Article

Preparation and Characterization of Corn Straw-Based Graphitized Carbon with Ferric Acetylacetonate as Catalyst

1
College of Food Science and Engineering, Changchun University, Changchun 130022, China
2
School of Chemical Engineering, Changchun University of Technology, Changchun 130023, China
*
Authors to whom correspondence should be addressed.
Processes 2023, 11(10), 2884; https://doi.org/10.3390/pr11102884
Submission received: 26 July 2023 / Revised: 21 September 2023 / Accepted: 25 September 2023 / Published: 30 September 2023

Abstract

:
Graphitized carbon exhibits exceptional thermal stability, electrical conductivity, corrosion resistance, and various intricate physical and chemical properties. Consequently, it has found extensive applications in diverse fields, such as electrodes, refractory materials, nuclear reactors, and supercapacitors. However, natural graphite is a limited nonrenewable resource, so finding other materials, exploring reliable graphitization methods, and achieving efficient green graphite production as an essential trend in the future is essential. In this paper, with corn straw liquefied product (CSLP) as raw material, ferric acetone catalyst, using carbonization, catalytic graphitization preparation of corn straw based graphitic carbon (CSBGC). When the graphitization temperature was 850 °C and the amount of ferric acetylpropionate (Fe(acac)3) was 7.0 mmol/g, the graphitized carbon showed better graphitization, micro fragmentation structure, and more minor defects, which effectively reduced the graphitization temperature, and the graphitic carbon rate of corn straw (CS) reached 25.2%. This study not only presents a highly efficient approach for synthesizing superior biomass-derived graphite carbon but also introduces usable perspectives on using corn straws.

1. Introduction

CS is primarily composed of cellulose, hemicellulose, and lignin, which humans have utilized as an energy source for a considerable period. According to statistics, China currently produces about 300 million tons of corn straw annually, but the utilization rate of corn straw is less than 30 percent. As climate and environmental change have become increasingly uncontrollable in recent years, and human activities have put unprecedented pressure on the environment, we must transition our energy model to a greener, recyclable economy. Corn straw is a high-quality renewable energy source with wide distribution, easy storage after conversion, and carbon recycling possibilities, which can be converted into preparing high-quality materials in many fields. Since corn straw contains hemicellulose and lignin, which are harmful to the generation of thin sheet graphene materials, the liquefaction of corn straw, with varying degrees of cellulose, hemicellulose, and lignin degradation, is conducive to graphitized carbon recombination [1,2,3]. CS will be degaussed and dehydrated during carbonization. Liquefaction residues form a more robust carbon skeleton via the carbonization process, and graphitization becomes more effective. The discovery of the role of catalytic graphitization originated at the end of the 19th century. Compared to conventional graphitization methods (usually above 1000 °C and sometimes as high as 2500–3000 °C), the catalytic graphitization method reduces the investment in reaction equipment significantly by adding catalysts such as metals and activators and keeping the reaction temperature as low as possible (usually below 1000 °C).
There are many ways to use CS. It is generally summarized as processing and utilization using physical, chemical, and biological means. The main ones are chemical pyrolysis [4], biomass liquefaction [5], biochemical conversion [6], biomass forming, direct combustion, biomass puffing [7], field return treatment, and feed processing. Currently, liquefaction has been shown to be the most effective method for transforming polymers, converting lignocellulosic biomass into high value-added intermediates [8], Weisheng Chen et al., using polyethylene glycol 400 (PEG400) and glycerol as liquefaction solvents, and liquefaction with sulfuric acid as a catalyst. The liquefaction conditions were optimized at 95.39% liquefaction yield under the reaction conditions of 150 °C and 120 min [9]. Sabzoi Nizamuddin et al., using ethanol as a solvent, showed that the thermal stability of biochar improved after the solvation liquefaction process [10]. Fei Yu et al. Prepared polyester from corn straw using liquefaction and cross-linking processes. Muslum et al. Used three nitrates, Fe, Co, and Mn, in the preparation of graphitized biochar from lignin, and all three metals improved the stability of graphitized biochar. Sung et al. [11]. Combined sodium lignosulfonate with Fe nanoparticles. The samples were obtained by direct mixing of sodium lignosulfonate and Fe nanoparticles by grinding and heating to 1000 °C for 1.0 h, which form a flower-like graphene sheet with a folded structure, while the samples without Fe nanoparticles are closer to an amorphous carbon material. Sun et al. [12]. Used coconut shell as a precursor and FeCl3 as a graphene catalyst to synthesize graphene, and obtained graphene materials with pore structure dominated by micropores and supplemented by mesopores. After the CS is liquefied, preparation of CSBGC by carbonization and catalytic graphitization of liquefied products. Catalytic graphitization is a simple and cost-effective strategy for converting biomass waste (a renewable and inexpensive source of carbon) into graphitic carbon materials at lower temperatures than conventional graphitization processes. Corn straw is a high-quality renewable energy source with widely distributed energy sources, easy storage after conversion, and carbon recycling capabilities. It can be converted into high-quality materials in many areas and is the worldwide focus of academic and industrial research. Fe(acac)3 is a ferric complex. In chemical reactions, it has the properties of traditional ferric salts on the one hand and its properties on the other. Fe(acac)3 is weakly acidic, which can catalyze some addition reactions and some carbon-carbon bond-forming reactions.
In this study, an existing combined liquefaction-carbonization-graphitization technique was employed. CSBGC was obtained at the graphitization stage using Fe(acac)3 as a catalyst. The optimum process conditions for CSBGC were determined by single-factor experiments (The successful preparation of CSBGC was achieved by utilizing a dosage ratio of 1:2 for CS to liquefying agent, a graphitization temperature of 850 °C, and a catalyst concentration of 7.0 mmol/g of Fe(acac)3). Using a Fourier transform infrared spectrometer (FTIR), an elemental analyzer (EA), an X-ray diffractometer (XRD), a Raman spectrometer (Raman), a scanning electron microscope (SEM), a transmission electron microscope (TEM), Thermal Gravimetric Analyzer (TGA), Brunauer Emmett Teller (BET), Inductive Coupled Plasma Emission Spectrometer (ICP) and so on. The structural evolution during graphitization was analyzed. The inexpensive CS was used to prepare graphitized carbon materials to generate the basic materials for obtaining graphene with high performance.

2. Materials and Methods

2.1. Experimental Materials

CS was bought from Jilin COFCO Company, Jilin, China. (Fe(acac)3) was obtained from Shanghai Macklin Company, Shanghai, China. Hydrochloric acid (analytical purity) was obtained from the Beijing Chemical Plant Co. Ltd., Beijing, China. Polyethylene Glycol 200 (PEG 200) was purchased from Tianjin Guangfu Fine Chemical Research Institute, Tianjin, China, Glycerol (GL) was purchased from Shandong Jinan Mingliang Chemical Co., Ltd., Jinan, China. Additionally, Hydroxy Ethylidene Diphosphate (HEDP) was purchased from Jiangsu Wuxi Kelion Envferricmental Protection Technology Co., Wuxi, China. Anhydrous ethanol was purchased from Shandong Hongda Biotechnology Co., Linyi, China. Deionized water was homemade in the laboratory.

2.2. Characterization

Several residues were analyzed using a Fourier transform infrared (FTIR) spectrometer. IR spectra were recorded on a Fuji FIRIS-25 Fourier transform spectrometer. Transmittance measurements were conducted using the KBr pellet method. Raman Spectra were measured with a 532 nm excitation laser (Lab et al. evolution, Horiba Jobin Yvon Paris, France) and recorded to study the properties of D and G bands over the range 3500~1000 cm−1. Nitrogen sorption measurements were carried out on a Micromeritics TriStar II 3020 analyzer. The sample was degaussed and dehydrated at 180 °C for 12 h. The Brunauer–Emmett–Teller surface area of CSBGC was calculated using Brunauer–Emmett–Teller (BET) and Barret-Joyner-Halenda (BJH) methods, respectively. Scanning electron microscopy (SEM) was performed with a Philips XL30 FEG FE-SEM instrument at an accelerating voltage of 25 kV. Transmission electron microscopy (TEM) was performed with a JEOL JEM-2100F. X-ray powder diffraction (XRD) measurements were performed on a SmartLab X-ray diffractometer in the range of 10~70° 2θ at room temperature. Cu-Kα radiation (λ = 0.15406 nm) was used with an X-ray tube operating at 40 kV and 30 MA. All analyses and fitting of the peaks were conducted on MDI Jade version 9 software (Materials Data Inc., Liverpool, CA, USA). Thermogravimetric (TG) and differential thermogravimetric (DTG) analyses were conducted on a thermal analyzer, Netzsch409PC. About 3.0 mg of sample was used in the TG/DTG. Pyrolysis was initiated at room temperature and ended at 900 °C with a heating rate of 10 °C/min under a flow of 50 mL/min of nitrogen. The Elemental analyzer (EA, Vario EL cube) determined the chemical composition variation during carbonization. The content of metal (wt.%) was measured using an Inductively Coupled Plasma Optical Emission Spectrometer (ICP-OES) (IRIS Intrepid II XSP, Thermo Fisher, Waltham, MA, USA).

2.3. Experimental Methods

2.3.1. CS Liquefied Process

10.0 g of CS were weighed and placed into an autoclave (500 mL, PTFE lining, Shanghai Rock Levy, Shanghai, China). Subsequently, a polyol liquefaction agent, consisting of a mixture of PEG200 and glycerol in a mass ratio of 7:3, was added to the autoclave, along with 0.3 g of hydroxyethylene diphosphoric acid catalyst. The autoclave was then subjected to a vacuum drying environment for liquefaction reaction. The reaction temperature was set at 140 °C. Following a predetermined temperature, the constant temperature was maintained for 5.0 h, producing liquefied products.

2.3.2. Preparation of Graphitized Carbon

A certain amount of corn straw liquefaction product was weighed and placed in a corundum crucible. The crucible was pushed to the center of the tube furnace, and nitrogen was introduced for 0.5 h to ensure that the reaction was in an inert gas environment. The carbonization reaction is conducted at a temperature of 600 °C, with a heating rate of 5 °C per minute, and the temperature is maintained constant for a period of 1.0 h. Once the reaction is complete and the temperature has decreased to 25 °C, immerse the carbonized product in a solution of 20% with absolute ethanol and subsequently perform suction filtration. Finally, the carbon product was obtained by drying at 80 °C for 12.0 h. 1.0 g of carbonized product was weighed and mixed with 7.0 mmol/g of ferric acetylacetonate catalyst. The reaction temperature was raised to 850 °C and stored for 1.0 h. After reducing the reaction to 25 °C, the crucible was removed. After adding 0.1 mol/L hydrochloric acid solution, three repetitive washes were performed, and repeated rinses using anhydrous ethanol were performed to remove excess hydrochloric acid. Finally, deionized water was used for rinsing to adjust the pH of the graphitized carbon, sonicated for 1.0 h, filtered, and dried for 80 °C for 12.0 h to obtain CSBGC (Figure 1). Calculation formula of graphitized carbon yield (1).
Y Graphitized   carbon   yield = M Graphitized   carbon   mass M Corn   straw   initial   mass × 100 %

3. Results and Discussion

The optimal parameters for the carbonization and graphitization process were determined using single-factor experiments. These parameters include a solid–liquid ratio of 1:2 as the carbonization raw material, a carbonization temperature of 600 °C, a graphitization temperature of 850 °C, the graphitization catalyst is Fe(acac)3, and the amount of 7.0 mmol/g carbonization product, a product ID/IG ratio of 0.8272, and a 2θ value of 26.38°. When these conditions are applied, the resulting material exhibits superior graphitization, a microscopic sheet structure, and fewer defects than corn straw’s direct graphitization.

3.1. Single Factor

3.1.1. Catalyst Concentration

Liquefaction products with a 1:2 solid–liquid ratio were prepared according to Section 2.3.1, and graphitized carbon was prepared by the process of Section 2.3.2 (Figure 2c). It can be seen that when the graphitization temperature was 850 °C, 1.0 mmol/g−7. 0 mmol/g catalyst dosage had a significant upward trend in the CSBGC yield, and there was no significant upward change in 7.0 mmol/g−9. 0 mmol/g catalyst dosage. Therefore, the yield of the sample was 22.2% at a ferric acetoacetate catalyst concentration of 7.0 mmol/g.

3.1.2. Solid–liquid Ratio of Liquefied Products

Liquefaction products with different solid–liquid ratios were prepared according to Section 2.3.1, and graphitized carbon was prepared by the process of Section 2.3.2. (Figure 2a) The results showed that the liquefaction rate increased when the solid–liquid ratio was in the range of 1:0–1:2 at a catalyst dosage of 7.0 mmol/g of Fe(acac)3 and a graphitization temperature of 850 °C. As the solid–liquid ratio continued to increase to 1:4, the change in liquefaction rate slowly decreased. The trend of graphitized carbon shows that the change in CSBGC yield is not significant as the solid–liquid ratio is in the range of 1:0–1:4. Therefore, the ratio is determined by the liquefaction rate. The liquefaction rate of corn straw was 15.2% at a ratio of 1:2, at which time the CSBGC yield obtained was 22.2%.

3.1.3. Graphitization Temperature

The liquefaction product with a 1:2 solid–liquid ratio was prepared according to Section 2.3.1, when the catalyst dosage was 7.0 mmol/g of Fe(acac)3, and graphitized carbon was prepared by the process of Section 2.3.2. I was using (Figure 2b). The experiments found that the temperature had a significant effect on the degree of graphitization of corn straw. The results showed that at the graphitization temperature, the yield of CSBGC was significantly increased in the range of 750 °C–850 °C, whereas there was no significant change in the yield of graphitized carbon in the range of 850 °C–900 °C. Considering the experimental cost, process conditions, and other factors, the graphitization temperature of CS was 850 °C.

3.2. Characterization of CSBGC

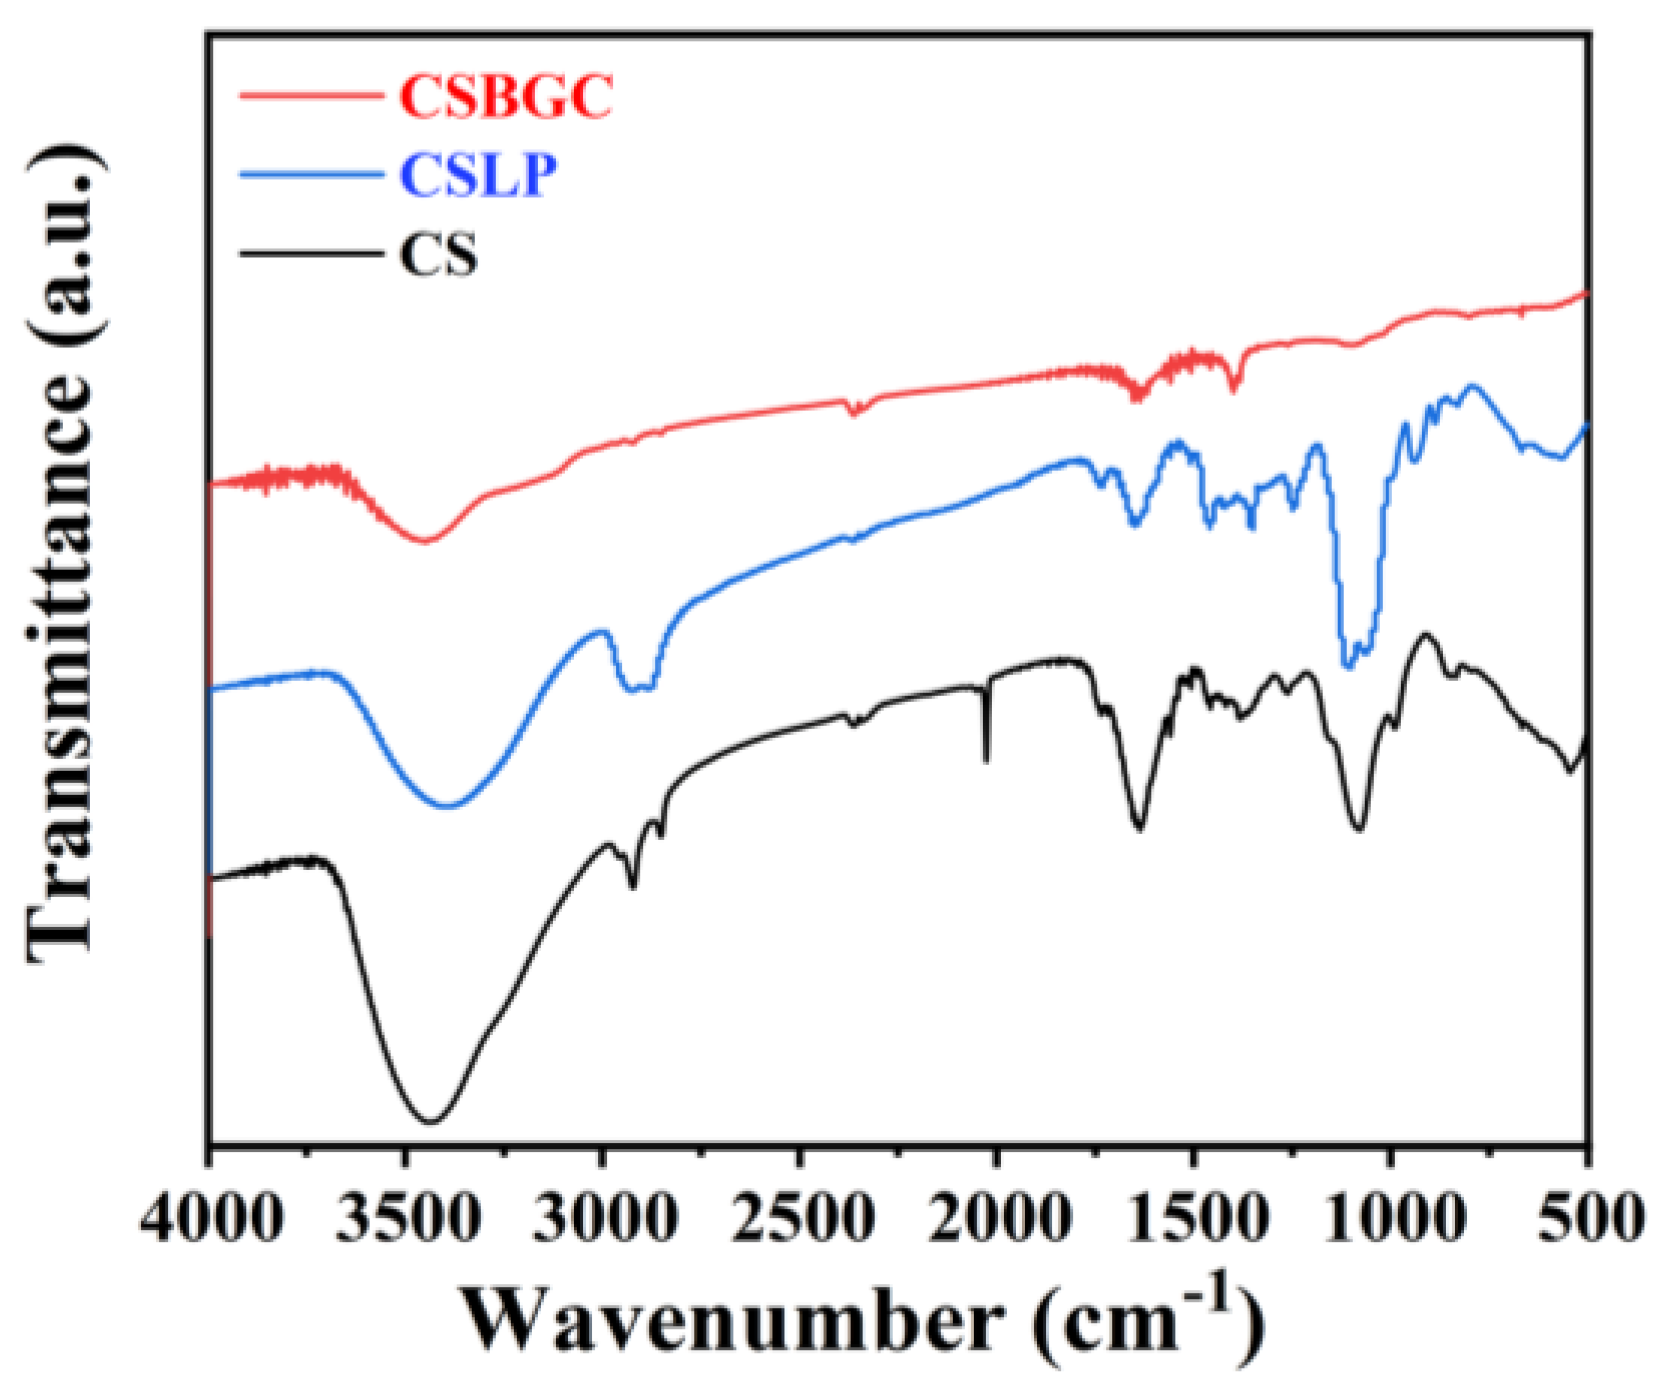
3.2.1. Surface Functional Group Analysis (FT-IR)

Figure 3 shows the FTIR absorption spectra of the liquefied products, from which it can be seen that the symmetric absorption peak of ether bond at 1208 cm−1, the antisymmetric absorption peak of ether bond at 1248 cm−1, CH3 of polyether polyol at 1380 cm−1, methylene group of polyether polyol at 1455 cm−1 [13], and a more apparent bending vibration peak at 1500–2500 cm−1, indicating the low content of unsaturated bonds such as carbon-carbon double bond and carbon-carbon triple bond, and a stretching vibration peak of CH3 at 2856 cm−1, and the methylidene of polyether polyol at 3310 cm−1. A more apparent bending vibration peak indicates that the content of unsaturated bonds such as carbon-carbon double bond and carbon-carbon triple bond is low. Comparing the graphitized carbon with the corn straw meal and liquefied product, it was found that the theβ-1,4-glycosidic bond of the raw material was broken, and the main components were destroyed and reconstituted into a new carbon skeleton [14]. The ether in the liquefaction product increases (infrared spectrum of the liquefaction product), where the absorption peak (infrared spectrum of the graphitized carbon) is about to disappear, and there is no ether in the graphitized carbon. The intensity of the O-H stretching vibration peak of the liquefaction product near 3310 cm−1 is weakened because the hydroxyl groups in the corn straw are re-polymerized using phosphoric acid and polyol to form water molecules or other small molecule compounds at the late stage of liquefaction [15]. Additionally, the absorption waveform here is closer to the characteristic peaks of graphene after graphitization, which may be the formation of hydrogen bonding that is favorable to counteract the van der Waals force between the layers of graphene. The hydrogen bonding between the graphene layers may be formed, which is favorable to counteract the van der Waals forces.

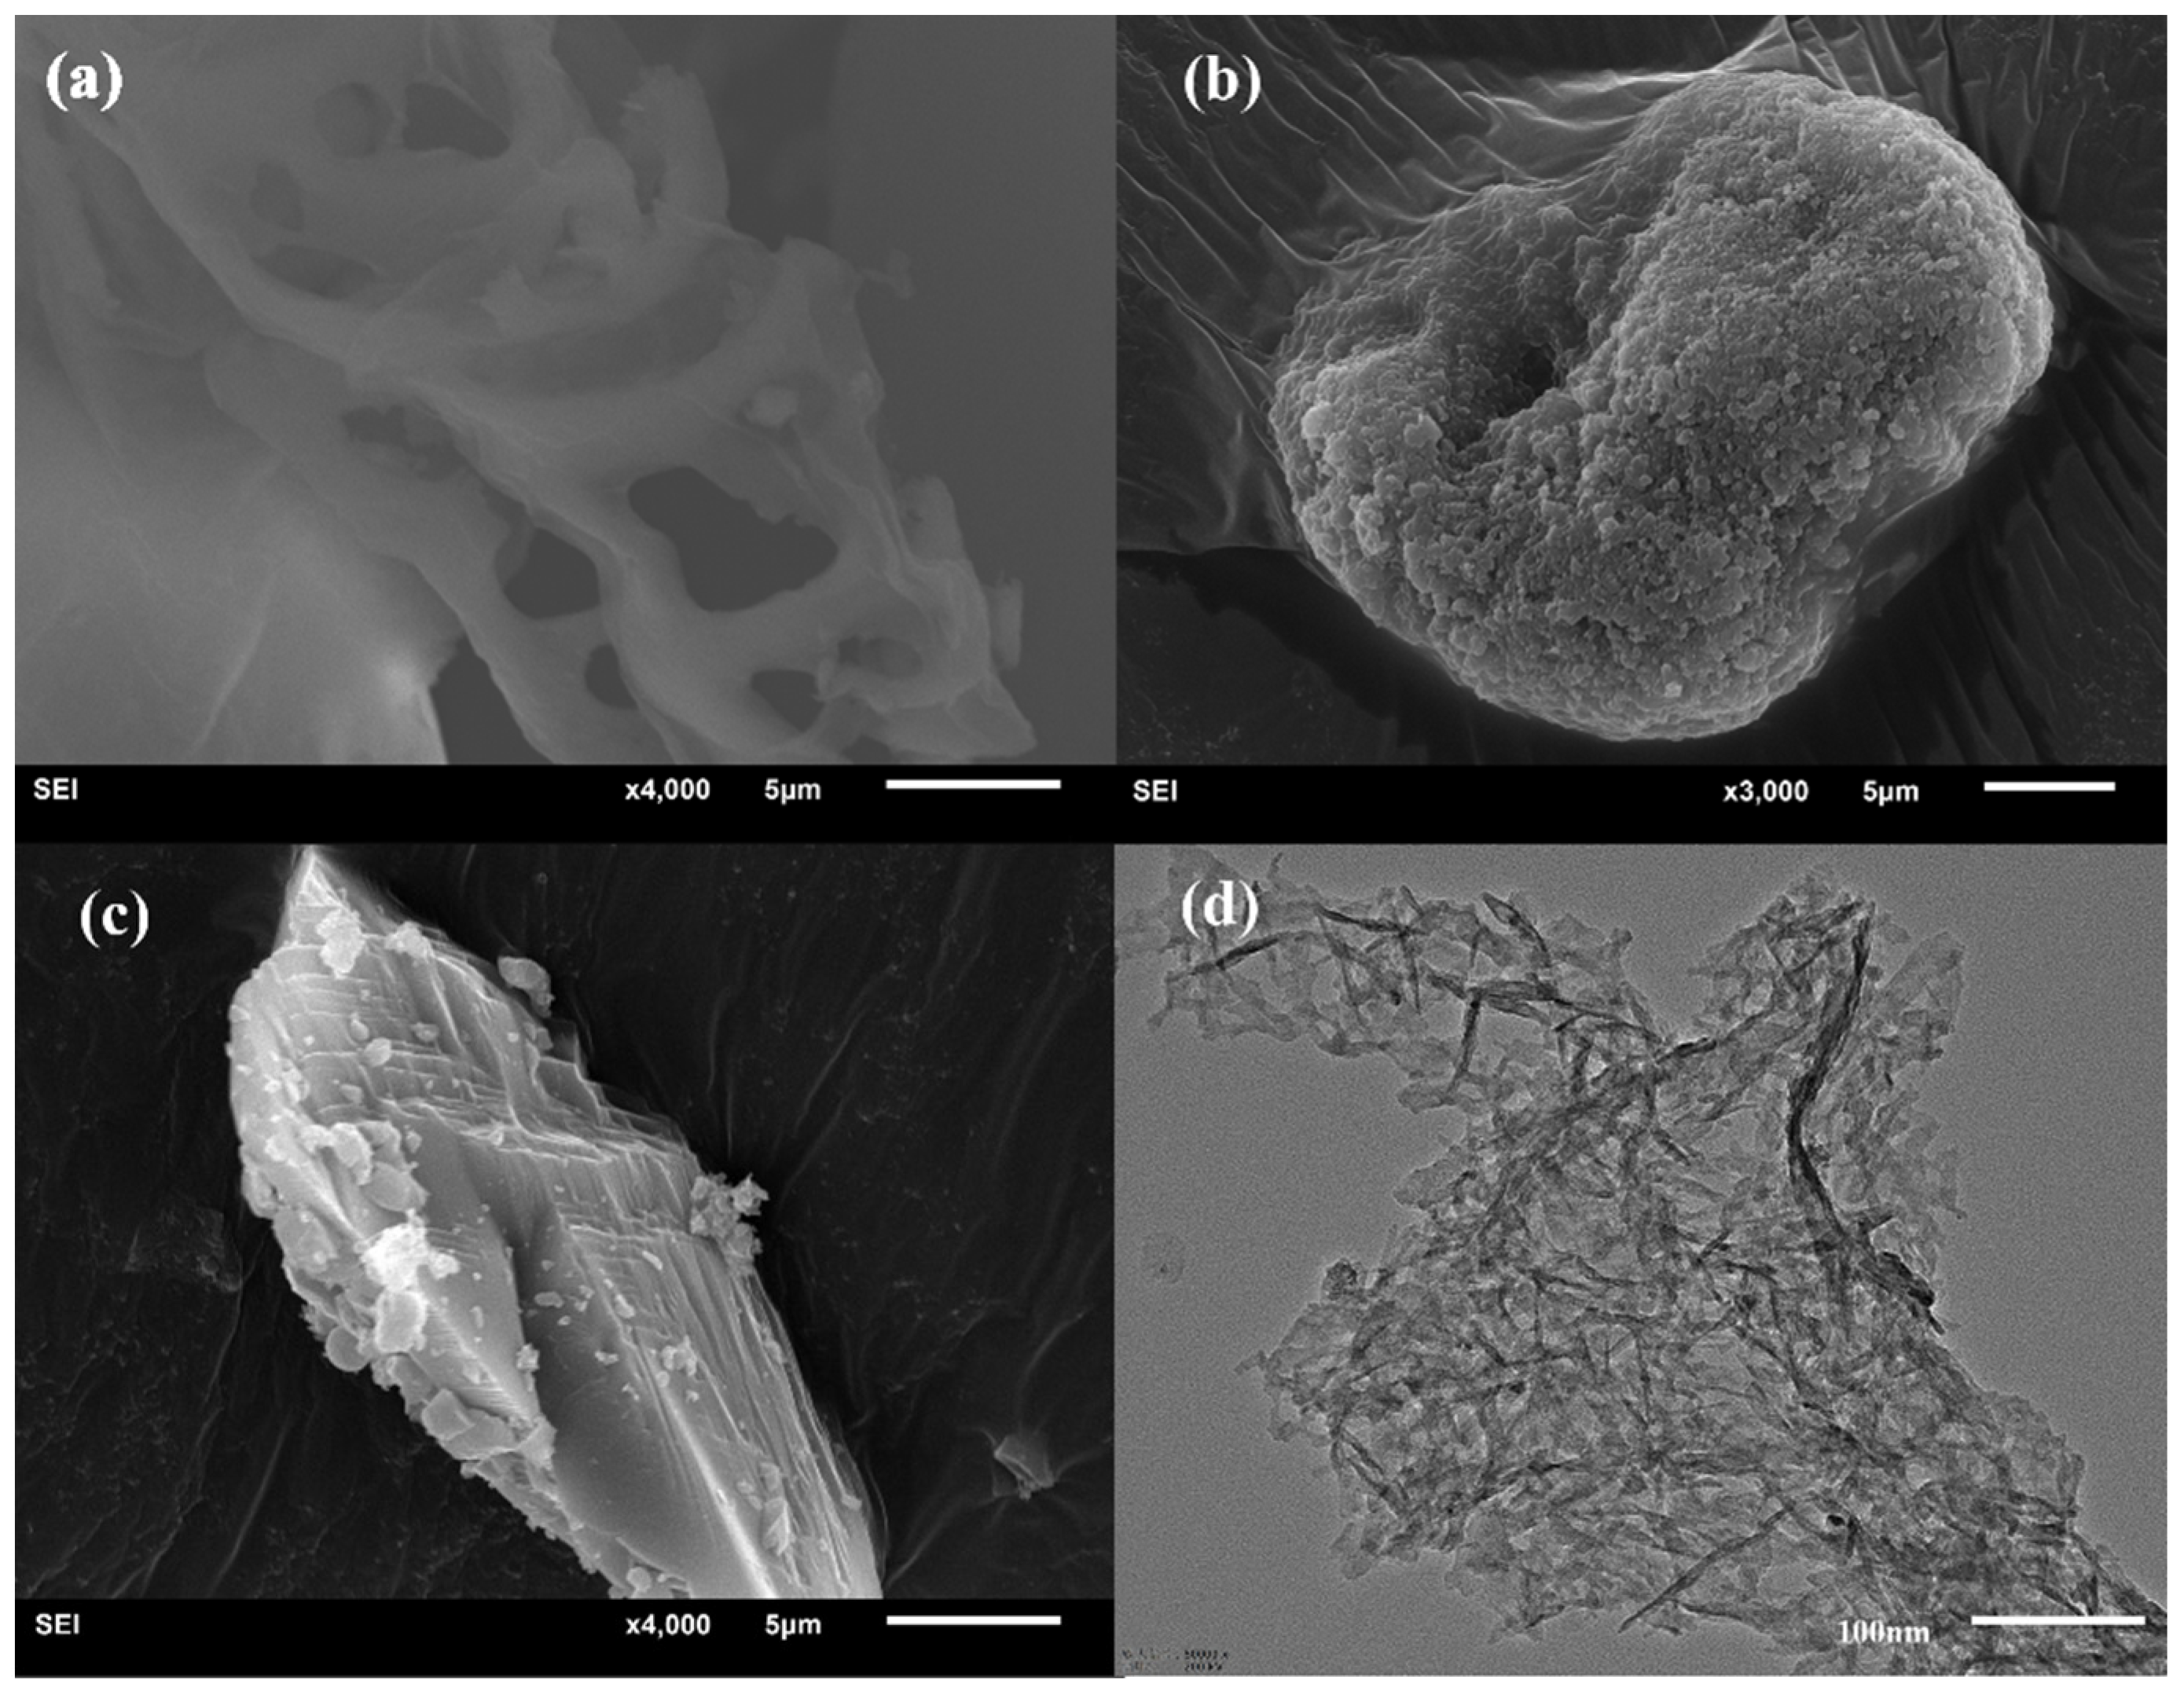
3.2.2. Microstructure Morphology Analysis (SEM and TEM)

The image of CS under a scanning electron microscope is fibrous rod-like, and its microscopic characteristic structure has been changed using the process of liquefaction and graphitization. Prominent lamellae characteristics can be seen in graphitized carbon’s scanning electron microscope image. It can be seen from Figure 4 that the graphitized carbon is agglomerated and wrapped by the catalyst Fe(acac)3, and the CSBGC with lamellae characteristics can be obtained after the ultrasonic ferric removal treatment by soaking in hydrochloric acid solution. Compared with the direct carbonization of CS, the defects are smaller, the degree of graphitization is better, and the flakes are clearer and more obvious. The images of graphitized carbon under transmission electron microscopy have typical graphene interlocking stacking and obvious graphene layer structures.

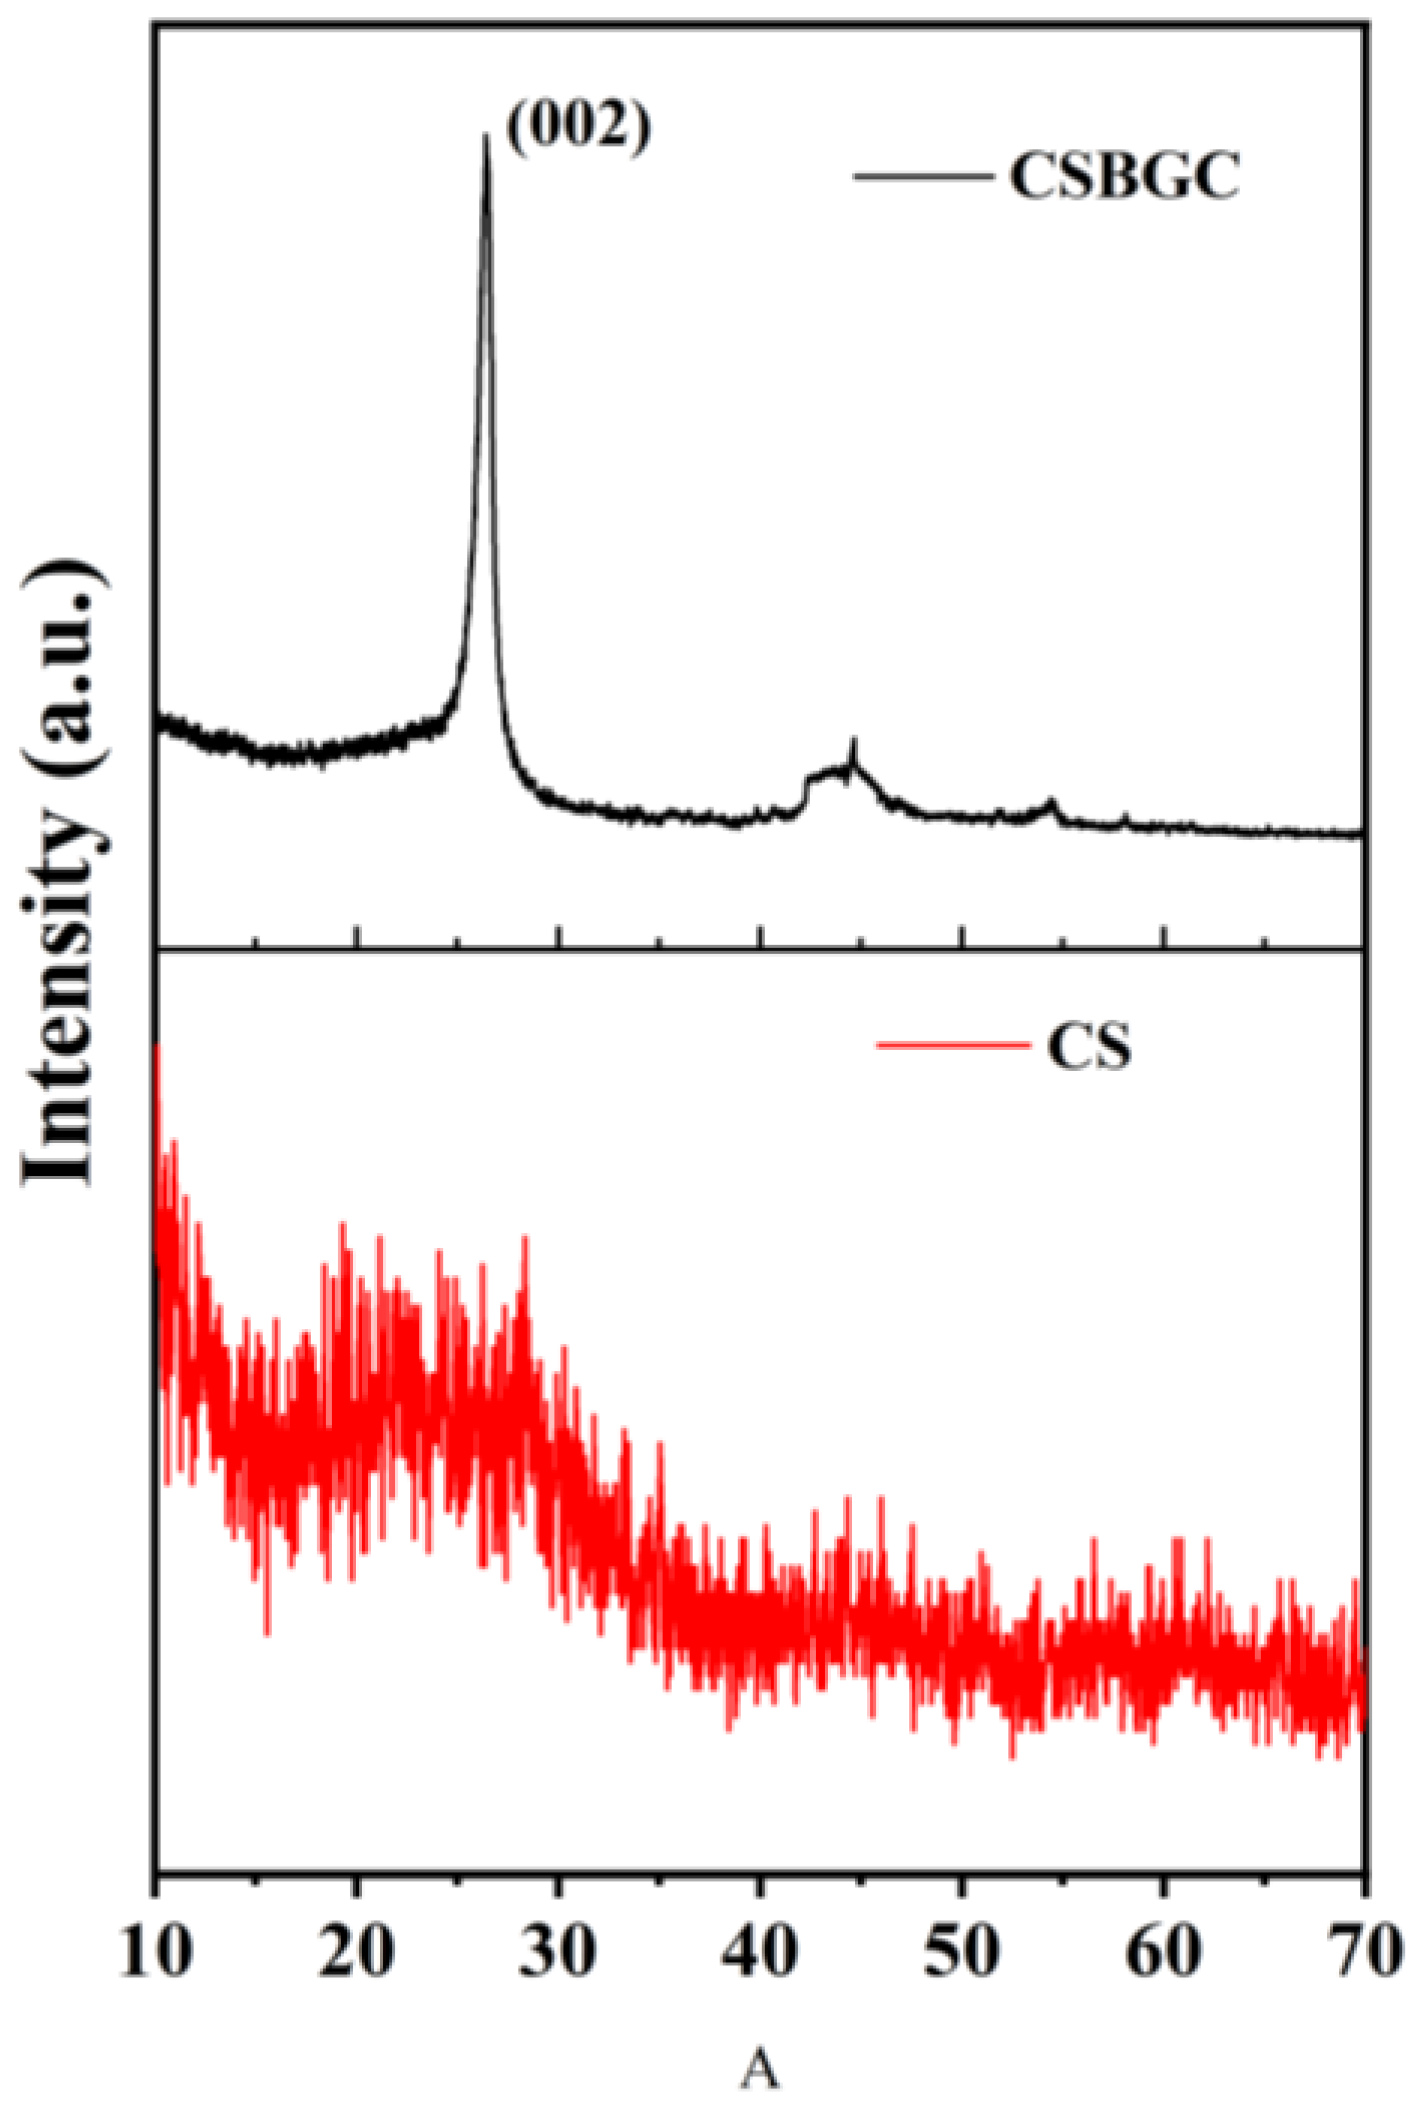
3.2.3. Crystal Structure Analysis (XRD)

It can be seen that the images of CS under XRD are relatively disordered, and the characteristic peaks have appeared near 20°–25° [16]. The characteristic peak of graphitized carbon appears near 25°–30° in Figure 5. Graphitized carbon by X-ray diffraction corresponds to the (002) crystal plane, while the feature peak is sharp with 2θ of 26.38°, which is a good degree of graphitization [17]. This shows that the liquefaction and graphitization processes changed the crystalline shape of CS under X-ray diffraction, which is similar to the results of SEM and TEM (Figure 4) analysis.

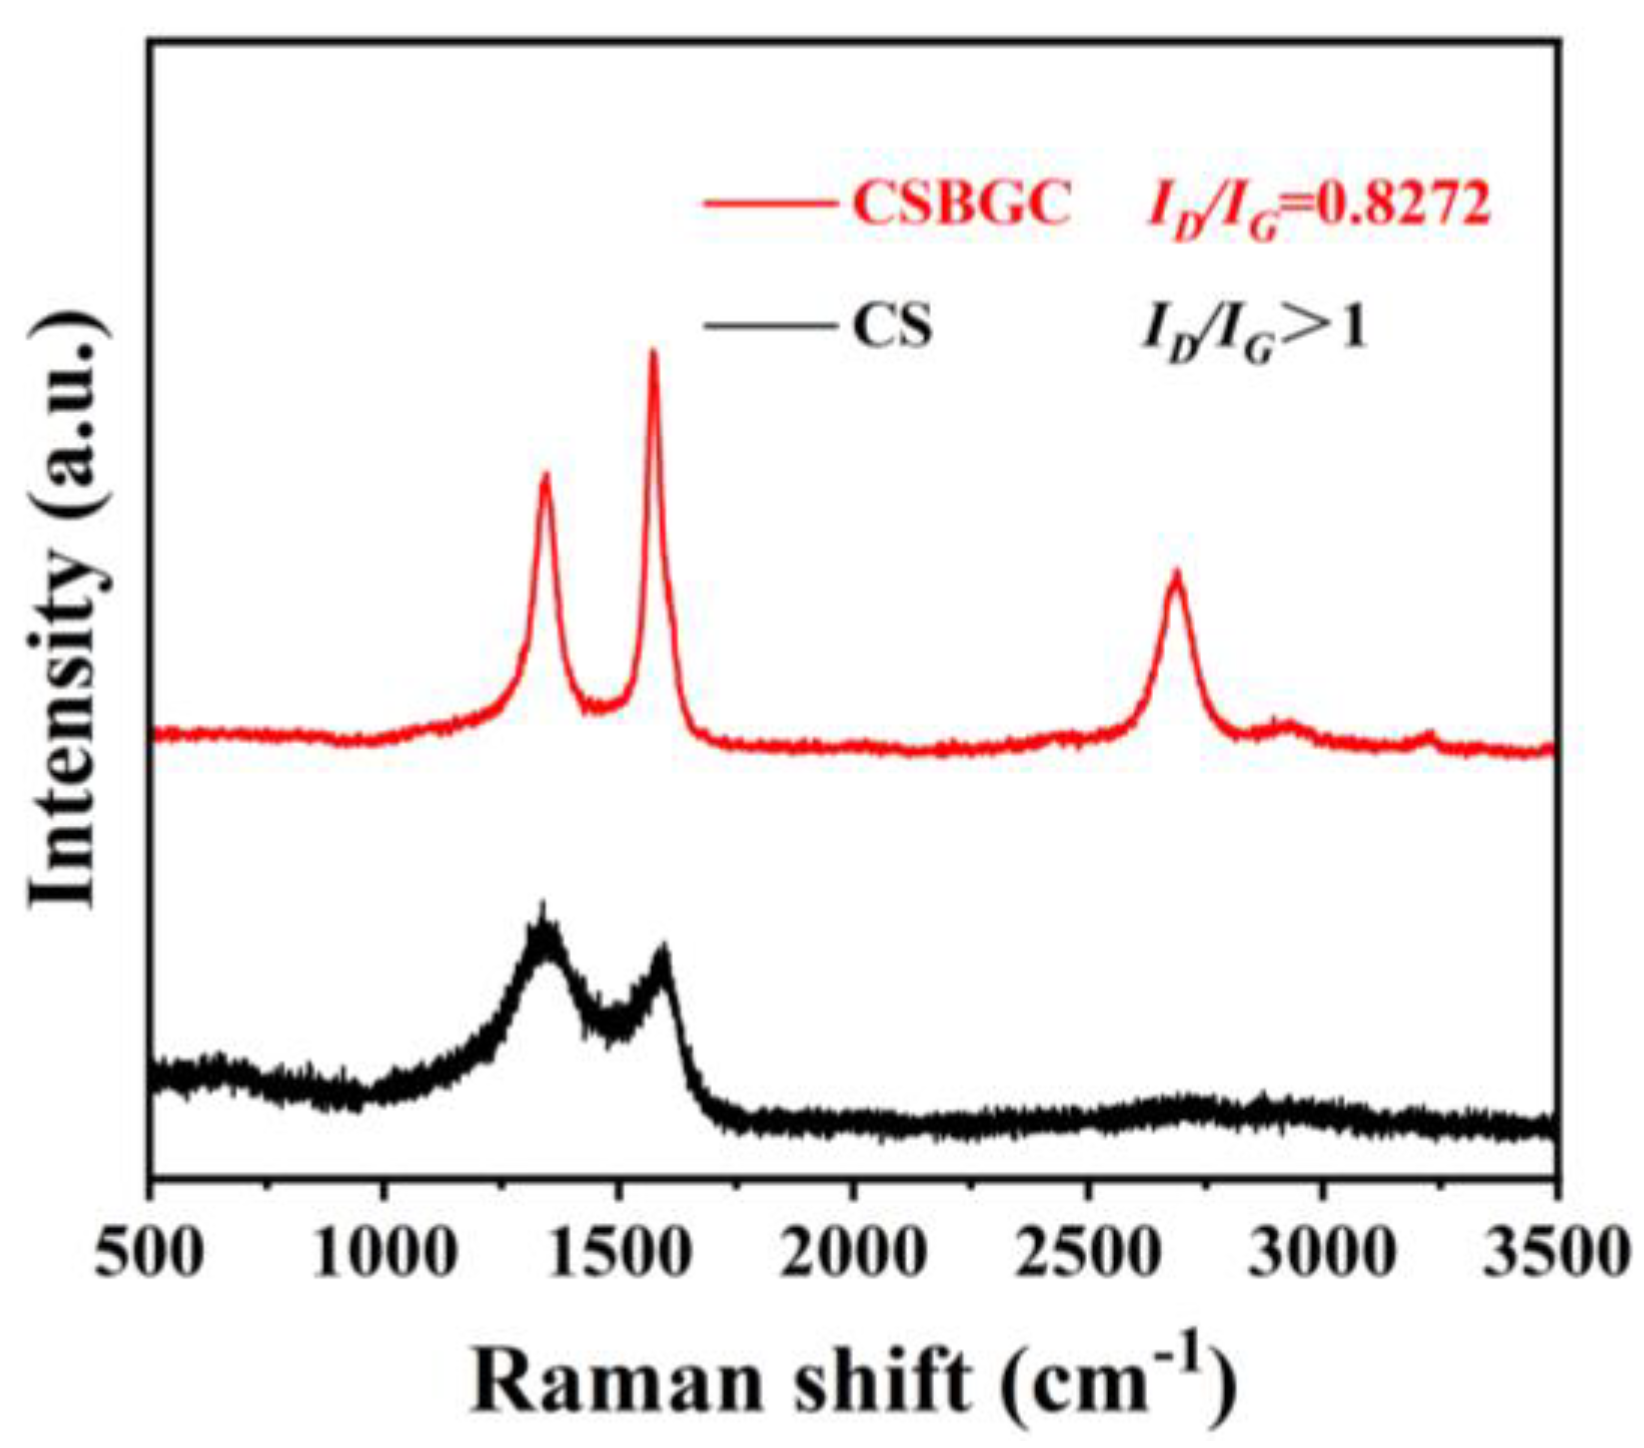
3.2.4. Graphitization Degree Analysis (Raman)

As a result, in Figure 6, the ID/IG for the CSBGC is smaller, with ID/IG = 0.8272, indicating a better degree of graphitization and a smaller degree of defects. It can be seen that under the experimental conditions of this paper, the liquefaction process optimized both the degree of graphitization and the degree of defects in the graphitized carbon products, which led to a plot and data closer to commercial graphite under Raman spectroscopy [18].

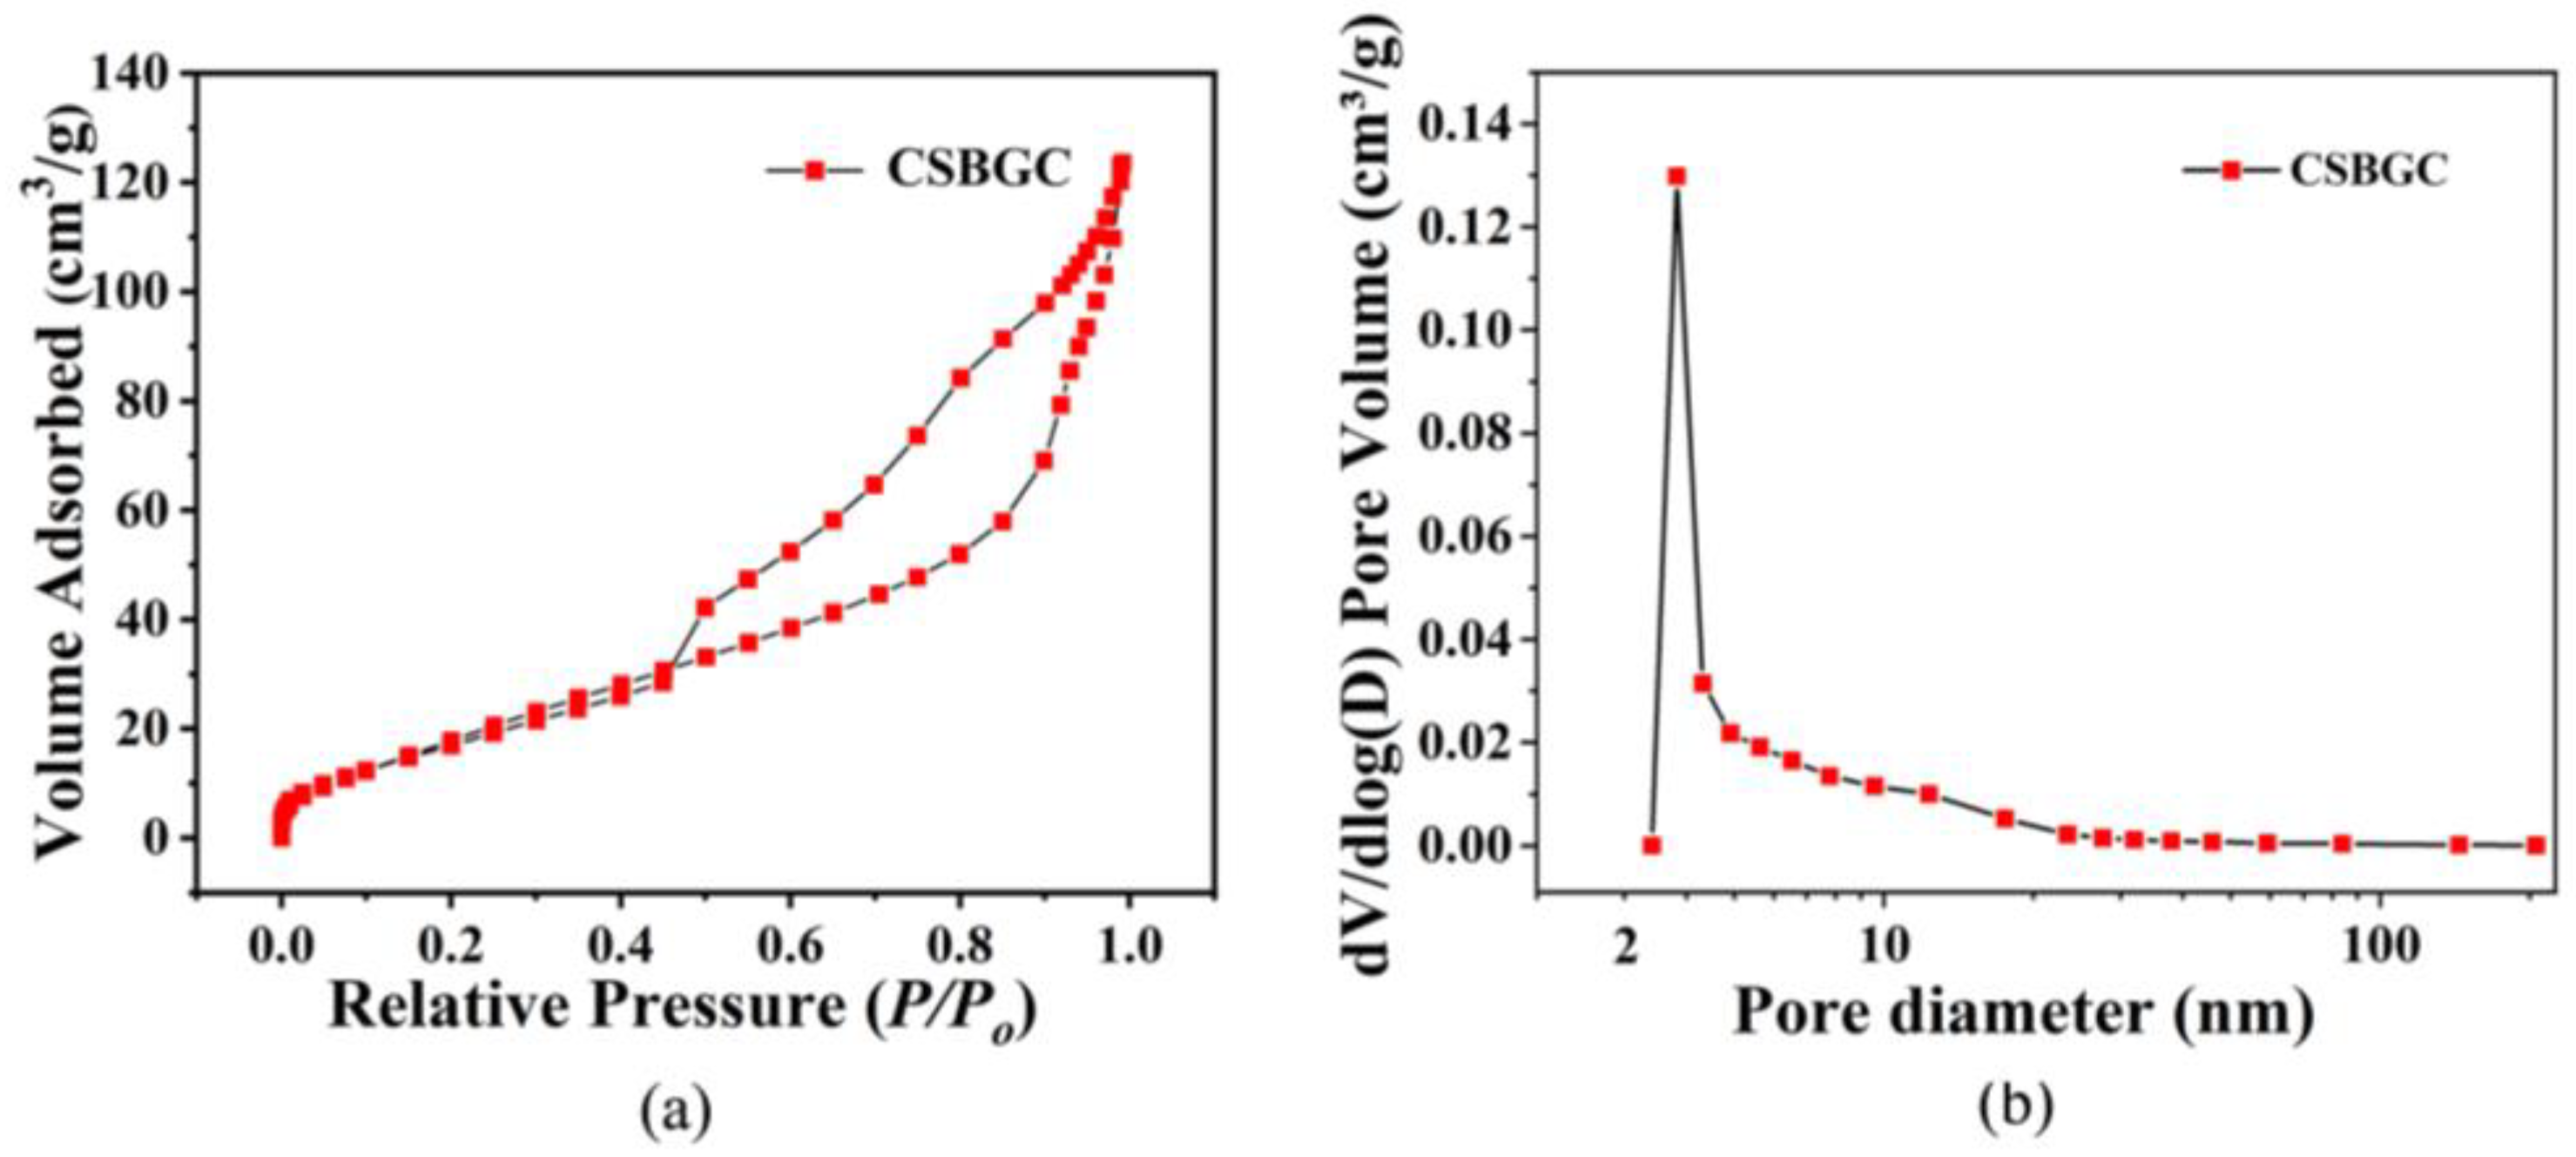
3.2.5. Specific Surface Area and Pore Size Analysis (BET)

It shows the isotherms and pore size distribution curves for the adsorption and desorption of CSBGC in Figure 7. Curve (a) is consistent with the type IV adsorption isotherm curve, with capillary aggregation in the high-pressure region, while the curves do not overlap, which reflects that there exist some mesopores. The H3 type hysteresis loop is exhibited in the figure, reflecting that there is no obvious saturation adsorption platform and the pore structure is very irregular with microporous, mesoporous, and macroporous void structure, and the pore shape is the conical structure of slit pores, which is consistent with the SEM and TEM analysis. According to the pore size distribution graph (b), it can be concluded that the pores of the sample are mostly smaller than 3.9 nm, which reflects that the produced biochar is mesoporous.

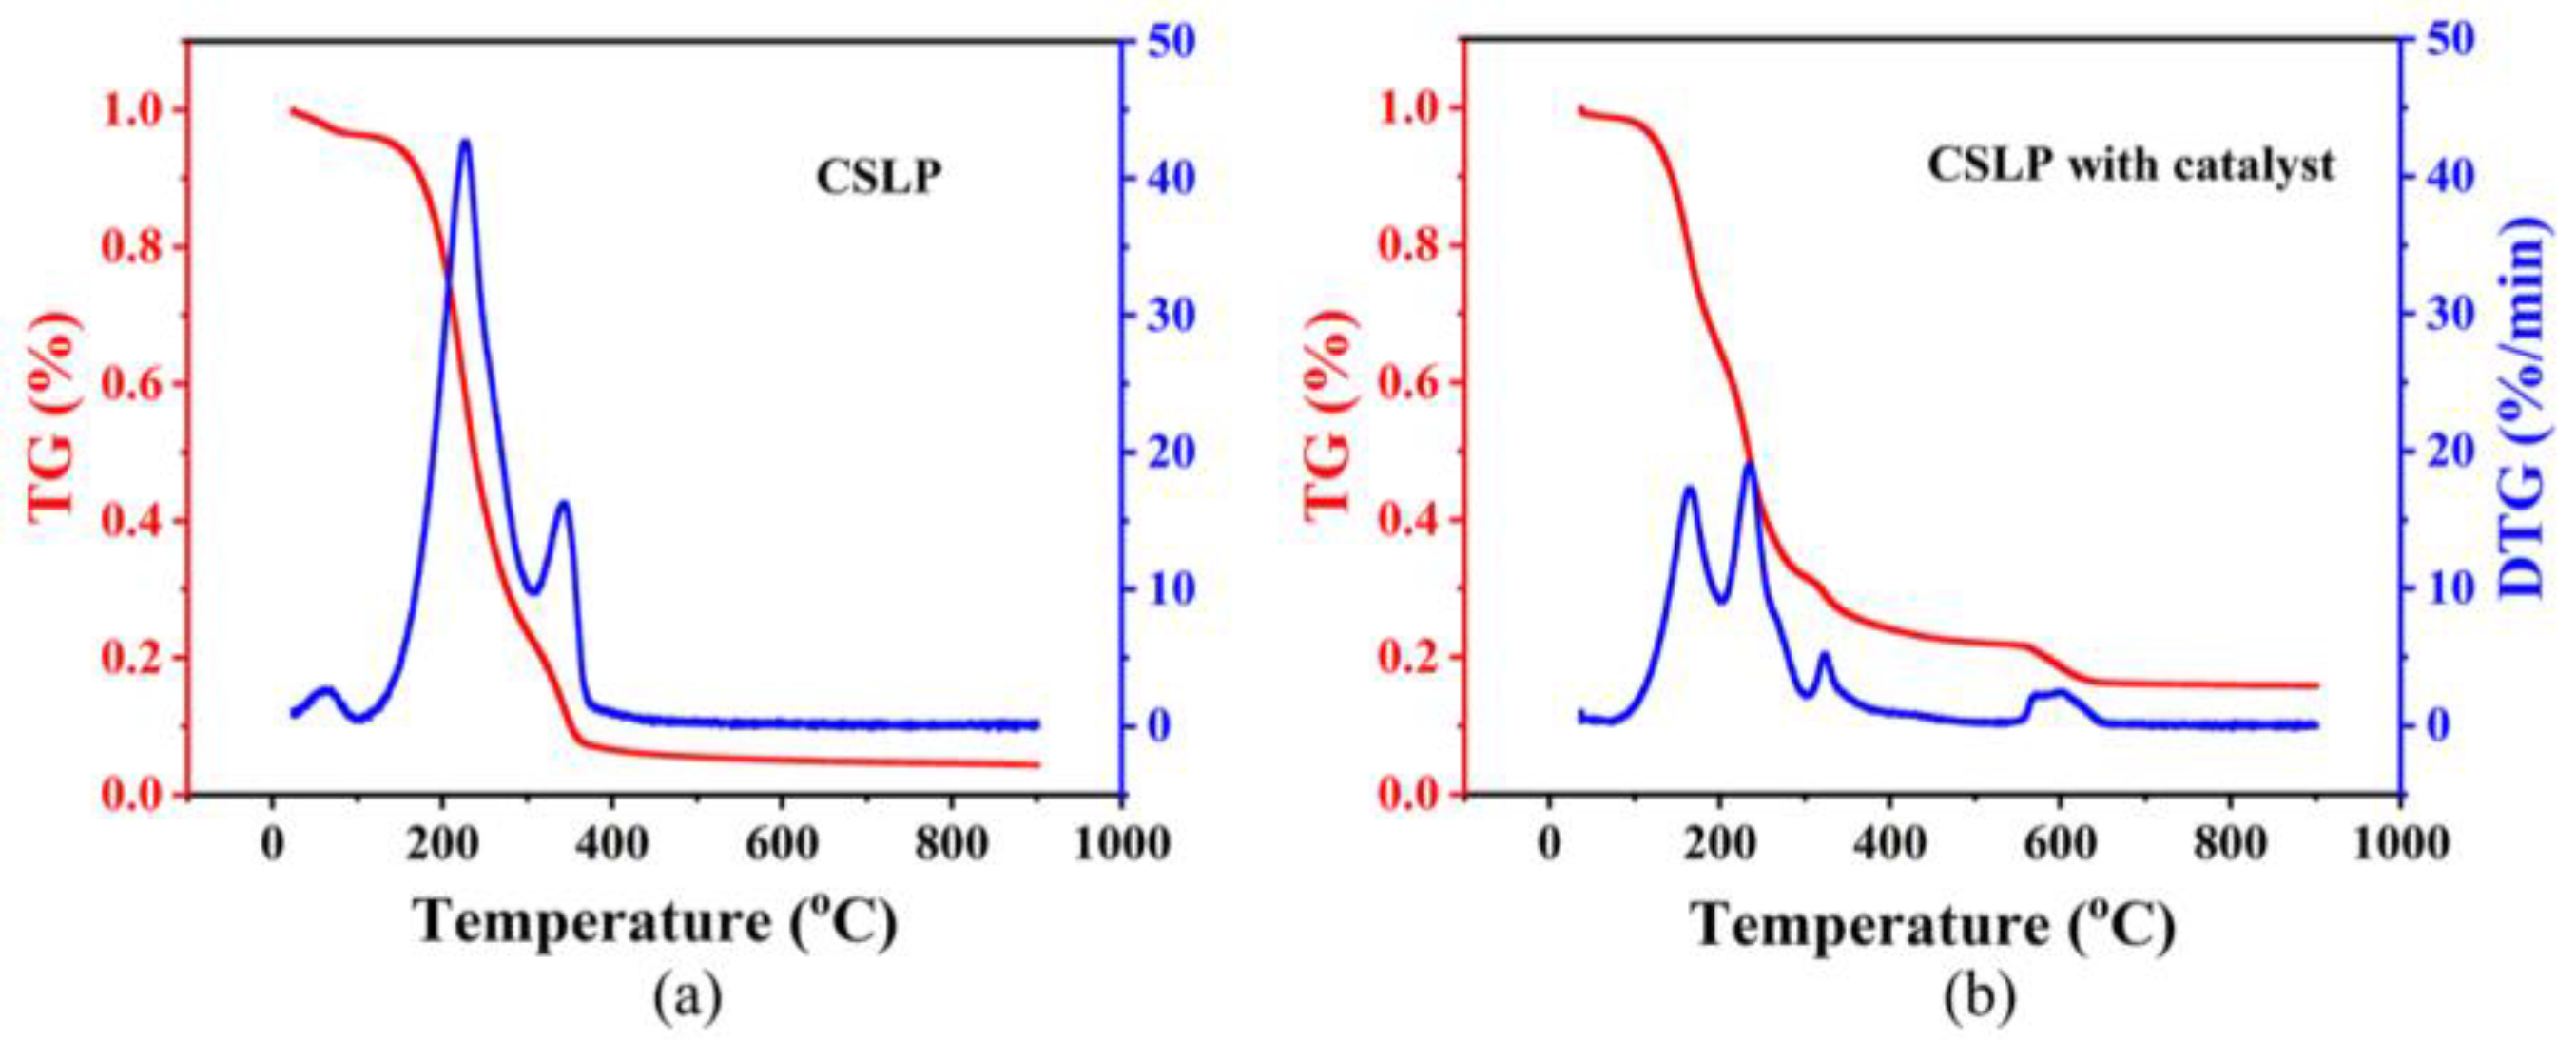
3.2.6. Thermogravimetric Analysis (TG)

TG and DTG diagrams of liquefied products and liquefied products with Fe(acac)3 catalysts of CS were shown in Figure 8a,b. According to that figure, the thermogravimetry of liquefied products includes three stages. Stage 1 is mainly caused by the removal of water and volatiles from the liquefied CS before 120 °C [19]. The weight loss in the second stage mainly occurs at 120 °C–400 °C, which is the main stage of pyrolysis. In this stage, biomass polysaccharides are converted to oligosaccharides in the liquefaction process. The mass loss is more significant due to oligosaccharides’ poor thermal stability, and oligosaccharides’ thermal decomposition reaction is intense at 200 °C–400 °C in Figure 8a,b. The third stage is 400 °C–800 °C. This stage may be Fe(acac)3 pyrolysis, which undergoes contraction of the carbon network, structural reorganization, and formation of the carbon skeleton. At this stage, oligosaccharides and lignin are paralyzed via chemical bond breakage and rearrangement, and carbon is formed while pyrolysis gases such as CO2 and CO, along with liquid products such as methanol and wood tar, are released [20]. Comparing (Figure 8a). When Fe(acac)3 (Figure 8b). Catalyst is added, thermal decomposition occurs at 170 °C, and complete thermal decomposition occurs at 640 °C (Figure 8b). Has a solid weight plateau at 600 °C, probably caused by the decomposition of the enol in the Fe(acac)3, which tends to plateau when the temperature continues to increase (Figure 8a,b). Does not change, and the CSBGC has Thermal stability, which also applies to our study. Before (Figure 8a) and after (Figure 8b) the addition of Fe(acac)3 catalyst, the yield of graphitized carbon was significantly increased after the addition of Fe(acac)3 catalyst.

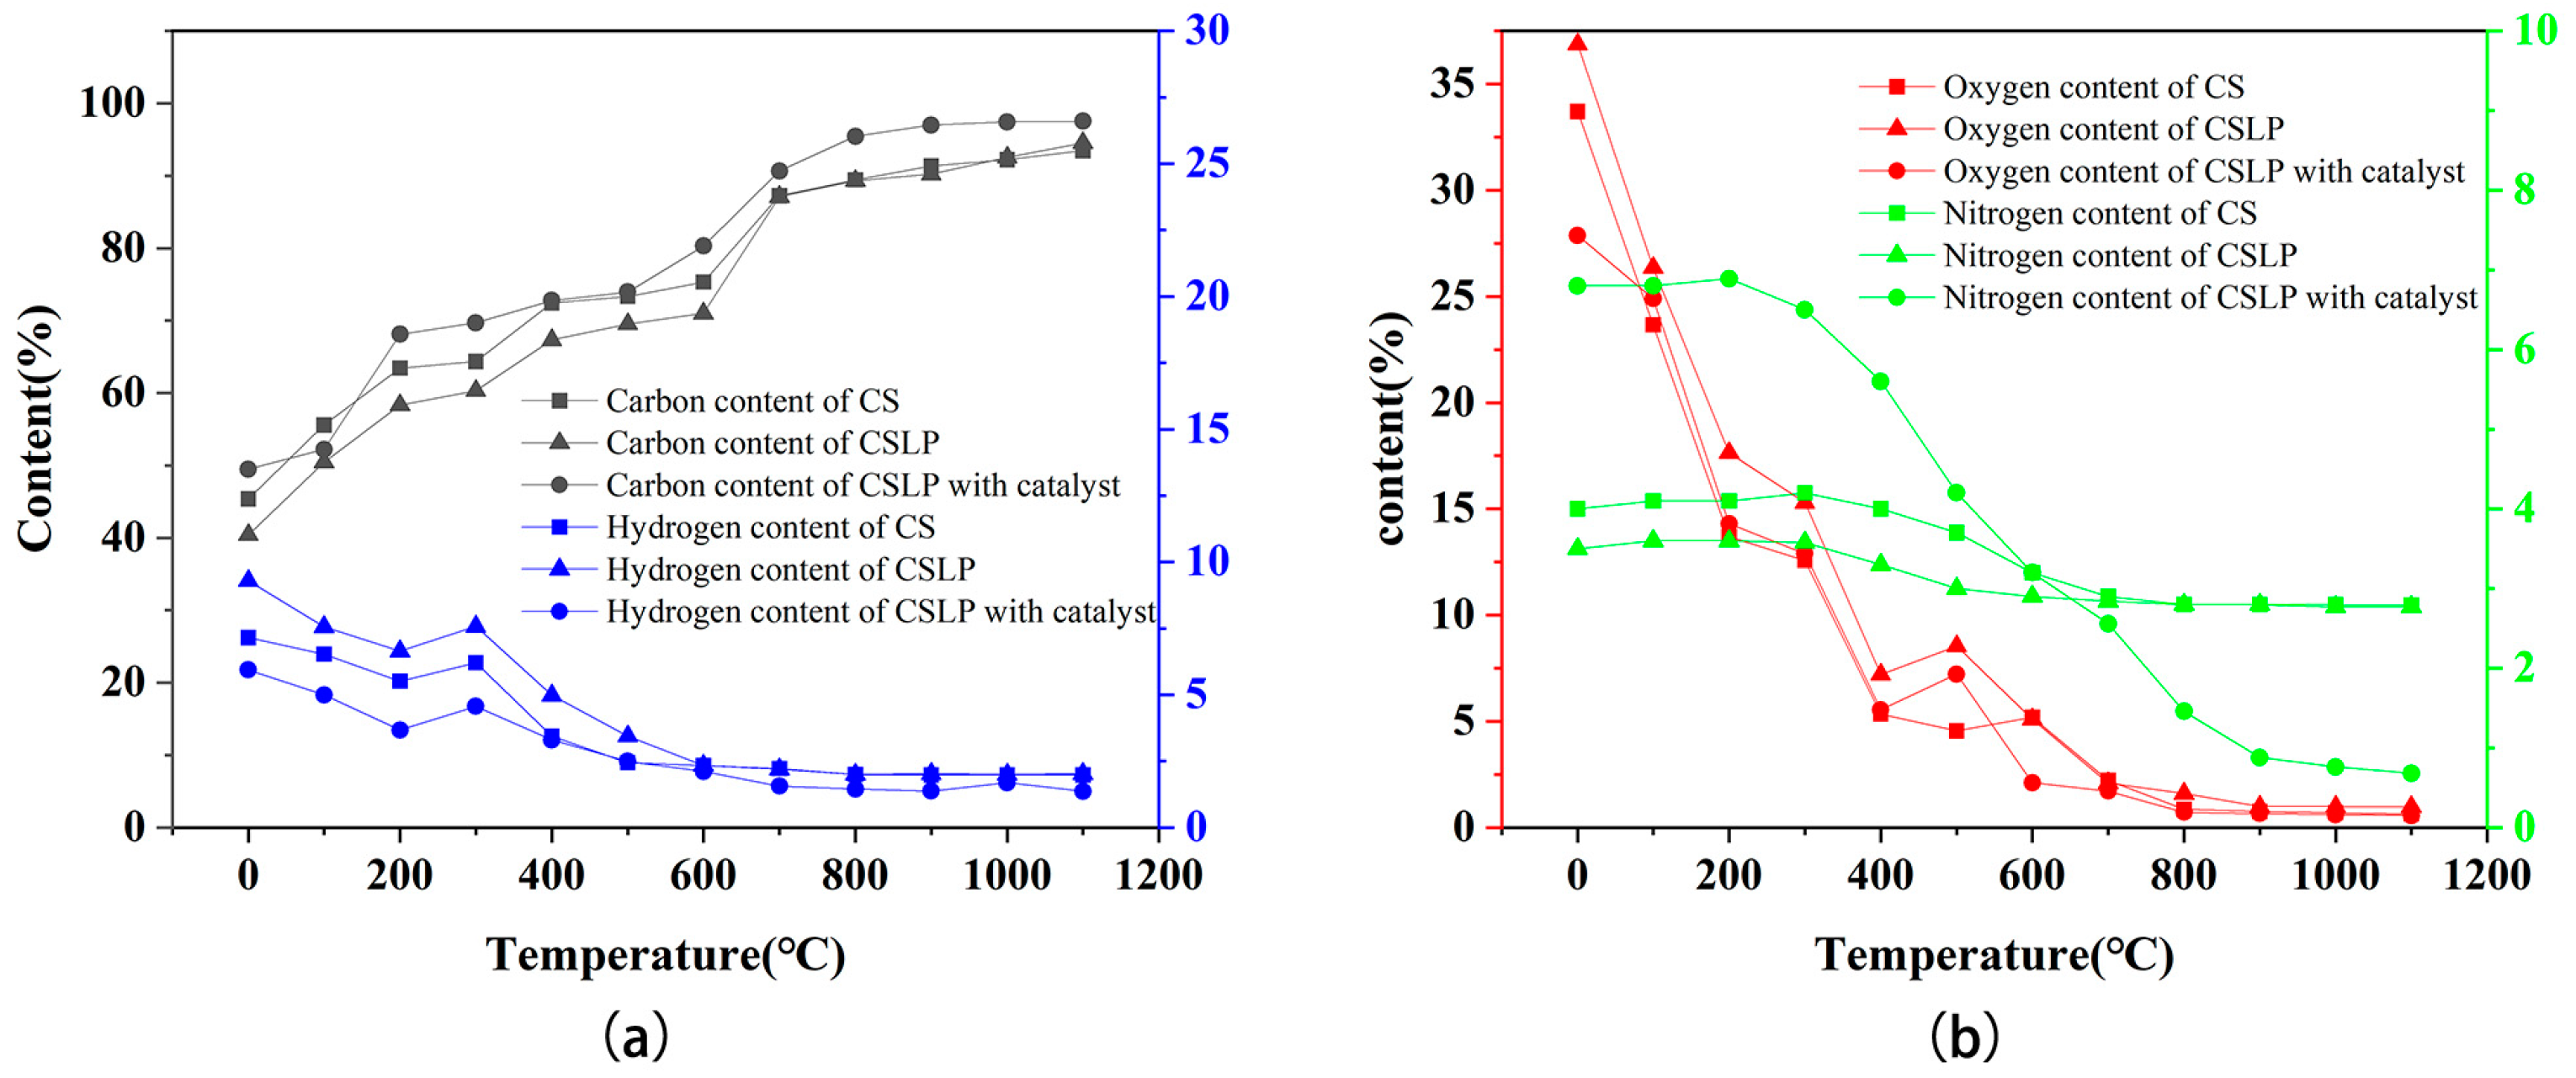
3.2.7. Elemental Analysis

EA obtained the changes in the chemical composition of corn straw during graphitization. As presented in Figure 9, CS initial elemental calculations C, 45.36; H, 7.146; O, 33.7; N, 4.00. CSLP initial elemental calculations C, 40.44; H, 9.30; O, 36.87; N, 3.50. Liquefied products with Fe(acac)3 catalyst initial elemental calculations C, 49.49; H, 5.94; O, 27.87; N, 6.80. The pristine CS’s atomic content was close to that calculated from its molecular formula. Graphitization pyrolysis products include CO2, CO, H2O, NO, NO2, HCN, and NH3. These gases are the products of the decomposition of the CS functional groups. In the initial stage of carbonization, the gaseous by-product CO2 is dominant. With further carbonization, CO escapes and begins to be emitted along with other gaseous products. As the temperature increases, the oxygen, nitrogen, and hydrogen content decreases while the carbon content increases. The carbon content in the graphitization process of carbonization has two stages of rapid increase at 120 °C and 400 °C, while the oxygen content decreases in the following four stages: a sudden decrease from 120 °C to 400 °C, a slight fluctuation until 550 °C, a sharp decrease from 550 °C to 640 °C, and a complete disappearance at 800 °C. On the other hand, the nitrogen and hydrogen contents gradually decrease above 50 °C. This changing carbon and oxygen content behavior is attributed to the conversion of carbonyl groups (C-O) in polyethylene glycol and Fe(acac)3 to CO or CO2. Gases such as H2O, NO, NO2, NH3, and HCN precipitate due to the gradual release of nitrogen and hydrogen atoms until gas precipitation is complete at 600 °C. The carbonation process is also characterized by a gradual decrease in nitrogen and hydrogen content from 550 to 640 °C. During the carbonization process, the carbon content of liquefied products with Fe(acac)3 catalyzes is slightly higher than that of CSLP. This is due to the higher content of carbon atoms and lower content of oxygen atoms in liquefied products with Fe(acac)3 catalyzes molecules. It is worth noting that the high oxygen content of CS implies that a large amount of CO and CO2 is released during the carbonization process, thus leading to a low carbon yield. As H/C and O/C decrease, the degree of graphitized carbon gradually increases, and the degree of defects decreases.

3.2.8. Inductively Coupled Plasma Optical Emission Spectrometer

Since CSLP with Fe(acac)3 contains Fe element, which will affect the purity of CSBGC, the CSBGC made by adding an excess of 0.1 mol/L hydrochloric acid solution followed by three repetitive washes, repeated rinsing using anhydrous ethanol to remove the excess hydrochloric acid, and finally rinsing with deionized water to adjust the pH neutrality of the graphitized carbon were subjected to AE Elemental analysis was performed. The high percentage of element C in CSBGC confirmed the high purity of CSBGC. At the same time, an ICP-OES test was conducted, and the results are shown in Table 1. The average iron content of CSBGC is 0.015%, which indicates that the products produced in this experiment have high purity and can be used to obtain the basic materials with high-performance graphene.

4. Conclusions

The current study employed a credible liquefaction-carbonization-graphitization technology to synthesize graphitized carbon from CS. The successful preparation of CSBGC was achieved by utilizing a dosage ratio of 1:2 for CS to liquefying agent, a graphitization temperature of 850 °C, and a catalyst concentration of 7.0 mmol/g of Fe(acac)3. Product testing and characterization were performed using SEM, TEM, FT-IR, XRD, Raman, BET, and TGA. Products show better graphitization and more minor defects. The result of the present study can support the preparation and application of CS of high-value materials. In this experiment, the disordered layer structure of carbon is gradually transformed into a graphitized structure, realizing the sustainable preparation of graphitic carbon based on biomass carbon and providing the transition stage of graphene preparation for biomass substances. At the same time, the material can be applied to different applications in different fields, including electrochemical energy storage, electrolyte conductance, electrodes, etc.

Author Contributions

L.M. was in charge of validation and writing the original draft; P.H. handled validation; P.L. was in charge of the investigation. All authors have read and agreed to the published version of the manuscript.

Funding

This work was supported by the Jilin Province Science and Technology Department (Grant number—20220101074JC) and the Climbing Project Fund of Changchun University (Grant number—ZKP202121).

Informed Consent Statement

This article does not contain any studies with human participants or animals performed by any of the authors.

Data Availability Statement

The data that support the findings of this study are available from the corresponding author upon reasonable request.

Conflicts of Interest

The authors declare that they have no known competing financial interest or personal relationships that could have appeared to influence the work reported in this paper.

References

  1. Yan, Q.; Li, J.; Zhang, X.; Hassan, E.B.; Wang, C.; Zhang, J.; Cai, Z. Catalytic Graphitization of Kraft Lignin to Graphene-Based Structures with Four Different Transitional Metals. J. Nanopart. Res. 2018, 20, 223. [Google Scholar] [CrossRef]
  2. Senneca, O.; Cerciello, F.; Russo, C.; Wütscher, A.; Muhler, M.; Apicella, B. Thermal Treatment of Lignin, Cellulose and Hemicellulose in Nitrogen and Carbon Dioxide. Fuel 2020, 271, 117656. [Google Scholar] [CrossRef]
  3. Morosawa, F.; Hayashi, S.; Terakawa, M. Femtosecond Laser-Induced Graphitization of Transparent Cellulose Nanofiber Films. ACS Sustain. Chem. Eng. 2021, 9, 2955–2961. [Google Scholar] [CrossRef]
  4. Li, Z.; Chen, Z.; Liu, C.; Hu, Z.; Zhao, W.; Zhao, G. Study on Pyrolysis Characteristics of Corn Straw. Int. J. Chem. React. Eng. 2011, 9. [Google Scholar] [CrossRef]
  5. Li, L.; You, Q.; Wu, S.; Huang, S.; Wu, Y.; Gao, J. Co-Liquefaction Behavior of Corn Straw and Shengli Lignite. J. Energy Inst. 2016, 89, 335–345. [Google Scholar] [CrossRef]
  6. Hudakorn, T.; Sritrakul, N. Biogas and Biomass Pellet Production from Water Hyacinth. Energy Rep. 2020, 6, 532–538. [Google Scholar] [CrossRef]
  7. Yelverton, T.L.B.; Brashear, A.T.; Nash, D.G.; Brown, J.E.; Singer, C.F.; Kariher, P.H.; Ryan, J.V.; Burnette, P. Characterization of Emissions from a Pilot-Scale Combustor Operating on Coal Blended with Woody Biomass. Fuel 2020, 264, 116774. [Google Scholar] [CrossRef] [PubMed]
  8. Xu, J.; Xie, X.; Wang, J.; Jiang, J. Directional Liquefaction Coupling Fractionation of Lignocellulosic Biomass for Platform Chemicals. Green Chem. 2016, 18, 3124–3138. [Google Scholar] [CrossRef]
  9. Chen, W.; Zhang, Q.; Lin, X.; Jiang, K.; Han, D. The Degradation and Repolymerization Analysis on Solvolysis Liquefaction of Corn Stalk. Polymers 2020, 12, 2337. [Google Scholar] [CrossRef] [PubMed]
  10. Nizamuddin, S.; Baloch, H.A.; Mubarak, N.M.; Riaz, S.; Siddiqui, M.T.H.; Takkalkar, P.; Tunio, M.M.; Mazari, S.; Bhutto, A.W. Solvothermal Liquefaction of Corn Stalk: Physico-Chemical Properties of Bio-oil and Biochar. Waste Biomass Valoriz. 2019, 10, 1957–1968. [Google Scholar] [CrossRef]
  11. Mun, S.P.; Cai, Z.; Zhang, J. Fe-Catalyzed Thermal Conversion of Sodium Lignosulfonate to Graphene. Mater. Lett. 2013, 100, 180–183. [Google Scholar] [CrossRef]
  12. Sun, L.; Tian, C.; Li, M.; Meng, X.; Wang, L.; Wang, R.; Yin, J.; Fu, H. From Coconut Shell to Porous Graphene-Like Nanosheets for High-Power Supercapacitors. J. Mater. Chem. A 2013, 1, 6462–6470. [Google Scholar] [CrossRef]
  13. Shen, J.; Li, T.; Long, Y.; Shi, M.; Li, N.; Ye, M. One-Step Solid State Preparation of Reduced Graphene Oxide. Carbon 2012, 50, 2134–2140. [Google Scholar] [CrossRef]
  14. Niu, M.; Zhao, G.J.; Alma, M.H. Thermogravimetric Studies on Condensed Wood Residues in Polyhydric Alcohols Liquefaction. BioResources 2011, 6, 615–630. [Google Scholar] [CrossRef]
  15. Yamada, T.; Ono, H. Rapid Liquefaction of Lignocellulosic Waste by Using Ethylene Carbonate. Bioresour. Technol. 1999, 70, 61–67. [Google Scholar] [CrossRef]
  16. Cheng, G.; Varanasi, P.; Li, C.; Liu, H.; Melnichenko, Y.B.; Simmons, B.A.; Kent, M.S.; Singh, S. Transition of Cellulose Crystalline Structure and Surface Morphology of Biomass as a Function of Ionic Liquid Pretreatment and Its Relation to Enzymatic Hydrolysis. Biomacromolecules 2011, 12, 933–941. [Google Scholar] [CrossRef] [PubMed]
  17. Tai, Z.; Zhang, Q.; Liu, Y.; Liu, H.; Dou, S. Activated Carbon from the Graphite with Increased Rate Capability for the Potassium Ion Battery. Carbon 2017, 123, 54–61. [Google Scholar] [CrossRef]
  18. Pan, C.; Liu, Y.; Cao, F.; Wang, J.; Ren, Y. Synthesis and Growth Mechanism of Carbon Nanotubes and Nanofibers from Ethanol Flames. Micron 2004, 35, 461–468. [Google Scholar] [CrossRef] [PubMed]
  19. Mendieta-Taboada, O.; Sobral, P.J.d.A.; Carvalho, R.A.; Habitante, A.M.B.Q. Thermomechanical Properties of Biodegradable Films Based on Blends of Gelatin and Poly(Vinyl Alcohol). Food Hydrocoll. 2008, 22, 1485–1492. [Google Scholar] [CrossRef]
  20. Yagmur, E.; Inal, I.I.G.; Gokce, Y.; Ulusoy Ghobadi, T.G.; Aktar, T.; Aktas, Z. Examination of Gas and Solid Products during the Preparation of Activated Carbon Using Phosphoric Acid. J. Environ. Manag. 2018, 228, 328–335. [Google Scholar] [CrossRef] [PubMed]
Figure 1. Simulation of the process principle of liquefaction-carbonization-graphitization of CS.
Processes 11 02884 g001
Figure 2. Effect of a single factor on CSBGC yields: (a) Solid–liquid ratio; (b) Graphitization Temperature; (c) Catalyst concentration.
Processes 11 02884 g002
Figure 3. The infrared spectrum of CS CSBGC and CSLP.
Processes 11 02884 g003
Figure 4. SEM and TEM CSBGC after pickling with various magnifications SEM (a) CSBGC wrapped by annealed and cooled before ferric element removal SEM (b) CSBGC directly prepared from CS SEM (c) and CSBGC TEM (d).
Processes 11 02884 g004
Figure 5. XRD results of CS and CSBGC.
Processes 11 02884 g005
Figure 6. Raman Spectra of CSBGC and CS.
Processes 11 02884 g006
Figure 7. N2 adsorption/desorption isotherm (a); Corresponding pore size distribution (b).
Processes 11 02884 g007
Figure 8. Thermogravimetric diagrams of liquefied products (a) and liquefied products with Fe(acac)3 catalyst (b). The red line represents TG and the blue line represents DTG.
Processes 11 02884 g008
Figure 9. (a) change of carbon and hydrogen atoms with temperature in CS and CSLP and CSLP. (b) change of oxygen and hydrogen nitrogen atoms with temperature in CS and CSLP and CSLP with catalysis.
Processes 11 02884 g009
Table 1. The Fe content results of CSBGC (by ICP-OES).
SampleTest 1Test 2Test 3Average
(wt.%)(wt.%)(wt.%)(wt.%)
CSBGC0.0220.0110.0130.015
Disclaimer/Publisher’s Note: The statements, opinions and data contained in all publications are solely those of the individual author(s) and contributor(s) and not of MDPI and/or the editor(s). MDPI and/or the editor(s) disclaim responsibility for any injury to people or property resulting from any ideas, methods, instructions or products referred to in the content.

