1. Introduction
In recent years, the exploration and development activities in the Bohai Sea region have escalated, with a shift toward identifying rocky trap oil and gas reservoirs that are primarily concealed. These reservoirs have replaced former exploration targets, including high-amplitude tectonic oil and gas reservoirs or layered oil and gas reservoirs. The target block is centrally positioned within the Bohai Basin. The target block is situated in a region of high relief at the center of the Shishutuo Bulge, between the Qinnan Depression and the Bohai-China Depression. It spreads east–west, with a significant rupture boundary on both the north and south sides. Faults have developed, forming a large, low-amplitude overburdened structure. The basin’s formation, development, and evolution are primarily controlled by tectonic activity [
1]. Moreover, it partially governs the hydrocarbon generation, transport, and gathering. The low-resistance oil reservoirs in our study area are predominantly situated along wide fracture zones, marked by relatively developed faults and robust tectonic movements. As exploration and development of the field continue to deepen, fruitful exploration and discovery have led to the development of an increasing number of unconventional, hidden, and complex oil and gas layers. In particular, increasing reserves and production in the Bohai Sea have made the low-resistance oil layer a major target. The Bohai Basin’s depth has been proven, and the conventional oil and gas strata are insufficient to meet the current development demand. The study area’s production dynamic data reveal that certain low-resistance layers yield over 100 m
3 of oil per day, demonstrating that they can succeed conventional oil strata as viable resources. At the same time, this illustrates the crucial necessity for precise and effective saturation logging evaluation of low-resistance oil reservoirs.
As early as the 1980s, Zemanek J. [
2] defined a nonproductive water reservoir with oil-bearing saturation of less than 50% as a low-resistivity oil reservoir. With the development of technology, researchers now have a deeper understanding of low-resistance oil reservoirs, and Cheng [
3] further subdivided low-resistance oil reservoirs based on previous research. The low-resistance oil reservoirs are subdivided into absolute-low-resistance and relative-low-resistance oil reservoirs. Absolute-low-resistance oil reservoirs refer to those where the absolute value of the reservoir resistivity is lower than the neighboring water reservoirs, while the relative-low-resistance oil reservoirs’ resistivity is 1~2 times that of the neighboring water reservoirs. The study of the genesis mechanism is the basis for the evaluation of low-resistivity oil reservoirs. There are various types of low-resistance reservoir genesis, which can be summarized into the following two categories: The first is macroscopic genesis, which includes tectonic action [
4], reservoir depositional environment [
5], and diagenesis [
6]. The second is microscopic genesis, which includes high bound water saturation [
7], clay additional conductivity [
8], oil and water formation mineralization differences [
9], and drilling fluid intrusion [
10].
The evaluation of water saturation logging in low-resistivity oil reservoirs has been a challenge. This is mainly because the low-resistivity oil reservoirs are affected by various factors, resulting in an insufficient accuracy of water saturation calculated by logging. A series of studies have been conducted by many scholars for the water saturation logging evaluation of a low-resistivity oil reservoir. Due to the low resistivity of the reservoir, the traditional Archie formula [
11] based on electrical characteristics is no longer applicable. Poupon and Leveaux [
12] proposed the Indonesia formula for low mineralized sandstone reservoirs in the Indonesian region. Waxman et al. [
13] proposed a new conductivity model (W-S model) for muddy sandstone based on the cation exchange capacity of rocks used to correct for the additional conductivity effect of clay. Clavier et al. [
14] considered the conductivity of muddy sandstone as a result of clay water and free water in parallel and, therefore, proposed a dual-water conductivity model (D-W model) for clayey sandstones. Silva et al. [
15] proposed an improved conductivity model (S-B model) for clayey sandstones based on the W-S and D-W models. All the above methods require accurate clay-bound water porosity, which is more dependent on cores and is difficult to accurately calculate from conventional logging data; thus, the calculated water saturation has some errors. According to Maxwell’s theory and the effective medium theory, Bussian [
16] developed models based on the distribution of reservoir mud and the electrical characteristics of the H-B equation. Subsequently, Lima [
17] and Berg [
18] improved these models. However, these new models are more complex, and the intermediate parameters are difficult to accurately obtain. Consequently, the research has remained at a basic level. Through extensive research, it has been acknowledged that various forms of conductivity exist beyond just muddy conductors. These include rock skeleton conductivity, micro-void conductivity, capillary-bound water conductivity, and clay-bound water conductivity. Givens proposed the rock skeleton conductivity model (CRMM) [
19], which suggests that the rock formation consists of two conductive networks: the free fluid and the rock skeleton containing conductive minerals. Meanwhile, Zhang et al. [
20] proposed the three-water model based on the traditional volumetric model, in which the total rock conductivity is seen as a combination of free water, microporous water, and clay water.
Simandoux [
21] proposed a saturation interpretation model based on the mud equivalent volume, according to the experimental results of uniformly distributed clay mixtures. Building upon this foundation, the initial focus of this paper resides in the meticulous analysis and exploration of the genesis mechanisms intrinsic to the representative low-resistivity oil reservoirs situated within the designated work zone. In tandem with elucidating the specific genesis category attributed to these low-resistivity oil reservoirs, a pertinent correction methodology is formulated to address the diverse influencing factors impacting such reservoirs. Finally, a robust water-saturation logging interpretation model is meticulously devised, tailored to effectively address the intricacies of low-resistance reservoirs. Through this systematic approach, a comprehensive framework is established to better comprehend, characterize, and interpret the distinctive attributes of low-resistivity oil reservoirs within the defined study area. The method has potential applications for water saturation determination in sand–mudstone reservoirs with complex low-resistance genesis types.
2. Analysis of the Petrophysical Genesis of a Low-Resistance Oil Reservoir
In the Bohai Basin, the low-resistivity oil reservoir within the Guantao Formation predominantly manifests in braided river deposits, situated at relatively shallow burial depths typically ranging between 1350 and 1400 m. Characterized by medium-sized pores and medium-to-high permeability, this reservoir type is marked by distinctive physical attributes. The underlying cause of low resistivity within these oil reservoirs primarily stems from several interrelated factors. These include a heightened saturation of immobile water, the pronounced additional conductivity contributed by clay, and the presence of conductive minerals. These factors are intricately tied to the reservoir’s lithology, physical characteristics, and pore structure. Consequently, these interactions induce alterations in the electrical properties of the reservoir, giving rise to the distinct phenomenon of a low-resistivity oil layer. Within the scope of petrophysical analysis, the prevailing causes for the emergence of low-resistivity oil reservoirs in the designated work zone are primarily attributed to two principal factors: elevated bound water saturation and the formidable influence of strong clay-related additional conductivity. These petrophysical aspects further contribute to the overarching understanding of the mechanisms behind the formation and behavior of low-resistivity oil reservoirs in this particular geological context.
- (1)
Analysis of the role of high immobile water saturation
A primary contributor to the occurrence of low-resistivity oil reservoirs is the presence of elevated immobile water saturation. This concept of immobile water is distinct from the conventional notion of bound water, which pertains to water incapable of flowing under specific pressure differentials within the pore space. Immovable water, on the other hand, primarily comprises thin-film water that adheres to particle surfaces due to adsorption, as well as capillary retention water confined within capillary pores.
The degree of water immobilization is markedly influenced by both the reservoir lithology and pore structure, jointly determining the reservoir’s potential for water retention through mechanisms such as adsorption and capillary action. By gaining an understanding of the intricacies underpinning immobile water behavior and its complex interplay with lithological and pore-related characteristics, a more profound comprehension of the low-resistivity oil reservoir phenomenon can be attained. It is noteworthy that the finer the particle size of clastic rock, the larger its specific surface area, subsequently enhancing its capacity for water retention on particle surfaces. As depicted in
Figure 1, which illustrates the median particle size data, section I exhibits a mean median particle size of 0.07 mm, while section II of the low-resistivity oil layer demonstrates a mean median particle size of 0.03 mm. In contrast, the adjacent conventional oil layer showcases a mean median particle size of 0.08 mm, while the neighboring water layer presents a mean median particle size of 0.10 mm. The overall composition of the reservoir reflects an exceedingly fine particle size distribution. Consequently, the fine lithological attributes of the formation, characterized by a robust water adsorption capacity, constitute a favorable foundation for the development of low-resistivity oil reservoirs within the designated work zone. This intricate interplay of lithology, pore structure, and water retention mechanisms underscores the distinctive nature of low-resistivity oil reservoirs in this geological context.
The pore structure of a reservoir usually refers to the distribution and arrangement form of the particles in the rock skeleton and the way the skeleton is filled with clay minerals. The more complex the pore structure is, the more likely it is to produce highly immobile water in the reservoir. The NMR T2 spectrum distribution has excellent correlation with the distribution of the pore throat size, which can be used to reflect the pore structure inside the rock.
Figure 2 shows the NMR T2 spectrum distribution of the experimental samples in a saturated state. From the curve pattern of the T2 spectrum distribution in the figure, we can find that the main peak of the low-resistivity oil reservoir is to the left, and the T2 transverse relaxation time is dominated by the low-value part, i.e., the small pore throat is dominant. That in the water and conventional oil formations is to the right, and the T2 transverse relaxation time is dominated by the middle and high values, i.e., the medium and large pore throats are dominant. This disparity underscores a critical insight: the low-resistivity oil reservoir manifests a more intricate microporosity and pore structure within the rock matrix when compared to conventional reservoir formations. This distinction in the pore structure contributes to the unique characteristics of low-resistivity oil reservoirs, shaping their behavior and properties in a distinctive manner.
According to the concept of immobile water, it contains the bound water in a strict sense, and when the bound water saturation is high, it leads to a decrease in the rock resistivity and the formation of a low-resistivity oil reservoir. Immobile water content is influenced by the mud and pore structure, as shown in
Figure 3, which shows the correlation analysis of the bound water saturation with the T2 geometric mean (T2LM) and the pore structure index, √(K/φ), respectively. Among them, the physical index is used to characterize the macroscopic pore structure, and T2LM is used to characterize the microscopic pore structure. The bound water saturation of the low-resistivity oil reservoir has excellent correlation with the pore structure index and the T2 geometric mean. An insight emerges from this analysis: the bound water saturation observed within the low-resistivity oil reservoir exhibits a robust correlation with both the pore structure index and the T2 geometric mean. This observation underscores the crucial role played by the complex pore structure in dictating the elevated bound water saturation characteristic of the low-resistivity oil reservoir within the designated study area.
- (2)
Analysis of the additional conductive effect of clay
The clay minerals themselves have good electrical conductivity and can improve the overall electrical conductivity of the reservoir. Therefore, the additional conductive effect of clay is often one of the important causes of the formation of low-resistivity oil reservoirs.
Clay minerals often contain charges on their tectonic forms, and these charges are divided into tectonic and surface charges. Tectonic charges arise from the substitution of ions in the lattice of clay minerals. In the process of such substitution, excess negative charges are formed. The surface charge is formed by the hydrolysis effect of Si-O and Al-OH bonds along the lattice structure surface of clay minerals. According to the diffusion double-layer theory, because of the unsaturated charge on the surface layer of clay minerals, after it enters the solution, there will certainly be an equal number of cations adsorbed to the surface of clay minerals to achieve electrical equilibrium. The cations adsorbed on the surface of the clay minerals, due to the concentration difference, will also eventually achieve ion concentration equilibrium by diffusing outward. This diffusion process will form a diffuse electric layer, which enhances the reservoir conductivity and forms a low-resistivity oil layer. Therefore, the electrical conductivity of clay minerals is mainly influenced by the cation exchange capacity (CEC) of clay minerals. The number of exchangeable cations per unit pore volume of clay is Qv, and the larger the Qv, the stronger its additional electrical conductivity.
Figure 4 shows the clay mineral distribution map, in which the main difference between the low-resistivity oil layer and the conventional oil and water layers is reflected in the content and type of clay minerals. Meanwhile, it shows that the content of clay minerals in the low-resistivity oil layer dominated by the illite–montmorillonite mixed layers is significantly larger than that in the conventional reservoir.
Combined with the cation exchange capacity data for analysis, as shown in
Figure 5, the CEC value is a key indicator parameter for the additional conductivity of clay, which refers to the exchange capacity of the number of cations exchangeable by clay per unit pore volume. The average CEC value of the low-resistivity oil layer in section III is 30.9 mmol/100 g, and that in section II is 11.3 mmol/100 g, which is much higher than the neighboring conventional oil layer (average CEC value is 2.6 mmol/100 g) and the overlying water layer (average CEC value is 5.7 mmol/100 g). The clay mineral content of the low-resistance oil section of the Guantao Formation is significantly higher than that of the adjacent conventional oil and water formations, and the clay minerals are mostly montmorillonite-dominated illite–montmorillonite mixed layers, blended with strong additional conductivity. This makes the low-resistivity oil section have an obvious strong cation exchange capacity. The additional conductivity of clay is one of the main microscopic control causes for the low-resistivity oil reservoir in this study block.
3. Saturation Evaluation Study of a Low-Resistance Oil Reservoir
Based on the comprehensive exploration into the genesis mechanism of low-resistivity oil reservoirs, the primary petrophysical factors contributing to their formation involve heightened immobile water saturation, attributable to the intricate nature of the pore structure, and augmented electrical conductivity arising from the substantial clay mineral content. Consequently, the formulation of a saturation evaluation model becomes imperative, aligning with the unique reservoir attributes of low-resistivity oil reservoirs. This model aims to mitigate the influence of electrical disparities on the accuracy of reservoir evaluation.
In sandstone reservoirs, the Archie formula is the most basic model for evaluating saturation. Since the Archie experiment is conducted in pure sandstone with good physical properties, the application of the Archie model is not satisfactory in low-resistance oil reservoirs with a higher mud content and a more complex composition. In the research into low-resistivity oil reservoirs, many saturation evaluation models have been proposed by researchers, among which the W-S model and the double-water model are the most widely used. The W-S model is a saturation interpretation model that considers the influence of cation exchange in muddy sandstones on the electrical conductivity of rocks. Through the experiment of the relationship between rock conductivity and the cation exchange capacity, Qv, the conductivity, σo, of muddy sandstone and the solution conductivity, σw, of saturation show a nonlinear variation law. It is proposed that the conductivity of muddy sandstone is jointly influenced by the parallel conductivity of the formation water and the cation exchange of clay minerals. The theoretical basis is the cation exchange effect of clay minerals, but the CEC of low-resistivity oil and adjacent water formations in the study block is comparable. Both present low values; however, the W-S model is applicable to high CEC conditions and formations with strong cation exchange effects. The application effect is poor in the destination block. Considering the heavy mud content and complex and variable forms of clay mineral composition and distribution in the study block, it takes the Simandoux formula for saturation evaluation.
- (1)
Principle of the Simandoux model
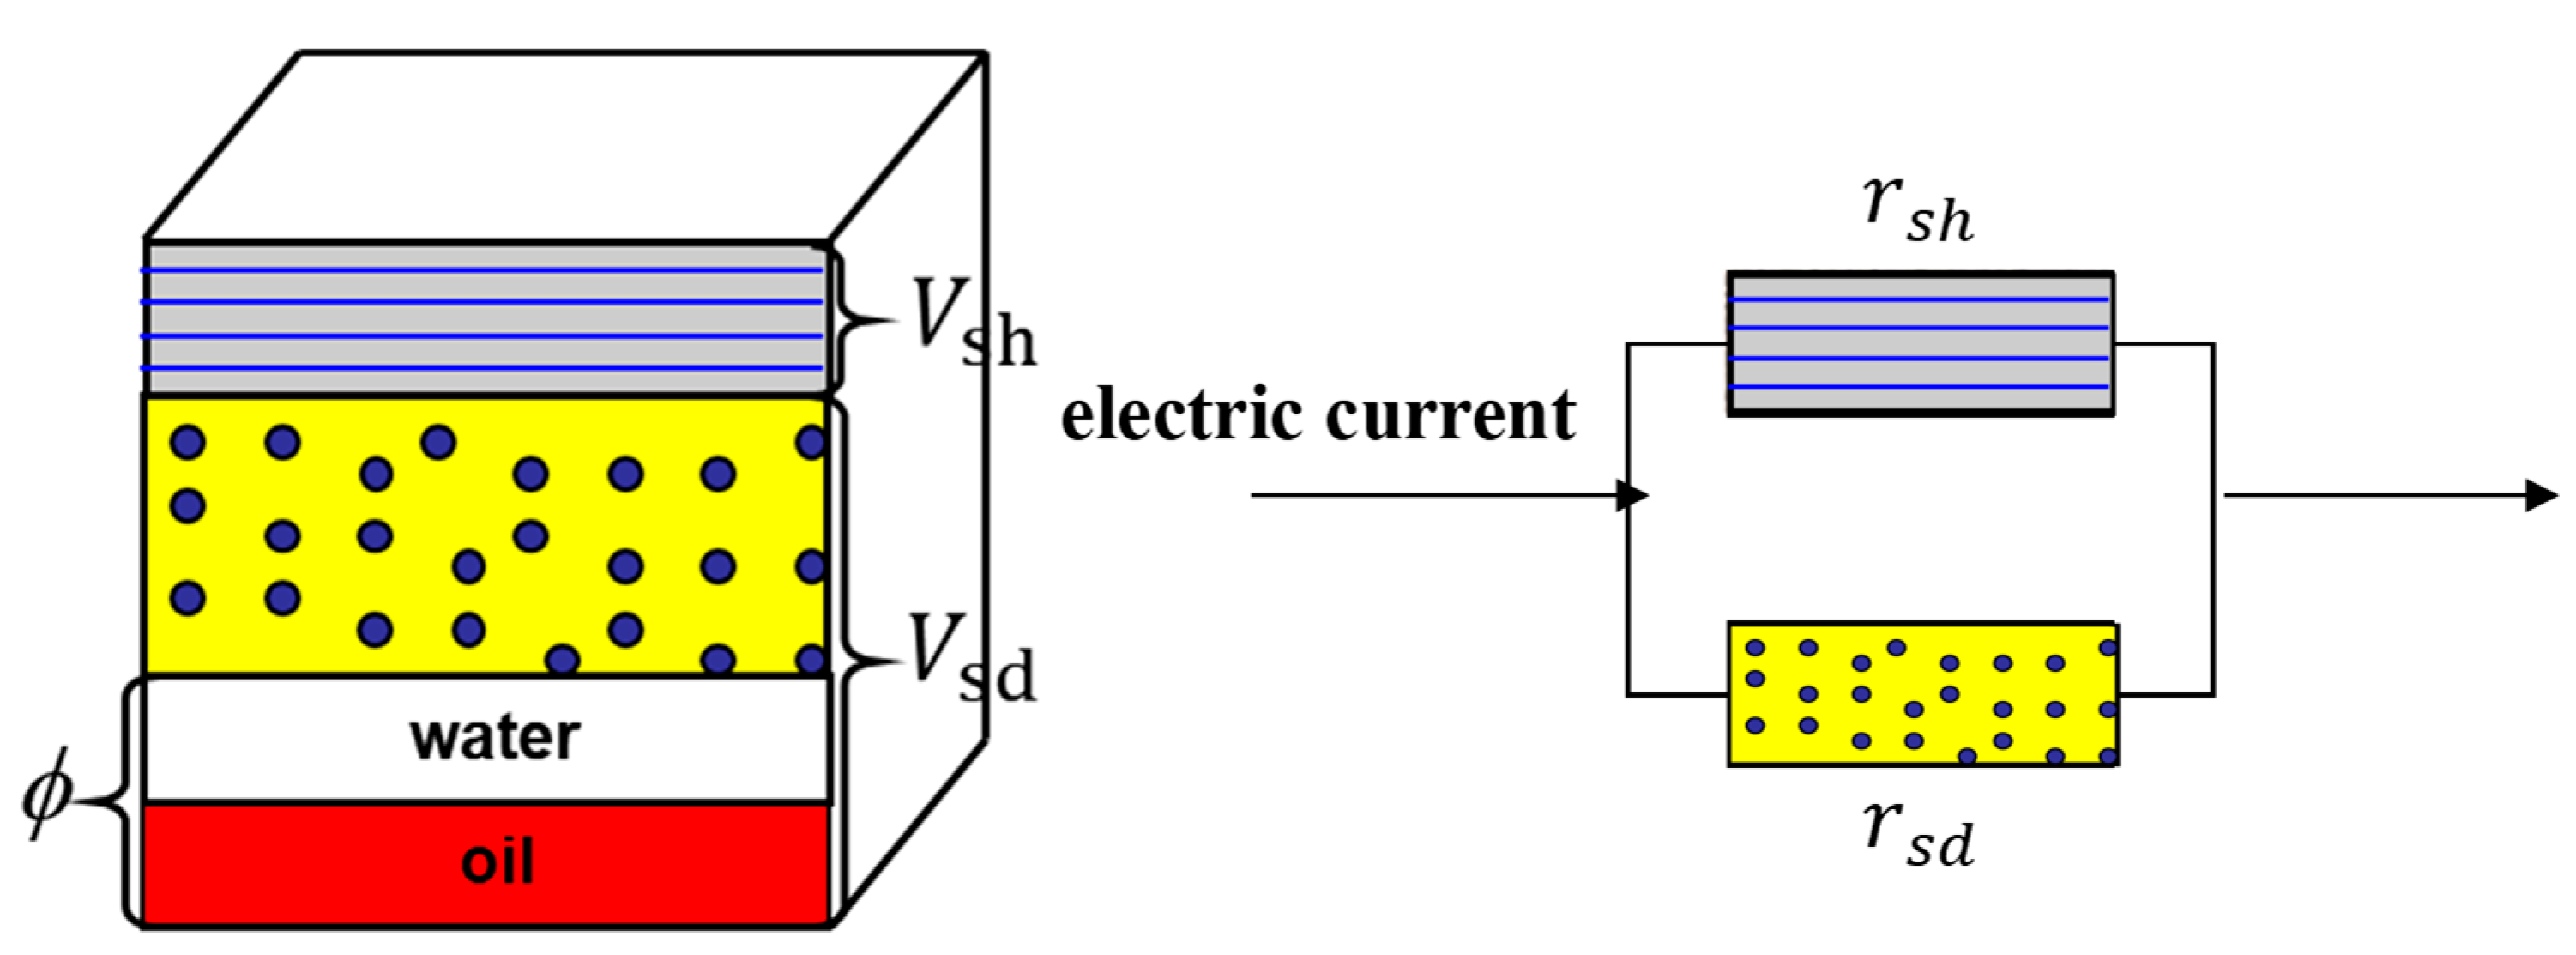
The Simandoux formula is a mixed mud sandstone saturation interpretation model, which considers the mud in the formation to be composed of clay and fine chalk. According to the Archie formula, the fine chalk part can be treated as oil- and gas-rich siltstone. The conductivity of the whole formation is contributed by both the pure sandstone itself and the fine chalk in the mud. Then, the two conduct in parallel to form the total conductivity of the mud sandstone.
Figure 6 shows the conductive model of the Simandoux formula. The Simandoux formula thus offers a comprehensive framework for assessing saturation in complex formations, particularly those characterized by a mix of mud and sandstone components. By incorporating the distinct electrical properties of clay, fine chalk, and pure sandstone, this model enables a more nuanced interpretation of reservoir properties and saturation levels, enhancing the accuracy and depth of analysis within these intricate geological settings.
That is, the resistance,
r, of the rock is the muddy part resistance,
r1, in parallel with the pure sandstone part resistance,
r2:
where
Rt is the formation resistivity, Ω·m,
Rs is the mud resistivity, Ω·m, and
Rsd is the pure sandstone resistivity, Ω·m.
Combining the bulk physical model with the Archie equation, the pure sandstone in the rock itself conforms to the Archie equation. The muddy part consists of clay and finely pulverized sand, and due to the extremely fine lithology, the saturation index n = 1, yielding the following equations:
where
φe is the effective porosity, decimal, and
Rsh is the resistivity of the muddy part without oil and gas (100% water content), Ω·m.
Substituting Equations (2) and (3) into Equation (1) yields the Simandouxian equation, but the equation does not fit the continuous interpretation of the strata. Thus, the obtained equation after the union is optimized, i.e., the Simandouxian equation, is:
- (2)
Correction of rock electric parameters in the Simandoux formula
According to the principle of the Simandoux formula, the parameters m and n are the pore structure index and the saturation index of the conductive part of the pure sandstone in the model. They are obtained by petrographic experiments influenced by the additional conductivity of clay in the core samples. Thus, the parameters m and n are corrected for the clay part by combining the theory of the W-S model of the clay cation exchange model to eliminate the influence of the additional conductivity of clay, and the corrected parameters are defined as m* and n*.
- ①
m* determination
The equivalent conductivity of formation water in muddy sandstone,
Cwe, consists of two components: the conductivity of formation water and that of clay water in mud. It can be expressed as:
where
Cwe is the conductivity of the formation water, mS/m,
Cw is the conductivity of the saturated muddy sandstone solution, mS/m, B is the electrochemical equivalent conductance of equilibrium cations, 10
−6 × S × m2 × meq
−1 and
Qv is the cation exchange concentration of clay, mmol/cm
3.
Based on the definition of the pure sandstone stratigraphic factor, the muddy sandstone stratigraphic factor,
F*, can be expressed as:
where
F* is the muddy sandstone stratigraphic factor, R
o is the (100% water content) sandstone resistivity, Ω·m,
Rwe is the formation water resistivity in muddy sandstone, Ω·m, and
Co is the muddy sandstone electrical conductivity, mS/m.
For pure sandstone strata, according to the Archie formula:
where
F is the pure sandstone stratigraphic factor.
Combining the above equations, we obtain:
The relationship between
F* and porosity is established using the corrected
F*. As shown in
Figure 7,
Figure 7a shows the uncorrected
F vs. porosity, and
Figure 7b shows clay with the additional conductivity-corrected
F* vs. porosity. The value of a is 0.987, and the value of m* is 1.893, as obtained from the rock electrical experiments with clay correction.
- ②
n* determination
The formation water equivalent conductivity,
Cwe, in a muddy sandstone containing oil and gas can be expressed as:
The resistivity increase factor,
I*, for muddy sandstone can be expressed as:
where
I* is the mud sandstone resistivity increase factor,
Rt is the oil- and gas-bearing mud sandstone resistivity, Ω·m, and
Ct is the oil- and gas-bearing mud sandstone electrical conductivity, mS/m
The resistivity increase factor,
I, for pure sandstone is calculated from Archie’s formula as:
where
I is the resistivity increase factor of pure sandstone.
Combining Equations (10)–(12), we obtain:
Using the equation-corrected I* to establish the relationship between the water content saturation and combining the rock and electricity experimental data, the mud-corrected n* value of 1.817 was obtained.
During the calibration process,
B and
Qv are calculated based on the definitions with the following equations:
where
φt is the total porosity, decimal, and
ρg is the particle density, g/cm
3.
- (3)
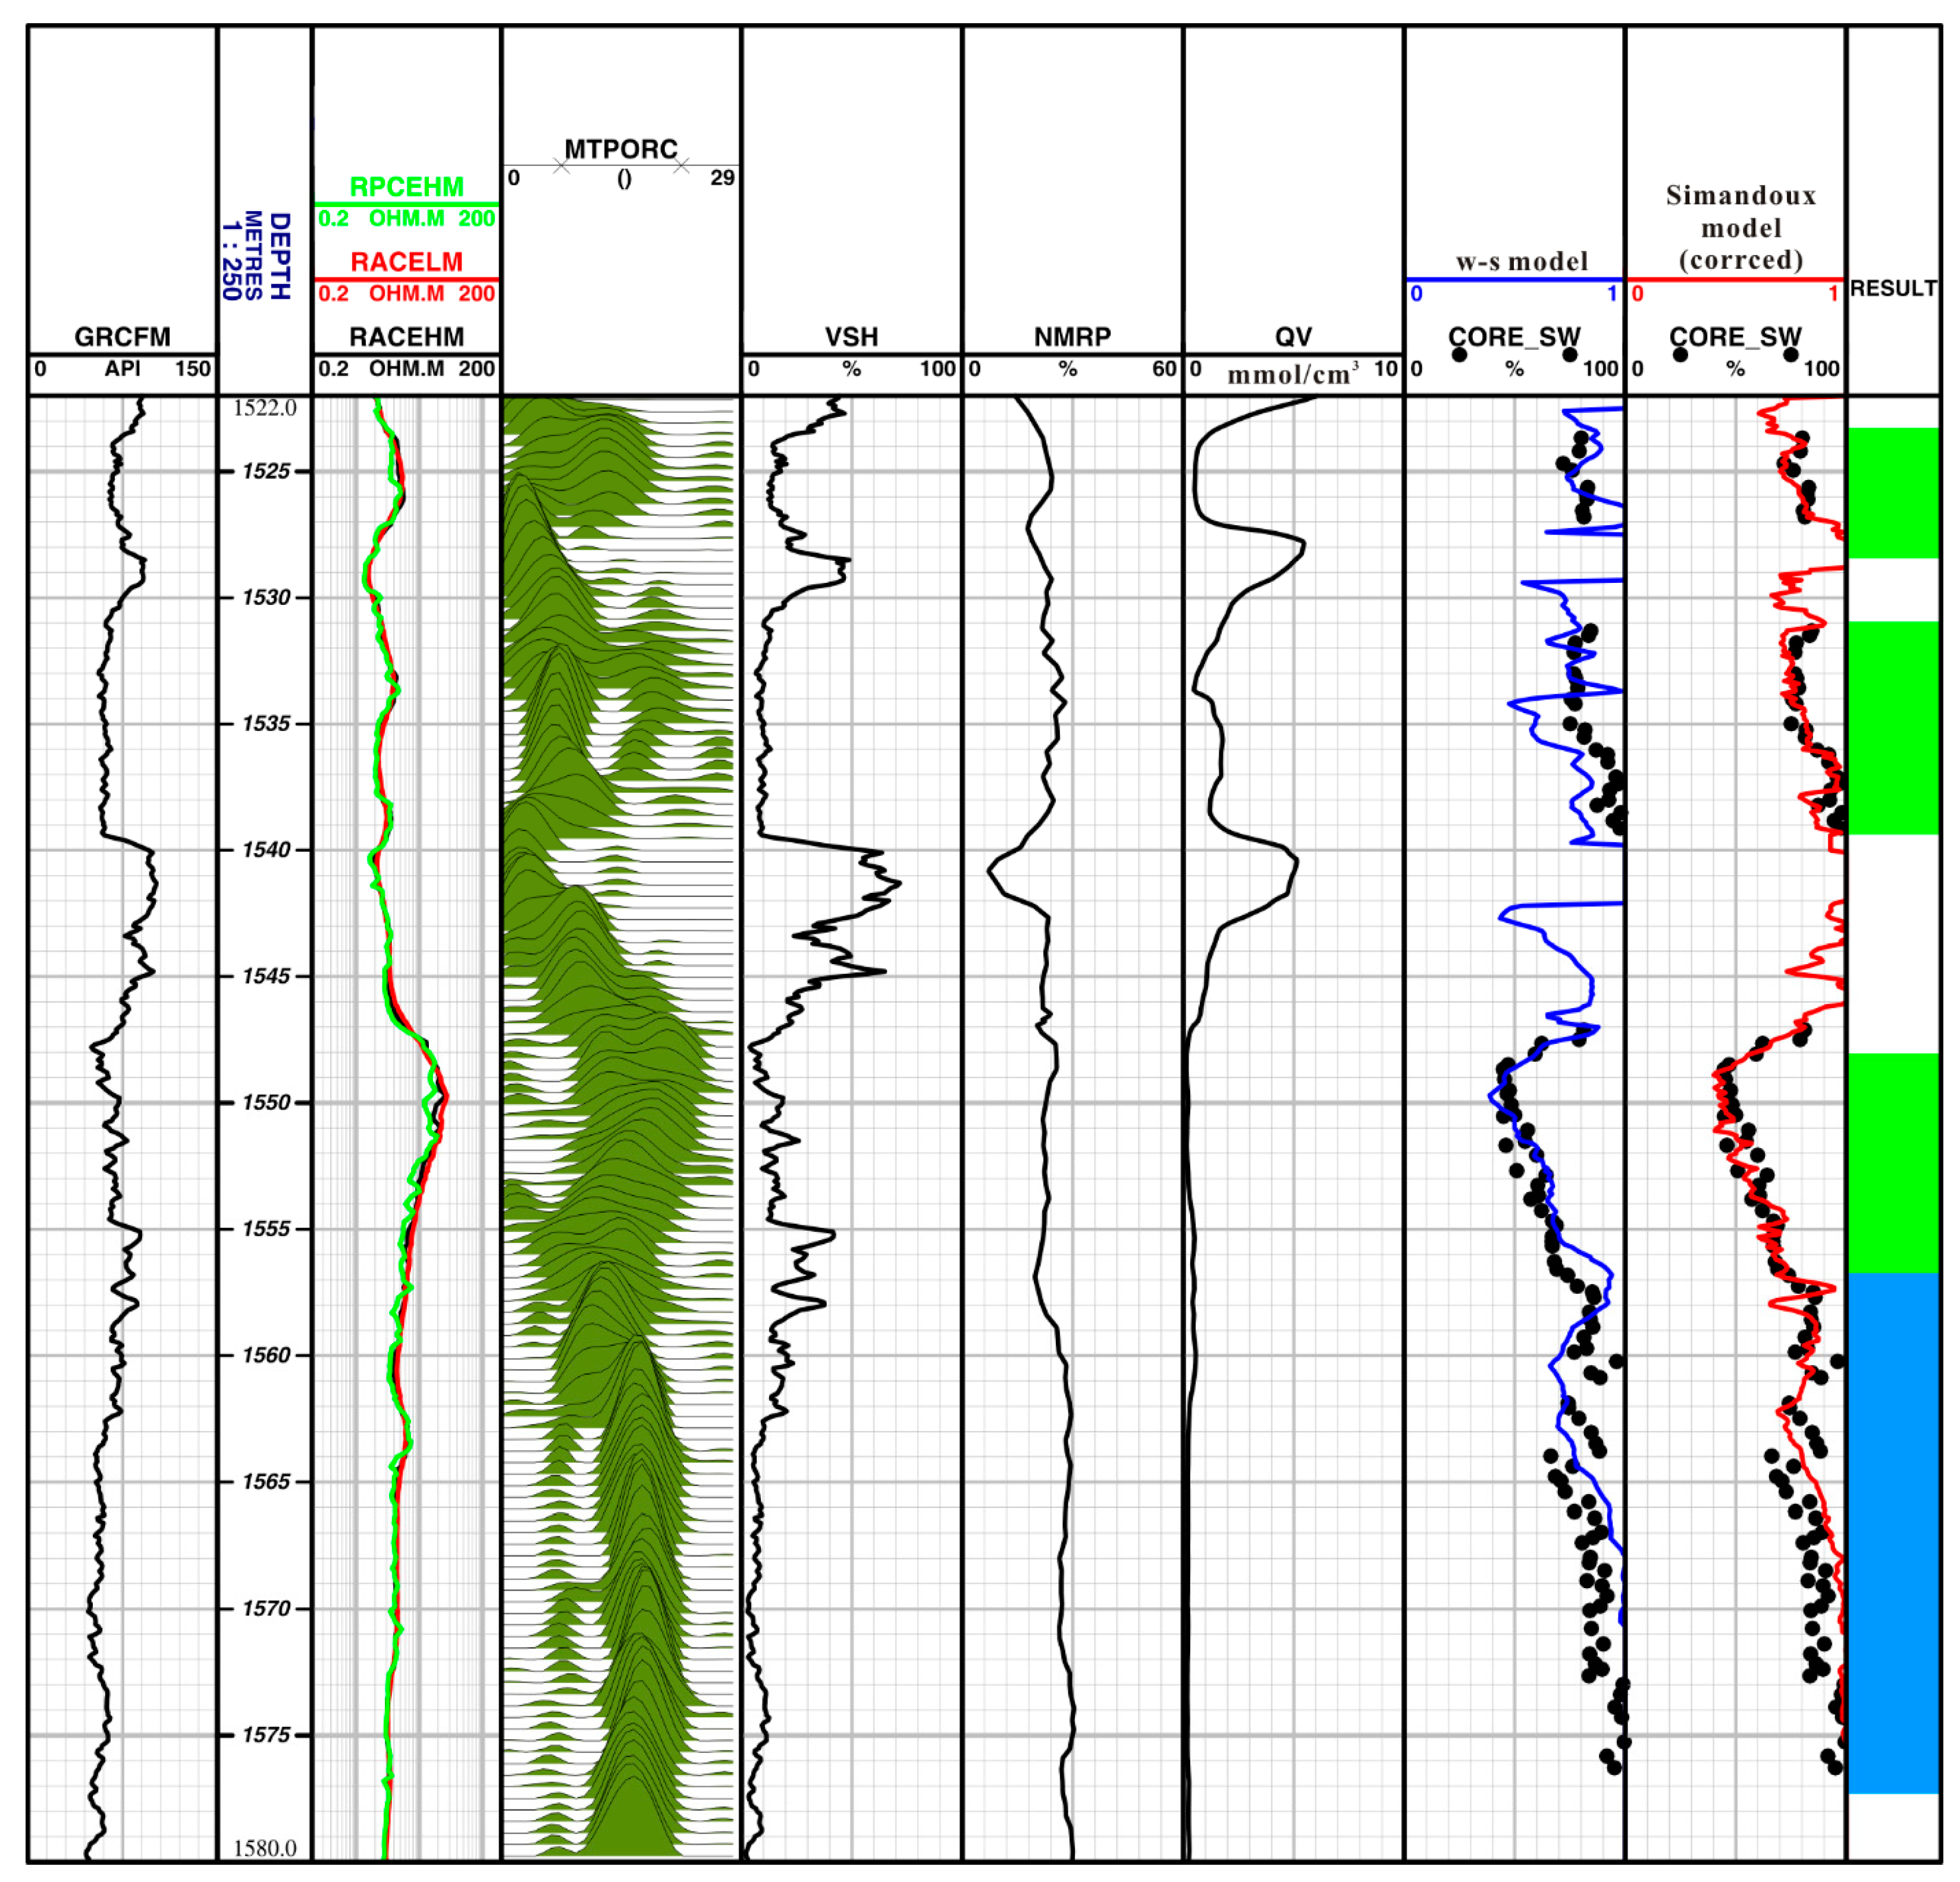
Determine the mineralization of formation water, Rw, and mudstone resistivity, Rsh
- ①
Determine the formation water resistivity, Rw. We determined the formation water equivalent resistivity based on two methods: formation water analysis data and core data inversion.
Using the mineralization of 30,985–99,805 mg/L indicated by the formation water analysis data, the resistivity of the formation water was taken as the average value of 0.04 ohm·m.
Using core data to invert the formation water resistivity: Based on the data of the core NMR-bound water saturation, porosity, mud content, and rock electricity of the parallel samples, the formation water resistivity was inferred using the Simandoux formula with an average value of 0.05 ohm·m.
The final formation water resistivity, Rw, was taken as the average value of both, 0.045 ohm·m.
- ②
Determine the mudstone resistivity, Rsh. The resistivity of the pure mudstone layer with a high natural gamma value adjacent to the low-resistivity oil reservoir of the Guantao Formation was selected as 2 ohm·m.


