Abstract
Manufacturing companies face significant challenges due to rapid changes in globalized markets and open economies, which are experiencing mega-trends such as urbanization, globalization, and individualization. For sustainable growth, advanced technology is necessary. However, selecting technology is a difficult task due to the wide variety of options in the market. Technology has become a fundamental strategic factor for the growth and profitability of companies. The main objective of this paper is to propose a model and a methodological proposal for technology selection in the context of Industry 4.0 manufacturing. The proposed methodology is divided into three stages: The first stage is of knowledge and intervention, which allows for the socialization of the model and data collection. The second stage is the operational stage, where a hybrid method of FAHP and FANP is used to determine the weights of the factors considered. Lastly, the third stage is the analysis and evaluation stage, where the analysis, discussion, and evaluation of the results take place. To validate the proposed model, the methodology was applied to two case studies in Chilean industrial companies. The results obtained through the FAHP and FANP algorithms enabled decision makers to manage and select the most suitable technology from the wide variety of options available in today’s markets.
1. Introduction
1.1. Background
In the last two decades, manufacturing has undergone a transformation thanks to advanced technologies in automation and robotics [1]. In this context, Manufacturing 4.0 involves the development of AMTs and the digitization of products and processes [2,3,4]. In this regard, Ref. [5] conducted a comprehensive research on the obstacles (barriers), drivers, and types of innovation faced by managers when adopting new advanced technologies. Moreover, the study conducted by [6] examined the rapid evolution, socialization, and value creation that has been achieved with the adoption of advanced technologies. Companies implement digitization strategies in line with technological evolution and market demands; hence, managers must understand and strengthen organizational capabilities to innovate in business models [7]. The digitization of industry has been able to modify traditional process and competitive structures and value generation, which has led to having to adapt to a completely transformed competitive environment [8,9,10]. On the one hand, Ref. [11] performs a study of the environmental and sustainability impact of advanced manufacturing in Hungary. On the other hand, the evolution towards Industry 4.0 is supported by automation, digitalization, smart factories, smart products, and smart services. This progress provides enormous opportunities for achieving sustainable manufacturing [12,13,14,15]. In this context, the study conducted by [16] has examined the transformations in manufacturing sustainability arising from Industry 4.0. To meet these challenges, companies need to adapt and improve their productivity through an efficient technology platform [17,18]. In manufacturing, several countries have implemented local programs to foster the development and adoption of Industry 4.0 technologies [3,4,19].
In Chile, a program has been proposed to revitalize the manufacturing industry and promote the emergence of new companies through the use of advanced technology. The objective is to increase productivity, generate quality employment and higher incomes, and create new, more efficient, sustainable, and high-quality business models (Strategic Program for Advanced Manufacturing, 2018). This research presents a model and methodological proposal for selecting suitable technologies in key sectors of the Chilean economy within the context of Industry 4.0 manufacturing.
Selecting the appropriate technology for a manufacturing process is a complex challenge that involves multiple qualitative and quantitative criteria. It is important to consider the interaction with other existing technologies within the company and seek compatibility. Although there are different approaches to selection, expert perspectives remain essential. The use of multicriteria methods and fuzzy systems theories is increasingly common to address uncertainties associated with human decision making [20].
This study contributes to the current trend by presenting an integrated hybrid method (AHP, ANP, and fuzzy logic) suitable for technology selection in the context of Industry 4.0 in the Chilean industry. It should be noted that the applied methodology and proposed model are specifically targeted towards manufacturing sector companies. It is important to highlight that the results obtained in the case studies presented in this research will be valid only for the companies where this methodology is applied.
1.2. Literature Review
1.2.1. Hybrid Methods
While AHP is commonly used for decision making, its traditional version may not adequately reflect human thinking and can be imprecise in ambiguous situations. Furthermore, its use of a deterministic scale can be misleading, according to [21]. To address these limitations, hybrid methods combine the strengths of each decision-making method, as noted by [22]. This strategy allows for compensating for the limitations of each method and is particularly useful in technology selection and other decision-making problems. An example of this is the work conducted by [23], which used an adjusted priority method and AHP to evaluate and rank alternatives, and subsequently employed a greedy heuristic algorithm to allocate resources to different technologies. To develop an efficient technology selection method, Ref. [24] employed a scoring model (TOPSIS) to weigh subjective criteria and a technological frontier approach to overcome the inefficiencies of TOPSIS (non-intuitive and deterministic numerical results).
Additionally, Ref. [25] utilized three decision-making methods, AHP, ANP, and graphs. These methods provide selection indices for the different alternatives considered. Similarly, Ref. [26] employed fuzzy techniques and financial analysis to quantify the tangible and intangible benefits of manufacturing technology alternatives. These methods provide selection indices for the different considered alternatives. In turn, Ref. [27] employed a two-filter fuzzy method to select paper pulp manufacturing technology, considering economic, technical, and risk dimensions in the first filter, and strategic, business, supplier, and environmental dimensions in the second filter. On the other hand, Ref. [28] conducted a study to select technology considering operational and environmental aspects, using COPRAS-G and EVAMIX techniques. The authors of [29] designed a maintenance support system with FUZZY–AHP and selected technical, cost, and risk dimensions. Likewise, Ref. [30] utilized cross-entropy with fuzzy numbers and multicriteria methods to select robots. Additionally, Ref. [31] used stochastic multicriteria methods for robot selection, while Ref. [32] proposed a hybrid model for the selection of advanced digital technologies. On the other hand, Ref. [33] conducted a financial portfolio analysis using a hybrid method with Fuzzy and ANP. Additionally, in the selection of materials for 3D-printed fiber-reinforced composites, Ref. [34] employed multicriteria methods. Moreover, Ref. [20] conducted a comparative study of a causal model and a multicriteria model to assess technology in technology and supplier management. On another note, Ref. [35] identified eight mechanisms for reducing digital waste that can support lean practices and enhance decision making. These studies enable managers to identify digital technologies that can effectively support their respective process improvement activities. Continuing with this trend, Ref. [36] describes how these cutting-edge technologies are utilized in sustainable manufacturing. A comprehensive study of multicriteria methods in the technology selection process in additive manufacturing has been conducted by [37]. Lately, Ref. [38] developed a powerful hybrid MCDM method to evaluate the influence of Industry 4.0 technologies on manufacturing strategies. They utilized AHP to calculate the weights of criteria and subcriteria, and the fuzzy–TOPSIS method to rank the industry 4.0 technologies. The results showed that cost is the most critical criterion in the implementation of Industry 4.0 technologies, and additive manufacturing (AM) is the most suitable Industry 4.0 technology to address global competition. Recently, in the study by [38] several multicriteria decision-making methods (MCDM) are used to select an optimal robot depending on the application.
1.2.2. Barriers and Enablers Faced by Managers in the Adoption of Technology in Industry 4.0
Recently, Ref. [5] investigated barriers and enablers in technology adoption, identifying five categories of barriers (economic, organizational, human resources, political and regulatory, and technological) with subcategories. They highlighted, for example, high capital costs in additive manufacturing [39,40,41]. The generic enablers found by Stornelli et al. [5] (2021) encompass government policies, enabling capability, corporate structure, and technology strategy. For example, a cost leadership strategy requires high-volume automation technologies, while differentiation involves the integration of advanced manufacturing technologies (AMT) components, according to [40]. Similarly, Ref. [42] conducted a study on the critical factors for the successful implementation of Industry 4.0, and the tenth factor involves the relationship between Industry 4.0 and sustainability, as technology, digitization, and artificial intelligence are interconnected with technical and social aspects [43]. In the study by [44], a digital strategy was implemented in three digital companies to learn from their experience in managing disruptive changes generated by technology. There must be consistency between the formulation and execution of the strategy, the latter stage is crucial for success [45]. On the other hand, Ref. [8] found that digital technology implementation often results below expectations unless companies improve their intangible resources, such as managerial, organizational, skills, and technical. Managerial capabilities are key to eliminating the mismatch between tasks and technology, thus improving technology adoption. However, the use of multicriteria tools has enabled managers to address complex problems, with dynamism, uncertainty, multiple scenarios, and conflicting criteria, and the involvement of several decision makers. This approach is based on procedural rationality, which seeks understanding and consensus, and harmonizes the different perspectives of stakeholders in decision making [46,47].
1.2.3. Review of Other Methods
In the literature, there are other methods that allow prioritizing and selecting technology. In a study carried out by [48], the authors analyzed the manufacturing technology selection methods (DEA, financial, mathematical programming, and fuzzy logic). On the other hand, Ref. [49] proposed a method using, DEA, integer linear programming, and MCDM for the technology selection. Likewise, Ref. [50] used DEA in a three-stage network and the IDEA-Malmquist method to measure innovation efficiency in China’s high-tech manufacturing industry. Similarly, Ref. [51] also applied the DEA three-phase method to study the effect of innovation on high-tech enterprises in China’s renewable energy sector. On the other hand, Ref. [52] proposed a project portfolio model that supports companies in the appropriate selection of technology in digital transformation in initiatives I.40. On the other hand, Ref. [53] carried out a systematic review of integration projects of technology in industry 4.0. Additionally, optimization methods are used, e.g., Kudratova [54] used an LP model to maximize the net present value (NPV), in which the sustainability cost of projects is explicitly considered. On the other hand, Ref. [55] used a two-phase mathematical programming model under uncertainty for the evaluation and selection of technology projects. Instead, Ref. [56] applied fuzzy logic to select cleaning remanufacturing technology in industrial processes.
1.3. Justification and Contribution
After reviewing the available studies, it is concluded that there is no research that employs a multicriteria model that integrates the dimensions of human resources, operational, manufacturing, and financial aspects to select technology in the context of Industry 4.0. This methodology is important because it focuses on improving the limitations identified in the existing literature by considering these four key strategic factors in manufacturing management and in technology selection. Additionally, compared to previous approaches for technology selection, the hybrid composite approach (FAHP and FAHP) brings new contributions. Firstly, it allows decomposing problem by means of a tree, it evaluates the independence of the (dimensions, selected selection criteria), and it is able to capture the vagueness and ambiguity of the evaluations made by decision makers. Secondly, it measures the interdependence and feedback of the (dimensions and criteria) and captures the vagueness and ambiguity of the judgements made by decision makers.
Therefore, the aim of this study is to fill this gap by proposing this model and developing a methodology for technology selection in the context of Industry 4.0.
2. Fuzzy and Multicriteria Methods
2.1. Fuzzy Sets and Fuzzy Number
A fuzzy set in a universe of discourse X is characterized by membership function , which associates with each element x in X, a real number in the interval [0, 1]. The function is termed the grade of membership of x in M (see Equation (1) and Figure 1).
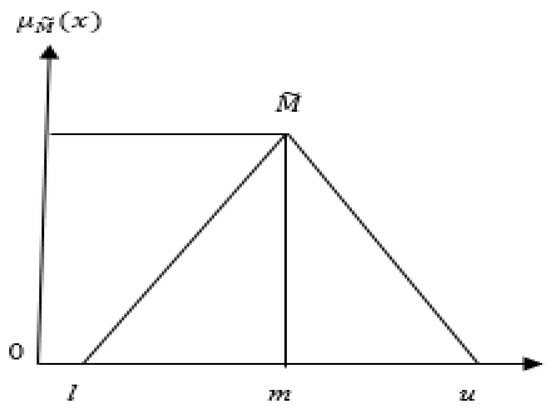
Figure 1.
Membership function.
The triangular fuzzy number above can be shown as) and , where l and u represent fuzzy probabilities between the lower and upper boundaries of evaluation information (see Figure 1): Basic operations with fuzzy numbers.
2.2. FAHP Method
In this study, the extent of FAHP is utilized, which was originally introduced by [57]. Let X = {x1, x2, x3, …, xn} be an object set, and G = {g1, g2, g3, …, gn} be a goal set. According to the method of extent analysis, each object is taken and extent analysis for each goal performed, respectively. Therefore, m extent analysis values for each object can be obtained, with the following signs,
where (j = 1, 2, …, m) all are TFNs. The steps of extent analysis can be given as in the following:
Step 1. The value of fuzzy synthetic extent with respect to the ith object is defined as:
To obtain , the fuzzy addition operation of m extent analysis values for a particular matrix is performed such as:
and to obtain the fuzzy addition operation of (j = 1, 2, …, n) and then the inverse of the vector above is computed, such as:
Step 2. As
and = (,,) are two triangular fuzzy numbers, the degree of possibility of ≥ = (,,) are compared, using the following fuzzy number comparison principles:
As and , are two triangular fuzzy numbers, the degree of possibility of ).
- (i)
- When , , the degree of possibility is defined as [58]:
- (ii)
- Otherwise, the ordinate of the highest intersection point is calculated as:
Step 3: To compare the fuzzy numbers, the degree of possibility M2 ≥ M1 is calculated as:
Figure 2 illustrates Equation (13) where d is the ordinate of the highest intersection point D between and . To compare and , both and are needed.
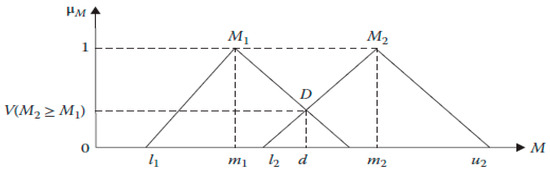
Figure 2.
Intersection between two fuzzy numbers M1 and M2.
Step 4: The degree of possibility for a fuzzy number to be greater than k fuzzy numbers can be defined as:
Assuming that
So, the weight vector is given by:
Step 5: Through normalization, the weight of the normalized non-fuzzy vector is calculated as:
2.3. FANP Method
The ANP method considers factor interdependencies and transforms qualitative judgments into quantitative values for decision analysis [59]. Fuzzy ANP captures judgment ambiguity, while visualizing and analyzing factor interdependencies. In this study the extent FANP.
The steps of the Fuzzy ANP algorithm are as follows:
- (i)
- Pairwise comparisons of the elements are performed using a scale ranging from equal importance to extreme importance, using the scale used by [60] indicated in Table 1. These measures are obtained by asking: “How important is one criterion compared to another criterion in terms of the interests or preferences of each decision-making expert who is evaluating?”
- (ii)
- The consistency of the pairwise comparison matrix is measured using the method proposed by [61], where it is established that a triangular fuzzy matrix where and the matrix . If is consistent, then is consistent.
- (iii)
- The weighted supermatrix is constructed using the results obtained in Step 2 and incorporated into the unweighted supermatrix. This Markov chain process is used to obtain global priorities in systems with interdependent influences. The local priority vectors are added to the corresponding columns of a matrix to form the supermatrix. The local priority vectors are obtained using the algorithm described in the previous step and represented in Figure 3 as a generalized supermatrix. Figure 4 shows the network indicating different types of interdependence.
- (iv)
- The blocks of the unweighted supermatrix are weighted with the corresponding cluster priorities, resulting in a stochastic column (weighted supermatrix).
- (v)
- The limit supermatrix is calculated, which resolves the interdependence effects among the system elements. The supermatrix is partitioned into matrices that represent the relationships of independence and interdependence between components and component levels. To achieve convergence of the weighted supermatrix, it is raised to the power of 2k + 1 and its limit is calculated as k tends to infinity. This allows for the convergence of interdependent relationships between clusters and feedback criteria.

Table 1.
Definition and membership function of the fuzzy number.
Table 1.
Definition and membership function of the fuzzy number.
| Importance Intensity | Fuzzy Number | Definition | Triangular Fuzzy Number | Inverse Triangular Fuzzy Numbers |
|---|---|---|---|---|
| 1 | Equally important | (1, 1, 1) | (1, 1, 1) | |
| 3 | Moderately important | (2, 3, 4) | (1/4, 1/3, 1/2) | |
| 5 | Strongly important, | (4, 5, 6) | (1/6, 1/5, 1/4) | |
| 7 | Very strongly important | (6, 7, 8) | (1/8, 1/7, 1/6) | |
| 9 | Extremely important | (8, 9, 10) | (1/8, 1/9, 1/10) | |
| 2 | Intermediate values | (1, 2, 3) | (1/3, 1/2, 1) | |
| 4 | Intermediate values | (3, 4, 5) | (1/5, 1/4, 1/3) | |
| 6 | Intermediate values | (5, 6, 7) | (1/7, 1/6, 1/5) | |
| 8 | Intermediate values | (7, 8, 9) | (1/9, 1/8, 1/9) |
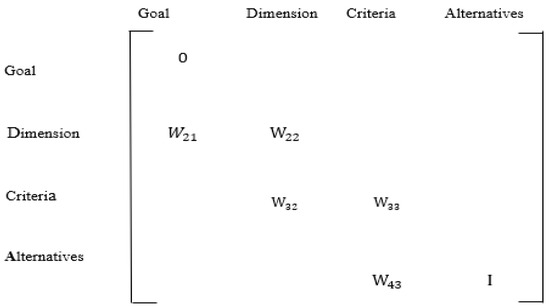
Figure 3.
Supermatrix.
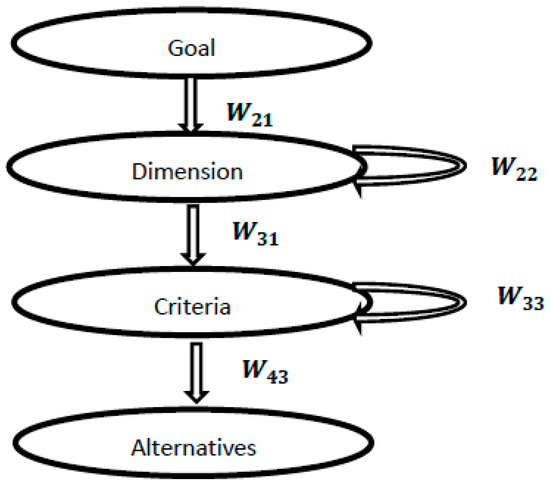
Figure 4.
Supermatrix network.
3. Proposed Methodology
The proposed methodology to support the technology selection model in the context of Industry 4.0 manufacturing consists of three generic stages: Stage 1 (Knowledge and Intervention), Stage 2 (Operability), and Stage 3 (Analysis and Evaluation). Figure 5 clearly shows these stages.
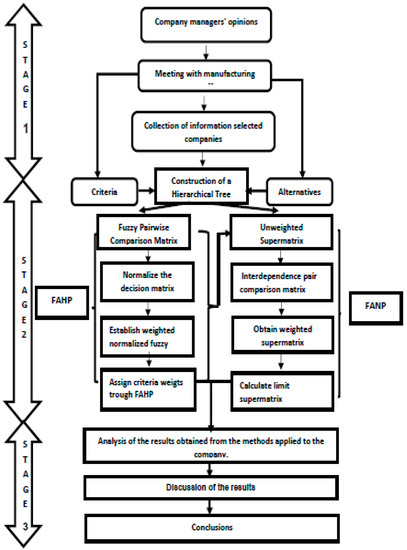
Figure 5.
Flowchart of the methodological proposal.
The methodological proposal consists of the following stages:
Stage 1: Knowledge and Intervention
Step 0: Managers’ Opinion
Obtaining the managers’ opinion is done through meetings, highlighting the importance of having a model for technology selection in the industry 4.0 manufacturing context and the economic impact they generate in companies.
Step 1: Meeting with executives and key employees from the manufacturing department, aiming to present and obtain validation for the dimensions and criteria of the proposed model, detailed in Figure 6.
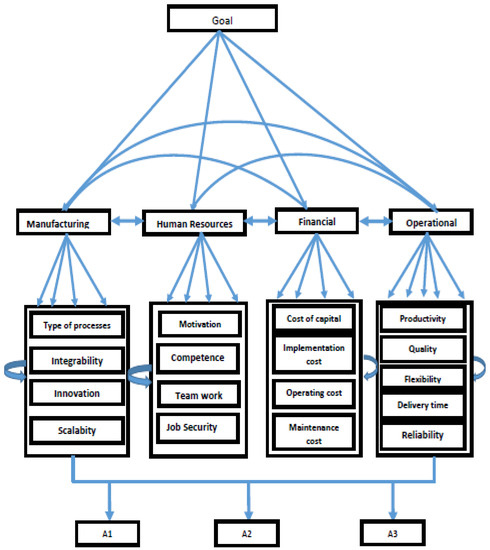
Figure 6.
Proposed FANP model.
Step 2: After the model has been thoroughly discussed and validated, the process moves on to gather company information through questionnaires. These questionnaires are designed to gather data about the criteria and dimensions, detailed in Table 2 for the proposed model. Pairwise comparison matrices are utilized, which are completed collaboratively with the participants. The Saaty scale, as illustrated in Table 1, is employed for the analysis.
Table 2.
Criteria for the four dimensions.
Stage 2: Operability
Step 3: Application of the FAHP Method following the steps described in Section 2.2.
Once the comparison matrices have been completed following the scale defined in Table 1, the process is continued to obtain the fuzzy comparison matrices. The consistency of each fuzzy matrix is evaluated. After this evaluation, the extended Chang method is applied, as detailed in Section 2.2.
Step 4: Application of the FANP Method according to the steps explained in Section 2.3.
The comparison matrices, fuzzy matrices, and consistency evaluation are carried out using the procedure described earlier in the paragraph of Step 3. Subsequently, the extended method is employed to calculate the weights of the elements present in the matrices, as depicted in the supermatrix (refer to Figure 3). Following this, the determination of the weighted matrix ensues, followed by the acquisition of the limit supermatrix.
Stage 3: Analysis and Evaluation
Step 5: Comprehensive analysis of the results obtained through the utilization of the FAHP and FANP methods.
In this step, we initially proceed to the analysis of the results derived from the application of Fuzzy AHP and Fuzzy ANP algorithms in two entities: a company in the food sector and another one that provides industrial services in the mining sector. Subsequently, we proceed to the evaluation and comparison of the data obtained using both hybrid approaches.
Step 6: Discussion of the findings to determine their possible implications and consequences.
In this step, the results obtained are analyzed in the context of both companies. In addition, the Platts criteria are used in order to carry out an evaluation of the methodology used. Additionally, an analysis of management implications arising from the methodological approach is carried out.
Step 7: Extraction of general conclusions from the application.
The conclusions of the model and the methodology proposed are inferred.
Step 8: Providing practical recommendations based on the conclusions drawn from the application.
In summary, the methodological proposal is divided into three stages: the first one focused on the socialization and validation of the model, the second one centered on its application in selected companies, and the third one on the comprehensive analysis of the results obtained for the extraction of conclusions and practical recommendations.
4. Results
The proposed approach was applied implemented in a company in the food sector and another one that provides industrial services in the mining sector. Next, we present the first case study of the company Alpha, in which it was validated using the methodological proposal described in the previous section.
4.1. Case Study: Alpha Company
The methodological proposal was validated in an international company with a presence in several countries in Latin America and Mexico. Currently, this company reaches more than 120 countries with its products in various sectors, such as food, sweets, chocolates, biscuits, ice creams, agribusiness, fishing, packaging, and cardboard.
During the knowledge and intervention phase, traditional production processes and methods were identified that generated issues such as product delivery delays, high production costs, and low productivity. The test results showed the need to modernize the production lines through the implementation of advanced technology, specifically automation through robots. For this purpose, three robot alternatives (three brands) were evaluated considering technical aspects such as size, energy consumption, maintenance, speed, and that they could be used in the existing production lines.
To carry out this process, a stage of model knowledge, validation, and methodology socialization was initiated. Group meetings were conducted at the beginning, along with individual activities involving an expert panel consisting of the General Manager, Production Manager, Shift Production Manager, Shift Production Manager B, and Quality Control Manager. This panel has an average experience of 20 years in the manufacturing industry. Due to the pandemic, all workshops were conducted online, based on the team members’ availability. However, in the final phase, in-person meetings were also held.
FAHP and FANP Results
After creating the comparison matrices of the model described in the previous section, the fuzzified matrices of the five experts were generated. The consistency of each matrix was then measured using the method proposed by [61]. Upon evaluating each matrix, it was found that the consistency ratio (CR) values were lower than the acceptable threshold value (i.e., CR < 0.1). This determination was made using a Python program developed for this purpose.
In the following, we will describe in detail how the weight vectors for the four dimensions are obtained with respect to the objective (technology selection). The analysis method provided by [57] was programmed in PythonTM, and the calculations obtained from the algorithm are:
- (i)
- The value of the fuzzy synthetic extension with respect to dimensions S1, S2, S3, S4, obtained by Equations (8)–(11) of step 1 of the algorithm described in Section 2.2.
- (ii)
- Once obtained, the values S1, S2, S3, S4 are compared to assess the degree of possibility between them, applying the comparison principles and Equation (13) from steps 2 and 3 of the algorithm explained in Section 2.2, the results found are:
- (iii)
- Calculate the grade of possibility for a convex fuzzy number to be greater than k convex
Fuzzy number, Using Equation (14) from step 4 (see Section 2.2)
- (iv)
- Calculate the weight vector and normalize the weight of the non-diffuse vector.
Immediately, we build the transposed matrix of the previously calculated values as follows:
Finally, we normalize the transpose matrix as shown in the following mathematical expression:
After normalization, the vector of importance of the dimensions for the overall goal is given by:
Based on the previously discussed calculations, the corresponding priority weights are presented in Table 3 and Table 4. Table 4 reflects the importance of different dimensions (criteria)—manufacturing (C1), human resources (C2), finance (C3), and operations (C4)—in the technology selection process at Alpha Company. On the other hand, Table 4 illustrates the relative impact of the selected criteria in manufacturing.
Table 3.
Fuzzy evaluation matrix with respect to the overall goal (technology selection).
Table 4.
Evaluation matrix of the criteria with respect to the manufacturing dimension.
To calculate the total weight of each alternative in the hierarchical model, which consists of three levels (criteria, subcriteria, and alternatives) in relation to the objective, the following ratio was used:
where:
- j = represents the number of dimension
- kj = represents the number of criteria for dimension j
- i = represents the number of alternatives.
The total weights obtained through the FAHP multicriteria method using the aforementioned relationship allowed us to establish that the values for the proposed alternatives by the manufacturing staff of Alpha Company are as follows: Alternative A1: 0.324; Alternative A2: 0.418; Alternative A3: 0.256.
Subsequently, decision makers contrast the interdependent interrelationships in the network of Figure 4. Table 5 shows the fuzzy interdependence matrices for the four dimensions, and the normalized weighting vectors are presented in the last column. Additionally, the internal dependence of the criteria in the manufacturing dimension is shown in Table 6.
Table 5.
Evaluation of the fuzzy interdependence matrices for the four dimensions.
Table 6.
The inner dependence matrix of the four criteria in the manufacturing dimension.
In Appendix A, Table A1 is presented, which is the unweighted supermatrix of Company Alpha. In it, all the appropriate eigenvectors are found to represent the interdependence between components, the interdependence between levels of components (or clusters), and the independence of the components. These eigenvectors are placed in their respective columns of the supermatrix. Once constructed, the supermatrix was transformed into a stochastic matrix using the method proposed by [72]. To achieve the convergence of the weighted supermatrix (stochastic), this matrix M was raised to the power of 2k + 1, and the limit was obtained as k tends to infinity, i.e., a large number was arbitrarily chosen for k, which allowed for the convergence of the interdependent relationships between clusters and the feedback relationships between criteria. The limit matrix converged after 12 iterations. The results of the limit supermatrix obtained using the FANP method are as follows: Alternative A1: 0.328; Alternative A2: 0.424; Alternative A3: 0.248.
4.2. Case Study: Beta Company
4.2.1. Description of the Company Beta
Beta provides mining services in transport and maintenance of machinery and industrial equipment in the medium mining sector in the third, fourth, and fifth regions of Chile, as well as offering engineering services in integral mineral projects since the 1990s, with a highly specialised team in the development of projects of high strategic value for the mining sector.
In Phase 1 of the methodology, the needs of the mining process product design department were understood. The prototype development process involves experimentation, learning, testing and, finally, product creation. This requires state-of-the-art technology that can respond quickly to the demands of mining companies. For this problem, the use of 3D printers was chosen. To select the right alternative, three 3D printers were analyzed (fusion, photopolymerization, and laser), also considering the cost of the material, processing time, and prototype finishing.
The intervention was carried out on the company’s premises and the team selected to carry out the intervention had an average experience of fifteen years in the industrial field.
4.2.2. FAHP and FANP Results
The model and the proposed methodology were applied in the Beta company after socialisation with the general manager and the team of experts. The questionnaires were applied with the comparison matrices constructed for the model (see Figure 6). Then, fuzzification was performed using the scale used by [60]. Next Ref. [57], extension method was applied. As an example, Table 7 shows the impact of the chosen criteria for human resources dimension.
Table 7.
Fuzzy matrix of comparison of the criteria in the human resource dimension.
After calculating all the fuzzy matrices, the global weight of each alternative in the three-level hierarchical model (criteria, criteria, and alternatives) is determined using Formula (10). The results of the FAHP method for the selection of 3D printers are as follows: Alternative A1: Weight of 0.411, Alternative A2: Weight of 0.323, Alternative A3: Weight of 0.258.
Once the normalized vectors were obtained using [57] extension algorithm, the matrices shown in Figure 4 were constructed applying the same procedure. W21 represents the impact of the goal (technology selection) on the dimensions (manufacturing, human resources, financial, operational), while W32 indicates the impact of the dimensions on each selected criterion for the respective dimension. Additionally, notations W22 and W33 reveal the internal dependency between dimension and criteria, respectively. Table 8 details the internal dependency of criteria in each studied dimension.
Table 8.
Matrix of internal dependency of subcriteria within each dimension.
To obtain the original unweighted supermatrix shown in Table A2 of Appendix B, all the eigenvectors of each of the interactions (dependent, interdependent, independent) present in the model (see Figure 6) were placed. Once the original supermatrix was completed, it was transformed into a stochastic matrix, where the sum of each column of the matrix is equal to 1, using the method proposed by [72]. Then, the weighted supermatrix was raised to limiting powers to achieve a steady-state outcome, and 12 iterations were performed using a program developed in Python. The results of the limit supermatrix obtained through the FANP method are as follows: Alternative A1: 0.417; Alternative A2: 0.338; Alternative A3: 0.245.
5. Discussion
5.1. Global Prioritization of Dimensions, Criteria, and Alternatives Using FAHP Method
Based on Figure 7 results in Company Alpha, the dimension with the highest weight is manufacturing, followed by human resources, financials, and operational dimensions. These results relate to technology selection’s overall objective. For Company Beta, manufacturing dimension contributes most to technology selection, as per decision makers’ preferences. Second choice is operational dimension, then financials. Human resources dimension is last.
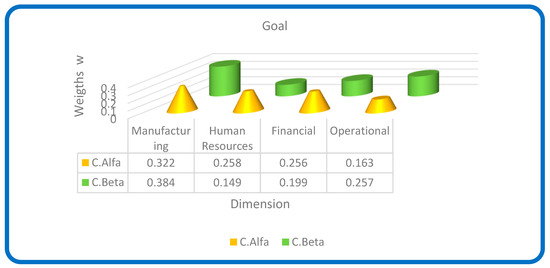
Figure 7.
Ranking of dimensions in the overall objective in Company Alpha and Beta.
Figure 8 presents criteria rankings in Company Alpha studied dimensions. Manufacturing: Types of processes are most important, followed by Integrability, Scalability, and Innovation. Human resources: Job security is top, followed by motivation, competence, and teamwork. Financial & operational: Rank order—capital cost, operating cost, maintenance cost, and implementation cost. Operational: Top criterion is productivity, then system quality, reliability, flexibility, and delivery time.
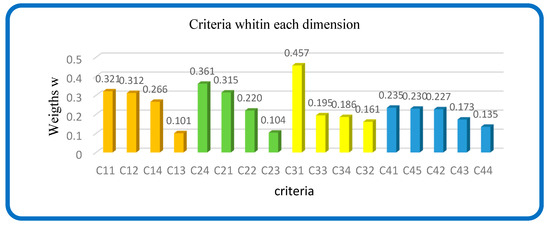
Figure 8.
Ranking of criteria in the four dimensions (Company Alpha).
In the manufacturing dimension, the process criterion was the most important, followed by innovation, integrability, and scalability. In the human resources dimension, motivation was the top preference, followed by competence, teamwork, and job security. In the financial dimension, the capital cost and implementation cost criterion had the highest ranking, followed by operating cost and maintenance cost. Lastly, in the operational dimension, reliability was the top preference, followed by productivity, quality, flexibility, and delivery time (see Figure 9).
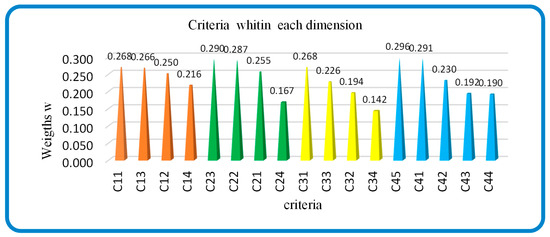
Figure 9.
Ranking of criteria in the four dimensions in Company Beta.
To identify the best option for Alpha and Beta Companies, it is crucial to consider the comprehensive weights obtained through the detailed analysis utilizing formula (17). The alternative rankings, influenced by the preferences of Alpha Company’s decision-makers, are illustrated in Figure 10. Leading the list is the favored choice, Alternative A2 (Robot-2), succeeded by Alternative A1 (Robot-1) in the second spot, and finally, Alternative A3 (Robot-3). Conversely, Company Beta’s intervention team assigned distinct rankings to the alternatives. Their prioritization positioned Alternative A1 (3D Printer-1) as the top selection, followed by Alternative A2 (3D Printer-2) in the second position. Concluding the list, Alternative A3 (3D Printer-3) was tagged as the least preferred alternative.
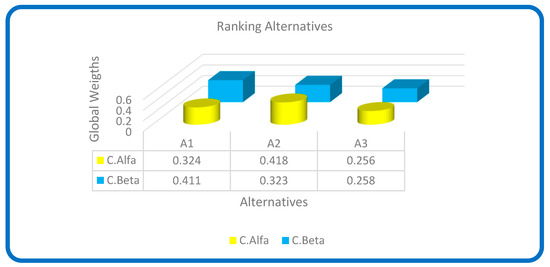
Figure 10.
Ranking of selected alternatives in Company Alpha and Beta.
5.2. Discussion of the Results Obtained through the FANP Method in Companies Alpha and Beta
A study was conducted using the FANP method for Companies Alpha and Beta. Firstly, an unweighted matrix was obtained, which was then transformed into a weighted (stochastic) matrix. Subsequently, the results obtained through the limit supermatrix were utilized for both case studies. The results are shown in Figure 11, and it was determined that the best alternative for Company Alpha is the selection of Robot Type 2, with a preference of 42.4% as determined by the expert committee of the company. On the other hand, the study indicated that the appropriate technology for Company Beta, according to the choice of the manufacturing staff, is Printer D-1, with a preference of 41.7% as determined by the experts.
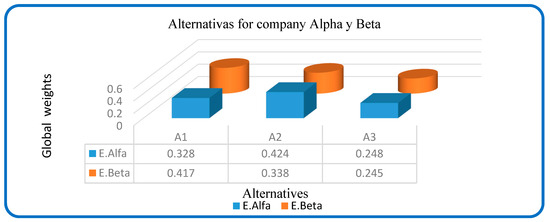
Figure 11.
Alternatives for Company Alpha and Beta.
In order to make appropriate strategic decisions, it is crucial to understand which dimension is most relevant for the companies in question. In the case of Company Alpha, it can be seen (Figure 7) that the most important dimension chosen was manufacturing. This is because the technology must meet the requirements of the type of products they want to produce, given that their business belongs to the food sector (cookies, candies, etc.). In other words, this dimension is closely related to the company’s core activity, and therefore optimizing it could have a significant impact on business outcomes.
Regarding the available alternatives, it can be identified that the most relevant option was Robot 2 (see Figure 10 and Figure 11) as it allows for adaptation to different product configurations, reducing costs, improving delivery times, and increasing productivity. This, in turn, enhances customer service. This is an important consideration from a management perspective, as the success of any company largely depends on its ability to meet the needs of its customers. Therefore, a decision that improves the quality of customer service could have a positive impact on the company’s reputation, as well as customer loyalty and retention.
After repeating the previous analysis in the case of Company Beta. it can be inferred that the most important and fundamental dimension is manufacturing, as can be observed in Figure 7. This is because the company is dedicated to designing and creating specific products for plant mining processes, infrastructure, and the mine, which helps reduce process costs, energy consumption, and increases efficiency and pressure in these areas. It is worth mentioning that this dimension is closely related to the projects developed by the company in the mining sector. In this regard, the decision has been made to choose Alternative 1 (see Figure 10 and Figure 11), which corresponds to a 3D printer-1 that meets the finishing requirements for this type of prototype.
In this sense, the adoption of innovative technologies such as 3D printers is becoming increasingly important to enhance efficiency and productivity in design and manufacturing processes. Thanks to these advanced tools, Company Beta will be able to design and manufacture prototypes more quickly, enabling them to adapt to changing market needs and maintain their competitive advantage in the sector.
5.3. Evaluation
This work used the case study research methodology, because we were interested in the complete process, implementing the proposed methodology. It was necessary to implement it in the field, so the participation of managers was crucial. The companies were selected considering that the implementation process was representative. Yin [73] states that case study research is appropriate when it is necessary to test a well-developed theory. In this case, there is not a statistical, but a conceptual evaluation. For this reason, managers were consulted regarding their opinion on the implementation of the proposed method in the company. The following three questions were made [74]:
- (i)
- Was the methodology understood?
The methodology proposed in this research was examined according to the feasibility, usability, and utility tests established by [42]. According to these authors, feasibility indicates whether the process is easy to understand. Usability indicates whether the process is easy to use for the users. Utility refers to the process’s ability to achieve the established objectives.
- (ii)
- Was it easy or difficult to execute?
The second criterion (the usability test) comprised the majority of the case study work. The aim was to test the process of this methodology as initially conceived and refine it through application. According to the managers’ opinion from both companies, the execution of the methodology was easy. Perhaps the only drawback was that not all the results obtained in the pairwise comparison matrices during the initial meeting with the selected manufacturing staff members were consistent (CR < 10%), which extended the time. Additionally, another intrinsic factor that influenced the time was rescheduling some meetings with staff members due to shift changes or fieldwork.
- (iii)
- Was it useful in their work? Why?
After completing the process in each company, the usefulness of the proposed methodology was evaluated. According to the managers, the methodology allowed them to identify the most important variables in the manufacturing dimension, understand the cost structure in the financial aspect, determine key aspects in human resources, and comprehend the factors influencing the operational part of the company. The tools used in the methodology facilitated the resolution of complex and unstructured problems and provided them with guidance to select the most appropriate technology in the context of Industry 4.0 manufacturing. Overall, the managers considered the methodology to be very useful in their work.
5.4. Managerial Implications
In recent decades, multicriteria methods have undergone significant evolution and application in decision-making processes. These methods are capable of addressing highly complex problems characterized by dynamics, uncertainty, multiple scenarios, conflicting criteria and stakeholders, and the need to incorporate the opinions of different participants in problem resolution.
In general, all MCDM (multicriteria decision making) methods have the advantage of considering disproportionate and conflicting impacts of decisions [75]. In this regard, the proposed method utilizes the framework of multicriteria methods [76].
The proposed hybrid method, composed of FAHP and FANP, enables managers to more accurately evaluate technology options available in the market within the context of Industry 4.0. On the one hand, FAHP provides a structured and systematic evaluation of multiple criteria, while FANP allows for assessing interactions and dependencies among the chosen criteria.
This method also helps managers to reduce uncertainty and subjectivity in the technology selection decision-making process by using logic in both methods and incorporating both quantitative and qualitative factors of the proposed model. By employing a hybrid technology selection method, managers can achieve greater transparency and objectivity in the decision-making process. The obtained results can be evaluated and discussed in-depth, aiding in reaching a consensus and objective decision. Furthermore, the method allows managers to generate manufacturing action plans for the selected technologies.
The use of workshops is also important as it allows all participants to have the opportunity to communicate and highlight their viewpoints on the discussed topics. At the same time, they have the chance to listen to and understand the perspectives of participants from different organizational levels.
An important feature of the proposed method is that it can be applied to select technology in different manufacturing areas, as demonstrated in the selection of robots in a food company and a 3D company in the mining sector.
In summary, the use of a hybrid method can provide several positive managerial implications when selecting technology in the context of Industry 4.0 manufacturing. These implications include more precise evaluation, reduction of uncertainty, increased transparency, and objectivity in the decision-making process for managers. The managerial implications of implementing these technologies can be diverse and can have a significant impact on a company’s management, efficiency, profitability, and operations, making this strategy an option to consider for those seeking to improve their performance in the market.
6. Conclusions
This study represents a valuable addition to current research as it proposes a hybrid methodological approach that integrates FAHP and FANP for technology selection in the 4.0 manufacturing industry in Chile. This methodology focuses on improving the limitations identified in the existing literature by considering four key strategic factors: human resources, manufacturing, financial, and operational. In this way, a more comprehensive and effective selection of technologies is achieved, contributing to improve the efficiency and competitiveness of the Chilean industry in the current context of the fourth industrial revolution.
The proposed method was implemented in one company in the food sector and another one that provides industrial services in the mining sector. The method was applied through both online and in-person workshops involving the General Manager, Production Manager, Production Supervisor (Shift A), Production Supervisor (Shift B), and Quality Control Manager in the food sector company. In the mining sector company, the participants included the General Manager, Project Manager, Operations Supervisor, Process Engineer, and Project Engineer. One of the authors of this work acted as the facilitator. It was determined that this working modality was effective as it enabled enriching discussions among individuals with different responsibilities within the organization.
The question of the validity of the proposed method is raised. In this regard, (Platts, 1998) is cited, who states that it is difficult to prove a process and emphasize that “the proof is of the process, not the outcome. Therefore, they suggested asking the participants the following questions about the method: Was it easy to understand? (Feasibility), was it easy to apply? (Usability), and was the outcome appropriate? (Utility). All participants agreed that the proposed methodology met these three criteria, indicating that it is a good tool for technology selection. Moreover, the method could potentially be applied to any industrial sector.
The validation of the proposed model was carried out through the application of the methodology in the intervened companies, referred to as Alpha and Beta. After analyzing the obtained results, the following conclusions can be established:
- The methodological proposal was validated as an effective tool in the case study, as it allowed decision makers to select the appropriate technology for the studied companies.
- The proposed method is a suitable approach to address decision-making problems involving multiple criteria with a high degree of conflict, as technology selection is a multidimensional problem.
- This method takes into account the intensity of preferences and provides experts with the ability to evaluate alternatives under uncertainty by expressing their judgments using linguistic variables that are transformed into fuzzy numbers and expressed in a membership function.
- The multicriteria methods FAHP and FANP are capable of capturing the inherent ambiguity in human reasoning and addressing the problem in a way that preserves the principle of relevance, meaning each variable is valued with the required level of precision.
- The ranking obtained by applying the multicriteria method (FAHP) shows that the experts from both companies (Alpha, Beta) selected the manufacturing dimension as the most important for technology selection, with 32.2% and 38.4%, respectively. However, the other dimensions (human resources, financial, and operational) show an inverse relationship in the experts’ choices.
The specialists from each company (Alpha and Beta) determined the overall weights of the chosen alternatives using the FAHP algorithm. For Alpha company, Alternative 2 (Robot-2) obtained an overall weight of 41.8%. On the other hand, Alternative 1 (3D Printer-1) from Beta company obtained an overall weight of 41.1%.
- The application of the FANP multicriteria method resulted in the selection of the following alternatives by the experts from the intervened companies for technology selection: Alternative A2 (42.8%—Robot-2) in the case of Alpha company and Alternative A1 (41.7%—3D Printer-1) in the case of Beta company.
- The results obtained through the multicriteria methods (FAHP, FANP) indicate that the group of experts from the company involved in the process selected the same technology, namely Robot-2 and 3D Printer-1.
7. Future Research
In light of the research, several guidelines for future investigations are proposed:
- Expand the study by using other forms of fuzzy numbers (trapezoidal, Gaussian, etc.) along with different types of membership functions.
- Apply graph theory to handle incomplete pairwise comparison matrices, which represent situations where experts are not completely certain about one or more factors and may prefer not to express any preference.
- Analyze the strategic factor of technology in the competitiveness of companies in the context of Industry 4.0 manufacturing.
- Apply probability theory as support when an expert or groups of decision makers have doubts in assigning crisp values to their judgments. Instead, probabilistic values could be provided, and in this case, pairwise comparison matrices would be treated as random reciprocal matrices with one or more random entries, which would be positive random variables capturing the expert’s uncertainty.
- Develop a decision support model that integrates all multicriteria techniques through software.
Author Contributions
Methodology, L.Q.; Software, C.S.; Investigation, C.A.; Writing—review & editing, C.A. All authors have read and agreed to the published version of the manuscript.
Funding
This paper was supported by the Department of Industrial Engineering of Universidad de Santiago de Chile.
Data Availability Statement
All data generated or analyzed during this study are included in this manuscript.
Conflicts of Interest
The authors declare no conflict of interest.
Appendix A
Table A1.
Unweigthed supermatrix for company Alpha.
Table A1.
Unweigthed supermatrix for company Alpha.
| O.G | D1 | D2 | D3 | D4 | C11 | C12 | C13 | C14 | C21 | C22 | C23 | C24 | C31 | C32 | C33 | C34 | C41 | C42 | C43 | C44 | C45 | A1 | A2 | A3 | |
|---|---|---|---|---|---|---|---|---|---|---|---|---|---|---|---|---|---|---|---|---|---|---|---|---|---|
| O.G | 0 | ||||||||||||||||||||||||
| D1 | 0.322 | 0 | 0.243 | 0.695 | 0.337 | ||||||||||||||||||||
| D2 | 0.258 | 0.494 | 0 | 0.139 | 0.438 | ||||||||||||||||||||
| D3 | 0.163 | 0.140 | 0.547 | 0 | 0.225 | ||||||||||||||||||||
| D4 | 0.256 | 0.366 | 0.209 | 0.165 | 0 | ||||||||||||||||||||
| C11 | 0 | 0.321 | 0 | 0.332 | 0.359 | 0.336 | |||||||||||||||||||
| C12 | 0 | 0.312 | 0.154 | 0 | 0.412 | 0.312 | |||||||||||||||||||
| C13 | 0 | 0.101 | 0.237 | 0.496 | 0 | 0.352 | |||||||||||||||||||
| C14 | 0 | 0.266 | 0.609 | 0.172 | 0.228 | 0 | |||||||||||||||||||
| C21 | 0.315 | 0 | 0.725 | 0.465 | 0.138 | ||||||||||||||||||||
| C22 | 0.220 | 0.277 | 0 | 0.233 | 0.647 | ||||||||||||||||||||
| C23 | 0.104 | 0.416 | 0.129 | 0 | 0.214 | ||||||||||||||||||||
| C24 | 0.361 | 0.307 | 0.146 | 0.302 | 0 | ||||||||||||||||||||
| C31 | 0 | 0.457 | 0 | 0.244 | 0.446 | 0.189 | |||||||||||||||||||
| C32 | 0 | 0.161 | 0.358 | 0 | 0.421 | 0.45 | |||||||||||||||||||
| C33 | 0 | 0.186 | 0.389 | 0.199 | 0 | 0.361 | |||||||||||||||||||
| C34 | 0 | 0.195 | 0.253 | 0.557 | 0.133 | 0 | |||||||||||||||||||
| C41 | 0.235 | 0 | 0.268 | 0.346 | 0.235 | 0.160 | |||||||||||||||||||
| C42 | 0.227 | 0.289 | 0 | 0.259 | 0.329 | 0.367 | |||||||||||||||||||
| C43 | 0.173 | 0.306 | 0.179 | 0 | 0.137 | 0.171 | |||||||||||||||||||
| C44 | 0.135 | 0.257 | 0.194 | 0.161 | 0 | 0.301 | |||||||||||||||||||
| C45 | 0.230 | 0.149 | 0.358 | 0.235 | 0.298 | 0 | |||||||||||||||||||
| A1 | 0 | 0.278 | 0.294 | 0.29 | 0.443 | 0.381 | 0.322 | 0.389 | 0.275 | 0.321 | 0.310 | 0.300 | 0.292 | 0.407 | 0.353 | 0.344 | 0.303 | 0.250 | 1 | 0 | 0 | ||||
| A2 | 0 | 0.406 | 0.355 | 0.377 | 0.451 | 0.456 | 0.499 | 0.464 | 0.367 | 0.424 | 0.432 | 0.386 | 0.443 | 0.411 | 0.393 | 0.427 | 0.483 | 0.476 | 0 | 1 | 0 | ||||
| A3 | 0 | 0.317 | 0.351 | 0.333 | 0.105 | 0.162 | 0.178 | 0.147 | 0.358 | 0.255 | 0.257 | 0.314 | 0.265 | 0.182 | 0.254 | 0.229 | 0.214 | 0.274 | 0 | 0 | 1 |
Appendix B
Table A2.
Unweigthed supermatrix for company Beta.
Table A2.
Unweigthed supermatrix for company Beta.
| O.G | C1 | C2 | C3 | C4 | C11 | C12 | C13 | C14 | C21 | C22 | C23 | C24 | C31 | C32 | C33 | C34 | C41 | C42 | C43 | C44 | C45 | A1 | A2 | A3 | |
|---|---|---|---|---|---|---|---|---|---|---|---|---|---|---|---|---|---|---|---|---|---|---|---|---|---|
| O.G | 0 | ||||||||||||||||||||||||
| C1 | 0.384 | 0 | 0.248 | 0.205 | 0.187 | ||||||||||||||||||||
| C2 | 0.149 | 0.276 | 0 | 0.170 | 0.192 | ||||||||||||||||||||
| C3 | 0.199 | 0.106 | 0.122 | 0 | 0.121 | ||||||||||||||||||||
| C4 | 0.267 | 0.118 | 0.130 | 0.124 | 0 | ||||||||||||||||||||
| C11 | 0.134 | 0 | 0.222 | 0.172 | 0.157 | ||||||||||||||||||||
| C12 | 0.125 | 0.180 | 0 | 0.176 | 0.228 | ||||||||||||||||||||
| C13 | 0.133 | 0.163 | 0.172 | 0 | 0.115 | ||||||||||||||||||||
| C14 | 0.108 | 0.157 | 0.107 | 0.151 | 0 | ||||||||||||||||||||
| C21 | 0.157 | 0 | 0.258 | 0.151 | 0.314 | ||||||||||||||||||||
| C22 | 0.110 | 0.167 | 0 | 0.216 | 0.110 | ||||||||||||||||||||
| C23 | 0.052 | 0.278 | 0.172 | 0 | 0.076 | ||||||||||||||||||||
| C24 | 0.181 | 0.054 | 0.070 | 0.133 | 0 | ||||||||||||||||||||
| C31 | 0.161 | 0 | 0.110 | 0.266 | 0.150 | ||||||||||||||||||||
| C32 | 0.136 | 0.200 | 0 | 0.180 | 0.204 | ||||||||||||||||||||
| C33 | 0.117 | 0.220 | 0.167 | 0 | 0.146 | ||||||||||||||||||||
| C34 | 0.086 | 0.080 | 0.223 | 0.054 | 0 | ||||||||||||||||||||
| C41 | 0 | 0.137 | 0.116 | 0.129 | 0.177 | ||||||||||||||||||||
| C42 | 0.111 | 0.140 | 0 | 0.198 | 0.127 | 0.159 | |||||||||||||||||||
| C43 | 0.097 | 0.184 | 0.135 | 0 | 0.086 | 0.093 | |||||||||||||||||||
| C44 | 0.054 | 0.111 | 0.088 | 0.115 | 0 | 0.071 | |||||||||||||||||||
| C45 | 0.074 | 0.065 | 0.140 | 0.070 | 0.158 | 0 | |||||||||||||||||||
| A1 | 0.219 | 0.222 | 0.207 | 0.222 | 0.173 | 0.225 | 0.301 | 0.170 | 0.189 | 0.176 | 0.177 | 0.261 | 0.184 | 0.207 | 0.212 | 0.223 | 0.196 | 1 | 0 | 0 | |||||
| A2 | 0.119 | 0.173 | 0.203 | 0.203 | 0.195 | 0.219 | 0.100 | 0.165 | 0.160 | 0.158 | 0.173 | 0.085 | 0.160 | 0.188 | 0.204 | 0.143 | 0.171 | 0 | 1 | 0 | |||||
| A3 | 0.162 | 0.105 | 0.089 | 0.075 | 0.133 | 0.056 | 0.099 | 0.165 | 0.151 | 0.167 | 0.150 | 0.154 | 0.156 | 0.105 | 0.084 | 0.134 | 0.123 | 0 | 0 | 1 |
References
- PWC. Will Robots Really Steal Our Jobs? An International Analysis of the Potential Long Term Impact of Automation; PricewaterhouseCoopers LLP: London, UK, 2018; pp. 1–43. [Google Scholar]
- Szalavetz, A. Industry 4.0 and Capability Development in Manufacturing Subsidiaries. Technol. Forecast. Soc. Chang. 2019, 145, 384–395. [Google Scholar] [CrossRef]
- Dalenogare, L.S.; Benitez, G.B.; Ayala, N.F.; Frank, A.G. The Expected Contribution of Industry 4.0 Technologies for Industrial Performance. Int. J. Prod. Econ. 2018, 204, 383–394. [Google Scholar] [CrossRef]
- Frank, A.G.; Dalenogare, L.S.; Ayala, N.F. Industry 4.0 Technologies: Implementation Patterns in Manufacturing Companies. Int. J. Prod. Econ. 2019, 210, 15–26. [Google Scholar] [CrossRef]
- Stornelli, A.; Ozcan, S.; Simms, C. Advanced Manufacturing Technology Adoption and Innovation: A Systematic Literature Review on Barriers, Enablers, and Innovation Types. Res. Policy 2021, 50, 104229. [Google Scholar] [CrossRef]
- Tao, F.; Cheng, Y.; Zhang, L.; Nee, A.Y.C. Advanced Manufacturing Systems: Socialization Characteristics and Trends. J. Intell. Manuf. 2017, 28, 1079–1094. [Google Scholar] [CrossRef]
- Teece, D.J.; Linden, G. Business Models, Value Capture, and the Digital Enterprise. J. Organ. Des. 2017, 6, 8. [Google Scholar] [CrossRef]
- Szalavetz, A. The Digitalisation of Manufacturing and Blurring Industry Boundaries. CIRP J. Manuf. Sci. Technol. 2022, 37, 332–343. [Google Scholar] [CrossRef]
- Chiarello, F.; Trivelli, L.; Bonaccorsi, A.; Fantoni, G. Extracting and Mapping Industry 4.0 Technologies Using Wikipedia. Comput. Ind. 2018, 100, 244–257. [Google Scholar] [CrossRef]
- Paschou, T.; Rapaccini, M.; Adrodegari, F.; Saccani, N. Digital Servitization in Manufacturing: A Systematic Literature Review and Research Agenda. Ind. Mark. Manag. 2020, 89, 278–292. [Google Scholar] [CrossRef]
- Szalavetz, A. The Environmental Impact of Advanced Manufacturing Technologies: Examples from Hungary. Cent. Eur. Bus. Rev. 2017, 6, 18–29. [Google Scholar] [CrossRef]
- Müller, J.M.; Kiel, D.; Voigt, K.I. What Drives the Implementation of Industry 4.0? The Role of Opportunities and Challenges in the Context of Sustainability. Sustainability 2018, 10, 247. [Google Scholar] [CrossRef]
- Stock, T.; Seliger, G. Opportunities of Sustainable Manufacturing in Industry 4.0. Procedia CIRP 2016, 40, 536–541. [Google Scholar] [CrossRef]
- Ng, T.C.; Lau, S.Y.; Ghobakhloo, M.; Fathi, M.; Liang, M.S. The Application of Industry 4.0 Technological Constituents for Sustainable Manufacturing: A Content-Centric Review. Sustainability 2022, 14, 4327. [Google Scholar] [CrossRef]
- Hasselblatt, M.; Huikkola, T.; Kohtamäki, M.; Nickell, D. Modeling Manufacturer’s Capabilities for the Internet of Things. J. Bus. Ind. Mark. 2018, 33, 822–836. [Google Scholar] [CrossRef]
- Jamwal, A.; Agrawal, R.; Sharma, M.; Giallanza, A. Industry 4.0 Technologies for Manufacturing Sustainability: A Systematic Review and Future Research Directions. Appl. Sci. 2021, 11, 5725. [Google Scholar] [CrossRef]
- Ghobakhloo, M. The Future of Manufacturing Industry: A Strategic Roadmap toward Industry 4.0. J. Manuf. Technol. Manag. 2018, 29, 910–936. [Google Scholar] [CrossRef]
- Oztemel, E.; Gursev, S. Literature Review of Industry 4.0 and Related Technologies. J. Intell. Manuf. 2020, 31, 127–182. [Google Scholar] [CrossRef]
- Liao, Y.; Deschamps, F.; Loures, E.d.F.R.; Ramos, L.F.P. Past, Present and Future of Industry 4.0—A Systematic Literature Review and Research Agenda Proposal. Int. J. Prod. Res. 2017, 55, 3609–3629. [Google Scholar] [CrossRef]
- Basílio, M.P.; Pereira, V.; Costa, H.G.; Santos, M.; Ghosh, A. A Systematic Review of the Applications of Multi-Criteria Decision Aid Methods (1977–2022). Electronics 2022, 11, 1720. [Google Scholar] [CrossRef]
- Tozan, H. Fuzzy Ahp Based Decision Support System for Technology Selection in Abrasive Water Jet Cutting Processes. Teh. Vjesn. 2011, 2, 187–191. [Google Scholar]
- Shen, Y.C.; Lin, G.T.R.; Tzeng, G.H. Combined DEMATEL Techniques with Novel MCDM for the Organic Light Emitting Diode Technology Selection. Expert Syst. Appl. 2011, 38, 1468–1481. [Google Scholar] [CrossRef]
- Kuei, C.H.; Lin, C.; Aheto, J.; Madu, C.N. A Strategic Decision Model for the Selection of Advanced Technology. Int. J. Prod. Res. 1994, 32, 2117–2130. [Google Scholar] [CrossRef]
- Kirby, M.R.; Mavris, D.N. A Method for Technology Selection Based on Benefit, Available Schedule and Budget Resources. In Proceedings of the 2000 World Aviation Conference, San Diego, CA, USA, 10–12 October 2000. [Google Scholar] [CrossRef]
- Paramasivam, V.; Senthil, V.; Rajam Ramasamy, N. Decision Making in Equipment Selection: An Integrated Approach with Digraph and Matrix Approach, AHP and ANP. Int. J. Adv. Manuf. Technol. 2011, 54, 1233–1244. [Google Scholar] [CrossRef]
- Kagermann, H.; Wahlster, W.; Helbig, J. Recommendations for Implementing the Strategic Initiative INDUSTRIE 4.0—Securing the Future of German Manufacturing Industry; Forschungsunion: Berlin, Germany, 2013. [Google Scholar]
- Akhundzadeh, M.; Shirazi, B. Technology Selection and Evaluation in Iran’s Pulp and Paper Industry Using 2-Filterd Fuzzy Decision Making Method. J. Clean. Prod. 2017, 142, 3028–3043. [Google Scholar] [CrossRef]
- Nath, S.; Sarkar, B. An Exploratory Analysis for the Selection and Implementation of Advanced Manufacturing Technology by Fuzzy Multi-Criteria Decision Making Methods: A Comparative Study. J. Inst. Eng. Ser. C 2017, 98, 493–506. [Google Scholar] [CrossRef]
- Pun, K.P.; Tsang, Y.P.; Choy, K.L.; Tang, V.; Lam, H.Y. A Fuzzy-AHP-Based Decision Support System for Maintenance Strategy Selection in Facility Management. In Proceedings of the 2017 Portland International Conference on Management of Engineering and Technology (PICMET), Portland, OR, USA, 9–13 July 2017; pp. 1–7. [Google Scholar] [CrossRef]
- Dodevska, Z.A.; Vujosevic, M. Multi-Criteria Decision-Making for Robot Selection Based on Cross-Entropy. In Proceedings of the XLVI Symposium on Operational Research SYM-OP-IS, Kladovo, Serbia, 15–18 September 2019. [Google Scholar]
- Fu, Y.; Li, M.; Luo, H.; Huang, G.Q. Industrial Robot Selection Using Stochastic Multicriteria Acceptability Analysis for Group Decision Making. Rob. Auton. Syst. 2019, 122, 103304. [Google Scholar] [CrossRef]
- Medić, N.; Anišić, Z.; Lalić, B.; Marjanović, U.; Brezocnik, M. Hybrid Fuzzy Multi-Attribute Decision Making Model for Evaluation of Advanced Digital Technologies in Manufacturing: Industry 4.0 Perspective. Adv. Prod. Eng. Manag. 2019, 14, 483–493. [Google Scholar] [CrossRef]
- Galankashi, M.R.; Rafiei, F.M.; Ghezelbash, M. Portfolio Selection: A Fuzzy-ANP Approach. Financ. Innov. 2020, 6, 17. [Google Scholar] [CrossRef]
- Zhang, H.; Wu, Y.; Wang, K.; Peng, Y.; Wang, D.; Yao, S.; Wang, J. Materials Selection of 3D-Printed Continuous Carbon Fiber Reinforced Composites Considering Multiple Criteria. Mater. Des. 2020, 196, 109140. [Google Scholar] [CrossRef]
- Chang, C.W. Evaluation of Smart Alarm Systems for Industry 4.0 Technologies. Appl. Sci. 2020, 10, 2022. [Google Scholar] [CrossRef]
- Cifone, F.D.; Hoberg, K.; Holweg, M.; Staudacher, A.P. ‘Lean 4.0’: How Can Digital Technologies Support Lean Practices? Int. J. Prod. Econ. 2021, 241, 108258. [Google Scholar] [CrossRef]
- Abdullah, F.M.; Al-Ahmari, A.M.; Anwar, S. A Hybrid Fuzzy Multi-Criteria Decision-Making Model for Manufacturing Strategies. Machines 2023, 11, 310. [Google Scholar] [CrossRef]
- Shanmugasundar, G.; Kalita, K.; Čep, R.; Chohan, J.S. Decision Models for Selection of Industrial Robots—A Comprehensive Comparison of Multi-Criteria Decision Making. Processes 2023, 11, 1681. [Google Scholar] [CrossRef]
- Meier, M.; Tan, K.H.; Lim, M.K.; Chung, L. Unlocking Innovation in the Sport Industry through Additive Manufacturing. Bus. Process Manag. J. 2019, 25, 456–475. [Google Scholar] [CrossRef]
- Niaki, M.K.; Torabi, S.A.; Nonino, F. Why Manufacturers Adopt Additive Manufacturing Technologies: The Role of Sustainability. J. Clean. Prod. 2019, 222, 381–392. [Google Scholar] [CrossRef]
- Müller, J.M.; Buliga, O.; Voigt, K.I. Fortune Favors the Prepared: How SMEs Approach Business Model Innovations in Industry 4.0. Technol. Forecast. Soc. Chang. 2018, 132, 2–17. [Google Scholar] [CrossRef]
- Sony, M.; Naik, S. Critical Factors for the Successful Implementation of Industry 4.0: A Review and Future Research Direction. Prod. Plan. Control 2020, 31, 799–815. [Google Scholar] [CrossRef]
- Avis, J. Socio-Technical Imaginary of the Fourth Industrial Revolution and Its Implications for Vocational Education and Training: A Literature Review. J. Vocat. Educ. Train. 2018, 70, 337–363. [Google Scholar] [CrossRef]
- Correani, A.; De Massis, A.; Frattini, F.; Petruzzelli, A.M.; Natalicchio, A. Implementing a Digital Strategy: Learning from the Experience of Three Digital Transformation Projects. Calif. Manag. Rev. 2020, 62, 37–56. [Google Scholar] [CrossRef]
- Davenport, T.H. From Analytics to Artificial Intelligence. J. Bus. Anal. 2018, 1, 73–80. [Google Scholar] [CrossRef]
- Chen, L.; Pan, W. Review Fuzzy Multi-Criteria Decision-Making in Construction Management Using a Network Approach. Appl. Soft Comput. 2021, 102, 107103. [Google Scholar] [CrossRef]
- Liu, Y.; Eckert, C.M.; Earl, C. A Review of Fuzzy AHP Methods for Decision-Making with Subjective Judgements. Expert Syst. Appl. 2020, 161, 113738. [Google Scholar] [CrossRef]
- Hamzeh, R.; Xu, X. Technology Selection Methods and Applications in Manufacturing: A Review from 1990 to 2017. Comput. Ind. Eng. 2019, 138, 106123. [Google Scholar] [CrossRef]
- Chu, J.; Wu, J.; Chu, C.; Liu, M. A New DEA Common-Weight Multi-Criteria Decision-Making Approach for Technology Selection. Int. J. Prod. Res. 2020, 58, 3686–3700. [Google Scholar] [CrossRef]
- Lin, T.X.; Wu, Z.H.; Yang, J.J. The Evaluation of Innovation Efficiency of China’s High-Tech Manufacturing Industry Based on the Analysis of the Three-Stage Network DEA-Malmquist Model. Prod. Plan. Control 2023, 1–13. [Google Scholar] [CrossRef]
- Chen, Y.; Song, J.H. The Technological Innovation Efficiency of China’s Renewable Energy Enterprises: An Estimation Based on a Three-Stage DEA Model. Sustainability 2023, 15, 6342. [Google Scholar] [CrossRef]
- Richard, S.; Pellerin, R.; Bellemare, J.; Perrier, N. A Business Process and Portfolio Management Approach for Industry 4.0 Transformation. Bus. Process Manag. J. 2021, 27, 505–528. [Google Scholar] [CrossRef]
- Pongboonchai-Empl, T.; Antony, J.; Garza-Reyes, J.A.; Komkowski, T.; Tortorella, G.L. Integration of Industry 4.0 Technologies into Lean Six Sigma DMAIC: A Systematic Review. Prod. Plan. Control 2023, 1–26. [Google Scholar] [CrossRef]
- Kudratova, S.; Huang, X.; Zhou, X. Sustainable Project Selection: Optimal Project Selection Considering Sustainability under Reinvestment Strategy. J. Clean. Prod. 2018, 203, 469–481. [Google Scholar] [CrossRef]
- Tavana, M.; Khosrojerdi, G.; Mina, H.; Rahman, A. A New Dynamic Two-Stage Mathematical Programming Model under Uncertainty for Project Evaluation and Selection. Comput. Ind. Eng. 2020, 149, 106795. [Google Scholar] [CrossRef]
- Kafuku, J.M.; Saman, M.Z.M.; Yusof, S.M. Application of Fuzzy Logic in Selection of Remanufacturing Technology. Procedia Manuf. 2019, 33, 192–199. [Google Scholar] [CrossRef]
- Chang, D.Y. Applications of the Extent Analysis Method on Fuzzy AHP. Eur. J. Oper. Res. 1996, 95, 649–655. [Google Scholar] [CrossRef]
- Lee, A.H.I.; Kang, H.Y.; Hsu, C.F.; Hung, H.C. A Green Supplier Selection Model for High-Tech Industry. Expert Syst. Appl. 2009, 36, 7917–7927. [Google Scholar] [CrossRef]
- Saaty, T. A Scaling Method for Priorities in Hierarchical Structures. J. Math. Psychol. 1997, 15, 234–281. [Google Scholar] [CrossRef]
- Huang, J.J.; Tzeng, G.H.; Ong, C.S. Multidimensional Data in Multidimensional Scaling Using the Analytic Network Process. Pattern Recognit. Lett. 2005, 26, 755–767. [Google Scholar] [CrossRef]
- Lin, H.F. An Application of Fuzzy AHP for Evaluating Course Website Quality. Comput. Educ. 2010, 54, 877–888. [Google Scholar] [CrossRef]
- Bortolini, M.; Galizia, F.G.; Mora, C. Reconfigurable Manufacturing Systems: Literature Review and Research Trend. J. Manuf. Syst. 2018, 49, 93–106. [Google Scholar] [CrossRef]
- Dahmani, A.; Benyoucef, L.; Mercantini, J.-M. Toward Sustainable Reconfigurable Manufacturing Systems (SRMS): Past, Present, and Future. Procedia Comput. Sci. 2022, 200, 1605–1614. [Google Scholar] [CrossRef]
- Anand, G.; Kodali, R. Selection of Lean Manufacturing Systems Using the Analytic Network Process—A Case Study. J. Manuf. Technol. Manag. 2009, 20, 258–289. [Google Scholar] [CrossRef]
- Chan, F.T.S.; Chan, H.K.; Chan, M.H.; Humphreys, P.K. An Integrated Fuzzy Approach for the Selection of Manufacturing Technologies. Int. J. Adv. Manuf. Technol. 2006, 27, 747–758. [Google Scholar] [CrossRef]
- Dalalah, D.; Bataineh, O. A Fuzzy Logic Approach to the Selection of the Best Silicon Crystal Slicing Technology. Expert Syst. Appl. 2009, 36, 3712–3719. [Google Scholar] [CrossRef]
- Anand, G.; Kodali, R. Selection of Lean Manufacturing Systems Using the PROMETHEE. J. Model. Manag. 2008, 3, 40–70. [Google Scholar] [CrossRef]
- Shehabuddeen, N.; Probert, D.; Phaal, R. From Theory to Practice: Challenges in Operationalising a Technology Selection Framework. Technovation 2006, 26, 324–335. [Google Scholar] [CrossRef]
- Bayazit, O. Use of AHP in Decision-making for Flexible Manufacturing Systems. J. Manuf. Technol. Manag. 2005, 16, 808–819. [Google Scholar] [CrossRef]
- Yurdakul, M. Measuring a Manufacturing System’s Performance Using Saaty’s System with Feedback Approach. Integr. Manuf. Syst. 2002, 13, 25–34. [Google Scholar] [CrossRef]
- Ordoobadi, S.M. Application of AHP and Taguchi Loss Functions in Evaluation of Advanced Manufacturing Technologies. Int. J. Adv. Manuf. Technol. 2013, 67, 2593–2605. [Google Scholar] [CrossRef]
- Aznar Bellver, J.; Guijarro Martínez, F. Nuevos Métodos de Valoración. Modelos Multicriterio, 2nd ed.; de València, U.P., Ed.; Universitat Politècnica de València: València, Spain, 2012; ISBN 978-5-84-8363-982-5. [Google Scholar]
- Yin, R.K. Case Study Research Design and Methods; Sage: Thousand Oaks, CA, USA, 2014; ISBN 978-1-4522-4256-9. [Google Scholar]
- Platts, K.W.; Mills, J.F.; Richards, A.H.; Bourne, M.C.S.; Neely, A.D. Researching Strategic Management Processes. In Proceedings of the Twelfth Annual Conference of the Production and Operations Management Society, Orlando, FL, USA, 30 March–4 April 2001. [Google Scholar]
- Taherdoost, H.; Madanchian, M. Multi-Criteria Decision Making (MCDM) Methods and Concepts. Encyclopedia 2023, 3, 77–87. [Google Scholar] [CrossRef]
- Pramanik, P.K.D.; Biswas, S.; Pal, S.; Marinković, D.; Choudhury, P. A Comparative Analysis of Multi-Criteria Decision-Making Methods for Resource Selection in Mobile Crowd Computing. Symmetry 2021, 13, 1713. [Google Scholar] [CrossRef]
Disclaimer/Publisher’s Note: The statements, opinions and data contained in all publications are solely those of the individual author(s) and contributor(s) and not of MDPI and/or the editor(s). MDPI and/or the editor(s) disclaim responsibility for any injury to people or property resulting from any ideas, methods, instructions or products referred to in the content. |
© 2023 by the authors. Licensee MDPI, Basel, Switzerland. This article is an open access article distributed under the terms and conditions of the Creative Commons Attribution (CC BY) license (https://creativecommons.org/licenses/by/4.0/).