

ISCSO-PTCN-BIGRU Prediction Model for Fracture Risk Grade of Gas-Containing Coal Fracture

Abstract
:1. Introduction
1.1. Literature Review
1.2. Methodology
2. Selection of Predictive Indicators and Pre-Processing
2.1. Selection of Predictive Indicators for Gas-Containing Coal Fracture Risk Level
2.2. Data Pre-Processing
3. TCN-BIGRU Gas-Containing Coal Fracture Risk Rating Prediction Model
3.1. TCN
3.2. BIGRU
3.3. BiGRU Hyperparameter Optimization
3.4. Establishment of Gas-Containing Coal Fracture Risk Level Prediction Model
4. Experimental Testing and Analysis
4.1. Experimental Data Pre-Processing
4.2. Algorithm Testing
4.3. Hyperparameter Optimization Results and Analysis
4.4. Comparison of the Performance of Different Models
5. Conclusions
- (1)
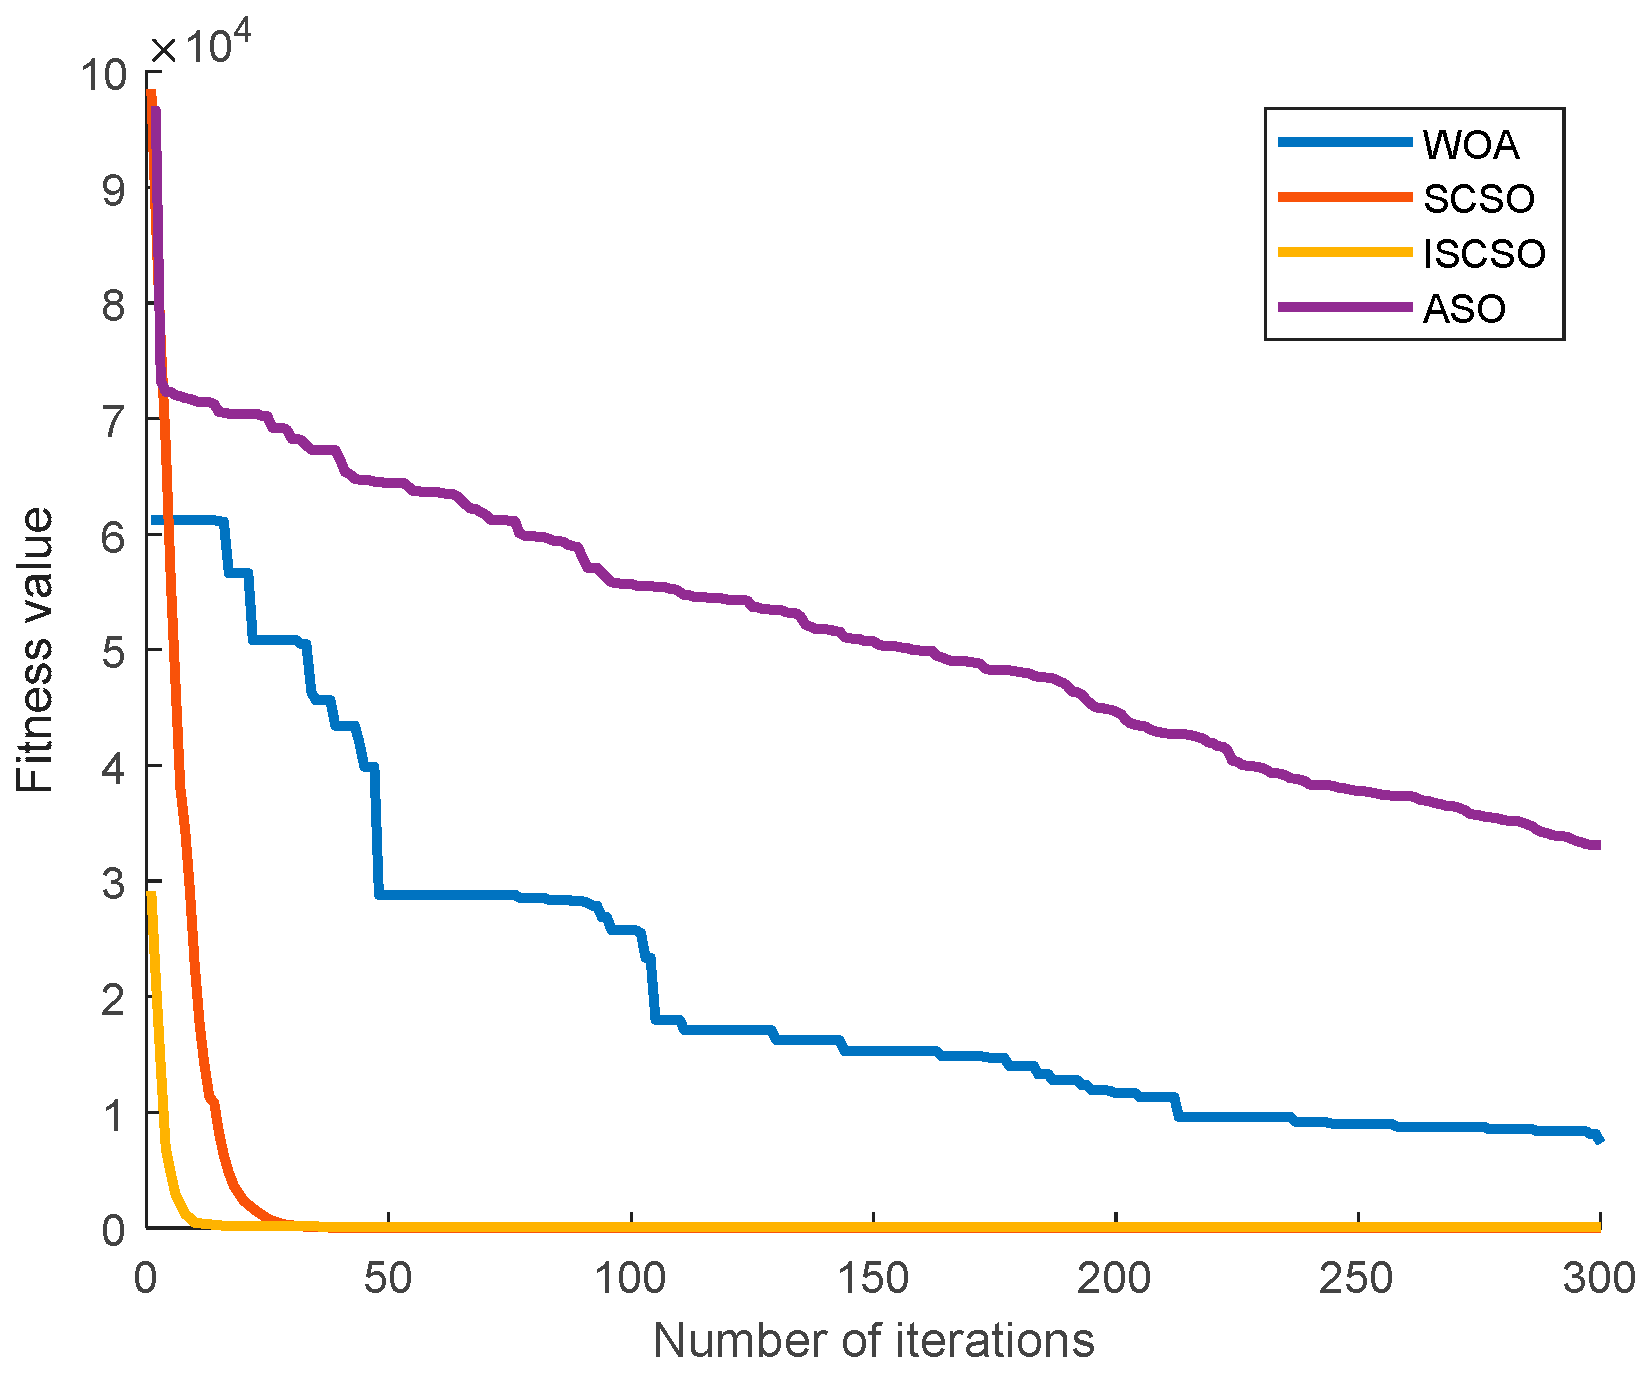
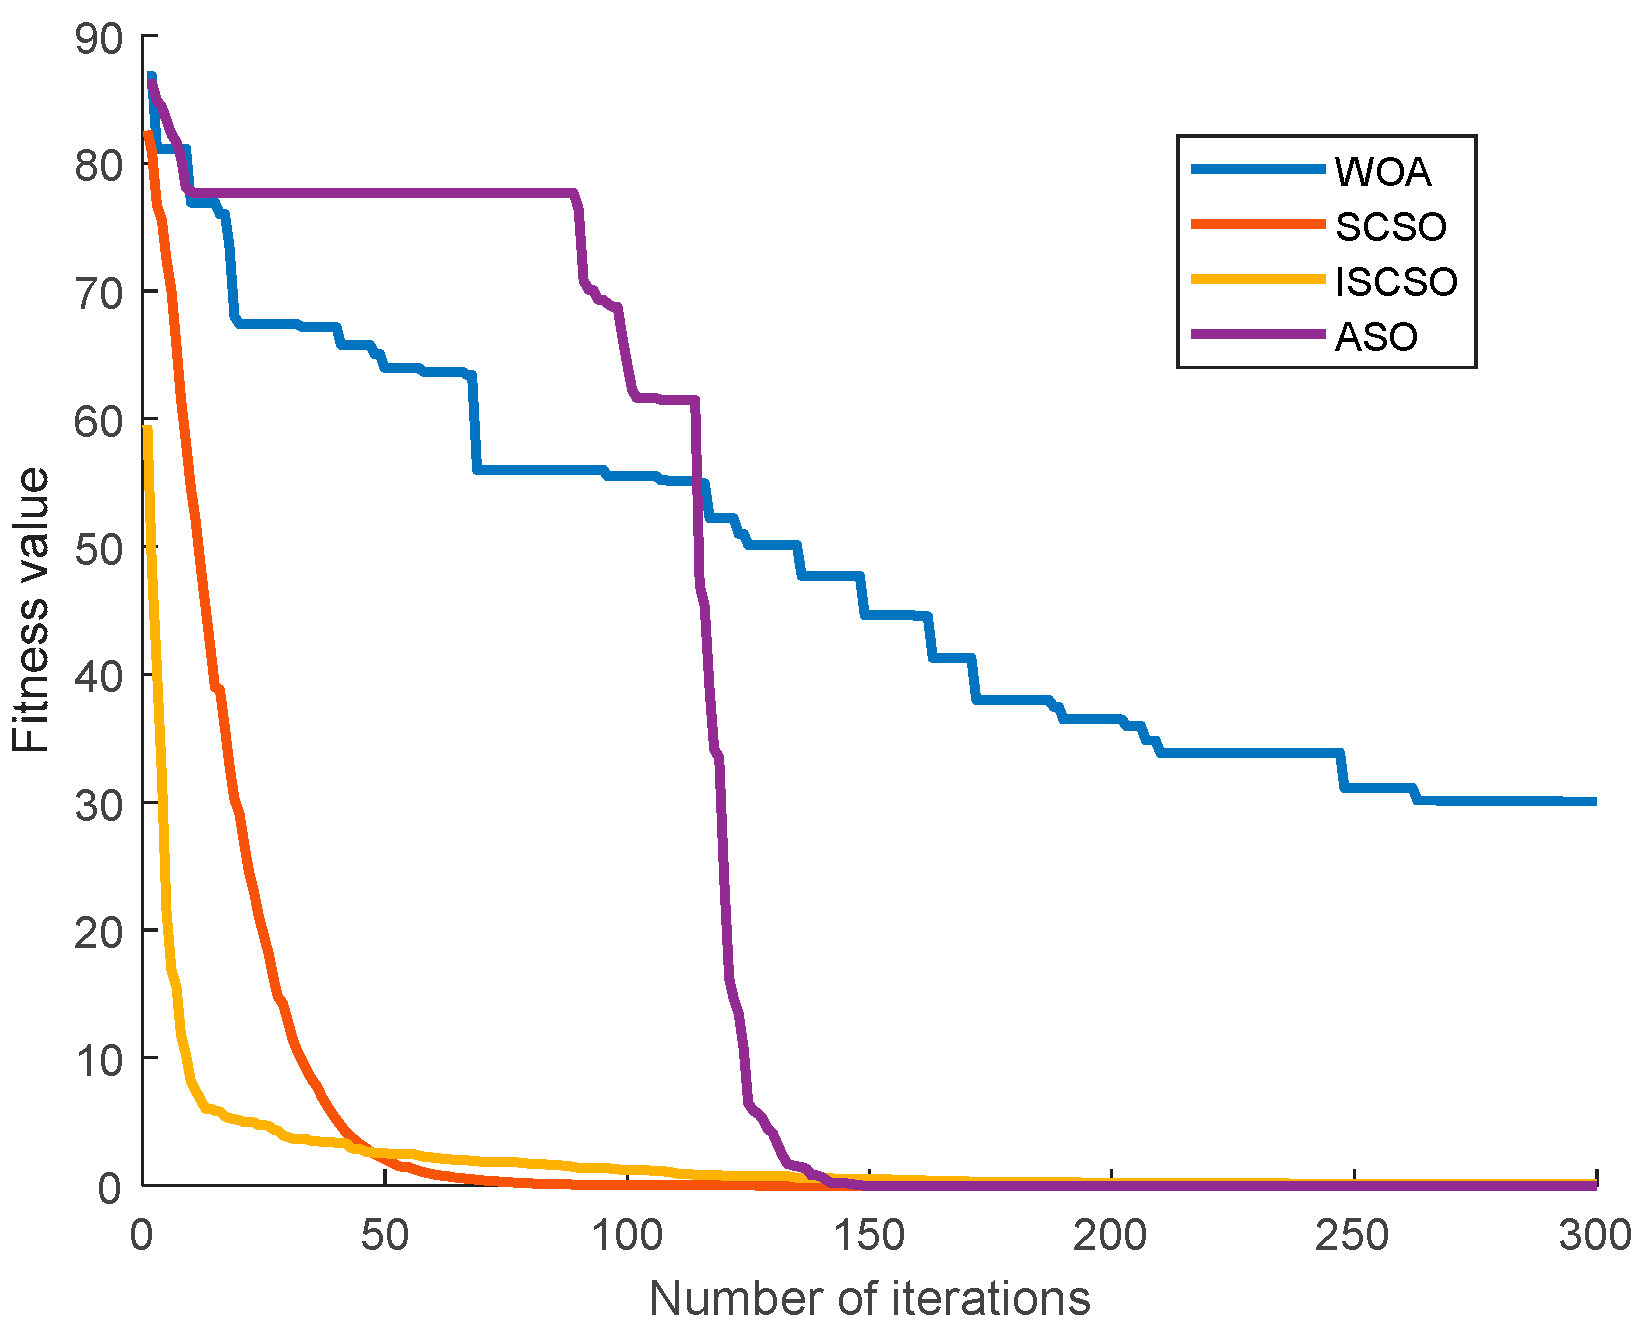
- The sand cat swarm optimization algorithm is improved by Singer chaotic mapping, chaotic decreasing factor and adaptive t-distribution multi-strategy to enrich the diversity of populations, coordinate and balance the global search and local development process, and improve the defects of the optimization process which is easy to fall into the local optimum.
- (2)
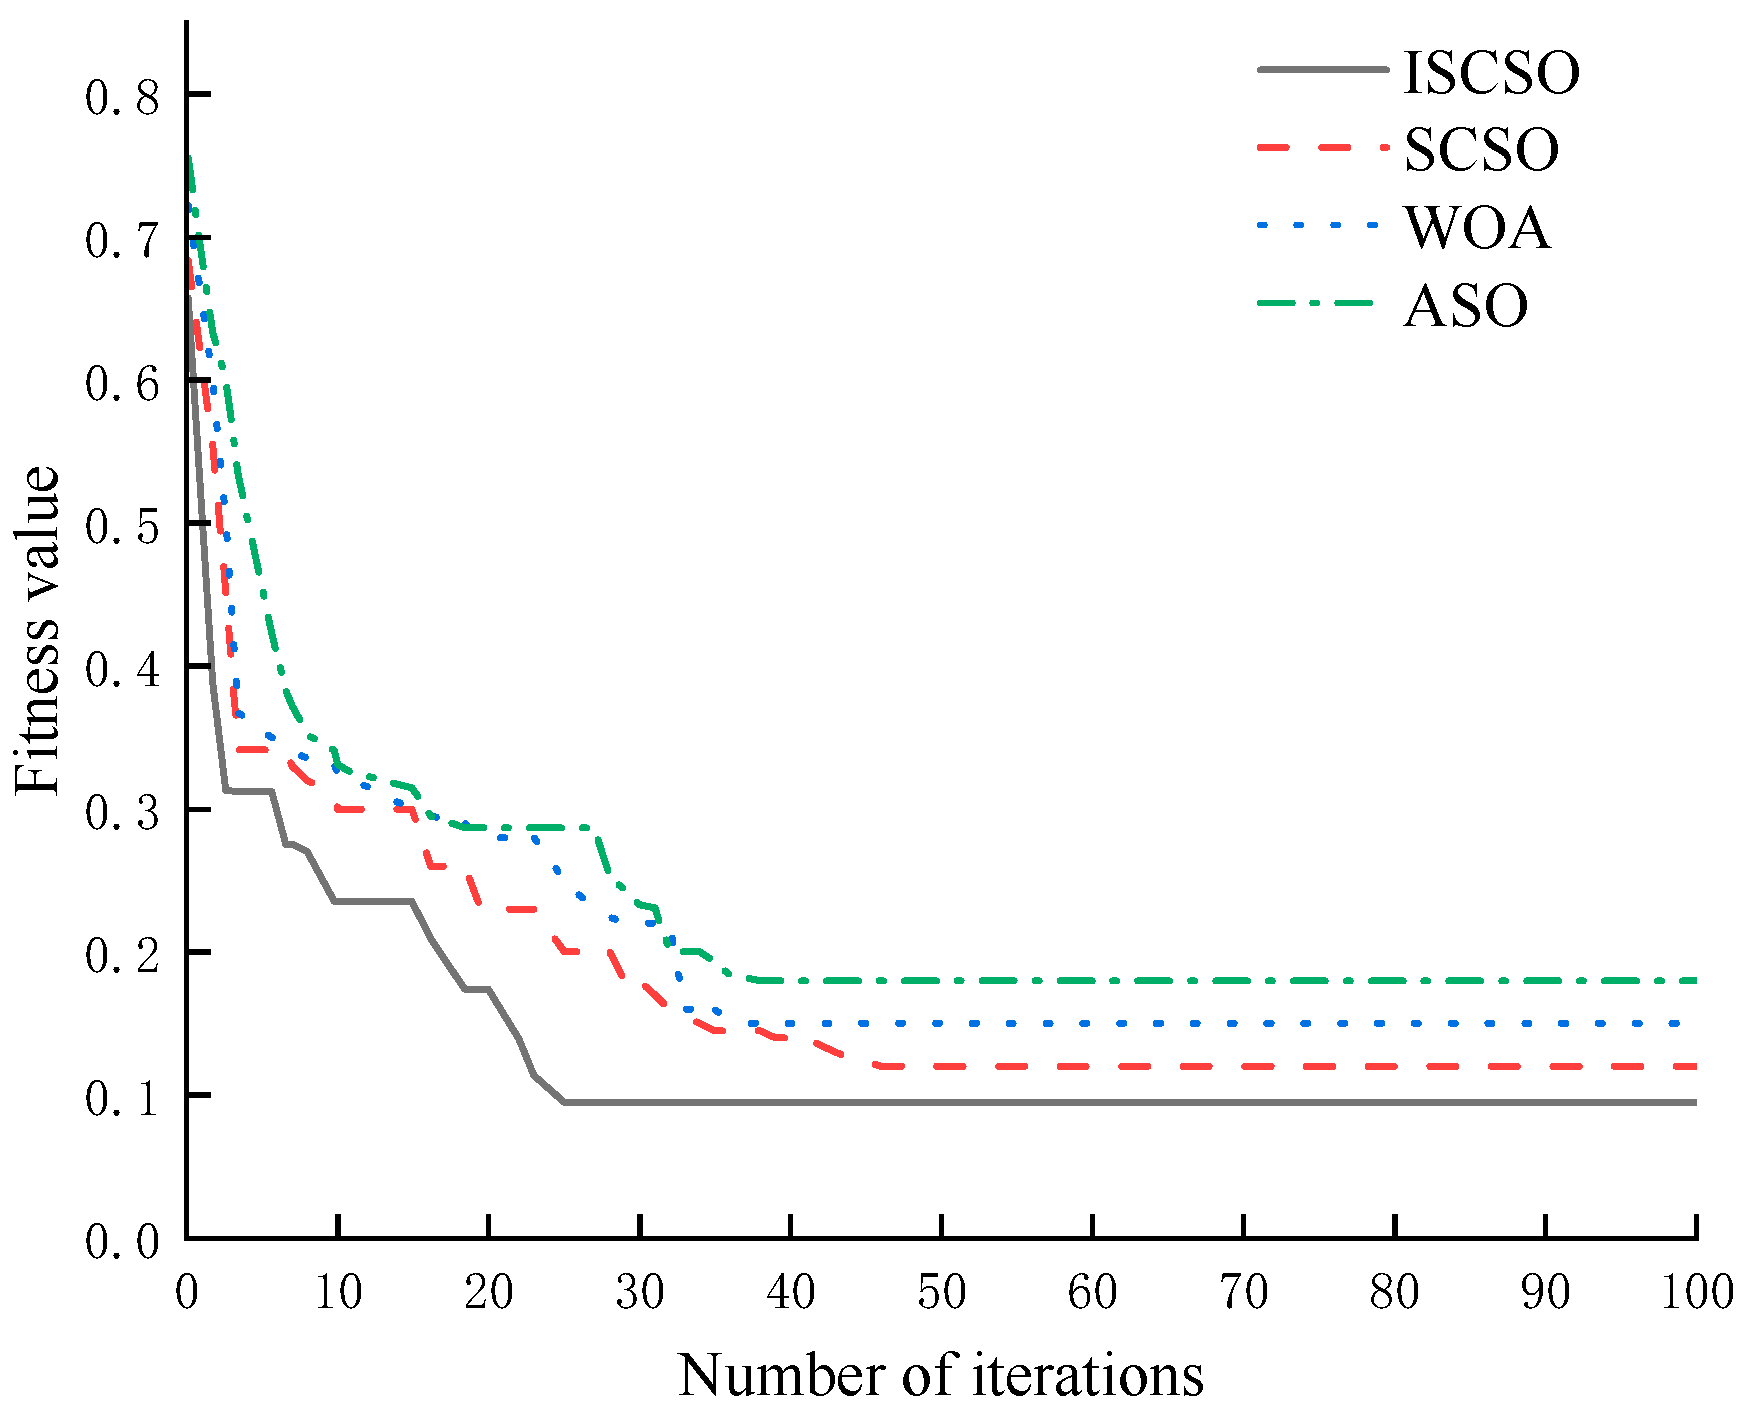
- Using ISCSO to optimize the relevant hyperparameters of BiGRU can effectively improve the generalization ability and accuracy of the gas-containing coal fracture risk prediction model, and combining it with the Kernel Entropy Component Analysis (KECA) downsizes the indicators of the gas-containing coal fracture risk level prediction removes the invalid and redundant features, which accelerates the convergence speed of the model.
- (3)
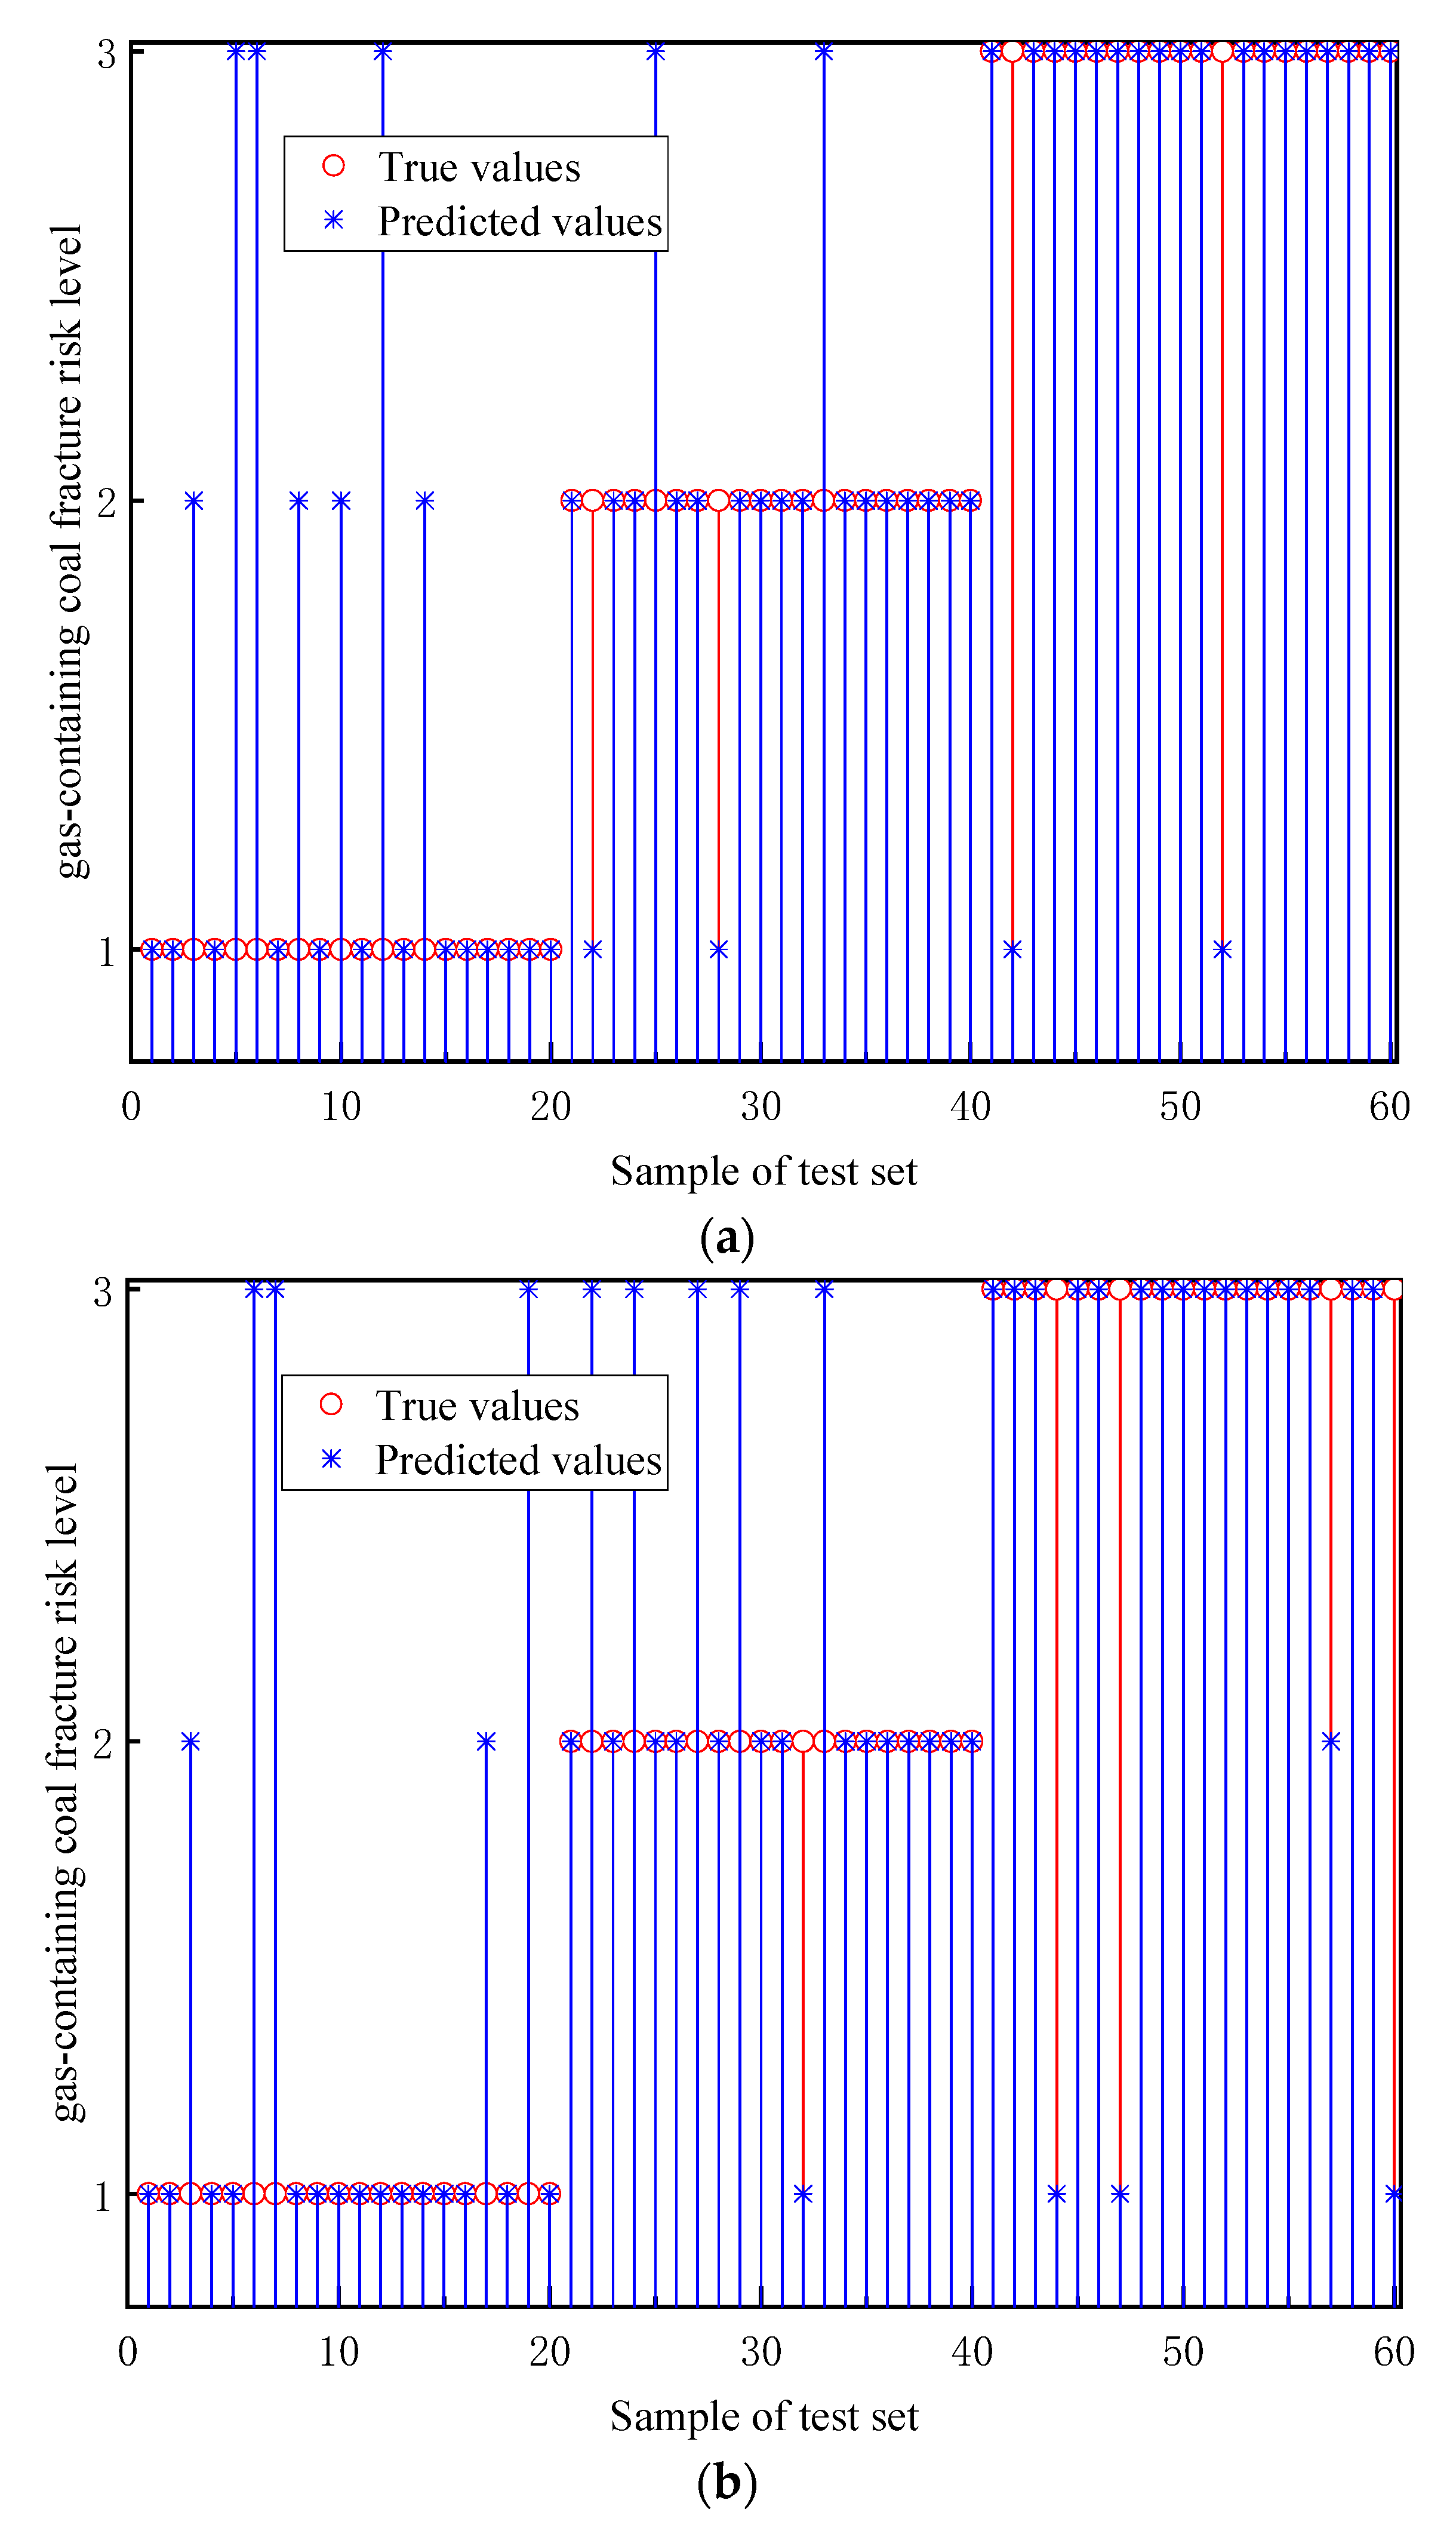
- In the TCN network, the gradient problem can be solved better by using the PeLU function instead of the ReLU function. Compared with other prediction models, the method proposed in this paper can more accurately and reliably predict gas-containing coal fractures, which has certain theoretical research and practical significance in engineering. Due to the limited data obtained on gas-containing coal fractures, the accuracy of the risk rank prediction needs to be improved, and further efforts will be made in data collection in the future.
Author Contributions
Funding
Data Availability Statement
Conflicts of Interest
Abbreviations
| KPCA | Kernel Principal Component Analysis |
| ELM | Extreme Learning Machine |
| FTA | Fault Tree Analysis |
| ANN | Artificial Neural Network |
| XGBoost | Xtreme Gradient Boosting |
| SVM | Support Vector Machines |
| NRS | Neighborhood Rough Sets |
| GA | Genetic Algorithm |
| SA | Simulated Annealing |
| KECA | Kernel Entropy Component Analysis |
| TCN | Temporal Convolutional Network |
| BiGRU | Bidirectional Gate Recurrent Unit |
| SCSO | Sand Cat Swarm Optimization Algorithm |
| WOA | Whale Optimization Algorithm |
| ASO | Atom Search Optimization |
References
- Kong, X.G.; Yang, S.R.; Wang, E.Y.; Li, S.G.; Lin, H.F.; Ji, P.F. Study on rupture evolution and gas emission characteristics of raw coal samples with instantaneous disturbance of shock load. Chin. J. Rock Mech. Eng. 2023, 42, 1384–1394. [Google Scholar]
- Tang, J.P.; Ren, L.R.; Pan, Y.S.; Zhang, X.; Yu, H.H. Study on the evolution law of coal and gas outburst impact force under high ground stress conditions. Coal Sci. Technol. 2023, 51, 116–128. [Google Scholar]
- Liu, P.; Jing, J.B.; Wei, H.Z.; Yu, J.; Lu, X.L.; Liu, M.M. Construction of gas accident knowledge base and early warning reasoning based on spatiotemporal constraints. Coal Sci. Technol. 2020, 48, 262–273. [Google Scholar]
- Du, J.S.; Chen, J.; Pu, Y.Y.; Jiang, D.Y.; Chen, L.L.; Zhang, Y.R. Risk assessment of dynamic disasters in deep coal mines based on multi-source, multi-parameter indexes, and engineering application. Process Saf. Environ. 2021, 155, 575–586. [Google Scholar] [CrossRef]
- Wen, H.; Yan, L.; Jin, Y.F.; Wang, Z.P.; Guo, J.; Deng, J. Coalbed methane concentration prediction and early-warning in fully mechanized mining face based on deep learning. Energy 2023, 264, 126208. [Google Scholar] [CrossRef]
- Zhang, Y.Y.; Cui, J.L.; Jiao, X.D. Research and application of multi-index coupling prediction model for coal and gas outburst. J. Eng. Sci. 2018, 40, 309–1316. [Google Scholar]
- Rashid, M.; Luo, M.; Ashraf, U.; Hussain, W.; Ali, N.; Rahman, N.; Hussain, S.; Martyushev, D.A.; Vo Thanh, H.; Anees, A. Reservoir Quality Prediction of Gas-Bearing Carbonate Sediments in the Qadirpur Field: Insights from Advanced Machine Learning Approaches of SOM and Cluster Analysis. Minerals 2023, 13, 29. [Google Scholar] [CrossRef]
- Kaleem, W.; Tewari, S.; Fogat, M.; Martyushev, D.A. A Hybrid Machine Learning Approach Based Study of Production Forecasting and Factors Influencing the Multiphase Flow through Surface Chokes. Petroleum 2023. [Google Scholar] [CrossRef]
- Ponomareva, I.N.; Galkin, V.I.; Martyushev, D.A. Operational method for determining bottom hole pressure in mechanized oil producing wells, based on the application of multivariate regression analysis. Pet. Res. 2021, 6, 351–360. [Google Scholar] [CrossRef]
- Yang, L.; Fang, X.; Wang, X.; Li, S.; Zhu, J. Risk Prediction of Coal and Gas Outburst in Deep Coal Mines Based on the SAPSO-ELM Algorithm. Int. J. Environ. Res. Public Health 2022, 19, 12382. [Google Scholar] [CrossRef]
- Zhang, R.; Lowndes, I.S. The application of a coupled artificial neural network and fault tree analysis model to predict coal and gas outbursts. Int. J. Coal Geol. 2010, 84, 141–152. [Google Scholar] [CrossRef]
- Zheng, X.; Lai, W.; Zhang, L.; Xue, S. Quantitative evaluation of the indexes contribution to coal and gas outburst prediction based on machine learning. Fuel 2023, 338, 127389. [Google Scholar] [CrossRef]
- Zhang, Z.; Liu, X.; Li, Z.; Hu, H. Outburst Prediction and Influencing Factors Analysis Based on Boruta-Apriori and BO-SVM Algorithms. J. Intell. Fuzzy Syst. 2021, 41, 3201–3218. [Google Scholar]
- Xie, G.M.; Xie, H.; Fu, H.; Yan, X.H. NN-SVM model for coal vs. gas prominence prediction. J. Sens. Technol. 2016, 29, 733–738. [Google Scholar]
- Wu, Y.Q.; Gao, R.L.; Yang, J.Z. Prediction of coal and gas outburst: A method based on the BP neural network optimized by GASA. Process Saf. Environ. 2020, 133, 64–72. [Google Scholar] [CrossRef]
- Xu, Y.R.; Qiu, W.; Wang, Z.G. Coal and gas outburst prediction study based on wavelet KPCA and IQGA-ELM. J. Sens. Technol. 2018, 31, 720–725. [Google Scholar]
- Wang, L.; Chen, L.P.; Liu, H.Q.; Zhu, C.Q.; Li, S.B.; Fan, H.; Zhang, S.; Wang, A.C. Coal dynamics and deterioration characteristics under different initial gas pressures. Geomechanics 2023, 44, 144–158. [Google Scholar]
- Wang, L.; Chen, L.P.; Liu, H.Q.; Zhu, C.Q.; Li, S.B.; Fan, H.; Zhang, S.; Wang, A.C. Energy dissipation and damage failure law of gas-containing coal under impact load. Geomechanics 2023, 44, 1901–1915. [Google Scholar] [CrossRef]
- Jiang, C.L.; Gao, Y.Z.; Chen, S.L.; Lv, S.W. Research on the grading and grading identification index of mine gas dynamic disaster. J. China Coal Soc. 2007, 149, 159–162. [Google Scholar]
- Bai, L.L.; Han, Z.N.; Ren, J.J.; Qin, X.F. Research on feature selection for rotating machinery based on Supervision Kernel Entropy Component Analysis with Whale Optimization Algorithm. Appl. Soft Comput. 2020, 92, 106245. [Google Scholar] [CrossRef]
- Limouni, T.; Yaagoubi, R.; Bouziane, K.; Guissi, K.; Baali, E.H. Accurate one step and multistep forecasting of very short-term PV power using LSTM-TCN model. Renew Energy 2023, 205, 1010–1024. [Google Scholar] [CrossRef]
- Dubey, S.R.; Singh, S.K.; Chaudhuri, B.B. Activation functions in deep learning: A comprehensive survey and benchmark. Neurocomputing 2022, 503, 92–108. [Google Scholar] [CrossRef]
- Kiani, F.; Anka, F.A.; Erenel, F. PSCSO: Enhanced sand cat swarm optimization inspired by the political system to solve complex problems. Adv. Eng. Softw. 2023, 178, 103423. [Google Scholar] [CrossRef]
- Zhang, S.; Zheng, D.J.; Liu, Y.T. Deformation Prediction System of Concrete Dam Based on IVM-SCSO-RF. Water 2022, 14, 3739. [Google Scholar] [CrossRef]
- Tubishat, M.; Ja’afar, S.; Idris, N.; Al-Betar, M.A.; Alswaitti, M.; Jarrah, H.; Ismail, M.A.; Omar, M.S. Improved sine cosine algorithm with simulated annealing and singer chaotic map for Hadith classification. Neural Comput. Applic. 2022, 34, 1385–1406. [Google Scholar] [CrossRef]
- Bhandari, N.; Walambe, R.; Kotecha, K.; Kaliya, M. Integrative gene expression analysis for the diagnosis of Parkinson’s disease using machine learning and explainable AI. Comput. Biol. Med. 2023, 163, 107140. [Google Scholar] [CrossRef]
- Sun, H.; Chen, P.F.; Hu, Z.Y.; Wei, L.X. Multi-objective evolutionary multitasking algorithm based on cross-task transfer solution matching strategy. ISA Trans. 2023, 138, 504–520. [Google Scholar] [CrossRef]
- Rugveth, V.S.; Khatter, K. Sensitivity analysis on Gaussian quantum-behaved particle swarm optimization control parameters. Soft Comput. 2023, 27, 8759–8774. [Google Scholar] [CrossRef]
- Chakraborty, S.; Sharma, S.; Saha, A.K.; Chakraborty, S. SHADE–WOA: A metaheuristic algorithm for global optimization. Appl. Soft Comput. 2021, 113, 107866. [Google Scholar] [CrossRef]
- Jiang, P.; Yang, H.F.; Li, R.R.; Li, C. Inbound tourism demand forecasting framework based on fuzzy time series and advanced optimization algorithm. Appl. Soft Comput. 2020, 92, 106320. [Google Scholar] [CrossRef]


| X1 (MPa) | X2 (m3/t) | X3 (L/min) | X4 | X5 (mV) | X6 (m) | X7 (MPa) | X8 | X9 | X10 | Risk |
|---|---|---|---|---|---|---|---|---|---|---|
| 2.80 | 10.24 | 8 | 885 | 224 | 425 | 12.9 | 0.58 | 3 | 1 | 3 |
| 1.24 | 9.01 | 8 | 735 | 167 | 744 | 15.2 | 0.37 | 3 | 2 | 3 |
| 1.36 | 9.88 | 7 | 268 | 24 | 399 | 4.3 | 0.27 | 5 | 3 | 1 |
| 1.57 | 12.49 | 13 | 387 | 114 | 542 | 11.2 | 0.36 | 1 | 2 | 1 |
| 0.94 | 13.06 | 6 | 649 | 241 | 446 | 13.2 | 0.23 | 3 | 1 | 2 |
| 1.20 | 10.27 | 18 | 357 | 129 | 462 | 12.4 | 0.16 | 3 | 1 | 2 |
| 0.44 | 4.61 | 7 | 120 | 12 | 512 | 5.7 | 0.54 | 1 | 1 | 1 |
| 1.28 | 8.26 | 6 | 673 | 138 | 484 | 16.6 | 0.52 | 5 | 2 | 2 |
| 1.19 | 9.05 | 5 | 332 | 142 | 397 | 11.1 | 0.61 | 1 | 1 | 2 |
| 2.76 | 10.03 | 20 | 579 | 163 | 621 | 7.7 | 0.31 | 5 | 3 | 2 |
| Kernel Entropy Component | No.1 | No.2 | No.3 | No.4 |
|---|---|---|---|---|
| Individual | 67.15% | 15.53% | 9.25% | 6.43% |
| Accumulating | 67.15% | 82.68% | 91.93% | 98.36% |
| Hyperparameters | Search Space |
|---|---|
| Batch | 1–20 |
| Learning rate | 0.0001–0.01 |
| Maximum Iteration | 300–500 |
| Prediction Model | ISCSO | SCSO | WOA | ASO |
|---|---|---|---|---|
| Elapsed time | 1 min 23 s | 1 min 54 s | 1 min 43 s | 1 min 35 s |
| Prediction Model | PTCN-BiGRU | TCN-BIGRU | BIGRU | TCN |
|---|---|---|---|---|
| Prediction accuracy | 78.33% | 75% | 71.67% | 68.33% |
| Prediction Model | ISCSO-PTCN-BiGRU | SCSO-PTCN-BiGRU | WOA-PTCN-BiGRU | ASO-PTCN-BiGRU |
|---|---|---|---|---|
| Prediction accuracy | 93.33% | 90% | 86.67% | 81.67% |
Disclaimer/Publisher’s Note: The statements, opinions and data contained in all publications are solely those of the individual author(s) and contributor(s) and not of MDPI and/or the editor(s). MDPI and/or the editor(s) disclaim responsibility for any injury to people or property resulting from any ideas, methods, instructions or products referred to in the content. |
© 2023 by the authors. Licensee MDPI, Basel, Switzerland. This article is an open access article distributed under the terms and conditions of the Creative Commons Attribution (CC BY) license (https://creativecommons.org/licenses/by/4.0/).
Share and Cite
Fu, H.; Lei, T. ISCSO-PTCN-BIGRU Prediction Model for Fracture Risk Grade of Gas-Containing Coal Fracture. Processes 2023, 11, 2925. https://doi.org/10.3390/pr11102925
Fu H, Lei T. ISCSO-PTCN-BIGRU Prediction Model for Fracture Risk Grade of Gas-Containing Coal Fracture. Processes. 2023; 11(10):2925. https://doi.org/10.3390/pr11102925
Chicago/Turabian StyleFu, Hua, and Tian Lei. 2023. "ISCSO-PTCN-BIGRU Prediction Model for Fracture Risk Grade of Gas-Containing Coal Fracture" Processes 11, no. 10: 2925. https://doi.org/10.3390/pr11102925
APA StyleFu, H., & Lei, T. (2023). ISCSO-PTCN-BIGRU Prediction Model for Fracture Risk Grade of Gas-Containing Coal Fracture. Processes, 11(10), 2925. https://doi.org/10.3390/pr11102925