Article

Supercritical-CO2-Assisted Electrospray for the Production of the PLA-Antibiotic-Sustained Drug-Delivery System

by
Mariangela Guastaferro
1,
Lucia Baldino
2,
Stefano Cardea
2 and
Ernesto Reverchon
2,*
1
Department of Civil and Industrial Engineering, University of Pisa, Largo Lazzarino, 2, 56122 Pisa, Italy
2
Department of Industrial Engineering, University of Salerno, Via Giovanni Paolo II, 132, 84084 Fisciano, Italy
*
Author to whom correspondence should be addressed.
Processes 2023, 11(10), 2957; https://doi.org/10.3390/pr11102957
Submission received: 22 August 2023 / Revised: 7 October 2023 / Accepted: 10 October 2023 / Published: 12 October 2023

Abstract

:
Supercritical CO2 (SC-CO2)-assisted electrospray has been successfully performed to obtain a sustained release of ceftriaxone sodium (CFX) from polylactic acid (PLA) nanoparticles. PLA nanoparticles ranged from 270 ± 70 to 310 ± 80 nm, when produced at 140 bar. CFX release in a phosphate-buffered solution ranged from about 5 min, when the pure antibiotic was tested, to a maximum of 1200 min when 140 bar and 4 wt% of PLA + CFX nanoparticles was used: operating at these process conditions, an increase of 240 times of the release time was observed and no interactions were produced between PLA and the antibiotic. The release curves were explained hypothesizing a two-step mass transfer mechanism consisting of polymer swelling and PLA ester bond cleavage.

1. Introduction

One of the major challenges in the pharmaceutical field is to provide drugs in an effective and targeted way [1,2,3]; the goal of selecting suitable nanocarriers is to increase the bioavailability of the therapeutic agent with minimum or no side effects [4,5,6,7].
The use of biodegradable polymers is a promising strategy due to their biocompatibility and degradability properties; indeed, they can break down in natural compounds that can be easily eliminated from the human body [8,9]. The main mechanisms controlling the release of the drug from biodegradable synthetic carriers are diffusion, degradation, swelling and affinity-based mechanisms [10,11]. They are generally influenced by polymer physicochemical properties, such as crystallinity, glass transition temperature, solubility in physiological fluids and molecular weight [12]. The most extensively investigated degradable synthetic polymers are aliphatic polyester, such as poly(glycolic acid) (PGA), poly(lactic acid) (PLA) and polyD,L-lactic-co-glycolic acid PLGA [13,14,15].
In particular, PLA has been widely employed in drug delivery since it is biodegradable, well adaptable to biological environments and does not have adverse effects on blood and tissues [16,17]. PLA nanoparticles were produced by Buhecha et al. [16] for pulmonary delivery of hydrophilic and lipophilic drugs. PLA nanoparticles were produced using a multi-step process involving double emulsification solvent diffusion, organic solvent evaporation, centrifugation and 24 h of freeze-drying processing. The loading efficiency was very low, ranging from 0.04%, using acetone as organic solvent up to 35% using acetonitrile; 60% of the encapsulated drug was released over time up to 24 h. Xia et al. [17] produced polyethylene glycol (PEG)-PLA nanoparticles for brain drug-delivery systems. Coumarin-6 was encapsulated in an oil-in-water (o/w) emulsion and the nanoparticles were obtained by solvent evaporation, centrifugation, and freeze-drying. A very low amount of material was processed and no data about drug encapsulation were provided. Hu et al. [18] developed a drug-delivery system for glioma treatment. The authors produced F3-peptine-modified surface PEG-PLA nanoparticles to improve the targeting of the chemotherapy treatment and to increase the cellular internalization. The particles were loaded with paclitaxel and its burst effect in the first minutes of drug release demonstrated that a core–shell structure was not efficiently formed at the end of the process.
Electrospray belongs to the bottom-up techniques and it is a promising candidate for one-step production of polymeric dried nanoparticles [19,20]. The electrospray process is characterized by the generation of highly charged droplets that while passing through a potential and pressure gradient undergo to a size reduction by solvent evaporation or by Coulomb explosion [19,20]. However, only a few attempts have been performed to process PLA using electrospray. PLA-PEG-based nanoparticles were prepared using coaxialtri-capillary electrospray and paclitaxel was used as model drug [21]. The coaxial configuration of electrospray process is characterized by coaxial electrified jets, leading to the production of multilayer microparticles having high encapsulation efficiency, high bioactivity, and uniform size. The flow rates of shell and core fluids were fixed at 0.5 and 0.8 mL/h; the drug solution flow rate was varied from 0.2 up to 0.3 mL/h, i.e., very low flow rates. The average diameter of the produced particles was around 155 nm. With respect to the previously described work of Hu et al. [18] that indicated a paclitaxel biphasic release, in this work, a continuous sustained release of the drug over 40 days was guaranteed and no burst effect mechanism was recorded. Drug release curves were also fitted using the Ritger–Peppas equation and “n” values indicated that polymeric erosion and drug diffusion were the main controlling steps during the paclitaxel release. The same coaxial apparatus was also used by Ghaffarzadegan et al. [22] for the sustained release of an anticancer drug: berberine. Particles with an average diameter around 300 nm were produced. A sustained release of the drug over 240 h was ensured and it was described by a zero-order kinetic. Tasci et al. [23] studied the optimum combination of parameters to achieve homogenous and porous microparticles. In particular, 3 wt% PLA in a dichloromethane (DCM) solution with an applied voltage of 18 kV and a flow rate of 1.2 mL/h (almost ten times higher than the previous described works) led to the production of particles with an average diameter of around 4 μm: nanoparticles were not formed. Mai et al. [24] optimized the production of PLA + curcumin microparticles using the electrospray technique. Spherical and uniform micrometric particles were obtained selecting trichloromethane as solvent; on the other hand, when acetone (less harmful solvent) was used, collapsed particles were obtained. After processing, 0.3 mL/h and 3 wt% PLA were selected as the most suitable processing parameters, considering their effect on the particle size uniformity.
However, even though the electrospray process is a useful fabrication technique for the production of uniform particles, it suffers from various drawbacks. Among them, the most relevant is represented by the very low processed flow rates that lead to the production of very small particles quantities and do not allow the performance reliable characterizations and production scalable to industrial applications [22,23,24].
Therefore, Guastaferro et al. [25,26,27,28] produced biopolymeric particles, whose diameters ranged from nanometric up to submicrometric dimensions, using an evolution of the traditional electrospray configuration, i.e., the SC-CO2-assisted electrospray. It allowed to process a solution flow rate increased up to one thousand times with respect to the traditional electrospray due to the application of a main disruptive force (i.e., CO2 pressure). However, it was necessary to consider that the SC-CO2 electrospray produced particles characterized by larger kinetic energy with respect to the traditional apparatus (caused by the presence of a high pressure drop at the exit of the injector) and, consequently, a liquid collector needed to be used to capture even the smaller ones. This plant-engineering choice involved the use of a liquid medium that should be removed to perform particles’ characterization, i.e., time-consuming post-treatments (i.e., rotavapor, lyophilization and filtration) were required.
For these reasons, the aim of this study is the production of PLA-based particles using the innovative SC-CO2-assisted electrospray, to demonstrate the overcoming of the previously discussed limitations of the traditional configurations [25,26,27,28]. The effect of the main processing parameters was investigated, such as polymer concentration and pressure. Physicochemical properties of the produced materials were analysed using the field emission scanning electron microscope (FESEM), the dynamic light scattering (DLS), the Fourier transform infrared (FT-IR) and the gas chromatograph (GC) analyses. A powerful antibiotic, ceftriaxone sodium (CFX), was used as a model drug of the class III in the biopharmaceutical classification system (BCS); CFX was loaded into the polymeric matrix and its effective entrapment and release kinetic were verified using FT-IR analysis and UV-Vis spectrophotometry.

2. Materials and Methods

2.1. Materials

Poly-Lactic-Acid (PLA, RESOMER 203H, Mw 18,000–24,000 Da, indicated as low Mw-PLA) was supplied by Evonik Industries (Essen, Germany). Span® 80 (Mw = 428.60 g/mol, HLB = 4.3) was purchased from Merck (Darmstadt, Germany). Ceftriaxone sodium (purity 99.98%) and acetone (purity > 99.5%) were bought from Sigma-Aldrich (Milan, Italy). CO2 (99.9% purity) was purchased from Morlando Group Srl (Sant’Antimo (NA), Italy).

2.2. Methods

PLA solutions at different values of polymer concentration (1, 2, 3, 4, 7 wt%) were prepared in 50 mL of acetone, and two different pressure values were investigated (100 and 140 bar). To prepare CFX-loaded PLA solutions, the antibiotic was firstly solubilized in 10 mL of aqueous solution and, then, it was mixed with 40 mL of PLA + acetone solutions. To stabilize the interactions between the two phases, 0.25 wt% of Span 80 was loaded into the oil phase (PLA + acetone). The solutions were stirred for 30 min, at 200 rpm and room temperature.
The lab-scale plant used to carry out the experimentations consisted of a stainless-steel high-pressure vessel, with an internal volume of 70 mL. A high-pressure pump (Gilson, mod. 305, Middleton, WI, USA) delivered CO2 to the vessel, up to the operative pressure (100 and 140 bar). Pressure in the vessel was measured using a test gauge (mod. MP1, OMET, Lecco, Italy). The system was left in equilibration for 10 min, when the selected temperature and pressure were reached. The temperature control in the vessel and in the injection tube was ensured by a controller connected with an electrically thin band (mod. 305, Watlow, Corsico (MI), Italy): temperature was kept fixed at 40 °C. Then, the polymeric solution was discharged through a 140 µm internal diameter stainless-steel nozzle. The applied voltage was set at 30 kV, using a voltage generator (FUG Elektronic, mod. HCP 35–3500, Schechen, Germany), that was applied between injector and collector, located at a 25 cm distance. The collector consisted of two adjacent stainless-steel blocks, covered with an aluminum dish, in which a 100 mL volume of distillated water, that did not solubilize the selected polymer, was located. Each experiment provided a suspension containing the produced electrosprayed particles. The apparatus was graphically described in [25].
The average diameter of the suspended particles was measured by DLS, using a Malvern Zetasizer instrument (Zetasizer Nano S, Worcestershire, UK). For this analysis, a 5 mL volume of the produced suspension (PLA and PLA + CFX particles) was used without any further dilution step. Then, the suspension containing the electrospray particles was freeze-dried, and the morphology of the produced particles was investigated by FESEM (mod. LEO 1525, Carl Zeiss SMT AG, Oberkochen, Germany). The powder, which was dispersed on an aluminum stub, was coated with gold (layer thickness 250 Å) using a sputter coater (mod. 108 A, Agar Scientific, Stansted, UK).
The loaded droplets (PLA + CFX) were observed using an optical microscope (Olympus, Tokyo, Japan) equipped with a phase contrast condenser.
The particles were dried using two different methods, i.e., freeze-drying and under-vacuum filtration. In particular, the freeze-drying technique was carried out using a cooling chamber of a programmable cryostat (LyoQuest-55 Plus ECO, Seneco Srl, Milan, Italy), set at −50 °C, under vacuum, overnight. During under-vacuum filtration, a laboratory-grade vacuum pump was connected to a filter flask creating a pressure differential that allowed the nanoparticle suspension to pass throughout the cellulose acetate filter. The filter membrane with a nominal pore size of 0.20 μm was carefully placed inside the filter funnel. This specific pore size was chosen to ensure efficient separation and collection of nanoparticles while preventing larger particles from passing through.
FT-IR spectra were obtained using an M2000 FT-IR spectrophotometer (MIDAC Co, Costa Mesa, CA, USA) to investigate the presence of the drug in the polymeric matrix and possible chemical interactions between CFX and PLA. Pellets were prepared by mixing the produced freeze-dried particles and KBr (1:100 by weight). Scans were performed at a resolution of 32 cm−1.
Release tests were performed, suspending the freeze-dried particles (5 mg) in 3 mL of phosphate-buffered saline (PBS) and loading the suspension in a dialysis sack. Then, CFX release profiles were determined in 80 mL of PBS at pH 7.4 continuously stirred at 200 rpm in a 37 °C incubator to maintain adequate gastro-intestinal conditions. Released CFX was determined continuously measuring the absorbance at 254 nm (UV-Vis spectrophotometer, mod. Cary 50, Varian, Polo Alto, CA, USA). The UV-Vis spectrophotometer allowed to select the time range during while the instrument acquired points of analytic value (i.e., drug absorbance) and then, after the acquisition, the average value (i.e., mean value ± standard deviation) of the recorded data was provided. All analyses were performed in triplicate.
A headspace (HS) sampler (mod. 7694E, Hewlett Packard, Palo Alto, CA, USA) coupled with a GC interfaced with a flame ionization detector (GC-FID, mod. 6890 GC SYSTEM, Hewlett Packard, Palo Alto, CA, USA) was used to perform the solvent residue analysis on the obtained freeze-dried particles. Specifically, solvents were separated using two fused-silica capillary columns connected in series by press-fit: the first column (mod. Carbomax EASYSEP, Stepbios, Bologna, Italy) connected to the detector, 30 m length, 0.53 mm internal diameter, 1 µm film thickness, and the second one (mod. Cp Sil 5CB CHROMPACK, Stepbios, Bologna, Italy) connected to the injector, 25 m length, 0.53 mm internal diameter, 5 µm film thickness. The HS conditions were oven temperature at 95 °C and manifold temperature at 105 °C, incubation time of 30 min. The GC conditions were as follows: oven temperature was set at 45 °C for 8 min; then, from 45 °C to 150 °C at 7 °C/min; from 150 °C to 210 °C at 38 °C/min; and, finally, at 210 °C for 6 min.

3. Results and Discussion

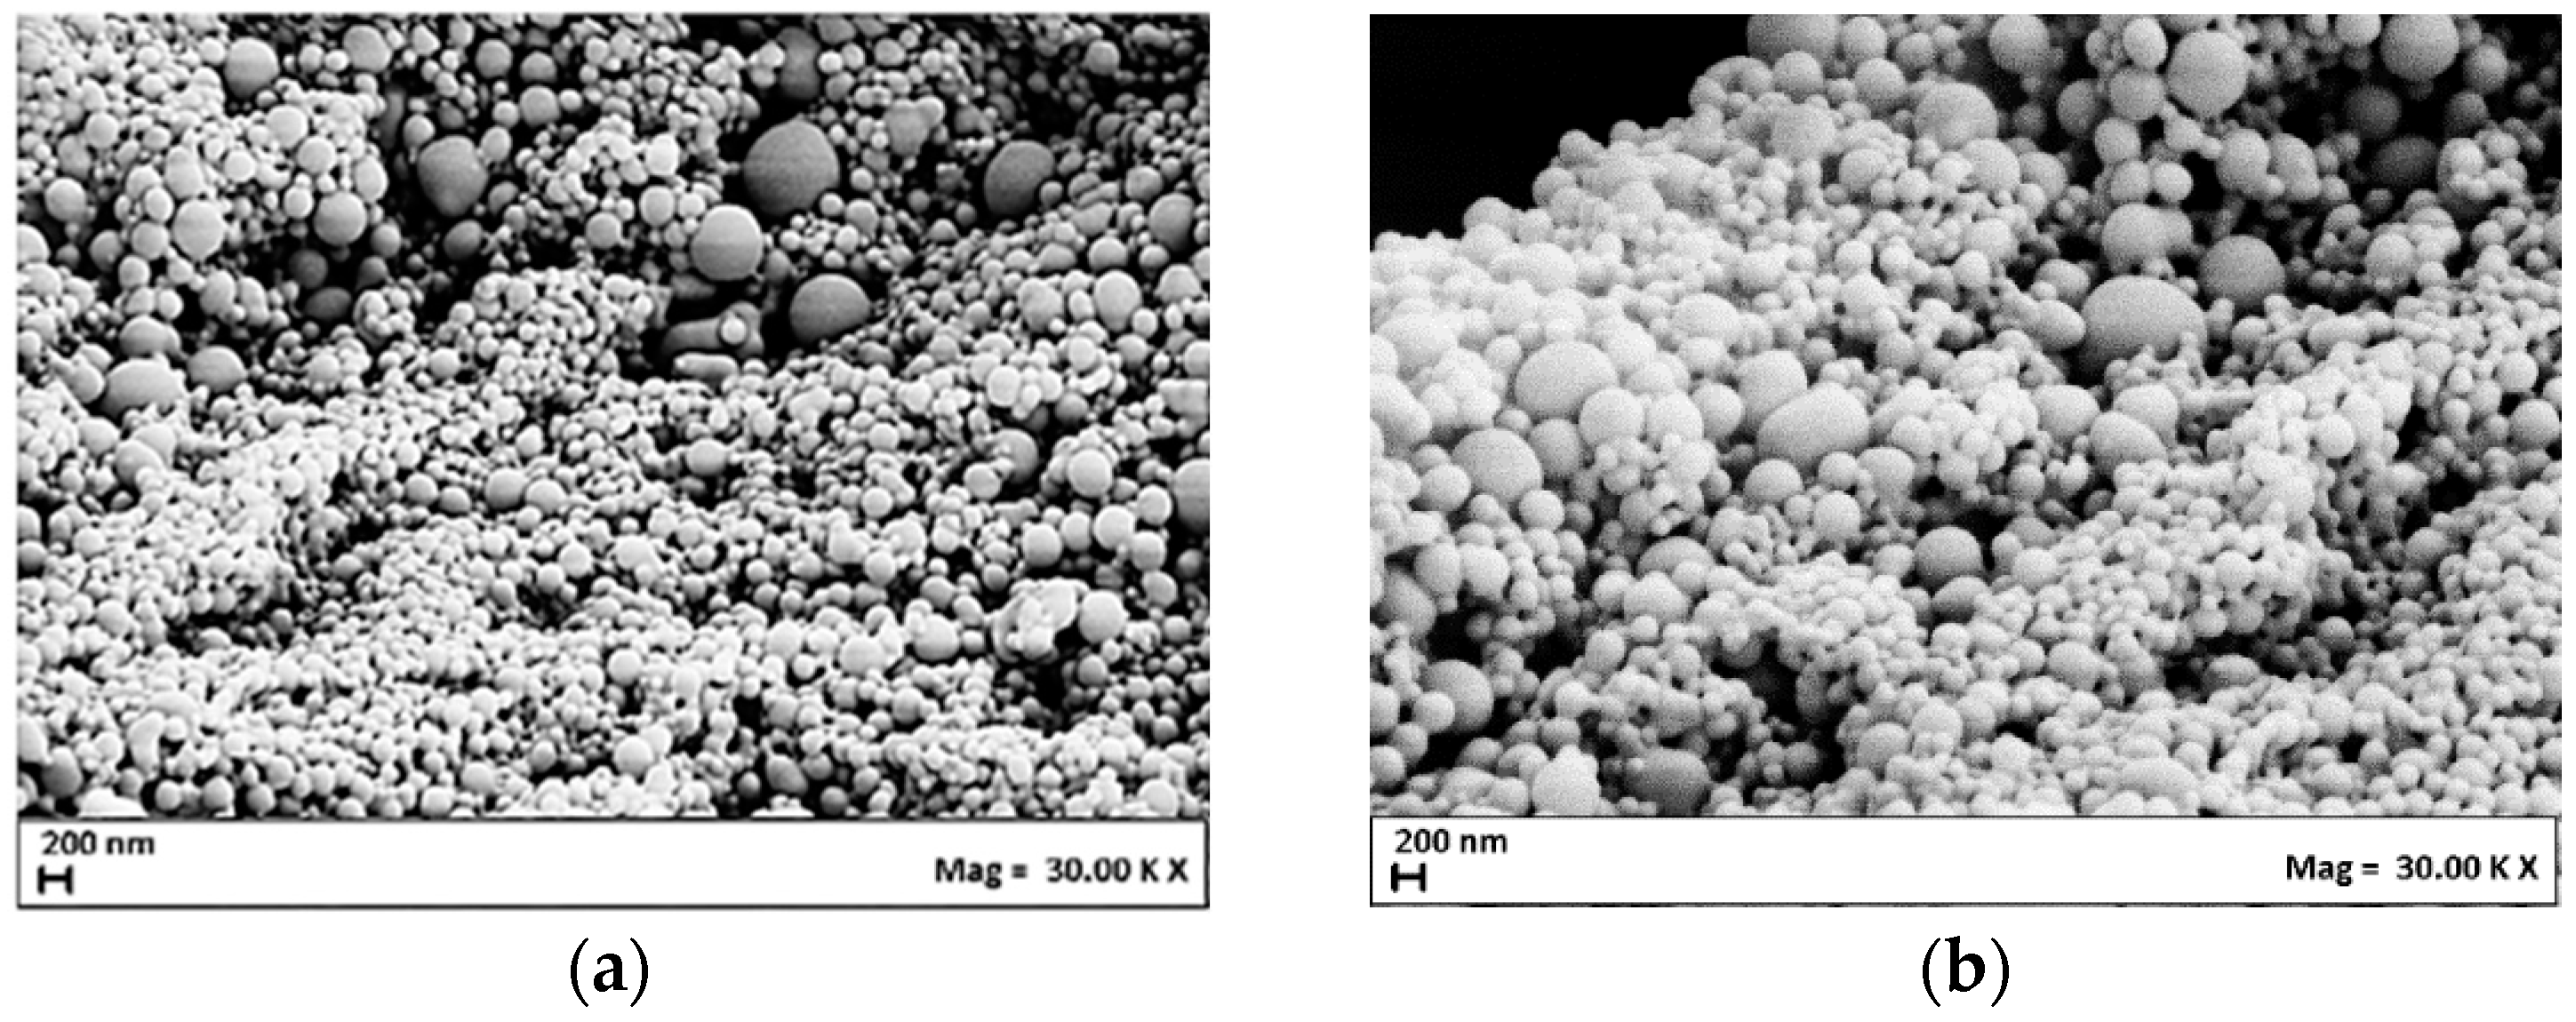
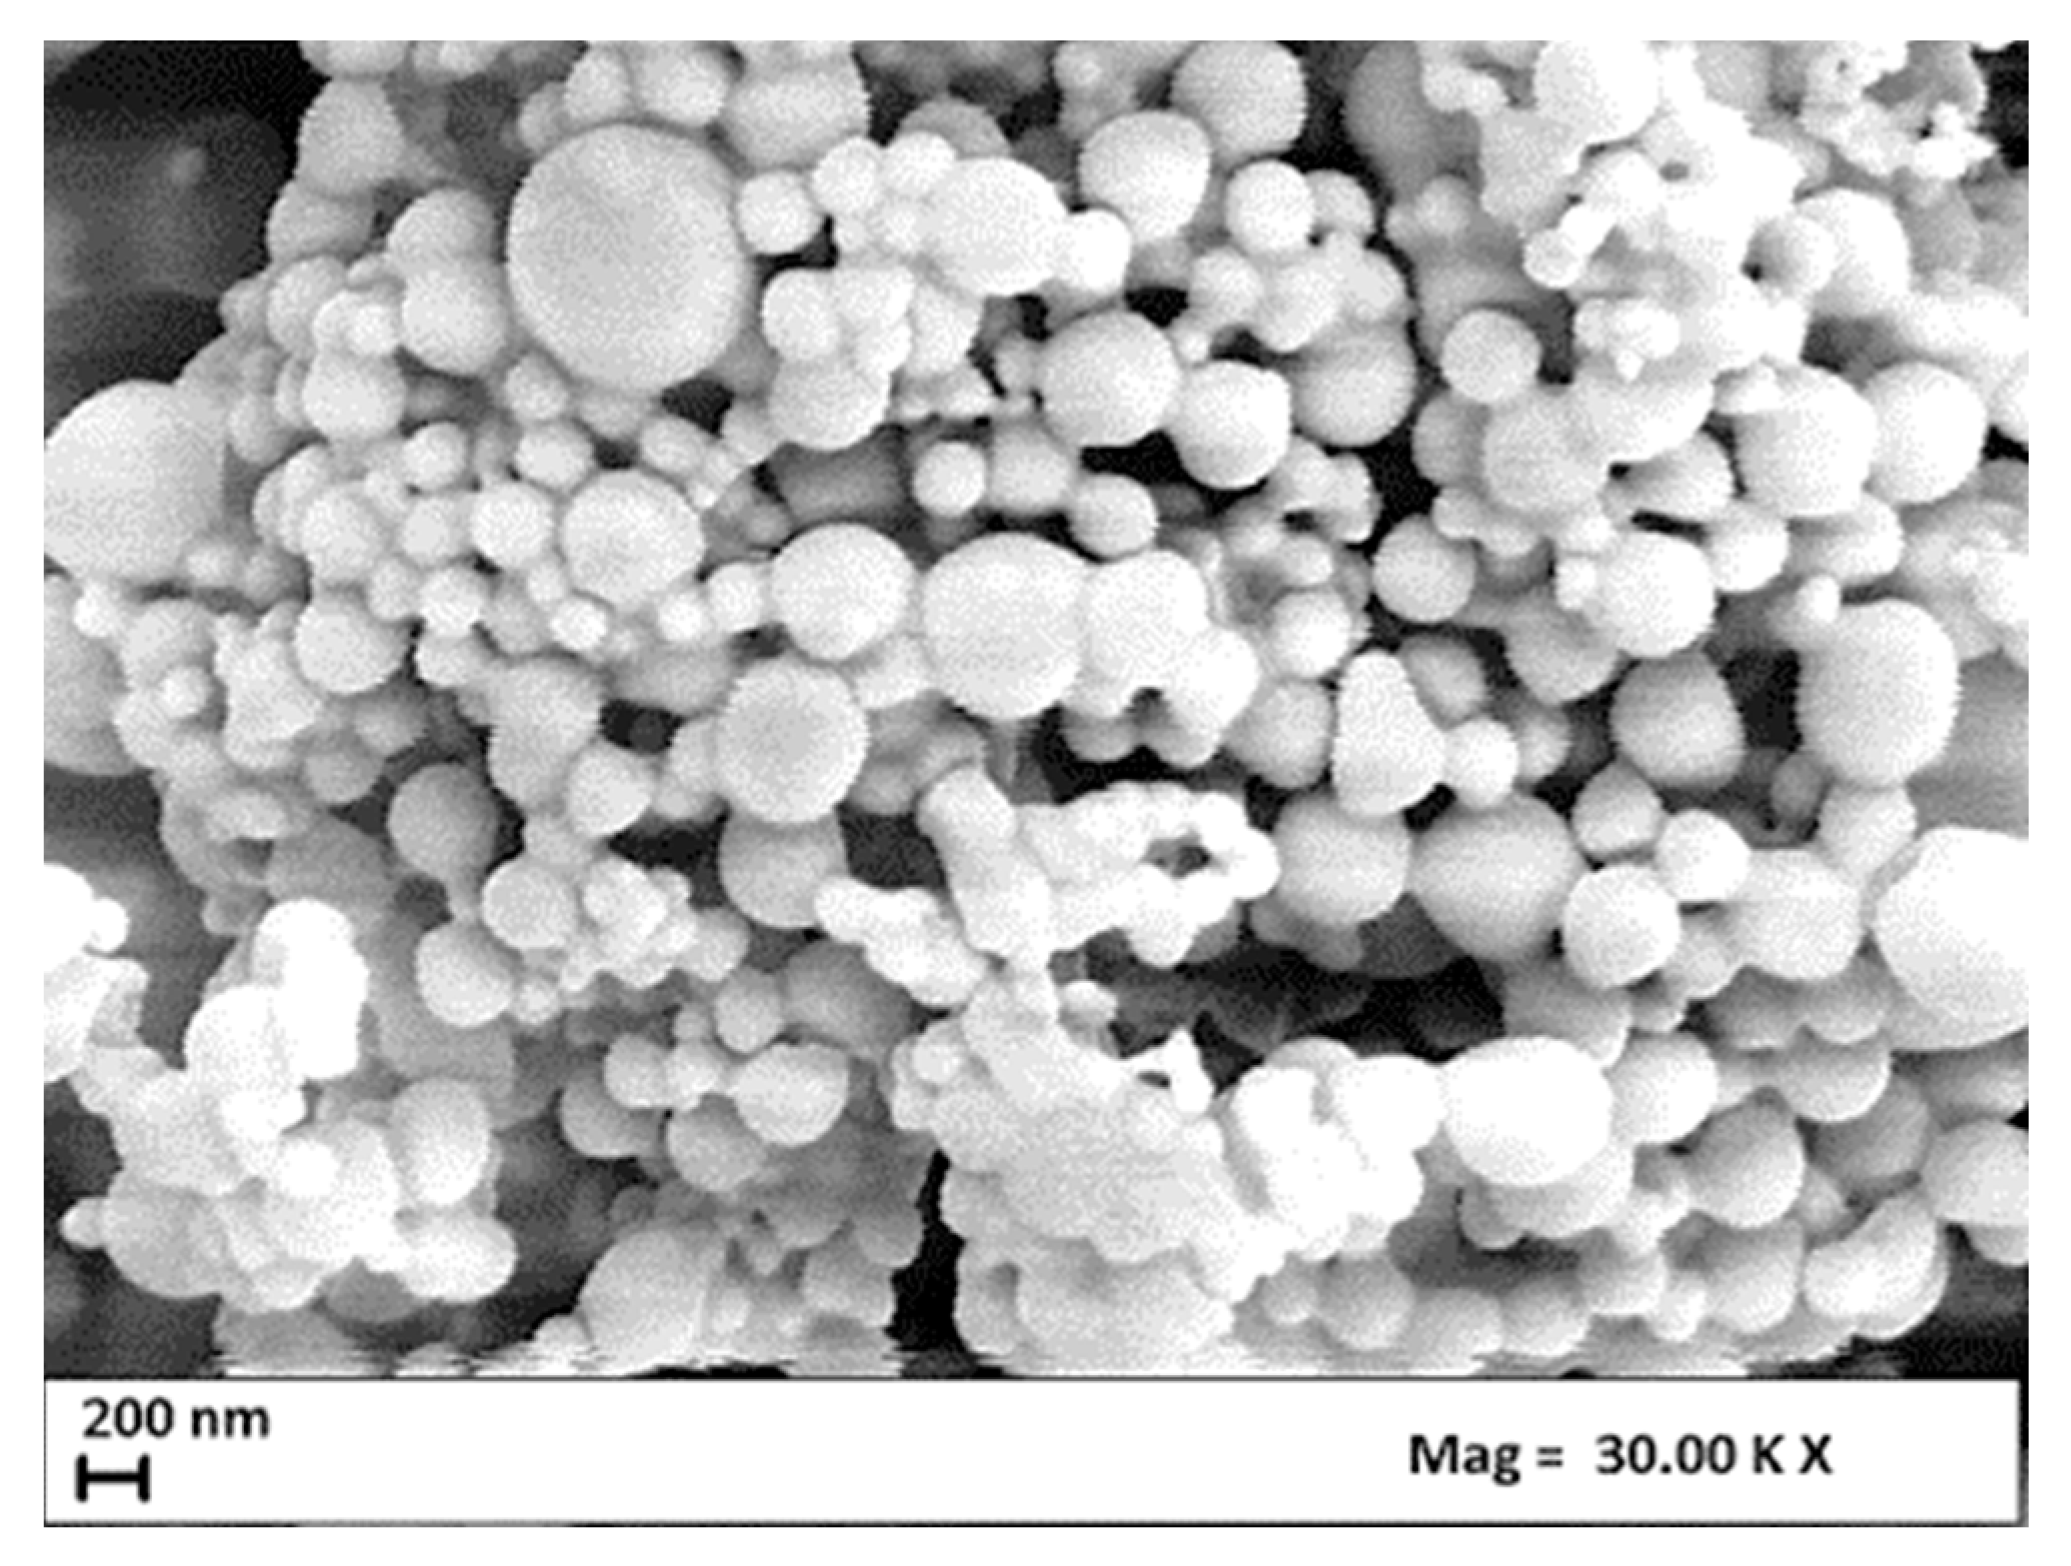
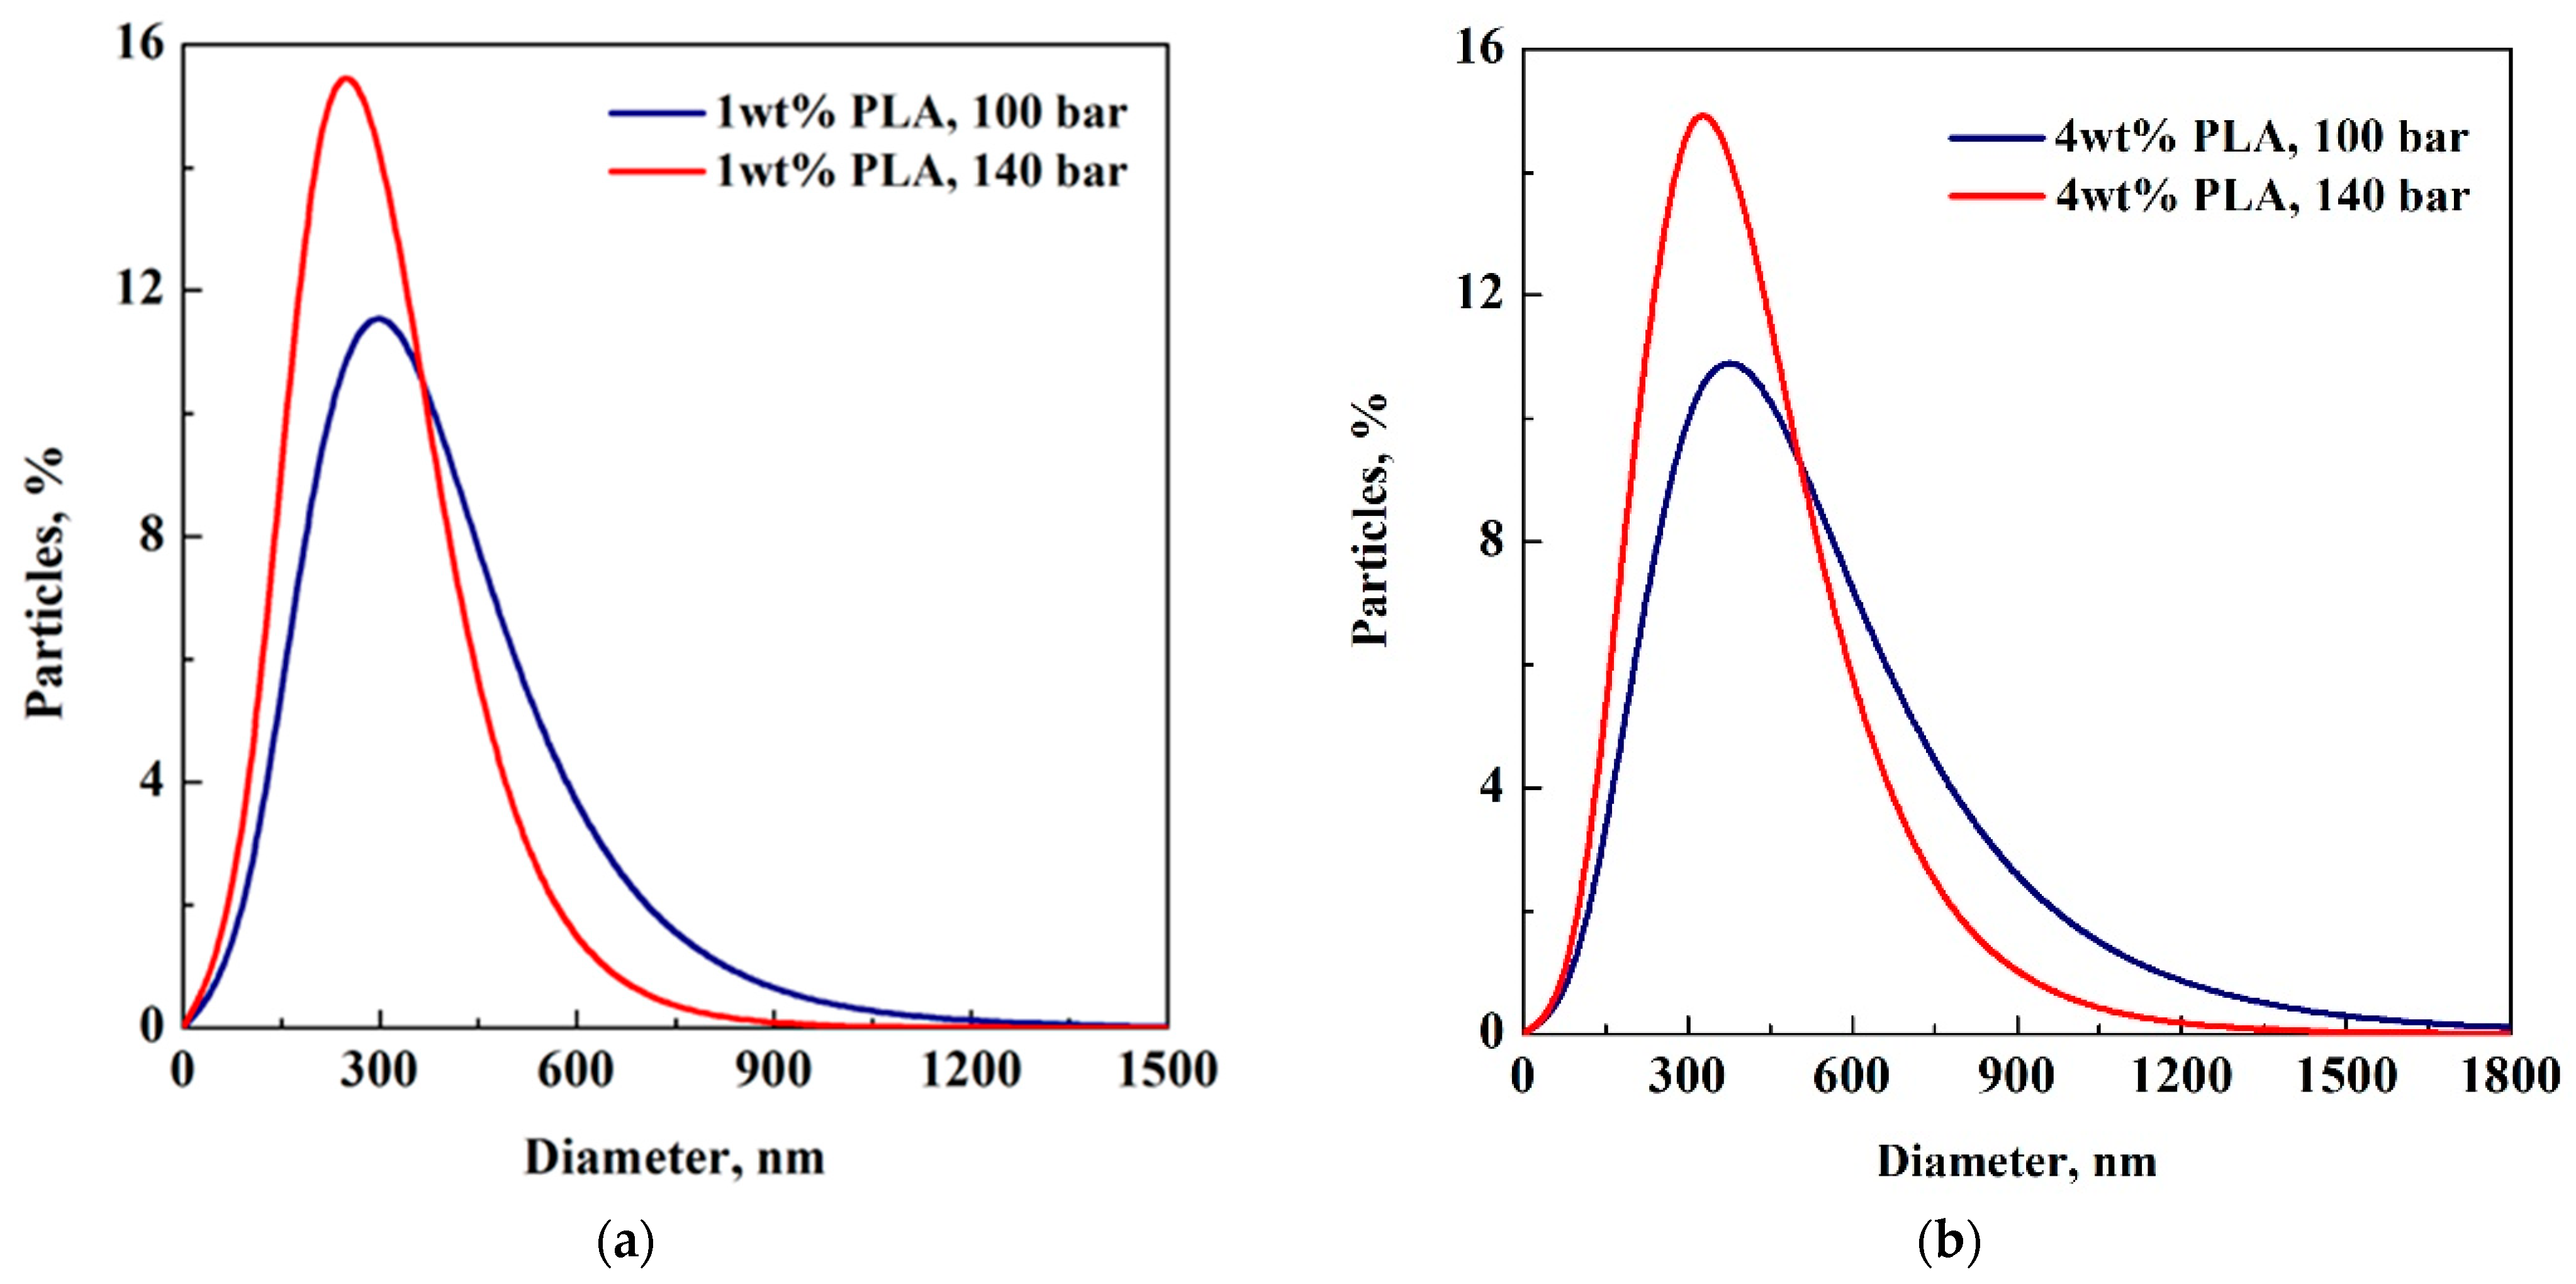
3.1. Effect of PLA Concentration

Different PLA-based solutions were processed (i.e., 1, 2, 3, 4 and 7 wt% PLA) to understand how polymer concentration can affect the final morphology of the produced material and to find the range in which electrospray is able to provide nanometric particles.
The 1, 2, 3, 4 wt% PLA solutions produced nanoparticles at each value of operating pressure (100 and 140 bar) and by fixing the applied voltage at 30 kV. Average particle diameter ranged from 270 ± 70 nm up to 350 ± 110 nm, at 100 bar, and from 250 ± 50 nm to 310 ± 80 nm, at 140 bar, upon the increase in polymer concentration, as reported in Table 1. Particle size distributions (PSDs), obtained at 100 and 140 bar and at different polymer concentrations, are shown in Figure 1.
SEM images of 1 and 4 wt% PLA particles, produced at 100 bar, are reported in Figure 2.
According to Table 1, the standard deviation of particles produced at 100 bar and using 4 wt% of polymer is low (i.e., 100 nm), but in Figure 2b, particles having a mean diameter value so much higher can be clearly observed. This feature can be explained considering that DLS measures several Avogadro numbers of particles meaning that, even though particles of larger size are produced and collected in the final suspension, their amount does not contribute in a relevant way to the final value of average diameter provided by the equipment.
During our previous studies [25,26,27,28], polymer concentration was the key factor in determining particle size that enlarged with a polymer concentration increase; the particle morphology varied from spherical to elongated upon concentration decrease due to the occurrence of the Coulomb fission phenomenon. In this study, instead, only a slight increase in the average particle diameters occurred. Indeed, according to the study carried out by Xu et al. [29], as the PLA concentration increased from 1 up to 4 wt%, the viscosity of PLA solution increased from 37.4 to 38.9 mN m−1, respectively. Therefore, in this case, viscosity did not play a relevant role in controlling the surface wave instability that influences the length of liquid alignment of the jet break-up and, consequently, the size of particles derived from the jet break-up.
It was also observed that the level of aggregation increased with an increase in polymer concentration, as can be seen in Figure 3.
The increase in polymer concentration generally leads to an increase in the time required for solvent evaporation and to longer polymer diffusion kinetics; therefore, the depletion interactions are expected to be stronger for a higher value of the PLA amount.
The 7 wt% PLA solutions produced microparticles and microfibers at both pressures. An example of the coexistence of these two morphologies is reported in Figure 4, where an SEM image of a sample produced at 140 bar and 30 kV is reported.
The simultaneous formation of particles and fibres represent the transition between the two morphologies and, according to the previous studies [26], the increase in cohesive force, due to the increase in polymer concentration, represents the main parameter influencing the transition between droplets and fibre formation in electrohydrodynamic technique. The fibres produced are not homogeneous in size and it is difficult to provide an accurate value of the average diameter due to a partial coalescence of the electrospun products and due to the presence of particles distributed along their length.

3.2. Effect of Pressure

Electrohydrodynamic force reflects the interactions of two orthogonal forces: electrical force and inertial force. According to the literature, the difference between the electrical properties of the liquid jet and the surrounding air creates the driving disruptive force at the interface of the two fluids (air and liquid solution) that is responsible for jet disruption. On the contrary, during our experimentations, the main disruptive force was represented by pressure, due to the addition of CO2 at supercritical conditions; for this reason, this parameter was also investigated.
PSDs of 1 and 4 wt% PLA particles are reported, for example, in Figure 5.
As can be observed in Figure 5, the effect of pressure was not significant in determining the reduction of particles’ average diameters; but, it contributed to promote a sharpening of the PSDs.

3.3. Effect of CFX Loading
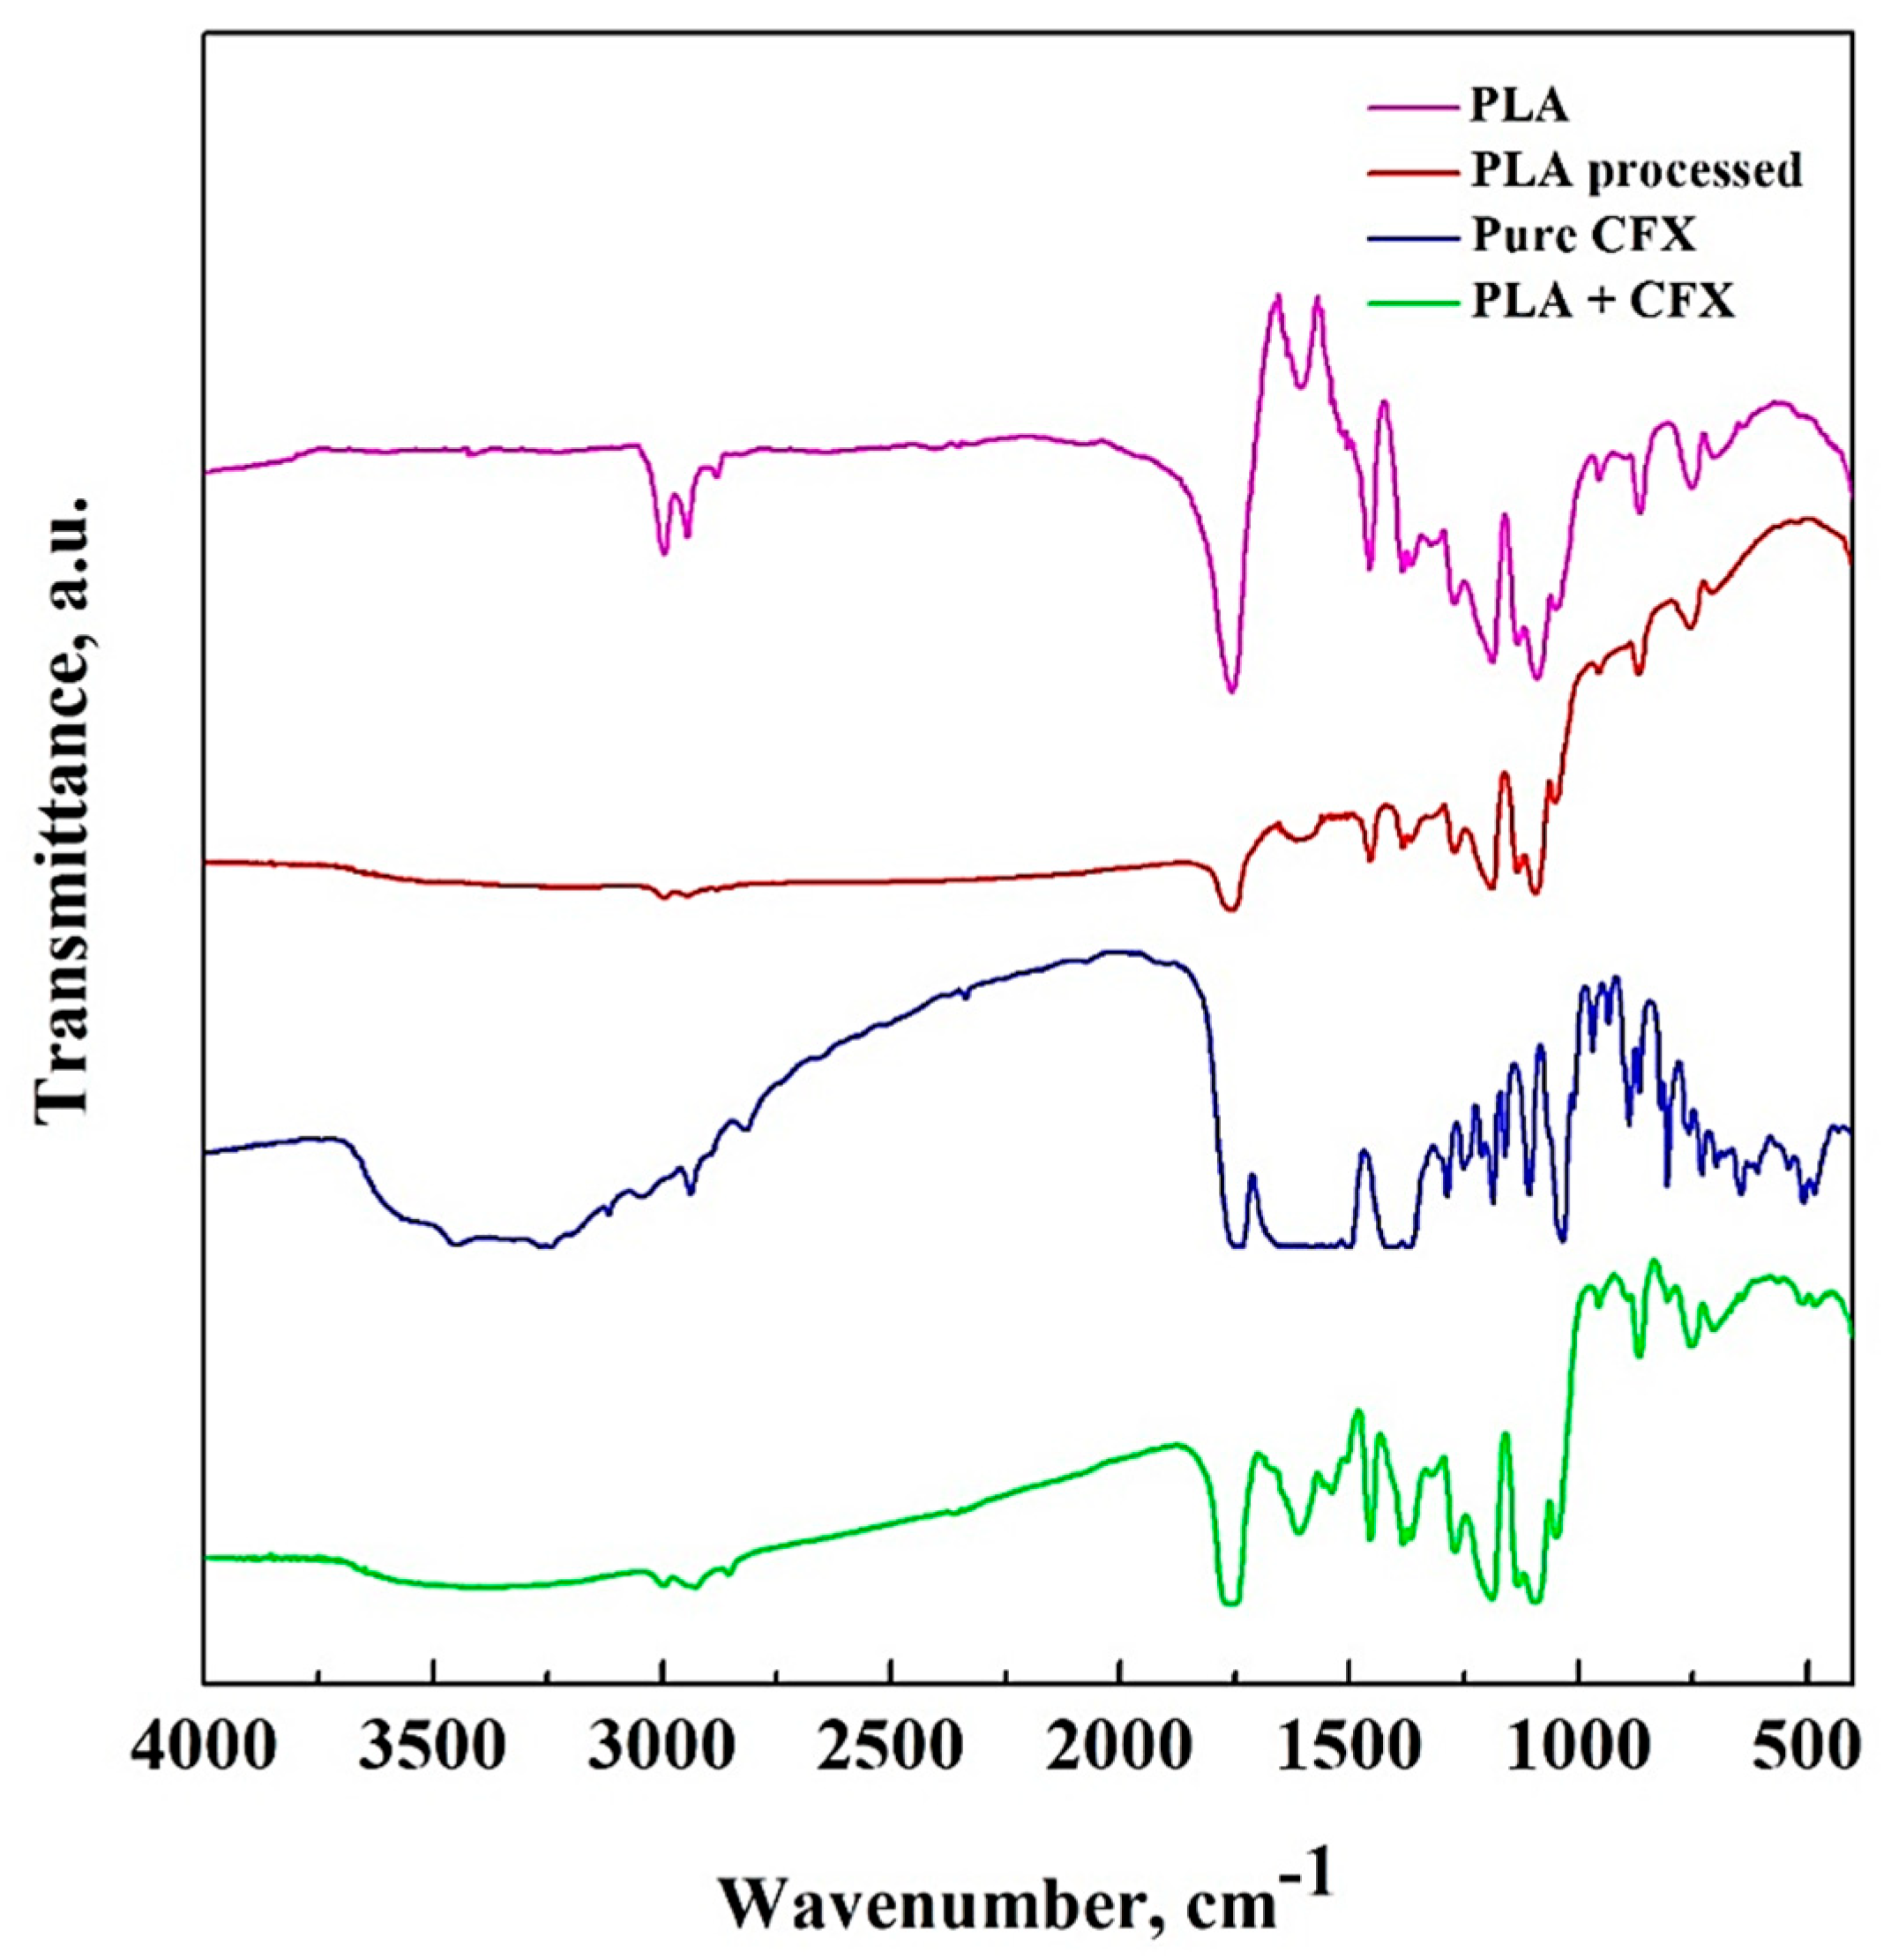
PLA has also been studied for various medical and pharmaceutical applications, like drug-delivery systems, since it is able to guarantee high biocompatibility. In this study, PLA was loaded with ceftriaxone; this is a third-generation semi-synthetic antibiotic belonging to cephalosporines. The resistance to this kind of antibiotic has been increasing in various countries [30], and several authors demonstrated that nanotechnology-based structures can target the drug in a more effective way and can also circumvent drug-resistance mechanisms [31].
In this work, two different drug loadings were used, i.e., 5 and 10 wt% with respect to the polymer amount. Also, in this case, the effect of operating pressure was investigated: the experiments were carried out at 100 and 140 bar. The voltage was kept constant at 30 kV. Moreover, since the average value of particles diameters was almost the same for each tested PLA mass amount, a similar behaviour during CFX release was expected. Therefore, an intermediate value and an extreme value of PLA concentration were tested (i.e., 2 and 4 wt%).
The entrapment of a hydrophilic drug into a hydrophobic system can lead to a reduction in the encapsulation efficiency [22]. Therefore, to enhance the chemical affinity with the hydrophobic polymer and to increase the solubility parameter, a mixture of solvents was used (acetone + water). The 1 wt% CFX was dissolved in water-miscible acetone and upon the addition of 2 and 4 wt% of PLA acetone solution (40 mL) into water, acetone rapidly diffused into the aqueous solution, resulting in the formation of a nanoparticle suspension (Figure 6), that was stirred using the emulsifier for 5 min and stabilized using 0.25 wt% Span 80 in the oil phase.
Then, the emulsified solution underwent the SC-CO2 electrospray micronization process to remove the solvents used as polymer and drug carrier, and, at the end of the experimentation, a suspension in the liquid collector was still obtained. To perform CFX release tests, the suspension was dried, and two different methods were tested: vacuum filtration and lyophilization (see Figure 7).
In Figure 7a, it is possible to observe the formation of interconnected particles: this means that liquid bridges were formed between particles and they led to an increase in the pressure drop during filtration, resulting in a long-time consuming process; on the other hand, lyophilization was a more effective process and the morphology of the produced particles was maintained after the drying step (Figure 7b).
Also, in this case, the average particle diameters were measured using DLS to understand the effect of drug loading on the final particles’ morphology; the results are summarized in Table 2.
The average diameters of the composite particles (PLA + CFX) were smaller than PLA-only-based particles. This result could be explained considering that the processed solution was subjected to a high shear forces that affected the viscosity, causing its decrease. Furthermore, it should be considered that the system proceeded towards a dilution, since water-soluble acetone, used to dissolve CFX, was added to the PLA + acetone system [29]. Consequently, the processed solution was characterized by reduced values of the forces related to viscosity and surface tension, and the applied disruptive forces caused the jet to break up into smaller particles.
An ideal pharmacokinetic process is represented by zero-order release kinetic profiles that can describe the systems in which the drug release kinetic is constant over time. Drug release tests obtained during this experimentation are synthetically reported in Figure 8.
The CFX dissolution took place in the PBS solution in the first 5 min. According to the US Pharmacopeion standards, the drug must not exceed 10% in the first 30 min [32]. For this reason, CFX was loaded into PLA-based matrix to provide a sustained drug release pattern. Indeed, in the PLA-based matrix, CFX was completely released up to a maximum of 1200 min (Figure 8): the release kinetic was slowed down to 240 times compared to pure CFX. Moreover, to overcome the burst effect limitations related to the kinetic release of pure CFX, and still recorded when 2 wt% of polymer was used in the oil phase, the PLA concentration was increased up to 4 wt%. The CFX amount in the water phase was kept constant; as a consequence, the parameter “drug:polymer” ratio was varied from 1:20, using 2 wt% PLA, down to 1:10, using 4 wt% PLA. Moreover, for the same PLA amount, the pressure effect was also investigated: the average particle diameter ranged from 240 ± 40 nm (100 bar) down to 190 ± 30 nm (140 bar), and from the first 400 min of release, it became clear that particles characterized by higher surface area (green squares in Figure 8) more efficiently contributed to the slowdown of CFX release with respect to those obtained working at 140 bar (violet squares).
To deeply understand the CFX release mechanism from PLA nanoparticles, it is possible to consider the main steps involved in the PLA degradation mechanism (reported in Figure 9).
The mass transport mechanisms involved include water penetration into the systems, polymer chain cleavage, drug dissolution, and polymer erosion. The water imbibition leads to polymer swelling that represents the reason why an initial faster release rate is observed. Then, after a certain time of water uptake, the cleaving of the ester bonds occurs, leading to a reduction of polymer molecular weight and, during this phase, a constant drug release is obtained (from 100 up to 400 min of violet and green lines reported in Figure 8). Upon the cleaving, the newly created -COOH groups and the increased osmotic pressure make the PLA chain more hydrophilic, allowing substantial amounts of water to enter the system. In this way, a faster drug release is recorded again (see the last minutes of violet and green lines reported in Figure 8). It is possible to claim that the former PLA degradation mechanism is critical for the controlled drug release, i.e., the cleavage of PLA ester bonds generally affects the rate of polymer matrix swelling and the subsequent drug diffusion. However, this mechanism does not reflect the drug behaviour release of 2%w/w PLA particles (red and blue lines reported in Figure 8): in this case, CFX was not efficiently entrapped into the polymeric matrix after SC-CO2-assisted electrospray; therefore, CFX was distributed on the external surface of polymeric particles, and it was completely released in the external medium before PLA degradation took place.

3.4. FT-IR Analysis

FT-IR spectra of before and after processing PLA and 4 wt% CFX-loaded PLA particles are reported in Figure 10.
The PLA spectrum shows bands at 1750 cm−1 that can be attributed to the groups C=O, and at about 3000 cm−1, corresponding to the hydroxyl groups (-OH) of the carboxylic function (-COOH). The spectrum of the processed PLA shows the characteristic bands of the polymer: the process did not affect the chemical structure of the polymer. Indeed, it is possible to observe the characteristic absorption bands at 1750 and 1079–1189 cm−1 that correspond to the stretching vibrations of the groups C=O and CO of PLA; the bending and stretching movements of the CH groups of the PLA are recorded at 1470 cm−1 [33]. The FT-IR spectrum of CFX has characteristic peaks at about 3500 cm−1, at 1740 cm−1 and at about 1500 cm−1, attributed to the stretching of the N-H bond of the amide group, of the C=O group and to the vibration of the C=N bond, respectively [34,35]. The characteristic bands related to the vibrations of CFX are also visible in the PLA spectrum loaded with CFX. This result confirmed the presence of the antibiotic (CFX) in the nanoparticles obtained downstream of the electrospray process assisted by SC-CO2.

3.5. Solvent Residue Analysis

Before carrying out the analysis of solvent residue related to the sample produced, the calibration curve of the mixture ‘acetone + water’ was evaluated using the GC, and it is reported below:
A r e a = 2.21   C o n c
Then, 100 mg of the produced samples and 3 mL of distilled water were placed in 22 mL vials. The results of the analysis showed a retention time located at 9.50 min; therefore, the areas under the curves and the referred normalized concentrations were evaluated providing the results reported in Table 3.

4. Conclusions

PLA- and CFX-loaded PLA nanoparticles were successfully produced at each value of pressure tested in this work. Loaded particles underwent high shear forces during the emulsification and they contributed to a reduction of solution viscosity and, consequently, to lower particle diameters. The increase in operating pressure contributed only to a sharpening of PSDs. Moreover, the incorporation of CFX into the PLA matrix provided a drug release slowed down to 1200 min (240 times with respect to pure CFX) and gas chromatography analysis showed that the acetone concentration was highly below the limit to be respected for pharmaceutical applications of these drug-delivery systems.

Author Contributions

Conceptualization, M.G. and E.R.; methodology, M.G. and E.R.; validation, L.B., S.C. and E.R.; formal analysis, M.G.; investigation, M.G.; resources, E.R.; writing—original draft preparation, L.B., S.C., M.G. and E.R.; writing—review and editing, L.B., S.C., M.G. and E.R.; supervision, E.R. All authors have read and agreed to the published version of the manuscript.

Funding

This research received no external funding.

Data Availability Statement

Data will be made available upon request.

Acknowledgments

The authors thank Gioacchino Pizzani for his help provided during the development of his Master Thesis in Chemical Engineering at the Department of Industrial Engineering, University of Salerno.

Conflicts of Interest

The authors declare no conflict of interest.

References

  1. Kianfar, E. Magnetic Nanoparticles in Targeted Drug Delivery: A Review. J. Supercond. Nov. Magn. 2021, 34, 1709–1735. [Google Scholar] [CrossRef]
  2. Liu, Y.L.; Chen, D.; Shang, P.; Yin, D.C. A Review of Magnet Systems for Targeted Drug Delivery. J. Control. Release 2019, 302, 90–104. [Google Scholar] [CrossRef] [PubMed]
  3. Salahpour Anarjan, F. Active Targeting Drug Delivery Nanocarriers: Ligands. Nano-Struct. Nano-Objects 2019, 19, 100370. [Google Scholar] [CrossRef]
  4. Do Amorim Costa Gaspar, L.M.; Dórea, A.C.S.; Droppa-Almeida, D.; de Mélo Silva, I.S.; Montoro, F.E.; Alves, L.L.; Macedo, M.L.H.; Padilha, F.F. Development and Characterization of PLGA Nanoparticles Containing Antibiotics. J. Nanopart. Res. 2018, 20, 289. [Google Scholar] [CrossRef]
  5. Arana, L.; Gallego, L.; Alkorta, I. Incorporation of Antibiotics into Solid Lipid Nanoparticles: A Promising Approach to Reduce Antibiotic Resistance Emergence. Nanomaterials 2021, 11, 1251. [Google Scholar] [CrossRef] [PubMed]
  6. Brigger, I.; Dubernet, C.; Couvreur, P. Nanoparticles in Cancer Therapy and Diagnosis. Adv. Drug Deliv. Rev. 2012, 64, 24–36. [Google Scholar] [CrossRef]
  7. Bhattacharya, D.; Saha, B.; Mukherjee, A.; Ranjan Santra, C.; Karmakar, P. Gold Nanoparticles Conjugated Antibiotics: Stability and Functional Evaluation. Nanosci. Nanotechnol. 2012, 2, 14–21. [Google Scholar] [CrossRef]
  8. Endres, H.-J.; Siebert-Raths, A. Engineering Biopolymers: Markets, Manufacturing, Properties, and Applications; Hanser Publishers: Cincinnati, OH, USA, 2011; ISBN 1569904618. [Google Scholar]
  9. Doppalapudi, S.; Jain, A.; Khan, W.; Domb, A.J. Biodegradable Polymers—An Overview. Polym. Adv. Technol. 2014, 25, 427–435. [Google Scholar] [CrossRef]
  10. Kamaly, N.; Yameen, B.; Wu, J.; Farokhzad, O.C. Degradable Controlled-Release Polymers and Polymeric Nanoparticles: Mechanisms of Controlling Drug Release. Chem. Rev. 2016, 116, 2602–2663. [Google Scholar] [CrossRef]
  11. Ding, C.; Li, Z. A Review of Drug Release Mechanisms from Nanocarrier Systems. Mater. Sci. Eng. C 2017, 76, 1440–1453. [Google Scholar] [CrossRef]
  12. Alexis, F. Factors Affecting the Degradation and Drug-Release Mechanism of Poly(Lactic Acid) and Poly[(Lactic Acid)-Co-(Glycolic Acid)]. Polym. Int. 2005, 54, 36–46. [Google Scholar] [CrossRef]
  13. Stipa, P.; Marano, S.; Galeazzi, R.; Minnelli, C.; Mobbili, G.; Laudadio, E. Prediction of Drug-Carrier Interactions of PLA and PLGA Drug-Loaded Nanoparticles by Molecular Dynamics Simulations. Eur. Polym. J. 2021, 147, 110292. [Google Scholar] [CrossRef]
  14. Grayson, A.C.R.; Voskerician, G.; Lynn, A.; Anderson, J.M.; Cima, M.J.; Langer, R. Differential Degradation Rates In Vivo and In Vitro of Biocompatible Poly(Lactic Acid) and Poly(Glycolic Acid) Homo- and Co-Polymers for Polymeric Drug-Delivery Microchip. J. Biomater. Sci. Polym. Ed. 2004, 15, 1281–1304. [Google Scholar] [CrossRef] [PubMed]
  15. Makadia, H.K.; Siegel, S.J. Poly Lactic-Co-Glycolic Acid (PLGA) as Biodegradable Controlled Drug Delivery Carrier. Polymers 2011, 3, 1377–1397. [Google Scholar] [CrossRef] [PubMed]
  16. Buhecha, M.D.; Lansley, A.B.; Somavarapu, S.; Pannala, A.S. Development and Characterization of PLA Nanoparticles for Pulmonary Drug Delivery: Co-Encapsulation of Theophylline and Budesonide, a Hydrophilic and Lipophilic Drug. J. Drug Deliv. Sci. Technol. 2019, 53, 101128. [Google Scholar] [CrossRef]
  17. Xia, H.; Gao, X.; Gu, G.; Liu, Z.; Hu, Q.; Tu, Y.; Song, Q.; Yao, L.; Pang, Z.; Jiang, X.; et al. Penetratin-Functionalized PEG-PLA Nanoparticles for Brain Drug Delivery. Int. J. Pharm. 2012, 436, 840–850. [Google Scholar] [CrossRef] [PubMed]
  18. Hu, Q.; Gu, G.; Liu, Z.; Jiang, M.; Kang, T.; Miao, D.; Tu, Y.; Pang, Z.; Song, Q.; Yao, L.; et al. F3 Peptide-Functionalized PEG-PLA Nanoparticles Co-Administrated with TLyp-1 Peptide for Anti-Glioma Drug Delivery. Biomaterials 2013, 34, 1135–1145. [Google Scholar] [CrossRef] [PubMed]
  19. Hao, S.; Wang, Y.; Wang, B.; Deng, J.; Liu, X.; Liu, J. Rapid Preparation of PH-Sensitive Polymeric Nanoparticle with High Loading Capacity Using Electrospray for Oral Drug Delivery. Mater. Sci. Eng. C 2013, 33, 4562–4567. [Google Scholar] [CrossRef]
  20. Zhang, S.; Kawakami, K. One-Step Preparation of Chitosan Solid Nanoparticles by Electrospray Deposition. Int. J. Pharm. 2010, 397, 211–217. [Google Scholar] [CrossRef]
  21. Chen, J.; Cao, L.; Cui, Y.; Tu, K.; Wang, H.; Wang, L.Q. The Exploration of Endocytic Mechanisms of PLA-PEG Nanoparticles Prepared by Coaxialtri-Capillary Electrospray-Template Removal Method. Colloids Surf. B Biointerfaces 2018, 161, 10–17. [Google Scholar] [CrossRef]
  22. Ghaffarzadegan, R.; Khoee, S.; Rezazadeh, S. Fabrication, Characterization and Optimization of Berberine-Loaded PLA Nanoparticles Using Coaxial Electrospray for Sustained Drug Release. DARU J. Pharm. Sci. 2020, 28, 237–252. [Google Scholar] [CrossRef] [PubMed]
  23. Tasci, M.E.; Dede, B.; Tabak, E.; Gur, A.; Sulutas, R.B.; Cesur, S.; Ilhan, E.; Lin, C.-C.; Paik, P.; Ficai, D.; et al. Production, Optimization and Characterization of Polylactic Acid Microparticles Using Electrospray with Porous Structure. Appl. Sci. 2021, 11, 5090. [Google Scholar] [CrossRef]
  24. Mai, Z.; Chen, J.; He, T.; Hu, Y.; Dong, X.; Zhang, H.; Huang, W.; Ko, F.; Zhou, W. Electrospray Biodegradable Microcapsules Loaded with Curcumin for Drug Delivery Systems with High Bioactivity. RSC Adv. 2017, 7, 1724–1734. [Google Scholar] [CrossRef]
  25. Guastaferro, M.; Baldino, L.; Cardea, S.; Reverchon, E. Supercritical CO2 Assisted Electrospray of PVP-Rutin Mixtures Using a Liquid Collector. J. Supercrit. Fluids 2022, 188, 105684. [Google Scholar] [CrossRef]
  26. Guastaferro, M.; Baldino, L.; Cardea, S.; Reverchon, E. Supercritical Assisted Electrospray/Spinning to Produce PVP+quercetin Microparticles and Microfibers. J. Taiwan Inst. Chem. Eng. 2020, 117, 278–286. [Google Scholar] [CrossRef]
  27. Barbero-Colmenar, E.; Guastaferro, M.; Baldino, L.; Cardea, S.; Reverchon, E. Supercritical CO2 Assisted Electrospray to Produce Poly(lactic-co-glycolic Acid) Nanoparticles. ChemEngineering 2022, 6, 66. [Google Scholar] [CrossRef]
  28. Guastaferro, M.; Cardea, S.; Baldino, L.; Reverchon, E. Supercritical-CO2 Assisted Electrospray to Produce Cellulose Acetate+Rutin Micro-Carriers. Chem. Eng. Trans. 2022, 93, 109–114. [Google Scholar] [CrossRef]
  29. Xu, X.; Chen, X.; Wang, Z.; Jing, X. Ultrafine PEG–PLA fibers loaded with both paclitaxel and doxorubicin hydrochloride and their in vitro cytotoxicity. Eur. J. Pharm. Biopharm. 2009, 72, 18–25. [Google Scholar] [CrossRef]
  30. Tewabe, A.; Marew, T.; Birhanu, G. The Contribution of Nano-Based Strategies in Overcoming Ceftriaxone Resistance: A Literature Review. Pharmacol. Res. Perspect. 2021, 9, e00849. [Google Scholar] [CrossRef]
  31. Baptista, P.V.; McCusker, M.P.; Carvalho, A.; Ferreira, D.A.; Mohan, N.M.; Martins, M.; Fernandes, A.R. Nano-Strategies to Fight Multidrug Resistant Bacteria—“A Battle of the Titans”. Front. Microbiol. 2018, 9, 1441. [Google Scholar] [CrossRef]
  32. Gull, N.; Khan, S.M.; Zahid Butt, M.T.; Khalid, S.; Shafiq, M.; Islam, A.; Asim, S.; Hafeez, S.; Khan, R.U. In Vitro Study of Chitosan-Based Multi-Responsive Hydrogels as Drug Release Vehicles: A Preclinical Study. RSC Adv. 2019, 9, 31078–31091. [Google Scholar] [CrossRef]
  33. Hong, S.-H.; Park, J.H.; Kim, O.Y.; Hwang, S.-H. Preparation of Chemically Modified Lignin-Reinforced PLA Biocomposites and Their 3D Printing Performance. Polymers 2021, 13, 667. [Google Scholar] [CrossRef]
  34. Mahmoud, M.E.; El-Ghanam, A.M.; Mohamed, R.H.A.; Saad, S.R. Enhanced Adsorption of Levofloxacin and Ceftriaxone Antibiotics from Water by Assembled Composite of Nanotitanium Oxide/Chitosan/Nano-Bentonite. Mater. Sci. Eng. C 2020, 108, 110199. [Google Scholar] [CrossRef] [PubMed]
  35. Antolín, E.M.; Quiñónez, Y.B.; Canavaciolo, V.G.; Cruz, E.R. Validation of an Analytical Method for Quality Control of Residual Solvents (n-Hexane and Acetone) in D-002: New Active Ingredient from Beeswax. J. Pharm. Biomed. Anal. 2008, 47, 646–650. [Google Scholar] [CrossRef]
Figure 1. Particle size distributions of 1, 2, 3, 4 wt% of PLA particles produced at 100 bar (a) and 140 bar (b).
Processes 11 02957 g001
Figure 2. FESEM images of 1 wt% PLA particles (a) and 4 wt% PLA particles (b).
Processes 11 02957 g002
Figure 3. FESEM image of 3 wt% PLA particles produced at 140 bar.
Processes 11 02957 g003
Figure 4. FESEM image of 7 wt% PLA sample obtained at 140 bar.
Processes 11 02957 g004
Figure 5. Particle size distributions of PLA particles produced at 100 and 140 bar, using 1 wt% PLA (a) and 4 wt% PLA (b).
Processes 11 02957 g005
Figure 6. Optical microscope image of the emulsion obtained.
Processes 11 02957 g006
Figure 7. FESEM images of PLA particles after under-vacuum filtration (a) and lyophilization (b) (pressure = 100 bar, 4 wt% of PLA and 5 wt% of CFX with respect to the PLA amount).
Processes 11 02957 g007
Figure 8. Drug release tests of pure CFX and CFX-loaded PLA particles.
Processes 11 02957 g008
Figure 9. Possible steps involved in PLA degradation mechanism (black lines indicate the polymeric chains, red crosses indicate the points of chain breakage and green dots indicate the drug diffusing across the polymeric chains after breakage).
Processes 11 02957 g009
Figure 10. FT-IR spectra of PLA before process (pink line), PLA after process (red line), pure CFX (blue line) and PLA + CFX particles (green line).
Processes 11 02957 g010
Table 1. Average diameter of PLA particles.
Concentration PLA, wt%Average Diameter, nm
P = 100 bar
Average Diameter, nm
P = 140 bar
1270 ± 70250 ± 50
2310 ± 70290 ± 80
3330 ± 100290 ± 90
4350 ± 110310 ± 80
Table 2. Average diameter of CFX loaded PLA particles.
Concentration PLA, wt%MorphologyAverage Diameter, nm
P = 100 bar
Average Diameter, nm
P = 140 bar
2 (CFX/PLA = 10 wt%)P210 ± 40180 ± 30
4 (CFX/PLA = 5 wt%)P240 ± 40190 ± 30
P = particles.
Table 3. Results of solvent residue analysis.
SampleConcentration, ppm
3 wt% PLA_100 bar
(Particles)
422
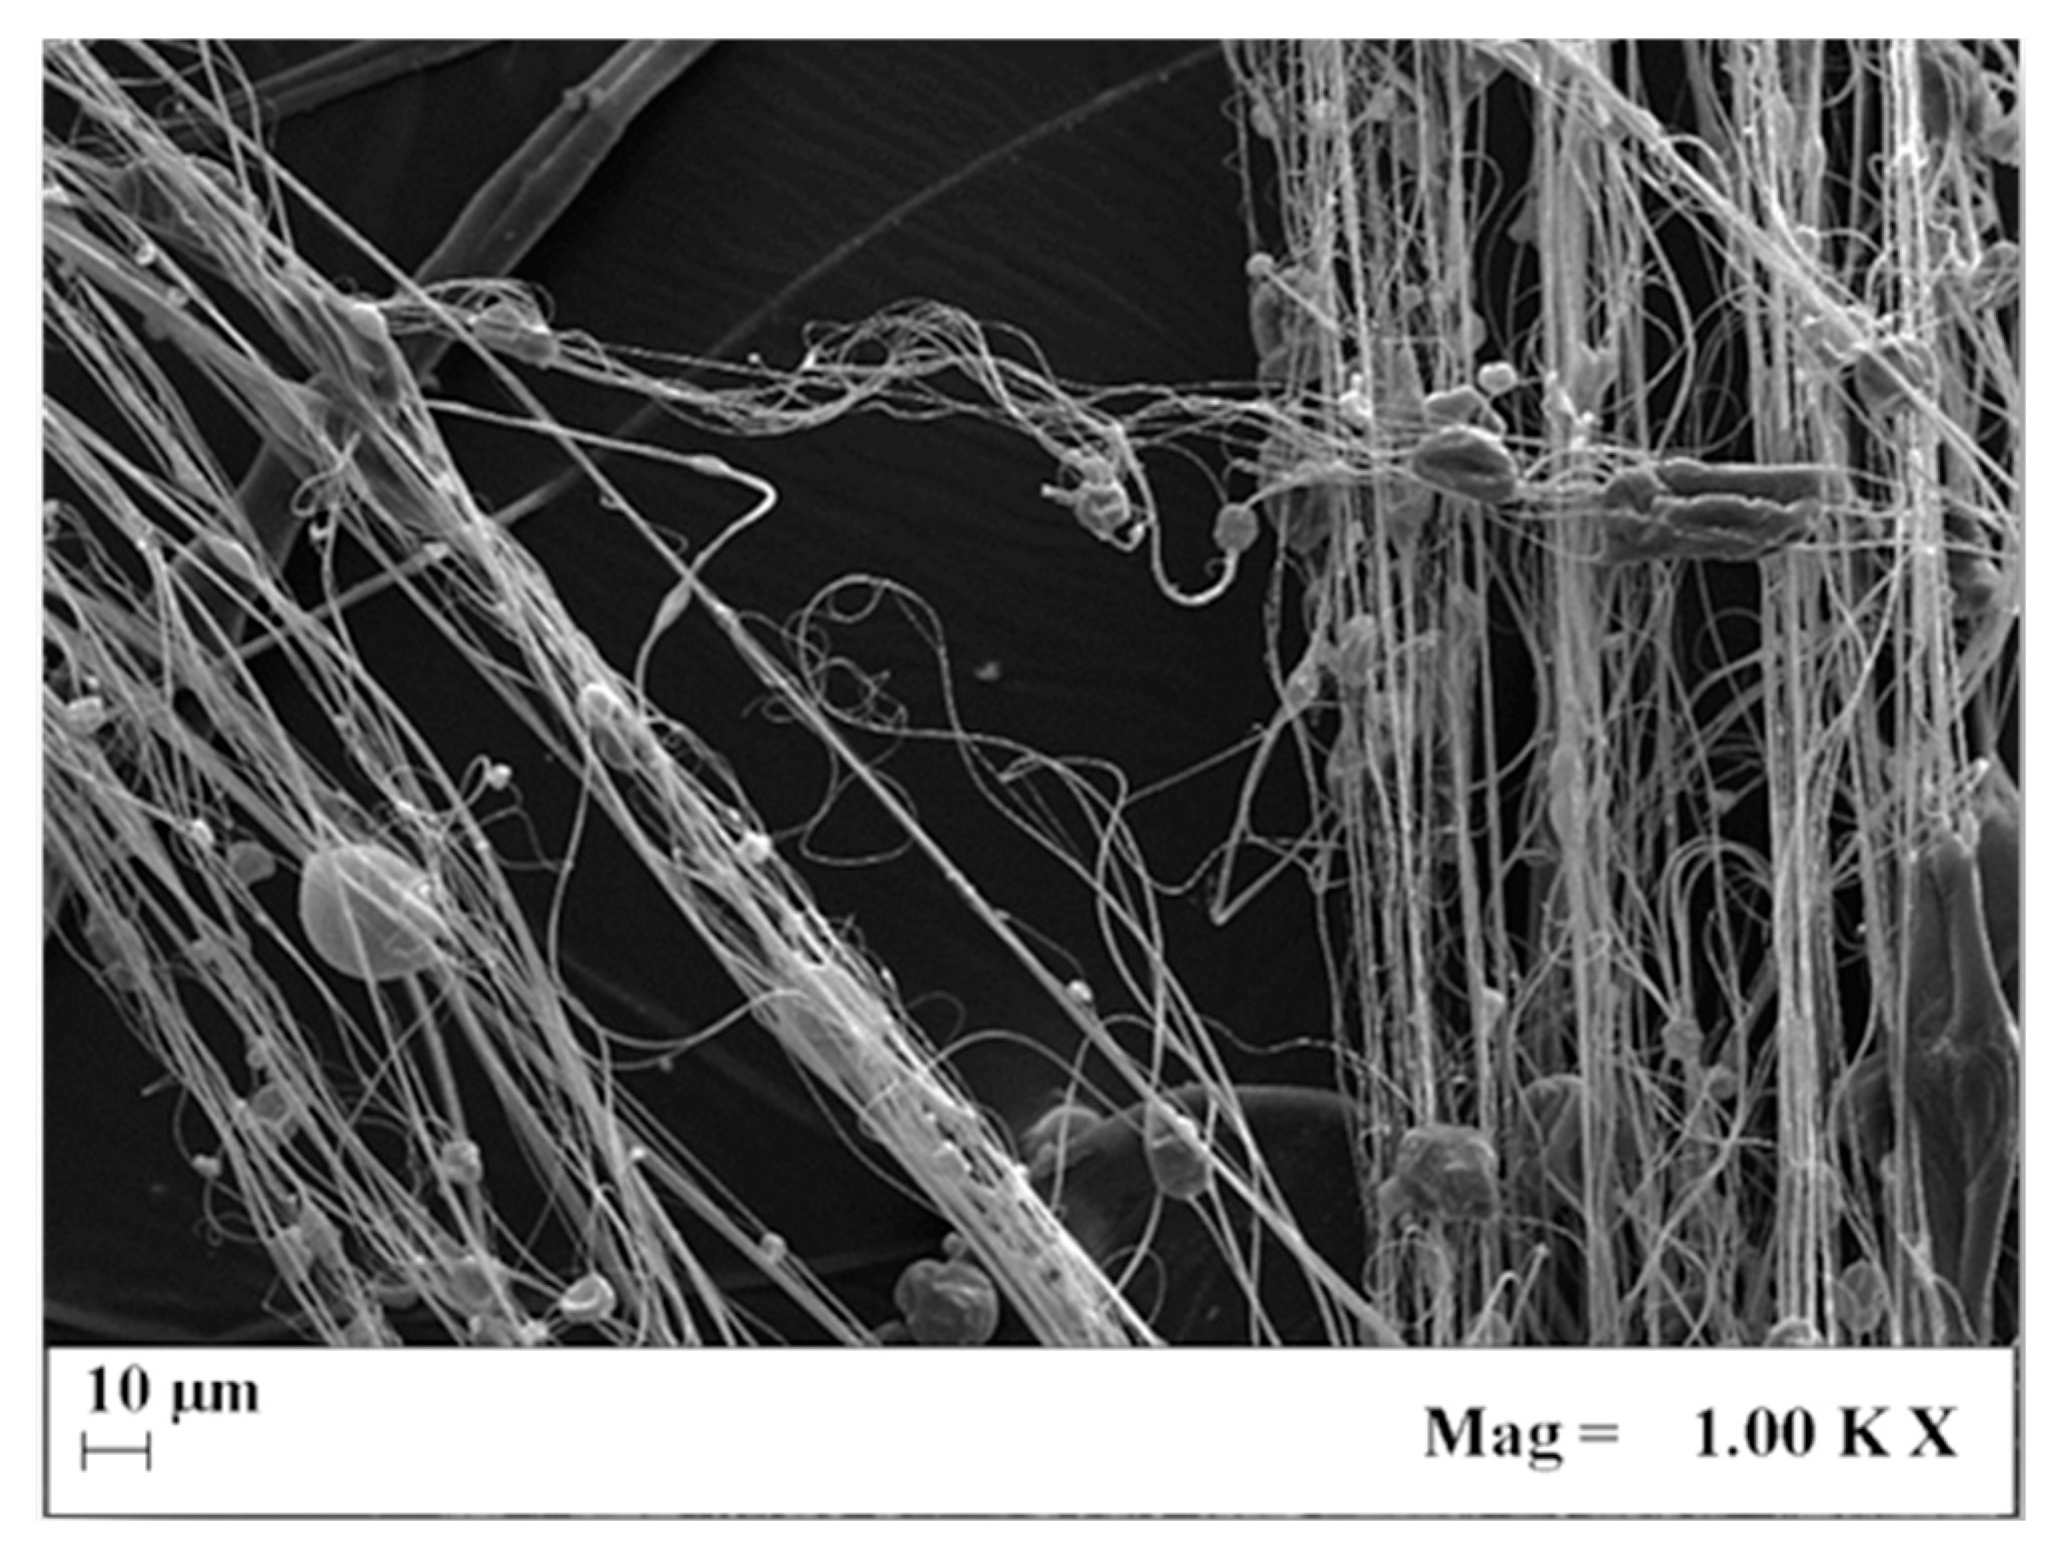
7 wt% PLA_100 bar
(Particles and Fibers)
300
Disclaimer/Publisher’s Note: The statements, opinions and data contained in all publications are solely those of the individual author(s) and contributor(s) and not of MDPI and/or the editor(s). MDPI and/or the editor(s) disclaim responsibility for any injury to people or property resulting from any ideas, methods, instructions or products referred to in the content.

