Article

Transport of Steam-Gas Mixture in Hydrodynamic Devices: A Numerical Study of Steam Reforming of Methane

by
Galymzhan Mamytbekov
1,*,
Nurlan Shayakhmetov
1,
Daniar Aizhulov
2,
Maksat Kurmanseiit
1 and
Madina Tungatarova
3,*
1
Institute of Nuclear Physics, Almaty 050032, Kazakhstan
2
Department of Software Engineering, Satbayev University, Almaty 050013, Kazakhstan
3
Department of Mechanical Engineering, Satbayev University, Almaty 050013, Kazakhstan
*
Authors to whom correspondence should be addressed.
Processes 2023, 11(10), 2991; https://doi.org/10.3390/pr11102991
Submission received: 3 October 2023 / Revised: 11 October 2023 / Accepted: 13 October 2023 / Published: 17 October 2023

Abstract

:
The paper introduces a mathematical model that describes the cavitation process occurring during the passage of a water steam flow in various geometric configurations of a hydrodynamic device. The flow experiences a localized constriction (convergent nozzle) followed by expansion (divergent nozzle), exemplified by a Venturi tube or a Laval nozzle. A narrow flow channel connecting the convergent and divergent sections is equipped with a narrow-section nozzle for injecting methane molecules into the high-speed steam flow. As the steam-gas mixture passes through this zone, it is irradiated with an electron beam and sprayed into a cylindrical chamber at atmospheric pressure, where the distribution of methane molecules in water vapor forms an aerosol. Key geometric parameters of the constriction and expansion zones of the hydraulic system (cavitation-jet chamber) are determined to ensure the uniform distribution of dispersed-phase particles (methane) in the dispersion medium (water vapor). Velocity and pressure distributions of the mixed steam-gas flow are calculated using a turbulent mathematical model, specifically the k-ω model, while the motion of methane particles is simulated using a particle tracing method. The uniformity of methane molecule distribution in water vapor is assessed using Ripley’s K-function. The best performance of the hydrogen-producing chamber was observed when the cavitation-inducing nozzle’s convergence angle exceeded 50 degrees. The divergence angle of the nozzle within the range of 30–40 degrees provided the best distribution in terms of uniformity of the methane particles in the chamber.

1. Introduction

In light of the global trend of decarbonizing economies with a gradual transition to renewable energy sources and addressing global temperature rise, the development of hydrogen energy has become particularly relevant as a new energy source for the 21st century. Consequently, the research into efficient and cost-effective methods for industrial production has gained significant importance. However, hydrogen itself is not a tool for decarbonizing global energy and the economy of the future, but as an intermediate energy carrier, it can be used in various industries, energy, and transport to eliminate the polluting effects of greenhouse and exhaust gases on the environment. Numerous technological processes around the world pose a significant challenge when it comes to electrification, as they require alternative fuel sources to replace oil, coal, and natural gas.
At the same time, hydrogen demand is expected to increase up to 158 Mt by 2030 [1], while the most economical and favored method for producing hydrogen on a commercial scale is through methane steam reforming [2]. Various intensification processes have been studied to increase the economic efficiency of hydrogen production through steam reforming. The usage of catalysts has garnered significant attention for their versatility in fine-tuning characteristics like surface area, metal-support interaction, and basicity, making them particularly attractive for steam methane reforming reactions during hydrogen production [3]. Another approach to strengthening the economic sustainability of hydrogen production via steam reforming lies in the utilization of biogas, produced via biodigestion in water treatment plants, rich in methane [4].
The conventional method of thermally heating the reactant gas mixture is widely used to overcome the activation barrier of a chemical reaction. Despite several technological advantages, such as simplicity of implementation and versatility, thermocatalytic processes do not always achieve acceptable energy utilization coefficients. When heating a gas mixture, apart from the energy required for the dissociation of the initial molecules, there is a need for energy input to heat other components of the reactant gas mixture, including the chemical reactor’s enclosure. Additionally, it is important to consider that as the number of atoms in the molecules rises, the energy utilization coefficient decreases due to the increased heat capacity of the reacting components [5,6,7,8].
An analysis of the trends in natural gas processing technologies for industrial-scale hydrogen production reveals that currently, technologies involving the use of high-energy excitation sources for gas-phase molecules at moderate temperatures are taking the forefront. In this context, the rate of methane conversion is determined not by neutral reactant particles but by excited and ionized particles in a plasma state, with interaction cross-sections several orders of magnitude higher [9,10,11] compared to thermocatalytic processes.
The authors of [12] identify three main stages in the initiation and execution of plasma chemical reactions: (i) energy from an external source is transferred to the electronic component of the plasma; (ii) the electron gas transfers the acquired energy to heavy particles (reactants) through processes involving heating, excitation of internal degrees of freedom of atoms and molecules, ionization and dissociation; (iii) chemical transformations occur within the chemically active environment. Consequently, in plasma-chemical processes, all types of particles present in the plasma are involved: electrons, ions, and neutral particles in both ground and excited states, with the role of the electronic component of the plasma being crucial in initiating the reaction.
However, there are certain limitations that hinder the development of industrial technologies based on the use of thermal plasma and various types of discharge. These limitations include low working resources, high energy consumption, the influence of electrodes on processes in the flow, and a high rate of reversible reactions [13,14].
Notably, the efficiency of plasma-chemical processes initiated by an electron stream is also influenced by the hydrodynamic component. It has been previously emphasized by the authors of [10,15,16] that the maximum efficiency of plasma-chemical processes is achieved when combining high-energy electron beams with super or near-sonic rates of reactant injection into the irradiation zone using specially designed apparatuses such as Venturi tubes or Laval nozzles, which induce cavitation phenomena.
As demonstrated by previous studies [17,18], an effect involving the generation of plasma formations during the cavitation flow of gas streams in dielectric cells has been observed. The nature of this effect is associated with the accumulation of static electric charge, which occurs due to electrification at the boundary of dielectrics with different dielectric permittivity values. It also occurs due to charge drainage when a dielectric liquid flows over the surface of a conductor. Electrification is accompanied by electrical breakdown and the formation of weakly ionized plasma in the region of the cavitation vapor-gas bubble [15].
Molecule dissociation occurs when the energy on vibrational levels exceeds a critical value, leading to an increase in the interatomic distance to a point where the strength of intramolecular bonds becomes weak, resulting in molecule dissociation. The translational or rotational motion of a molecule does not lead to dissociation in the absence of collisions with other molecules or the reactor wall. Therefore, the energy associated with translational and rotational motion is unproductive in terms of initiating a chemical reaction [19].
One of the ways to create thermodynamically non-equilibrium conditions for initiating a chemical reaction involves expending energy on the decomposition of initial molecules and the generation of active radicals through the formation of a hydrodynamic jet [20]. In this method, excited molecules from a stationary gas volume are pre-accelerated in a supersonic adiabatic expanding gas-dynamic flow, known as a free jet. The formation of a supersonic jet occurs as stationary gas flows from the convergent section to the divergent region of the nozzle, resulting in hydrodynamic molecular beams with a non-equilibrium distribution of energy in the vibrational and rotational degrees of freedom of molecules, making it an effective working medium for laser creation [21]. With additional activation by an electron beam, the hydrodynamic jet effectively promotes cluster formation and the dissociation of the initial molecules [22,23,24].
Thus, it can be concluded that the use of supersonic or near-sonic gas jets in combination with a high-energy electron beam is the most effective way to achieve maximum productivity in the steam methane conversion process for hydrogen production. This conclusion is supported by the findings of previous work [12], which investigated hydrogen production from methane in electron beam plasma. Firstly, the electron energy distribution function in the reactor is significantly shifted towards higher energies compared to discharge plasma. Secondly, the rapid decrease in density in the cavitation zone of the jet hinders reverse reactions that lead to a decrease in the concentration of the products of plasma-chemical reactions. Thirdly, methane molecules can serve as both reactants and carriers of plasma formations. Lastly, the need for external heating of the reactor casing to maintain the process temperature is minimized.
The goal of this article is to mathematically model the flow of a steam-gas mixture in hydrodynamic apparatuses for steam methane conversion and to investigate the distribution patterns of methane particles in water vapor depending on the geometric parameters of the cavitation flow formation zones. This problem formulation is driven by the fact that the efficiency of hydrogen production in the steam methane conversion process using electron impact is entirely determined by the parameters of the hydrodynamic flow of reacting methane molecules and water vapor in the irradiation zone, which, according to the proposed model, falls within the cavitation formation region.
The novelty of the work lies in the possibility of optimizing the process of steam reforming methane by mixing flows of water and methane vapor in the cavitation mode using hydrodynamic devices of a special design. This will ensure a uniform distribution of methane molecules in the volume of water vapor with the formation of aerosol systems with high density, which should affect the efficiency of the electron irradiation process on the decomposition of methane molecules with the formation of hydrogen and other by-products.

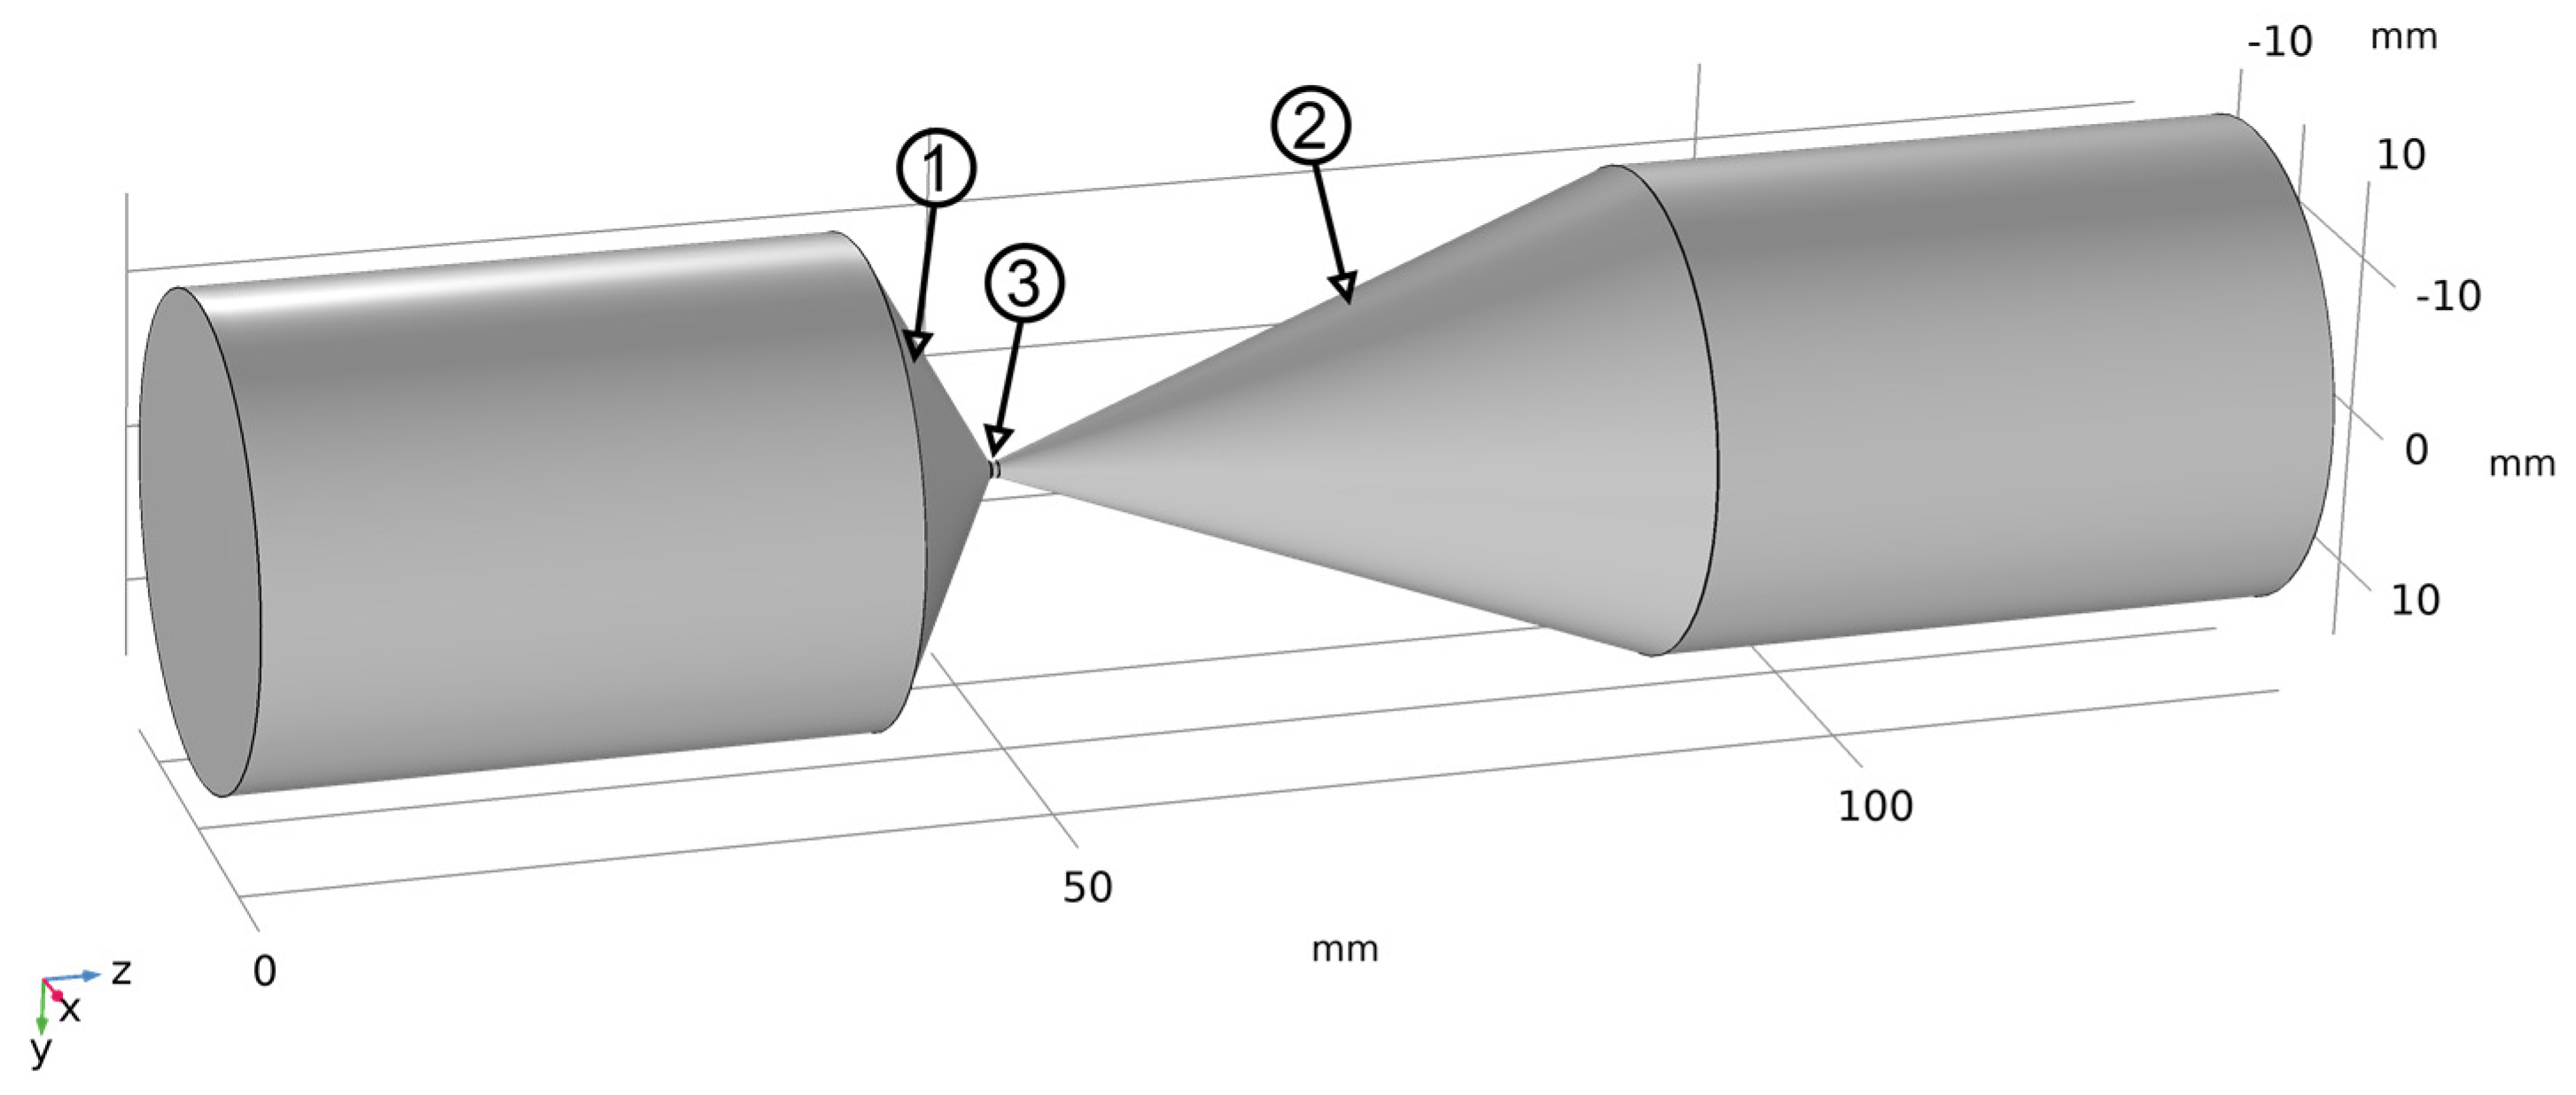
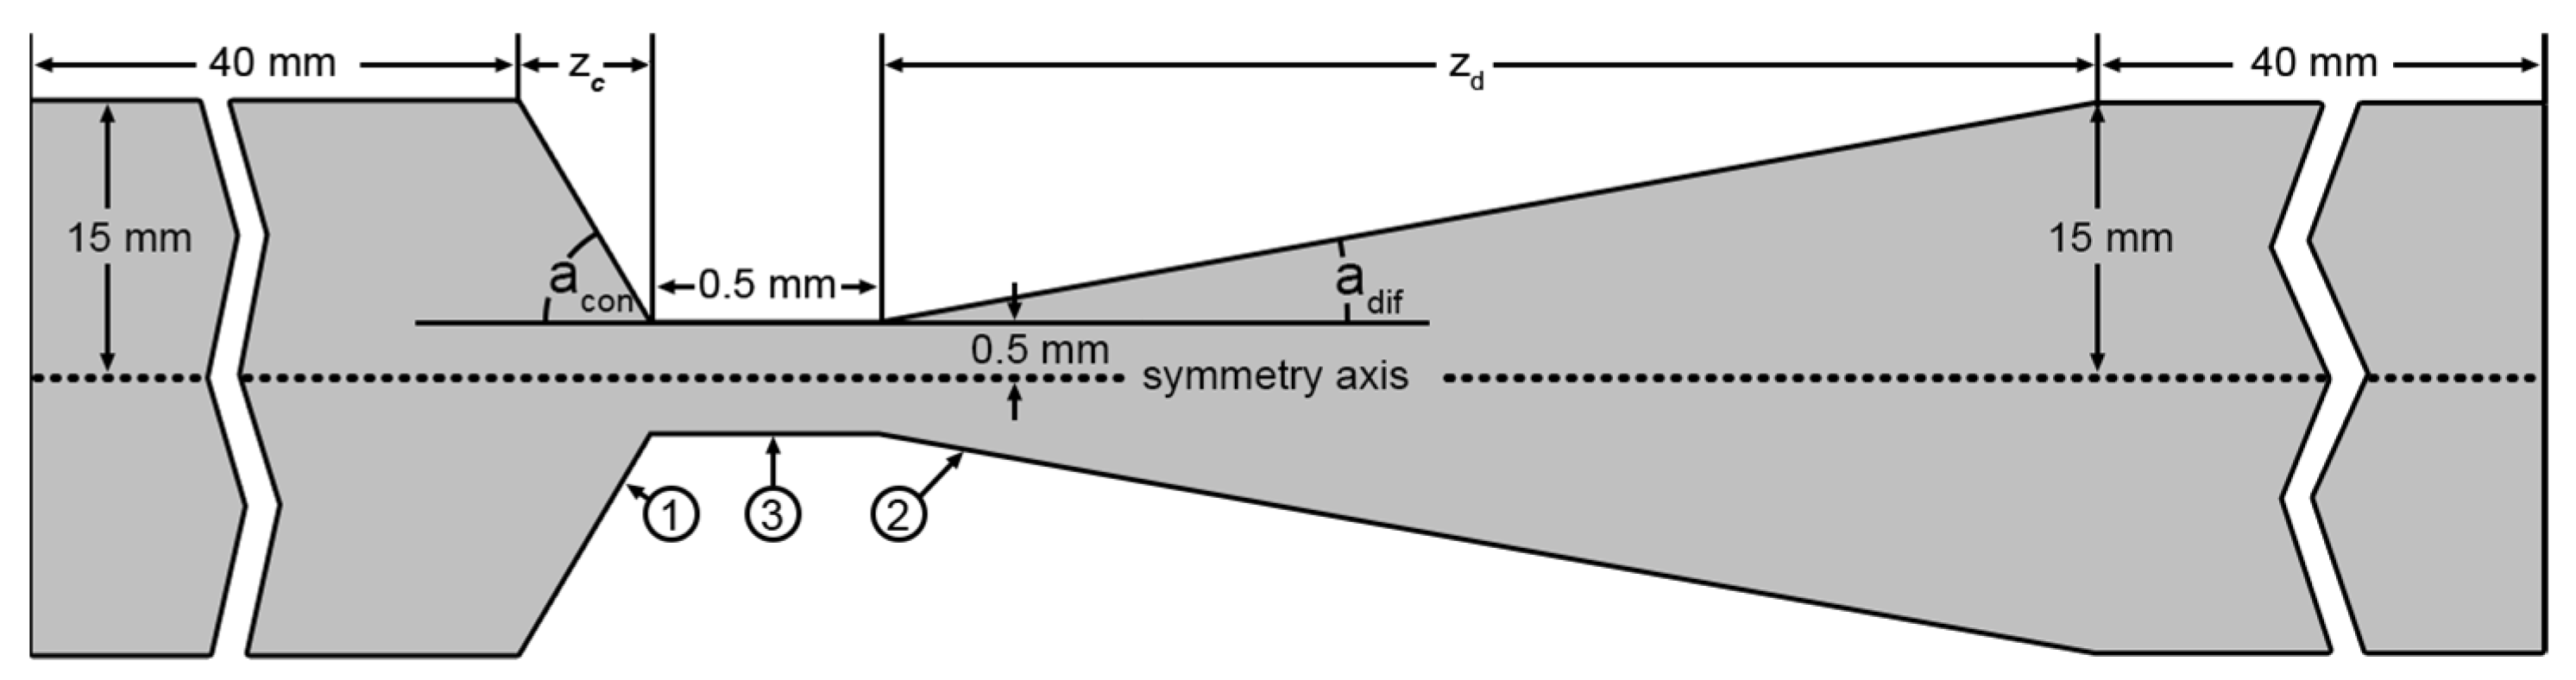
2. Study of the Formation of a Cavitation Zone

2.1. Problem Statement and Mathematical Model

Within the scope of this study, a system was examined, comprising a convergent nozzle ➀ and a divergent nozzle ➁ connected by a transitional channel ➂ (Figure 1 and Figure 2). The transitional channel is the area where the cavitation zone forms and high-velocity water vapor flow captures methane [25]. The water vapor is supplied into the narrowing section (convergent nozzle) using a high-pressure pump.
The domain under consideration is three-dimensional but can be simplified into two-dimensional, taking into account symmetry relative to the central axis, as a result of which the condition of axial symmetry was set at the lower boundary. The resulting two-dimensional model is illustrated in Figure 2.
As part of this study, the influence of the convergent nozzle narrowing angle ( a c o n ) and divergent nozzle expansion angle ( a d i f ) were analyzed for the formation of cavitation in the system. For this purpose, various angle values of a c o n and a d i f were considered within the range between 10° and 90° with a step of 10°.
The mathematical flow model used in this context is based on the Navier–Stokes equations, which describe the movement of fluids in a system. To model turbulent flows, a special version of these equations is used, called the model k ω [26]:
ρ u · u = · p I + μ + μ T u + u T 2 3 μ + μ T · u I 2 3 ρ k I
· ρ u = 0
ρ u · k = · μ + μ T σ k k + P k β 0 * ρ ω k
ρ u · ω = · μ + μ T σ ω ω + α ω P k k ρ β 0 ω 2
μ T = ρ k ω
P k = μ T u u + u T 2 3 · u 2 2 3 ρ k · u
where, ρ —fluid density [ k g / m 3 ] , u —velocity vector [ m / s ] , p —pressure [ P a ] , μ —fluid dynamic viscosity [ P a · s ] , k —turbulent kinetic energy [ m 2 / s 2 ] , ω —specific turbulence dissipation rate [ 1 / s ] .
It is essential to mention that the input velocity remained constant regardless of the values of the angles a c o n and a d i f and was equal to 20 m/s. On the other side of the device, at the outlet of the system, a pressure boundary condition equal to atmospheric pressure is established. This condition indicates that the outlet pressure is equal to the ambient atmospheric pressure:
u i n l e t = 20   m / s
p o u t l e t = 101,325   P a
No-flow and no-slip conditions were set at the remaining boundaries:
u · n w a l l = u · τ w a l l = 0  
The combination of these three boundary conditions allows for the determination of the flow behavior in the system while considering the values of the inlet velocity and the outlet pressure.
Equations for determining the critical velocity required for cavitation flow to occur, as well as the volumes of cavitation zones, are as follows:
u * = 2   ( p 0 p d ) ρ    
V c a v = 1   d V ,         u > u *
Since changing the angles a c o n and a d i f entails a change in the volume of the analyzed area, more presentable results can be obtained by considering the ratio of the volume of the cavitation zone ( V c a v ) to the total volume of the entire computational area ( V t o t ):
P c a v = V c a v V t o t  
In this problem, the flow is assumed to be adiabatic, and the temperature is 25   ° C , at which the saturated vapor pressure ( p d ) corresponds to 3169   P a .

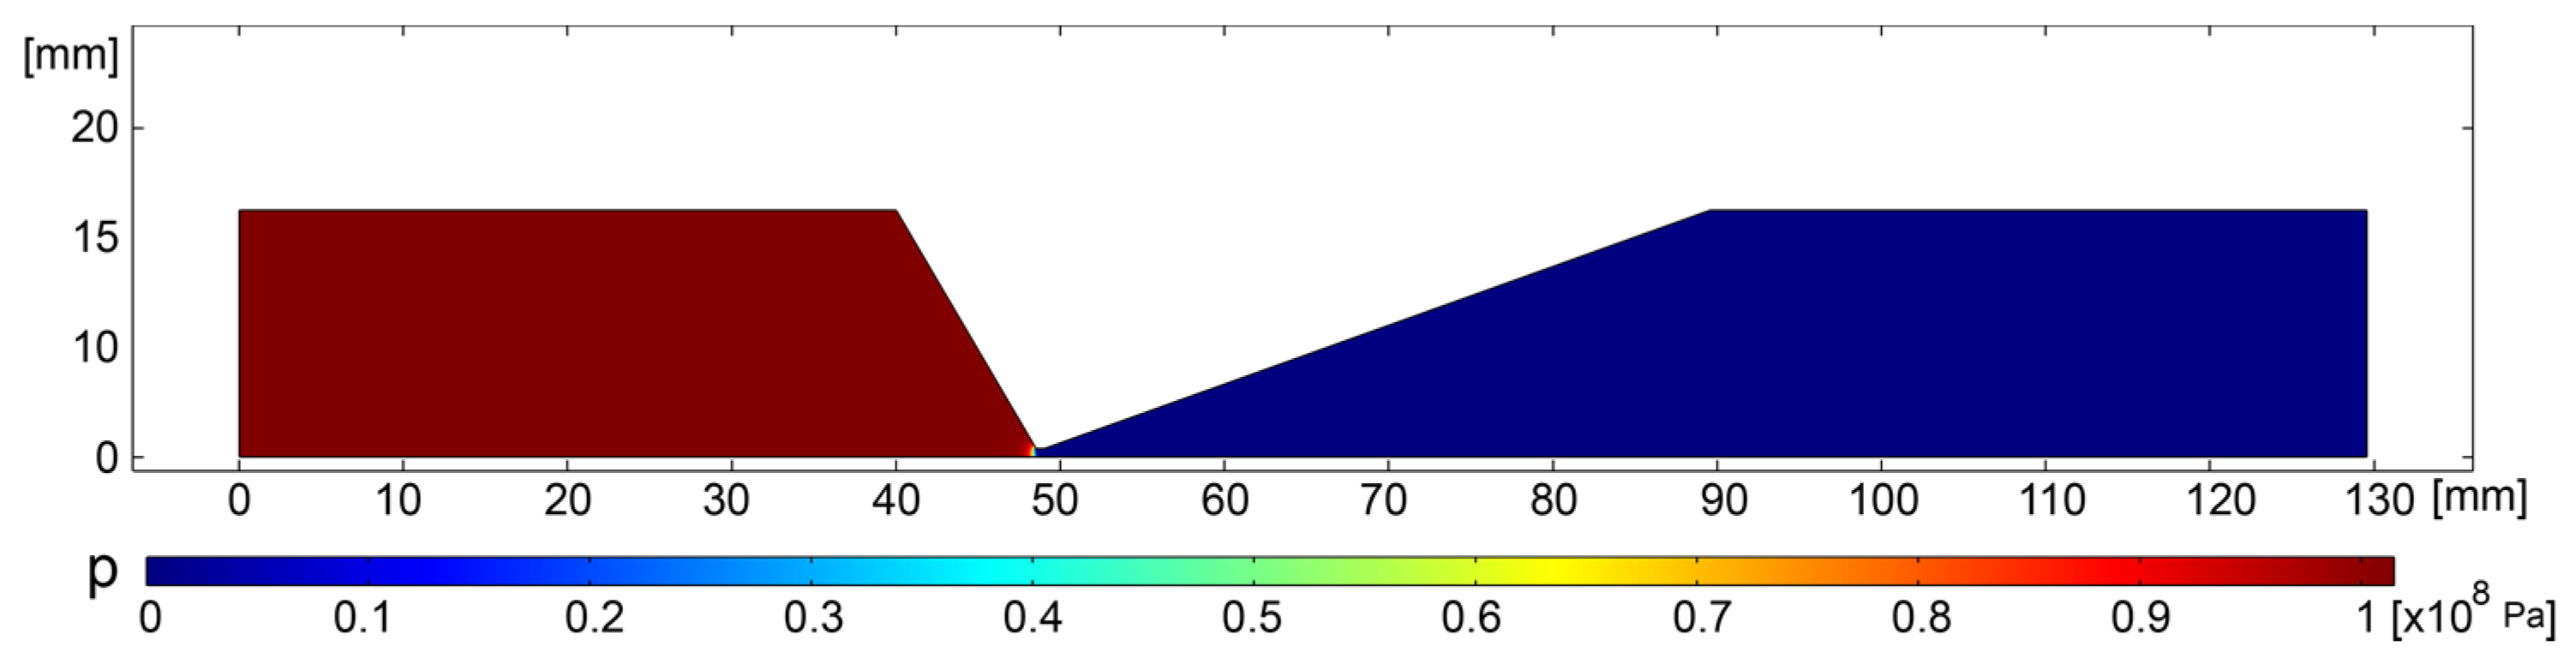
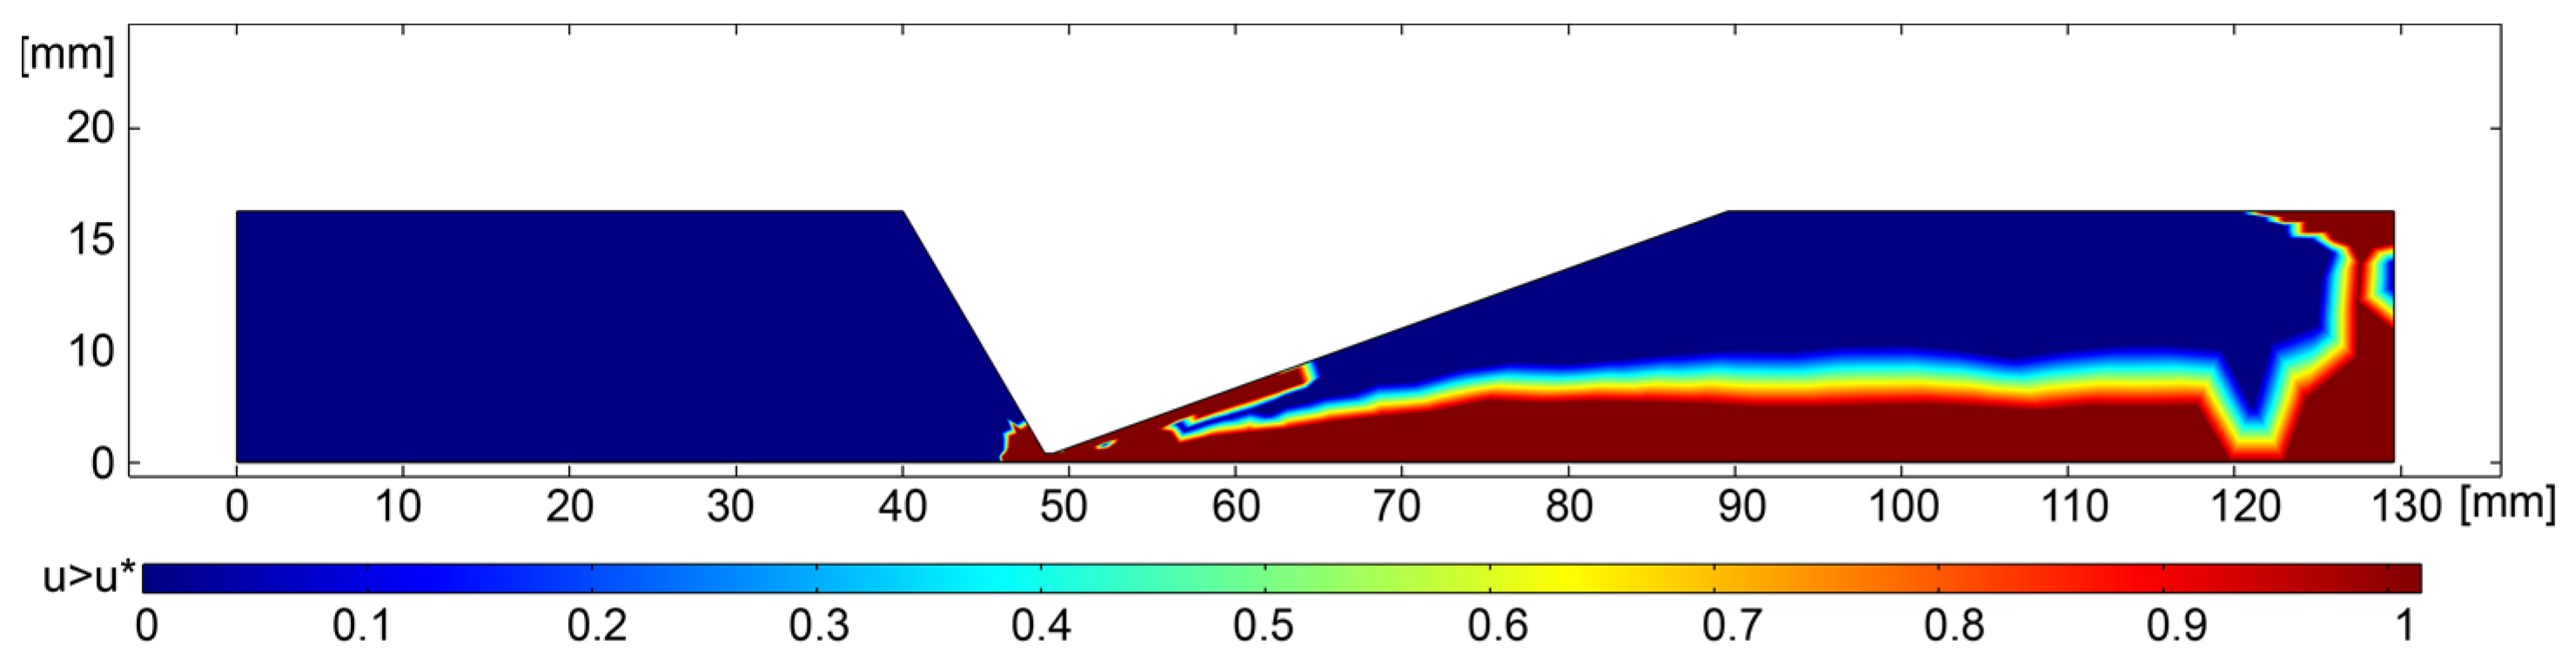
2.2. Results and Discussion

Mathematical flow modeling corresponding to Equations (1)–(6) was conducted using COMSOL 5.6, a multiphysics simulation software.
Figure 3 shows the pressure and velocity distributions for the system at a c o n = a d i f = 30 ° , which allows us to visually evaluate internal behavior and influence on the hydrodynamic conditions set in the system.
A domain has been selected using Equation (10) where the flow velocity exceeds the critical value for cavitation ( u * ). For the purposes of demonstrating cavitation zone distribution at angles a c o n = 60 ° and a d i f = 20 ° the result is illustrated in Figure 4.
The fractional volume of the cavitation zone ( P c a v ) for the values of a c o n and a d i f ranging from 10 ° to 90 ° with the step of 10 ° is shown in Figure 5.
As can be observed from Figure 4, to increase the volume of the cavitation zone, most optimal values of convergent angle and divergent angle are equal to a c o n = 10 ° and a d i f = 20 ° , r e s p e c t i v e l y . Since the angle of the expansion of the diffusor ( a d i f ) has a great influence on the uniformity of the distribution of aerosol methane particles in water vapor; this angle is also a subject of study from the point of view of optimizing particle distribution, which is discussed further. However, based on the data presented in this section, it can be concluded that the effectiveness of the convergent nozzle increases when the constriction angle is greater than 50 ° .

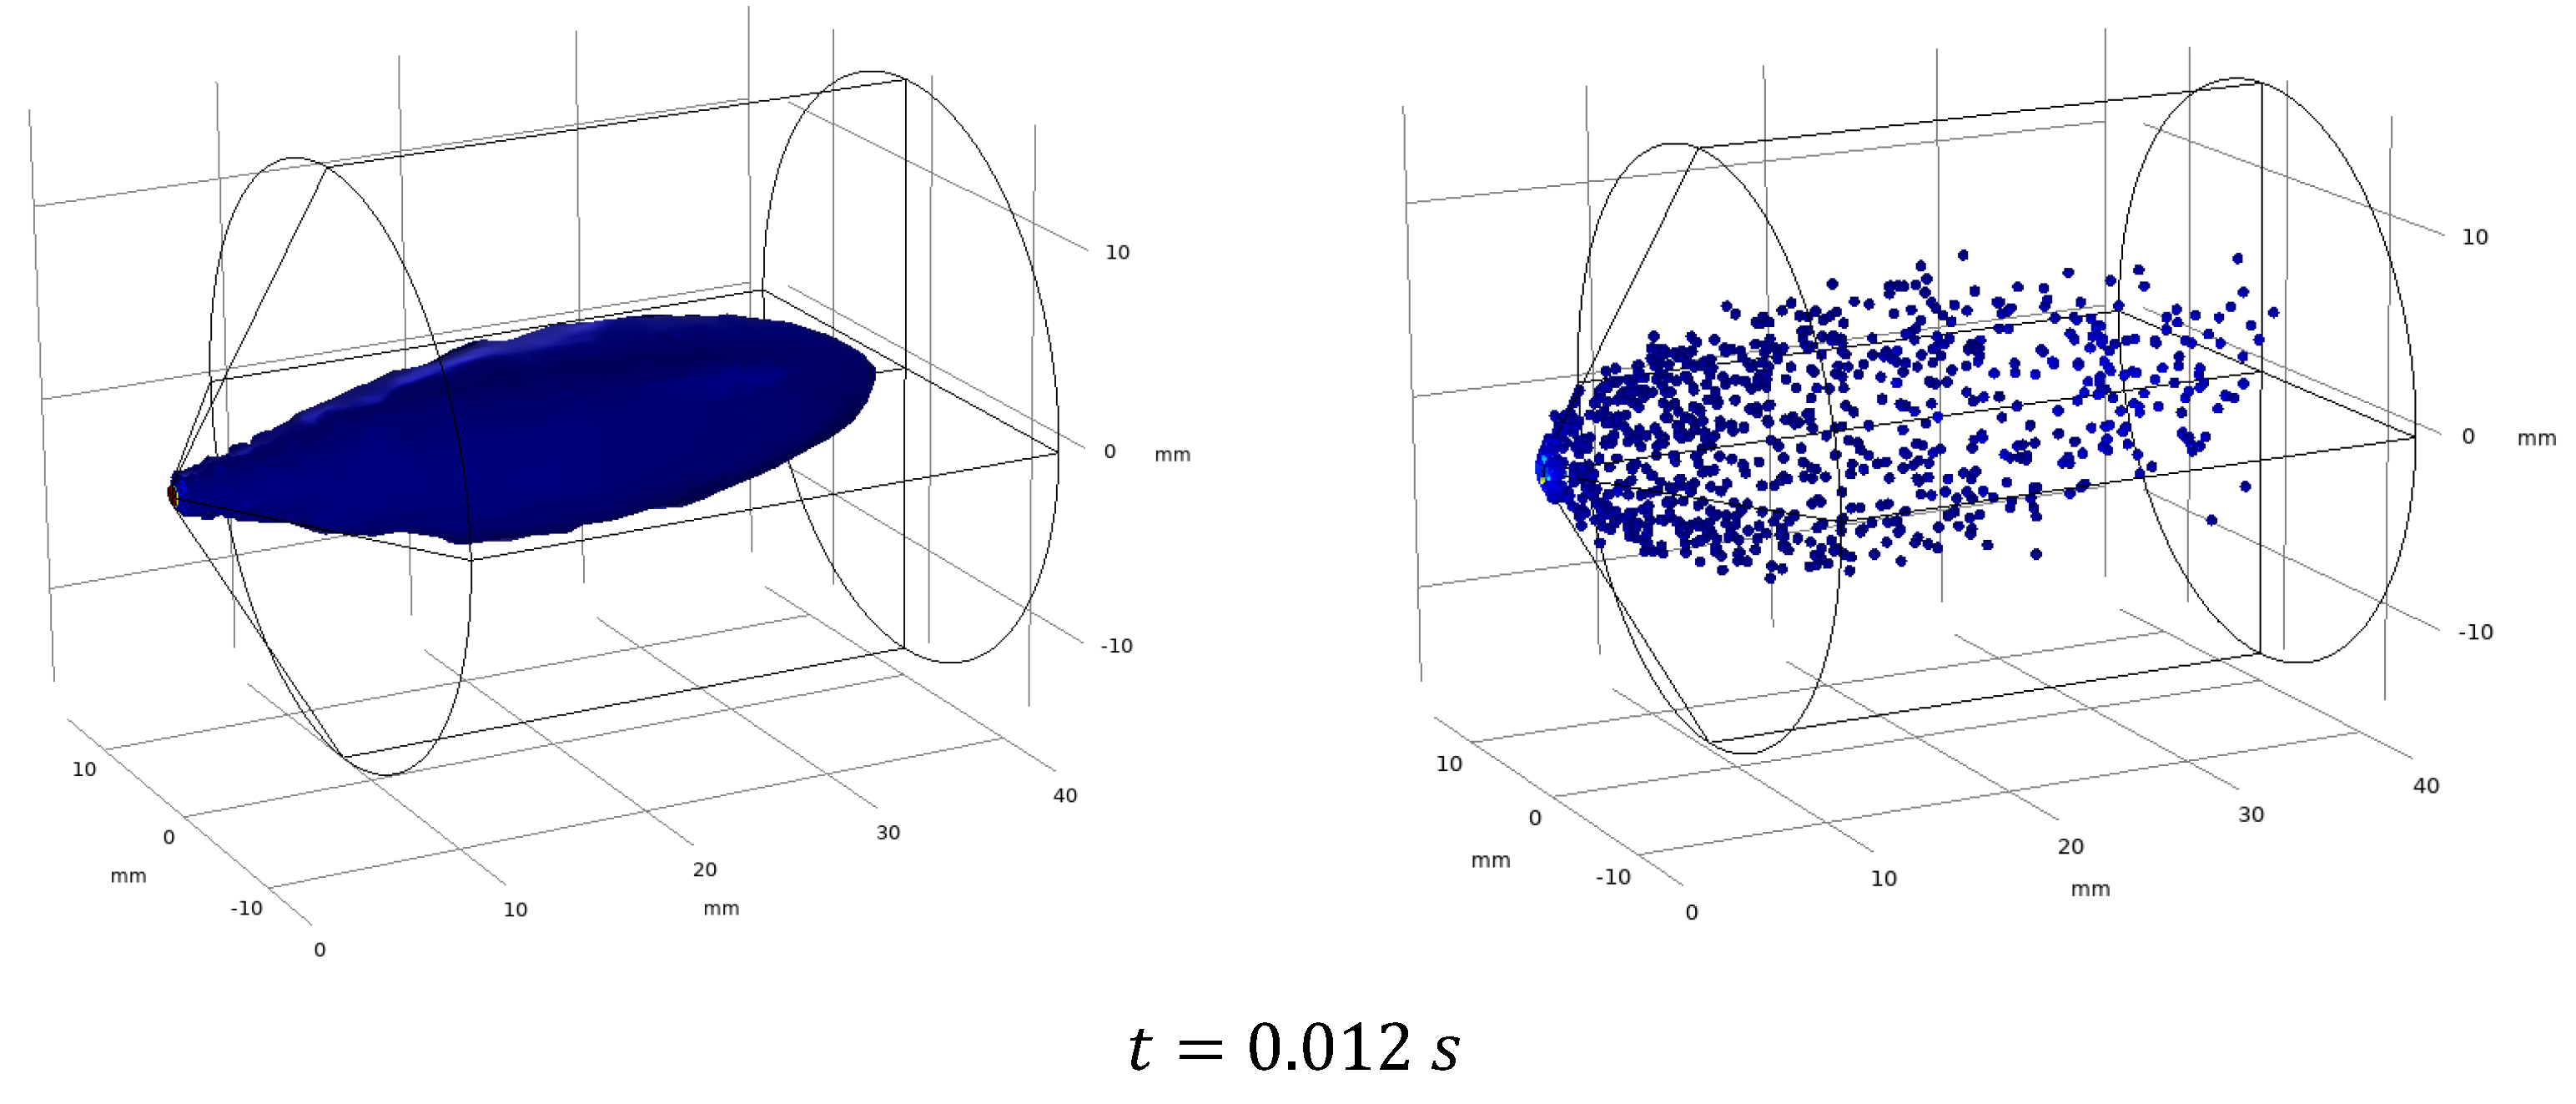
3. Study of the Motion of Aerosol Particles of Methane in Water Steam

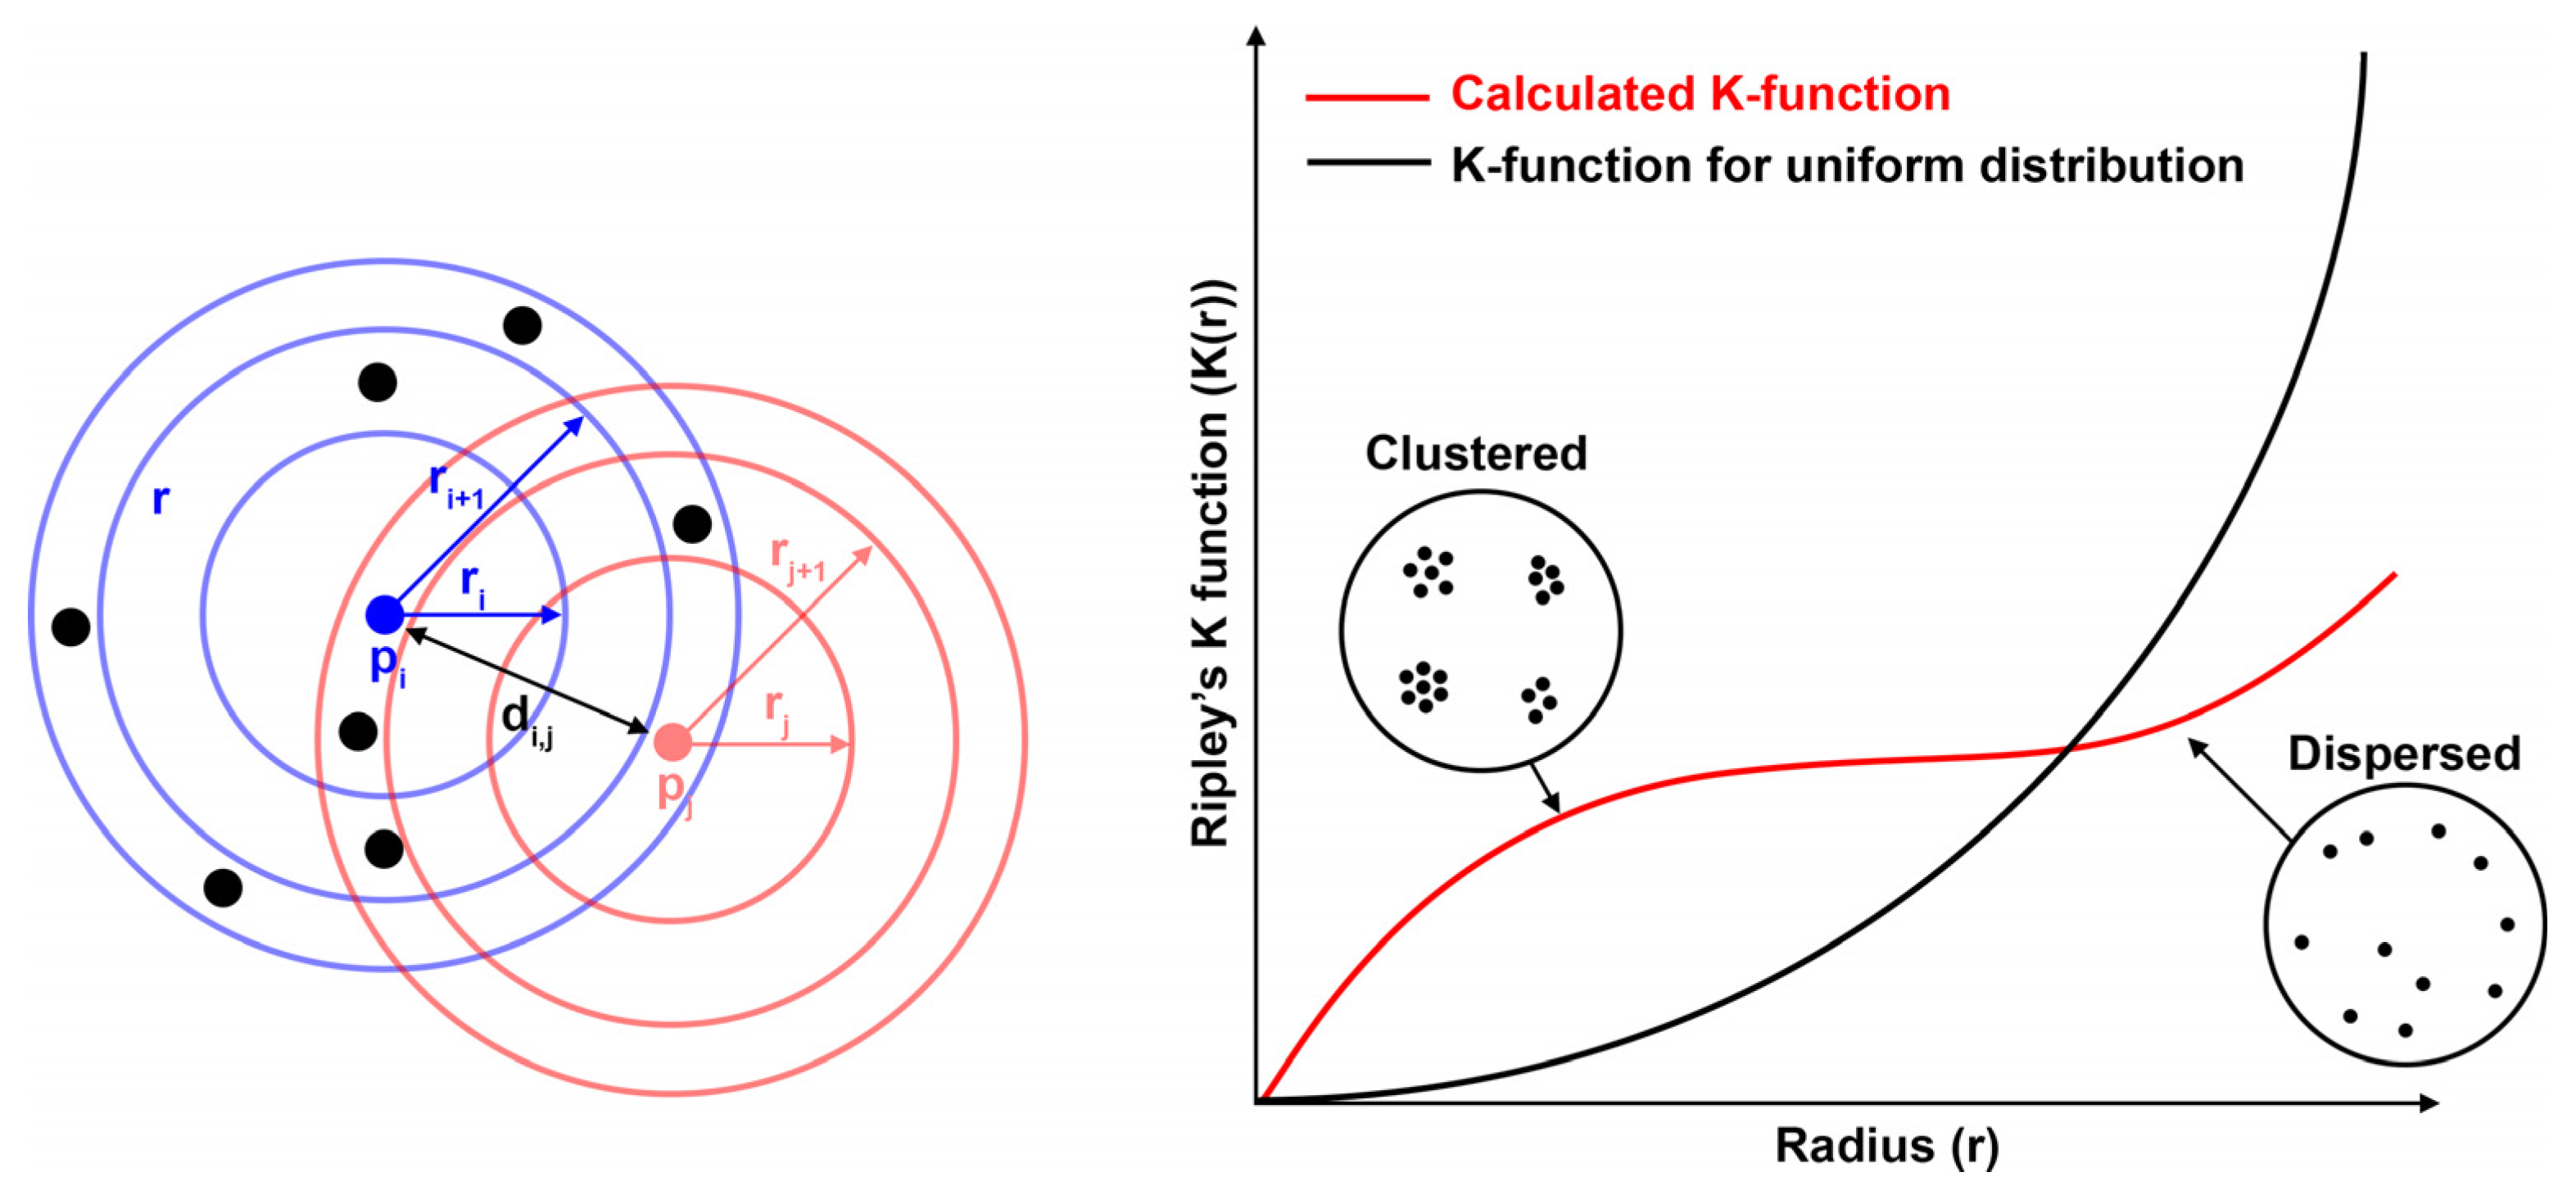
3.1. Investigation of Approaches

The movement of methane aerosol particles in water vapor can be formalized through mathematical equations representing the concentration of particles in the context of Euler’s perspective, where the medium is considered a continuous field. This transport model takes into account two main mechanisms: convection and diffusion. The convective term of the Equation is responsible for the movement of aerosol particles under the influence of flow velocity, whereas the diffusion term describes the Brownian motion, which arises due to collisions of particles causing chaotic and random movement. The mathematical model of the movement of aerosol particles based on the Euler perspective is represented by the following Equation:
c t + u · c c o n v e c t i o n D · c d i f f u s i o n = 0
where c —aerosol particle concentration [ 1 / m 3 ] , t—time s , u —velocity vector calculated by solving Equations (1)–(6) [ m / s ] , D —diffusion coefficient [ m 2 / s ] .
This process can also be analyzed from a Lagrangian description, using a model of the motion of solid particles within a flowing medium, which in this case is water vapor. In this context, the movement of methane aerosol particles is described using the mechanisms of movement of spherical bodies in a flowing medium. These mechanisms include Brownian motion associated with chaotic, random vibrations of particles, the force of gravity, and collisions between the aerosol particles themselves. A mathematical model of aerosol movement based on the particle tracing method is presented below [27]:
d m p u p d t = ζ 12 π k B μ T r p Δ t b r o w n i a n   f o r c e + m p g ρ p ρ ρ p g r a v i t y   f o r c e k s j = 1 N p r r j r 0 r r j r r j p a r t i c l e p a r t i c l e   i n t e r a c t i o n 1 2 C d ρ A u 2 d r a g   f o r c e
where u p —velocity vector of the particle [ m / s ], m p —mass of particle [ k g ] , u—flow velocity by solving Equations (1)–(6) [ m / s ] , t—time s , ζ , k B —Boltzmann constant [ J / K ] , μ —dynamic viscosity [ P a · s ] , T —temperature [K], r p —particle radius [ m ] , g —gravitational acceleration vector [ m / s 2 ] , ρ p —density of particle [ k g / m 3 ] , k s —spring constant [ N / m ] , r 0 —equilibrium distance between particles [ m ] , C d —drag coefficient, A —reference area [ m 2 ] .
Analyzing this motion through a Lagrangian description allows for a more detailed study of the trajectories and interactions of individual particles within a flowing medium. This is important for more accurate prediction and modeling of the behavior of aerosol methane particles in water vapor and their response to external influences.
In this study, both approaches were evaluated in achieving a uniform distribution of methane aerosols in water vapor. All particle simulations were conducted using COMSOL multiphysics simulation software with Transport of Diluted Species and Particle Tracing for Fluid Flow modules.
The distribution of velocities and pressure in both approaches is solved using the stationary turbulent k-ω model presented in Section 2. Notably, the movement of aerosol particles is three-dimensional and is non-stationary since the movement of individual methane particles can occur in three planes and depends on time. Therefore, the velocity and pressure distribution presented in Section 2 were converted into a three-dimensional domain and used as the pressure and velocity fields in the numerical simulation of aerosol particle motion.
Figure 6 shows the distribution of aerosol particles at the angle a d i f = 60 ° , obtained using the concentration equation in a continuous medium and using the movement of solid particles in space at the same time values.
Based on the analysis presented in Figure 6, the following conclusions can be drawn. The concentration equation, based on the Euler description, does not consider physical phenomena such as particle collisions and the interaction of particles with the environment at the individual solid spherical body level. This omission results in an insufficiently accurate description of particle distribution, particularly in scenarios where such effects are significant. In the Euler description, within a continuous medium, particle velocity is frequently assumed to be equal to the flow velocity. However, in real-world conditions, particle movement must account for the drag coefficient, which can significantly influence their trajectories.
Thus, investigating the motion of aerosol methane particles within a water vapor environment involved employing the particle tracing method, specifically the Lagrangian description.

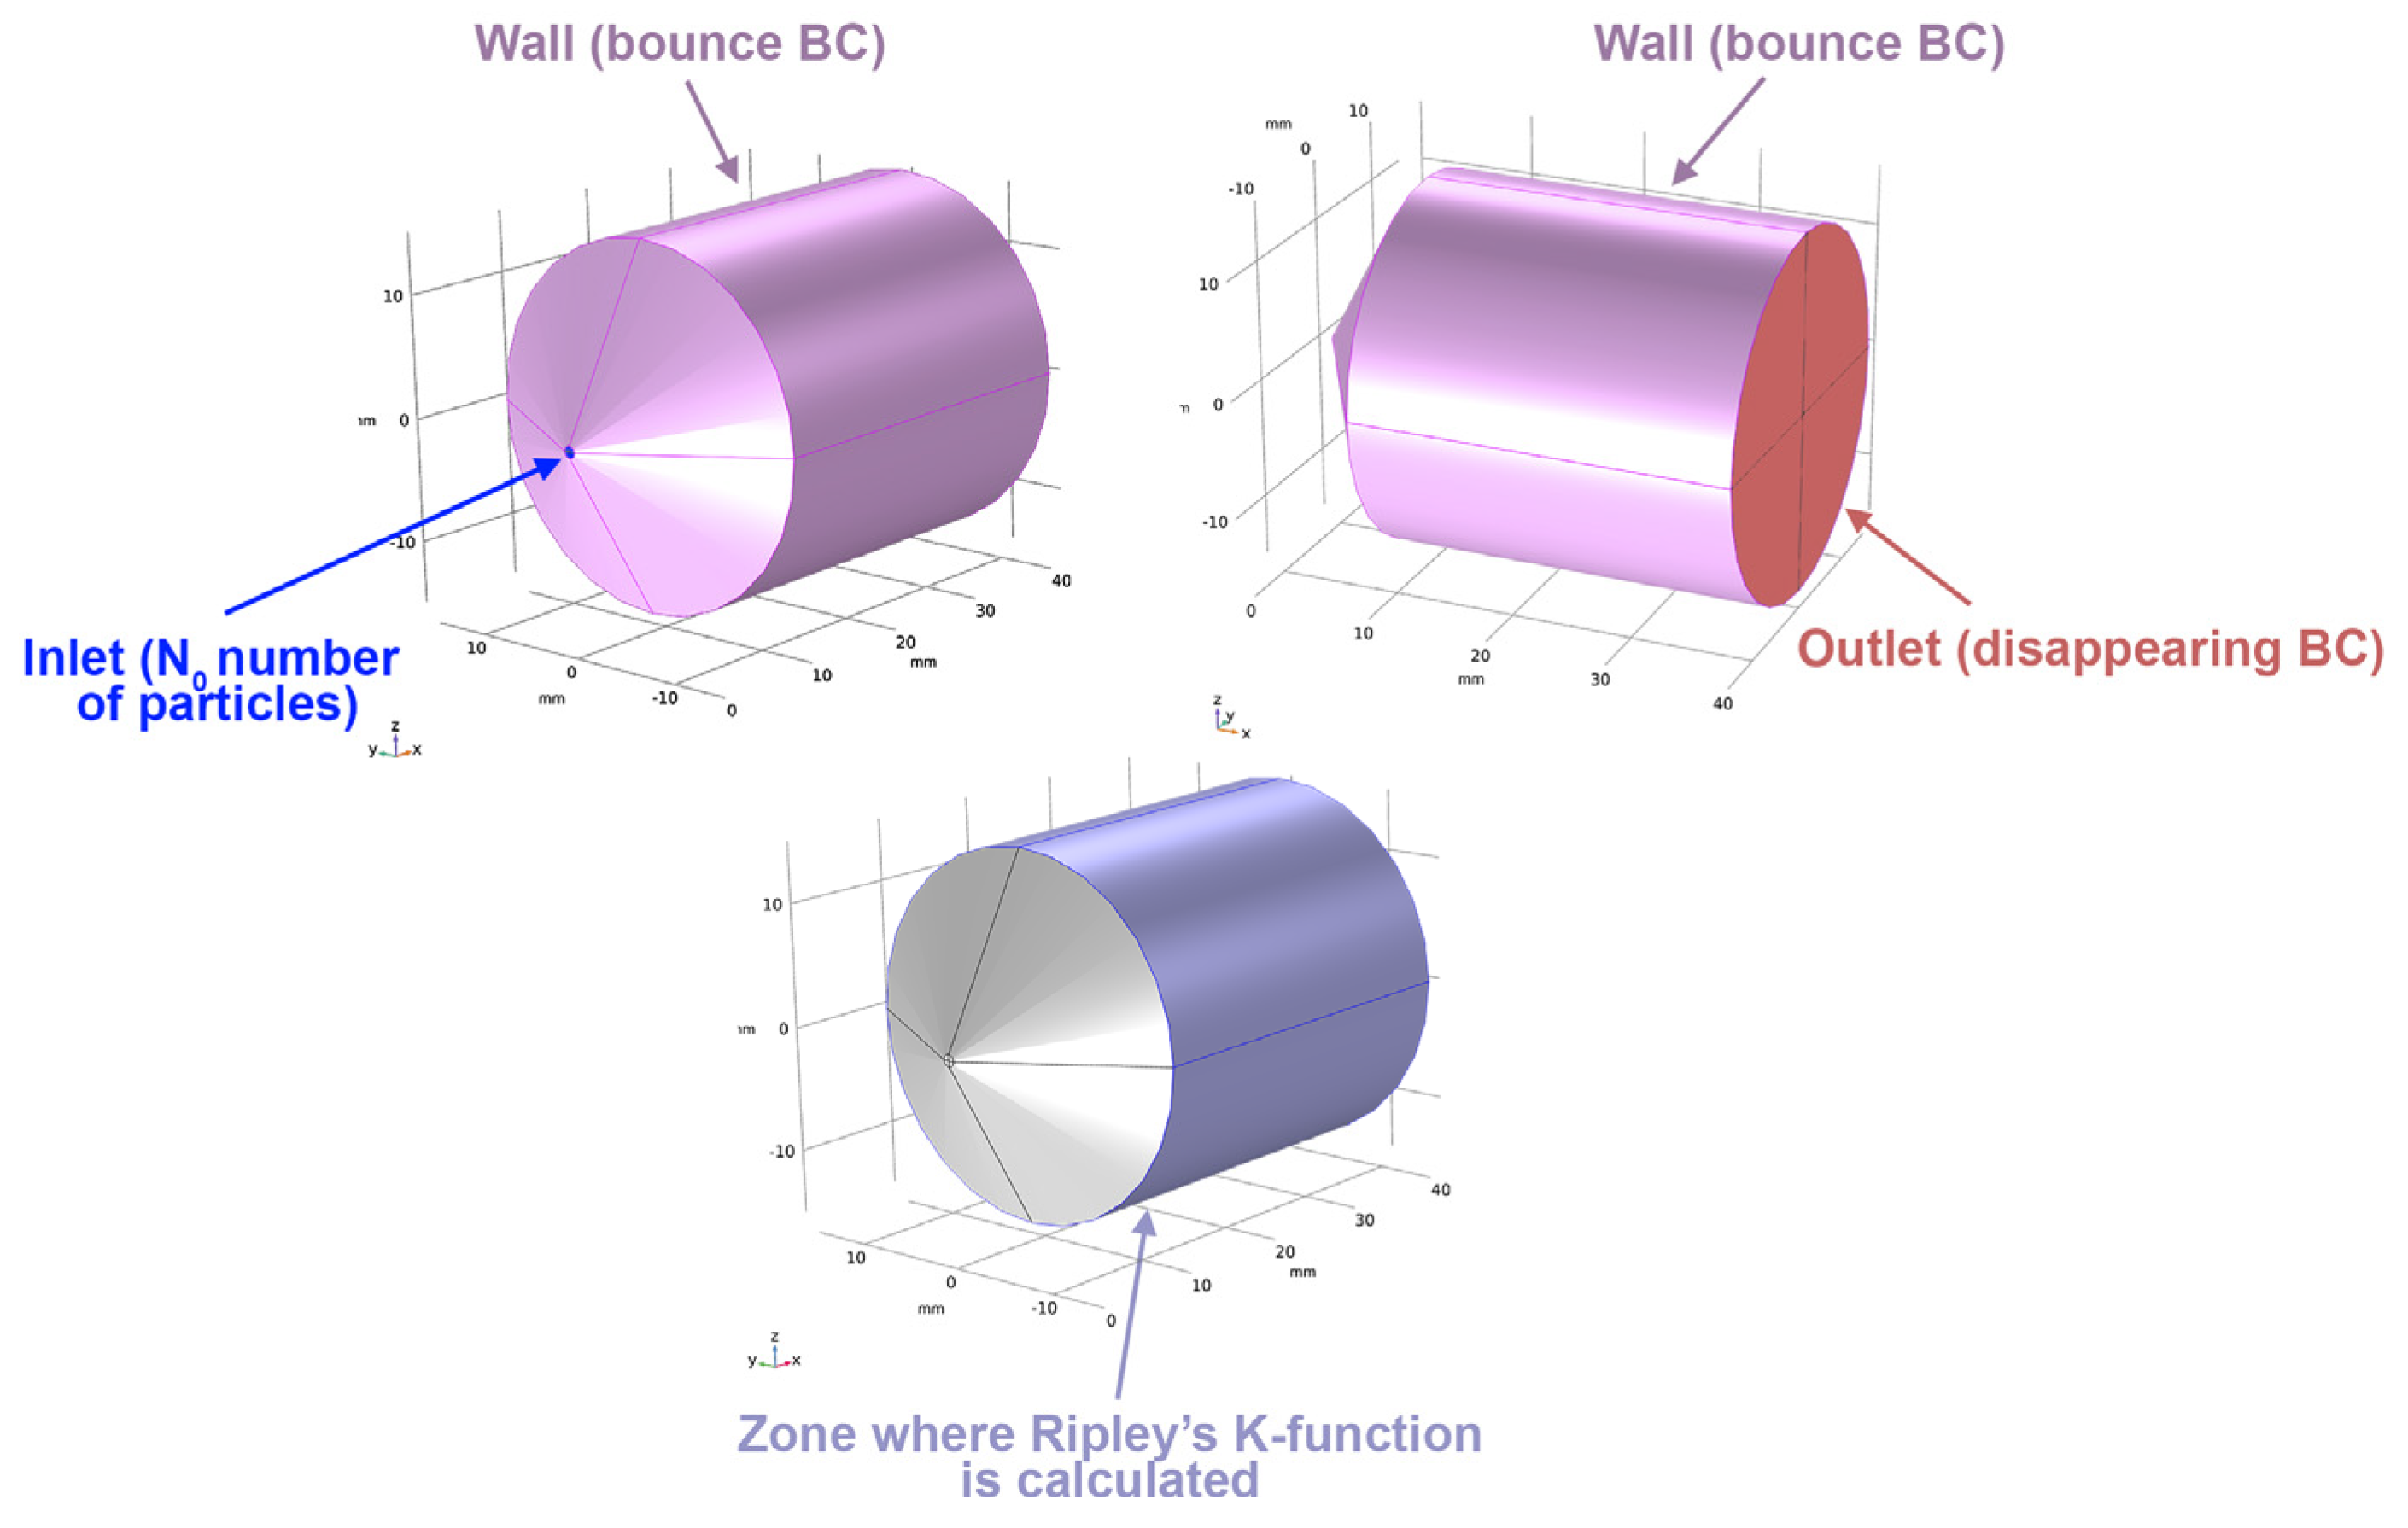
3.2. Problem Statement and Mathematical Model

The formation of aerosol particles occurs as a result of a decrease in pressure between the convergent and divergent nozzles. Accordingly, modeling of the movement of aerosol particles is carried out in the area of divergent nozzle expansion (Figure 1, ➂). Moreover, as was written in Section 3.1. the distribution of the velocity field is determined by the stationary system of Equations (1)–(6) specified in Section 2. The main object of study in this section is the divergent nozzle expansion angle ( a d i f ). The movement of aerosol particles was modeled based on the particle tracing Equation (14). Various angle values were considered for a d i f from 10 ° to 90 ° while the uniformity of particle distribution was assessed using Ripley’s K-function.
Ripley’s K-function provides an assessment of the degree of randomness or clustering of the distribution of methane particles in space. The function is based on counting the number of pairs of particles in a given volume or at a given distance from each other, depending on the radius of a spherical or other shape ( K ( r ) ) [28]:
K r = N p V i = 1 N p i j N p I d i , j < r N p
where N p —total number of particles in volume V , I —indicator function, which equals 1 if the condition inside the function is true and equals 0 otherwise, d i , j —distance between i -th and j -th particles, r —the radius under consideration.
Figure 7 shows a schematic illustration of the operating principle of Ripley’s K-function for a two-dimensional domain.
Figure 7 illustrates the curve of Ripley’s K-function for a uniform distribution of objects (black line), which is determined by the volume of a cylindrical region with a square cross-section depending on the change in radius ( r ) . If the density of objects in a given area remains constant as the radius increases, then the curve for the number of pairs of particles in this area will be identical to the curve for the change in volume of a cylinder. Otherwise, if the curve is not identical to the volume of the cylinder, then this may indicate a clustering effect (particles grouped together) or, conversely, dispersion (particles spread far apart). The evaluation of distribution uniformity can also be carried out for a spherical shape; however, in the current case, after the divergent nozzle, the considered shape of the area is cylindrical. In this context, to evaluate volume uniformity, a cylinder is used as the corresponding geometric shape.
Figure 8 shows the shape of the computational domain, an area for counting the number of particles, as well as specified boundary conditions on the walls and on the inlet and outlet of this computational domain.
In the region with the minimum cross-sectional radius of the divergent nozzle (inlet), a number of particles were launched, while the calculation of Ripley’s K-function was carried out in the specified volume of a cylindrical shape (Figure 8). A bounce condition was applied to the walls, while at the outlet boundary, the particles were set to disappear:
N p i n l e t = N 0
u p w a l l = u c
where u c —represents the particle velocity upon impact with the wall [ m / s ] , N 0 —number of particles entering the domain.

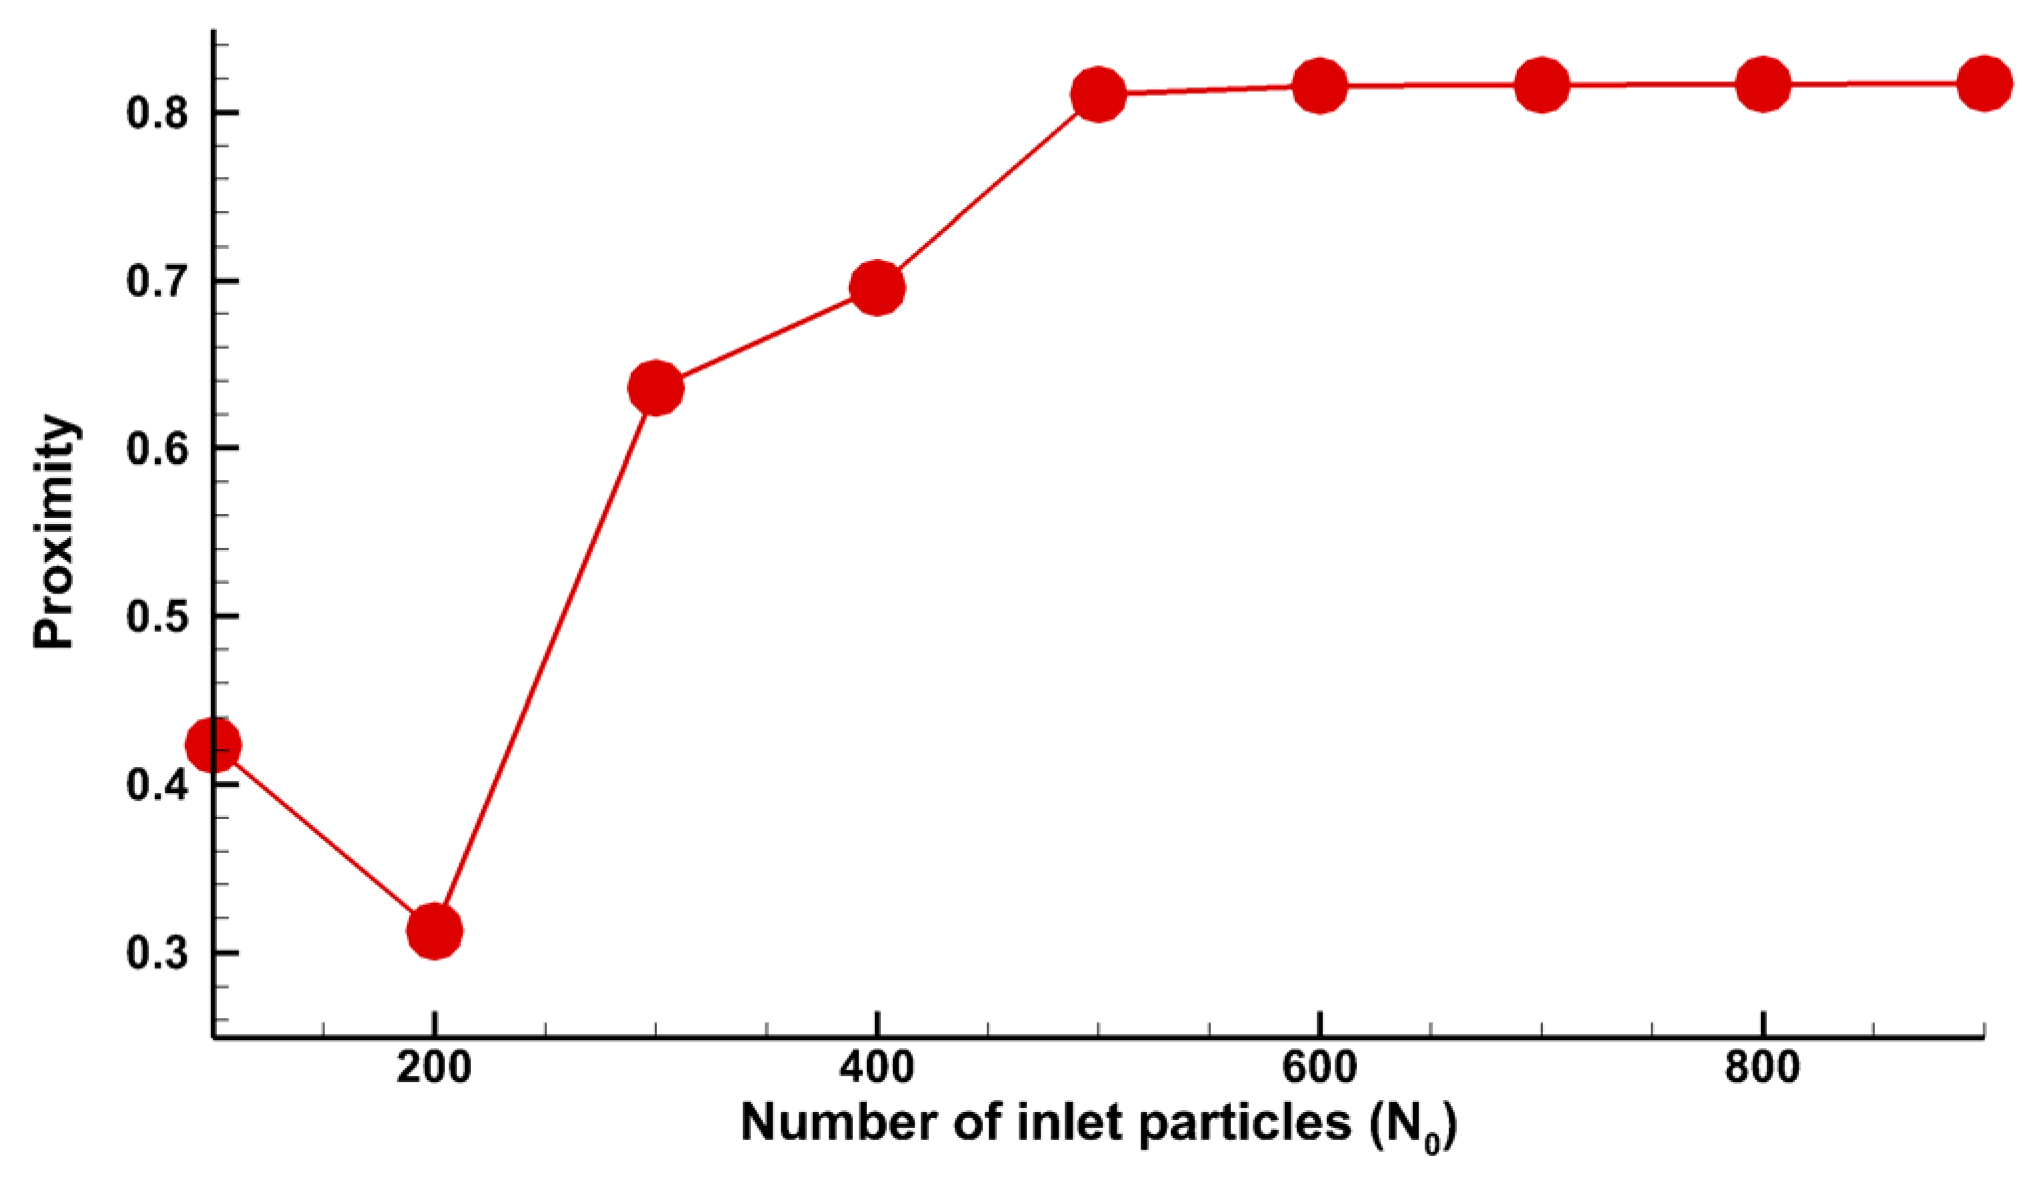
3.3. Results and Discussion

Figure 9 illustrates the comparative results of the distribution of methane particles in the calculation area at divergent nozzle expansion angles of 20°, 30°, and 90°.
As can be seen from Figure 9, in the cylindrical region, particles at an angle of a d i f = 90 ° are grouped near the central axis of the cylinder, while at a d i f = 30 ° the particles are distributed more evenly. At 20°, the occurrence of particle clustering is noticeable along the surfaces of the divergent nozzle.
A dedicated evaluation software has been developed by the authors to perform a quantitative analysis using Ripley’s K function. As mentioned earlier, the closer Ripley’s K-function curve is to the volume curve of a cylinder, the more uniformly the particles are distributed. For a visual comparison, Figure 10 shows graphs of Ripley’s K-function and the volume of the cylinder in a dimensionless form.
Figure 10 demonstrates that the Ripley K-function curve at the value of the divergent nozzle expansion angle a d i f = 30 ° is the closest to the dimensionless volume curve of the cylinder.
The numerical value of the proximity can be determined by calculating the area of deviation of Ripley’s K-function curve for different values of the divergent nozzle expansion angle from the cylinder volume change curve (Figure 11).
A graph of proximity change for different values of the divergent nozzle expansion angle is presented in Figure 12.
Based on the data presented in Figure 12, the following conclusion can be made: the most optimal divergent nozzle expansion angle to achieve uniform distribution of methane particles with the calculation accuracy of 10 ° is 30 ° , which is also confirmed by visual analysis (Figure 9). At low values of the angle a d i f , ranging from 10 ° to 20 ° , the proximity decreases due to the clustering of particles in the wall regions of the divergent nozzle. As the angle a d i f increases beyond 30 ° , there is an increase in clustering in areas close to the centerline. It should be noted that close proximity values between 30 ° and 40 ° suggest that angle values in this range may be the most optimal for the system under study.
An additional analysis was conducted to test the dependency of resulting uniformity on the amount of particles used during simulation. As can be seen from Figure 13, the proximity converges to a certain value as the amount of particles increases. In this particular case, the value stabilizes starting from 500, hence the specific number of particles used in the aforementioned simulations. In other words, while lower amounts of particles lead to a decreased accuracy of modeling, increasing this number above 500 will raise the computational costs unnecessarily.

4. Conclusions

According to the studies, the intensity of the cavitation mixing process and the distribution of methane molecules in water vapor are significantly influenced by a combination of geometric parameters of the convergent and divergent sections of the hydrodynamic chamber. The mathematical models investigated in this study allow for the description of the processes that occur during the short activation stage of mixing particles. The mathematical model proposed in this work is designed for the predictive quantitative assessment of the dynamic characteristics of the cavitation cluster of mixing vapor-gas flows as an initial step in developing efficient cavitation-jet devices in the technological scheme of methane steam conversion under the influence of electron irradiation.
The model can be used to engineer a steam reforming device for hydrogen production with an increased efficiency achieved using the appropriate determination of nozzle geometry.
The next stage of the study is modeling the most probable paths of radiation-chemical reactions of methane clusters formed in the cavitation zone in water vapor under electron beam irradiation, as well as designing the device itself.

Author Contributions

Conceptualization, G.M.; methodology, N.S.; software, D.A.; validation, M.K., N.S. and M.T.; investigation, G.M. and N.S.; resources, G.M.; writing—original draft preparation, G.M., M.T. and D.A.; writing—review and editing, G.M. and N.S.; visualization, N.S. and M.K.; supervision, G.M.; project administration, G.M.; funding acquisition, G.M. All authors have read and agreed to the published version of the manuscript.

Funding

The work was performed under financial support of the State Institution “Science Committee of the Ministry of Science and Higher Education of the Republic of Kazakhstan” within the framework of the Scientific-Technical Program BR18574073 “Designing and development of new innovative devices, materials, and high technologies for introduction and application of hydrogen energy in Kazakhstan”.

Data Availability Statement

Data is contained within the article.

Conflicts of Interest

The authors declare no conflict of interest.

References

  1. Yusaf, T.; Laimon, M.; Alrefae, W.; Kadirgama, K.; Dhahad, H.A.; Ramasamy, D.; Kamarulzaman, M.K.; Yousif, B. Hydrogen Energy Demand Growth Prediction and Assessment (2021–2050) Using a System Thinking and System Dynamics Approach. Appl. Sci. 2022, 12, 781. [Google Scholar] [CrossRef]
  2. de Abreu, V.H.S.; Pereira, V.G.F.; Proença, L.F.C.; Toniolo, F.S.; Santos, A.S. A Systematic Study on Techno-Economic Evaluation of Hydrogen Production. Energies 2023, 16, 6542. [Google Scholar] [CrossRef]
  3. Saeedi, S.; Nguyen, X.T.; Bossola, F.; Evangelisti, C.; Dal Santo, V. Methane Reforming Processes: Advances on Mono- and Bimetallic Ni-Based Catalysts Supported on Mg-Al Mixed Oxides. Catalysts 2023, 13, 379. [Google Scholar] [CrossRef]
  4. González, J.F.; Álvez-Medina, C.M.; Nogales-Delgado, S. Biogas Steam Reforming in Wastewater Treatment Plants: Opportunities and Challenges. Energies 2023, 16, 6343. [Google Scholar] [CrossRef]
  5. Yeletsky, A.V. Processes in chemical lasers [Protsessy v khimicheskikh lazerakh]. Adv. Phys. Sci. [Uspekhi Fiz. Nauk.] 1981, 134, 279–314. (In Russian) [Google Scholar]
  6. Kondratiev, V.N. The Energy of Breaking Chemical Bonds. Ionization Potentials and Electron Affinities: Handbook [Energiya Razryva khimicheskikh Svyazey. Potentsialy Ionizatsii i Srodstvo k elektronu: Spravochnik]; Publishing House of the USSR Academy of Sciences: Moscow, Russia, 1962; 216p. (In Russian) [Google Scholar]
  7. Okechukwu, C.C.; Alabi, S.B. Profitability Analysis of Selected Steam Methane Reforming Methods for Hydrogen Production. J. Power Energy Eng. 2022, 10, 45–53. [Google Scholar] [CrossRef]
  8. Yonus, T.; Answer, A.; Asim, Z.; Surahio, M. Production of Hydrogen by Steam Methane Reformation Process. In Proceedings of the 2018 3rd International Conference on Advances on Clean Energy Research (ICACER 2018), Barcelona, Spain, 6–8 April 2018; Volume 51, p. 03003. [Google Scholar] [CrossRef]
  9. Supat, K.; Chavadej, S.; Lobban, L.L.; Richard, G. Mallinson. Combined Steam Reforming and Partial Oxidation of Methane to Synthesis Gas under Electrical Discharge. Energy Fuels 2003, 17, 474–481. [Google Scholar] [CrossRef]
  10. Yao, S.L.; Suzuki, E.; Meng, N.; Nakayama, A.A. High-Efficiency Reactor for the Pulsed Plasma Conversion of Methane. Plasma Chem. Plasma Process. 2002, 22, 225–237. [Google Scholar] [CrossRef]
  11. Daniel, C. Schram. Plasma processing and chemistry. Pure Appl. Chem. 2002, 74, 369–380. [Google Scholar] [CrossRef]
  12. Sharafutdinov, R.G.; Zarvin, A.Y.e.; Madirbayev, V.Z.h.; Gagachev, V.V.; Gartvich, G.G. Production of hydrogen from methane in electron beam plasma [Polucheniye vodoroda iz metana v elektronno-puchkovoy plazme]. Lett. J. Tech. Phys. [Pis’ma V Zhurnal Tekhnicheskoy Fiz.] 2005, 31, 23–28. (In Russian) [Google Scholar]
  13. Kozlov, K.V.; Michel, P.; Wagner, H.-E. Synthesis of Organic Compounds from Mixtures of Methane with Carbon Dioxide in Dielectric-Barrier Discharges at Atmospheric Pressure. Plasmas Polym. 2000, 5, 129–150. [Google Scholar] [CrossRef]
  14. Ruzinska, E.; Kurdel, M.; Morvova, M. Influence of DC corona discharge with one electrode deep in water on the mixture of combustion products of natural gas with natural gas. In Proceedings of the 1996 5th International Symposium on High Pressure Low Temperature Plasma Chemistry (HAKONE-5), Milovy, Czech Republic, 2–4 September 1996; Volume 1, pp. 290–294. [Google Scholar]
  15. Zherlitsyn, A.G.; Korzhenko, D.V.; Shiean, V.P. Hydrogen production from the natural gas in the microwave discharged at atmospheric pressure [Polucheniye vodoroda iz prirodnogo gaza v plazme svch-razryada pri atmosfernom davlenii]. Gas Ind. Sci. Tech. Prod. J. [Gazov. Promyshlennost’ Nauchno-Tekhnicheskiy I Proizv. Zhurnal] 2018, 11, 104–113. (In Russian) [Google Scholar]
  16. Lemanov, V.; Lukashov, V.; Sharov, K.; Nezavitin, D. Turbulent spots in the flame of a diffusion torch. J. Phys. Conf. Ser. 2019, 1382, 012058. [Google Scholar] [CrossRef]
  17. Margulis, M.A. Sonochemistry and Cavitation; Gordon&Breach: London, UK, 1995; 545p. [Google Scholar]
  18. Bagrov, V.V.; Grafov, D.Y.; Desyatov, A.V.; Kruchinina, N.E.; Kuterbekov, K.A.; Nurakhmetov, T.N.; Yakushin, R.V. Ecologically Safe Cavity Way of Hydrogen Generation in Water Flows with Low Ionized Plasma Emergence. Ecol. Saf. 2013, 5, 21–24. [Google Scholar] [CrossRef]
  19. Pushkarev, A.I.; Novoselov, Y.N.; Remnev, G.E. Chain Processes in Low-Temperature Plasma [Tsepnyye Protsessy v Nizkotemperaturnoy Plazme]; Nauka: Novosibirsk, Russia, 2008; 226p. (In Russian) [Google Scholar]
  20. Aleksandrov, M.L.; Kusner, Y.S. Gas-Dynamic Molecular, Ion and Clustered Beams [Gazodinamicheskiye Molekulyarnyye, Ionnyye i Klastirovannyye Puchki]; Nauka: Leningrad, Russia, 1989; 271p. (In Russian) [Google Scholar]
  21. Gartvich, G.G.; Dudnikov, V.G.; Zarvin, A.E. Spatio-temporal characteristics of a supersonic flow formed using a pulsed electromagnetic valve [Prostranstvenno-vremennyye kharakteristiki sverkhzvukovogo potoka, formiruyemogo s pomoshch’yu impul’s¬nogo elektromagnitnogo klapana]. Instrum. Exp. Technol. [Prib. I Tekhnika Eksperimenta] 1977, 2, 134–136. (In Russian) [Google Scholar]
  22. Khmel, S.Y.; Sharafutdinov, R.G. Electron-induced fluorescence of carbon dioxide clusters. 1. Free stream of condensing gas [Elektronno-indutsirovannaya flyuorestsen¬tsiya klasterov dvuokisi ugleroda. 1. Svobodnaya struya kondensiruyushchegosya gaza]. J. Tech. Phys. [Zhurnal Tekhnicheskoy Fiz.] 1997, 67, 43–51. (In Russian) [Google Scholar]
  23. Vostrikov, A.A.; Gileva, V.P.; Dubov, D.Y. Electron—Induced fluorescence of clusters [Elektron—Indutsirovannaya flyuo-restsentsiya klasterov]. J. Tech. Phys. [Zhurnal Tekhnicheskoy Fiz.] 1992, 62, 60–69. (In Russian) [Google Scholar]
  24. Zarvin, A.E.; Korobeyshchikov, N.G.; Madirbaev, V.Z.; Sharafutdinov, R.G. The influence of condensation on the parameters of supersonic flows [Vliya¬niye kondensatsii na parametry sverkhzvukovykh potokov]. Lett. J. Tech. Phys. [Pis’ma V Zhurnal Tekhnicheskoy Fiz.] 2000, 26, 21–25. (In Russian) [Google Scholar]
  25. Anderson, J. Fundamentals of Aerodynamics, 6th ed.; McGraw-Hill Education: New York, NY, USA, 2017; 218p. [Google Scholar]
  26. Teso-Fz-Betoño, D.; Juica, M.; Portal-Porras, K.; Fernandez-Gamiz, U.; Zulueta, E. Estimating the Reattachment Length by Realizing a Comparison between URANS k-Omega SST and LES WALE Models on a Symmetric Geometry. Symmetry 2021, 13, 1555. [Google Scholar] [CrossRef]
  27. Han, M.; Sane, S.; Johnson, C.R. Exploratory lagrangian-based particle tracing using deep learning. J. Flow Vis. Image Process. 2022, 29, 73–96. [Google Scholar] [CrossRef]
  28. Dixon, P.M. Ripley’s K function. In Encyclopedia of Environmetrics; John Wiley & Sons: Chinchester, UK, 2002; Volume 3, pp. 1796–1803. [Google Scholar]
Figure 1. Computational domain in three-dimensional view, where ➀—convergent nozzle, ➁—transitional channel, ➂—divergent nozzle.
Processes 11 02991 g001
Figure 2. A schematic representation of a two-dimensional domain, where ➀—convergent nozzle, ➁—transitional channel, ➂—divergent nozzle.
Processes 11 02991 g002
Figure 3. Distribution of velocity and pressure for a c o n = 60 ° and a d i f = 20 ° .
Processes 11 02991 g003aProcesses 11 02991 g003b
Figure 4. Cavitation zone distribution at a c o n = 60 °   and a d i f = 20 ° .
Processes 11 02991 g004
Figure 5. Change in cavitation zone ( P c a v ) depending on the value of the convergent angle ( a c o n ) and divergent angle ( a d i f ).
Processes 11 02991 g005
Figure 6. Comparison of approaches to modeling the movement of aerosol particles, where the color in particle tracing represents absolute velocity.
Processes 11 02991 g006aProcesses 11 02991 g006b
Figure 7. Ripley’s K-function to determine the clustering effect, with different colors representing individual particles and their respective Ripley’s K-function radii.
Processes 11 02991 g007
Figure 8. Location of boundary conditions and counting area for Ripley’s K-function.
Processes 11 02991 g008
Figure 9. Particle distribution at 20°, 30°, and 90° divergent nozzle expansion angles ( a d i f ) at t = 0.014   s , where the color represents absolute velocity.
Processes 11 02991 g009
Figure 10. Ripley’s K-function for different divergent nozzle expansion angles ( a d i f ) and change in the volume of the cylinder depending on the radius (r).
Processes 11 02991 g010
Figure 11. An example of calculating the deviation area of the Ripley K-function at a d i f = 90 ° from the dimensionless curve of changes in the volume of a cylinder depending on the radius (r).
Processes 11 02991 g011
Figure 12. Uniformity of particle distribution based on the proximity of Ripley’s K-function to the volume function at different values of the divergent nozzle expansion angle ( a d i f ).
Processes 11 02991 g012
Figure 13. Uniformity of particle distribution based on the proximity of Ripley’s K-function to the volume function at different values of the number of particles discharged from the inlet ( N 0 ).
Processes 11 02991 g013
Disclaimer/Publisher’s Note: The statements, opinions and data contained in all publications are solely those of the individual author(s) and contributor(s) and not of MDPI and/or the editor(s). MDPI and/or the editor(s) disclaim responsibility for any injury to people or property resulting from any ideas, methods, instructions or products referred to in the content.

