Article

Analysis of Controllability in Cyber–Physical Power Systems under a Novel Load-Capacity Model

1
Key Laboratory of Cyber–Physical Power System of Yunnan Colleges and Universities, Yunnan Minzu University, Kunming 650504, China
2
Measurement Verification Department of the Measurement Center of Yunnan Power Grid Co., Ltd., Kunming 650217, China
3
Power Science Research Institute of Yunnan Power Grid Co., Ltd., Kunming 650217, China
*
Author to whom correspondence should be addressed.
Processes 2023, 11(10), 3046; https://doi.org/10.3390/pr11103046
Submission received: 4 October 2023 / Revised: 19 October 2023 / Accepted: 21 October 2023 / Published: 23 October 2023

Abstract

:
In cyber–physical power systems (CPPSs), system collapse can occur as a result of a failure in a particular component. In this paper, an approach is presented to build the load-capacity model of CPPSs using the concept of electrical betweenness and information entropy, which takes into account real-time node loads and the allocation of power and information flows within CPPSs. By introducing an innovative load redistribution strategy and comparing it with conventional load distribution strategies, the superior effectiveness of the proposed strategy in minimizing system failures and averting system collapses has been demonstrated. The controllability of the system after cascading failures under different coupling strategies and capacity parameters is investigated through the analysis of different information network topologies and network parameters. It was observed that CPPSs constructed using small-world networks, which couple high-degree nodes from the information network to high-betweenness nodes from the power grid, exhibit improved resilience. Furthermore, increasing the capacity parameter of the power network yields more favorable results compared to increasing the capacity parameter of the information network. In addition, our research results are validated using the IEEE 39-node system and the Chinese 132-node system.

1. Introduction

In recent years, Industry 4.0 has emerged as a fundamental concept in the new wave of the industrial revolution. This revolutionary force has been instrumental in driving the global manufacturing industry toward digital transformation and intelligent advancement [1,2]. Inspired by the ideals of Industry 4.0, the smart grid has gradually embodied comprehensive perception, intelligent decision making, and autonomous control, ultimately transforming into the cyber–physical power system (CPPS) [3]. CPPS is characterized by its digitalized, networked and intelligent nature. By seamlessly integrating state-of-the-art information and communication technology, automation control technology, and data analysis technology, the power system is equipped to achieve superior optimization and flexible operation.
However, while the fusion of power systems with communication technology has brought a wealth of benefits, it has also introduced potential threats to power systems [4,5,6]. For example, changes in the network topology of the information system have the propensity to cause delays or even obstructions in the transmission of information, thus disrupting real-time monitoring of the power system [7]. Moreover, the security vulnerabilities inherent in these information systems, such as malicious hacker infiltration and the insidious spread of computer viruses, are apt to jeopardize the safe and stable operation of these power systems. In addition, disruptions and anomalous conditions within the power system can also have a detrimental impact on the information systems [8]. Unlike other intricate networks, the cyber–physical power system embodies a higher degree of intricacy, which reduces its resilience in the face of abrupt power fluctuations or on-site failures, further accentuating the vulnerabilities within the network.
The failure of a specific component within the CPPS can lead to cascading failures and, in severe cases, to the total collapse of the system. In 2010, Buldyrev [9] introduced the concept of interdependent networks in power systems, emphasizing that a failure in one network can cause failures in nodes of other networks that depend on it, which is referred to as cascading failures. Subsequently, many researchers built on this concept and used complex network theory to study the mechanisms of cascading failures in various systems. They proposed cascading failure models such as load capacity models [10,11], epidemic models [12], OPA failure models (ORNL-PSERC-Alaska, OPA), sandpile models [13], and power flow models [14] to explain the causes behind cascading failure phenomena. Regarding the common load capacity models, various researchers have proposed different load redistribution strategies. Wang [10], based on the betweenness centrality of each node, defined initial load and overload functions for each node and then proposed an evaluation method for the importance of network nodes based on these measures. Wang [15] proposed the strategy of redistributing the load among the nearest neighbors. As shown in the approach, the load of each failed node is distributed to its neighbors. On the other hand, Nguyen [16] ranked the importance of nodes and lines based on the DC power flow in the power system to reduce the damage caused by cascading failure attacks. Cai [17] proposed a dependency network model between the power grid and the scheduling data network based on dynamic flow. In recent years, numerous scholars and researchers have extended the concept of cascading failure in single-layer networks to the realms of dual-layer and even multi-layer networks. Artime [18] and Zhou [19], respectively, delve into the impact of non-local cascading failures and network inter-similarity on the robustness of multi-layered multiplex networks. Meanwhile, Artime [20] explores the characteristics of networks under varying circumstances, ranging from the perspective of multi-layered structures and dynamics. These modeling methods are effective, but the purpose of studying a system is to gain better control over it. As the scale of CPPS gradually expands, it is imperative for us to study the controllability during the cascading failure process.
The integration of power systems and information systems has improved the controllability and observability of power systems [21]. However, it has also made the control of cyber–physical power systems more challenging. For a given initial time t 0 and final time t f , if there exists a set of control signals u ( t ) that allow the network to transition from an initial state x ( t 0 ) to any desired state x ( t f ) , then the system is said to be fully controllable. In this paper, the term “node failure” indicates that a node has ceased to function, thereby interrupting normal operations following the failure of the node. Liu [22] first proposed the theory of structural controllability, establishing a research framework for the controllability of complex networks. They also showed that driver nodes tend to avoid high-degree nodes, addressing the issue of controllability in directed networks. However, it revealed limitations when dealing with undirected networks, weighted networks, and certain large-scale networks. Therefore, Yuan [23] introduced the concept of exact controllability in 2013, solving the controllability determination problem for networks with arbitrary topologies, undirected networks, and networks with weighted edges.Wang [24] extended the concept of structural controllability by considering the controllability of multi-input multi-output systems. They found that in certain cases, even if a system satisfies structural controllability, it may still be uncontrollable. The above problems are based on single-layer networks, but in reality, many networks are multi-layer. Jiang [25] investigated the controllability of multi-layer networks with high-dimensional node states and analyzed the structural controllability of interdependent networks with known directed subnetworks. In addition, Miao [26] investigated the controllability problem of matrix-weighted discrete-time leader–follower multi-agent systems (MASs).
It is worth noting that most of the previous work focused on network topologies with different types of links, which have different internal coupling patterns. In addition, the impact of different redistribution strategies on the controllability of CPPS may vary.
Taking these factors into consideration, a load-based redistribution strategy is proposed, and the controllability of CPPS is investigated under different coupling strategies and attack scenarios. This paper focuses primarily on the controllability of interdependent power systems in the face of cascading failure models, as well as the influence of network topology, coupling patterns, and attack scenarios on said controllability. The main contributions of this research are outlined below:
  • By combining the network topology and functional characteristics of the system, a load-capacity model is developed to address the research gap in cascading failure of CPPS. The validity of the results is verified through the modeling of realistic networks, enhancing the persuasiveness of our findings.
  • By considering the real-time node loads and the distribution of power flow and information flow in CPPS, a novel load redistribution strategy is introduced. Compared to other strategies, this strategy can quickly terminate failures and prevent system collapse.
  • This paper comprehensively analyzes different information network topologies and network parameters, and it investigates the controllability of the system after cascading failures under different coupling strategies and capacity parameters. Guidelines for future smart grid planning are provided.
The remaining sections of this paper are organized as follows. Section 2 outlines the methodology used in this study. Section 3 focuses on the fault propagation model of CPPS under cascading failures. Section 4 presents the simulation analysis and related discussions. Finally, Section 5 provides a summary of the research conducted in this paper.

2. Methods

The purpose of studying a system is to gain better control over it. In this paper, the controllability of CPPS is analyzed based on the cyber–physical power system model, taking into account both its physical characteristics and topological properties.

2.1. Cyber–Physical Power System Model

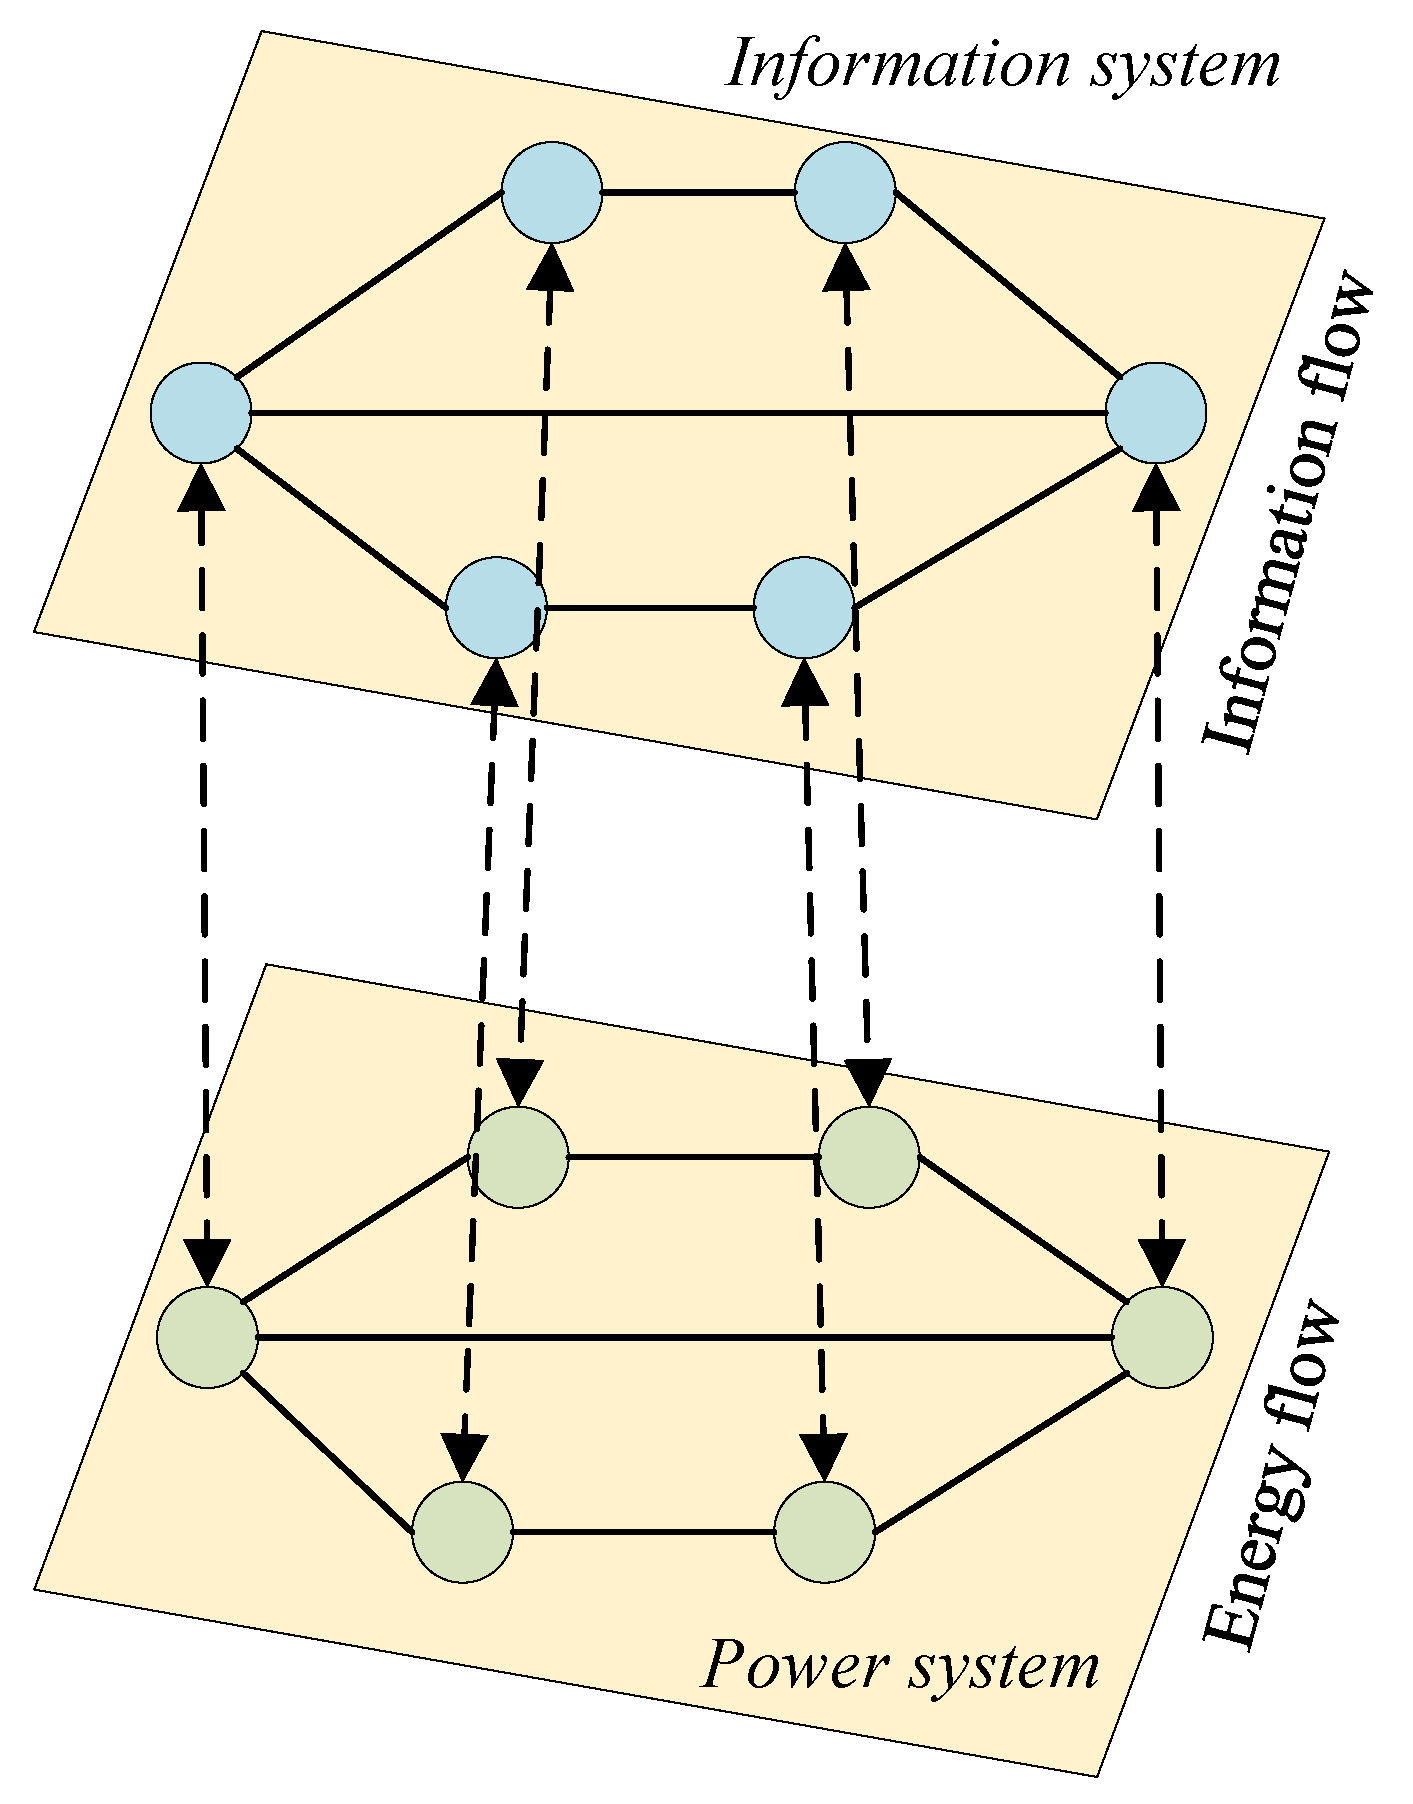
A cyber–physical power system is an intricately interconnected network consisting of a power grid and an information network. Within this system, the nodes of the information network monitor control the nodes of the power grid, while the nodes of the power grid provide electrical power to the information devices, as shown in Figure 1.
In explaining the CPPS, it can be said that there is a symbiotic relationship between the nodes of the power system and the information system. The CPPS intricately weaves these systems together and embodies their interplay. This interconnectedness facilitates the transmission and dissemination of power-related data and communication information between the two systems, thereby promoting the synchronized functioning of the power and information systems.
In the realm of graph theory, CPPS can be conceptualized as a collection of vertices and edges. The components of CPPS, which include power plants, loads, and communication devices, can be aptly viewed as vertices within the graphical construct. Correspondingly, the power lines and information links that make up CPPS can be perceived as edges within the same construct. Thus, it becomes plausible to depict CPPS as shown in Figure 2.
For a graph G ( G p , G c , V ) , where G p and G c represent the power network and the information networks, respectively, and V represents the set of edges in the system, the power system with N power nodes can be represented as:
G p = p 11 p 1 N p N 1 p N N N × N
where p i j represents the connection between ( i , j ) , and p i j = 1 if there is a connection between ( i , j ) , i.e.,:
p i j = 1 there is an edge between node i and node j 0 there is no edge between node i and node j
Similarly, in the information network with M information nodes:
G c = c 11 c 1 M c M 1 c M M M × M
where
c i j = 1 there is an edge between node i and node j 0 there is no edge between node i and node j
Similarly, the edges connecting the N nodes in the power system and the M nodes in the information system can be defined as r m n . The coupling matrix between the power system and the information system can be defined as:
R = r 11 r 1 M r N 1 r N M N × M
where
r i j = 1 there is an edge between node i and node j 0 there is no edge between node i and node j

2.2. Controllability of Cyber–Physical Power System

Representing real power information physical systems using unified equations is difficult due to their nonlinear nature. Nevertheless, there are many similarities between nonlinear and linear systems. Therefore, when dealing with nonlinear and time-invariant CPPSs, it is possible to explore their linear dynamics. The dynamics equations for these linear time-varying systems can be formulated as follows:
d x ( t ) t = G p C C T G c x ( t ) + B τ P B τ c u ( t )
where x ( t ) = [ x 1 ( t ) , x 2 ( t ) , . . . , x N + M ( t ) ] represent the state of nodes, x ( t ) R ( N + M ) . And u ( t ) = [ u 1 ( t ) , u 2 ( t ) , . . . , u s ( t ) ] represents a set of independent input signals, u ( t ) R s . A = G p C C T G c ( N + M ) × ( N + M ) is the transpose adjacency matrix of the CPPS, which reflects its internal dynamics. B = B τ p B τ c s defines how the input signals are coupled to the system, and B τ p represents the input signals in the power network, while B τ c represents the input signals in the information network.
According to Kalman’s controllability rank condition [27], a system described by (7) is deemed fully controllable if and only if it can reach any desired state x ( t ) under the control of input signals if and only if the matrix
C = [ B , A B , A 2 B , , A N + M 1 B ]
is full rank, that is,
r a n k ( C ) = ( N + M ) .
Here, the concept of driver node density is employed to assess the controllability of the network. In Figure 3, input nodes u 1 , u 2 , and u 3 send control signals to nodes x 1 and x 2 , which are referred to as controlled nodes. When a controlled node is influenced by only one control signal, it is called a driver node. In Figure 3, x 1 serves as a driver node. The driver node density, denoted as n d , is defined as follows [22]:
n d = N D / ( M + N )
where N D is the minimum number of driver nodes in the network, and ( M + N ) is the total number of nodes in the CPPS, including both power and information network nodes. For a CPPS, the minimum number of driver nodes can be determined by calculating the maximum algebraic multiplicity δ ( λ i ) of the eigenvalues λ i of the network’s adjacency matrix. This can be expressed as follows [23]:
N D = max i { δ ( λ i ) }
The higher the density of driver nodes n d , the greater the number of driver nodes required for the network, indicating the poorer controllability of the network. Conversely, the lower the density of driver nodes n d , the fewer driver nodes are needed for the network, indicating better controllability.

3. Fault Propagation of CPPS under Cascading Failure

3.1. Initial Load and Capacity Model

A cyber–physical power system is a heterogeneous network formed by the coupling of a power grid and an information network. Therefore, many previous studies have treated the power grid and the information network equally, and the load-capacity models have also been treated as homogeneous [17]. As a result, the power grid and information network are considered separately in the CPPS. Each network’s capacity and load are defined independently. When describing the cascading failures in chemical process systems, the load-capacity model proposed by Motter [11] is often employed, where the node capacity is linearly related to the initial load. Building upon this, a load-capacity model for a cyber–physical power system is proposed in this paper. However, in contrast to the previous model, this study introduces a load-capacity model based on electrical betweenness and information entropy, which better aligns with the real-world scenarios of CPPSs.

3.1.1. Load Capacity Model in Power Networks

In the power grid, power nodes can be classified into three types based on their role:
  • Generation Nodes: These nodes feed power into the grid.
  • Load Nodes: These nodes consume power from the grid.
  • Transmission Nodes: These nodes neither consume nor contribute power to the grid.
In previous research, the principle of shortest path propagation is often used to study power networks. However, this approach is not appropriate because the power injected by the generation nodes propagates through all transmission lines.
For a power system with ( N + 1 ) nodes, the matrix form of the loop current equations can be given as
U b ˙ = Z b I b ˙
where U b ˙ is a column vector of size N × 1 , representing the vector of node voltages; Z b is a N × N matrix of loop impedance; and I b ˙ is a column vector of size N × 1 , representing the vector of injection currents. Equation (12) can be expanded as follows:
U ˙ 1 U ˙ 2 U ˙ n = z 11 z 12 z 1 n z 21 z 22 z 2 n z n 1 z n 2 z n n I ˙ 1 I ˙ 2 I ˙ 4
When power currents are injected between nodes i and j ( I i = 1 , I j = 1 ), the voltage at node k can be determined using the node voltage equations. Assuming that node k is not the reference node, the equation can be expressed as follows:
U ˙ k = z k 1 I ˙ 1 + z k 2 I ˙ 2 + + z k n I ˙ n = z k i I ˙ i + z k j I ˙ j
Unlike complex network theory, the distribution of power in power systems follows Kirchhoff’s laws. Therefore, the distance between two points is equivalent to the impedance between those two points. Based on these principles, the impedance between two points in a power system represents the “distance” or resistance to power flow between those points. This analysis helps in accurately modeling and understanding the power distribution in the system.
D i j = U ˙ i U ˙ j = z i i z i j z j i z j j = z i i + z j j 2 z i j
Therefore, based on the concept of node betweenness centrality, it is possible to calculate the electrical betweenness [28] of node i in the power network.
B ( i ) = l L , g G W l W g n f ( n ) 1 2 I lg ( i , n ) , j L , G l L , g G W l W g n f ( n ) I lg ( i , n ) , j L , G
where L and G are the load and generation nodes, and f ( i ) is the set of neighbors of node i. W l is the actual load or rated load of the load, W g is the actual power output or rated power of the generator, and I lg ( i , n ) represents the current flowing through the branch ( i , n ) when a unit current element is injected between the generation node G and the load node L.
Therefore, the initial load L ( i ) of node i in the power system can be defined as follows.
L p ( i ) = B ( i )
In actual power systems, each station will allocate a certain amount of reserve capacity to ensure the electricity market demand during equipment maintenance, accidents, and other situations. So, the network capacity parameter α is introduced in the power network to define the total capacity of each node as follows:
C p ( i ) = ( 1 + α ) L p ( i )

3.1.2. Load Capacity Model in Information Networks

For an information network, many studies in the literature equate the initial load of its nodes directly with the node’s betweenness centrality [29]. However, they overlook the information exchange between nodes. Entropy [30], which reflects the degree of disorder in a system, is a concept in physics. A higher entropy value indicates a more disordered system, while a lower entropy value indicates a more ordered system. In information theory, Shannon [31] introduced the concept of information entropy to measure the uncertainty or randomness of information. It is often used to measure channel capacity and other related problems.
H ( X ) = i = 1 n p ( x i ) log p ( x i )
where P ( x i ) is the probability that the random event X is x i . Thus, this paper is based on the concept of information entropy, and according to the different topologies of the network, the information entropy of different nodes is defined, which represents the initial load of information nodes.
L c ( i ) = H ( X ) = i = 1 n p ( x i ) log p ( x i )
where p ( x i ) is the influence of other nodes on node i.
p ( x i ) = K i j τ i K j
where K i is the degree of node i, and τ i is the set of neighboring nodes of node i. Similarly, the capacity of a node in an information network can be defined based on the capacity parameter β as follows:
C c ( i ) = ( 1 + β ) L c ( i )

3.2. The Process of Cascading Failure

In CPPS, cascading failures can occur for a variety of reasons, including physical failures, information failures, operational failures, malicious attacks, and more. When one node or component fails, it can potentially affect the surrounding nodes or components, resulting in additional failures. This chain reaction can spread quickly and result in the entire system being unable to operate normally.
In the domain of power systems, the conditions of a system are commonly categorized into three classifications according to the magnitude of the load [32]: light load, heavy load, and overload. Consequently, subsequent to a redistribution of the load, the condition of the node can be categorized into three classes based on this criterion:
  • Underloading Node: The node’s load is within its rated range.
  • Heavy-Loading Node: The load on the node exceeds the rated range but does not exceed the capacity of the node. Therefore, the node is still in a normal operating state, but it cannot remain in this state for a long time or it will cause the node to fail.
  • Overloading Node: The node load exceeds the capacity of the node and the node fails.
For example, in Figure 4a, the different colors of the six nodes represent their respective states. Due to a certain condition, node N 1 becomes overloading. At this point, N 1 fails and its load is transferred to its neighboring nodes. Subsequently, in Figure 4b, due to capacity constraints, the originally lightly loaded five nodes become burdened with increased load. As a result, N 4 becomes heavy loading, and N 2 and N 5 become overloading. Subsequently, N 2 and N 5 will repeat the process of load redistribution until the network stabilizes or collapses.
When node i fails due to overloading, the load of the failed node is distributed to the connected nodes in proportion to Q i j , where Q i j is defined as
Q i j = C ( j ) L ( j ) n f ( n ) C ( n ) L ( n )
After load redistribution, the new load of neighboring node j can be calculated as
L ( j ) = L ( j ) + Q i j L ( i )
As mentioned above, redistributing the load on node j can cause it to become overloading, potentially increasing the area of failure.

4. Case Study and Discussion

The load redistribution model proposed in this paper was validated, and its controllability changes during the process were analyzed using the IEEE standard 39-node system and the Chinese 132-node system. This paper assumes the assurance of complete synchronization between the power system and the information system, and unless otherwise specified, the system capacity parameters α and β are 0.5, respectively. The horizontal axis in the graph of this section, times of attacks, represents the system’s change in terms of controllability after enduring x instances of node attacks. The simulations in this paper were performed using MATLAB 2020b on a personal computer equipped with an Intel Core i5 2.4 GHz CPU and 16 GB RAM.
In general, the network coupling methods of CPPS can be categorized into a “one-to-one” coupling strategy and “one-to-many” coupling strategy. This paper adopts the “one-to-one” coupling strategy to analyze the cascading failure in CPPS. Meanwhile, the coupling methods between nodes in two networks can be divided into the following four methods:
  • DDM: High-degree nodes in the power network are connected to high-degree nodes in the information network.
  • BBM: High-betweenness nodes in the power network are connected to high betweenness nodes in the information network.
  • DBM: High-degree nodes in the power network are connected to high betweenness nodes in the information network.
  • BDM: High-betweenness nodes in the power network are connected to high-degree nodes in the information network.

4.1. Initial Network Topology

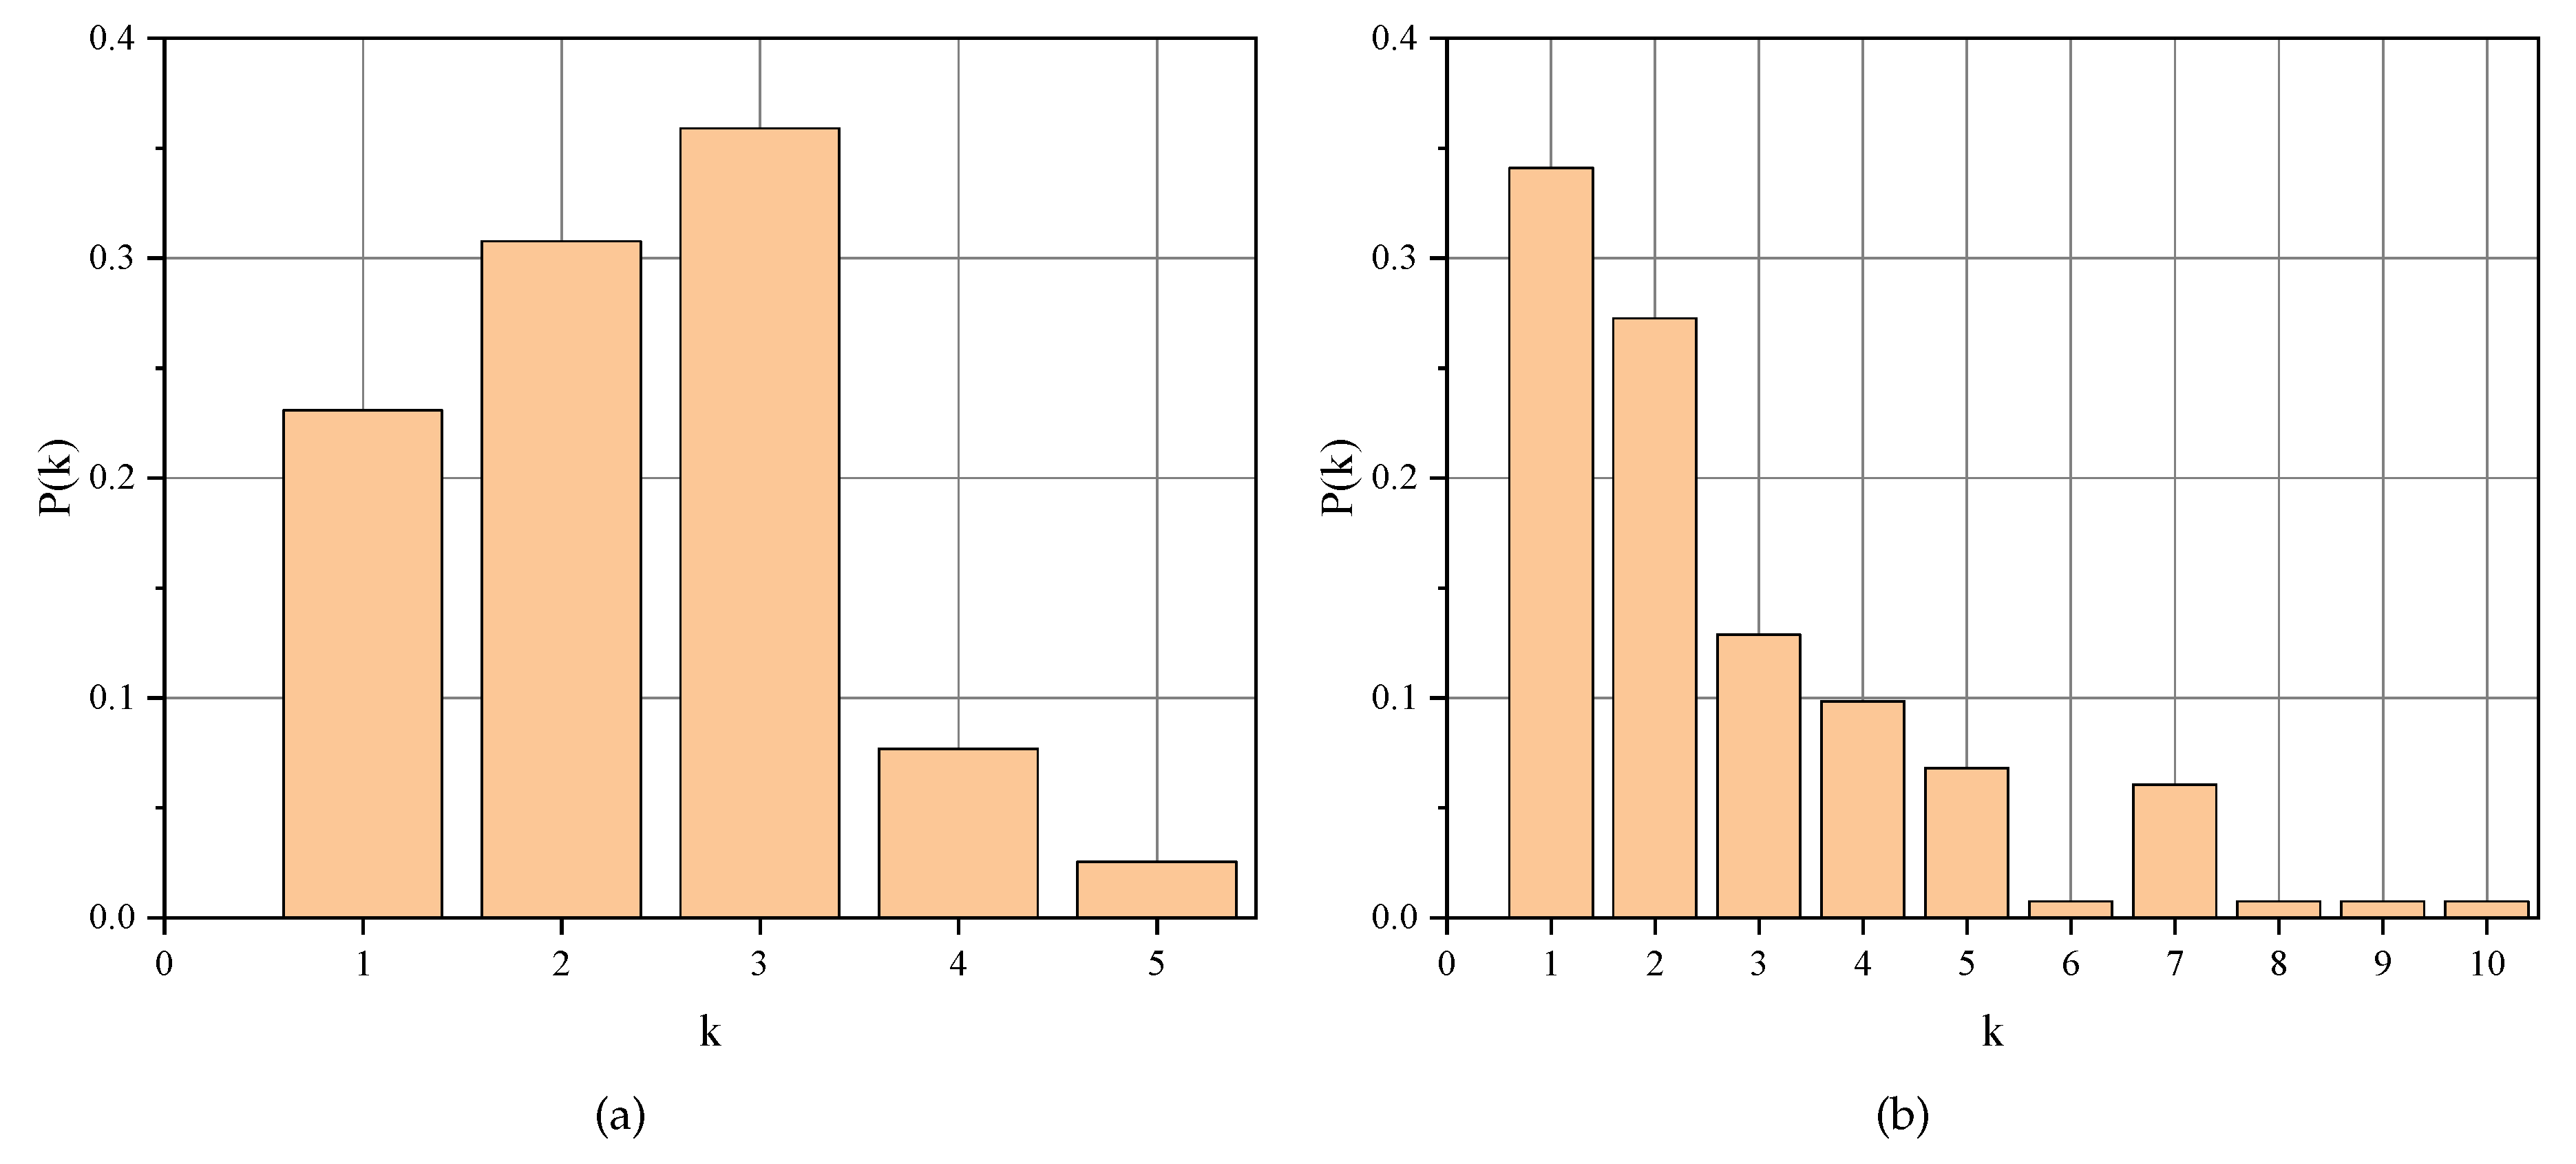
The power-side electrical network topology established on the basis of the IEEE 39-node system and the Chinese 132-node system is shown in Figure 5a and Figure 5b, respectively. The IEEE 39-node system consists of a total of 10 generators, 39 busbars, and 12 transformers. In contrast, the Chinese 132-node system represents a more streamlined provincial network consisting of 25 generators, 101 loads, and 180 transmission lines. The degree distribution for both systems is shown in Figure 6, and the statistical characteristics of the networks are summarized in Table 1.
The degree distributions in these two networks show notable differences. In the IEEE 39-node system, a significant proportion of nodes are connected to three or two other nodes, resulting in an intricate and highly clustered pattern. Conversely, in the 132-node system in China, the majority of nodes are connected to only one or two other nodes, resulting in a sparse and straightforward network structure. Referring to Table 1, there is a notable difference in driver node density and network clustering coefficient between the two networks. A higher minimum driver node density implies a higher number of required driver nodes. The network clustering coefficient [33] measures the degree to which neighboring nodes of a node are connected and is defined as the ratio of the actual number of connections between a node’s neighbors to the maximum possible number of connections. A larger clustering coefficient indicates more connections between nodes and a denser network. Indeed, these two networks exhibit different characteristics, and using both the IEEE standard 39-node system and the Chinese 132-node system for simulation helps improve the universality of the models.
To account for the uncertain topology of the information network, the simulation will be randomly run for 10,000 iterations. This approach aims to minimize the random errors stemming from the inherent randomness of the network.

4.2. The Controllability of CPPS in Different Network Types

The underlying topology of the information network is unknown, so all cascading failure processes in this paper are based on the failure of power nodes. In typical scenarios, the use of networks of equal scale, such as scale-free (BA) networks or small-world (WS) networks, is considered. Therefore, the impact of different attack strategies on the controllability of the system within these two network models is investigated.

4.2.1. Case A: IEEE 39-Node System

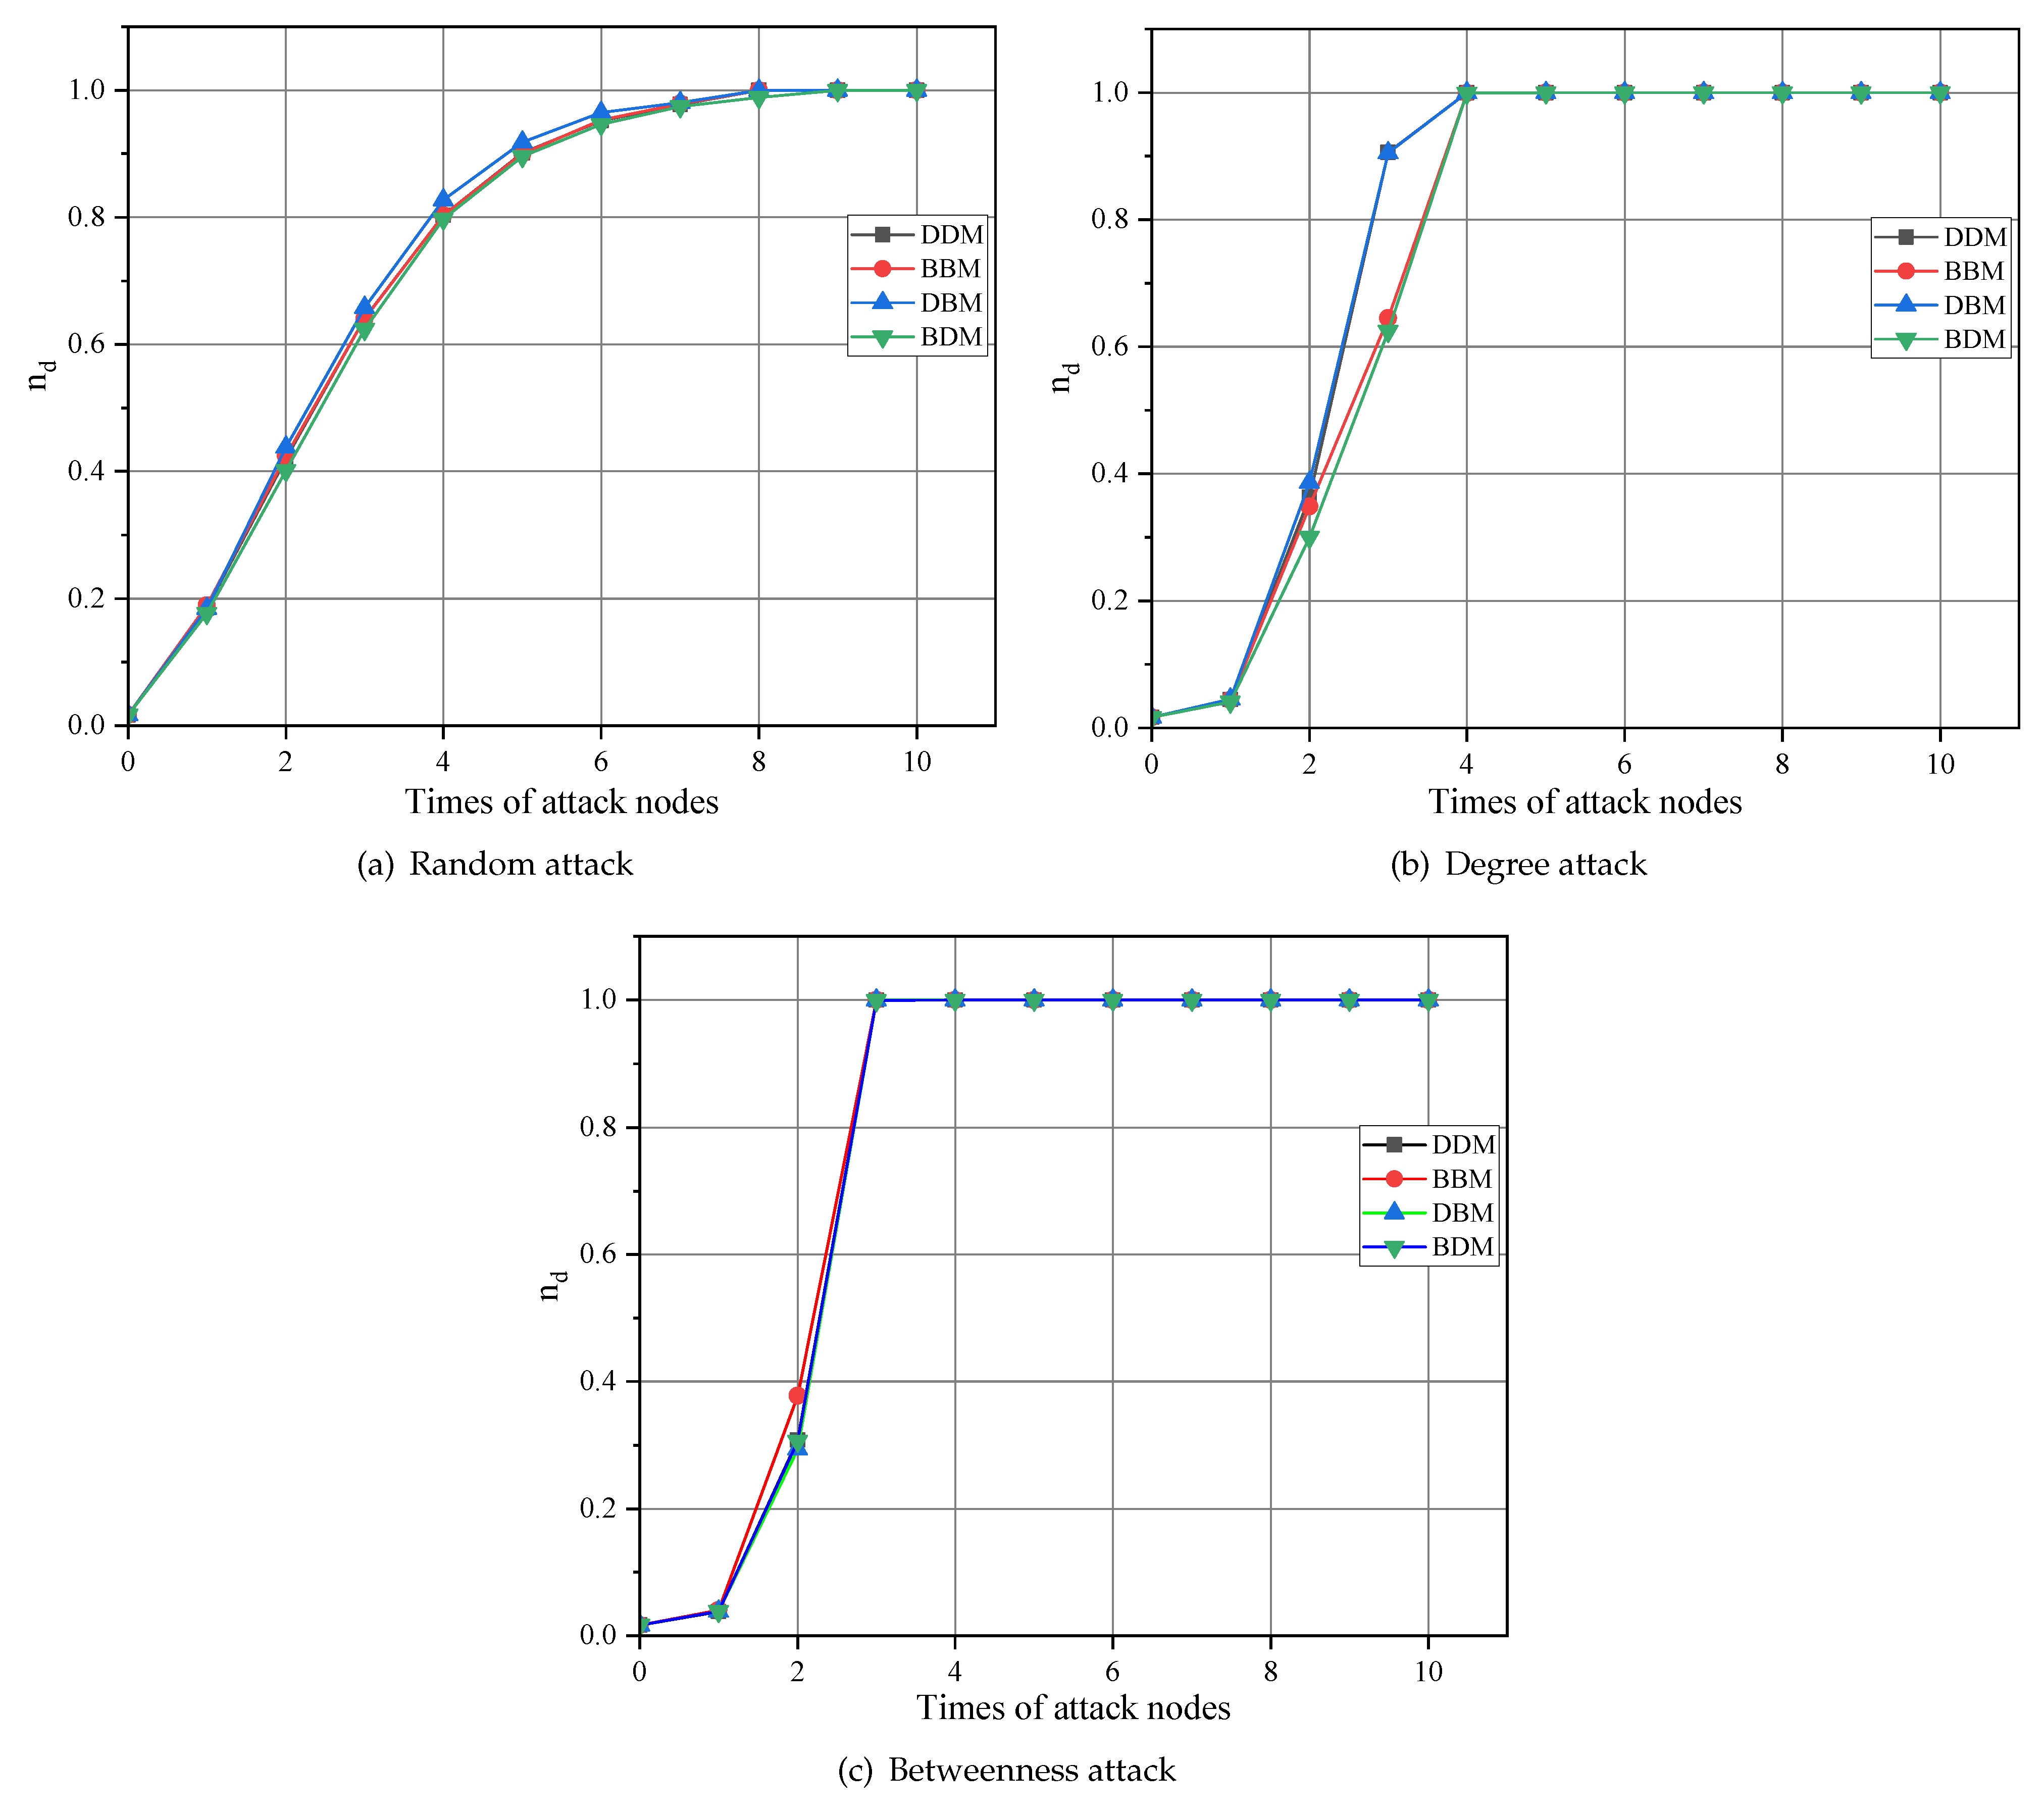
Under the three attack strategies, the information network is constructed into a BA network topology of the same scale, which is coupled with the IEEE 39-node system to form the CPPS. The controllability after cascading failure is shown in Figure 7, where (a), (b), and (c) represent the controllability changes of the network under random attack, degree attack, and betweenness attack, respectively. As shown in the figure, after the network is subjected to random attacks, the density of driver nodes gradually increases, while the controllability of the network gradually decreases. After the eighth attack, the network is on the verge of collapse under all four coupling modes. In contrast, after four degree attacks and three betweenness attacks, all four networks suddenly collapse. Prior to this, even though the network was under attack, the network still retained some isolated islands due to the redistribution of loads to neighboring nodes. However, the loads of certain nodes had reached the threshold, and after another attack, the network immediately collapsed completely.
After we constructed the information network into a WS network of the same scale and coupled it with the IEEE39 node system to form the CPPS, then three attack strategies of random, degree and betweenness are used to attack the IEEE 39-node system. The controllability of the network after the node load redistribution process is shown in Figure 8, and like the CPPS coupled with the information network built by the BA network, the CPPS drive node density under random attacks gradually increases and the network controllability gradually decreases. After the number of attacks reaches the 8th time, the network almost collapses under the four coupling methods. When the network was subjected to multiple attacks, the CPPS did not collapse most of the network after the third attack as before. Instead, it still survived most of the nodes and suddenly collapsed after the fourth attack. It is worth noting that after the third betweenness attack, the driver node density of the CPPS has been close to 1, which means that most of the CPPS was decomposed into islands at this time, and it can no longer meet the power demand or communicate with other nodes.

4.2.2. Case B: Chinese 132-Node System

Similarly, the Chinese 132-node system is taken as an example, and the BA network and WS network of the same size are coupled with the Chinese 132-node system to form a CPPS. The controllability of the network with different coupling strategies under three different attack strategies is shown in Figure 9 and Figure 10, respectively.
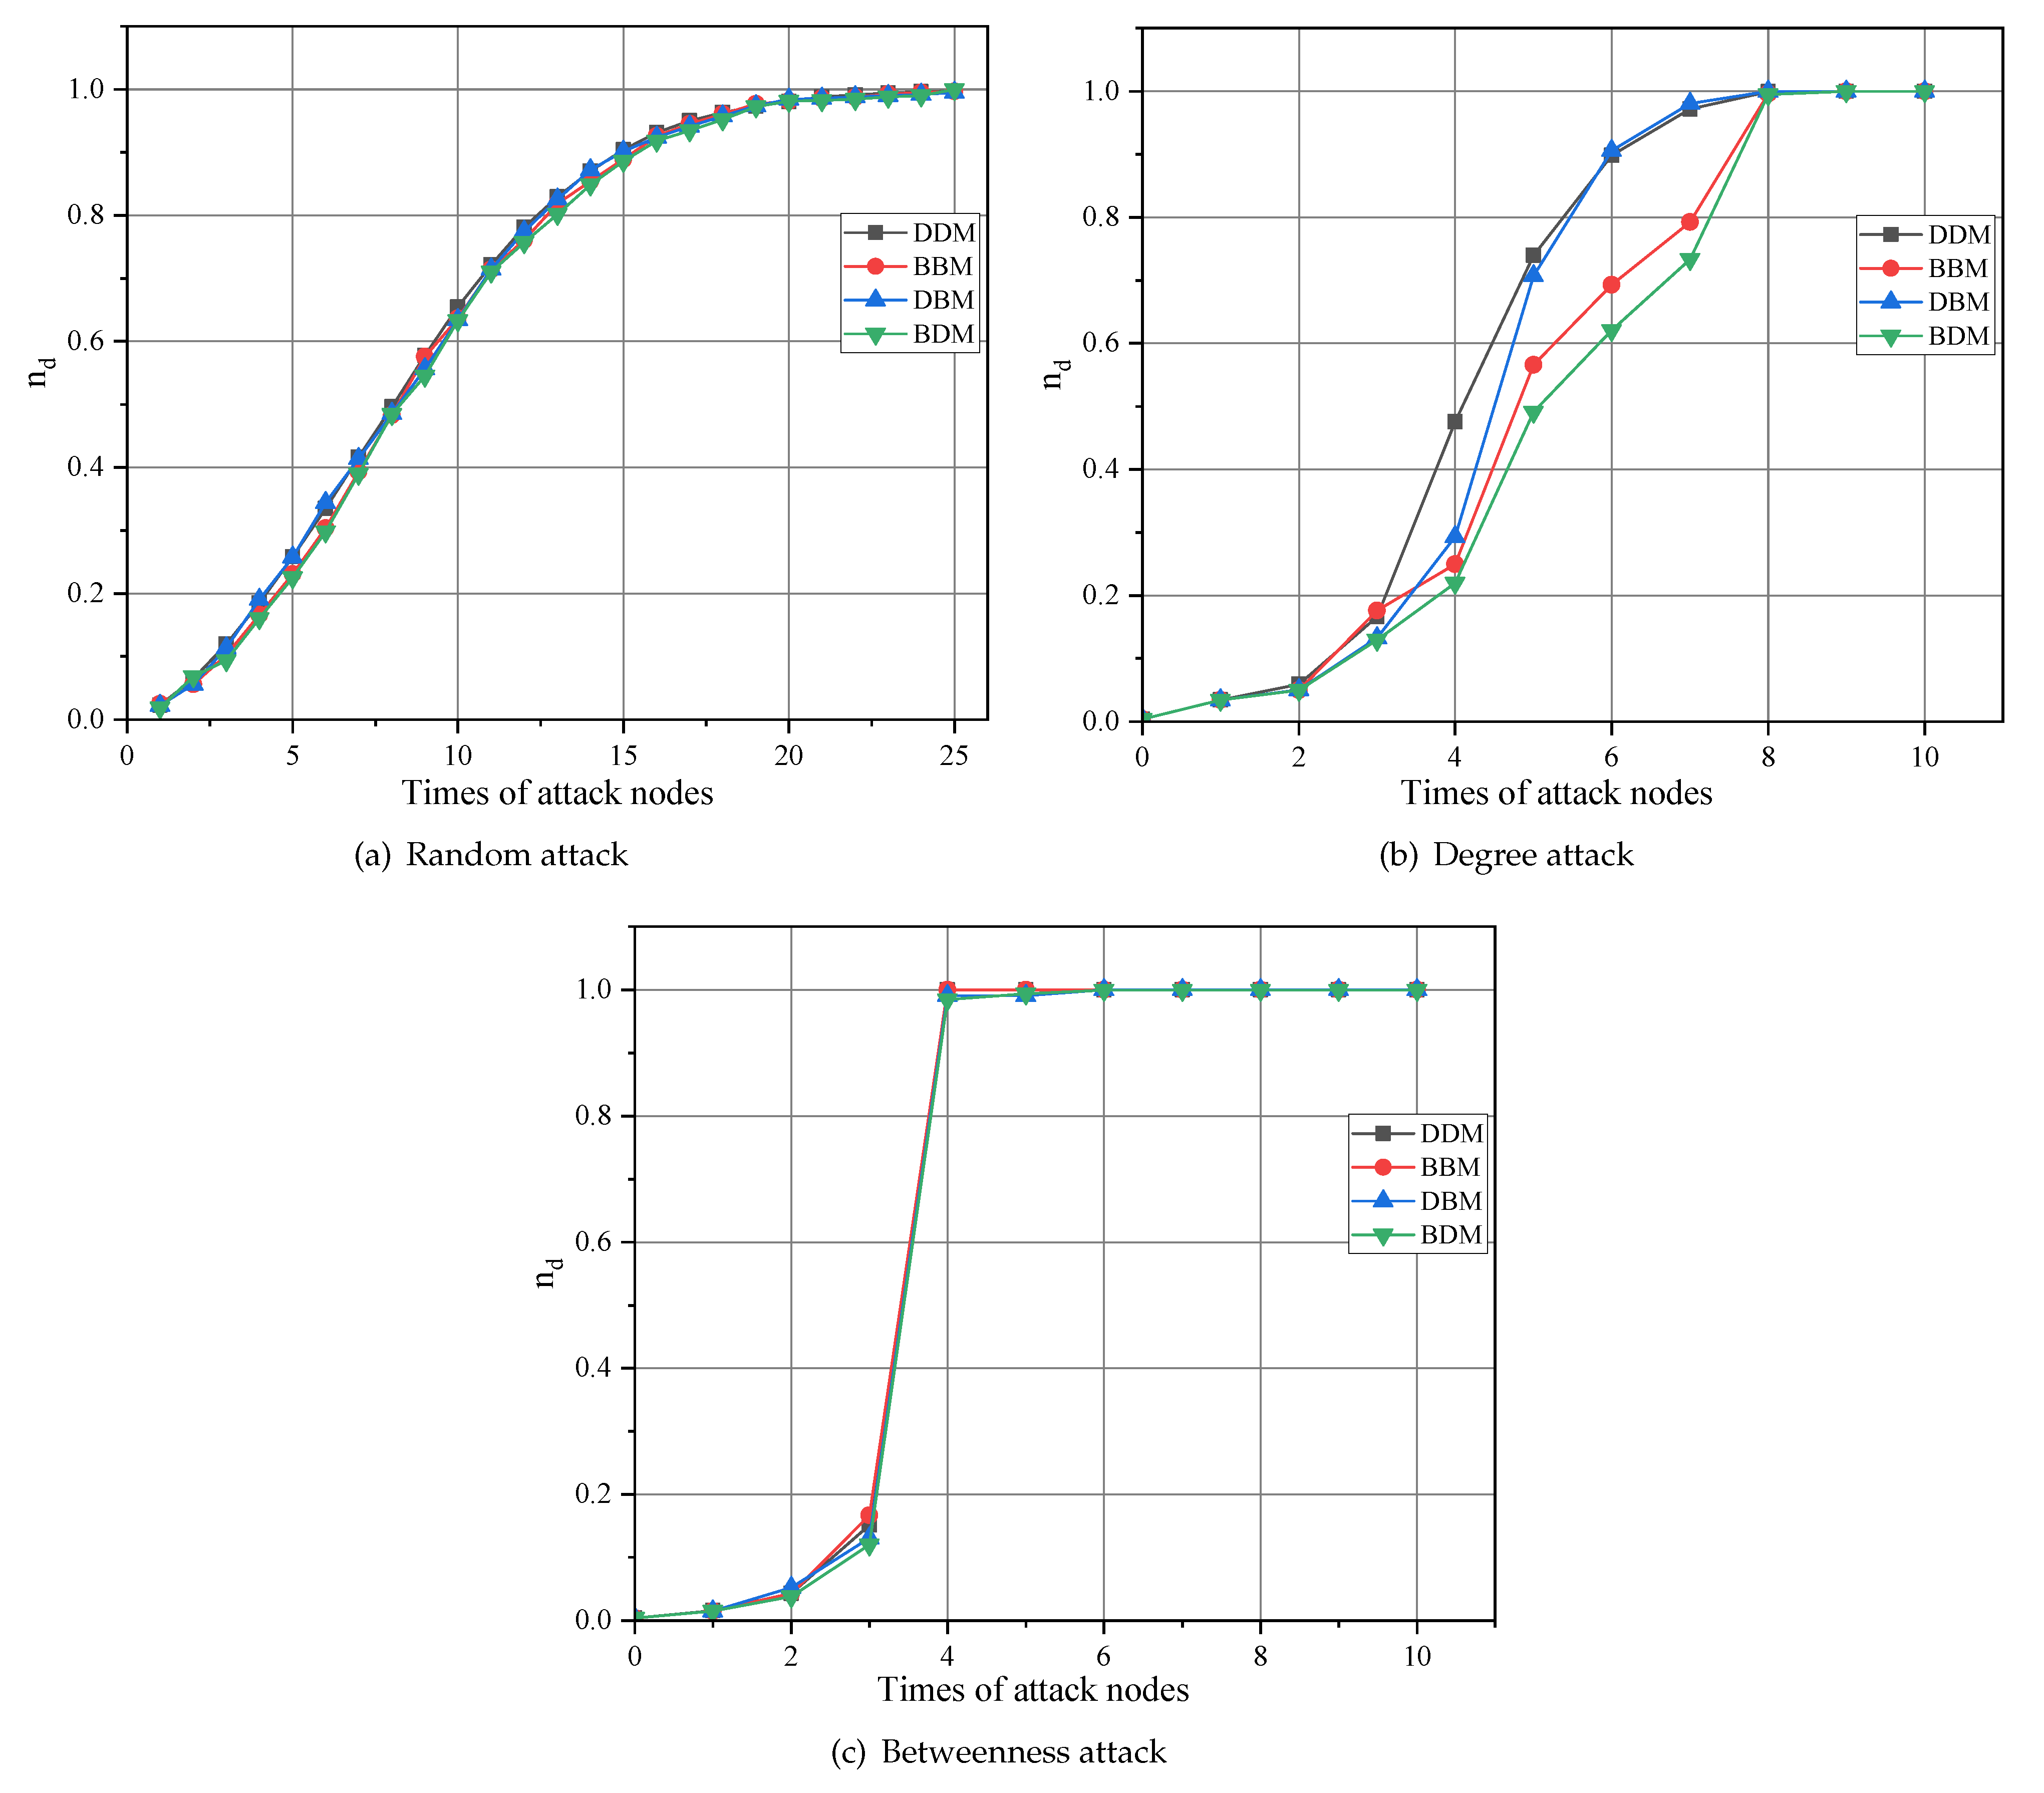
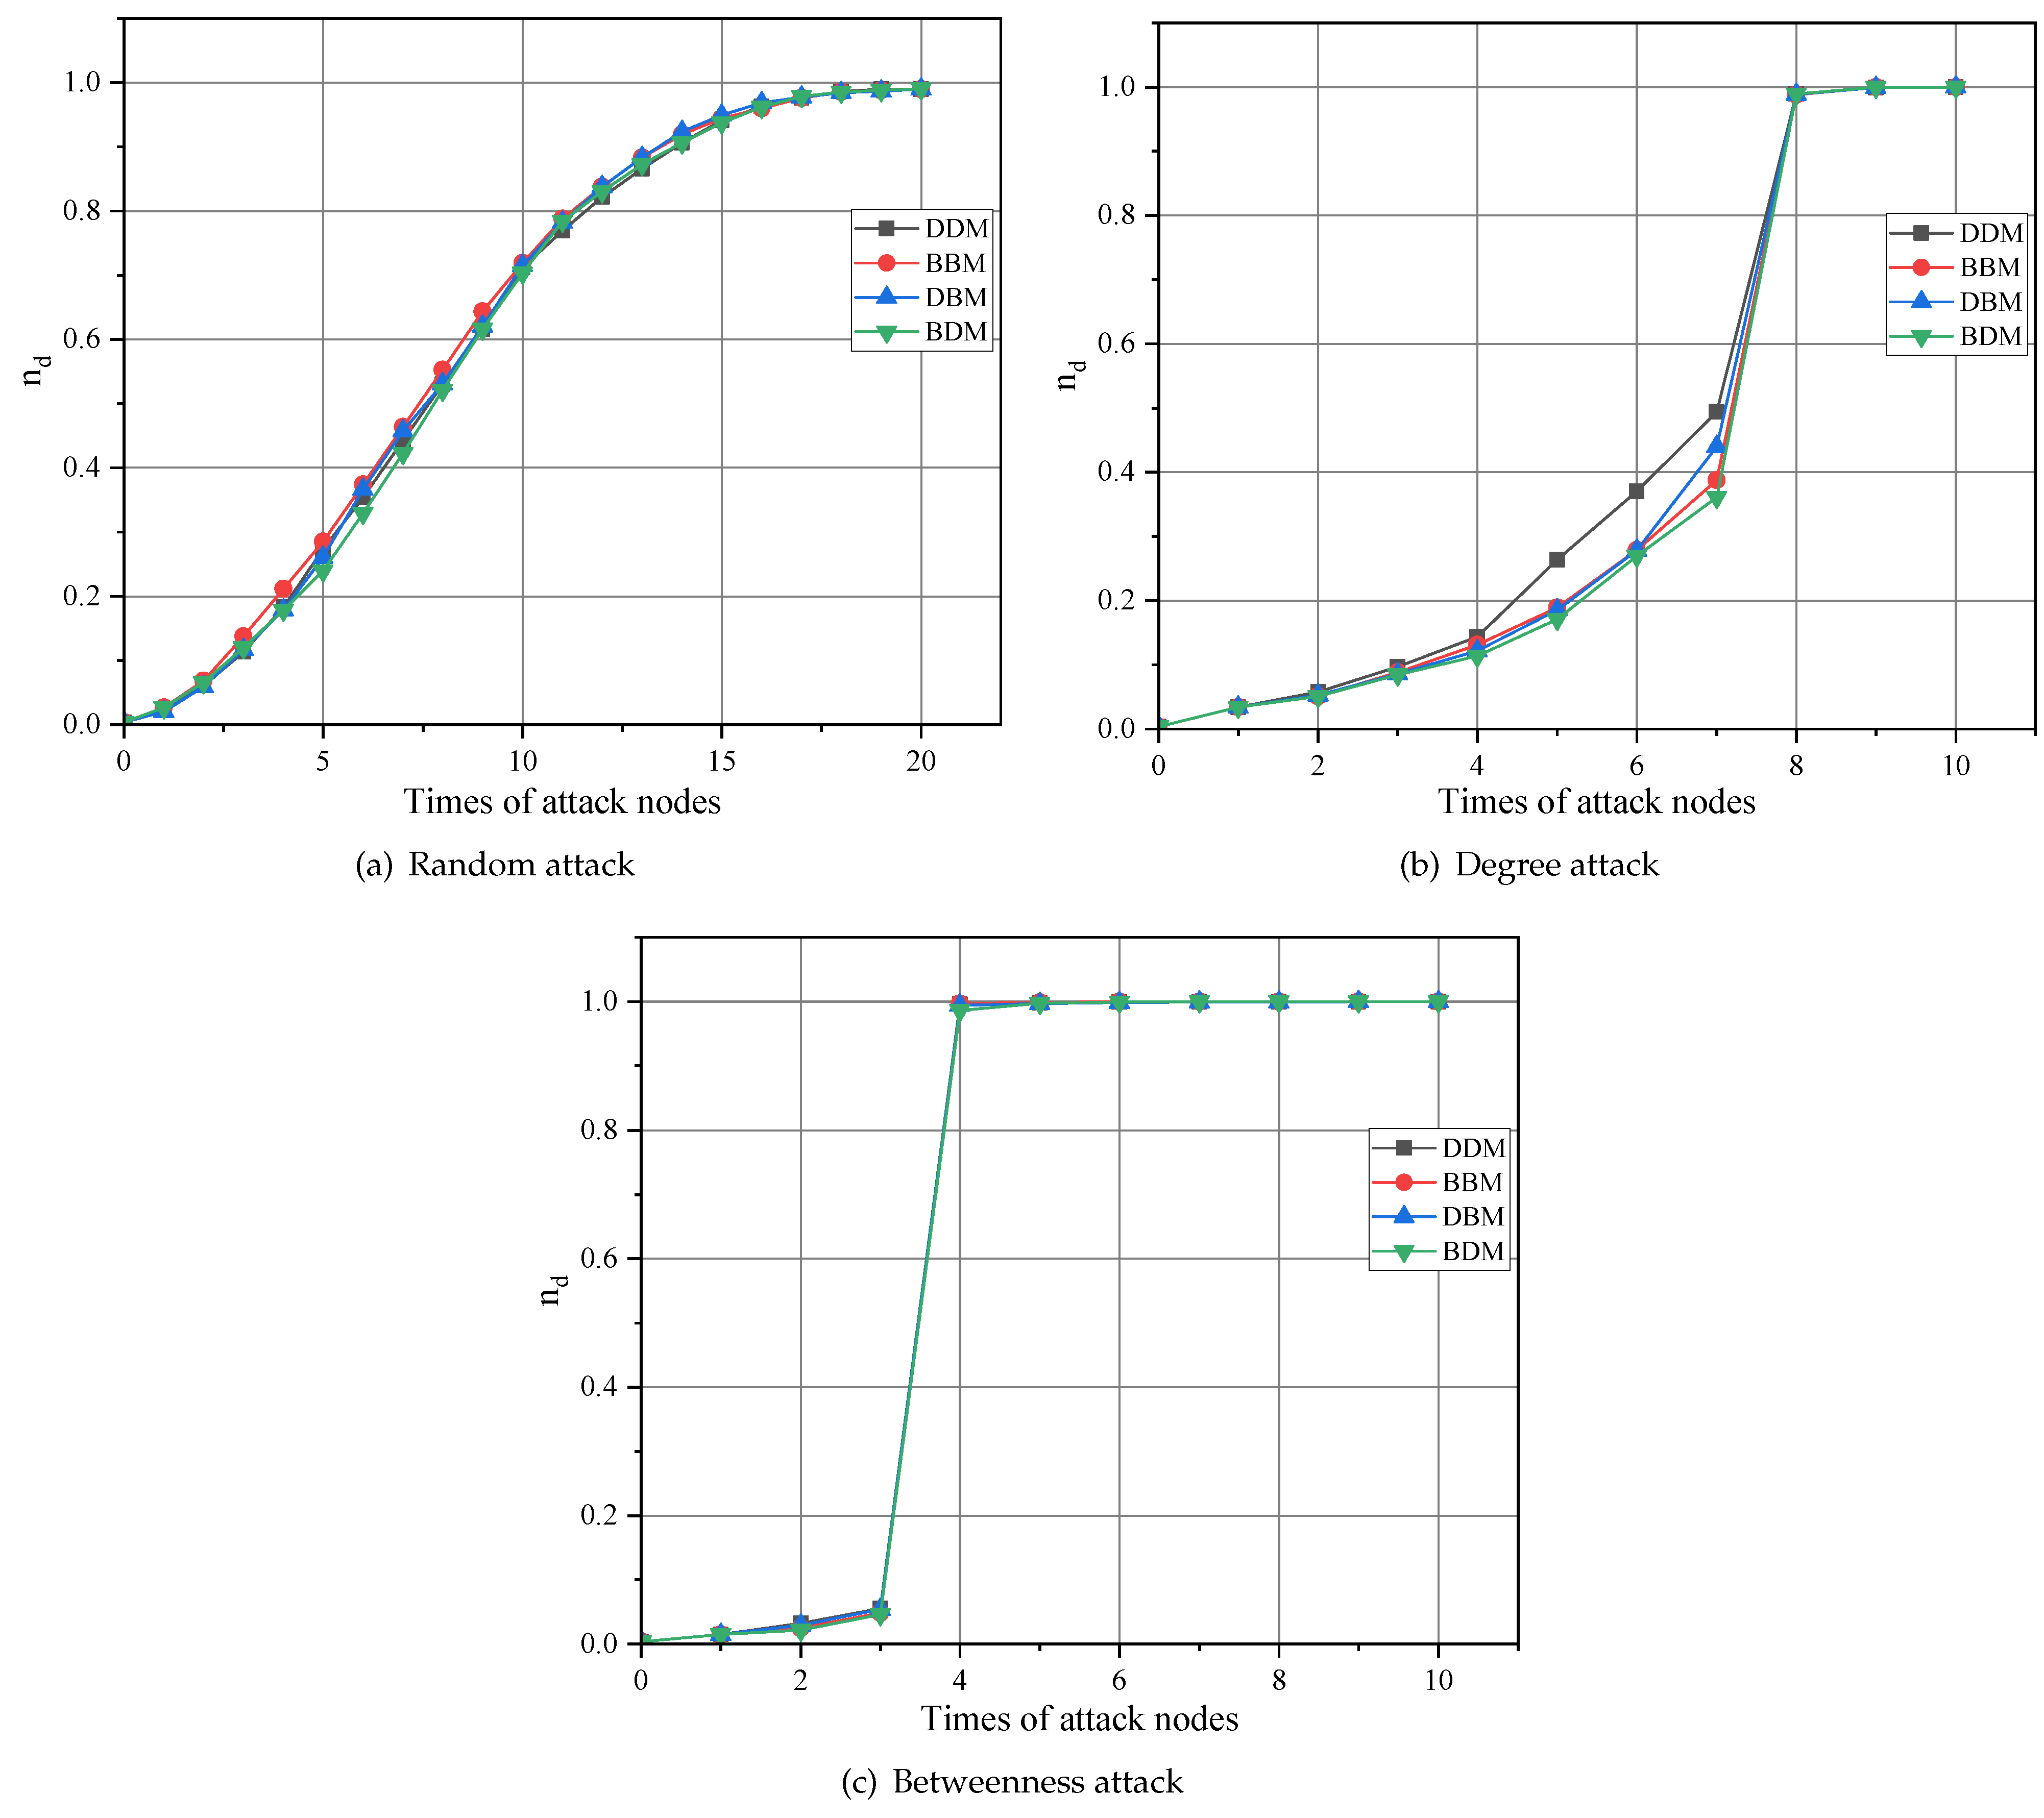
Figure 9 shows the controllability changes of a CPPS constructed with a BA network as its information network topology under different attack strategies. (a), (b), and (c) represent the controllability variation curves of the system under random, degree, and betweenness attack strategies, respectively. When the system is subjected to random attacks, the density of driver nodes gradually increases, while the controllability of the system decreases. The system is already in a state of collapse when the number of attacks reaches about 20. Meanwhile, under degree attacks, the controllability of the CPPS constructed with DDM and DBM strategies differs significantly from that of the CPPS constructed with BBM and BDM strategies when the number of attacks reaches 4. In comparison, the changes in the controllability of the CPPS under BBM and BDM strategies are relatively small when faced with multiple-node attacks, allowing for greater opportunities for system adaptation. Finally, under betweenness attacks, the system suddenly collapses when subjected to the fourth attack, and before that, the CPPS under all four coupling strategies was in a partially dysfunctional state.
Similarly, Figure 10 shows the changes in the controllability of the CPPS using the WS network as the information network when it is subjected to three attack strategies.
It is noteworthy that in any situation, deliberate attacks on networks do not significantly reduce the controllability of the network compared to random attacks. Deliberate attacks often target “hub” nodes that are connected to many other nodes. As a result, when a hub node fails, its neighboring nodes take over the load, preventing any further propagation of failures. In addition, the BDM coupling approach better withstands node failures or attacks, as the controllability degradation of the CPPS formed by BDM coupling is the slowest compared to the other three methods in all cases.
After comparing the two methods of constructing information networks, it was found that under the same circumstances, the CPPS composed of a WS network can exhibit stronger controllability when subjected to node attacks or failures. This finding has important implications for future designs of information systems and holds certain guiding significance. Small-world networks possess short average paths and high aggregation, which are highly advantageous in a CPPS, as they enable global connectivity and information transfer while maintaining local communication efficiency. Therefore, in the subsequent research, the information network will be constructed as a small-world network of the same size as the power network. Additionally, the power network and the information network will be coupled in a one-to-one manner based on BDM, thereby enhancing its adaptability to node attacks or failures.

4.3. CPPS Controllability under Different Redistribution Strategies

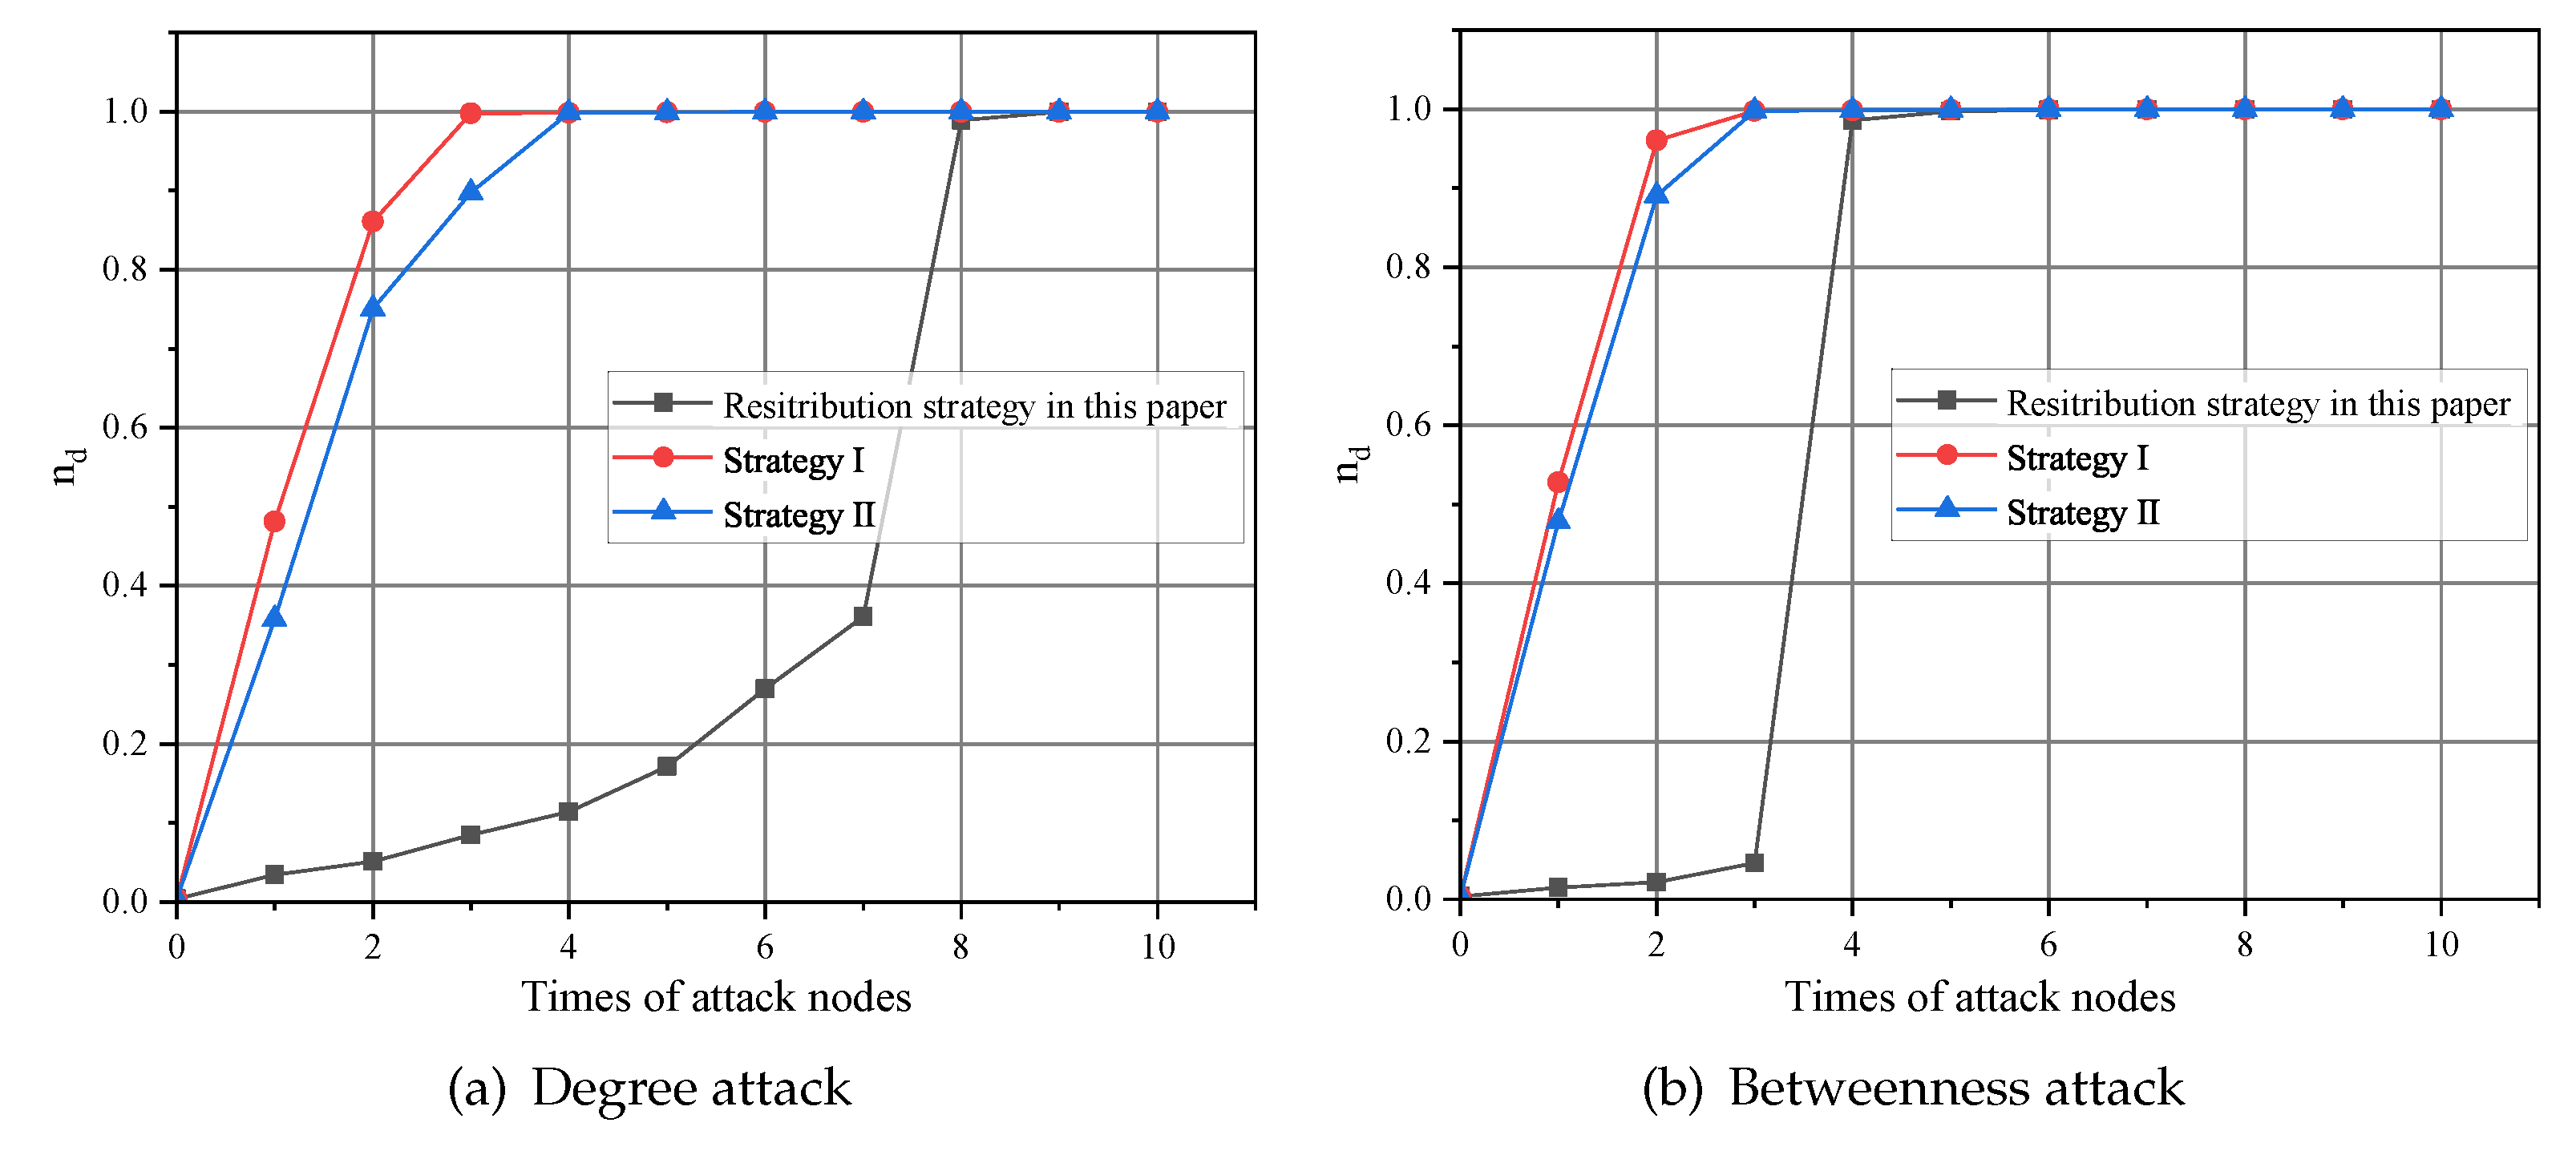
Network attacks can be divided into static and dynamic attacks. Static attacks refer to the attack sequence that has been determined when the system is established, while dynamic attacks dynamically adjust the attack sequence based on the real-time status and load of the system. Different from static attacks [34], this paper adopts dynamic attack strategies to make the attacks more targeted, and the network that survives this situation has higher stability. This section compares the load redistribution strategy introduced in this paper with the load redistribution strategies in other studies in the literature [35,36], and it analyzes the impact of different load redistribution strategies on the network controllability under different attack strategies.
Strategy I [35]: Distributing the failed load evenly among the neighboring nodes of the faulty node, based on the average number of neighboring nodes for each fault node.
Q i j = 1 N f ( i )
where N f ( i ) indicates the number of neighbor nodes of node i, and f ( i ) is the set of neighbor nodes of node i.
Strategy II [36]: Distributing the failed load evenly among the neighboring nodes of the faulty node based on the average number of neighboring nodes for each fault node.
Q i j = D j n f ( n ) D n
where D n indicates the degree of node n.
For degree attacks and betweenness attacks, the impact of various load redistribution strategies on system controllability was investigated in both scenarios.

4.3.1. Case A: IEEE 39-Node System

Using the IEEE 39-node system as an example, a comparison was made between the reallocation strategy proposed in this paper and strategy I and strategy II. The simulation results are shown in Figure 11. Under a degree attack on the network, the driver node density of strategies I and II increased significantly after the first attack, reaching about 0.8. However, before the network of the redistribution strategy in this paper was attacked for the third time, the driver node density of the network increased significantly. The density is kept below 0.3. At this point, the controllability of the network is much greater than that of the network under other redistribution strategies. It is worth noting that under betweenness attacks, after two betweenness attacks, the redistribution strategy of this paper still maintains the driver node density of the network below 0.1, which means that most nodes in the network are still in a normal state, while the other two redistribution strategies drive the node density to increase to about 0.8 after one betweenness attack, indicating that most nodes in the network are in an isolated state at this time.

4.3.2. Case B: Chinese 132-Node System

In the simulation of the Chinese 132-node system, under the degree attack, the simulation results are shown in Figure 12, which is similar to Case A. However, due to the increase in network scale, the driver node density of the network of the other two strategies is reduced after being attacked by two nodes. It reaches 0.8, while the redistribution strategy in this paper drives the node density to remain below 0.4 before being attacked by eight nodes, and the growth rate is much smaller than the other two strategies. Under betweenness attacks, the driver node density of the network of the three redistribution strategies is similar to that of case A, but the number of node attacks required to collapse the network is one more than that of case A, which is the reason why the network scale is larger than that.

4.4. Effect of Various Parameters on the Controllability of CPPS Cascading Failures

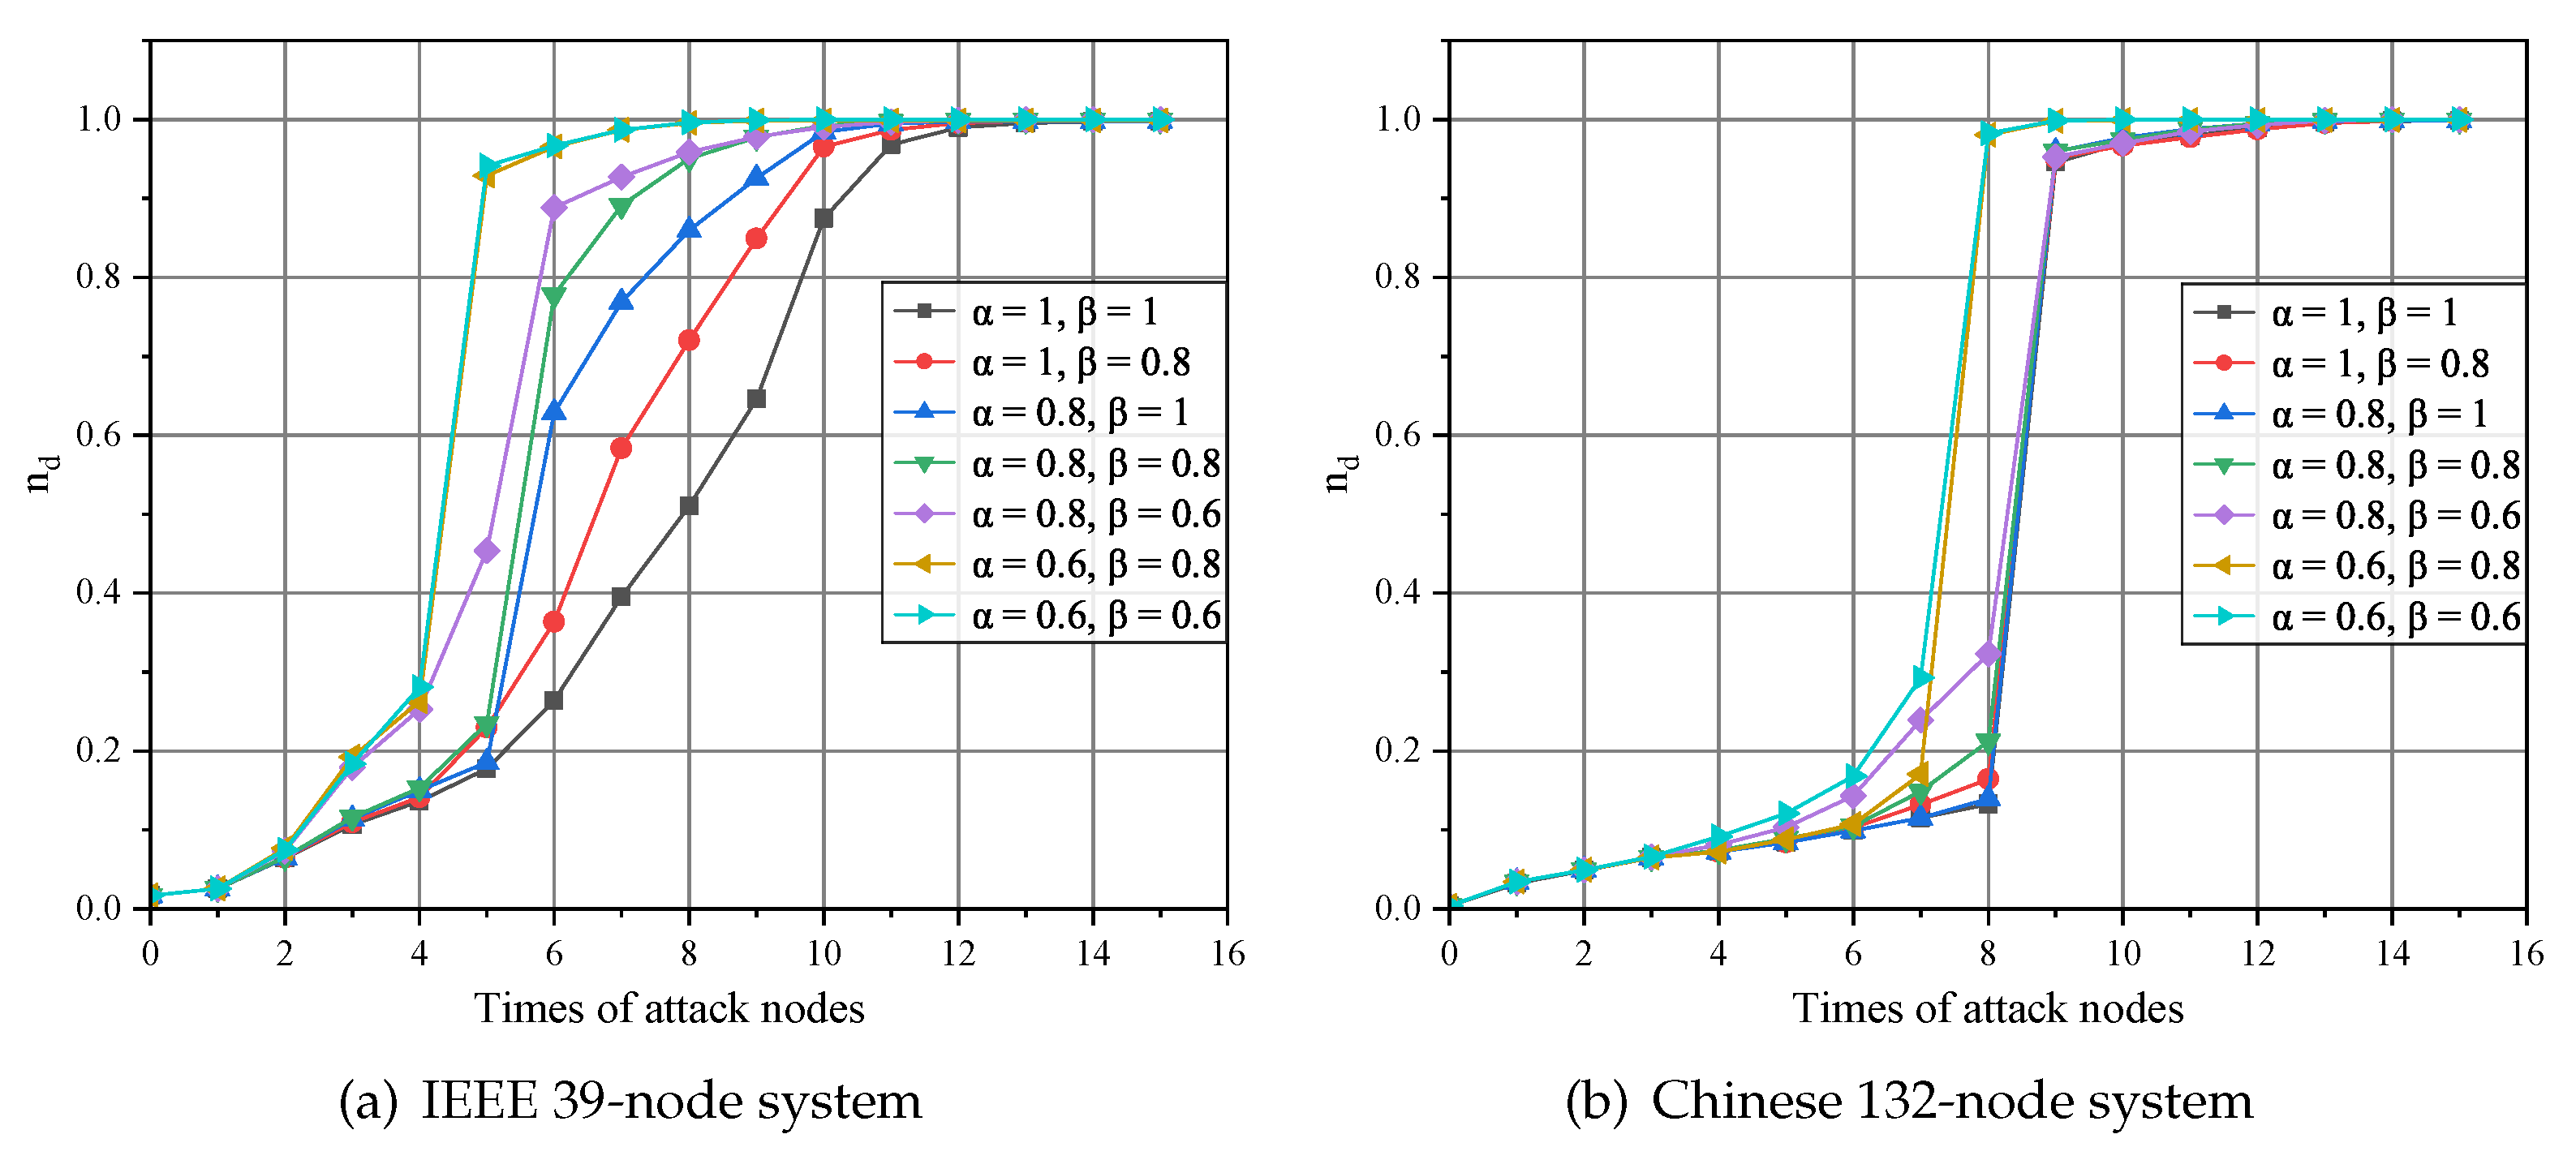
Under high-degree attacks, an analysis was conducted to assess the influence of various capacity parameters on the controllability of the network cascading failure process. The simulation results are shown in Figure 13. Figure 13a,b show the two networks under different capacity parameters, respectively, indicating the controllable performance of the cascading failure process. In Figure 13a,b, when α and β are both 1, the driver node density of the network increases the slowest. As α and β decrease, the driver node density of the network increases under the degree attack. The slope of the density curve also increases gradually, meaning that for the same number of node attacks, the driver node density increases as α and β decrease. It is worth noting that when α and β decrease by 0.2 each, the increment of the network’s driver node density is not the same, which means that the node capacity of the power network has a greater impact on the network’s controllability than the node capacity of the information network.

5. Conclusions

This study has considered both power flow and information exchange, and it has developed a load-capacity model for CPPS based on electrical betweenness and information entropy. By introducing a novel load redistribution strategy, the changes in the controllability of the network under different scenarios are analyzed. The research results suggest that the CPPS built on a small-world network coupled with high-degree nodes in the information network and high-betweenness nodes in the power network exhibits better resilience when dealing with network failures. In addition, improving the capacity parameters of the power network has a more significant effect than improving the capacity parameters of the information network. These research results provide valuable insights for future power network planning. In future research, emphasis will be placed on investigating the methods of one-to-many and many-to-many coupling as well as further exploring the controllability of CPPSs in the case of cascading failures under temporal constraints.

Author Contributions

Conceptualization, Y.G. and Y.L.; Methodology, Y.G. and Y.L.; Software, Z.H.; Validation, Q.Z.; Writing—original draft, Y.G.; Writing—review & editing, Y.L. and T.X. All authors have read and agreed to the published version of the manuscript.

Funding

This research was funded by the National Natural Science Foundation of China (grant number 62062068).

Data Availability Statement

Not applicable.

Acknowledgments

Thanks to Min Du of the University of Sheffield for data support for this paper.

Conflicts of Interest

The authors declare no conflict of interest.

References

  1. Faheem, M.; Shah, S.B.H.; Butt, R.A.; Raza, B.; Anwar, M.; Ashraf, M.W.; Ngadi, M.A.; Gungor, V.C. Smart grid communication and information technologies in the perspective of Industry 4.0: Opportunities and challenges. Comput. Sci. Rev. 2018, 30, 1–30. [Google Scholar] [CrossRef]
  2. Salkuti, S.R. Challenges, issues and opportunities for the development of smart grid. Int. J. Electr. Comput. Eng. 2020, 10, 1179–1186. [Google Scholar] [CrossRef]
  3. Qu, Z.; Shi, H.; Wang, Y.; Yin, G.; Abu-Siada, A. Active and Passive Defense Strategies of Cyber-Physical Power System against Cyber Attacks Considering Node Vulnerability. Processes 2022, 10, 1351. [Google Scholar] [CrossRef]
  4. Yohanandhan, R.V.; Elavarasan, R.M.; Manoharan, P.; Mihet-Popa, L. Cyber-physical power system (CPPS): A review on modeling, simulation, and analysis with cyber security applications. IEEE Access 2020, 8, 151019–151064. [Google Scholar] [CrossRef]
  5. Sturaro, A.; Silvestri, S.; Conti, M.; Das, S.K. A realistic model for failure propagation in interdependent cyber-physical systems. IEEE Trans. Netw. Sci. Eng. 2018, 7, 817–831. [Google Scholar] [CrossRef]
  6. Wang, Q.; Cai, X.; Tang, Y.; Ni, M. Methods of cyber-attack identification for power systems based on bilateral cyber-physical information. Int. J. Electr. Power Energy Syst. 2021, 125, 106515. [Google Scholar] [CrossRef]
  7. Khan, M.M.S.; Giraldo, J.A.; Parvania, M. Attack detection in power distribution systems using a cyber-physical real-time reference model. IEEE Trans. Smart Grid 2021, 13, 1490–1499. [Google Scholar] [CrossRef]
  8. Chen, Y.; Wei, W.; Liu, F.; Shafie-khah, M.; Mei, S.; Catalão, J.P. Optimal contracts of energy mix in a retail market under asymmetric information. Energy 2018, 165, 634–650. [Google Scholar] [CrossRef]
  9. Buldyrev, S.V.; Parshani, R.; Paul, G.; Stanley, H.E.; Havlin, S. Catastrophic cascade of failures in interdependent networks. Nature 2010, 464, 1025–1028. [Google Scholar] [CrossRef]
  10. Wang, X.; Du, J.; Zou, R.; Zhou, Z. Key node identification of wireless sensor networks based on cascade failure. Mod. Phys. Lett. B 2020, 34, 2050394. [Google Scholar] [CrossRef]
  11. Motter, A.E.; Lai, Y.C. Cascade-based attacks on complex networks. Phys. Rev. E 2002, 66, 065102. [Google Scholar] [CrossRef]
  12. Jin, Z.; Duan, D.; Wang, N. Cascading failure of complex networks based on load redistribution and epidemic process. Phys. A Stat. Mech. Its Appl. 2022, 606, 128041. [Google Scholar] [CrossRef]
  13. Lang, M.; Shkolnikov, M. Harmonic dynamics of the abelian sandpile. Proc. Natl. Acad. Sci. USA 2019, 116, 2821–2830. [Google Scholar] [CrossRef] [PubMed]
  14. Li, M.J.; Tse, C.K.; Liu, D.; Zhang, X. Cascading Failure Propagation and Mitigation Strategies in Power Systems. IEEE Syst. J. 2023, 17, 3282–3293. [Google Scholar] [CrossRef]
  15. Wang, W.X.; Chen, G. Universal robustness characteristic of weighted networks against cascading failure. Phys. Rev. E 2008, 77, 026101. [Google Scholar] [CrossRef] [PubMed]
  16. Nguyen, T.N.; Liu, B.H.; Nguyen, N.P.; Dumba, B.; Chou, J.T. Smart grid vulnerability and defense analysis under cascading failure attacks. IEEE Trans. Power Deliv. 2021, 36, 2264–2273. [Google Scholar] [CrossRef]
  17. Cai, Y.; Cao, Y.; Li, Y.; Huang, T.; Zhou, B. Cascading failure analysis considering interaction between power grids and communication networks. IEEE Trans. Smart Grid 2015, 7, 530–538. [Google Scholar] [CrossRef]
  18. Artime, O.; De Domenico, M. Abrupt transition due to non-local cascade propagation in multiplex systems. New J. Phys. 2020, 22, 093035. [Google Scholar] [CrossRef]
  19. Zhou, D.; Elmokashfi, A. Overload-based cascades on multiplex networks and effects of inter-similarity. PLoS ONE 2017, 12, e0189624. [Google Scholar] [CrossRef]
  20. Artime, O.; Benigni, B.; Bertagnolli, G.; d’Andrea, V.; Gallotti, R.; Ghavasieh, A.; Raimondo, S.; De Domenico, M. Multilayer Network Science: From Cells to Societies; Cambridge University Press: Cambridge, UK, 2022. [Google Scholar]
  21. Lo, C.H.; Ansari, N. Decentralized controls and communications for autonomous distribution networks in smart grid. IEEE Trans. Smart Grid 2012, 4, 66–77. [Google Scholar] [CrossRef]
  22. Liu, Y.Y.; Slotine, J.J.; Barabási, A.L. Controllability of complex networks. Nature 2011, 473, 167–173. [Google Scholar] [CrossRef] [PubMed]
  23. Yuan, Z.; Zhao, C.; Di, Z.; Wang, W.X.; Lai, Y.C. Exact controllability of complex networks. Nat. Commun. 2013, 4, 2447. [Google Scholar] [CrossRef] [PubMed]
  24. Wang, L.; Chen, G.; Wang, X.; Tang, W.K. Controllability of networked MIMO systems. Automatica 2016, 69, 405–409. [Google Scholar] [CrossRef]
  25. Jiang, L.; Tang, L.; Lü, J. Controllability of multilayer networks. Asian J. Control. 2022, 24, 1517–1527. [Google Scholar] [CrossRef]
  26. Miao, S.; Su, H.; Liu, B. Controllability of Discrete-Time Multi-agent Systems with Matrix-Weighted Networks. IEEE Trans. Circuits Syst. II Express Briefs 2023, 70, 2984–2988. [Google Scholar] [CrossRef]
  27. Kalman, R.E. Mathematical description of linear dynamical systems. J. Soc. Ind. Appl. Math. Ser. A Control. 1963, 1, 152–192. [Google Scholar] [CrossRef]
  28. Wang, K.; Zhang, B.h.; Zhang, Z.; Yin, X.g.; Wang, B. An electrical betweenness approach for vulnerability assessment of power grids considering the capacity of generators and load. Phys. A Stat. Mech. Its Appl. 2011, 390, 4692–4701. [Google Scholar] [CrossRef]
  29. Feng, O.; Zhang, H.; Liu, H.; Zhong, G. Enhancing the Robustness of Scale-Free Networks: The Simulation of Cascade Failures with Adjustable Initial Load Parameters. Processes 2023, 11, 2118. [Google Scholar] [CrossRef]
  30. Balasis, G.; Balikhin, M.A.; Chapman, S.C.; Consolini, G.; Daglis, I.A.; Donner, R.V.; Kurths, J.; Paluš, M.; Runge, J.; Tsurutani, B.T.; et al. Complex systems methods characterizing nonlinear processes in the near-earth electromagnetic environment: Recent advances and open challenges. Space Sci. Rev. 2023, 219, 38. [Google Scholar] [CrossRef]
  31. Shannon, C.E. A mathematical theory of communication. Bell Syst. Tech. J. 1948, 27, 379–423. [Google Scholar] [CrossRef]
  32. Von Meier, A. Electric Power Systems: A Conceptual Introduction; John Wiley & Sons: Hoboken, NJ, USA, 2006. [Google Scholar]
  33. Hamilton, W.L. Graph Representation Learning; Morgan & Claypool Publishers: Williston, VT, USA, 2020. [Google Scholar]
  34. Wang, Y.; Dong, J.; Zhao, J.; Qu, Z.; Huang, J. Dynamic Load Redistribution of Power CPS Based on Comprehensive Index of Coupling Node Pairs. Processes 2022, 10, 1937. [Google Scholar] [CrossRef]
  35. Ozel, O.; Sinopoli, B.; Yağan, O. Uniform redundancy allocation maximizes the robustness of flow networks against cascading failures. Phys. Rev. E 2018, 98, 042306. [Google Scholar] [CrossRef]
  36. Fu, X.; Yao, H.; Yang, Y. Cascading failures in wireless sensor networks with load redistribution of links and nodes. Ad Hoc Netw. 2019, 93, 101900. [Google Scholar] [CrossRef]
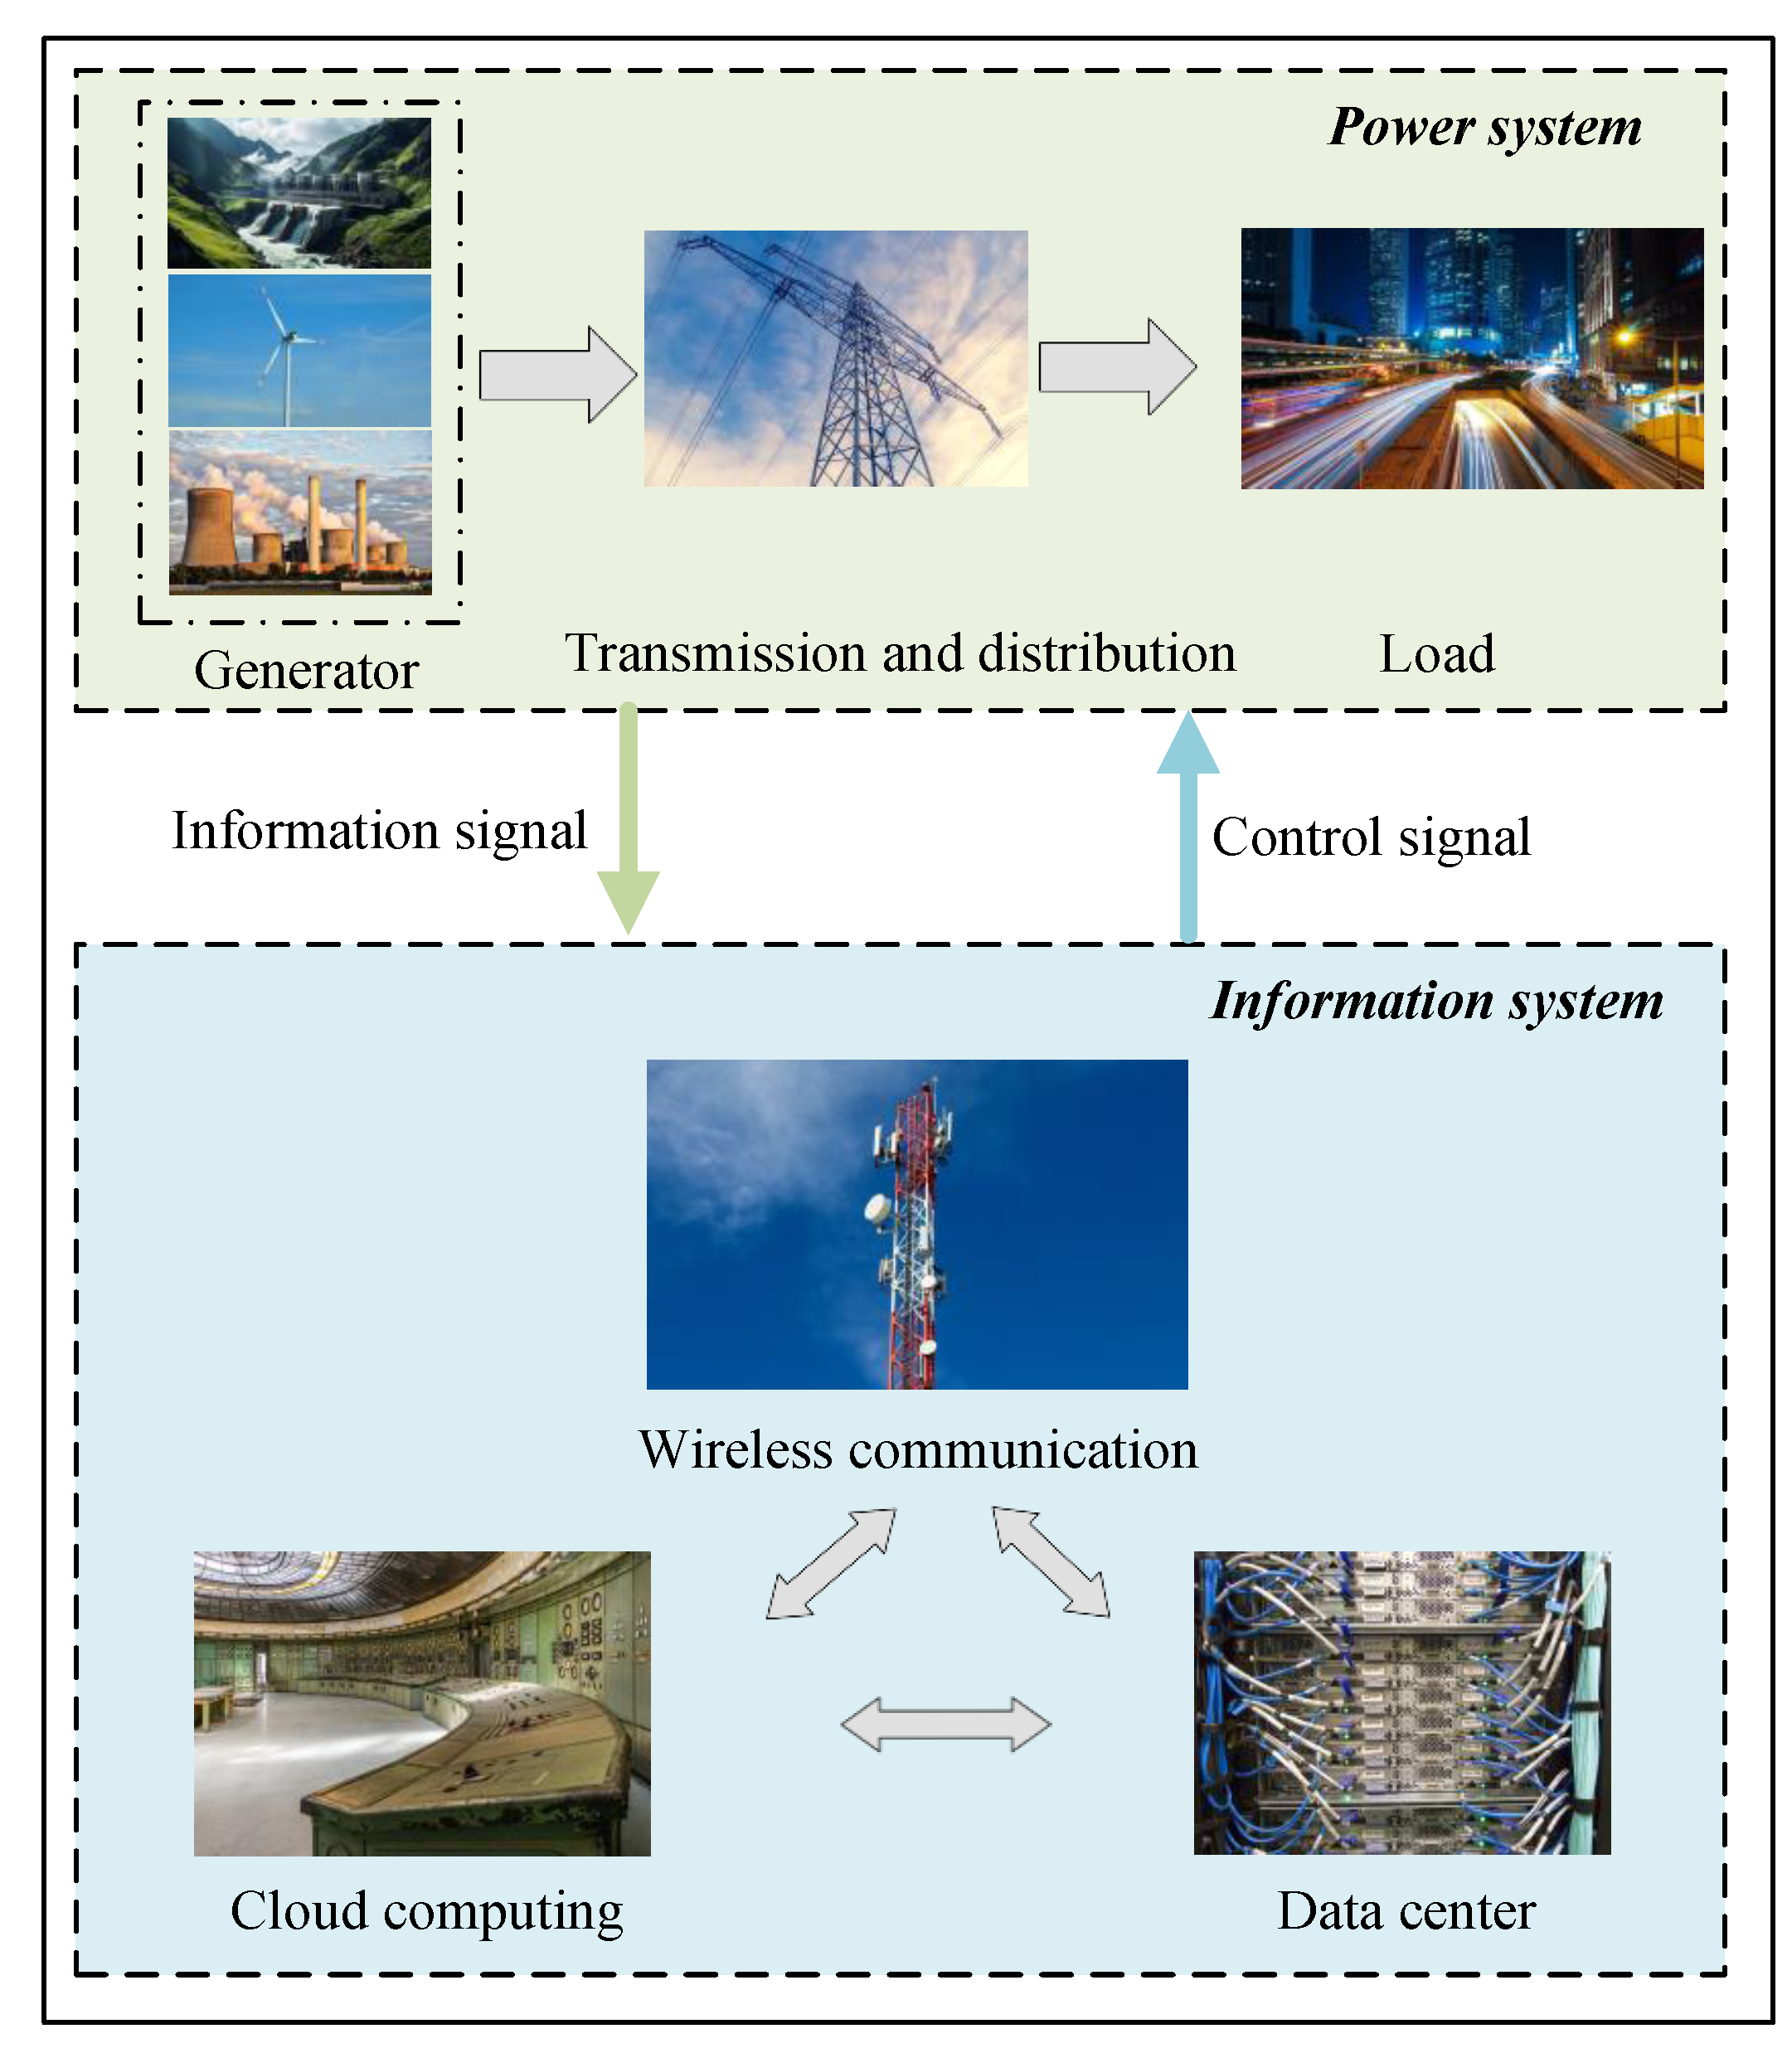
Figure 1. Architecture of cyber–physical power system.
Processes 11 03046 g001
Figure 2. Cyber–physical power system modeling.
Processes 11 03046 g002
Figure 3. Controlling a simple network.
Processes 11 03046 g003
Figure 4. An example of the cascading failure process. The nodes represent partial locations in the network, the dashed lines indicate the connections between nodes, and the solid lines represent the direction of load redistribution after node failures. The colors of the nodes represent their respective states, where green, yellow, and red indicate nodes in underloading, heavy-loading, and overloading states, respectively. The darker the color, the heavier the load on the node. In (a), node N 1 is in an overloading state, and after the failure, the load should be distributed among neighboring nodes. In (b), it represents the state of this set of nodes after the load redistribution of N 1 . Nodes N 2 and N 5 also become overloading, and N 4 becomes heavy-loading. This process will be repeated until the network stabilizes or collapses.
Processes 11 03046 g004
Figure 5. (a) The network topology of the IEEE 39-node system; (b) the network topology of the Chinese 132-node system.
Processes 11 03046 g005
Figure 6. (a) The degree distribution of the IEEE 39-node system, (b) the degree distribution of the Chinese 132-node system.
Processes 11 03046 g006
Figure 7. (ac) The n d variation curves of the CPPS under four different coupling strategies after random attack, degree attack, and betweenness attack, respectively. The CPPS is formed by coupling the IEEE 39-node system and the BA network.
Processes 11 03046 g007
Figure 8. (ac) The n d variation curves of the CPPS under four different coupling strategies after random attack, degree attack, and betweenness attack, respectively. The CPPS is formed by coupling the IEEE 39-node system and the WS network.
Processes 11 03046 g008
Figure 9. (ac) The n d variation curves of the CPPS under four different coupling strategies after random attack, degree attack, and betweenness attack, respectively. The CPPS is formed by coupling the Chinese 132-node system and the BA network.
Processes 11 03046 g009
Figure 10. (ac) The n d variation curves of the CPPS under four different coupling strategies after random attack, degree attack, and betweenness attack, respectively. The CPPS is formed by coupling the Chinese 132-node system and the WS network.
Processes 11 03046 g010
Figure 11. (a,b) The n d change curves of the CPPS with different load redistribution strategies in two different attack strategies, respectively. CPPS is coupled through the IEEE 39-node system and the WS network.
Processes 11 03046 g011
Figure 12. (a,b) show the n d change curves of CPPS with different load redistribution strategies in two different attack strategies, respectively. CPPS is coupled through the Chinese 132-node system and the WS network.
Processes 11 03046 g012
Figure 13. (a,b) represent the varying curves of the parameter n d in the system under the degree attack strategy in two different networks.
Processes 11 03046 g013
Table 1. The characteristics of the networks analyzed in the paper.
Network TypeNL n d Clustering Coefficient
IEEE 39-Node System39390.07690.0385
Chinese 132-Node System1321800.22730.0880
Disclaimer/Publisher’s Note: The statements, opinions and data contained in all publications are solely those of the individual author(s) and contributor(s) and not of MDPI and/or the editor(s). MDPI and/or the editor(s) disclaim responsibility for any injury to people or property resulting from any ideas, methods, instructions or products referred to in the content.