Article

Effect of Wheat Residue-Derived Biochar on Naphthalene Adsorption in Loess Soil in Northwest China

1
School of Environmental & Municipal Engineering, Lanzhou Jiaotong University, Lanzhou 730070, China
2
Key Laboratory of Yellow River Water Environment in Gansu Province, Lanzhou Jiaotong University, Lanzhou 730070, China
*
Author to whom correspondence should be addressed.
Processes 2023, 11(11), 3085; https://doi.org/10.3390/pr11113085
Submission received: 22 September 2023 / Revised: 17 October 2023 / Accepted: 23 October 2023 / Published: 27 October 2023

Abstract

:
Research on the environmental behavior of polycyclic aromatic hydrocarbons (PAHs) in soil is limited, particularly regarding the influence of biochar on naphthalene (NAP) adsorption on the loess soil of Northwest China. In this study, a batch equilibrium experiment was used to analyze the sorption kinetics, sorption isotherms, and influencing factors of NAP adsorption by biochar derived from wheat residue at various pyrolysis temperatures on loess soil. The results indicated that NAP adsorption onto biochar-modified soil was rapid, within 6 h, and reached equilibrium after 20 h. The sorption kinetics was accurately described by a pseudo-second-order model. Additionally, the sorption isotherms were best described by the Freundlich model, indicating a multilayer adsorption mechanism. The average value of KF decreased as follows: BC-600 (2.03) > BC-400 (1.52) > BC-200 (1.25) > soil (0.91), indicating that biochar addition was beneficial for the adsorption of NAP on loess soil. The Gibbs free energy (ΔGθ) of NAP was less than zero, and the enthalpy (ΔHθ) and entropy (ΔSθ) values were greater than zero, suggesting that the adsorption occurred spontaneously through an endothermic reaction. Furthermore, the initial concentration of NAP influenced its adsorption amount. Pyrolysis temperatures of 400 °C and 600 °C resulted in higher NAP adsorption capacities, highlighting the beneficial effect of biochar addition on enhancing NAP adsorption in loess soil. However, at a pyrolysis temperature of 200 °C, the process of carbonization became incomplete, resulting in a reduction in the adsorption amount.

1. Introduction

Polycyclic aromatic hydrocarbons (PAHs) are persistent semi-volatile organic pollutants that are extensively found in the environment [1,2]. They are emitted into the atmosphere mainly through natural sources (such as volcanic eruptions and forest fires) or human-induced activities (such as fossil fuel combustion, biomass pyrolysis, oil spills, and vehicle combustion) [3]. PAHs can be transported over long distances in the atmosphere and eventually accumulate in the soil through dry and wet deposition, leading to significant environmental burdens and ecological threats when their accumulation exceeds the self-purification capacity of the soil [4]. There are over 100 PAH homologs in the environment, including parent compounds and derivatives [5], with 16 designated as priority pollutants by the USEPA, according to the International Agency for Research on Cancer [6,7]. Owing to their high stability, hydrophobicity, and carcinogenic, teratogenic, and mutagenic properties, PAHs have become a global environmental concern [8] with the potential to harm both human health and the food chain.
Notably, naphthalene (NAP), the smallest-molecular-weight PAH and a typical representative of PAHs, is composed of two benzene rings and is characterized by semi-volatility and the tendency to accumulate in biological organisms and environments [9]. NAP possesses a stable structure that enables it to migrate over long distances and cause environmental damage [10]. The compound is widely utilized as a raw material for dyes, phthalic anhydride, and pesticides in the chemical industry [11], and it is commonly found in the soil, owing to its low solubility and strong adsorption to soil [12]. The accumulation of NAP can lead to various health risks, including red blood cell rupture, skin irritation, hemolysis, and methemoglobinemia, particularly in areas with severe pollution [13]. Moreover, NAP has a high detection rate and content in PAH-contaminated sites in China [14]. Previous studies have indicated that the concentration of NAP in soil varies from 5.5 to 538.7 ng/g, with a detection rate of 97.7% [15]. NAP is the primary PAH found in surface water and marine environments, with measured concentrations ranging from 31 to 443 ng/L [16]. Therefore, the implementation of effective strategies for managing NAP in the soil environment is necessary to prevent environmental issues.
Biochar, a low-cost and carbon-rich porous material produced through the thermochemical transformation of organic matter or industrial waste in an anoxic or hypoxic environment at temperatures below 700 °C, has garnered attention in various fields, owing to its high adsorption properties and extensive applications in agriculture and soil remediation [17,18]. The porous carbonate structure, high specific surface area, ion-exchange capacity, and abundant surface functional groups of biochar make it an excellent adsorbent for organic pollutants [19]. Its interaction with soil components through physical or biochemical reactions can modify the surface properties of biochar, resulting in changes in the adsorption behavior and retention capability of organic pollutants in soil [20]. Biochar can interact with inorganic ions in soil minerals through processes such as complexation, cation bridging, precipitation, and electrostatic attraction. Additionally, biochar has the ability to reunite with soil particles, thereby enhancing its chemical stability [21]. Recent studies have demonstrated that the application of biochar improves soil quality, enhances crop yield, exhibits great potential for pollutant remediation, and facilitates the recycling of waste biomass [22,23]. Furthermore, studies have shown that biochar acts as an excellent soil amendment, promoting the population and abundance of microorganisms and enhancing the efficiency of PAH degradation in the soil [24]. Additionally, the benzene ring, carboxyl group, and methyl group present in biochar are the main functional groups responsible for PAH adsorption [25]. Therefore, we speculate that the addition of biochar to loess soil can modify the adsorption capacity of the soil, effectively reducing the migration of PAHs in soil and playing a crucial role in preventing and controlling PAH pollution in loess soil. At present, the adsorption process of NAP in soil by different modifiers has been studied. Zhang et al. conducted batch equilibrium experiment to investigate the process of NAP adsorption by surfactants on soil [26]. Li et al. utilized a high-temperature carbon reduction method to synthesize loaded with nano zero-valent iron as an adsorbent, analyzing the adsorption process of NAP in soil [27]. However, there is a lack of discussion on the mechanism and influencing factors of biochar on the adsorption of NAP in loess soil. China, being a major agricultural production country, generates a significant amount of crop straw annually. If fully utilized, this waste can be transformed into a valuable resource, which holds great practical significance in terms of mitigating environmental pollution and promoting sustainable agricultural development. In the northwest region of China, wheat is the primary crop cultivated. Utilizing wheat straw as raw material for biochar preparation, instead of resorting to open burning, yields higher carbon emission reduction benefits. Therefore, this research focuses on investigating the impact of applying wheat straw biochar on the environmental behavior of PAHs.
Loess soil is widely distributed around the world, representing approximately one tenth of the global land area, and the Northwestern District of China has the world’s largest loess plateau. Compared to the soils that have previously been studied, loess soil is considered alkaline calcareous soil, which has the unique characteristics of loose structure, large porosity, susceptibility to erosion, and low soil organic matter (SOM) content. The existing research has shown that it is commonly contaminated by PAHs [28]. Despite the extensive research attention given to PAHs, in terms of toxicity evaluation, pollution remediation, and PAH degradation, only a few studies have investigated the environmental behavior of PAHs in loess soil environments, particularly the adsorption behavior of NAP affected by biochar in typical loess soil in Northwest China. Therefore, the present study aims to (1) research the adsorption process of NAP in typical biochar-modified loess soil in Northwest China and (2) identify the mechanisms influencing NAP adsorption and retention capabilities. This study can provide theoretical references and a scientific foundation for the management and remediation of PAH-polluted soil.

2. Materials and Methods

2.1. Biochar Preparation and Characterization

Biochar was produced through the oxygen-limited temperature-controlled carbonization technique. First, a predetermined amount of wheat straw was rinsed with water, dried at 70–80 °C in an electric heating oven, and then placed in a hydrothermal synthesis reactor. The reactor was heated to 200 °C, 400 °C, and 600 °C in a furnace (SX-4-10 chamber electric furnace, Beijing, China) at a rate of 10 °C/min for 3 h. The resulting carbonized products were soaked in 1 mol/L of dilute hydrochloric acid for 12 h to remove ash, rinsed with distilled water until they became neutral, and subsequently dried at 70–80 °C. The resulting samples were labeled BC-200, BC-400, and BC-600, corresponding to treatment temperatures of 200 °C, 400 °C, and 600 °C, respectively. The characteristics of the biochar were analyzed elemental analysis, and specific surface area analysis [29]. The biochar samples were scanned using a Japanese JSM-5600LV (JEOL, Beijing, China) low-vacuum scanning electron microscope. Fourier-transform infrared (FTIR) spectra were detected using a Bruker Vertex 70 spectrometer (Bruker Optics, Billerica, MA, USA). BET surface area was detected using 3H-2000PS4 Aperture Analyzer (Beijing, China). Organic elemental analyzer (vario EL cube, Elementar, Germany) was used to determine the percentage contents of C, H, N, and O elements in wheat straw and biochar prepared at different temperatures. Detailed descriptions of the test conditions can be found in our previous study [30].

2.2. Soil Collection and Pretreatment

Soil samples (0–20 cm) were collected from farmland in Lanzhou (S1, E 130°42′46.5″, N 36°7′34.9″), Tianshui (S2, E 105°53′22.7″, N 34°34′12.9″), and Jiayuguan (S3, E 98°17′22.9″, N 39°46′18.9″), Gansu, Northwest China, where NAP was not detected [31]. The collected samples were air-dried in the laboratory, sieved to eliminate any remaining materials (2 mm), and stored at 4 °C until they were ready to be used. The cation exchange capacity (CEC) was measured using the hexamminecobalt trichloride solution-spectrophotometric method. Total organic carbon (TOC) was quantified using a total organic carbon analyzer (MULTIN/C2100, Analytik Jena, Jena, Germany). The pH values were determined using a pH meter (PHS-3C, Shanghai, China). Mastersizer2000 (Malvern, Shanghai, China) was used to determine the granulometric composition of soil. The characteristics of the three loess soils were determined in Table 1.

2.3. Chemicals and Reagents

The chemicals used in the experiments, including NAP, CaCl2, and methanol, were of analytical grade and were employed without any additional purification. The purity of CaCl2 was >74%, while the purity of the remaining chemicals exceeded 98%.

2.4. Experimental Methods

Sorption experiments were conducted following the OECD (Organisation for Economic Co-operation and Development) 106 guidelines [32] and our previous investigation [27]. In the experimental setup, 100 mL Teflon plastic tubes were used as a water bath system, in which the temperature of the water bath system was regulated using a constant-temperature oscillator. To maintain a constant ionic strength in the aqueous soil systems, a CaCl2 background solution (0.01 mol/L) was used. After a predetermined period, each plastic tube was centrifuged at 4000 rpm for 15 min, and the supernatant was passed through a 0.45 µm filter. The presence of NAP in the solution was analyzed using a UV-vis spectrophotometer (UV-2102C, Shanghai, China). The test wavelength for NAP was set at 275 nm.

2.4.1. Sorption Kinetics Experiment

A soil sample (S3) weighing 0.5000 ± 0.0005 g and 0.0200 ± 0.0002 g of biochar were added to 50 mL of a background solution containing an initial concentration of 4 mg/L of NAP. A kinetic experiment was then conducted through placing the sample in a constant-temperature water bath oscillator at 25 °C and oscillating it at 200 r/min for a specific duration. Afterward, the sample was centrifuged at 4000 r/min for 15 min, and the NAP mass concentration was determined after filtration. Each group consisted of three parallel experiments. BC-200, BC-400, and BC-600 were added to the soil following the OECD 106 guidelines.

2.4.2. Sorption Isotherm Experiment

A soil sample (S3) weighing 0.5000 ± 0.0005 g and 0.0200 ± 0.0002 g of biochar were added to 50 mL of a background solution to conduct the adsorption isotherm test at three temperatures: 25 °C, 35 °C, and 45 °C. The sample was placed in a constant-temperature water bath oscillator and oscillated at 200 rpm for an appropriate duration. Subsequently, it was centrifuged at 4000 rpm for 15 min, and the NAP mass concentration was determined after filtration. Each group of experiments consisted of three parallel tests. BC-200, BC-400, and BC-600 were added to the soil following the method described above.

2.4.3. Experiment on Influencing Factors

Using a background solution of 0.01 mol/L CaCl2, we assessed the impact of different initial concentrations on NAP adsorption, considering NAP mass concentrations of 8–80 mg/L. Additionally, we studied the effect of biochar on NAP adsorption under different types of loess soil. Furthermore, we examined the influence of biochar pyrolysis temperature on NAP adsorption onto loess soil. Each experimental group was conducted in triplicate.

2.5. Data Analysis

The results of our study were graphed using Origin 2021.
The sorptive amount of NAP (Cs, mg/kg) was determined via subtracting the starting concentration (C0, mg/L) from the concentration in the batch solution at the end of the equilibrium period (Ce, mg/L). The Cs of NAP was obtained using the following formula:
C S = C 0 C e × V m  
A pseudo-first-order model [33] and a pseudo-second-order model [34] were used to describe the sorption kinetics process of pollutants on soil. Langmuir models [35] and Freundlich models [36] were used to fit and analyze the adsorption thermodynamic data of NAP on biochar-modified loess. The expression equations are shown in Table 2.
In Equations (1)–(4), t (min) is the set time interval; qt is the sorption amount (mg·g−1) during time t; k1 and k2 are, respectively, the pseudo-first-order sorption kinetic rate constant (min−1) and the pseudo-second-order sorption kinetic rate constant (g·mg−1·min−1); q1 and q2 are the absorbances of target pollutants (mg·g−1); Qm (mg/g) is the maximum sorption capacity; KL (L/g) is the Langmuir sorption coefficient; KF (mg/g)/(mg/L)n is the Freundlich sorption coefficient; and the adsorption nonlinearity degree is described using the constant 1/n.
The thermodynamic function is calculated using the Gibbs equation, as follows:
G θ = R T l n K d  
G θ = H θ T S θ  
l n K d = H θ R T + S θ   R  
Here, R (8.314 J·mol·K−1) is the molar gas constant, T (K) is the absolute temperature, and Kd (L/kg) is the adsorption constant.

3. Results and Discussion

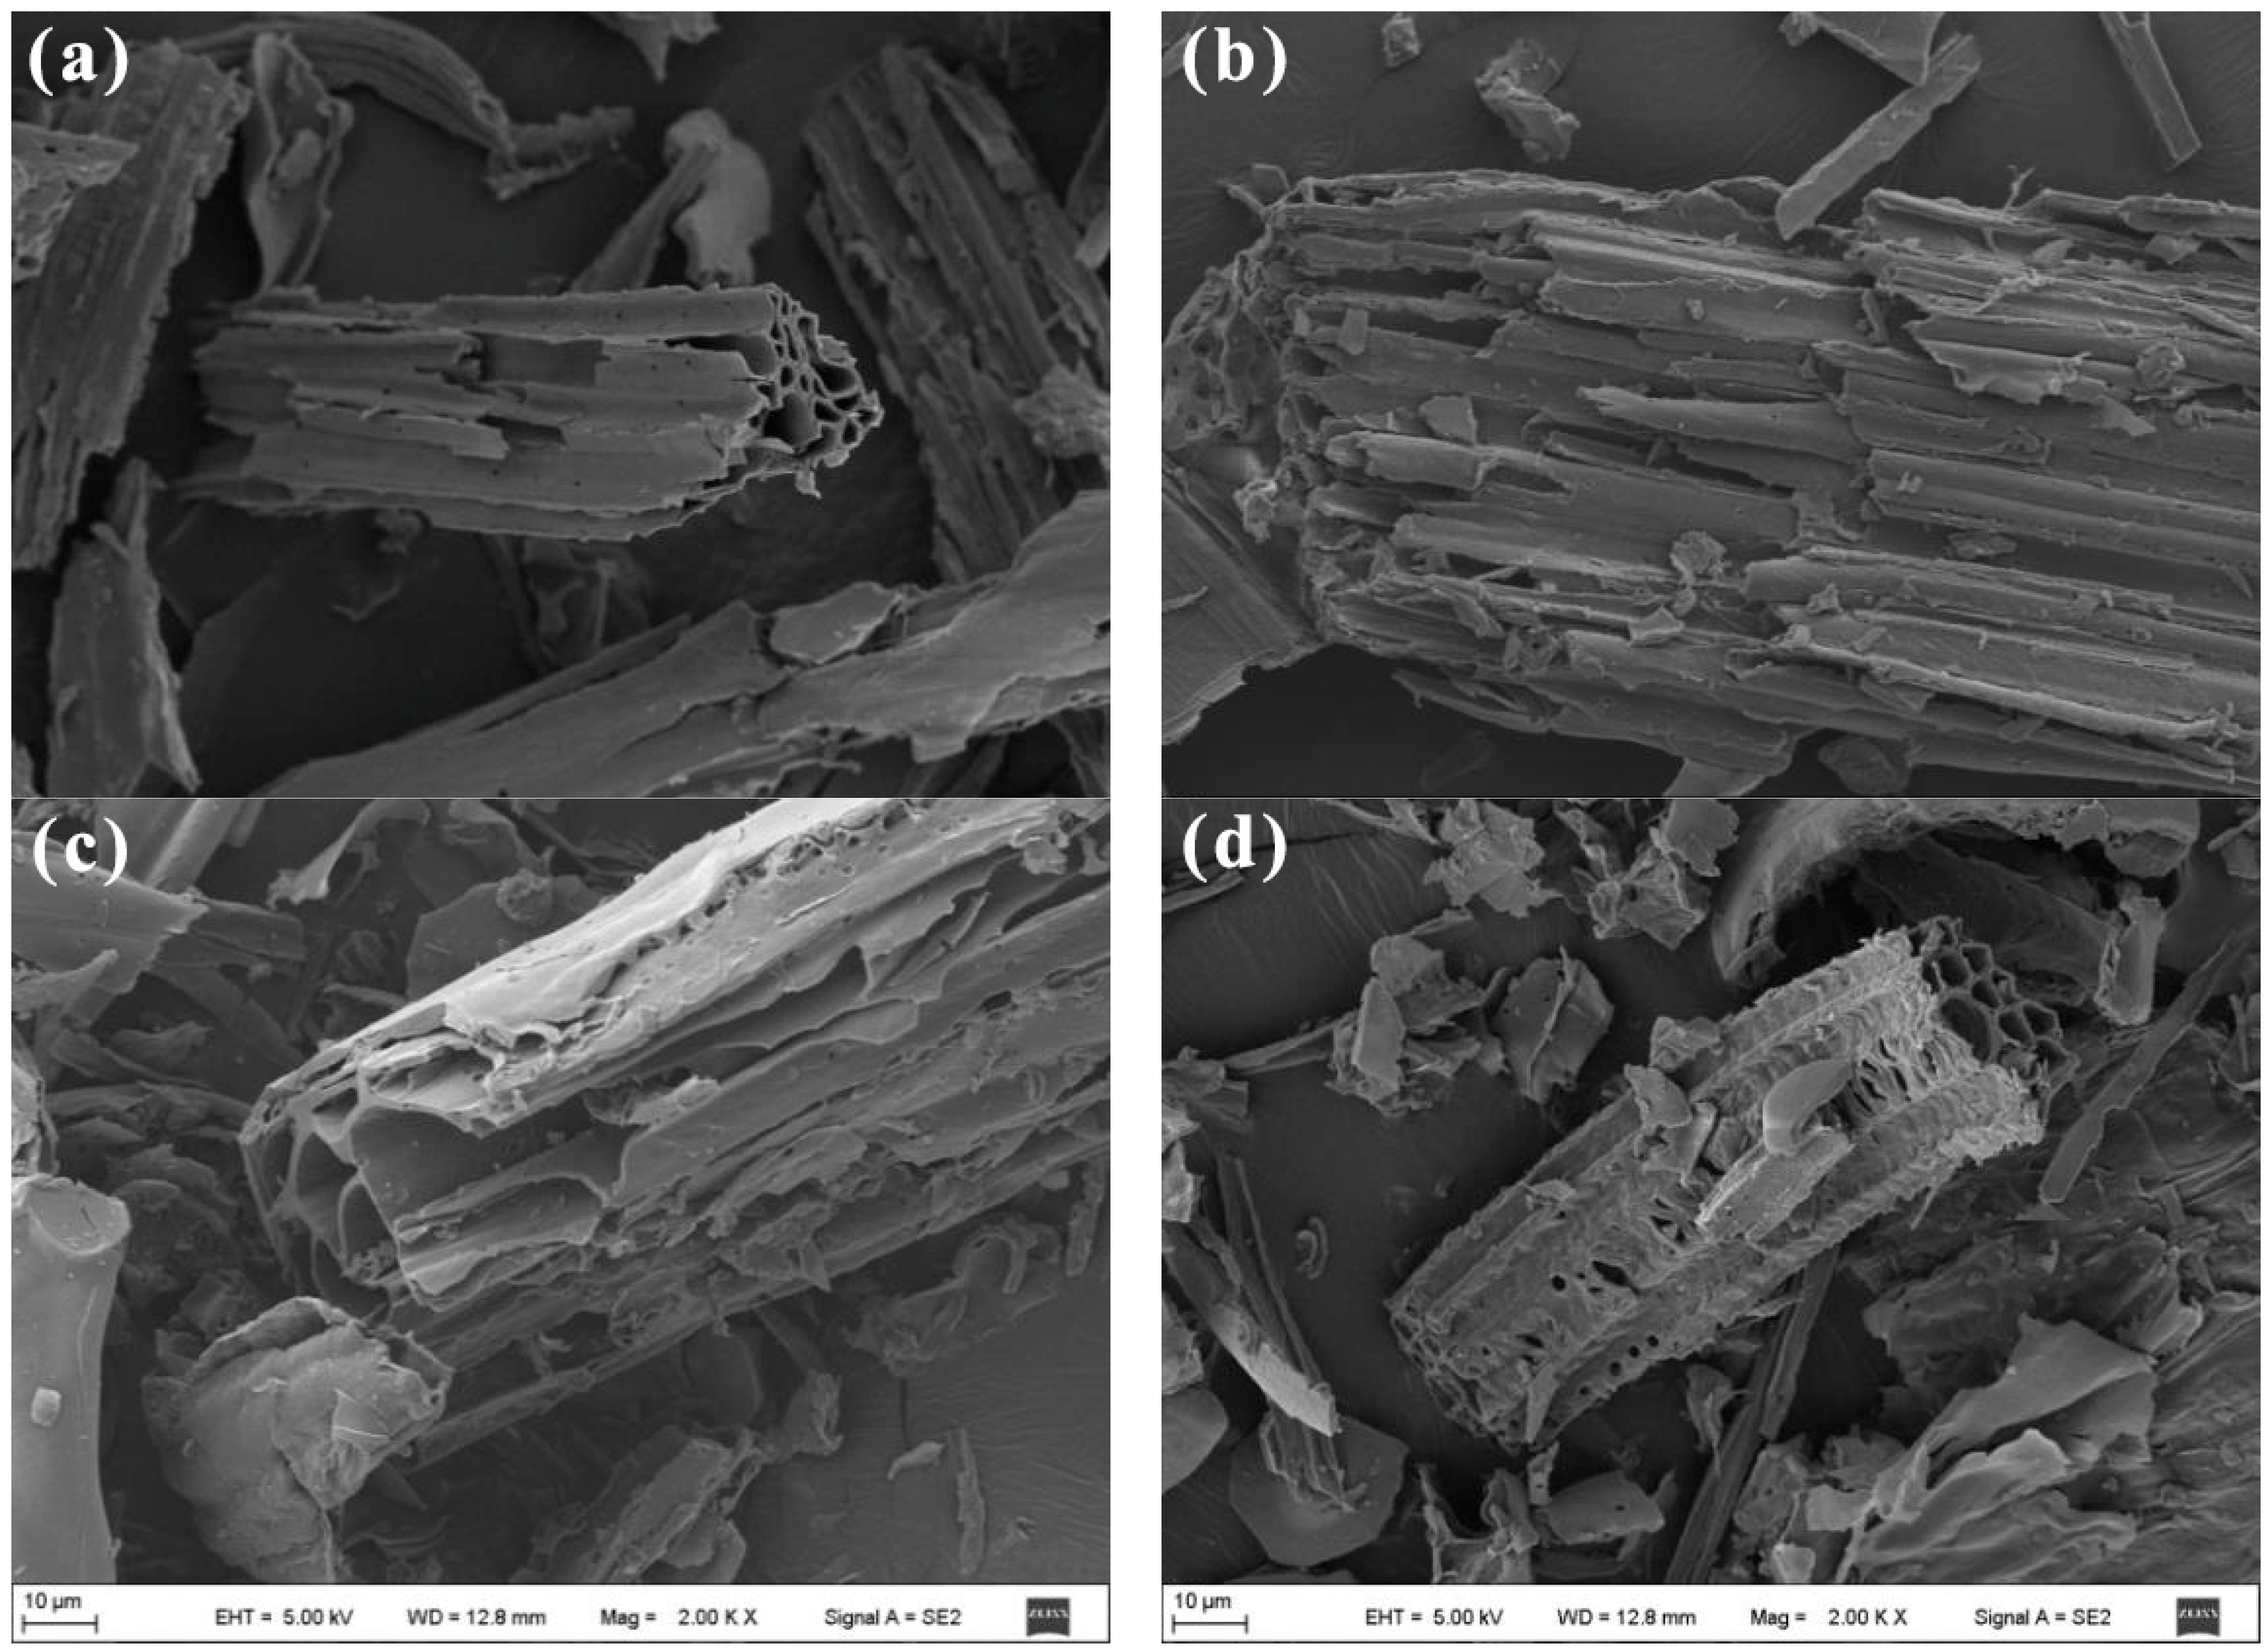
3.1. Characterization of Biochar

The biochar samples were produced from wheat residue through the application of different pyrolytic temperatures. The surface characteristics of the biochar were substantially influenced by the pyrolysis temperature, as observed in the surface SEM images (see Figure 1a–d). Before pyrolysis (Figure 1a) or at lower pyrolysis temperatures (Figure 1b), the pore channels of the straw exhibited a uniform and regular distribution. However, with increasing temperature, significant changes in surface properties occurred. At 400 °C, certain pore channels underwent carbonization, resulting in fragmentation, and this effect was further accentuated at 600 °C (Figure 1c,d). As the pyrolysis temperature exceeded 400 °C, the walls of micropores melted, increasing the surface roughness of the biochar (Figure 1c). This phenomenon can be attributed to the melting of porous edges during the carbonization process, resulting in the opening of inner pores and disrupting the distribution of straw pores.
The SEM analysis results were consistent with the data on pore volume and aperture presented in Table 3. Pyrolysis resulted in a substantial increase in the pore volume, surface area, and micropores of the biochar compared to the raw materials. Specifically, as the pyrolysis temperature increased from 200 °C to 400 °C and then to 600 °C, the specific surface area of the biochar increased from 1.72 to 521.29 m2/g, and the pore volume increased from 0.008 to 0.322 mL/g. Table 3 also shows a significant change in the elemental composition of the biochar compared with the raw wheat straw material. As the pyrolysis temperature increased from 200 °C to 600 °C, the carbon (C) content increased from 63.63% to 79.49%, while the oxygen (O) content decreased from 30.81% to 17.91%. This observation can be attributed to the increased consumption of oxygen at high temperatures, resulting in a decrease in the hydrogen (H) content from 5.15% (BC-200) to 2.18% (BC-600). The decrease in the H/C ratio from 0.08 (BC-200) to 0.03 (BC-600) also suggests that at high temperatures, the carbonization process of biochar became more complete, and the aromaticity increased. A higher aromaticity index in biochar corresponds to higher stability [37]. Additionally, high temperatures promote the transformation of biochar from “soft carbon” to “hard carbon” [38]. The polarity of biochar can be characterized by the (O + N)/C ratio, while the surface hydrophobicity can be determined by the O/C ratio. The (O + N)/C ratio decreased from 0.49 (BC-200) to 0.23 (BC-600) as the pyrolysis temperature increased, indicating a gradual reduction in the polarity of the biochar and a decrease in the presence of polar groups. Similarly, the O/C ratio decreased from 0.48 (BC-200) to 0.23 (BC-600), indicating an increase in the hydrophobicity of the biochar with increasing pyrolysis temperature. These studies are consistent with those reported by Chen et al., who characterized orange peel-derived biochar across a range of pyrolysis temperatures (150–700 °C) via elemental analysis [39].
The biochar spectra were primarily characterized by distinctive bands located at wavenumbers 3428, 2922, 1702/1605, 1429, 1225, and 1057 cm−1, which correspond to hydroxyl (–OH), methylene (–CH2–), aromatic carboxyl/carbonyl (–C=O), –COOH, –CHO, aromatic CO– and phenolic –OH, and C–O–C stretching, respectively. Wheat residue and BC-200 displayed the highest band intensities, but the intensities gradually diminished in BC-400 and BC-600, while certain bands (such as methylene –CH2–, phenolic –OH, –COOH, –CHO, and C–O–C) completely vanished as the temperature increased. The acidic groups exhibited a gradual decrease with temperature and almost disappeared at higher temperatures (Figure 2). For example, the peak at 1057 cm−1 vanished at 400 °C and 600 °C, suggesting the decomposition of cellulose and the breaking of C–O–C bonds. The characteristic absorption region of the benzene ring is located at ~1605 cm−1, and the absorption peak gradually increases with increasing temperature, indicating that the aromatic structure was enhanced. The C–O–C bending vibration peak and –O–CH3 absorption peak were at ~1057 cm−1, and only wheat straw and BC-200 featured absorption peaks at that wavenumber, indicating that the structural characteristics of the raw material were preserved at low temperatures. Li et al. prepared biochar using peanut shells as the raw material. FTIR analysis revealed that with increasing pyrolysis temperature, the alkyl content in biochar decreased, the aromaticity increased, and the stability increased [40]. Lu et al. prepared biochar using rice straw and corn straw as raw materials and analyzed the surface functional groups of the biochar via FTIR spectroscopy. The C–O–C and C=O disappeared after pyrolysis at high temperatures. –CH3 and –CH2 also gradually disappeared with increasing pyrolysis temperature, but the aromaticity and stability increased [41].

3.2. Sorption Kinetics

The study of sorption kinetics is a widely used method for determining the equilibrium time and maximum capacity of pollutant adsorption onto soils while elucidating the adsorption mechanism. Figure 3 illustrates the adsorption kinetics of NAP on loess soil and biochar-modified loess. Both cases exhibited similar adsorption behavior, characterized by three adsorption stages before equilibrium: the initial rapid adsorption stage, the succedent slow adsorption stage, and the final adsorption equilibrium stage [42]. The initial stage was a fast adsorption stage featuring a high adsorption rate, resulting from NAP partitioning in soil organic matter and soil physisorption. In this stage, van der Waals, dipole, and hydrogen bond forces manifested as molecular forces, and these forces operated rather quickly. As the reaction time increased, the NAP adsorption capacity gradually slowed down, entering the slow adsorption stage, which can be interpreted as the adsorbate diffusion into the adsorbent [43,44]. After 20 h of adsorption reaction, the adsorption capacity of NAP reached the equilibrium stage, in accordance with the report by Zhang et al. [45]. Cabal et al. also presented a three-stage dynamic change curve of NAP adsorption on activated carbon [46]. As the contact time increased, NAP adsorption capacity grew until equilibrium adsorption was achieved. This phenomenon could be attributed to the availability of numerous adsorption sites on the soil and biochar surface for NAP adsorption during the initial adsorption stage. As the adsorption proceeded, the number of adsorption sites decreased, and NAP had to penetrate the water molecule layer enveloping the soil solid phase via membrane diffusion and then move into the soil micropores through pores and finally move into the soil solid phase via matrix diffusion, causing a gradual reduction in the diffusion rate [47,48]. The trend of the saturated adsorption capacity of NAP on the different samples was as follows: soil + BC-600 > soil + BC-400 > soil > soil + BC-200. NAP adsorption capacity on loess increased from 1.0 to 2.1 mg/g after biochar addition, implying a significant improvement in the adsorption of NAP on soil.
Kinetic models are widely used to explain adsorption phenomena for different pollutants. The correlation coefficient R2 provides information about the discrepancy between research and calculated data. A larger R2 value indicates that the adsorption kinetic model better describes the adsorption process [49]. Yuan et al. fitted NAP adsorption kinetics data using pseudo-first-order and pseudo-second-order models [50]; the outcomes are summarized in Table 4. The results revealed that the pseudo-second-order model achieved a better fit for NAP adsorption behavior on loess and biochar-modified loess (R2 > 0.99), indicating that the adsorption mechanisms involved various processes, including surface adsorption, external liquid membrane diffusion, and intraparticle diffusion [51]. Xiong et al. investigated the adsorption kinetics of NAP on activated carbon prepared with KOH as an activator. The pseudo-second-order model exhibits the highest R2 value (>0.998). This indicates that the adsorption of NAP on activated carbon was primarily governed by chemical adsorption [52]. Chang et al. also analyzed the kinetic model fitting of NAP on zeolite, and their results demonstrated that the pseudo-second-order model accurately predicted NAP adsorption on zeolite [53]. These findings imply that the NAP adsorption process is complex and involves multiple mechanisms.

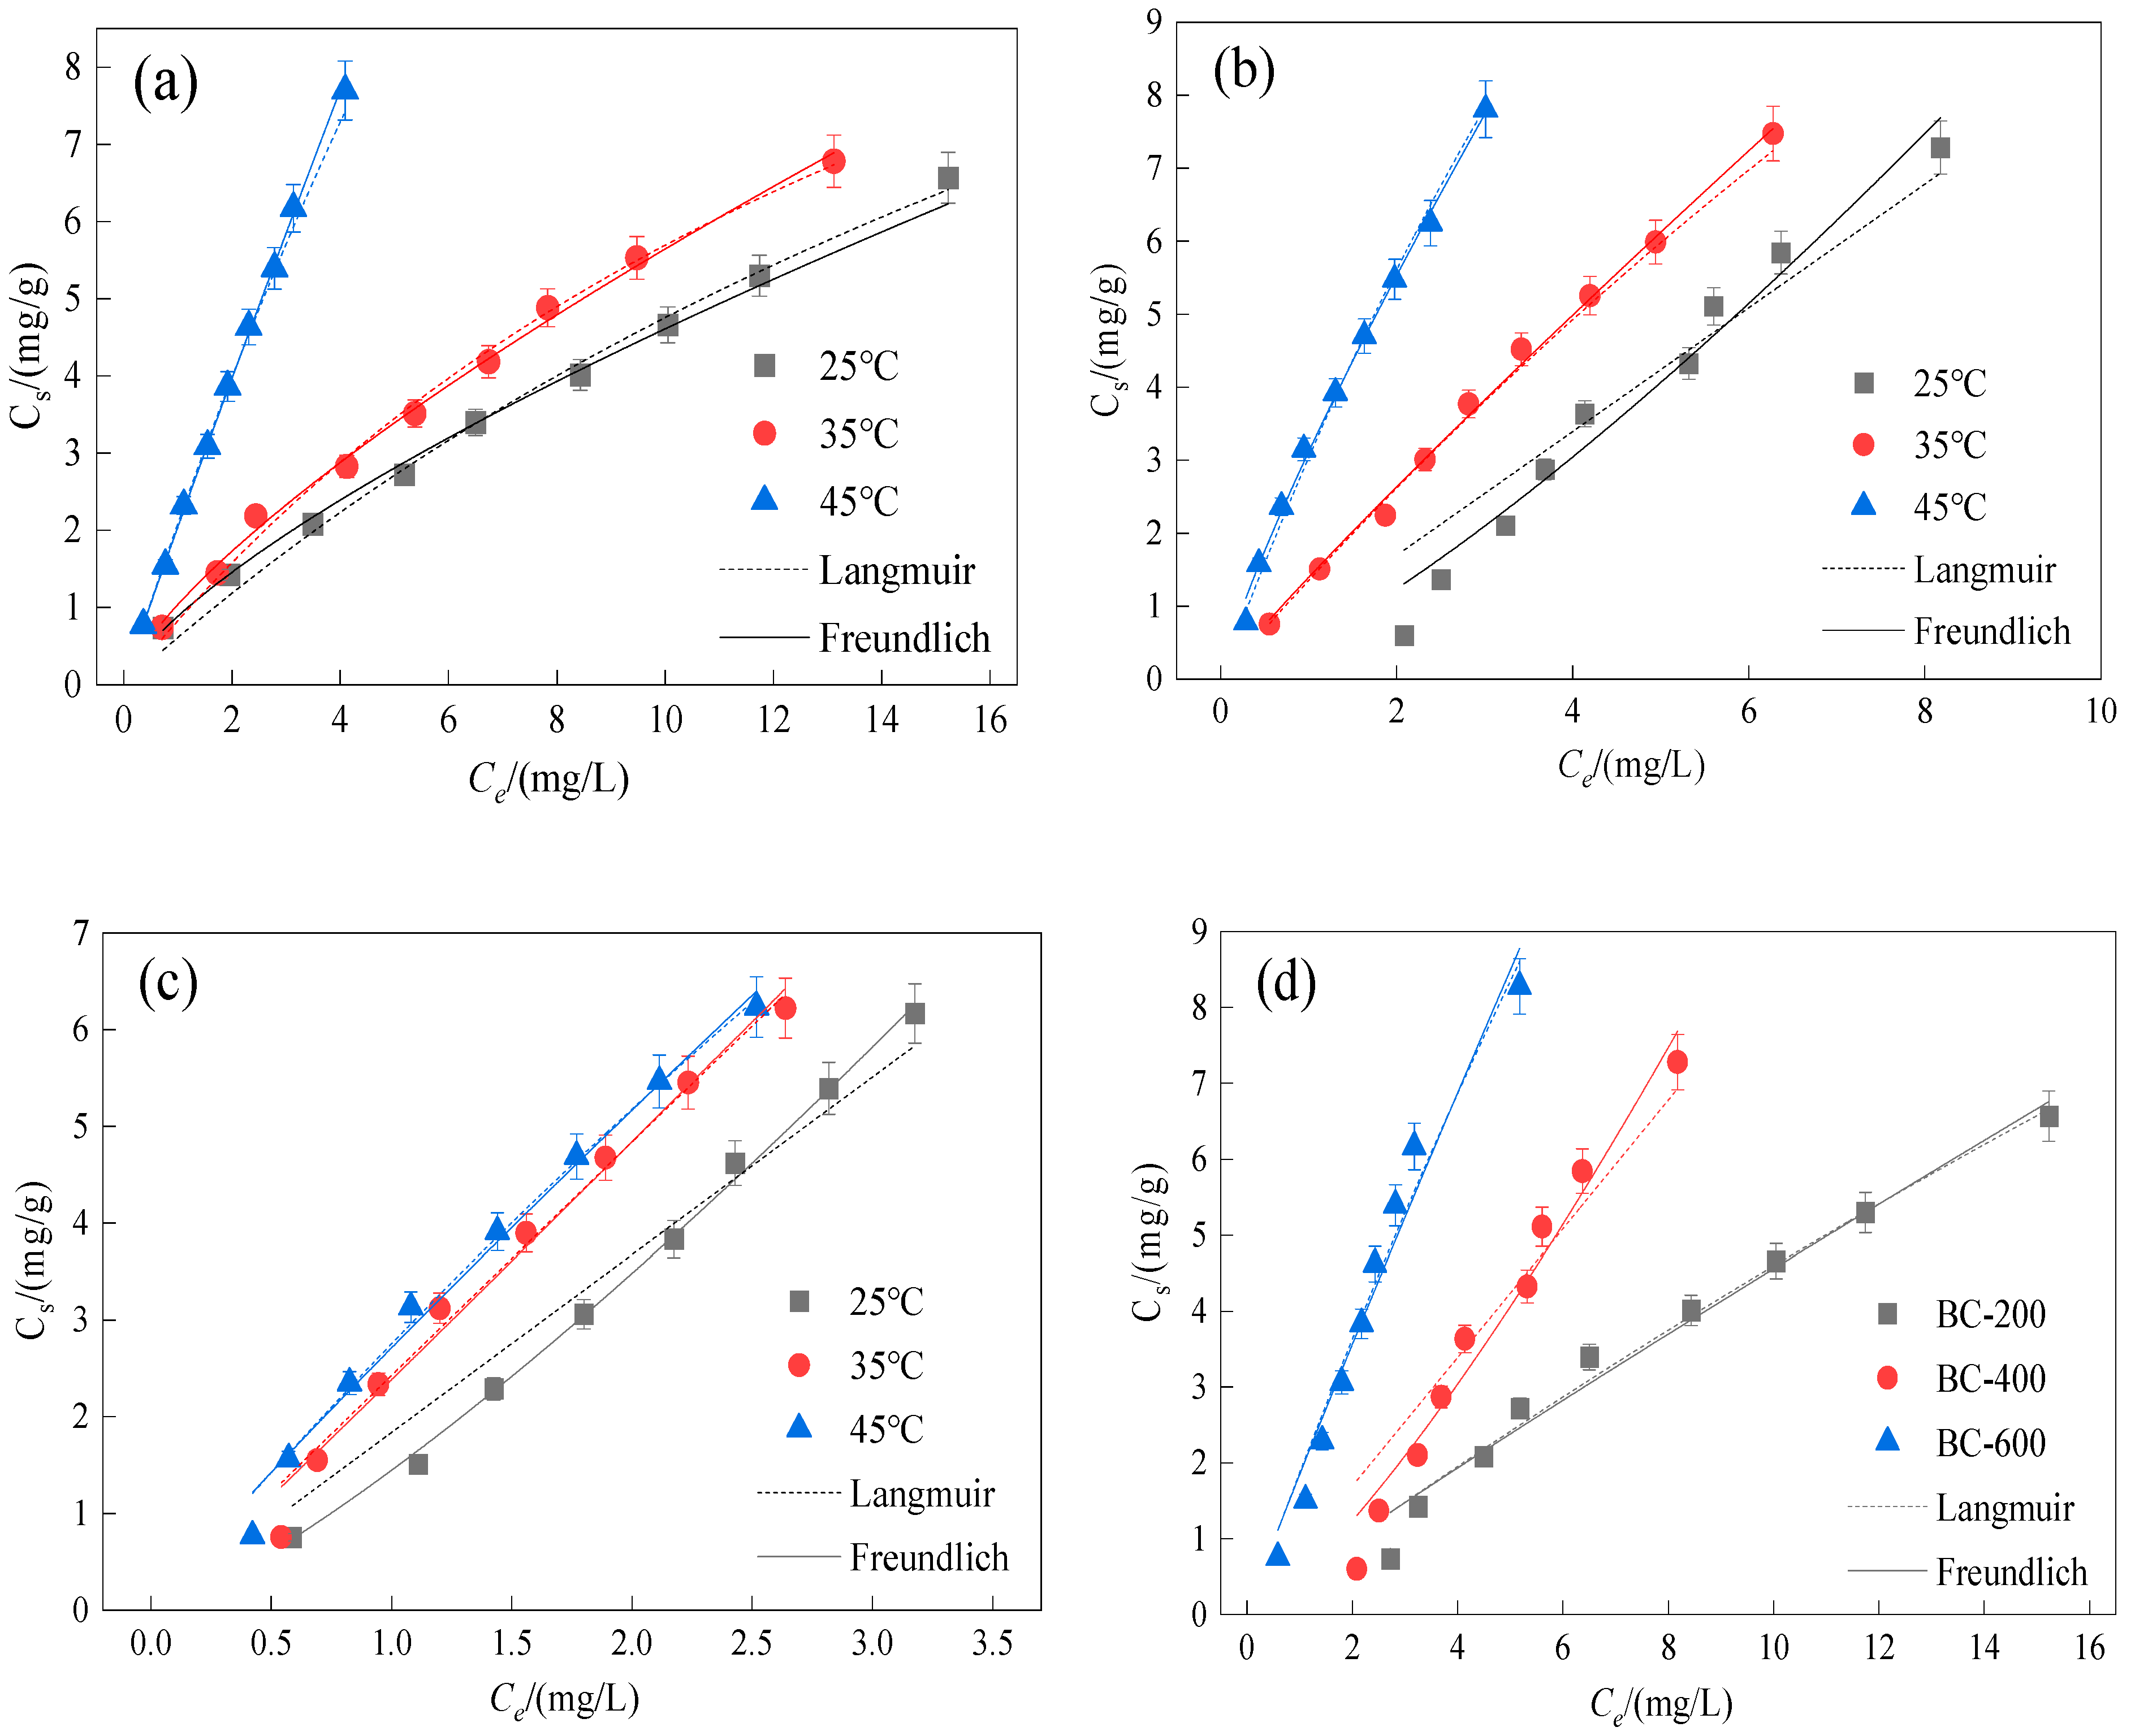
3.3. Sorption Isotherms

Sorption isotherms provide an experimental basis for studying adsorption mechanisms via describing the relationship between the equilibrium adsorption capacity and the adsorbate concentration [54]. Figure 4 explores the sorption isotherms of NAP with biochar-modified loess at 25, 35, and 45 °C. The sorptive amount of NAP was observed to increase with an increase in system temperature. Specifically, as the system temperature increased from 25 to 35 °C and from 35 to 45 °C, the sorptive amount of NAP rose from 7.25 to 7.80 mg/g and from 7.70 to 7.74 mg/g, respectively. These findings suggest that the adsorption of NAP is an endothermic reaction, and higher temperatures are more favorable for the adsorption of NAP. The biochar prepared under high-temperature conditions possibly had a larger specific surface area, providing more adsorption sites for NAP and resulting in stronger adsorption effects [55]. At the same temperature, the NAP adsorption capacities of biochar-modified loess decreased in the following order: BC-600 > BC-400 > BC-200 (Figure 4d).
The Langmuir and Freundlich models were used to describe the adsorption behavior of NAP and to explore its adsorption mechanism. The results of the fitting parameters (Table 5) indicate that the adsorption processes of NAP on the soil and biochar-modified loess were more consistent with the Freundlich model (RF2 = 0.933–0.999). These results suggest that NAP adsorption was monolayered, with a synergistic effect between the molecules and the uneven surface energy distribution of biochar [56]. Studies have reported similar findings. Chen et al. examined the adsorption of NAP on soil and pure organic matter. All of the adsorption processes fitted well with the Freundlich model [57]. Huang et al. investigated the NAP adsorption properties of biochar prepared at 300 °C, 500 °C, and 700 °C with corn stalks as the raw material. The results indicated that the Freundlich model is the most appropriate for describing the NAP adsorption process of biochar [58].
The KF and n values in the Freundlich model are commonly used to analyze the adsorption capacity of pollutants. A higher KF value indicates a stronger adsorption capacity [59]. n > 1 suggests a favorable adsorption process (i.e., a stronger affinity between the pollutant and the soil), and n < 0.5 suggests that the adsorption process is less likely to occur [60]. According to the fitting results, the average value of KF decreased as follows: BC-600 (2.03) > BC-400 (1.52) > BC-200 (1.25) > soil (0.91), indicating that biochar addition was beneficial for the adsorption of NAP on loess. The n value was generally greater than 1, and the adsorption process roughly followed an “L-shaped” isotherm, which describes monolayer adsorption. This suggests that a strong affinity existed between NAP and soil at low concentrations. As the concentration increased, the adsorption affinity gradually decreased, and the adsorption rate decreased until it reached equilibrium.

3.4. Thermodynamic Parameters

The study of adsorption thermodynamic parameters further elucidates the types and mechanisms of adsorption reaction processes [61]. To determine ΔHθ and ΔSθ, a 1/T-to-lnKd correlation figure was used, and the slope and intercept of the line are showed in Table 6. For the adsorption process of biochar-modified loess at 25 °C, 35 °C, and 45 °C, ΔGθ was found to be less than zero, and ΔGθ decreased as the temperature increased, that is, the adsorption was spontaneous. Generally, a ΔGθ range between −20 and 0 kJ/mol corresponds to physisorption, while a ΔGθ range of −80 to 400 kJ/mol corresponds to chemisorption [30,62]. In this study, the range of ΔGθ was −2.52 to 1.86 kJ/mol, which indicates primarily physisorption. A positive ΔHθ value indicates endothermic adsorption, and the magnitude of ΔHθ determines the strength of the interaction during the adsorption process. A ΔHθ range of 4–8 kJ/mol indicates that the main force is van der Waals, while hydrogen bonding dominates in the range of 8–40 kJ/mol [63,64]. In the adsorption process of NAP, the dominant force is Van der Waals, as indicated by the ΔHθ value of 5.84 kJ/mol. The contribution of entropy change, as indicated by ΔSθ, to the total free energy change in the adsorption process should not be overlooked. This conclusion is supported by the findings of Sun et al., who investigated the adsorption characteristics of NAP on four different soils [65]. Wan et al. also reported that the adsorption process of NAP on Lou soil is a spontaneous exothermic process, with entropy change playing a role in the adsorption of NAP by Lou soil [66]. Moreover, Yuan et al. synthesized carbon materials possessing a substantial specific surface area to study the adsorption properties of NAP, and they also found that the adsorption process of NAP was spontaneous and exothermic [50].

3.5. Factors Influencing NAP Adsorption

3.5.1. Impact of Loess Soil Types

In this study, the influence of biochar on NAP adsorption on various types of loess soil was also investigated, and the fitting results are presented in Table 4. The equilibrium adsorption capacity of NAP varied among the three types of loess with different biochar concentrations. When the pyrolysis temperature of biochar was 600 °C, the equilibrium adsorption capacity of NAP for S1, S2, and S3 was 2.81, 2.79, and 2.85 mg/g, respectively. The NAP equilibrium adsorption capacity of S3 was slightly higher than those of S1 and S2, mainly due to the differences in the physical and chemical properties of the soil. Studies have shown that the adsorption of PAHs in soil depends on the clay and organic matter contents of the soil. All three types of loess soils were alkaline, with pH values of 7.56 for S1, 8.23 for S2, and 8.56 for S3. The SOM contents were as follows: S3 (10.84 g/kg) > S2 (9.20 g/kg) > S1 (9.16 g/kg), and the clay contents were as follows: S3 (12.2%) > S2 (10.7%) > S1 (7.3%). The slightly higher SOM content in S3 resulted in a higher adsorption capacity for organic pollutants. Similar findings were reported by Hu et al. [31], where the adsorption capacity of hydrophobic organic pollutants in soil was found to depend on the organic matter content of the soil. This dependence is primarily due to the enhanced adsorption and retention of hydrophobic organic pollutants facilitated by the hydrophobic partitioning of soil organic matter.

3.5.2. Impact of Initial Concentration of NAP

Figure 5 illustrates the impact of the initial concentration of NAP on the adsorption behavior of loess soil with BC-400. The graph shows that the amount of NAP adsorbed by the biochar loess increases proportionally with increasing initial concentration. As the initial concentration of NAP increases from 8 to 80 mg/L, the adsorption capacity also increases from 0.73 to 6.56 mg/g. The high linear correlation between the solid–liquid phases indicate the dominant role of hydrophobic partitioning. This phenomenon can be explained by the fact that at low NAP concentrations, the adsorption sites on the biochar and soil surfaces are not fully occupied by NAP. However, as the initial concentration increases, more adsorption sites become occupied, resulting in an increased adsorption capacity. Moreover, a higher concentration of NAP leads to a greater frequency of effective collisions between the soil and NAP, further enhancing the adsorption capacity [67,68]. The same research results were also reported by Xiao et al. [69].

3.5.3. Impact of Biochar Pyrolysis Temperature

The physicochemical characteristics of biochar are significantly influenced by the pyrolysis temperature, making it a crucial factor. Figure 6 displays the effect of biochar produced at three pyrolysis temperatures (200 °C, 400 °C, and 600 °C) on NAP adsorption on loess soil. The equilibrium NAP adsorption capacities on the loess supplemented with BC-400 and BC-600 were 7.81 and 7.71 mg/g, respectively, indicating that biochar addition to loess soil can significantly enhance the equilibrium adsorption capacity of NAP. Yu et al. studied that adding trace amounts of biochar to soil can considerably improve its adsorption capacity for organic pollutants, they found that in soil with a biochar content of 0.05%, most organic pollutants are primarily absorbed by the biochar [70]. However, the equilibrium NAP adsorption capacity on the loess supplemented with BC-200 was 6.56 mg/g. The equilibrium NAP adsorption capacity was reduced compared with loess alone and loess supplemented with BC-400 and BC-600, possibly owing to the incomplete carbonization of BC-200. Some dissolved organic matter in BC-200 occupied the adsorption sites of NAP in the soil, resulting in competitive adsorption and a reduction in the NAP adsorption capacity. Additionally, the dissolution of NAP increases its concentration in the non-aqueous phase. Zhao et al. found that biochar produced at temperatures lower than 400 °C released a considerable amount of dissolved organic matter, which has poor stability and readily combines with organic pollutants, thereby altering their behavior and distribution in the environment [71].

4. Conclusions

Loess soil is characterized by poor soil fertility, loose structure, large porosity, low SOM content, and weak adsorption capacity. In this study, we systematically analyzed the sorption of NAP on loess soil and its influencing factors. Biochar made from wheat residue showed a considerable effect on the adsorption of NAP in loess soil. NAP adsorption by loess soil with or without biochar reached equilibrium quickly. The adsorption kinetics of NAP followed a pseudo-second-order model. The adsorption amounts of NAP increased with temperature, and the isothermal adsorption process was best described by the Freundlich model. The efficiency percent of adsorption of NAP was as follows: soil + BC-600 (71.1%) > soil + BC-400 (68.4%) > soil (59.9%) > soil + BC-200 (59.1%). The presence of biochar significantly improved the adsorption capacity of NAP. Moreover, ΔGθ was less than zero at all temperatures, indicating that the adsorption process of NAP onto loess soil was spontaneous and thermodynamically beneficial. The adsorption of NAP was primarily physical and substantiated by the presence of chemical adsorption, enhancing the overall process. This adsorption capacity of NAP also increased with the initial concentration. Furthermore, the pyrolysis temperature of biochar played a key role in NAP adsorption through influencing the structure of biochar. The adsorption of NAP on different loess soils was influenced by soil organic matter, and the high linear correlation between the solid and liquid phases indicated the dominant role of hydrophobic partitioning. According to our results, modifying loess soil with biochar made from wheat residue can enhance the retention of adsorbed PAHs in loess soil in Northwest China, thereby reducing the risk of PAH migration in the soil.
This study focused on the effects of biochar derived from wheat residue on the adsorption process of NAP in loess soil in Northwest China. Future studies will focus on biochar from different sources and its interaction mechanism with loess components. Additionally, studying the stabilization of biochar fixation in loess soil in tillage areas of Northwest China is critical.

Author Contributions

R.H.: writing—manuscript preparation, data analysis. R.Y.: experiment, data analysis. Y.J.: writing—manuscript preparation, reviewing and editing, funding acquisition. Z.L.: software, validation analysis. J.W.: soil sampling and treatment. X.Z.: instrumental analysis. G.W.: data analysis. All authors have read and agreed to the published version of the manuscript.

Funding

This work was financially supported by the National Natural Science Foundation of China, grant number 21966020; and the Natural Science Foundation of Gansu Province, grant number 20JR5RA392.

Data Availability Statement

Data will be made available on request.

Conflicts of Interest

The authors declare no conflict of interest.

References

  1. Song, M.; Yang, Y.; Jiang, L.; Hong, Q.; Zhang, D.; Shen, Z.; Yin, H.; Luo, C. Characterization of the phenanthrene degradation-related genes and degrading ability of a newly isolated copper-tolerant bacterium. Environ. Pollut. 2017, 220, 1059–1067. [Google Scholar] [CrossRef] [PubMed]
  2. Guo, Y.; Dai, Y.; Zhao, W.; Li, H.; Xu, B.; Sun, C. Highly efficient photocatalytic degradation of naphthalene by Co3O4/Bi2O2CO3 under visible light: A novel p–n heterojunction nanocomposite with nanocrystals/lotus-leaf-like nanosheets structure. Appl. Catal. B Environ. 2018, 237, 273–287. [Google Scholar] [CrossRef]
  3. Shi, C.; Qu, C.; Sun, W.; Zhou, J.; Zhang, J.; Cao, Y.; Zhang, Y.; Guo, J.; Zhang, J.; Qi, S. Multimedia distribution of polycyclic aromatic hydrocarbons in the Wang Lake Wetland, China. Environ. Pollut. 2022, 306, 119358. [Google Scholar] [CrossRef]
  4. Wang, J.; Zhang, H.; Cai, J.; Li, J.; Sun, B.; Wu, F. Effects of different carbon substrates on PAHs fractions and microbial community changes in PAHs-contaminated soils. Environ. Pollut. 2023, 324, 121367. [Google Scholar] [CrossRef] [PubMed]
  5. Ameur, W.B.; Annabi, A.; Mhadhbi, T.; Hassine, S.B.; Safouen, G.; Megdiche, Y.E.; Khadija, M.; Ennaceur, S.; Trabelsi, S.; Hammami, B.; et al. Polycyclic aromatic hydrocarbons in mullet (Chelon auratus) from two lagoons of great ecological and economic importance in Tunisia: Levels, sources and human health risk implications. J. Sea Res. 2023, 192, 102325. [Google Scholar] [CrossRef]
  6. Jafarabadi, A.R.; Bakhtiari, A.R.; Yaghoobi, Z.; Yap, C.K.; Maisano, M.; Cappello, T. Distributions and compositional patterns of polycyclic aromatic hydrocarbons (PAHs) and their derivatives in three edible fishes from Kharg coral Island, Persian Gulf, Iran. Chemosphere 2019, 215, 835–845. [Google Scholar] [CrossRef]
  7. Robin, S.L.; Marchand, C. Polycyclic aromatic hydrocarbons (PAHs) in mangrove ecosystems: A review. Environ. Pollut. 2022, 311, 119959. [Google Scholar] [CrossRef]
  8. Yu, H.; Li, T.; Liu, Y.; Ma, L. Spatial distribution of polycyclic aromatic hydrocarbon contamination in urban soil of China. Chemosphere 2019, 230, 498–509. [Google Scholar] [CrossRef]
  9. Wei, Y.P.; Ma, H.Q.; Li, S.; Li, C.; Zhang, L.; Kang, Q. Preparation of sludge-based biochar and its adsorption capacity for naphthalene. New Chem. Mater. 2023, 51, 281–286. [Google Scholar] [CrossRef]
  10. Gong, X.Y.; Xiong, W.F.; Peng, Z.; Hu, H.Y.; Zhong, P. Adsorption of naphthalene by chicken manure-derived biochar. J. Wuhan Univ. Sci. Technol. 2020, 43, 37–43. [Google Scholar] [CrossRef]
  11. Patowary, R.; Patowary, K.; Kalita, M.C.; Deka, S.; Borah, J.M.; Joshi, S.J.; Zhang, M.; Peng, W.; Sharma, G.; Rinklebe, J.; et al. Biodegradation of hazardous naphthalene and cleaner production of rhamnolipids-green approaches of pollution mitigation. Environ. Res. 2022, 209, 112875. [Google Scholar] [CrossRef] [PubMed]
  12. Bojes, H.K.; Pope, P.G. Characterization of EPA’s 16 priority pollutant polycyclic aromatic hydrocarbons (PAHs) in tank bottom solids and associated contaminated soils at oil exploration and production sites in Texas. Regul. Toxicol. Pharmacol. 2007, 47, 288–295. [Google Scholar] [CrossRef] [PubMed]
  13. Zhu, Y.; Ji, S.; Liang, W.; Li, C.; Nie, Y.; Dong, J.; Shi, W.; Ai, S. A low-cost and eco-friendly powder catalyst: Iron and copper nanoparticles supported on biochar/geopolymer for activating potassium peroxymonosulfate to degrade naphthalene in water and soil. Chemosphere 2022, 303, 135185. [Google Scholar] [CrossRef]
  14. Cao, Y.Z.; Han, M.; Xia, F.Y.; Yan, Z.G.; Zhou, Y.Y.; Guo, G.L.; Li, F.S. Regional variance and its influencing factors in deriving standard values of organic pollutants in soil: A case study based on human health risk assessment modeling approach. J. Agro-Environ. Sci. 2010, 29, 270–275. [Google Scholar]
  15. Yu, L.L.; Li, J.; Liu, G.Q.; Liu, X.; Qi, S.H.; Zhang, G. Polycyclic aromatic hydrocarbons in surface soils of the Pearl River Delta, south China. Ecol. Environ. 2007, 16, 1683–1687. [Google Scholar] [CrossRef]
  16. Tong, Y.F.; Chen, L.; Liu, Y.; Wang, Y.N.; Tian, S.Y. Distribution, sources and ecological risk assessment of PAHs in surface seawater from coastal Bohai Bay, China. Mar. Pollut. Bull. 2019, 142, 520–524. [Google Scholar] [CrossRef]
  17. Kaur, V.; Sharma, P. Effect of Prosopis juliflora Biochar on Physico-Chemical Properties of Naphthalene and Phenanthrene Contaminated Soil. Polycycl. Aromat. Compd. 2021, 41, 1406–1417. [Google Scholar] [CrossRef]
  18. Peng, Z.; Gong, X.Y.; Xiong, W.F.; Wang, Z.Y.; Ren, D.J. Effect and the mechanism of modified biochar on adsorption of naphthalene. J. Ecol. Rural Environ. 2021, 37, 1080–1088. [Google Scholar] [CrossRef]
  19. Du, L.; Ahmad, S.; Liu, L.; Wang, L.; Tang, J. A review of antibiotics and antibiotic resistance genes (ARGs) adsorption by biochar and modified biochar in water. Sci. Total Environ. 2022, 858, 159815. [Google Scholar] [CrossRef]
  20. Shang, Q.; Chi, J. Impact of biochar coexistence with polar/nonpolar microplastics on phenanthrene sorption in soil. J. Hazard. Mater. 2023, 447, 130761. [Google Scholar] [CrossRef]
  21. Cao, X.; Ma, L.; Liang, Y.; Gao, B.; Harris, W. Simultaneous immobilization of lead and atrazine in contaminated soils using dairy-manure biochar. Environ. Sci. Technol. 2011, 45, 4884–4889. [Google Scholar] [CrossRef] [PubMed]
  22. Wang, M.M.; Zhou, Q.X. Environmental effects and their mechanisms of biochar applied to soils. Environ. Chem. 2013, 32, 768–780. [Google Scholar] [CrossRef]
  23. Chen, Q.; Chen, L.F.; Wu, D.P.; Wu, M.; Pan, P. Mechanisms of soil minerals enhance biochar stability: A review. J. Agro-Environ. Sci. 2023, 42, 490–499. [Google Scholar]
  24. Zhang, C.H.; Wang, J.L.; Li, H.X.; Su, H.H.; Sun, Z.; Wang, X.T. Research development of remediation of polycyclic aromatic hydrocarbons contaminated soil by biochar. Appl. Chem. Ind. 2023, 52, 892–897+903. [Google Scholar] [CrossRef]
  25. Zhou, X.; Shi, L.; Moghaddam, T.B.; Chen, M.; Wu, S.; Yuan, X. Adsorption mechanism of polycyclic aromatic hydrocarbons using wood waste-derived biochar. J. Hazard. Mater. 2022, 425, 128003. [Google Scholar] [CrossRef] [PubMed]
  26. Sun, H.; Jiang, Y.F.; Hu, X.F.; Zhan, H.Y.; Yves, U.J. Adsorption and influential factors of carbofuran on the loess soil by adding biochar prepared at different temperatures. Acta Sci. Circumstantiae 2016, 36, 1015–1020. [Google Scholar] [CrossRef]
  27. Chang, X.L.; Hu, X.F.; Jiang, Y.F.; Sun, H.; Mu, Z.F. Biochar made from wheat straw: Preparation and characterization. J. Environ. Sci. Technol. 2017, 40, 24–29. [Google Scholar]
  28. Li, C.Y.; Sun, X.T.; Zhu, Y.F.; Liang, W.X.; Nie, Y.X.; Shi, W.J.; Ai, S.Y. Core-shell structural nitrogen-doped carbon foam loaded with nano zero-valent iron for simultaneous remediation of Cd (II) and NAP in water and soil: Kinetics, mechanism, and environmental evaluation. Sci. Total Environ. 2022, 832, 155091. [Google Scholar] [CrossRef]
  29. Zhang, J.H.; Zeng, J.H. Influence of several surfactants on sorption of toluene and naphthalene in soils. J. Agro-Environ. Sci. 2006, 25, 512–517. [Google Scholar]
  30. Jiang, Y.F.; Sun, H.; Yves, U.J.; Li, H.; Hu, X.F. Impact of biochar produced from post-harvest residue on the adsorption behavior of diesel oil on loess soil. Environ. Geochem. Health 2016, 38, 243–253. [Google Scholar] [CrossRef]
  31. Hu, X.F. Effect of Biochar on the Adsorption Behavior of Polycyclic Aromatic Hydrocarbons onto Oil-Contaminated Loess Soil; Lanzhou Jiaotong University: Lanzhou, China, 2015. [Google Scholar]
  32. OECD. Adsorption-Desorption Using a Batch Equilibrium Method: Technical Guideline 106; Organization for Economic Cooperation and Development: Paris, France, 2000. [Google Scholar]
  33. Ho, Y.S.; McKay, G. Sorption of dye from aqueous solution by peat. Chem. Eng. J. 1998, 70, 115–124. [Google Scholar] [CrossRef]
  34. Ho, Y.S.; McKay, G. Kinetic models for the sorption of dye from aqueous solution by wood. Process Saf. Environ. Prot. 1998, 76, 183–191. [Google Scholar] [CrossRef]
  35. Langmuir, I. The adsorption of gases on plane surfaces of glass, mica and platinum. J. Am. Chem. Soc. 1918, 40, 1361–1403. [Google Scholar] [CrossRef]
  36. Freundlich, H. Über die adsorption in lösungen (adsorption in solution). Phys. Chem. Period. 1906, 57, 384–470. [Google Scholar]
  37. Zhong, W.J.; Fu, D.J.; Qi, D.; Liu, R.N.; Lu, X.J. Preparation of Biochar and its Application in Water Treatment. Technol. Water Treat. 2023, 49, 26–30. [Google Scholar] [CrossRef]
  38. Tang, X.C.; Zhang, M. Review on the Remediation of Contaminated Soil by Biochar Amendment. Environ. Sci. Surv. 2014, 33, 17–26. [Google Scholar] [CrossRef]
  39. Chen, B.; Chen, Z. Sorption of naphthalene and 1-naphthol by biochars of orange peels with different pyrolytic temperatures. Chemosphere 2009, 76, 127–133. [Google Scholar] [CrossRef]
  40. Li, F.Y.; Tao, J.G.; Wang, J.F.; Li, X.L. Difference characteristics of biochar derived from peanut shell under different temperatures. Chin. J. Environ. Eng. 2017, 11, 3726–3730. [Google Scholar] [CrossRef]
  41. Lu, H.N.; Hu, X.Y.; Liu, H.W. Influence of Pyrolysis Conditions on Stability of Biochar. Environ. Sci. Technol. 2013, 36, 11–14. [Google Scholar] [CrossRef]
  42. Xing, B.S.; Pignatello, J.J. Time-dependent isotherm shape of organic compounds in soil organic matter: Implications for sorption mechanism. Environ. Toxicol. Chem. Int. J. 1996, 15, 1282–1288. [Google Scholar] [CrossRef]
  43. Karapanagioti, H.K.; Kleineidam, S.; Sabatini, D.A.; Grathwohl, P.; Ligouis, B. Impacts of heterogeneous organic matter on phenanthrene sorption: Equilibrium and kinetic studies with aquifer material. Environ. Sci. Technol. 2000, 34, 406–414. [Google Scholar] [CrossRef]
  44. Deng, J.C.; Jiang, X.; Hu, W.P.; Lu, X. Effect of sorption reaction time on sorption behavior of herbicide atrazine. Ecol. Environ. Sci. 2007, 2, 402–406. [Google Scholar] [CrossRef]
  45. Zhang, Z.Y.; Chen, T.; Li, W.Y. Adsorption of polycyclic aromatic hydrocarbon naphthalene in water by two kinds of biochar. Appl. Chem. Ind. 2022, 51, 653–657. [Google Scholar] [CrossRef]
  46. Cabal, B.; Ania, C.O.; Parra, J.B.; Pis, J.J. Kinetics of naphthalene adsorption on an activated carbon: Comparison between aqueous and organic media. Chemosphere 2009, 76, 433–438. [Google Scholar] [CrossRef] [PubMed]
  47. Lesan, H.M.; Bhandari, A. Contact-time-dependent atrazine residue formation in surface soils. Water Res. 2004, 38, 4435–4445. [Google Scholar] [CrossRef] [PubMed]
  48. Tang, Z. Mechanism and Model Study on Benzene Sorption and Desorption by Organic Matter in Soil. Ph.D. Thesis, China University of Geosciences, Wuhan, China, 2021. [Google Scholar] [CrossRef]
  49. Yu, Z.; Wang, Q.; Huang, J.; Meng, C.; Lu, J.M. Adsorption equilibrium, kinetics and mechanism studies of copper and nickel on coal-fired fly ash. Coal Process. Compr. Util. 2022, 272, 91–95. [Google Scholar] [CrossRef]
  50. Yuan, J.; Feng, L.; Wang, J. Rapid adsorption of naphthalene from aqueous solution by naphthylmethyl derived porous carbon materials. J. Mol. Liq. 2020, 304, 112768. [Google Scholar] [CrossRef]
  51. Chang, M.Y.; Juang, R.S. Adsorption of tannic acid, humic acid, and dyes from water using the composite of chitosan and activated clay. J. Colloid Interface Sci. 2004, 278, 18–25. [Google Scholar] [CrossRef]
  52. Xiong, H.; Xiao, Y.; Yan, Z. Preparation of activated carbon and its adsorption of naphthalene in liquid paraffin oil. Colloid Interface Sci. Commun. 2021, 43, 100460. [Google Scholar] [CrossRef]
  53. Chang, C.F.; Chang, C.Y.; Chen, K.H.; Tsai, W.T.; Shie, J.L.; Chen, Y.H. Adsorption of naphthalene on zeolite from aqueous solution. J. Colloid Interface Sci. 2004, 277, 29–34. [Google Scholar] [CrossRef]
  54. Zhao, E.L.; Yin, A.P.; Zhang, X.L.; Hao, L.Q.; Zhao, S.H. Thermodynamics and kinetics of adsorption of Cr (VI) on sorghum stalk siochar. New Chem. Mater. 2017, 45, 186–188+193. [Google Scholar]
  55. Zhang, Z.G.; Jiang, Y.F.; Mu, Z.F.; Sun, H.; Zhou, Q.; Zhan, H.Y. Effect of Biochar on Adsorption Behavior of Nonylphenol onto Loess Soil in Northwest China. Environ. Sci. 2016, 37, 4428–4436. [Google Scholar] [CrossRef]
  56. Pan, Y.F.; Wang, Y.L.; Liu, W.X.; Zhao, B.D.; Chen, B. Adsorption Kinetics and Thermodynamics of ADN on Activated Carbon. Chin. J. Explos. Propellants 2019, 42, 465–472. [Google Scholar] [CrossRef]
  57. Chen, D.; Xing, B.; Xie, W. Sorption of phenanthrene, naphthalene and o-xylene by soil organic matter fractions. Geoderma 2007, 139, 329–335. [Google Scholar] [CrossRef]
  58. Huang, H.; Wang, Y.X.; Tang, J.C.; Zhu, W.Y. Properties of Maize Stalk Biochar Produced Under Different Pyrolysis Temperatures and Its Sorption Capability to Naphthalene. Environ. Sci. 2014, 35, 1884–1890. [Google Scholar] [CrossRef]
  59. McCall, P.J.; Laskowski, D.A.; Swann, R.L.; Dishburger, H. Test protocols for environmental fate and movement of toxicants. In Proceedings of the AOAC, Washington, DC, USA, 21–22 October 1980; Association of Official Analytical Chemists: Washington, DC, USA, 1980; pp. 89–109. [Google Scholar]
  60. Liu, W.; Ma, J.J.; Yao, X.D.; Cheng, L.; Fang, R.N. Adsorption thermodyamics of carbon black to dispersant in isopropanol aqueous. Text. Aux. 2018, 35, 18–22. [Google Scholar]
  61. Han, J.; Li, J.X.; Cui, H.Y.; LÜ, W.; Bai, S.Q. Kinetic and thermodynamic characteristics of phosphorus adsorption by modified corn straw. J. Agro-Environ. Sci. 2020, 39, 2008–2014. [Google Scholar] [CrossRef]
  62. Chen, Y.; Zhang, F.A.; Shao, J.T.; Xu, J.B.; Yu, C.L. Thermodynamics and kinetics of carmine adsorption on rosin-based aminated polymer microspheres. J. Guilin Univ. Technol. 2019, 39, 439–445. [Google Scholar] [CrossRef]
  63. Flores, C.; Morgante, V.; González, M.; Navia, R.; Seeger, M. Adsorption studies of the herbicide simazine in agricultural soils of the Aconcagua valley, central Chile. Chemosphere 2009, 74, 1544–1549. [Google Scholar] [CrossRef]
  64. Zhu, H.J.; Li, J.H. Thermodynamics study on Adsorption-desorption of Pymetrozine in three soils. Guangzhou Chem. Ind. 2022, 50, 78–80+102. [Google Scholar]
  65. Sun, Y.P. The Properties of Naphthalene Adsorption on Soil and Its Site-Energy Distribution Analysis; Xi’an University of Architecture and Technology: Xi’an, China, 2008. [Google Scholar]
  66. Wan, J.M.; Liu, X.; Zhang, W.J.; Zhang, M.; Yang, Y.T. Adsorption characteristics of phenanthrene and naphthaleneon on Lou soil. J. Agro-Environ. Sci. 2011, 30, 1991–1997. [Google Scholar]
  67. Rafatullah, M.; Sulaiman, O.; Hashim, R.; Ahmad, A. Adsorption of copper (II), chromium (III), nickel (II) and lead (II) ions from aqueous solutions by meranti sawdust. J. Hazard. Mater. 2009, 170, 969–977. [Google Scholar] [CrossRef] [PubMed]
  68. Liu, A.A.; Huang, Z.; Deng, G.H.; Guo, Y. Adsorption of benzonitrile at the air/water interface studied by sum frequency generation spectroscopy. Chin. Sci. Bull. 2013, 58, 1529–1535. [Google Scholar] [CrossRef]
  69. Xiao, X.; Liu, D.; Yan, Y.; Wu, Z.; Wu, Z.; Cravotto, G. Preparation of activated carbon from Xinjiang region coal by microwave activation and its application in naphthalene, phenanthrene, and pyrene adsorption. J. Taiwan Inst. Chem. Eng. 2015, 53, 160–167. [Google Scholar] [CrossRef]
  70. Yu, X.Y. Impact of Charcoal on the Sorption/Desorption Behavior and Bioavailability of Pesticide in Soil; Northwest A&F University: Xianyang, China, 2007. [Google Scholar]
  71. Zhao, M.; Chen, B.F.; Feng, M.H.; Chen, K.N.; Pan, J.Z. Spectral characteristics of dissolved organic matter released from biochar at different pyrolysis temperatures. Spectrosc. Spectr. Anal. 2020, 40, 2505–2511. [Google Scholar]
Figure 1. SEM images of biochar samples prepared at different pyrolytic temperatures: (a) wheat residue; (b) BC-200; (c) BC-400; and (d) BC-600 (10 μm, EHT = 5.0 KV, WD = 12.8 mm, Mag = 2.00 K X, and Signal A = SE2).
Processes 11 03085 g001
Figure 2. FTIR spectra of wheat residue and biochar samples: (a) wheat residue; (b) BC-200; (c) BC-400; (d) BC-600.
Processes 11 03085 g002
Figure 3. Kinetics curves for the adsorption and fitting curves of NAP on loess soil applicated with the different biochar samples.
Processes 11 03085 g003
Figure 4. Thermodynamic adsorption curves and fitting curves of NAP o on loess soil applicated with the different biochar samples: (a) BC-200; (b) BC-400; (c) BC-600; (d) 25 °C.
Processes 11 03085 g004
Figure 5. Effect curve of the different initial NAP concentration for the adsorption of loess soil applicated with the different biochar samples.
Processes 11 03085 g005
Figure 6. Curves of different biochar pyrolysis at different temperatures for the adsorption of NAP on loess soil.
Processes 11 03085 g006
Table 1. Properties of the selected loess soil.
SoilspHTOCCECClaySiltSand
g/kgcmol/kgg/kg
S17.569.1737.107.3052.4040.30
S28.239.2023.209.7032.7057.60
S38.4210.8421.3012.2069.6018.20
Table 2. Sorption kinetics and sorption thermodynamics models.
NamesExpression Equations
Sorption kinetics modelsPseudo-first-order model 1 q t = 1 q 1 + k 1 q 1 t
Pseudo-second-order model t q t = 1 k 2 q 2 2 + t q 2
Sorption thermodynamics modelsLangmuir model C s = Q m × K L × C e 1 + K L × C e
Freundlich model C s = K F C e 1 / n
Table 3. Yields, elemental analysis, specific area, pore volume, and aperture of the prepared biochar.
BiocharTYieldsCHNO(O + N)/CO/CH/CSpecific AreaPore VolumeAperture
°C%%%%%---m2·g−1mL·g−1nm
Wheat straw----43.325.630.2943.680.850.830.064.170.02422.62
BC-20020083.7063.635.150.4030.810.490.480.081.720.00818.63
BC-40040023.6074.973.091.0720.870.290.280.04304.180.1762.31
BC-60060021.5079.492.180.4217.910.230.230.03521.290.3222.47
Table 4. Fitting parameters of NAP adsorption kinetic process on loess soil applicated with the different biochar samples.
SoilsAdsorbentPseudo-First-Order Kinetic ModelPseudo-Second-Order Kinetic Model
k1q1R12pk2q2R22p
min−1mg·g−1--g·(mg·min)−1mg·g−1--
S1BC-600 + S19.412.730.9241.13 × 10−100.0162.811.0000.025
BC-400 + S113.402.410.7511.82 × 10−80.0062.660.9990.023
BC-200 + S124.802.160.8112.62 × 10−80.0052.450.9990.023
S136.602.170.7592.33 × 10−70.0032.580.9980.022
S2BC-600 + S214.202.680.8523.66 × 10−90.0162.790.9990.026
BC-400 + S223.202.530.8984.81 × 10−80.0082.710.9980.023
BC-200 + S222.502.340.7087.77 × 10−80.0092.590.9990.022
S230.802.460.8451.60 × 10−70.0062.690.9990.022
S3BC-600 + S312.002.750.9222.68 × 10−100.0122.850.9990.025
BC-400 + S321.102.580.9451.45 × 10−80.0082.710.9980.023
BC-200 + S334.602.440.9402.72 × 10−70.0062.640.9980.023
S332.802.500.8955.41 × 10−70.0072.690.9990.021
Table 5. Fitting parameters of NAP adsorption isotherm on loess soil applicated with the different biochar samples.
AdsorbentTLangmuir Adsorption ModelFreundlich Adsorption Model
QmKLRL2pnKFRF2p
°Cmg·g−1L·g−1---L·g−1--
Soil2524.400.050.9990.0011.121.180.9960.001
3512.600.120.9900.0011.151.290.9980.002
4565.800.010.9810.0040.580.250.9330.007
Soil + BC-200251.561.610.9970.0011.390.880.9970.001
351.301.570.9880.0011.310.990.9960.001
4552.600.040.9990.0031.042.040.9990.008
Soil + BC-4002552.100.020.9990.0011.041.320.9970.001
35−65.40−0.040.9670.0011.092.990.9810.001
45−1.98−0.130.8270.0120.580.250.9330.021
Soil + BC-60025−8.45−0.140.9960.0010.791.430.9970.002
35−6.21−0.230.8950.0020.842.140.9570.004
45−10.40−0.180.9270.0040.942.510.9680.009
Table 6. Thermodynamic parameters for the adsorption of NAP on loess soil of different biochar.
T (°C)ΔGθ (kJ/mol)ΔHθ (kJ/mol)ΔSθ (J/K × mol)
25−1.86
35−2.305.840.02
45−2.52
Disclaimer/Publisher’s Note: The statements, opinions and data contained in all publications are solely those of the individual author(s) and contributor(s) and not of MDPI and/or the editor(s). MDPI and/or the editor(s) disclaim responsibility for any injury to people or property resulting from any ideas, methods, instructions or products referred to in the content.

