Article

Numerical Modeling and Economic Analysis of Ultrasonic-Assisted CO2 Absorption Process for Offshore Application

1
CO2 Research Center (CO2RES), Chemical Engineering Department, Universiti Teknologi PETRONAS, Bandar Seri Iskandar 32610, Malaysia
2
Carbon Capture, Utilization & Storage (CCUS) R&D Department, PETRONAS Research Sdn Bhd, Jalan Ayer Itam, Kawasan Institusi Bangi, Kajang 43000, Malaysia
*
Author to whom correspondence should be addressed.
Processes 2023, 11(11), 3089; https://doi.org/10.3390/pr11113089
Submission received: 22 September 2023 / Revised: 23 October 2023 / Accepted: 25 October 2023 / Published: 27 October 2023

Abstract

:
In the quest for net zero carbon emissions by 2050, Carbon Capture Utilization and Storage (CCUS) is indispensable. The development of more efficient CO2 capture processes is essential. High-frequency ultrasonic irradiation is an emerging, intensified technique that can enhance the CO2 absorption process. To advance this technology toward commercialization, it is crucial to conduct a thorough economic analysis to allow the identification of the key cost component. While equipment sizing is essential in this economic assessment, there is a lack of numerical models for estimating the size and power consumption of ultrasonic absorbers. This study introduces a numerical model for these predictions. The model was then used to determine the economic feasibility of this emerging technique against the packed bed columns based on capital expenditure (CAPEX), operational expenditure (OPEX), and unit technical cost (UTC) for 20 years of plant operation. According to the economic analysis, ultrasonic intensification requires 34% less CAPEX due to its compact design. Although its OPEX is 11% higher due to the additional electricity needed for the ultrasonic transducers, the UTC is still 3% lower than the conventional packed bed column, demonstrating a potential cost savings in implementing the ultrasonic irradiation-assisted technique during the CO2 absorption process offshore.

1. Introduction

Carbon capture is one of the critical paths in the carbon capture, utilization, and storage (CCUS) solution towards a sustainable transition to net zero emissions and to overcome the global warming issue. It is essential to develop a more efficient CO2 capture process that is at the same time economically feasible to commercialize. In the oil and gas industry, natural gas extracted from the field can often feature elevated CO2 concentrations. Consequently, it is imperative to manage the surplus CO2 effectively while safeguarding the natural environment. Acid gases such as CO2 and H2S must be removed from natural gas to prevent pipeline corrosion, meet sales gas calorific values, avoid crystallization during liquefaction, and protect humans from exposure to highly toxic H2S gas [1,2,3,4]. Several technologies for acid gas removal from natural gas have been developed and commercialized, including membrane separation, cryogenic distillation, and solvent-based absorption processes [3,5,6].
Among these technologies, the acid gas absorption process using an amine-based solvent has been widely used in the oil and gas industries for decades. The chemical absorption technology demonstrates remarkably high separation efficiency (>90%) even at low carbon dioxide (CO2) partial pressure with minimal hydrocarbon loss. The effectiveness of the amine-based absorption process is primarily driven by the chemical reaction occurring between the acid gas and the specific type of solvent employed within the absorber.
Methyldietanolamine (MDEA) is commercially used as the solvent for the CO2 absorption process due to its promising characteristics such as high absorption capacity, low regeneration energy, low degradation rate, and being less corrosive as compared with primary and secondary amines [7,8,9]. However, the reaction rate between MDEA and acid gas such as CO2 is slower as compared with the reaction between primary and secondary amines with CO2, such as monoethanolamine (MEA) and diethanolamine (DEA) [4,8,10,11]. Due to this, piperazine (PZ), a cyclic diamine, is usually used with MDEA as the activator for CO2 removal because of its rapid formation to form carbamate and bicarbamate with CO2 [5,12]. The blended MDEA and PZ solvent (known as activated MDEA, or aMDEA) is usually employed to remove both CO2 and hydrogen sulfide (H2S) from natural gas during the sweetening process [9,13,14]. The aMDEA solvent was developed in the 1970s and patented by BASF for the CO2 absorption process, with a removal efficiency higher than the traditional MEA and potassium carbonate solvents. Besides, the solvent requires only one-third of the energy consumption of conventional Benfield technology [14,15,16]. Aqueous aMDEA reacts directly with H2S to form amine salt (methyldiethanolamine sulphide) as compared with CO2, and it does not form carbamate [9,17]. Therefore, the presence of CO2 will not affect the absorption of H2S, even though the partial pressure of H2S in the feed gas stream is much lower than CO2.
Although this technology has been applied in acid gas sweetening for several decades, the conventional absorption column suffers several drawbacks, such as a high equipment corrosion rate, low CO2 loading capacity, causing product off-spec, foaming, flooding, amine degradation, high energy consumption during regeneration, and excessive footprint and tonnage [12,18]. Ultrasonic irradiation is an emerging technology that can enhance gas-liquid mass transfer, enabling compact and lightweight designs, especially for offshore operations.
Ultrasonic irradiation technology has been studied widely to improve mass transfer for a wide variety of processes, such as biotechnology [19], chemical reactions and processes [20], wastewater treatment [19,21], microfluid systems [22,23], food technology [24], crude oil upgrading [25], and natural gas purification [26]. Ultrasonic technology has been widely used to enhance the mass transfer process due to its chemical and physical effects on the liquid medium [27]. The chemical effect of ultrasonic irradiation is also known as the sonochemistry effect, which is induced by the implosion of cavitation bubbles at high local pressure and temperature, causing the formation of free radicals [
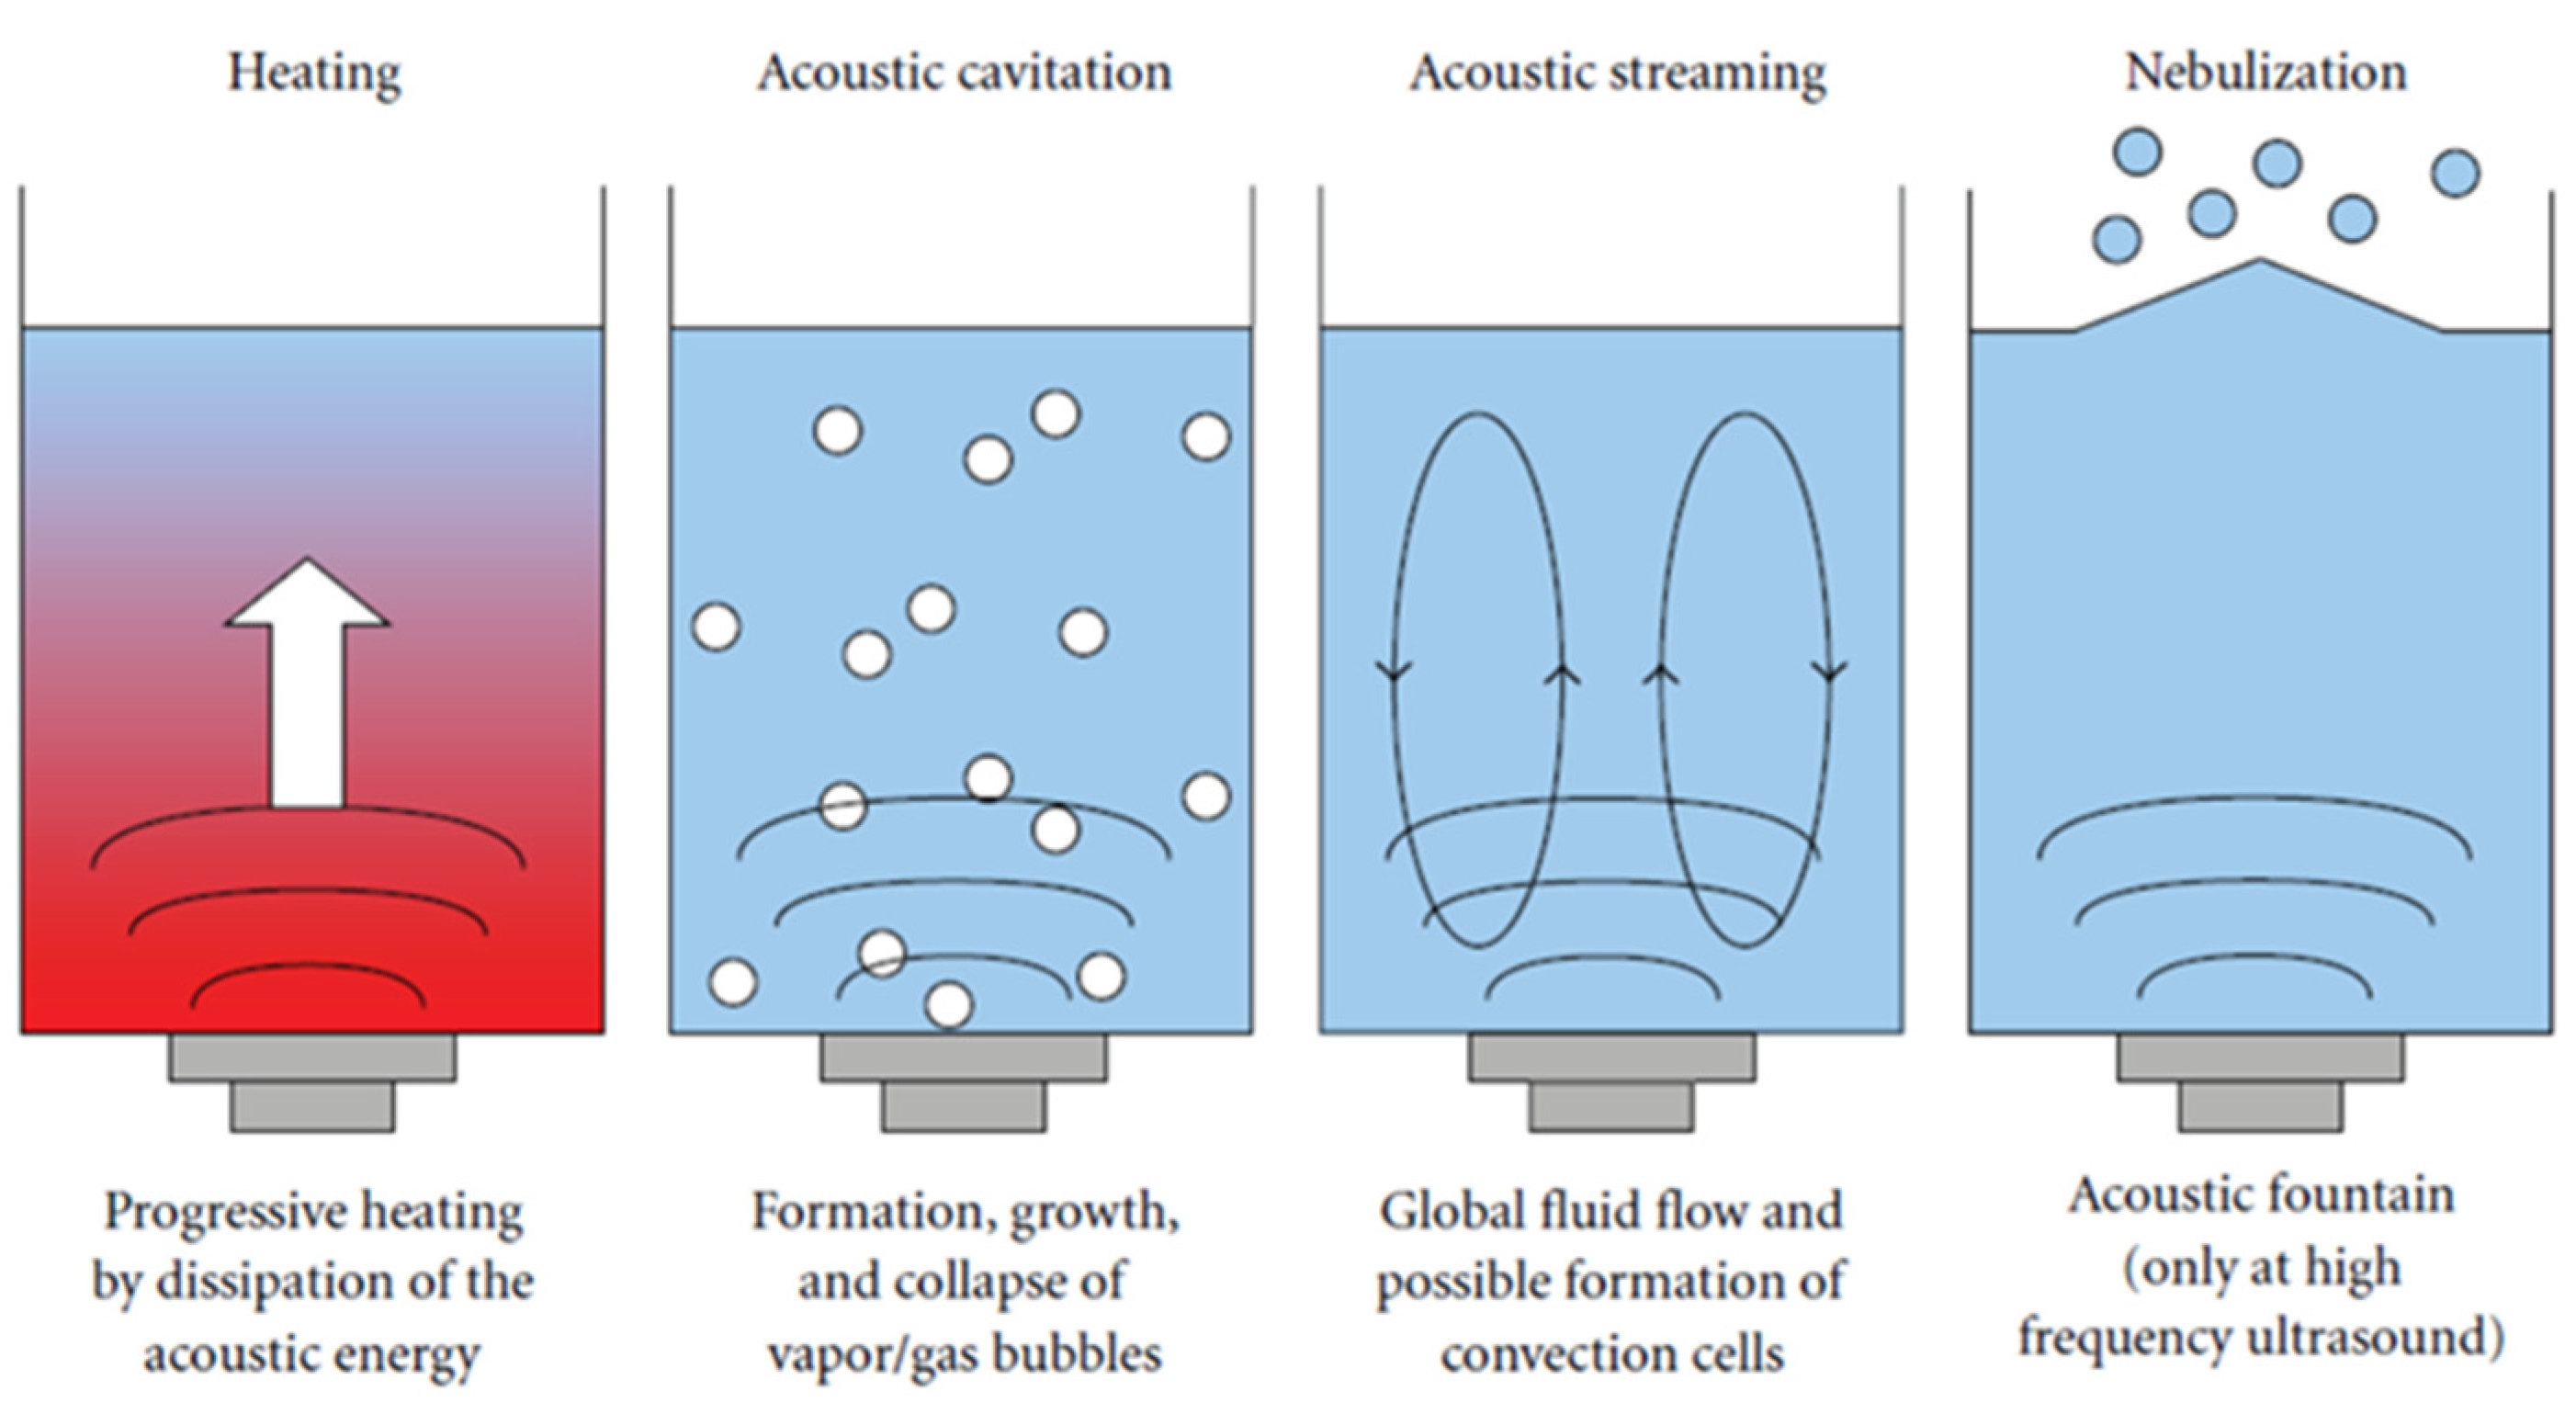
27]. These free radicals may enhance chemical reactions during the gas-liquid mass transfer process. Another phenomenon induced by ultrasonic irradiation in the liquid medium is the sonophysical effects, which refer to the formation of cavitation bubbles, acoustic streaming, an acoustic fountain, and atomization [27]. Figure 1 shows the schematic diagram of the sonophysical effects of ultrasonic irradiation in the liquid medium. The sonochemistry and sonophysical effects induced by high-frequency ultrasonic waves enhance mixing, stimulate radical formation, and increase the available surface area for mass transfer. This, in turn, results in higher removal efficiency.
Several experimental studies have been conducted to confirm the effect of ultrasonic irradiation on mass transfer enhancement in the gas-liquid absorption process. Tay et al. (2016) [29] investigated the effect of ultrasonic power up to 18 W on the CO2 absorption process. Based on the experimental results, it was observed that the formation of an acoustic fountain and liquid atomization generated from a high ultrasonic power source can amplify the mass transfer absorption process by up to 80 times. Acoustic streaming provides better gas-liquid mixing, while an acoustic fountain increases the gas-liquid interfacial area for mass transfer. M. Yusof et al. (2019) [27] have conducted a continuous experimental study utilizing 1.7 MHz ultrasonic waves to assist CO2 absorption in distilled water. The effect of gas flow rate, liquid flow rate, pressure, and voltage on absorption performance has been studied, and numerical optimization using Design Expert software has been conducted. At the optimum condition, the mass transfer coefficient of the continuous ultrasonic contactor system surpasses that of other contacting equipment, including bubble columns, stirred vessels, and counter-current-packed columns.
Akbari et al. (2017) [30] also conducted an experimental study to investigate the impact of 1.7 MHz ultrasound waves on micro-scale T-shaped glass microreactor gas-liquid contactors. Their research encompassed both physical and chemical absorption of CO2 into deionized water and sodium hydroxide solutions, respectively. The findings from their study revealed a significant enhancement in mass transfer coefficient when ultrasound waves were utilized as compared with the silent system at various operating conditions.
Numerical simulation has gained prominence in the advancement of ultrasonic-assisted gas-liquid mass transfer technology. This approach offers a comprehensive understanding of the distinctive flow behaviors induced by high-frequency ultrasound waves, such as mixing, cavitation, and heat and mass transfer mechanisms [31,32,33]. For instance, Abolhasani et al. (2012) conducted a numerical study on the effect of high-frequency ultrasonic waves on the heat transfer rate [34]. The simulation results revealed that the 1.7 MHz ultrasound wave fostered enhanced fluid mixing and the generation of high-velocity flows, resulting in a more uniformly distributed temperature in a vessel. Moreover, the simulation findings were validated against experimental data, illustrating a robust agreement between the CFD simulation and the actual temperature measurements recorded during the experiments.
Another study led by Parvizian et al. (2012) used the CFD model to predict the complex flow pattern induced by the 1.7 MHz transducers in a novel ultrasound reactor [35]. The outcomes of their CFD simulation have shown the superior performance of the sonoreactor, which exhibited a notably more uniform velocity distribution in contrast to a traditional stirred tank operating at equivalent power consumption. The formation of a jet stream capable of improving liquid mixing can be induced by high-frequency ultrasound waves, even with lower power consumption.
Xu et al. (2016) introduced a numerical model to predict the formation of acoustic fountains by taking into account the influence of surface tension and ultrasound radiation pressure [36]. With this model, they predicted that the area of the acoustic fountain increased with the increase in ethanol concentration in the liquid medium. This effect stems from ethanol’s lower surface tension, density, and sound speed. Furthermore, numerical modeling has also been developed to determine the mass transfer coefficient for ultrasonic-assisted gas-liquid mass transfer. Researchers frequently employ the dynamic method of gassing-in and the logarithmic expression of the instantaneous pressure method to derive the mass transfer coefficient from experimental data, as previously demonstrated in multiple studies [29,37].
Based on previous experimental works, the effectiveness of the ultrasonic-assisted CO2 absorption process has been well established, particularly in batch operations. Yet, for further advancement of this technology toward commercialization, a central challenge lies in cost reduction, encompassing both capital and operational expenses. Therefore, a comprehensive economic analysis is imperative to pinpoint the primary cost components of ultrasonic irradiation technology, enabling further cost optimization. One of the critical criteria for the economic analysis is equipment sizing, which will determine the capital expenditure (CAPEX) of the technology. However, the numerical model to predict the effective volume of the ultrasonic absorber is still lacking in the literature.
To the best of our knowledge, no literature to date has reported on the process simulation and economic analysis for the ultrasonic-assisted CO2 absorption process. This paper presents a numerical model to predict the effective volume and energy consumption of the ultrasonic absorber using data from experimental studies. The predicted effective volume and energy consumption were further employed in process simulation to facilitate the economic comparison analysis between the ultrasonic-assisted CO2 absorption system and conventional packed bed columns. Data from the process simulation was also used to estimate the operating expenditure (OPEX) for 20 years of operation. Finally, the Unit Technical Cost (UTC) was estimated to determine the economic feasibility of the ultrasonic absorber as compared with the conventional packed bed column.

2. Experimental Testing

2.1. Material

In this study, MDEA (purchased from Revlogi Materials, Puchong, Malaysia) and PZ (from Sigma Aldrich, Petaling Jaya, Malaysia) were mixed into a concentration of 46 wt% (39 wt% MDEA, 7 wt% PZ); the balance was distilled water and loaded with CO2 through direct bubbling (to achieve 0.2 mol CO2/mol amine loading). This mixture was used as the solvent for the ultrasonic-assisted CO2 absorption process. The feed gas was prepared by mixing the pure CO2 gas (supplied by Air Product, Kuala Lumpur, Malaysia) with pure nitrogen (N2) gas (supplied by Air Product, Kuala Lumpur, Malaysia) based on the volumetric flow rate to meet the target composition of 25 vol% CO2 and 75 vol% N2. This mixture was used to replicate the composition of natural gas. Given that N2 is an inert gas with lower solubility than CO2, which is similar to methane (CH4), substituting the flammable gas CH4 with N2 will have no discernible impact on the absorption performance [38,39].

2.2. Experimental Setup

An integrated pilot plant consisting of an ultrasonic-assisted absorption and solvent regeneration system was developed to study the performance of a continuous ultrasonic-assisted absorption process for the removal of CO2 at various operating conditions. The schematic diagram and the process description were described in our previous paper [40]. The absorption process was conducted at 60 barg pressure and 76 °C temperature, and the solvent regeneration was performed at 1 barg pressure and 100 °C temperature.

2.3. Experimental Procedure and Analysis

Experimental tests were conducted to determine the effect of operating conditions such as gas flow rate, liquid flow rate, and ultrasonic power on the ultrasonic-assisted CO2 absorption performance. The optimized operating conditions were selected based on the CO2 outlet concentration (mol%), liquid-to-gas ratio (L/G) (gal/lbmol), mass transfer coefficient (KGa) (mol/m3.s.Pa), ultrasonic absorber effective volume (m3), and ultrasonic absorber power consumption (MW). CO2 outlet concentration was measured using the infrared (IR) analyzer, and L/G and KGa were determined based on calculations as explained in our previous paper [40]. The ultrasonic absorber’s effective volume and power consumption were numerically determined and further described in Section 3.3 and Section 3.4. Table 1 provides the testing conditions for the experimental studies.
The titration method was used to determine the amine concentration and loading. For amine concentration determination, the samples were titrated with 0.5 N hydrochloric acid (HCl) [41]. 95 mL of distilled water was mixed with 5 g of amine sample and stirred at 400 rpm using the magnetic stirrer. The pH of the solution was determined using the pH meter (HANNA HI8424 Portable pH meter). The mixture was subsequently titrated using 0.5 N HCl until it reached a pH of 4.5. The weight of the amine sample, the pH of the solution before and after titration, and the volume of 0.5 N HCl solution used in the titration were recorded. The concentration of amine solution in wt% was calculated using the formula [41]:
( V H C l × N H C l × 9.102 W s ) = w t %   a m i n e
where  V HCl  (mL) was the volume of HCl used to titrate the sample,  N HCl  was the normality of the HCl solution, and  W s  (g) is the weight of the sample.
For amine loading determination, the amine samples were titrated with 0.5 N potassium hydroxide (KOH) [41]. First, 125 mL of methanol was measured, and its pH was adjusted to 11.2 by adding a few drops of 0.5 N KOH. Furthermore, 20 g of the amine sample was weighed, mixed with the pH-adjusted methanol solution, and stirred at 400 rpm using the magnetic stirrer. The pH of the solution was determined using the pH meter (HANNA HI8424 Portable pH meter). The solution was then titrated with 0.5 N KOH until the pH of the solution returned to 11.2. The weight of the amine sample, the pH of the mixture before and after titration, and the volume of 0.5 N KOH used in the titration were recorded. The concentration (wt%) of acid gas in the amine solution was determined using the formula [41]:
( V K O H W s V K O H , f W s , f ) × N K O H × 4.4 = w t %   a c i d   g a s
where  V KOH  (mL) was the volume of KOH used to titrate the sample,  V KOH , f  (mL) was the volume of KOH used to titrate fresh solvent,  W s , f  (g) is the weight of fresh solvent, and  N KOH  is the normality of the KOH solution.
The acid gas loading (mol CO2/mol amine) was calculated based on amine, and the acid gas concentration was determined using Equations (1) and (2):
( w t %   a c i d   g a s × 2.068 w t %   a m i n e ) = A c i d   g a s   l o a d i n g

3. Numerical Modeling of The Ultrasonic Absorber

3.1. Kinetic Reactions of CO2 Absorption into PZ + MDEA + Water Blended Solvent

The absorption rate of CO2 into the aqueous amine solvent mass transfer mechanism is represented using a rate-based steady-state model [42,43]. The main reactions that occur during CO2 absorption into MDEA + PZ + water blended solvent include carbamate formation, bicarbamate formation, and MDEA-catalyzed hydration, as listed in R1–R5 in Table 2 [5,14,43].
R1 in Table 2 shows the reaction of CO2 with tertiary alkanolamines (MDEA) proposed by Donaldson and Nguyen [44]. This reaction mechanism entails the base-catalyzed hydration of CO2. The mechanism suggests that tertiary amines cannot react directly with CO2. In support of this concept, Versteeg and Van Swaaij (1988) [45] conducted a study on the absorption of CO2 into non-aqueous (ethanol) solutions of MDEA and determined that solely physical absorption takes place in non-aqueous tertiary alkanolamine systems. Their findings reinforce the validity of the R1 mechanism.
PZ can react rapidly with CO2 to form carbamate and bicarbamate through R2 and R3. Both reaction rates are much faster than R1; therefore, the main reactions during the CO2 absorption process are the carbamate and bicarbamate formations [14]. PZ also can transfer the CO2 to MDEA as a homogeneous activator through the PZ regeneration mechanism, as stated in R4 [14,15]. The ability of PZ to regenerate in the bulk solution in the presence of MDEA as a proton acceptor will help to maintain the absorption rate in the MDEA + PZ + Water blended solvent at a moderate level for a prolonged period, which is much higher as compared with MDEA + water or PZ + water solvent [14,16].
The chemical absorption of CO2 into MDEA+PZ blended solvent can be depicted as a process involving gas absorption coupled with two parallel rapid pseudo-first-order reversible reactions [16,46]. The overall reaction rate is expressed in terms of the molar concentration of CO2 and MDEA+PZ, as suggested by Xu et al. (1992) [16]:
r o v = ( k 2 , M D E A C M D E A + k 2 , P Z C P Z ) [ C O 2 ]
where  C MDEA  and  C PZ  was the free concentration of MDEA and PZ, respectively, and  k 2 , M D E A  and  k 2 , P Z  was the second-order rate constant for MDEA and PZ, respectively. However, in the bulk solution, it is difficult to measure the concentration of MDEA and PZ separately. Since the concentration of PZ in the blended solvent is minimal as compared with MDEA and the reaction of PZ to form carbamate and bicarbamate is faster as compared with the PZ regeneration mechanism [47], only the free concentration of MDEA was considered for the reaction rate constant calculation. In this case, the overall reaction rate constant,  k O V , was simplified by using the coefficient kinetic constant,  k 2 , M D E A  as follows:
r o v = k o v [ CO 2 ]
k o v = k 2 , M D E A C M D E A
The reaction rate constant for MDEA,  k 2 , M D E A  (m3/kmol.s), was calculated based on the equation given by Haimour et al. (1987) [48]:
k 2 , M D E A = 8.741 × 10 12 e x p ( 8625 / T )
The  C MDEA   (mol/L) was determined using the log-mean average of the free concentration of MDEA at the liquid inlet and outlet of each segment. This value was assumed to be constant for every stage in the ultrasonic absorber since the liquid flows in parallel mode to each of the stages:
C M D E A = ( C M D E A ,   i n C M D E A , o u t ) ln ( C M D E A ,   i n C M D E A , o u t )

3.2. Modeling of Ultrasonic CO2 Absorption

The mass transfer between the gas and liquid phases in the ultrasonic absorber is described based on the two-film theory. The transport of CO2 species begins with its diffusion from the bulk gas phase to the gas-liquid interface through the gas film. At this interface, the CO2 absorption reaction takes place, and the reaction products then diffuse into the bulk liquid through the liquid film. These reactions can be classified into various kinetic regimes, which range from instantaneous, fast, intermediate, slow, or infinitely slow reactions [43].
The two-film theory considers equilibrium at the gas-liquid interphase, and the mass transfer resistance between the gas and liquid phases is added to get the overall resistance [49]. The overall mass transfer resistance of the CO2 absorption process can be estimated using the resistance in series (RIS) model [43,50,51]:
1 K G a = 1 k g a e + k l a e E H C O 2
where  K G a  (mol/m3.s.Pa) is the overall mass transfer coefficient,  k g a e  (1/s) is the gas phase mass transfer coefficient,  k l a e  (1/s) is the liquid phase mass transfer coefficient,  H C O 2  (Pa.m3/mol) is the Henry’s law constant, and  E    is the chemical enhancement factor of aMDEA. For the CO2-(MDEA+PZ) reactions, it is assumed that the reactions are fast pseudo-first-order reversible reactions occurring within the liquid film only [16,46]. In this case, the CO2 absorption into aMDEA solvent was considered liquid-film control. Therefore, the gas transport resistance has a negligible effect on  K g a . The overall mass transfer coefficient was determined by Equation (10) below [50]:
K G a = k l a e E H C O 2
The overall CO2 absorption rate at each segment can be expressed as follows:
N C O 2 = K g a   ( P C O 2 P C O 2   * )
where  P C O 2   ( Pa )  was the CO2 partial pressure and  P C O 2   *  was the equilibrium CO2 partial pressure. Since the kinetic of the reaction was fast,  P C O 2   *    is negligible [43,52,53]. Combining Equations (10) and (11) will define the CO2 absorption rate at each segment as:
N C O 2 = k l a e E H C O 2 P C O 2
The  P C O 2  was determined using the log-mean average of CO2 partial pressure at the inlet and outlet of each stage,  i  [5]:
P CO 2 , i = ( P C O 2 , i ,   i n P C O 2 , i , o u t ) ln ( P C O 2 , i ,   i n P C O 2 , i , o u t )
The CO2 mass transfer enhanced by the absorption reactions in the liquid phase is defined by using the enhancement factor ( E ), which is the ratio of the absorption rate with and without the chemical reactions [5,42,46]. The enhancement factor,  E , was determined using the equation that was introduced by Wellek et al. (1978) [54], as shown in Equation (14).  E  was dependent on the Hatta number (Ha) and infinite enhancement ( E i n f ).
E = 1 + 1 [ ( 1 E i n f 1 ) 1.35 + ( 1 E 1 1 ) 1.35 ] 1 1.35
where,
E i n f = 1 +   D M D E A C M D E A b M D E A D C O 2 l C C O 2 i
E 1 = H a tan h ( H a )
H a = D C O 2 l   ( k O V ) k l o
where  D MDEA  (m2/s) was the molecular diffusivity of amine in the liquid, which was 0.5 m2/s in this study.  b  was the stoichiometric factor of the reaction, which was 1,  D C O 2 l   (m2/s) was the molecular diffusivity of CO2 in the liquid, which was 9.77 × 10⁻⁹ m2/s,  C C O 2 i  was the CO2 molar concentration at the interphase,  Ha  was the Hatta number,  k O V  was the overall reaction rate constant given by Equations (6)–(8), and  k l o  was the liquid physical mass transfer coefficient. The  k l o  was determined based on the experimental study conducted by Tay et al. (2016) [29]. They performed the ultrasonic-assisted physical CO2 absorption into the water at high pressure, and the  k l o  based on their study was 0.014 m/s. The liquid phase mass transfer coefficient  k l a e  for the ultrasonic-assisted CO2 absorption process into MDEA+PZ solvent was determined from the KGa value of the experimental testing using Equation (10).

3.3. Modeling of the Ultrasonic Absorber Effective Volume

The model was developed to determine the effective volume of the ultrasonic absorber based on the mass balance method with the following assumptions:
  • The operation is in a steady state.
  • The fast absorption reactions occur in the liquid film at the gas-liquid interface.
  • The liquid flow rate is constant throughout the absorber.
  • The total pressure in the absorber is constant.
  • Heat loss to the surroundings is negligible.
  • Vaporization of water and MDEA+PZ is not considered in the mass conservation equation.
  • The reaction of hydrocarbon and MDEA+PZ is ignored.
Using the input parameters from experimental studies, such as the liquid mass transfer coefficient (klae), KGa, and L/G, the model was used to predict the effective volume of the ultrasonic absorber.
The CO2 concentration in the gas phase along the height of the ultrasonic absorber was determined based on the steady-state one-dimensional mass conservation equation [43]:
d N C O 2 d z = d ( G Y C O 2 ) d z = N CO 2
where G was the total gas flow rate per unit cross-sectional area of the ultrasonic absorber,  Y CO 2  was the mol ratio of CO2 in the gas phase,  N CO 2  was the CO2 absorption rate at each stage, and  d z  was the incremental height of the ultrasonic absorber from the bottom to the top. Figure 2 illustrates the schematic diagram of the ultrasonic absorber in the infinitesimal element for mass balance.
The total height of the ultrasonic absorber can be calculated using the following equation:
z = y 2 y 1 G d y K G a P T ( y C O 2 y C O 2 * )
where  y C O 2  was the CO2 mole fraction in the gas phase,  y C O 2 *  was the equilibrium molar fraction, and  P T  was the total pressure. The CO2 concentration profile at different heights of the ultrasonic absorber can be determined from the mass balance based on the CO2 absorption rate. The total height required to achieve the target CO2 concentration at the product gas was computed by the iteration method. Figure 3 shows the simplified flowchart of the ultrasonic absorber model to determine the ultrasonic absorber height. The model was solved by calculating the chemical enhancement factor (E) and absorption rate (NCO2) at each segment, as explained in Section 3.2. The CO2 composition for each segment was calculated from the MDEA+PZ CO2 loading at the inlet and outlet of the segment.
Once the height of the ultrasonic absorber has been numerically determined, the effective volume can be calculated using the following equation:
V e f f = π D 2 4 z N
where  D  (m) was the ultrasonic absorber internal diameter (ID) and  N  was the number of ultrasonic absorber modules. Due to fabrication constraints, the ultrasonic absorber ID was limited to a maximum of 1.5 m.

3.4. Determination of Ultrasonic Absorber Energy Consumption

The ultrasonic absorber energy consumption was estimated based on the ultrasound intensity obtained from the experimental studies:
U I = ( P U S ) 2 1000 R V R
where  U I  was the ultrasound intensity (kW/m3),  P U S  was the ultrasound power (V),  R  was the power supply circuit resistance (Ω), and  V R  was the ultrasonic absorber volume (m3). In this study, the circuit resistance was 8 Ω and the ultrasonic absorber volume was 6.70 × 10⁻⁴ m3. Maintaining consistent ultrasound intensity is imperative during technology scale-up, as the performance of the ultrasonic absorber is highly dependent on this critical parameter.
The ultrasonic absorber energy consumption can be determined using:
E U S = U I × V e f f 1000
where  E U S  was the ultrasonic absorber energy consumption (MW).

4. Process Simulation and Economic Analysis

Economic analysis was carried out to evaluate the potential of ultrasonic-assisted CO2 absorption technology against conventional packed columns. Process simulation was carried out using Aspen HYSYS V10 software to estimate the CAPEX and OPEX for both technologies. The economic evaluation was conducted by activating the costing engine in the Aspen HYSYS software. By activating the economic module, the process simulation results were automatically transferred to the Aspen Capital Cost Estimator (ACCE) for further mapping of unit operations to equipment and equipment sizing using default-assigned mapping and sizing algorithms.

4.1. Process Simulation

The process simulation for CO2 absorption was conducted for two (2) cases. The first case uses the conventional packed column as the acid gas removal unit (AGRU), and the second uses the ultrasonic absorber to replace the AGRU. The case study for process simulation was based on the typical offshore natural gas sweetening process facility that contains 19.22 mol% of CO2 in the feed gas stream with a target removal efficiency of 83.4% for bulk CO2 removal. Detailed information on this case study is listed in Table 3.
The same feed gas and product gas specifications are used for the packed column and ultrasonic absorber process simulations. The performance of the AGRU unit was simulated using the Amine property package. The solvent circulation rate was determined based on the L/G. The L/G for the conventional packed column was obtained from the heat and material balance of the case study process plant, which was 193 gal/lbmol CO2 removed. For the ultrasonic absorber, the L/G was determined from the experimental run. In the process simulation, the equipment installed weight and cost were determined, together with the total energy from the pumps, heater, and cooler in the overall acid gas removal process. Other information that was obtained from the process simulation includes the total amount of CO2 captured, the total amount of solvent, and the water top-up in the amine regeneration process. This information would be utilized to estimate the OPEX.
The process flow diagram for the process simulation is shown in Figure 4. The process consists of three main unit operations, which are the AGRU (packed column or ultrasonic absorber), high-pressure (HP) flash vessel, and low-pressure (LP) flash vessel. The acid gas absorption process occurs at the AGRU to remove the CO2 in the feed gas from 19.22% to 3.2% and other components as provided in Table 2. This absorption process occurs at high pressure (59.8 barg), and the pressure drop across the AGRU was assumed to be less than 1 bar. The rich amine solvent leaving the AGRU was sent to the HP flash vessel and Coalescer operating at 8–9 barg to recover the hydrocarbon loss. The rich amine was regenerated by heating the solvent to 90–119 °C to release the acid gas from the amine at the LP Flash vessel operating at 1 barg. The regeneration temperature was adjusted to meet the target regenerated lean amine of 0.2 mol CO2/mol amine loading. The regenerated amine was cooled down using cooling water in a shell and tube heat exchanger and recycled back to the AGRU. Since the ultrasonic absorber unit was not readily available in the Aspen HYSYS software, the efficiency of the absorption column unit, including the number of trays, was tuned to match the ultrasonic absorber’s experimental performance.

4.2. CAPEX Estimation

The installed cost and weight for all unit operations in the process simulation were based on the Icarus technology, except for the AGRU (packed column and ultrasonic absorber). The size of the conventional packed column was obtained from the absorber column data sheet of the case study. Table 4 summarizes the details of the packed column.
For the ultrasonic absorber, the effective volume was determined numerically, as explained in Section 2.2. The total volume was assumed to be 30% more than the calculated effective volume as a result of contingencies. The ultrasonic absorber weight was estimated based on a typical column density of 2.04 tonne/m3, and the installed weight was assumed to be 30% more than the equipment weight.
The CAPEX for the CO2 absorption process was the sum of all equipment installed costs, including the structure cost for offshore operations, with a 30% contingency. For the AGRU, the equipment cost was estimated based on a commercial absorber column price in 1999, and the value is updated to the year 2021 using the Chemical Engineering Plant Cost Index (CEPCI), where [56]:
C o s t   C o l u m n ,   2021 = C o s t C o l u m n ,   1999 × C E P C I 2021 C E P C I 1999
The cost index for 1999 and 2021 was 390.6 and 750, respectively [57]. The cost of the AGRU was then calculated using the cost-capacity equation [58]:
C o s t A G R U = C o s t C o l u m n , 2021 ( Q 2 Q 1 ) x
where  Q 1 ( m 3 )   was the capacity of the commercial absorber column and  Q 2   ( m 3 )  was the capacity of AGRU, for which the cost was to be determined in this study.  x  defines the relationship between the capacities, where in this study the value was 0.6. This value indicates that larger capacity was less costly due to economies of scale.
For the ultrasonic absorber equipment cost, the cost of the ultrasonic transducers was added to the cost of the AGRU column. Due to confidentiality, the number and unit price of the ultrasonic transducers will not be disclosed. The installed cost for the AGRU was assumed to be 30% higher than the equipment cost due to additional engineering, insurance, and administration costs [56].
The structure cost for the offshore operation was estimated based on the total equipment installed weight, including the piping, instruments, and solvent weight. Piping and instrument weight were assumed to be 50% of the equipment installed weight. The total solvent weight was estimated by assuming that 50% of the vessel’s volume was filled with liquid. An additional 10% of the solvent weight was also included for the solvent weight in the piping during operation. The structure cost was calculated based on a typical commercial cost for a jacketed leg platform, which was USD 36 k/tonne.

4.3. OPEX Estimation

The OPEX for the CO2 absorption process, which consists of electricity cost, initial solvent cost, solvent top-up, water top-up, maintenance cost, and transducer change-out cost (only for ultrasonic absorbers), was calculated yearly. The OPEX was estimated for the total lifetime of the plant, which was assumed to be 20 years, and the total annual hours of operation for the plant in this study was 8000 h/year [11,56]. The maintenance cost was assumed to be 5% of the total equipment installed cost.
The electricity cost was estimated from the total energy consumption for the CO2 absorption process obtained from the Aspen HYSYS process simulation. The electricity generated by the gas turbine was assumed to power the pump, heater, and ultrasonic absorber. The energy required for the plant operation was converted to power consumption costs by multiplying the fuel gas consumption rate by the sales gas price of 3 USD/MMBTU.
Another important expenditure for the plant is the initial cost of the solvent and the annual solvent top-up cost. The initial solvent cost was estimated by multiplying the total solvent weight with the commercial solvent price of 4350 USD/tonne. Over the course of continuous operation, the removal efficiency of the plant will decrease due to solvent degradation, the formation of heat-stable salts, and the accumulation of contaminants. Yearly amine change-out at a rate of 4% from its initial cost was recommended to maintain the CO2 removal performance. Besides, water top-up was also required to maintain the solvent concentration and viscosity at the optimum condition. Some of the water might evaporate during the solvent regeneration process and need to be replaced. The rate of water top-up was determined from the HYSIS process simulation, and the yearly cost was estimated based on the commercial demineralized water cost of RM10.10/m3.
For the ultrasonic absorber, there was another additional cost to be considered, which was the transducer change-out cost. Over time, some transducers, springs, and o-rings might wear and tear. Therefore, scheduled maintenance and replacements must be conducted to maintain the transducer’s performance. Due to this, a yearly change-out at the rate of 7.5% from the initial cost of the transducer was proposed starting in the 2nd year of the operation.

4.4. Unit Technical Cost (UTC) Calculation

Unit technical cost (UTC) was defined as the cost incurred for removing a ton of CO2 based on 20 years of operation. The amount of CO2 removed was determined from the process simulation. The total cost was inclusive of CAPEX and OPEX. The UTC can be calculated as follows [51,59]:
U T C = ( C A P E X + O P E X ) T o n n e   o f   CO 2 R e m o v e d

5. Results and Discussions

5.1. Effect of Ultrasonic Power

The effect of ultrasonic irradiation power on ultrasonic absorber performance is shown in Figure 5. The experimental studies were conducted at 25 V and 30 V ultrasonic power using a 0.2 LPM liquid flow rate at 17 and 20 SLPM gas flow rate. In general, the ultrasonic absorber performance at 30 V ultrasonic irradiation power was superior to that at 25 V. The CO2 outlet and L/G were about 10% lower as the ultrasonic irradiation power increased from 25 V to 30 V, while the KGa increased by about 5%.
Ultrasonic power can enhance the mass transfer of CO2 from the gas phase into the liquid phase by intensifying the physical interaction between the CO2 molecules and the aMDEA solvent [33]. The intensified sonophysical enhancement, such as acoustic streaming and acoustic fountains, leads to better mixing and more interfacial area for mass transfer to occur [27,29,40]. The acoustic streaming force and fountain flow rate are directly proportional to the ultrasonic power; thus, the CO2 absorption efficiency increases as the ultrasonic power increases. Furthermore, acoustic cavitation generates localized hotspots and high-pressure zones, creating favorable conditions for the CO2 absorption reaction with aMDEA. The increased temperature and pressure can enhance the reaction rate and promote carbamate formation, the chemical complex produced from the chemical reaction between CO2 and aMDEA solvent. This can lead to faster absorption kinetics and improved overall absorption efficiency.
Similar enhancement trends are observed at two gas flow rates of 17 and 20 SLPM. However, the performance enhancement at 17 SLPM was higher than at 20 SLPM. Even though a higher gas flow rate introduced more CO2 molecules into the ultrasonic absorber, which explained the reduced L/G at a higher gas flow rate due to more CO2 removed (refer to Figure 5a), the reaction rate between aMDEA and CO2 in the feed gas was not fast enough, and the sonochemistry effect from the high-frequency ultrasonic irradiation was not able to significantly enhance the chemical reaction. Therefore, the CO2 absorption reaction is limited by the gas residence time in the ultrasonic absorber. Consequently, the target CO2 outlet of 6.5 mol% could not be achieved at 20 SLPM even at 30 V ultrasonic power (refer to Figure 5b), and KGa was slightly reduced (refer to Figure 5c).

5.2. Effect of Liquid Flow Rate

The effect of liquid flow rate on ultrasonic absorber performance is demonstrated in Figure 6. The experimental testing was conducted at 25 V and 30 V ultrasonic power using a 20 SLPM feed gas flow rate. The liquid flow rate was varied from 0.2–0.4 LPM. From the graphs, it is observed that the liquid side mass transfer resistance was not significant in the ultrasonic absorber. The increased liquid flow rate did not significantly enhance the overall CO2 absorption performance. The increased liquid flow rate introduces more amine molecules for the absorption process, which should increase the solvent absorption capacity. However, the opposite trend was observed as the liquid flow rate increased from 0.2 to 0.4 LPM in the ultrasonic absorber. The discrepancy was probably because the CO2 absorption performance of the ultrasonic absorber was highly dependent on the reaction rate between the aMDEA and CO2. As the liquid flow rate increases, the liquid retention time in the ultrasonic absorber reduces and limits the reaction time for CO2 absorption into the aMDEA solvent.
Similar to the previous section, the increase in ultrasonic power from 25 V to 30 V can further enhance the CO2 absorption process, resulting in a lower CO2 outlet concentration and a higher KGa value (refer to Figure 6a,b). However, the improvement in L/G was insignificant, at less than 5% on average (refer to Figure 6c). Since lower L/G was preferred as it contributes to lower solvent circulation rates, lower solvent pumping energy, and heater power consumption for amine regeneration, maintaining the liquid flow rate at 0.2 LPM was more favorable.

5.3. Effect of Gas Flow Rate

The effect of gas flow rate on ultrasonic absorber performance is illustrated in Figure 7. The experimental runs were conducted using 30 V ultrasonic power and a 0.2 LPM liquid flow rate. The gas flow rate varied from 15 to 20 SLPM. Increasing the gas flow rate from 15 to 17 SLPM introduces more CO2 molecules, enhancing the rate at which CO2 molecules contact the aMDEA solvent and promoting faster absorption that leads to higher CO2 removal efficiencies. This explains the increase of KGa (refer to Figure 7a) and the reduction of L/G (refer to Figure 7b).
However, the gas flow rate also affects the contact time between the gas and the solvent. If the gas flow rate is higher than the optimal condition, it tends to decrease the gas residence time in the absorber and reduce the CO2 molecules to be absorbed into the solvent [52]. Consequently, at lower contact times, the absorption capacity of the solvent may not be fully utilized, resulting in lower CO2 capture efficiencies, and the target CO2 outlet of 6.5 mol% was not able to be met as the gas flow rate further increased to 20 SLPM (refer to Figure 7c). The CO2 outlet increased by 31%, KGa was reduced by 2%, and L/G increased by 13% at a 20 SLPM gas flow rate. A similar trend was observed by other researchers for CO2 absorption using AMP as a chemical solvent [60,61].
Based on these findings, the gas flow rate influences the absorption efficiency of CO2 into the aMDEA solvent. Balancing the gas flow rate is essential to achieving optimal absorption rates while considering the mass transfer rate and contact time aspects of the process. In this study, the optimum gas flow rate for the ultrasonic absorber was 17 SLPM.

5.4. Prediction of Ultrasonic Absorber Effective Volume and Energy Consumption

The effective volume and energy consumption of the ultrasonic absorber were determined using the numerical modeling approach as described in the earlier section. The model was developed to predict the ultrasonic absorber’s effective volume and energy consumption from the experimental runs. Figure 8 shows the predicted effective volume based on the experimental run performance. From the graphs, it is observed that the ultrasonic absorber effective volume was inversely proportional to the KGa obtained from the experimental runs, as explained in Equations (19) and (20) of the developed model. A higher KGa value indicates higher absorption efficiency per unit volume, thus a higher CO2 absorption rate at each segment of the ultrasonic absorber, as explained in Equation (11) [40]. As the absorption efficiency increased, less volume was required to achieve the target CO2 removal, leading to a more compact ultrasonic absorber size.
The CO2 absorption efficiency increased as the ultrasonic power increased due to stronger sonophysical and sonochemistry effects to enhance gas-liquid mass transfer. As a result, the effective volume at 17 SLPM and 20 SLPM gas flow rates using 30 V ultrasonic power was about 10% and 8% lower than 25 V, respectively (refer to Figure 8a). Gas flow rate showed the most significant effect on the ultrasonic absorber’s effective volume (refer to Figure 8b). The effective volume was reduced by 15% as the gas flow rate increased from 15 SLMP to 17 SLPM, owing to more CO2 molecules being introduced and absorbed into the aMDEA solvent, leading to higher KGa. Further increase in gas flow rate above 17 SLPM reduced the ultrasonic absorber performance due to the limited retention time for CO2 absorption reactions. This behavior was similar to increasing the liquid flow rate (refer to Figure 8c). Thus, limiting the liquid flow rate to 0.2 LPM is more beneficial.
Figure 9 shows the predicted energy consumption of the ultrasonic absorber based on the predicted effective volume and ultrasound intensity from the experimental testing. From Figure 9a, even though increasing the ultrasonic power from 25 V to 30 V enhanced the CO2 absorption performance, this led to a 32% increase in ultrasonic absorber energy consumption. The trade-off between compact size and minimal energy consumption is evident in Figure 8a and Figure 9a, which showcase the predicted effective volume and energy consumption from the model, respectively.
Specifically, at 17 SLPM gas flow rate, the ultrasonic absorber with the smallest effective volume using 30 V of ultrasonic power requires 30% more energy consumption than at 25 V. Conversely, at lower ultrasonic power (25 V), the ultrasonic absorber’s effective volume increased by 10% compared with 30 V due to reduced mass transfer intensification. This significant trade-off becomes apparent solely through the application of numerical modeling, enabling the prediction of effective volume and energy consumption.
Furthermore, implementing high ultrasonic power for the CO2 absorption process may require specialized equipment and additional costs. Therefore, it is important to consider the scalability and practicality of using high ultrasonic power in large-scale industrial applications. Minimizing the energy consumption for the ultrasonic absorber while maintaining its compact design is necessary for further scale-up and commercialization of the technology.
The effect of gas and liquid flow rates on energy consumption in the ultrasonic absorber closely paralleled their impact on the effective volume (refer to Figure 9b,c). Elevated gas flow rates (exceeding 17 SLPM) and liquid flow rates decreased ultrasonic absorber performance. This decline can be attributed to the constrained retention time available for CO2 absorption reactions, ultimately resulting in escalated energy consumption.
Table 5 summarizes the responses, including the ultrasonic absorber’s effective volume and energy consumption, for all the experimental runs in this study. Based on this table, the energy consumption for Run 4 is the lowest and deemed the most optimum operating condition for the ultrasonic-assisted CO2 absorption process in this study. The response based on this run, including the L/G and KGa, is further used in the process simulation and economic analysis.

5.5. CAPEX Comparison

Table 6 shows the equipment list, installed cost, and weight for the conventional packed column and ultrasonic absorber obtained from the process simulation. This information was used to calculate the CAPEX.
Table 7 shows the CAPEX comparison for both the packed column and ultrasonic absorber based on the process simulation. From the CAPEX comparison, it is observed that the ultrasonic absorber process requires 34% less CAPEX as compared with the conventional packed column process. Due to the enhanced mass transfer by ultrasonic irradiation, the ultrasonic absorber exhibits a compact design, resulting in reduced equipment weight. Consequently, this weight reduction contributes to lower structure costs for offshore operations.

5.6. OPEX Comparison

Table 8 compares the power consumption costs for the packed column and ultrasonic absorber. The pump and heater energy requirements for the packed column were much higher as compared with the ultrasonic absorber due to the packed column having a higher solvent circulation rate as compared with the ultrasonic absorber. 12–14% energy savings (from the heater and pump) were obtained by the ultrasonic absorber for having a lower L/G due to higher removal efficiency. However, the ultrasonic absorber requires 26.04 MW of electricity to power up the ultrasonic transducers, compared with the zero-energy requirement for the commercial packings to enhance the gas-liquid mass transfer area. Due to this, the power consumption cost for the ultrasonic absorber was 10% higher than the conventional packed column. The highest energy consumption was required for the heater to regenerate the solvent for both the packed column and ultrasonic absorber.
Table 9 highlights the OPEX comparison between conventional packed columns and ultrasonic absorbers based on this study. From the table, it is observed that the ultrasonic absorber requires about 11% higher OPEX as compared with the packed column. This is because the ultrasonic absorber incurs additional costs related to power consumption for energizing the ultrasonic transducer and for transducer change-outs. Even though ultrasonic irradiation can enhance the gas-liquid mass transfer that leads to lower CAPEX, this technology requires higher OPEX than the conventional packed column.

5.7. UTC Comparison

Figure 10 and Figure 11 show the total cost distribution for the packed column and ultrasonic absorber, respectively. When analyzing the overall cost distribution, it becomes evident that the highest expense was attributed to power consumption, with the structure cost ranking second for the packed column and ultrasonic absorber process. This shows that UTC is highly affected by overall energy consumption and equipment weight. Reducing energy consumption and equipment weight will greatly improve the UTC of the technology, thus making it more economically feasible for commercialization. The energy consumption of the ultrasonic absorber surpasses that of the packed column due to the additional energy required for powering the ultrasonic transducer, along with the energy needed for the pump and heater. However, the mass transfer enhancement by ultrasonic irradiation significantly reduced the volume and weight of the ultrasonic absorber, making the structure cost lower than the conventional packed column.
Table 10 compares UTC between the packed column and the ultrasonic absorber. Despite the ultrasonic absorber having approximately 11% higher OPEX than the packed column, its UTC remains 3% lower than the conventional packed column. This cost advantage is primarily due to the ultrasonic absorber’s compact design, which effectively reduces CAPEX by minimizing structure costs. In this study, the economic analysis clearly indicates the potential for cost savings by replacing the conventional packed column with an ultrasonic absorber for offshore operations. The potential for cost savings can be further maximized by reducing the OPEX of the ultrasonic absorber, making them comparable to those of the packed bed column.
Another commercially used technology for CO2 capture, especially for offshore operations, is membrane technology [62]. Membrane technology is renowned for its modular and compact design, making it the foremost choice for CO2 capture in offshore operations where footprint and equipment weight constraints are notably restrictive. The reported UTC for CO2 capture using membrane technology ranges from 22.76–118.9 USD/ton CO2 removed depending on the flow configuration in the membrane module and the requirement of sweep gas, vacuum pump, or feed gas compression to enhance the CO2 removal efficiency [63]. Based on these reported values, the economic potential of solvent-based technology, either using the packed column or an ultrasonic absorber as the contactor, has not yet surpassed that of membrane technology. Nevertheless, the choice of an appropriate CO2 capture technology for commercial application may also hinge on additional factors, including the CO2 concentration at the feed gas, feed gas pressure, tolerance for hydrocarbon losses, and the presence of other contaminants in the feed gas.

6. Conclusions

In this work, a numerical model was developed to predict the effective volume and energy consumption of the ultrasonic absorber based on experimental studies at various operating conditions. The effects of ultrasonic power and liquid and gas flow rates were investigated. Findings from the experimental studies and numerical modeling confirmed that Run 4, which operated at 25 V ultrasonic power, 0.2 LPM liquid flow rate, and 17 SLPM gas flow rate, is the most optimum condition for the ultrasonic-assisted CO2 absorption process because the energy consumption at this condition was the lowest, which was 26.04 MW with an effective volume of 222.66 m3. The economic analysis was conducted to compare the economic feasibility of this technology against the conventional packed bed column.
This technology demonstrates a potential 34% reduction in CAPEX compared with the conventional packed bed column. This is attributed to its ingeniously compact design, resulting in decreased equipment weight and lower structural costs, which is particularly advantageous for offshore operations. While the ultrasonic transducers impose an additional electricity demand, leading to an 11% increase in OPEX relative to the packed column, the overall UTC for the ultrasonic-assisted CO2 absorption process remains 3% below that of the conventional packed column.
Therefore, it is concluded that there is a potential cost savings in implementing ultrasonic irradiation technology to improve the existing packed column for acid gas removal. To further maximize the economic advantages of this technology, energy optimization, such as heat integration, water and solvent recovery systems, and transducer power system optimization, is recommended for future work.

Author Contributions

Conceptualization, A.M.T. and K.K.L.; methodology, A.M.T.; software, L.H.N., A.M.T., S.H.K. and V.C.Q.; validation, A.M.T. and S.M.M.Y.; formal analysis, A.M.T., L.H.N., S.M.M.Y., N.A. and S.Z.; investigation, A.M.T., S.M.M.Y. and S.Z.; writing—original draft preparation, A.M.T.; writing—review and editing, A.M.T., K.K.L., V.C.Q. and S.H.K.; visualization, A.M.T.; supervision, K.K.L. All authors have read and agreed to the published version of the manuscript.

Funding

This research was funded by the Petroleum Research Fund (E.025.GST.02019.005).

Institutional Review Board Statement

Not applicable.

Informed Consent Statement

Not applicable.

Data Availability Statement

Not applicable.

Acknowledgments

This work was technically supported by Universiti Teknologi PETRONAS and PETRONAS Research Sdn Bhd under the Master Research Agreement.

Conflicts of Interest

The authors declare no conflict of interest. The funders had no role in the design of the study; in the collection, analyses or interpretation of data; in the writing of the manuscript; or in the decision to publish the results.

Nomenclature

bStoichiometric factor
CCO2iCO2 molar concentration at the interphase (mol/L)
CMDEAFree concentration of MDEA (mol/L)
CPZFree concentration of PZ (mol/L)
DUltrasonic absorber internal diameter (m)
DCO2lMolecular diffusivity CO2 in the liquid (m2/s)
DMDEAMolecular diffusivity of amine in the liquid (m2/s)
EUSUltrasonic absorber energy consumption (MW)
GTotal gas flow rate per unit cross-sectional area
gGas phase
HaHatta number
HCO2Henry’s law constant (Pa.m3.mol−1)
k2,MDEASecond-order rate constants for MDEA (m3.kmol−1.s−1)
KGaMass transfer coefficient (mol/m3.s.Pa)
kgaeGas phase mass transfer coefficient (s−1)
kl0Liquid physical mass transfer coefficient (ms−1)
klaeLiquid phase mass transfer coefficient (s−1)
kovOverall reaction rate constant (s−1)
lLiquid phase
NNumber of ultrasonic absorber modules
NCO2CO2 absorption rate (mol/m3.s)
NHClNormality of HCl solution (N)
NKOHNormality of KOH solution
PCO2CO2 partial pressure (Pa)
PCO2*Equilibrium CO2 partial pressure (Pa)
PCO2,iCO2 partial pressure at each stage (Pa)
PCO2,i,inCO2 partial pressure at the inlet of each stage (Pa)
PCO2,i,outCO2 partial pressure at the outlet of each stage (Pa)
PTTotal pressure (Pa)
PUSUltrasound power (V)
Q1Capacity of the commercial absorber column (m3)
Q2Capacity of AGRU which the cost was to be determined (m3)
RPower supply circuit resistance (Ω)
rovOverall reaction rate (mol/L.s)
UIUltrasound intensity (kW/m3)
VeffEffective volume of ultrasonic absorber (m3)
VHClVolume of HCl used to titrate the sample (mL)
VKOHVolume of KOH used to titrate the sample (mL)
VRUltrasonic absorber volume (m3)
WsWeight of the sample for titration (g)
Ws,fWeight of fresh solvent (g)
xRelationship between the capacities
yCO2Mol ratio of CO2 in the gas phase
yCO2*CO2 equilibrium molar fraction
zTotal height of the ultrasonic absorber (m)

References

  1. Ahmad, F.; Lau, K.K.; Shariff, A.M. Removal of CO2 from Natural Gas using Membrane Separation System: Modeling and Process Design. J. Appl. Sci. 2010, 10, 1134–1139. [Google Scholar] [CrossRef]
  2. George, G.; Bhoria, N.; AlHallaq, S.; Abdala, A.; Mittal, V. Polymer membranes for acid gas removal from natural gas. Sep. Purif. Technol. 2016, 158, 333–356. [Google Scholar] [CrossRef]
  3. Isa, F.; Suleman, H.; Zabiri, H.; Maulud, A.; Ramasamy, M.; Tufa, L.; Shariff, A. An overview on CO2 removal via absorption: Effect of elevated pressures in counter-current packed column. J. Nat. Gas Sci. Eng. 2016, 33, 666–677. [Google Scholar] [CrossRef]
  4. Nakhjiri, A.T.; Heydarinasab, A.; Bakhtiari, O.; Mohammadi, T. Influence of non-wetting, partial wetting and complete wetting modes of operation on hydrogen sulfide removal utilizing monoethanolamine absorbent in hollow fiber membrane contactor. Sustain. Environ. Res. 2018, 28, 186–196. [Google Scholar] [CrossRef]
  5. Norouzbahari, S.; Shahhosseini, S.; Ghaemi, A. CO2 chemical absorption into aqueous solutions of piperazine: Modeling of kinetics and mass transfer rate. J. Nat. Gas Sci. Eng. 2015, 26, 1059–1067. [Google Scholar] [CrossRef]
  6. Marjani, A.; Nakhjiri, A.T.; Adimi, M.; Jirandehi, H.F.; Shirazian, S. Modification of polyethersulfone membrane using MWCNT-NH2 nanoparticles and its application in the separation of azeotropic solutions by means of pervaporation. PLoS ONE 2020, 15, e0236529. [Google Scholar] [CrossRef]
  7. Zare, A.; Mirzaei, S. Removal of CO2 and H2S using aqueous alkanolamine solusions. World Acad. Sci. Eng. Technol. 2009, 37, 194–203. [Google Scholar]
  8. Qian, Z.; Xu, L.; Li, Z.; Li, H.; Guo, K. Selective absorption of H2S from a gas mixture with CO2 by aqueous N-methyldiethanolamine in a rotating packed bed. Ind. Eng. Chem. Res. 2010, 49, 6196–6203. [Google Scholar] [CrossRef]
  9. Pal, P.; AbuKashabeh, A.; Al-Asheh, S.; Banat, F. Role of aqueous methyldiethanolamine (MDEA) as solvent in natural gas sweetening unit and process contaminants with probable reaction pathway. J. Nat. Gas Sci. Eng. 2015, 24, 124–131. [Google Scholar] [CrossRef]
  10. Vega, F.; Cano, M.; Camino, S.; Fernández, L.M.G.; Portillo, E.; Navarrete, B. Solvents for Carbon Dioxide Capture. In Carbon Dioxide Chemistry, Capture and Oil Recovery; IntechOpen Limited: London, UK, 2018. [Google Scholar]
  11. Rodríguez, N.; Mussati, S.; Scenna, N. Optimization of post-combustion CO2 process using DEA-MDEA mixtures. Chem. Eng. Res. Des. 2011, 89, 1763–1773. [Google Scholar] [CrossRef]
  12. Yu, C.-H.; Huang, C.-H.; Tan, C.-S. A Review of CO2 Capture by Absorption and Adsorption. Aerosol Air Qual. Res. 2012, 12, 745–769. [Google Scholar] [CrossRef]
  13. Tamidi, A.M.; Yasin, N.H. CO2 and H2S co-removal from natural gas using membrane contactor technology. In Proceedings of the SPE Asia Pacific Oil & Gas Conference and Exhibition, Virtual, 17–19 November 2020. [Google Scholar] [CrossRef]
  14. Ying, J.; Raets, S.; Eimer, D. The Activator Mechanism of Piperazine in Aqueous Methyldiethanolamine Solutions. Energy Procedia 2017, 114, 2078–2087. [Google Scholar] [CrossRef]
  15. Costa, C.; Di Felice, R.; Moretti, P.; Oliva, M.; Ramezani, R. Piperazine and methyldiethanolamine interrelationships in CO2 absorption by aqueous amine mixtures. Part II—Saturation rates of mixed reagent solutions. Can. J. Chem. Eng. 2020, 98, 2516–2529. [Google Scholar] [CrossRef]
  16. Xu, G.-W.; Zhang, C.-F.; Qin, S.-J.; Wang, Y.-W. Kinetics Study on Absorption of Carbon Dioxide into Solutions of Activated Methyldiethanolamine. Ind. Eng. Chem. Res. 1992, 31, 921–927. [Google Scholar] [CrossRef]
  17. Weiland, R.H.; Sivasubramaniam, M.S. Effect of Heat-Stable Salts on Amine. In Proceedings of the Fall Meeting of AIChE, Austin, TX, USA, 7–12 November 2004. [Google Scholar]
  18. Le Grange, P.; Sheilan, M.; Spooner, B. How to Limit Amine Systems Failures. The Chemical Engineer. Issue October 2017, 916. Available online: https://www.thechemicalengineer.com/features/how-to-limit-amine-systems-failures/ (accessed on 7 August 2023).
  19. Laugier, F.; Andriantsiferana, C.; Wilhelm, A.M.; Delmas, H. Ultrasound in gas–liquid systems: Effects on solubility and mass transfer. Ultrason. Sonochem. 2008, 15, 965–972. [Google Scholar] [CrossRef] [PubMed]
  20. Tudela, I.; Sáez, V.; Esclapez, M.D.; Díez-García, M.I.; Bonete, P.; González-García, J. Simulation of the spatial distribution of the acoustic pressure in sonochemical reactors with numerical methods: A review. Ultrason. Sonochem. 2014, 21, 909–919. [Google Scholar] [CrossRef] [PubMed]
  21. Xu, Z.; Yasuda, K.; Koda, S. Numerical simulation of liquid velocity distribution in a sonochemical reactor. Ultrason. Sonochem. 2013, 20, 452–459. [Google Scholar] [CrossRef]
  22. Yang, Z.; Goto, H.; Matsumot, M.; Maeda, R. Ultrasonic micromixer for microfluidic systems. In Proceedings of the IEEE Thirteenth Annual International Conference on Micro Electro Mechanical Systems, IEEE, Miyazaki, Japan, 23–27 January 2000; pp. 80–85. [Google Scholar]
  23. Rahimi, M.; Aghel, B.; Hatamifar, B.; Akbari, M.; Alsairafi, A. CFD modeling of mixing intensification assisted with ultrasound wave in a T-type microreactor. Chem. Eng. Process. Process. Intensif. 2014, 86, 36–46. [Google Scholar] [CrossRef]
  24. Trujillo, F.J.; Knoerzer, K. A computational modeling approach of the jet-like acoustic streaming and heat generation induced by low frequency high power ultrasonic horn reactors. Ultrason. Sonochem. 2011, 18, 1263–1273. [Google Scholar] [CrossRef]
  25. Niazi, S.; Hashemabadi, S.H.; Razi, M.M. CFD simulation of acoustic cavitation in a crude oil upgrading sonoreactor and prediction of collapse temperature and pressure of a cavitation bubble. Chem. Eng. Res. Des. 2014, 92, 166–173. [Google Scholar] [CrossRef]
  26. Tay, W.H.; Lau, K.K.; Shari, A.M. High performance promoter-free CO2 absorption using potassium carbonate solution in an ultrasonic irradiation system. J. CO2 Util. 2017, 21, 383–394. [Google Scholar] [CrossRef]
  27. Yusof, S.M.M.; Lau, K.K.; Shariff, A.M.; Tay, W.H.; Mustafa, N.F.A.; Lock, S.S.M. Novel continuous ultrasonic contactor system for CO2 absorption: Parametric and optimization study. J. Ind. Eng. Chem. 2019, 79, 279–287. [Google Scholar] [CrossRef]
  28. Legay, M.; Gondrexon, N.; Le Person, S.; Boldo, P.; Bontemps, A. Enhancement of Heat Transfer by Ultrasound: Review and Recent Advances. Int. J. Chem. Eng. 2011, 2011, 670108. [Google Scholar] [CrossRef]
  29. Tay, W.H.; Lau, K.K.; Shariff, A.M. High frequency ultrasonic-assisted CO2 absorption in a high pressure water batch system. Ultrason. Sonochem. 2016, 33, 190–196. [Google Scholar] [CrossRef]
  30. Akbari, M.; Rahimi, M.; Faryadi, M. Gas–liquid flow mass transfer in a T-shape microreactor stimulated with 1.7 MHz ultrasound waves. Chin. J. Chem. Eng. 2017, 25, 1143–1152. [Google Scholar] [CrossRef]
  31. Abolhasani, M.; Rahimi, M.; Dehbani, M. CFD Modeling of Low, Medium and High Frequency Ultrasound Waves Propagation Inside a Liquid Medium. In Proceedings of the 4th National Conference on CFD Applications in Chemical & Petroleum Industries, Ahwaz, Iran, 16 May 2012. [Google Scholar]
  32. Laborde, J.; Bouyer, C.; Caltagirone, J.; Gerard, A. Acoustic cavitation field prediction at low and high frequency ultrasounds. Ultrasoonics 1998, 36, 581–587. [Google Scholar] [CrossRef]
  33. Tamidi, A.M.; Lau, K.K.; Khalit, S.H. A review of recent development in numerical simulation of ultrasonic-assisted gas-liquid mass transfer process. Comput. Chem. Eng. 2021, 155, 107498. [Google Scholar] [CrossRef]
  34. Abolhasani, M.; Rahimi, M.; Dehbani, M.; Alsairafi, A.A. CFD Modeling of Heat Transfer by 1.7 MHz Ultrasound Waves. Numer. Heat Transfer Part A Appl. 2012, 62, 822–841. [Google Scholar] [CrossRef]
  35. Parvizian, F.; Rahimi, M.; Faryadi, M.; Abdulaziz, A. Comparison between Mixing in Novel High Frequency Sonoreactor and Stirred Tank Reactor. Eng. Appl. Comput. Fluid Mech. 2012, 6, 295–306. [Google Scholar] [CrossRef]
  36. Xu, Z.; Yasuda, K.; Liu, X. Simulation of the formation and characteristics of ultrasonic fountain. Ultrason. Sonochem. 2016, 32, 241–246. [Google Scholar] [CrossRef] [PubMed]
  37. Kumar, A.; Gogate, P.R.; Pandit, A.B.; Wilhelm, A.M.; Delmas, H. Investigation of induction of air due to ultrasound source in the sonochemical reactors. Ultrason. Sonochem. 2005, 12, 453–460. [Google Scholar] [CrossRef]
  38. Airgas. Nitrogen Safety Data Sheet. 2021. Available online: https://www.airgas.com/msds/001040.pdf (accessed on 28 July 2023).
  39. Nakhaei-Kohani, R.; Taslimi-Renani, E.; Hadavimoghaddam, F.; Mohammadi, M.R.; Hemmati-Sarapardeh, A. Modeling solubility of CO2–N2 gas mixtures in aqueous electrolyte systems using artificial intelligence techniques and equations of state. Sci. Rep. 2022, 12, 3625. [Google Scholar] [CrossRef] [PubMed]
  40. Tamidi, A.M.; Lau, K.K.; Yusof, S.M.M.; Azmi, N.; Zakariya, S.; Patthi, U. Enhancement of CO2 Absorption Process Using High-Frequency Ultrasonic Waves. Sustainability 2023, 15, 11064. [Google Scholar] [CrossRef]
  41. Nurida, M.Y.; Norfadilah, D.; Aishah, M.R.S.; Phak, C.Z.; Saleh, S.M. Monitoring of CO2 Absorption Solvent in Natural Gas Process Using Fourier Transform Near-Infrared Spectrometry. Int. J. Anal. Chem. 2020, 2020, 9830685. [Google Scholar] [CrossRef]
  42. Lee, J.; Kim, J.; Kim, H.; Lee, K.S.; Won, W. A new modeling approach for a CO2 capture process based on a blended amine solvent. J. Nat. Gas Sci. Eng. 2019, 61, 206–214. [Google Scholar] [CrossRef]
  43. Hairul, N.; Shariff, A.; Tay, W.; Mortel, A.; Lau, K.; Tan, L. Modelling of high pressure CO2 absorption using PZ+AMP blended solution in a packed absorption column. Sep. Purif. Technol. 2016, 165, 179–189. [Google Scholar] [CrossRef]
  44. Donaldson, T.L.; Nguyen, Y.N. Carbon Dioxide Reaction Kinetics and Transport in Aqueous Amine Membranes. Ind. Eng. Chem. Fundam. 1980, 19, 260–266. [Google Scholar] [CrossRef]
  45. Versteeg, G.F.; van Swaaij, W.P.M. On the kinetics between CO2 and alkanolamines both in aqueous and non-aqueous solutions-II. Tertiary amines. Chem. Eng. Sci. 1988, 43, 587–591. [Google Scholar] [CrossRef]
  46. Koronaki, I.P.; Prentza, L.; Papaefthimiou, V. Modeling of CO2 capture via chemical absorption processes–An extensive literature review. Renew. Sustain. Energy Rev. 2015, 50, 547–566. [Google Scholar] [CrossRef]
  47. Rufford, T.; Smart, S.; Watson, G.; Graham, B.; Boxall, J.; da Costa, J.D.; May, E. The removal of CO2 and N2 from natural gas: A review of conventional and emerging process technologies. J. Pet. Sci. Eng. 2012, 94–95, 123–154. [Google Scholar] [CrossRef]
  48. Haimour, N.; Bidarian, A.; Sandall, O.C. Kinetics of the reaction between carbon dioxide and methyldiethanolamine. Chem. Eng. Sci. 1987, 42, 1393–1398. [Google Scholar] [CrossRef]
  49. McCabe, W.; Smith, J.; Hariot, P. Unit Operation of Chemical Engineering, 7th ed.; McGraw-Hill Companies, Inc.: Singapore, 2005. [Google Scholar]
  50. Chan, Z.P.; Li, L.; Kang, G.; Ab Manan, N.; Cao, Y.; Wang, T. Deep CO2 removal using high pressure membrane contactors with low liquid-to-gas ratio. Chem. Eng. Res. Des. 2020, 153, 528–536. [Google Scholar] [CrossRef]
  51. Wang, C.; Seibert, A.F.; Rochelle, G.T. Packing characterization: Absorber economic analysis. Int. J. Greenh. Gas Control. 2015, 42, 124–131. [Google Scholar] [CrossRef]
  52. Zeng, Q.; Guo, Y.; Niu, Z.; Lin, W. Mass transfer coefficients for CO2 absorption into aqueous ammonia solution using a packed column. Ind. Eng. Chem. Res. 2011, 50, 10168–10175. [Google Scholar] [CrossRef]
  53. Aroonwilas, A.; Tontiwachwuthikul, P. High-efficiency structured packing for CO2 separation using 2-amino-2-methyl-1-propanol (AMP). Sep. Purif. Technol. 1997, 12, 67–79. [Google Scholar] [CrossRef]
  54. Wellek, R.M.; Brunson, R.J.; Law, F.H. Enhancement factors for gas-absorption with second-order irreversible chemical reaction. Can. J. Chem. Eng. 1978, 56, 181–186. [Google Scholar] [CrossRef]
  55. Technip DSME. Mechanical Data Sheet Bulk Removal Amine Absorber. PETRONAS Floating LNG Project. Front End Engineering Design Report. 2011.
  56. Orangi, S.; Aromada, S.A.; Razi, N.; Øi, L.E. Simulation and Economic Analysis of MEA+PZ and MDEA+MEA Blends in Post-combustion CO2 Capture Plant. In Proceedings of the First SIMS EUROSIM Conference on Modelling and Simulation, SIMS EUROSIM 2021, and 62nd International Conference of Scandinavian Simulation Society, SIMS 2021, Virtual Conference, Finland, 21–23 September 2021; pp. 317–324. [Google Scholar]
  57. Jenkins, S. 2021 CEPCI Updates: September (prelim.) and August (Final). 2021. Available online: https://www.chemengonline.com/2021-cepci-updates-september-prelim-and-august-final/?printmode=1#:~:text= (accessed on 18 May 2022).
  58. Clayton, T.; Baumann, P. Cost-to-Capacity Method: Applications and Considerations. M&TS J. 2014, 30, 49–56. [Google Scholar]
  59. Ogolo, O. Modification of the unit technical cost equation for the accurate determination of the cost of producing a barrel of oil in relation to the Contractor’s revenue. J. Pet. Sci. Eng. 2021, 198, 108122. [Google Scholar] [CrossRef]
  60. Aroonwilas, A.; Tontiwachwuthikul, P. Mass Transfer Coefficients and Correlation for CO2 Absorption into 2-Amino-2-methyl-1-propanol (AMP) Using Structured Packing. Ind. Eng. Chem. Res. 1998, 37, 569–575. [Google Scholar] [CrossRef]
  61. Øi, L.E.; Hansen, P.M.; Henriksen, M. CO2 Absorption Efficiency and Heat Consumption Measured at High Gas to Liquid Ratios in Laboratory Rig. Energy Procedia 2017, 114, 1273–1281. [Google Scholar] [CrossRef]
  62. Sukor, N.R.; Shamsuddin, A.H.; Indra Mahlia, T.M.; Mat Isa, M.F. Techno-Economic Analysis of CO2 Capture Technologies in Offshore Natural Gas Field. Processes 2020, 8, 350. [Google Scholar] [CrossRef]
  63. Asadi, J.; Kazempoor, P. Techno-economic analysis of membrane-based processes for flexible CO2 capturing from power plants. Energy Convers. Manag. 2021, 246, 114633. [Google Scholar] [CrossRef]
Figure 1. Liquid motion resulting from ultrasound propagation [28]. (Reprinted from Ref. [28]).
Processes 11 03089 g001
Figure 2. Schematic diagram of the ultrasonic absorber in an infinitesimal element for mass balance.
Processes 11 03089 g002
Figure 3. Flowchart for ultrasonic absorber effective volume determination model.
Processes 11 03089 g003
Figure 4. Process flow diagram for the acid gas removal process.
Processes 11 03089 g004
Figure 5. Effect of ultrasonic power on ultrasonic absorber performance (a) L/G (b) CO2 outlet (c) KGa.
Processes 11 03089 g005aProcesses 11 03089 g005b
Figure 6. Effect of liquid flow rate on ultrasonic absorber performance (a) CO2 outlet, (b) KGa, (c) L/G.
Processes 11 03089 g006
Figure 7. Effect of gas flow rate on ultrasonic absorber performance (a) KGa, (b) L/G, and (c) CO2 outlet.
Processes 11 03089 g007aProcesses 11 03089 g007b
Figure 8. Ultrasonic absorber effective volume prediction at various operating conditions (a) Ultrasonic power, (b) Gas flow rate, and (c) Liquid flow rate.
Processes 11 03089 g008
Figure 9. Ultrasonic absorber energy consumption prediction at various operating conditions (a) Ultrasonic power, (b) Gas flow rate, (c) Liquid flow rate.
Processes 11 03089 g009aProcesses 11 03089 g009b
Figure 10. Total cost distribution for the packed column.
Processes 11 03089 g010
Figure 11. Total cost distribution for the ultrasonic absorber.
Processes 11 03089 g011
Table 1. Operating conditions for experimental study.
RunParameters
Gas Flow Rate (SLPM)Liquid Flow Rate (LPM)Ultrasonic Power (V)
1200.230
2170.230
3150.230
4170.225
5200.330
6200.325
7200.430
8200.225
9200.425
Table 2. Reactions involved during CO2 absorption into PZ + MDEA + water solvent.
NoReaction NameReaction
R1MDEA catalyzed hydration   CO 2 + MDEA + H 2 O   MDEAH + + HCO 3
R2Carbamate formation with PZ   CO 2 + PZ + H 2 O PZCOO + H 3 O +
R3Bicarbamate formation with PZ   CO 2 + PZCOO + H 2 O PZ ( COO ) 2 + H 3 O +
R4PZ regeneration reaction   PZCOO + H 2 O + MDEA PZ + HCO 3 + MDEAH +
Table 3. Key specification of the selected case study.
Feed GasGas Flow Rate10,856 kmol/h @ 218 MMscfd
Temperature35 °C
Pressure59.8 barg
Composition19.22 mol% CO2
0.02 mol% H2S
0.06 mol% H2O
80.7 mol% Light and heavy hydrocarbon
Gas Flow Rate10,856 kmol/h @ 218 MMscfd
Temperature35 °C
Pressure59.8 barg
Product GasTemperature86 °C
Pressure58.9 barg
Composition3.2% CO2
27 ppm H2S
SolventComposition35 wt% MDEA, 6 wt% PZ, 59 wt% water
Lean Amine Loading0.2 mol/mol
Rich Amine Loading0.36–0.39 mol/mol
Ultrasonic Absorber PropertiesNo of Modules10
Gas Flow rate to each module21.8 MMscfd
Table 4. Dimension of conventional packed column [55].
DimensionValue
Inner diameter (ID)4.9 m
Height32.6 m
Volume614.8 m3
No. of unit1
Installed weight1210.3 tonne
Table 5. Summary of effective volume and energy consumption.
RunParametersResponses
Gas Flow Rate (SLPM)Liquid Flow Rate (LPM)Ultrasonic Power (V)Effective Volume (m3)Energy Consumption (MW)KGa
(×10−6 mol/m3.s.Pa)
L/G (gal/lbmol)
1200.230208.5235.114.75146.69
2170.230201.4533.924.86156.35
3150.230236.8039.874.09181.69
4170.225222.6626.044.40165.35
5200.330226.1938.094.23228.79
6200.325254.4729.763.83242.57
7200.430222.6637.494.43303.33
8200.225226.1926.454.37153.40
9200.425243.8728.524.02313.97
Table 6. Installed cost and weight for the packed column and ultrasonic absorber from process simulation.
EquipmentPacked ColumnUltrasonic Absorber
Installed Cost (USD)Installed Weight (tonne)Installed Cost (USD)Installed Weight (tonne)
Cooler754,200111.132631,50091.680
Pump A1,967,600127.0811,717,400108.337
Coalescer385,90059.070364,90053.669
Pump B456,40035.205401,80029.883
LP Flash622,20076.153553,20067.538
Heater548,50083.097479,60072.275
HP Flash775,500117.856714,900118.193
AGRU11,960,0001210.315,079,877.8512.85
Total 17,470,3001819.919,943,177.81054.4
Table 7. CAPEX comparison between packed column and ultrasonic absorber.
Packed ColumnUltrasonic Absorber
Installed Equipment Cost (mil USD)17.47019.94
Structure cost (mil USD)131.0578.61
Contingency @ 30% (mil USD)44.5629.57
Total CAPEX (mil USD)193.08128.12
Table 8. Comparison of power consumption cost.
ParametersPacked ColumnUltrasonic Absorber
Pump (MW)8.086.90
Heater (MW)107.3094.14
Absorber (MW)0.0026.04
Total Energy (MW)115.38127.08
Power Consumption cost (USD/day)74,88082,368
Table 9. OPEX Comparison between packed column and ultrasonic absorber.
CriteriaPacked ColumnUltrasonic Absorber
Power Consumption (mil USD)499.20549.12
Solvent Top-up (mil USD)7.134.71
Demin Water top-up (mil USD)2.662.99
Maintenance and repair (mil USD)17.4719.94
Transducer Change-out (mil USD)0.008.65
Total OPEX (mil USD)526.46585.42
Table 10. UTC comparison between packed column and ultrasonic absorber.
CriteriaPacked ColumnUltrasonic Absorber
CAPEX (mil USD)193.08128.12
OPEX for 20 years (mil USD)526.46583.34
UTC (USD/Tonne CO2)56.6154.67
Disclaimer/Publisher’s Note: The statements, opinions and data contained in all publications are solely those of the individual author(s) and contributor(s) and not of MDPI and/or the editor(s). MDPI and/or the editor(s) disclaim responsibility for any injury to people or property resulting from any ideas, methods, instructions or products referred to in the content.

