Article

Industrial Investigation of the Combined Action of Vacuum Residue Hydrocracking and Vacuum Gas Oil Catalytic Cracking While Processing Different Feeds and Operating under Distinct Conditions

1
LUKOIL Neftohim Burgas, 8104 Burgas, Bulgaria
2
Institute of Biophysics and Biomedical Engineering, Bulgarian Academy of Sciences, Georgi Bonchev 105, 1113 Sofia, Bulgaria
3
Department Chemical Technologies, University of Chemical Technology and Metallurgy, Kliment Ohridski 8, 1756 Sofia, Bulgaria
4
Department of Mathematics, University of Chemical Technology and Metallurgy, Kliment Ohridski 8, 1756 Sofia, Bulgaria
5
Department of Informatics, University of Chemical Technology and Metallurgy, Kliment Ohridski 8, 1756 Sofia, Bulgaria
6
Intelligent Systems Laboratory, Department Industrial Technologies and Management, University Prof. Dr. Assen Zlatarov, Professor Yakimov 1, 8010 Burgas, Bulgaria
*
Author to whom correspondence should be addressed.
Processes 2023, 11(11), 3174; https://doi.org/10.3390/pr11113174
Submission received: 19 October 2023 / Revised: 2 November 2023 / Accepted: 4 November 2023 / Published: 7 November 2023

Abstract

:
Ebullated bed vacuum residue hydrocracking and fluid catalytic cracking (FCC) are among the most profitable processes in modern refining. Their optimal performance is vital for petroleum refining profitability. That is why a better understanding of their combined action and the interrelations between these two heavy oil conversion processes in a real-world refinery could provide valuable information for further performance optimization. Nine distinct petroleum crudes belonging to the extra light, light, and medium petroleum crude types were processed in the LUKOIL Neftohim Burgas refinery to study the combined performance of two processes: FCC of vacuum gas oil and ebullated bed vacuum residue H-Oil hydrocracking. The operating conditions along with the characterization data of the feeds and products of both processes were evaluated through the employment of intercriteria analysis to define the variables with statistically significant relationships. Maple 2023 Academic Edition mathematics software was used to develop models to predict the vacuum residue conversion level under different operating conditions. The plug flow reactor model with an activation energy of 215 kJ/mol and a reaction order of 1.59 was found to provide the highest accuracy of vacuum residue conversion, with an average absolute deviation of 2.2%. H-Oil yields were found to correlate with the vacuum residue conversion level and the content of FCC slurry oil (SLO), the recycling of partially blended fuel oil, a material boiling point below 360 °C, and the vacuum gas oil (VGO) in the H-Oil feed. FCC conversion was found to depend on the H-Oil VGO content in the FCC feed and the content of FCC SLO in the H-Oil feed.

Graphical Abstract

1. Introduction

World climate change necessitates the development of measures to lessen carbon emissions—from traditional fossil fuels to renewable and sustainable clean energy. The truth is, however, that an immediate turn to renewables or clean energy is very difficult because of underdeveloped technologies, inadequate resources, and an unsteady provision of energy [1,2,3]. Over the next few decades, fossil fuels are expected to remain the main source of energy for the transport sector. Therefore, instead of neglecting fossil fuels altogether and looking for impractical technologies to reduce carbon emissions, improvement in the performance of energy-intensive refining plants can deliver the desired reduction in greenhouse gas emissions [1,2,3]. This study was devoted to the thermo-catalytic industrial processes of heavy petroleum fractions—fluid catalytic cracking and hydrocracking—and searching for possibilities to improve their performance.
Heavy oil petroleum fractions are those that cannot be removed by the atmospheric distillation. Their boiling point is usually above 350 °C, and they have a specific gravity higher than 0.935 at 15.6 °C [4]. Due to their significantly lower demand (about 15% versus 49% for middle distillates and 36% for light distillates), their price is considerably lower than that of the light petroleum fractions [5]. This is why the transformation of heavy oil fractions into transportation fuels and feeds for petrochemistry, which takes place in conversion units, makes them a key factor in modern refining [6,7,8,9].
Heavy oils are separated in vacuum gas oils and vacuum residues during vacuum distillation [10]. Vacuum gas oils are typically processed in fluid catalytic cracking (FCC) or hydrocracking, while vacuum residue can be converted by several processes classified in two groups: carbon rejection and hydrogen addition [11,12,13,14,15,16,17,18]. The hydrocracking of vacuum gas oils is commonly used in the industry in two fixed bed reactors, the first designed for hydrotreating VGO and the second for hydrocracking the hydrotreated VGO [19,20]. This processing scheme, unfortunately, is vulnerable to the treatment of secondary VGOs coming from residue coking and hydroprocessing due to their high content of nitrogen, carbon residue, and metals, which are hydrocracking catalyst poisons. FCC seems to be the better option for the conversion of secondary VGOs due to the higher tolerance of FCC catalysts. The highest conversion level of vacuum residues was reported to be achieved by two commercially proven hydroprocessing technologies—slurry hydrocracking [21,22] (95% vacuum residue conversion) and H-Oil ebullated bed hydrocracking (93% vacuum residue conversion) [23]. The use of FCC and H-Oil in the LUKOIL Neftohim Burgas (LNB) refinery enabled a light petroleum product yield enhancement from 64 to 81%. The synergy between FCC and ebullated bed hydrocracking was thoroughly investigated in a study by Stratiev at al. [23]. The lower demand for naphtha produced by H-Oil hydrocrackers in 2023 necessitated a reduction in process severity. While the operation of vacuum residue hydrocracking at a high severity has been extensively investigated and discussed [21,22,23,24,25,26,27], it has not been studied or discussed at a low severity to the best of our knowledge. H-Oil at a lower severity along with the refinement of various types of crude oils and their relationship with FCC unit performance have not been investigated or discussed yet, especially on an industrial scale. In the published research, knowledge about the industrial performance of both ebullated bed vacuum residue operating at low severity and FCC, which processes the hydrocracked VGO obtained at a low severity, is completely missing. The severity of vacuum residue hydrocracking depends on the reaction time or liquid hourly space velocity (LHSV) and reaction temperature. The LHSV design of the LUKOIL Neftohim Burgas (LNB) H-Oil hydrocracker is 0.25 h−1, and the design reaction temperature is 423 °C, providing a vacuum residue conversion of 70 wt.% when Urals vacuum residue is processed [27]. During the COVID 19 pandemic, the LNB H-Oil hydrocracker operated at an LHSV as low as 0.10 h−1, and the reaction temperature was as high as 436 °C, achieving a vacuum residue conversion of 93 wt.% [23]. Starting from July 2023, the H-Oil hydrocracker began to operate at a reaction temperature of 405 °C and an LHSV of about 0.13 h−1. The influence of the low severity of the ebullated bed hydrocracking H-Oil unit operation on FCC unit performance has also not been investigated yet. This is the reason we conducted this study, in which H-Oil conversion was varied between 51.8 and 91.7 wt.% and FCC conversion varied between 71.5 and 78.6%. The impact of the feed quality and operating conditions in both processes, H-Oil and FCC, on vacuum residue, vacuum gas oil conversion levels, hydrodeasphaltization, hydrodemetalation, and the quality of the products was investigated using intercriteria analysis.
The purpose of this research was to quantitatively determine the relationship between the conversion, product yields, extent of metals, sulfur removal, and product quality of the H-Oil and FCC processes and the operation conditions, crude slate processing, and processing of recycled and FCC decant oil in the H-Oil hydrocracker.

2. Materials and Methods

The characteristics of the nine petroleum crudes refined in the LNB are presented in Table 1.
Table 2 summarizes characteristics of the vacuum residues derived from the nine crude oils that were processed in the H-Oil unit.
Table 3 shows the characteristics of the vacuum gas oils derived from the nine crude oils.
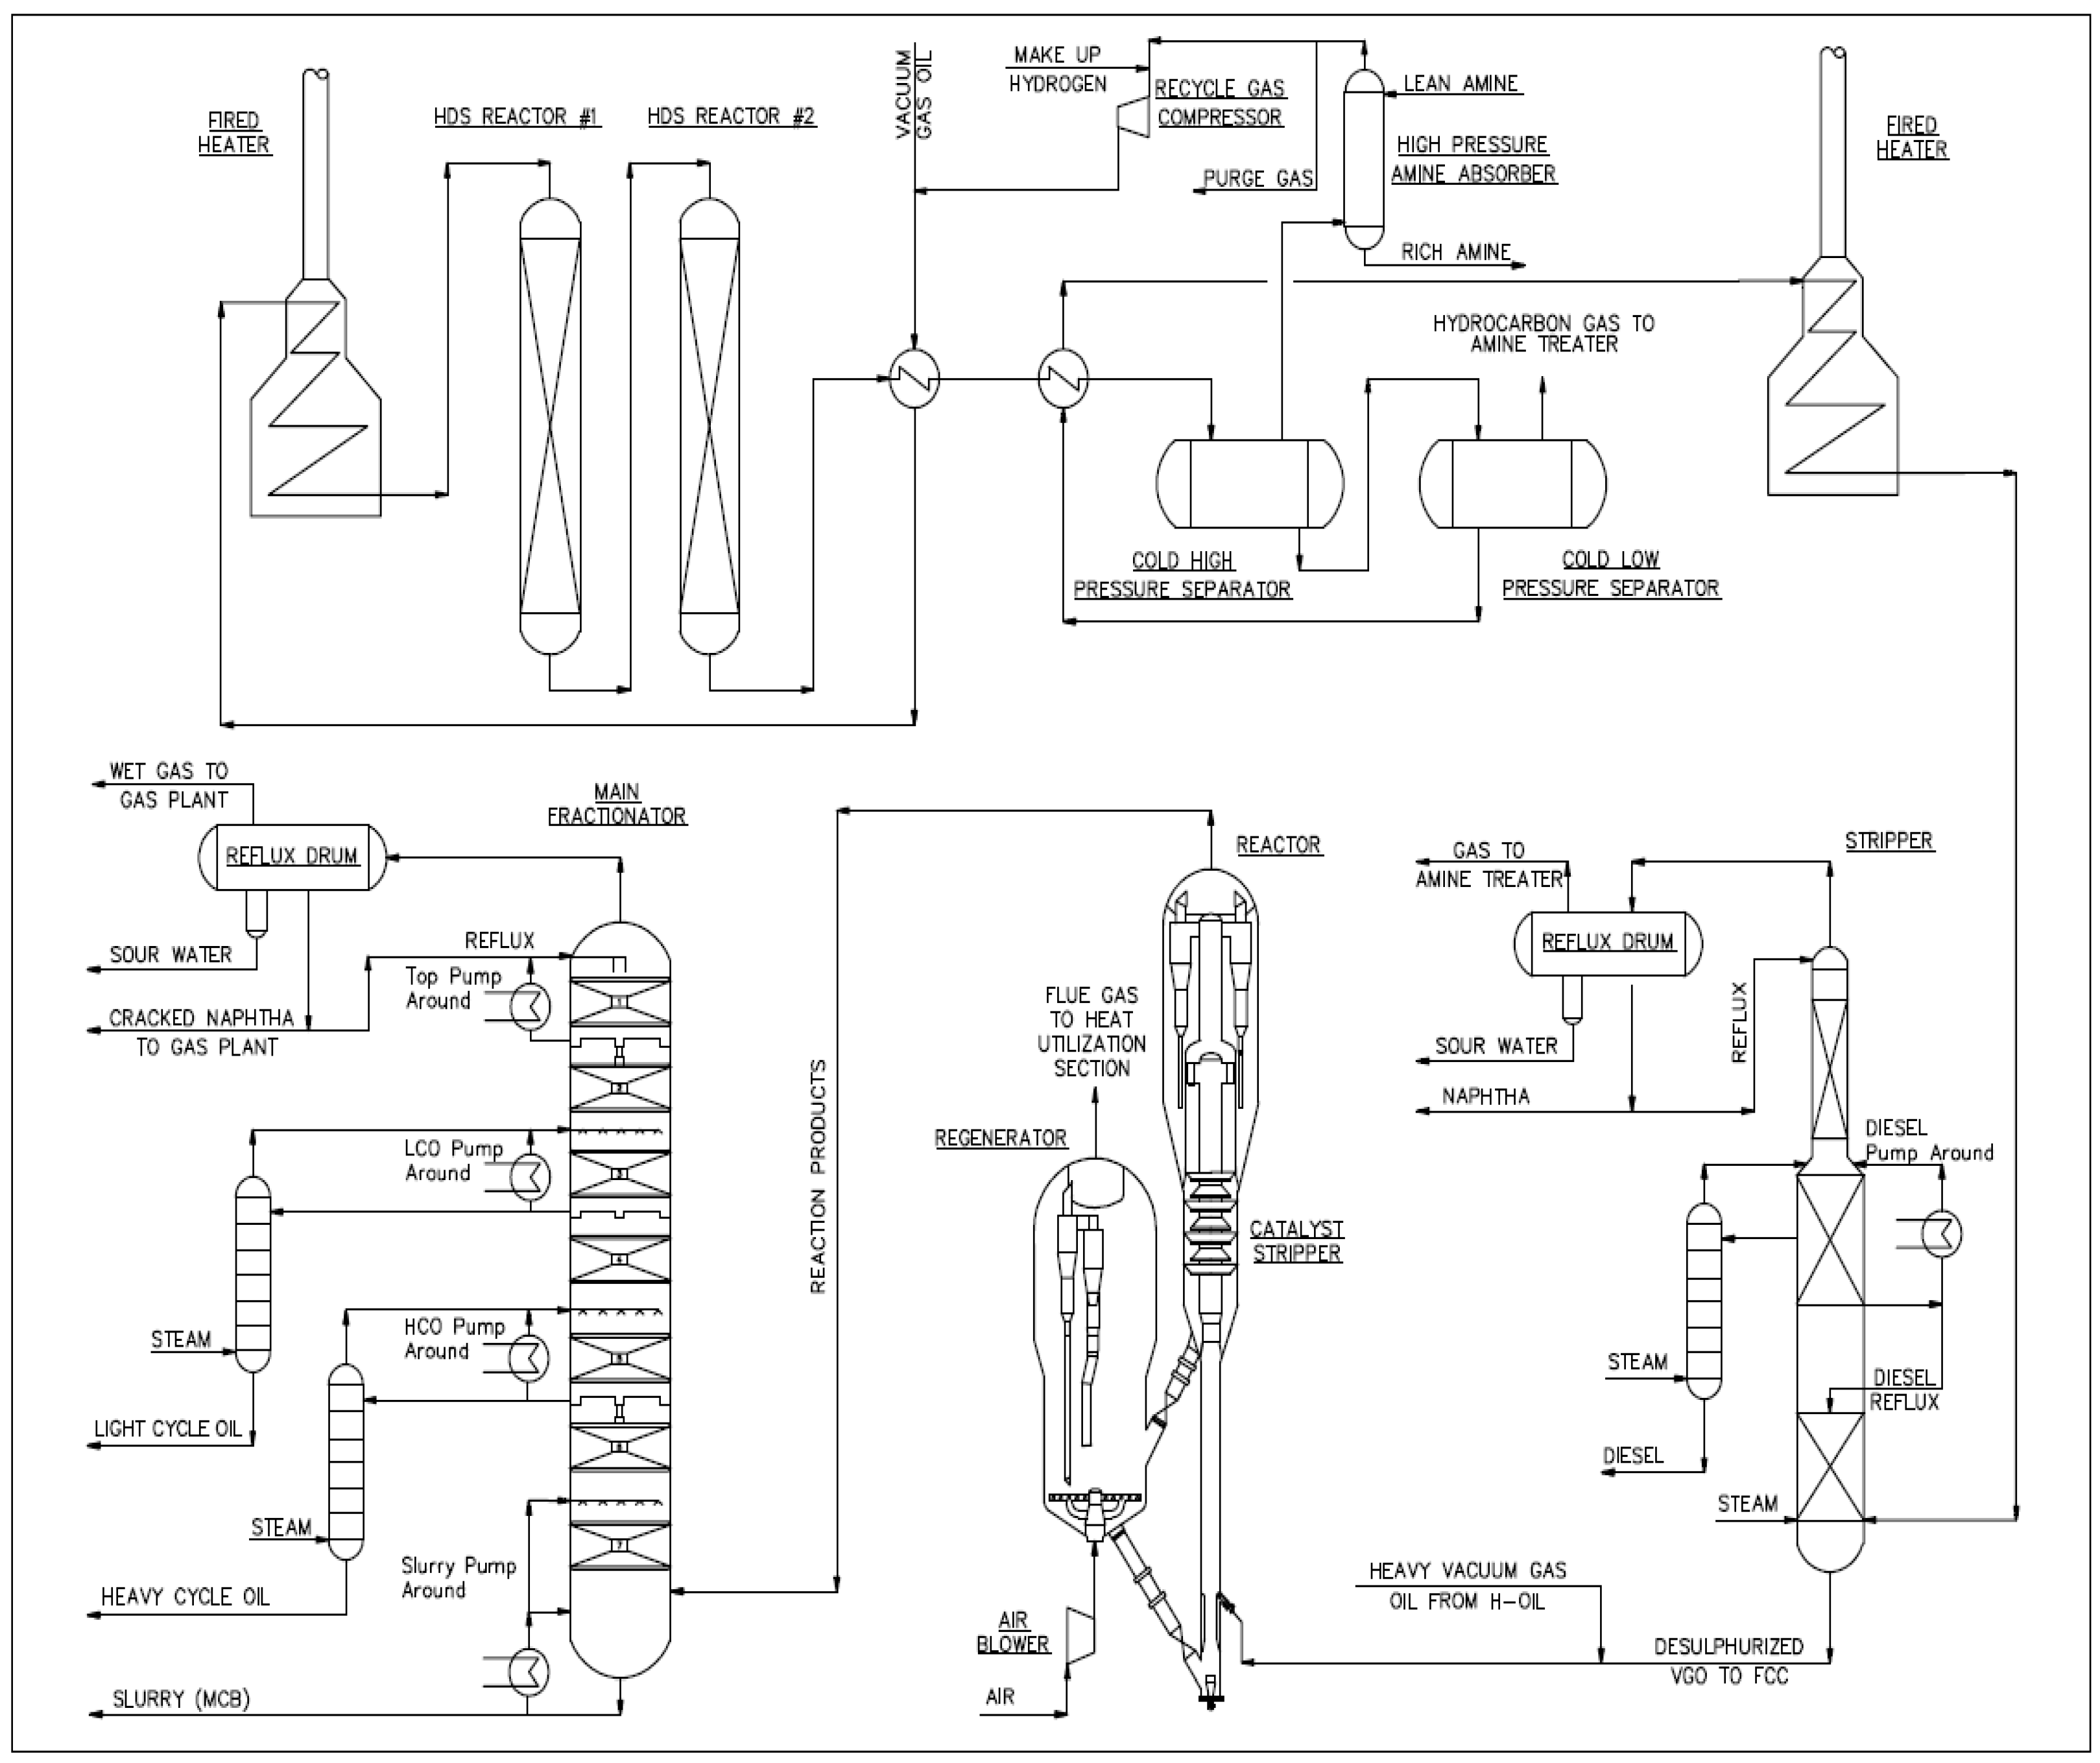
A technological scheme of the H-Oil vacuum residue hydrocracker and its detailed explanation are shown in Figure 1. A detailed explanation of the H-Oil hydrocracker and its application in the LNB refinery the reader can be found in our recent research [23]. The catalyst used in the H-Oil unit (Figure 1) was a low-sediment Ni-Mo catalyst.
The process scheme of the studied vacuum gas oil fluid catalytic cracker is displayed in Figure 2. The catalyst used in the FCC unit (Figure 2) during the study was an octane barrel-type catalyst, and its properties were summarized in our recent research [26] (Catalyst H from Table 2 in [29]).
A simplified layout of the heavy oil technological chain in the LUKOIL Neftohim Burgas refinery that includes the H-Oil and FCC processes is presented in Figure 3.
Figure 3 shows that the H-Oil and FCC processes in the present study are parallel–sequential with an intricate relationship between them, in which the H-Oil VGO product feeds the FCC unit along with the hydrotreated VGO (HTVGO) and FCC HCO, and the SLO products are feed components for the H-Oil unit together with the straight-run vacuum residue.
The SARA composition of the primary and secondary (hydrocracked) vacuum residues, the H-Oil feed, and the vacuum gas oils were analyzed by the liquid chromatography in-house method described in [30].
A net 540 °C+ vacuum residue conversion, which involves the transformation of material boiling above 540 °C from the feed into material boiling below 540 °C (percentage of feed), asphaltene conversion (HDAs), and hydrodemetallization (HDM) extent were computed following Equations (1)–(3), as reported in our recent investigation [31].
The sediment content in the H-Oil atmospheric tower bottom product (ATB) was determined following the procedure IP 375 (total sediment existent (TSE)). By contrast, the sediment content after thermal aging in the partially blended fuel oil (PBFO), which was prepared from about 60% H-Oil VTB (vacuum tower bottom product), about 30% fluid catalytic cracking heavy-cycle oil (FCC HCO), and about 10% FCC light cycle oil (LCO), and slurry oil (SLO) was determined following the procedure IP 390 (total sediment potential (TSP)). The composition of PBFO in the study is shown in Table S1.
The conversion of vacuum gas oil (VGO) in the FCC unit was computed as reported in our recent research [29].
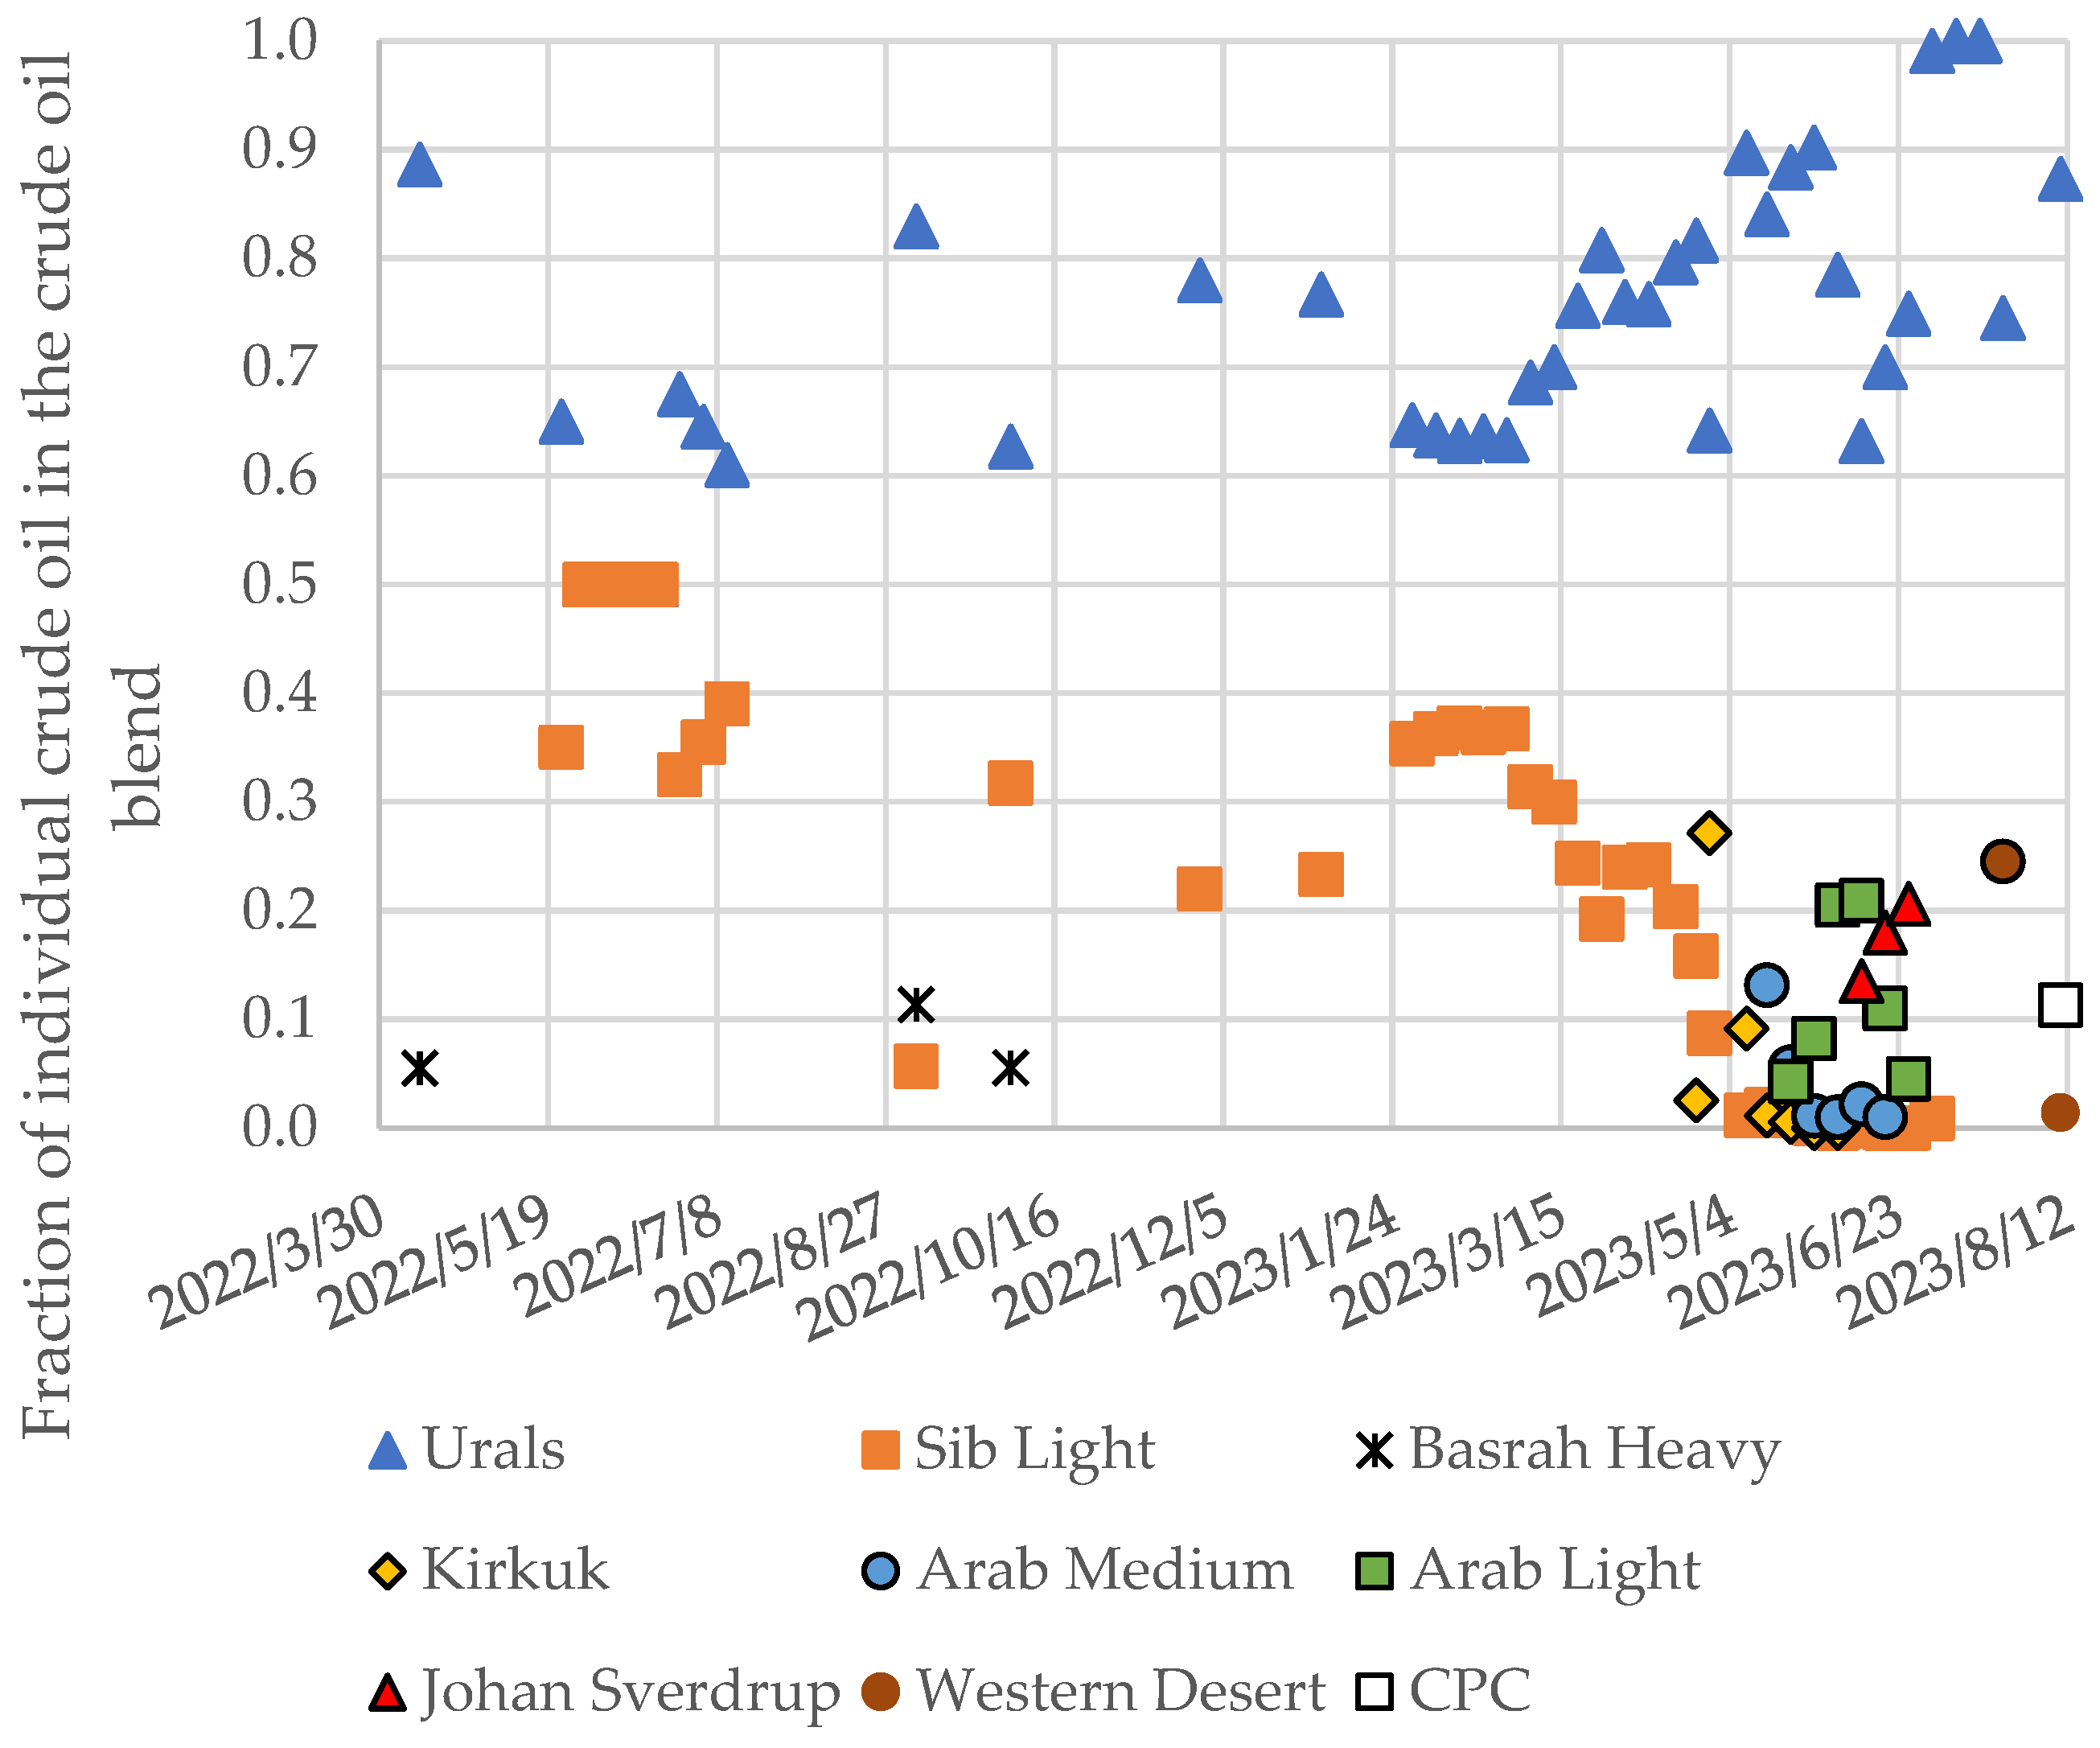
Figure 4 shows how the contents of individual petroleum crudes in processed petroleum mixtures varied during the study.
During the study (10 April 2022–24 July 2023), the LNB refinery processed the mixtures of the petroleum crudes Arab Light, Arab Medium, Basrah Heavy, Johan Sverdrup, Kirkuk, Light Siberian, Urals, and Western Desert. The contents of individual petroleum crudes in processed mixtures are shown in Figure 4. One can see from the data in Figure 4 that the main crude oils processed were Urals and Light Siberian crude oils. Their mutual content in the crude oil blend varied between 74.5 and 100%.
An intercriteria analysis (ICrA) assessment of the data for both the H-Oil and FCC processes was carried out to search for the statistically significant relationships between the studied variables. A μ-value = 0.70 ÷ 1.00; υ = 0 ÷ 0.30 indicates a statistically significant positive relationship, in which a strong positive association exhibits values of μ = 0.90 ÷ 1.00; υ = 0 ÷ 0.1 and a weak positive association demonstrates values of μ = 0.70 ÷ 0.80; υ = 0.20 ÷ 0.30. Accordingly, the values of negative association with μ = 0 ÷ 0.30; υ = 0.70 ÷ 1.00 allude to a statistically significant negative relationship, in which a strong negative association displays values of μ = 0 ÷ 0.1; υ = 0.90 ÷ 1.00 and a weak negative association shows values of μ = 0.20 ÷ 0.30; υ = 0.70 ÷ 0.80. All other cases are considered dissonance. A detailed explanation of ICrA application in petroleum chemistry and processing can be found in [32].
Two models were developed to relate vacuum residue conversion to reaction temperature and reaction time. The first model was a regression similar to that developed in our recent research [31]. The second used the kinetic expression employed for a continuous stirred tank reactor (CSTR) because ebullated bed reactors are assumed to behave as such a reactor [33]. The mass balance of the CSTR is given as Equation (1) [34].
τ = 1 C o n v k 0 × E X P ( E A R × T ) × ( 1 C o n v ) n
where:
τ = reaction time = 1 L H S V , hour;
Conv = 540 °C+ net conversion (calculated by Equation (1));
k0 = collision factor; h−1 × frac.−n;
EA = activation energy, kJ/mol;
R = universal gas constant; (R = 8.31446261815324 joules/mol.K);
T = reaction temperature, K;
n = reaction order.
After the rearrangement of Equation (1), the expression for conversion takes the form of Equation (2):
C o n v = 1 τ × k 0 × E X P E A R × T 1 1 n × 100 ,   wt . %
The objective function (the sum of the square of the difference between the experimental and calculated conversions) was minimized, and the best set of kinetic parameters (k0, EA, and n) was obtained, as shown in Equation (3):
S S E = ( C o n v E x p C o n v C a l c ) 2
The bounded nonlinear optimization problem in Equation (3) is iteratively minimized using a differential evolution algorithm (diffevol) in Maple’s Global Optimization Package.
Schweitzer and Kressmann, who studied ebullated bed reactor modeling, assumed that the ebullated bed reactor is modelled by the plug flow model [35]. A very simplified mass balance equation of the plug flow reactor is shown in Equation (4):
d ( 1 X ) d t = k ( 1 X ) n
0 X d ( 1 X ) ( 1 X ) n = k 0 t d t
( 1 X ) n + 1 n + 1 0 X = k t 0 t
1 X n + 1 n + 1 1 n + 1 = k × t
C o n v = 1 ( ( n 1 ) × k 0 × E X P ( E A R × T ) × t ) ) 1 1 n × 100
where:
X = conversion of the vacuum residue (540 °C+), frac.;
t = reaction time, h; t = 1 / L H S V ;
n = reaction order.

3. Results

3.1. Investigation of H-Oil Vacuum Residue Hydrocracking

The main problems in the ebullated bed vacuum residue hydrocracking operation are sediment formation and the related fouling [23,27,36,37,38,39,40,41,42,43]. The increase in reaction temperature typically leads to the exponential enhancement of the sediment formation rate and fouling [42,43]. Figure 5 presents a graph of the H-Oil atmospheric tower bottom (ATB) sediment content variation (TSE) and that of the partially blended fuel oil (PBFO) after thermal aging (TSP) along with the weighted average bed temperature (WABT) of both H-Oil hydrocracking reactors.
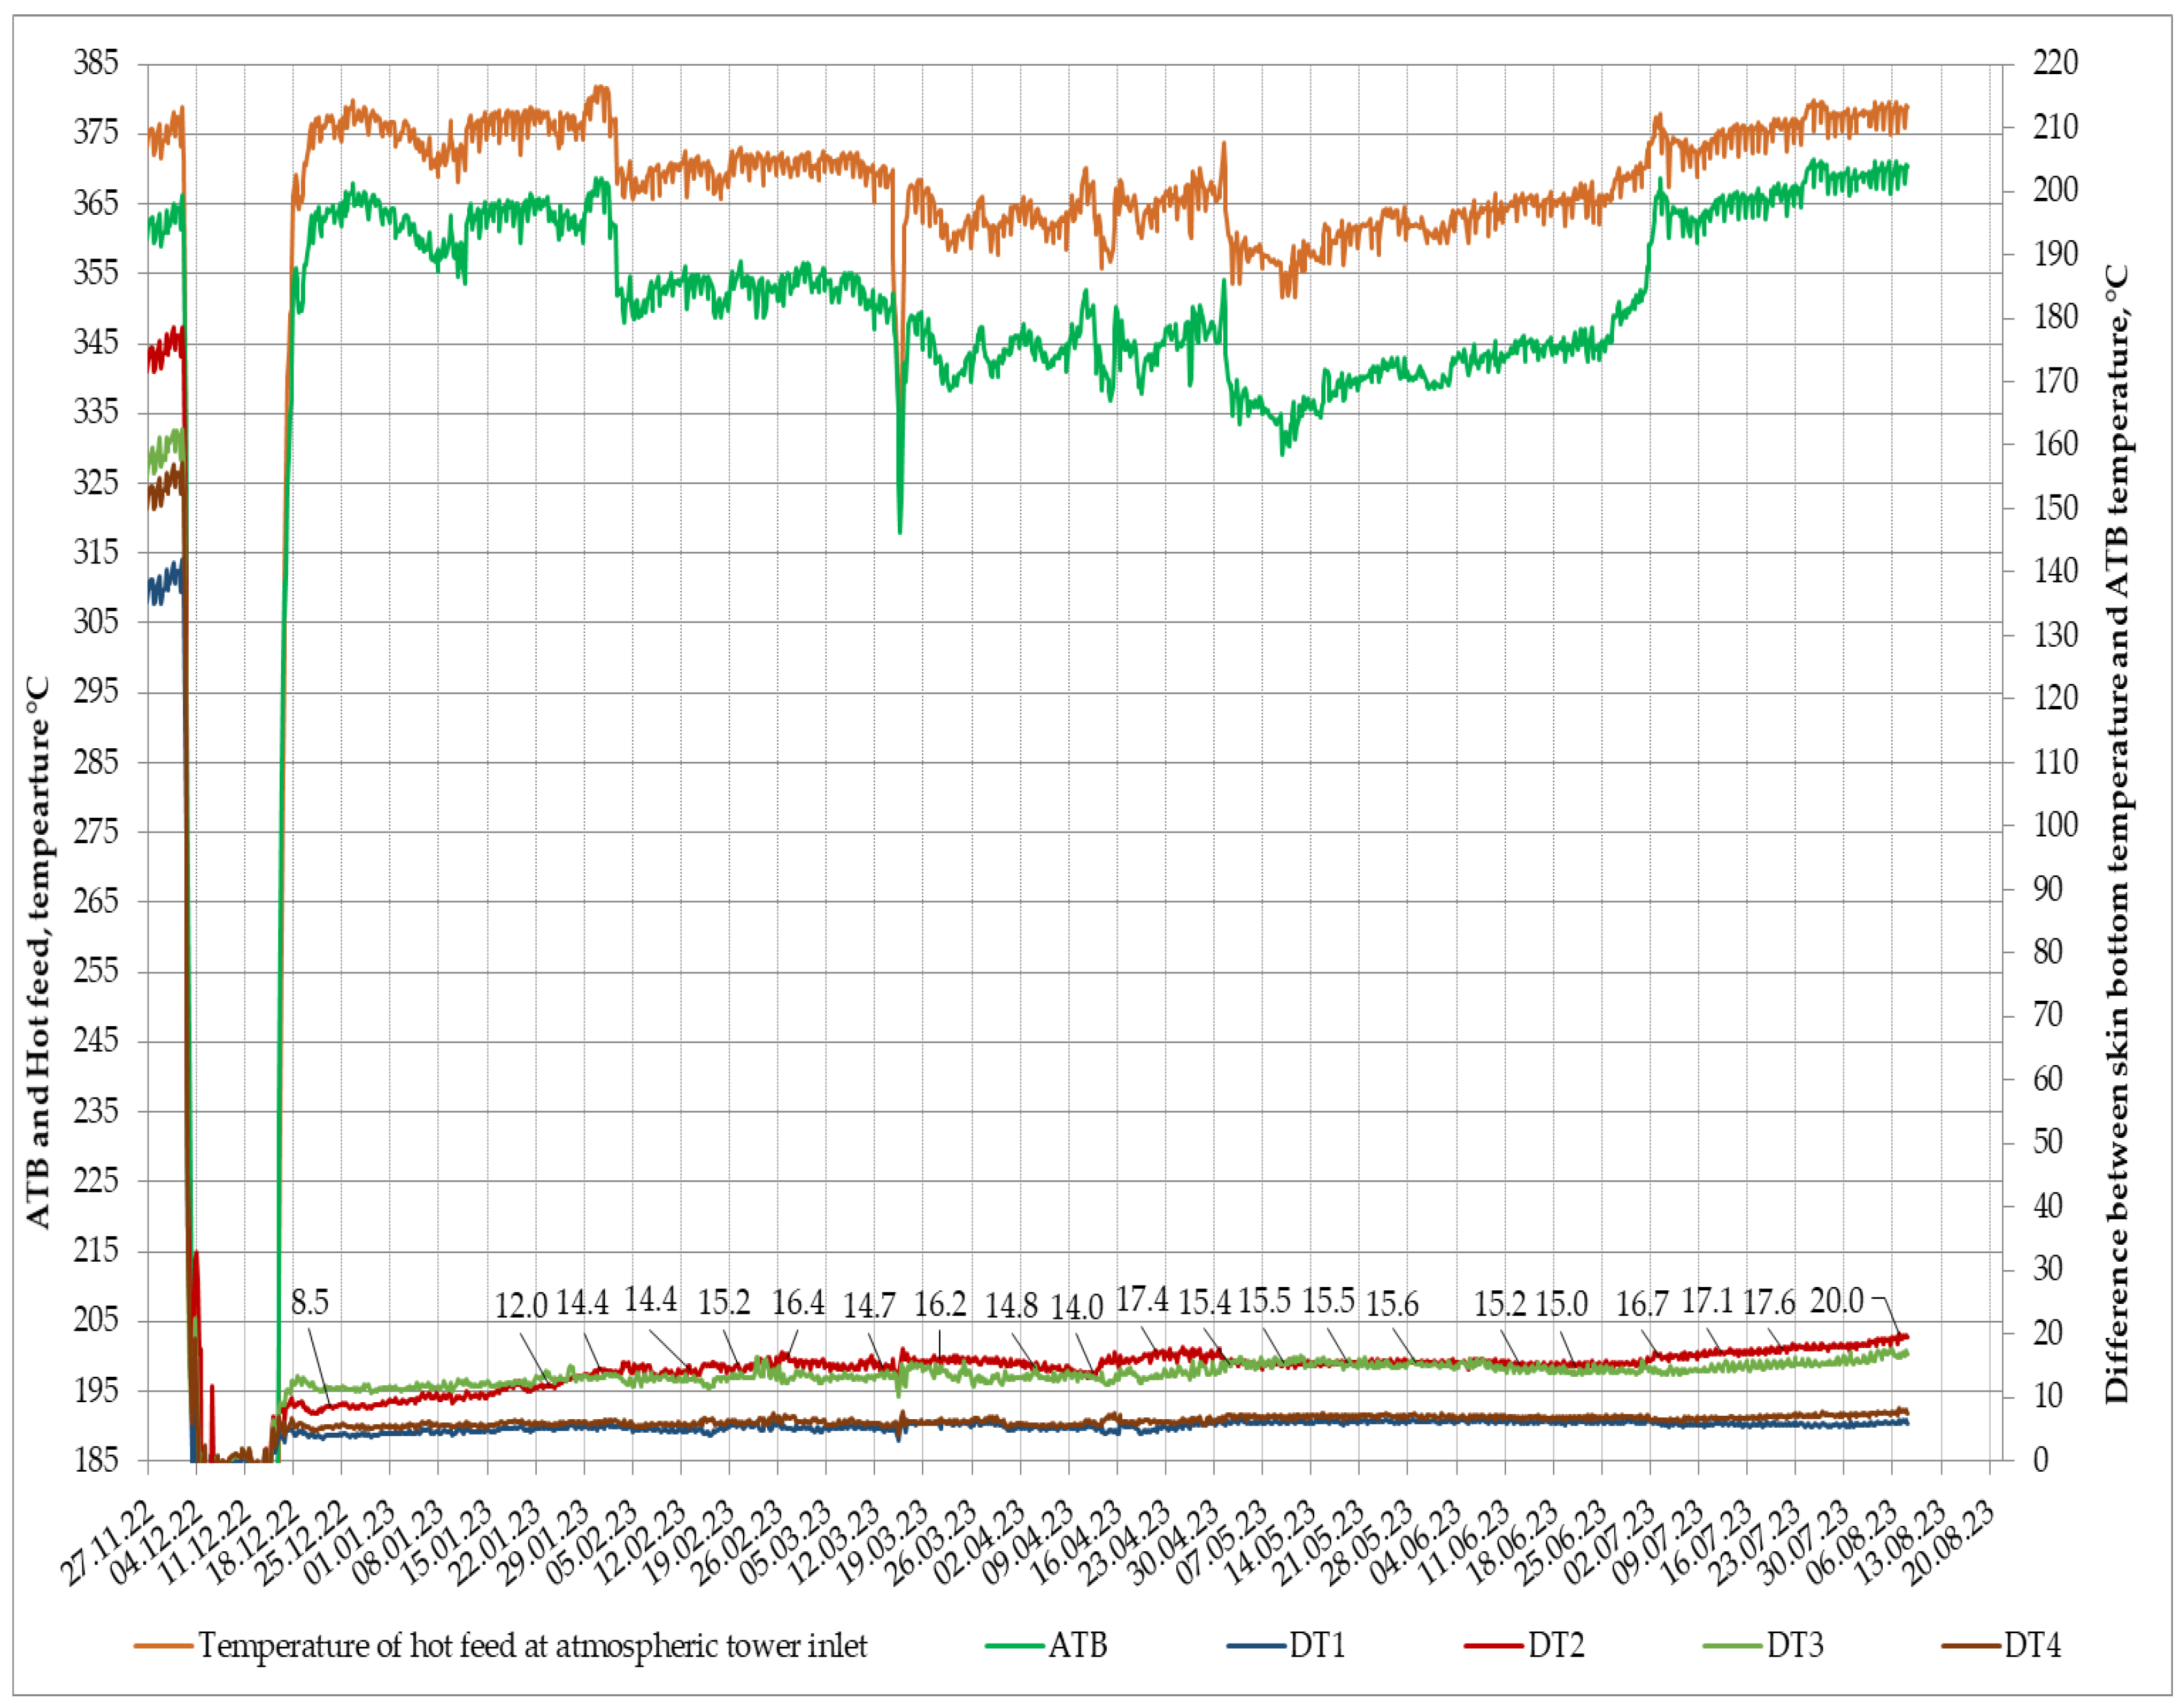
The data in Figure 5 indicate that irrespective of the WABT enhancement from 414.5 to 430 °C, the ATB TSE did not show any trend toward augmentation. Instead, the ATB TSE remained under the safe limit of about 0.3 wt.%. The reduction in WABT from 430 to 405 °C also showed no effect on the ATB TSE at the end of the study period. This supports the correctness of the decision to replace the cascade mode of fresh catalyst addition with the parallel mode and the optimization of the fresh catalyst addition rate, as discussed in our recent research [31]. The data shown in Figure 6 confirm the very low fouling rate registered during this study.
The unusually high PBFO TSP observed on 18 April 2023, 24 April 2023, and 28 April 2023 can be explained by the shutdown of the FCC unit for repairs during the period of 14 April 2023–30 April 2023. The lack of highly aromatic FCC gas oils (LCO, HCO, and SLO) due to the FCC unit shutdown negatively affected the sediment content after the thermal aging of the PBFO (Figure 5). This was reported in our earlier studies [23,27].
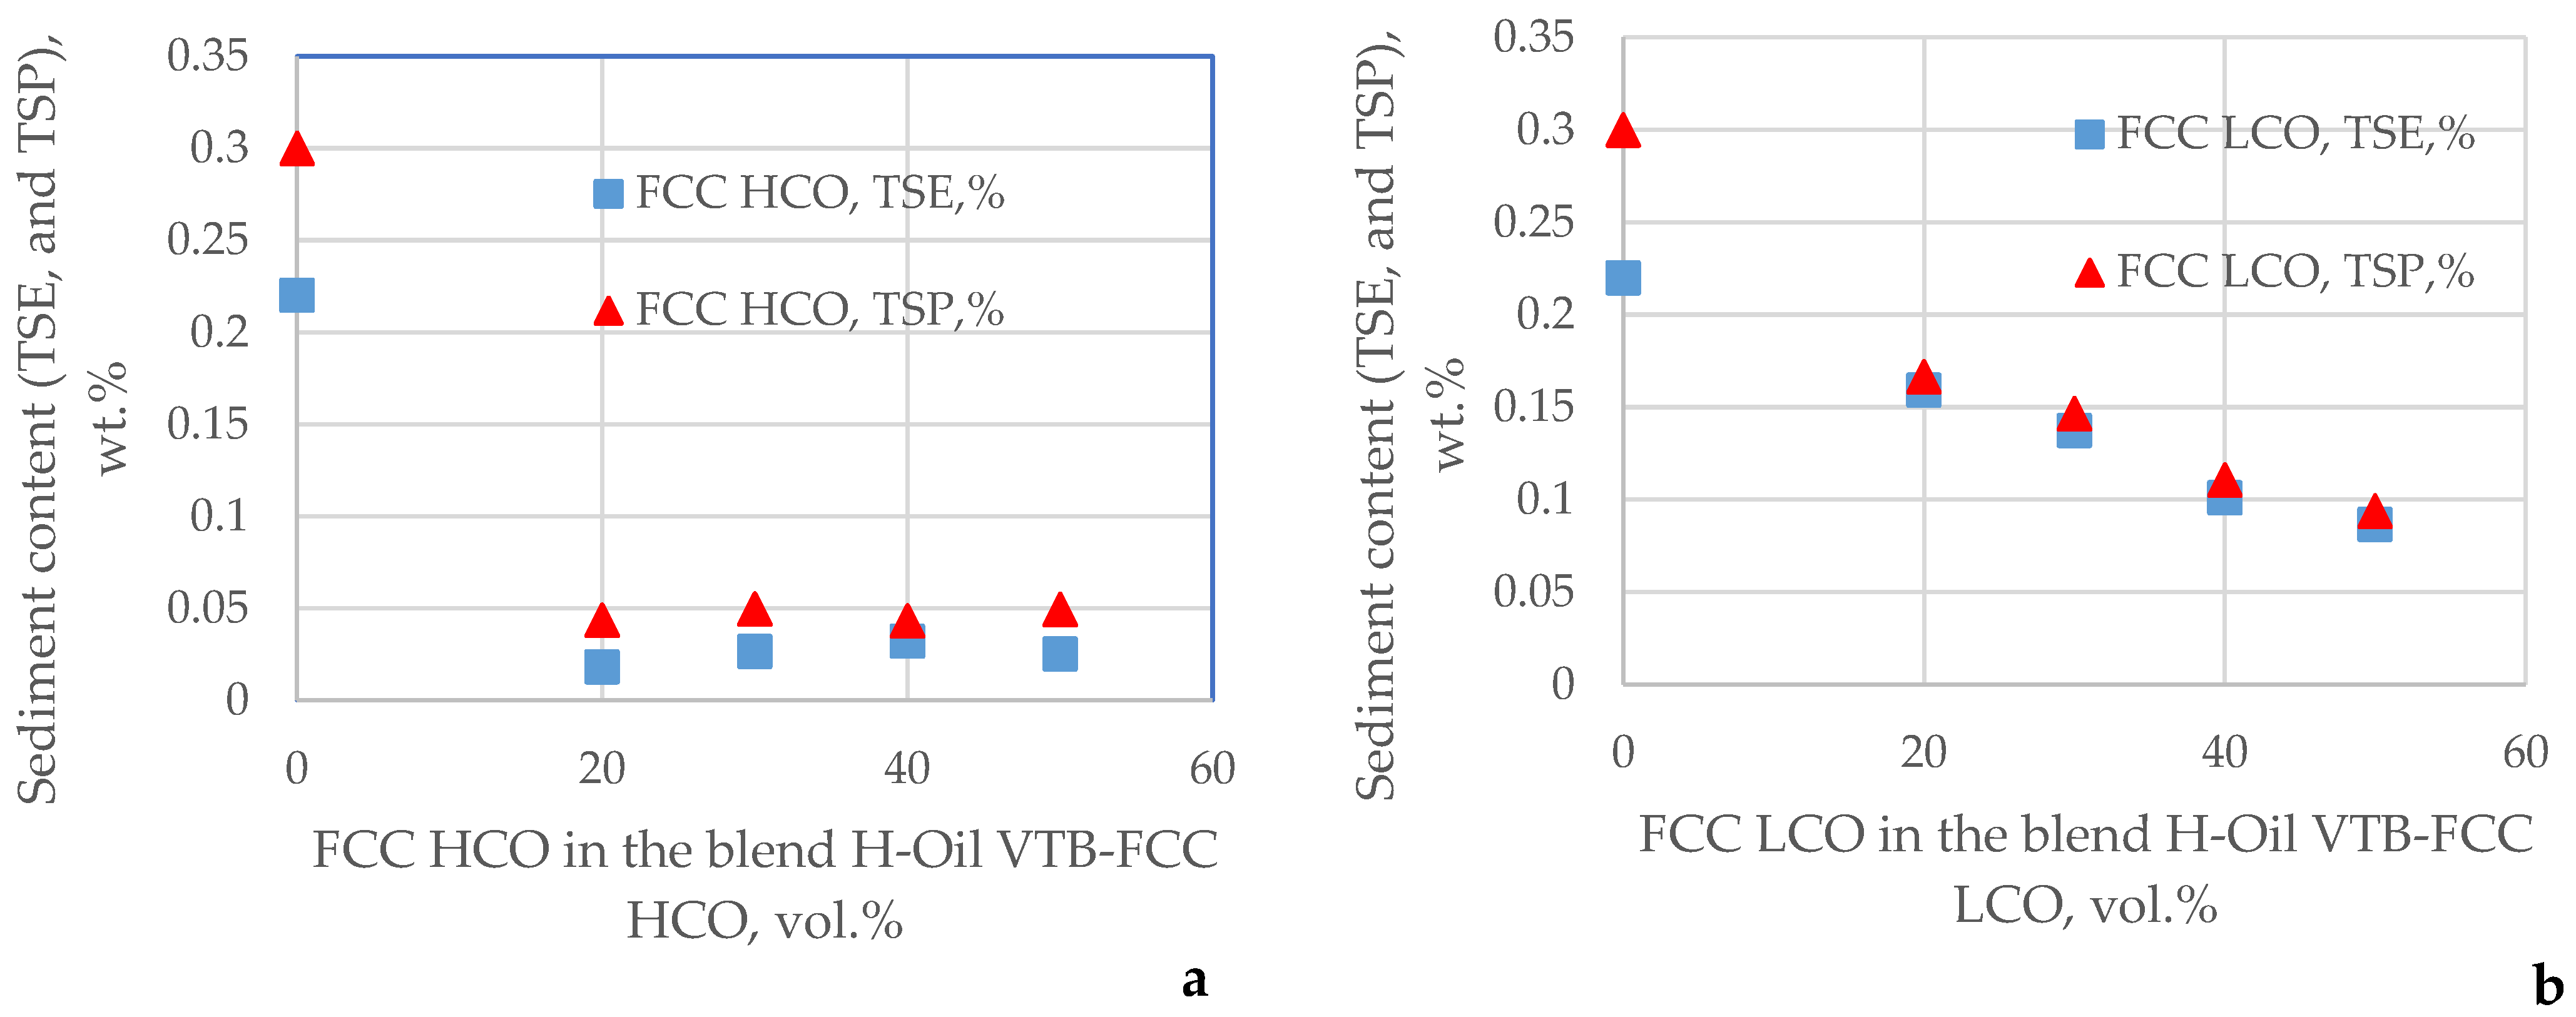
Figure 7 shows the graphs of variation of TSE and the TSP of blends of H-Oil VTB obtained at very low severities (WABT of 405 °C); high aromatic FCC LCO, HCO, and SLO; and low aromatic FCCPT diesel with the alteration of diluent concentration. The properties of these four gas oils are shown in Table S2.
It is obvious from the data in Figure 7 that the sediment content of the blend of H-Oil VTB–diluent is specific in relationship with the diluent, a finding that was also observed in our recent research [44]. The FCC HCO turned out to be the most effective diluent related to sediment content reduction, while the low aromatic FCCPT diesel exhibited the highest TSP, confirming that the shutdown of the FCC unit results in PBFO TSP enlargement. It deserves mentioning here that at a higher reaction severity (WABT of 430 °C), the TSE of the blend of H-Oil VTB–FCCPT diesel was about 1.0 wt.% [44], while at a WABT of 405 °C, as obvious from the data in Figure 7d, it was about 0.2 wt.%. This suggests that at higher a reaction severity, the H-Oil VTB asphaltenes become less soluble.
The operating variables affecting vacuum residue conversion, hydrodeasphaltization (HDAs) extent, and hydrodemetallization (HDM), such as the reaction temperature and reaction time ( 1 L H S V ), are summarized in Table S3.
Using the data from Table S3 and considering that the conversion depends on the reaction temperature (WABT, °C) and reaction time ( 1 L H S V ) ), two models, as mentioned in Section 2 (Materials and Methods), were developed to relate the vacuum residue conversion to the reaction temperature and reaction time.
The regression equation that predicts the conversion takes the form of Equation (9):
C o n v = 128.7928 × L H S V + 1.339 × W A B T 475.35
where:
LHSV = liquid hourly space velocity = F e e d   f l o w   r a t e E B R   v o l u m e ; h−1; feed flow rate in m3/h; EBR = ebullated bed reactor volume in m3;
WABT = weighted average bed temperature, °C.
For the dataset in Table S3, the following kinetic parameters for the CSTR model (Equation (2)) were found: k 0 = 1.4369 × 10 11 ; E A = 152.67 kJ/mol; n = 1.82.
For the dataset in Table S3, the following kinetic parameters for the plug flow model (Equation (8)) were found: k 0 = 4.42875 × 10 15 ; E A = 215 kJ/mol; n = 1.59, following the iteratively minimization of Equation (8) using the differential evolution algorithm (diffevol) in Maple’s Global Optimization Package.
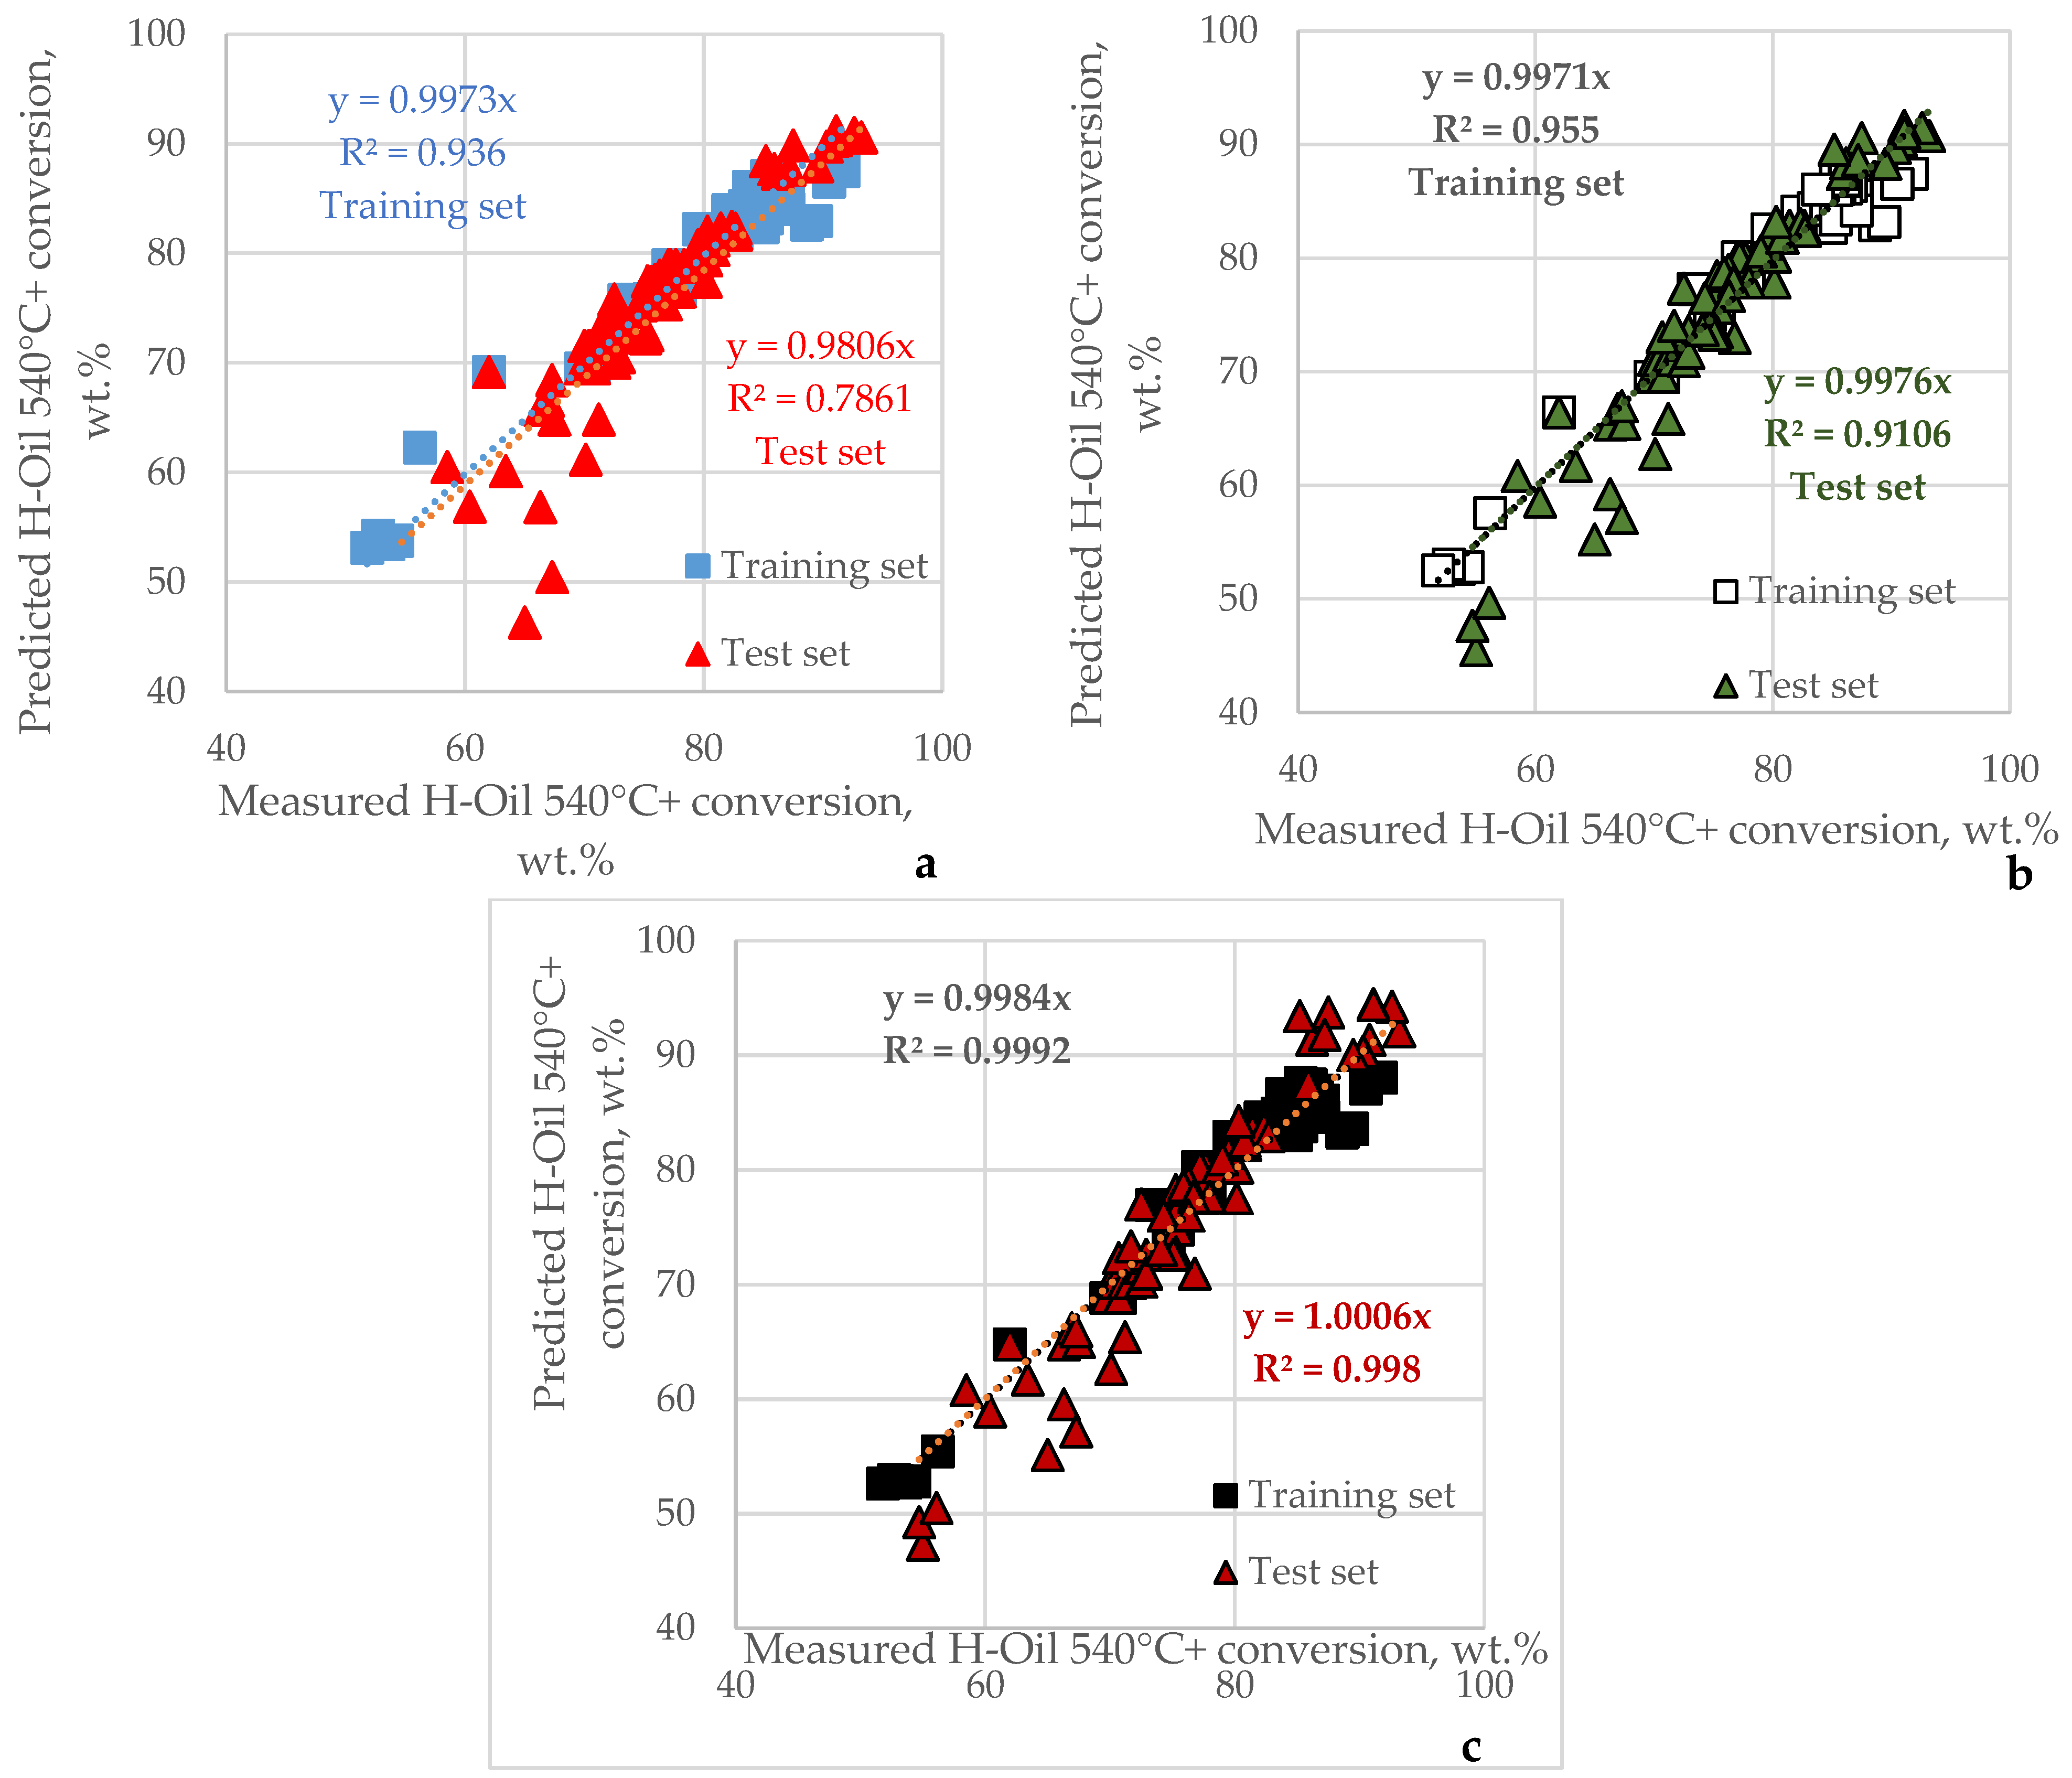
Figure 8 shows the parity graphs for the measured versus the predicted conversion using Equation (2) with the determined kinetic parameters ( k 0 = 1.4369 × 10 11 ; E A = 152.67 kJ/mol; n = 1.82) by the use of the regression model (Equation (9)) and Equation (8) ( k 0 = 4.42875 × 10 15 ; E A = 215 kJ/mol; n = 1.59).
In Figure 8, the training set is related to development of Equations (2), (8) and (9) with the data in Table S3. The test set was used to verify Equations (2), (8) and (9) with data not included in the process of equation development.
The statistical parameters used to evaluate the precision of conversion prediction are presented in Table 4. A total of 121 datasets were used to calculate them. Equation (8) (the plug flow model) seemed to outperform the regression (Equation (9)) and Equation (2) (CSTR model).
The data in Table S3 along with the data in Tables S4–S9, which encompass the H-Oil operating conditions, conversions, yields as well as the characteristics of the H-Oil feeds and H-Oil VTBs were evaluated by the use of ICrA. The results of ICrA in terms of the μ- and υ-values with statistically meaningful relationships between the variables (HDAs, HDM, conversion, reactor temperatures, ATB TSE, PBFO TSP, product yields, and H-Oil VTB properties) are summarized in Tables S10 and S11.
The data in Tables S10 and S11 indicate that both de-asphaltization degrees (HDAs (C5) and C7), hydrodemetallization (HDM), and 540 °C+ conversion had a statistically significant positive association. This implies that the factors contributing to 540 °C+ conversion enhancement contribute to HDAs and HDM enlargement. The data in Tables S10 and S11 also indicate that the higher the molecular weight of the H-Oil feed, the lower the HDAs and HDM because they have a statistically meaningful negative association. This suggests that higher-molecular-weight H-Oil feeds may impede HDAs and HDM. It is evident from the data in Tables S10 and S11 that the 540 °C+ conversion and VTB density and the VTB C5 and C7 asphaltene contents had a statistically significant positive association, along with a statistically meaningful negative association with VTB molecular weight and T50%. This means that the magnification of conversion is accompanied by the enhancement of VTB density and VTB C5 and C7 asphaltene contents as well as a reduction in VTB molecular weight. This can be explained by the cracking of the H-Oil 540 °C+ feed material, which leads to the production of lower-molecular-weight products like gas, naphtha, diesel, and VGO and leaves a lower-molecular-weight, higher aromaticity unconverted 540 °C+ material, denoted as VTB. Figure 9 illustrates the relationship between the VTB molecular weight and density and the 540 °C+ conversion.
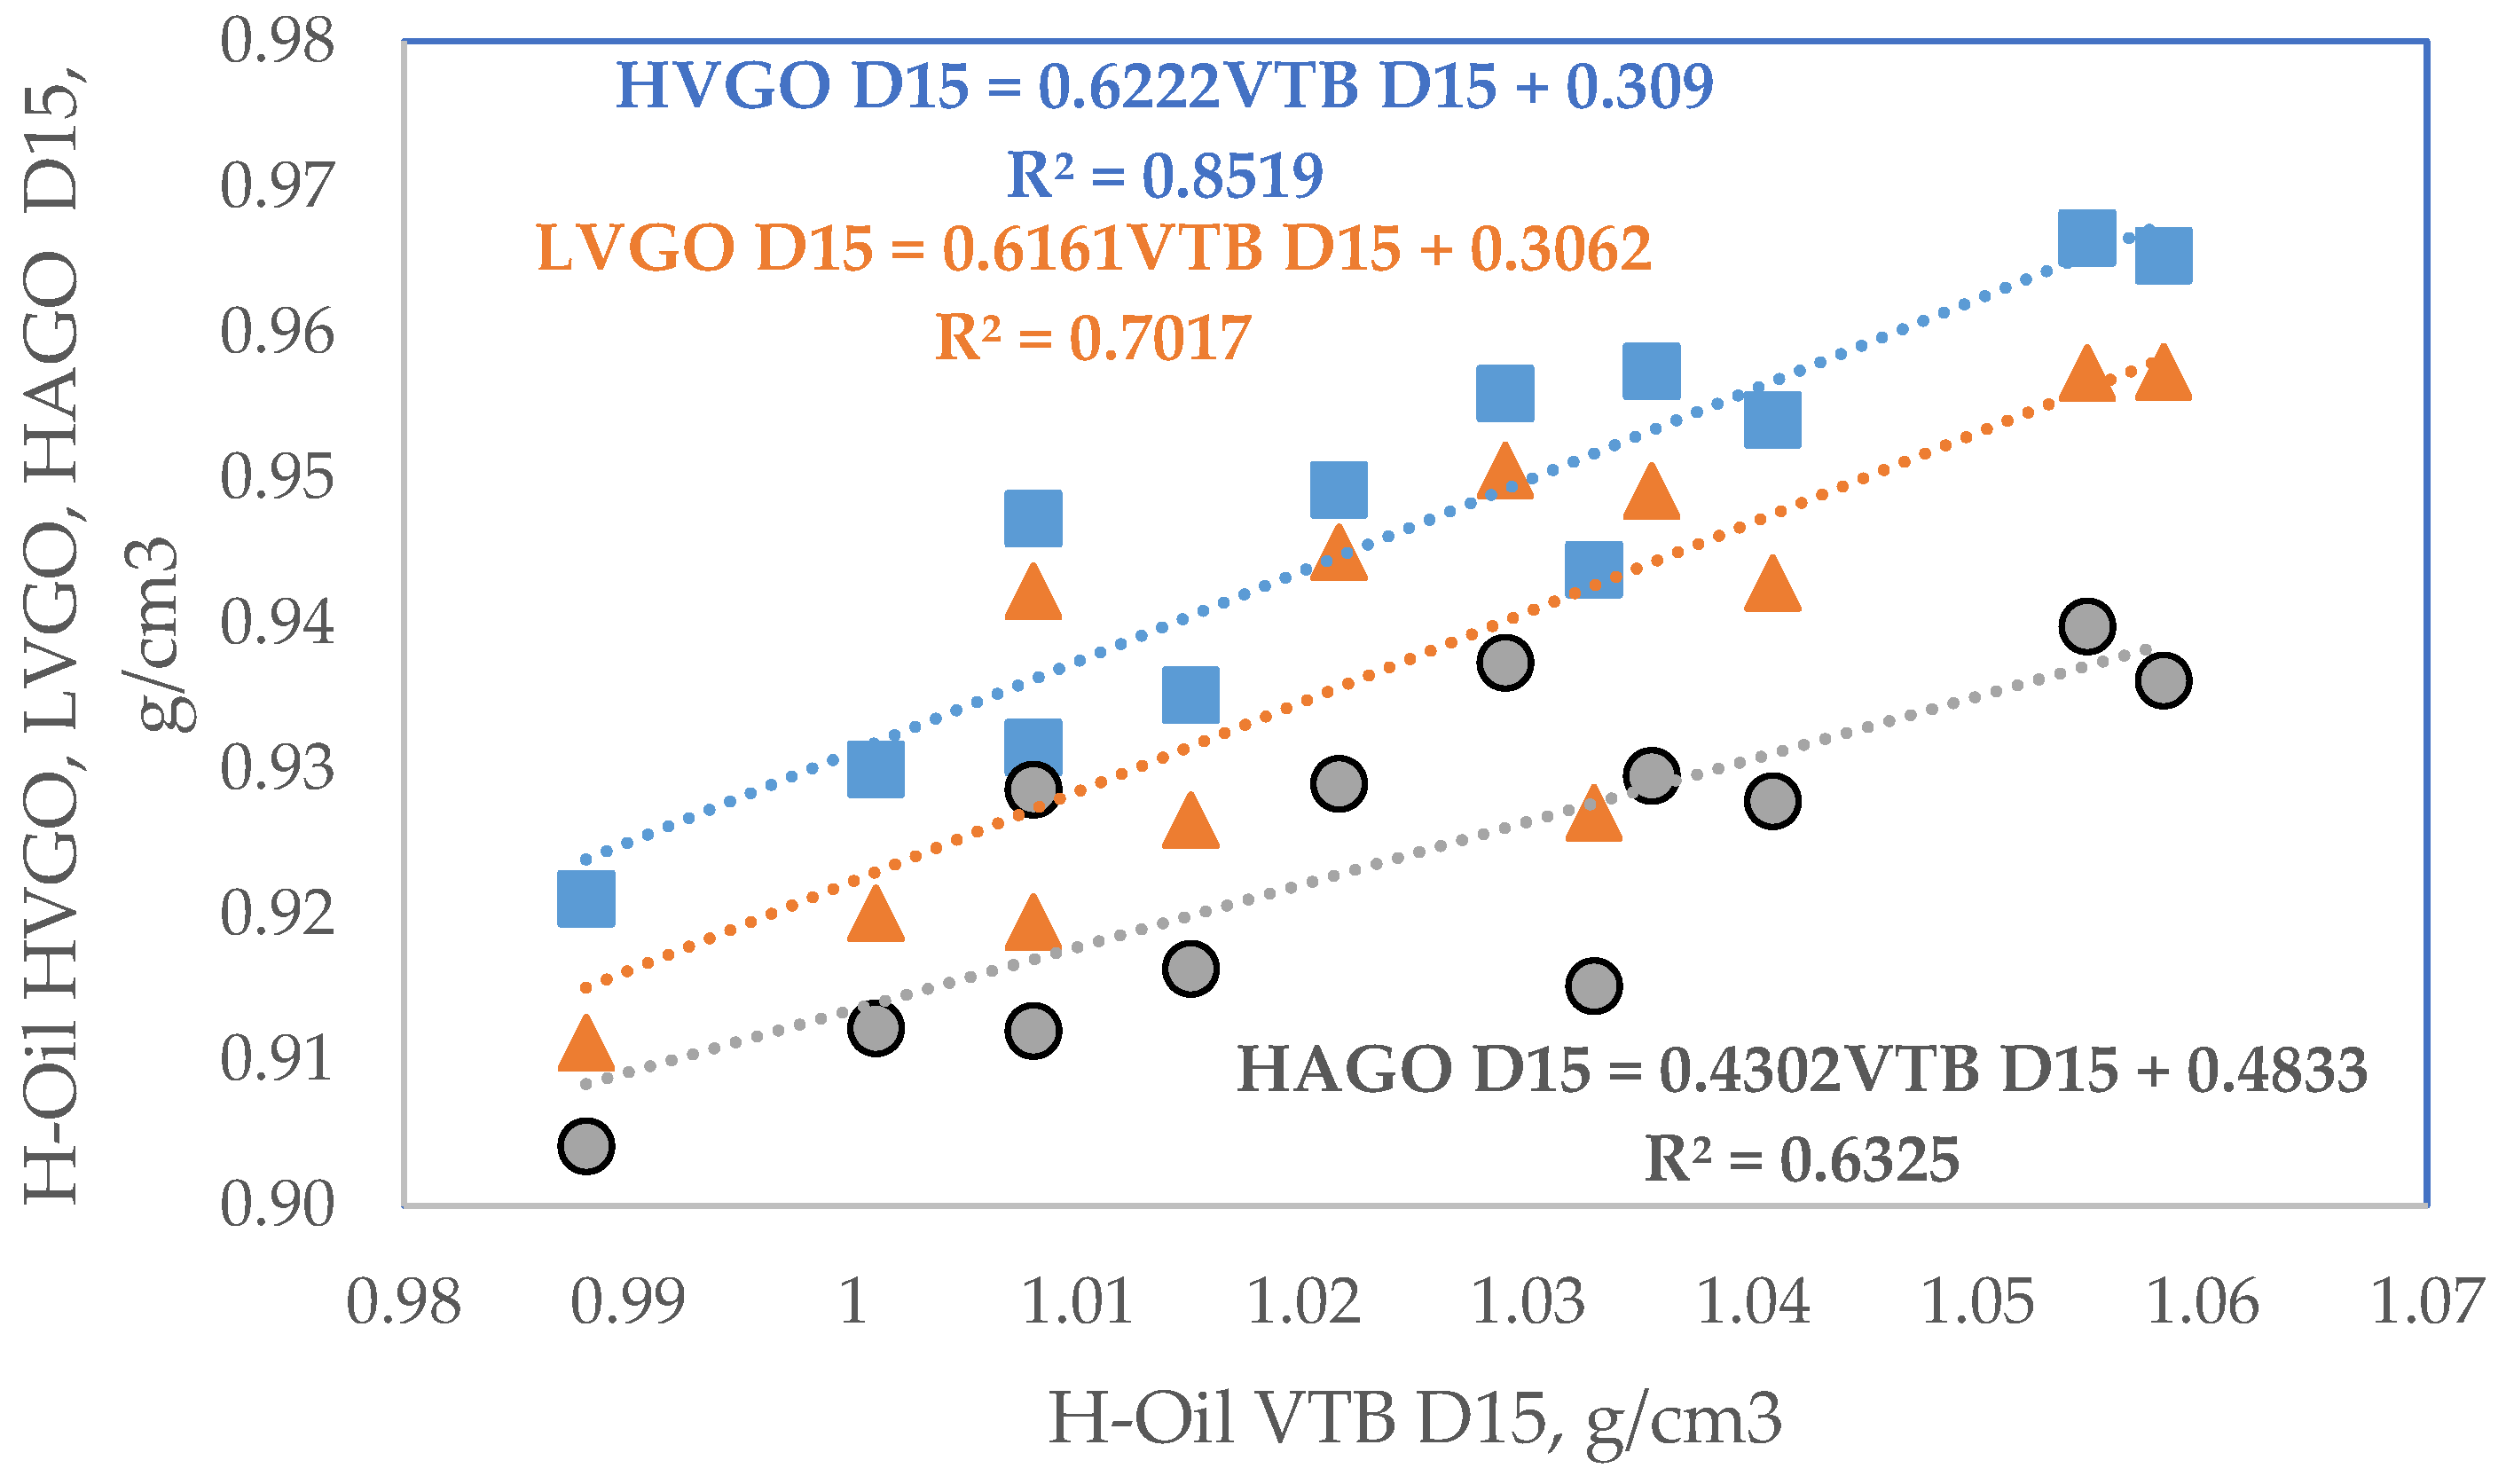
It is worth mentioning that along with the VTB density augmentation as a consequence of the increase in H-Oil conversion, the gas oils from the H-Oil, which make up the FCC feed, also followed the trend of VTB density enhancement, as illustrated in Figure 10. The data in Figure 10 indicate the same slope of the variation of the density of HVGO and LVGO with the VTB density alteration, whereas the HAGO density slope was substantially lower, suggesting that this H-Oil gas oil is less vulnerable to secondary cracking than HVGO and LVGO. Thus, it can be expected that the HAGO conversion observed in the FCC plant is less dependent on the severity of the H-Oil hydrocracker reaction than LVGO and HVGO.
Another interesting fact observed in the data in Tables S10 and S11 is the relatively strong positive association (μ = 0.89; υ = 0.00) between the VTB sulfur content and the sulfur content of the H-Oil feed. The regression that relates the VTB sulfur content to the H-Oil feed sulfur content for this data set is given in Equation (10):
H O i l   V T B   S u l = 0.5713 × H O i l   F e e d   S u l 0.3516    R 2 = 0.8704
where:
HOil VTB Sul = Sulfur content in the H-Oil VTB, wt.%;
HOil Feed Sul = Sulfur content in the H-Oil feed, wt.%.
A statistically meaningful weak association between the VTB vanadium content and the VTB sulfur content can be seen in the data in Tables S10 and S11, suggesting that the higher sulfur content of the H-Oil feeds are more difficult to demetallize.
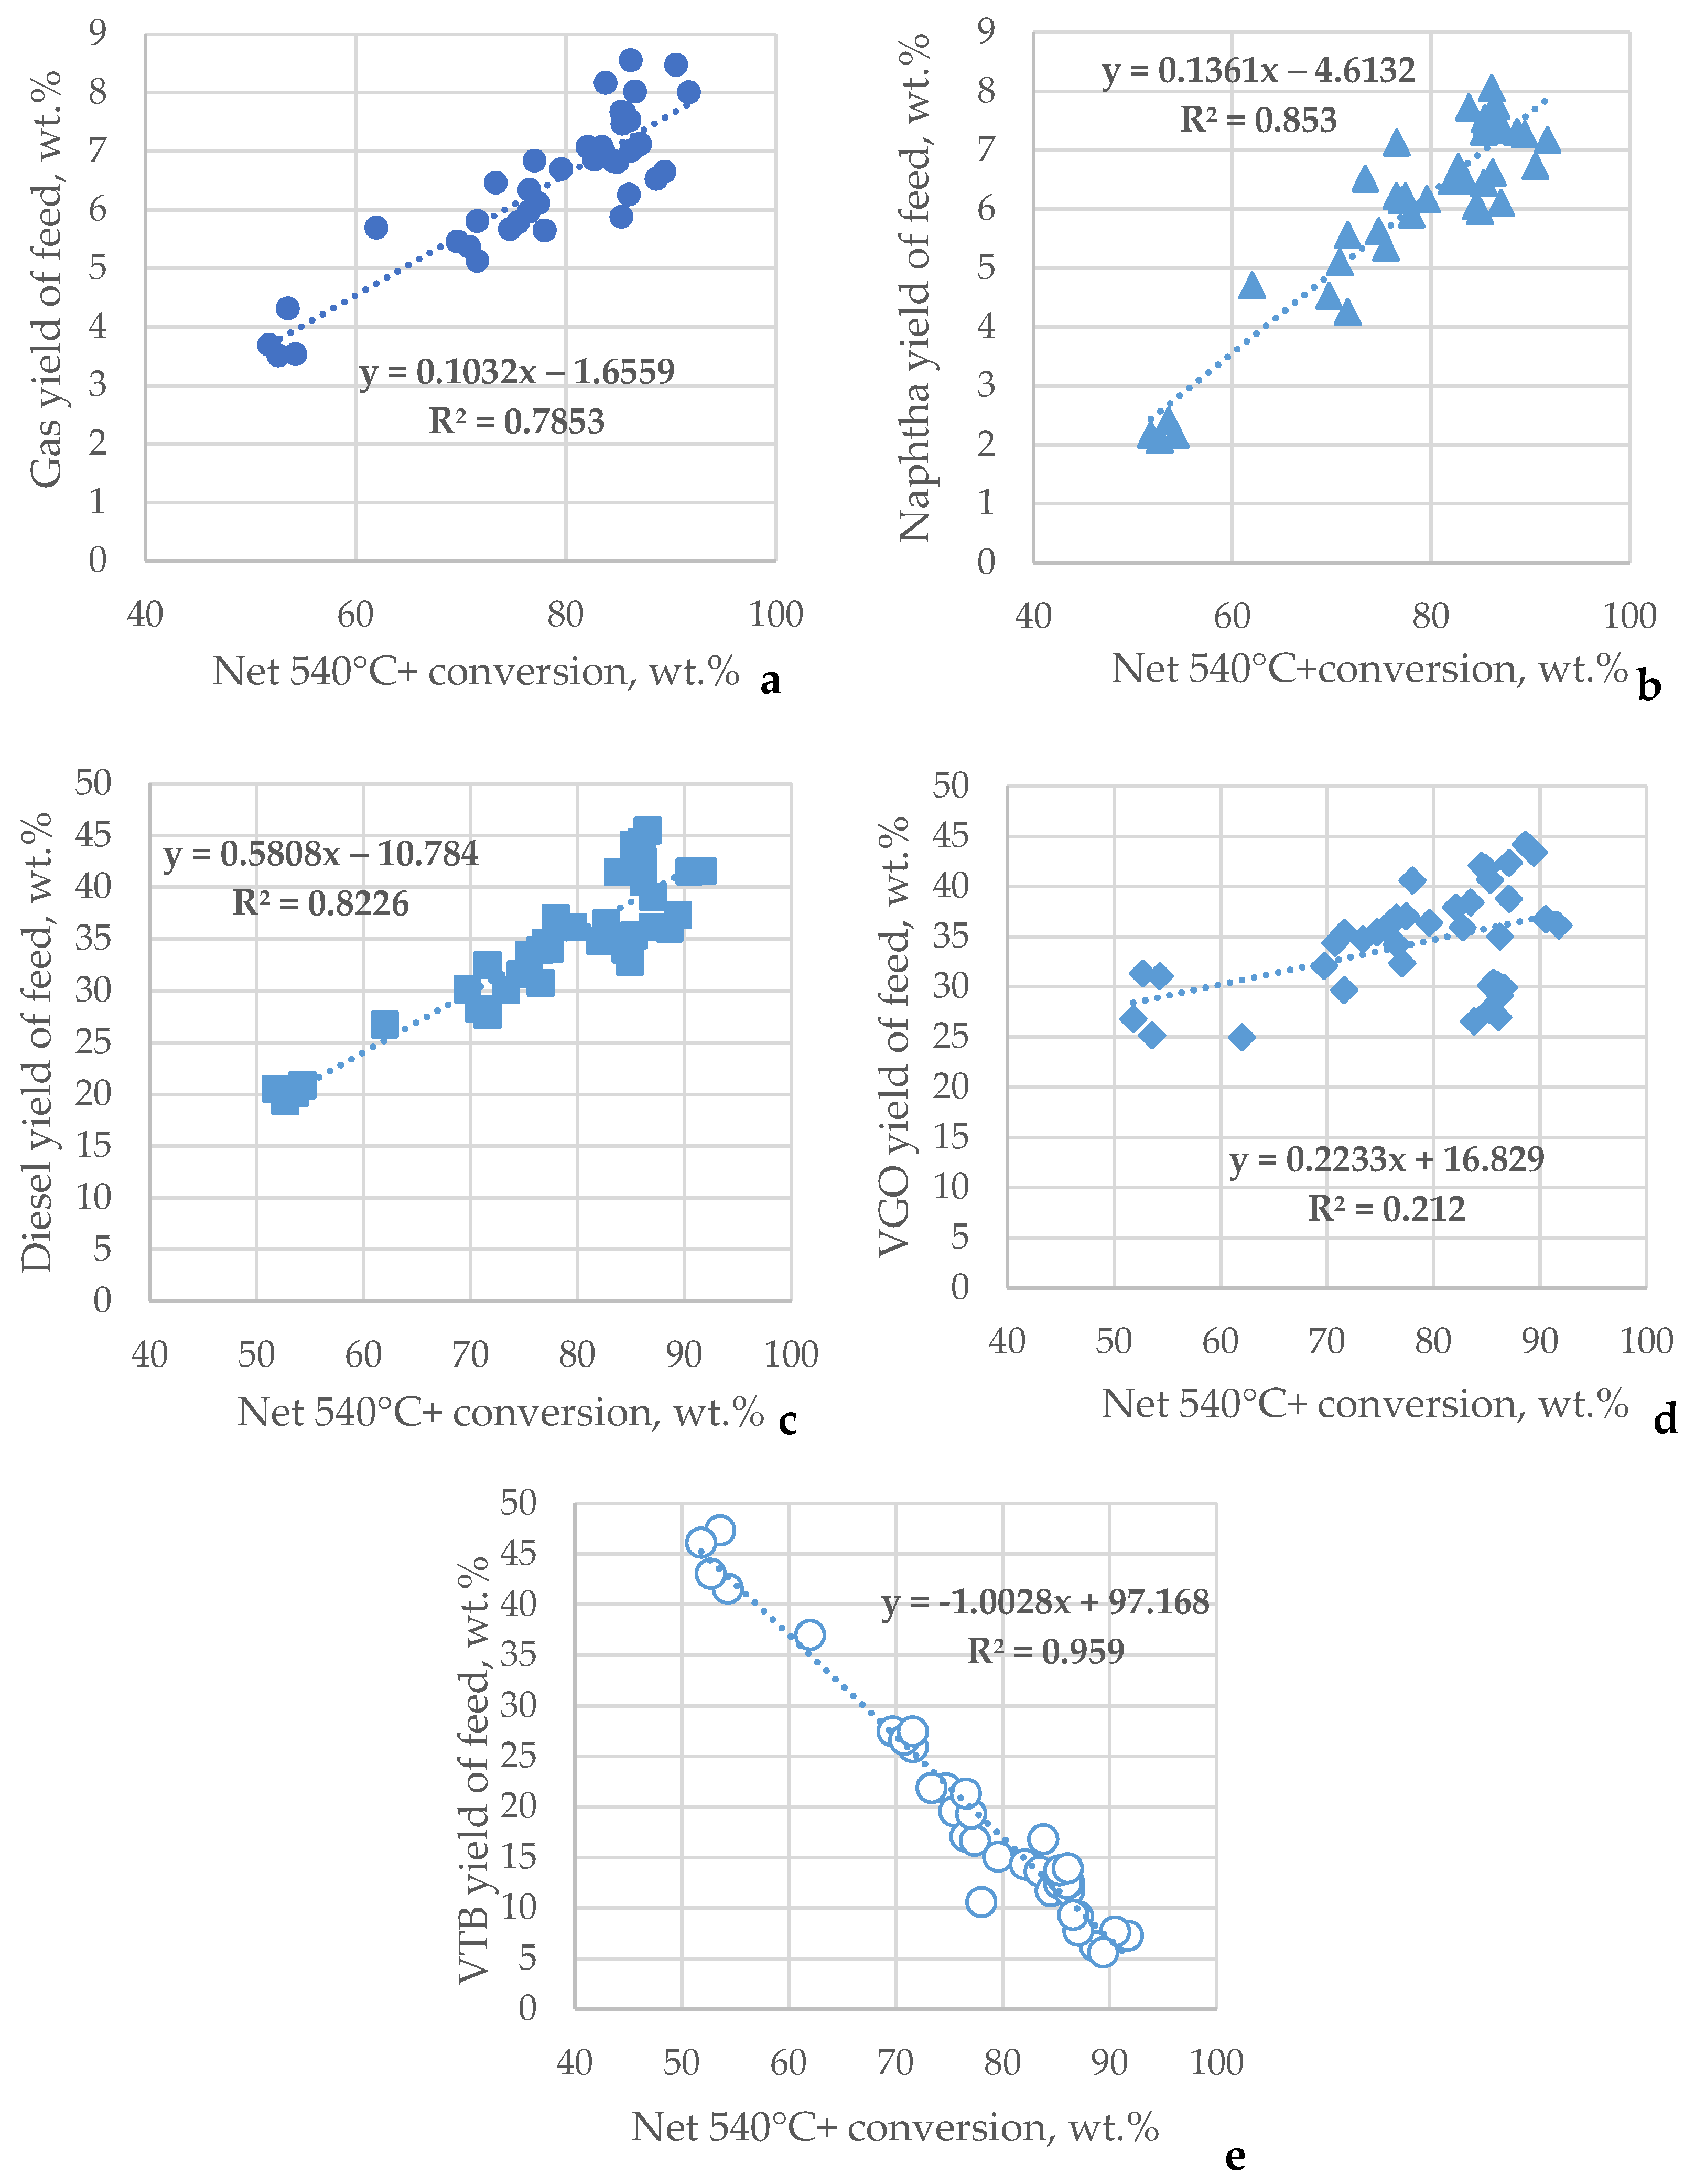
Figure 11 presents the graphs of the function of the yields of H-Oil gas, naphtha, diesel, VGO, and VTB yields of conversion. It can be observed in the data in Figure 11 that the yields of gas, naphtha, and diesel, which are primary and secondary stable products [10], increased, while the VTB yield decreased as conversion increased. The yield of VGO, which is a primary unstable product, should exhibit a decrease as conversion increases beyond 70 wt.%, as shown in our recent investigation [23]. The presence of a trend toward augmentation with conversion enhancement can be ascribed to the processing of VGO material in the H-Oil feed during the study.
Using the data in Table 4 and Tables S4–S9 and employing statistical analyses, the following regression equations for the yields of H-Oil gas and diesel products were established:
G a s   y i e l d = 0.113 + 0.554 × R e c y c l e + 0.518 × F C C   S L O   i n   F e e d   ( % ) + 0.072 × C o n v ,   wt . %    R 2 = 0.828
D i e s e l   y i e l d = 0.3144 × H O i l   F e e d   360 ° C + 0.181 × R e c y c l e + 0.428 × C o n v 2.25 , wt . %    R 2 = 0.872
V G O   y i e l d = 0.2188 × V G O   i n   H O I L   F e e d   % + 0.128 × C o n v ,   wt . %    R 2 = 0.44
where:
Recycle = Recycled PBFO, % of H-Oil feed;
FCC SLO in Feed (%) = Share of FCC SLO in H-Oil feed, % of H-Oil feed;
HOil Feed (360 °C) = Content of fraction boiling below 360 °C in H-Oil feed, % of H-Oil feed;
VGO in H-Oil Feed (%) = Content of VGO material in H-Oil feed, % of H-Oil feed;
Conv = Conversion as calculated by Equation (1).
The remaining yields of naphtha and VTB depended only on conversion by the regression equations embedded in Figure 11b,e.
It should be noted here that none of the H-Oil catalyst properties not shown in this work due to confidential reasons exhibited any statistically meaningful relationships with sediment formation or fouling rates or with the conversion level or product yields.

3.2. Investigation of Fluid Catalytic Cracking (FCC)

The operating conditions and calculated parameters from the heat balance of the FCC unit for the cases studied are summarized in Table S12, and the conversion and product yields obtained fromt the FCC unit for cases studied are presented in Table S13.
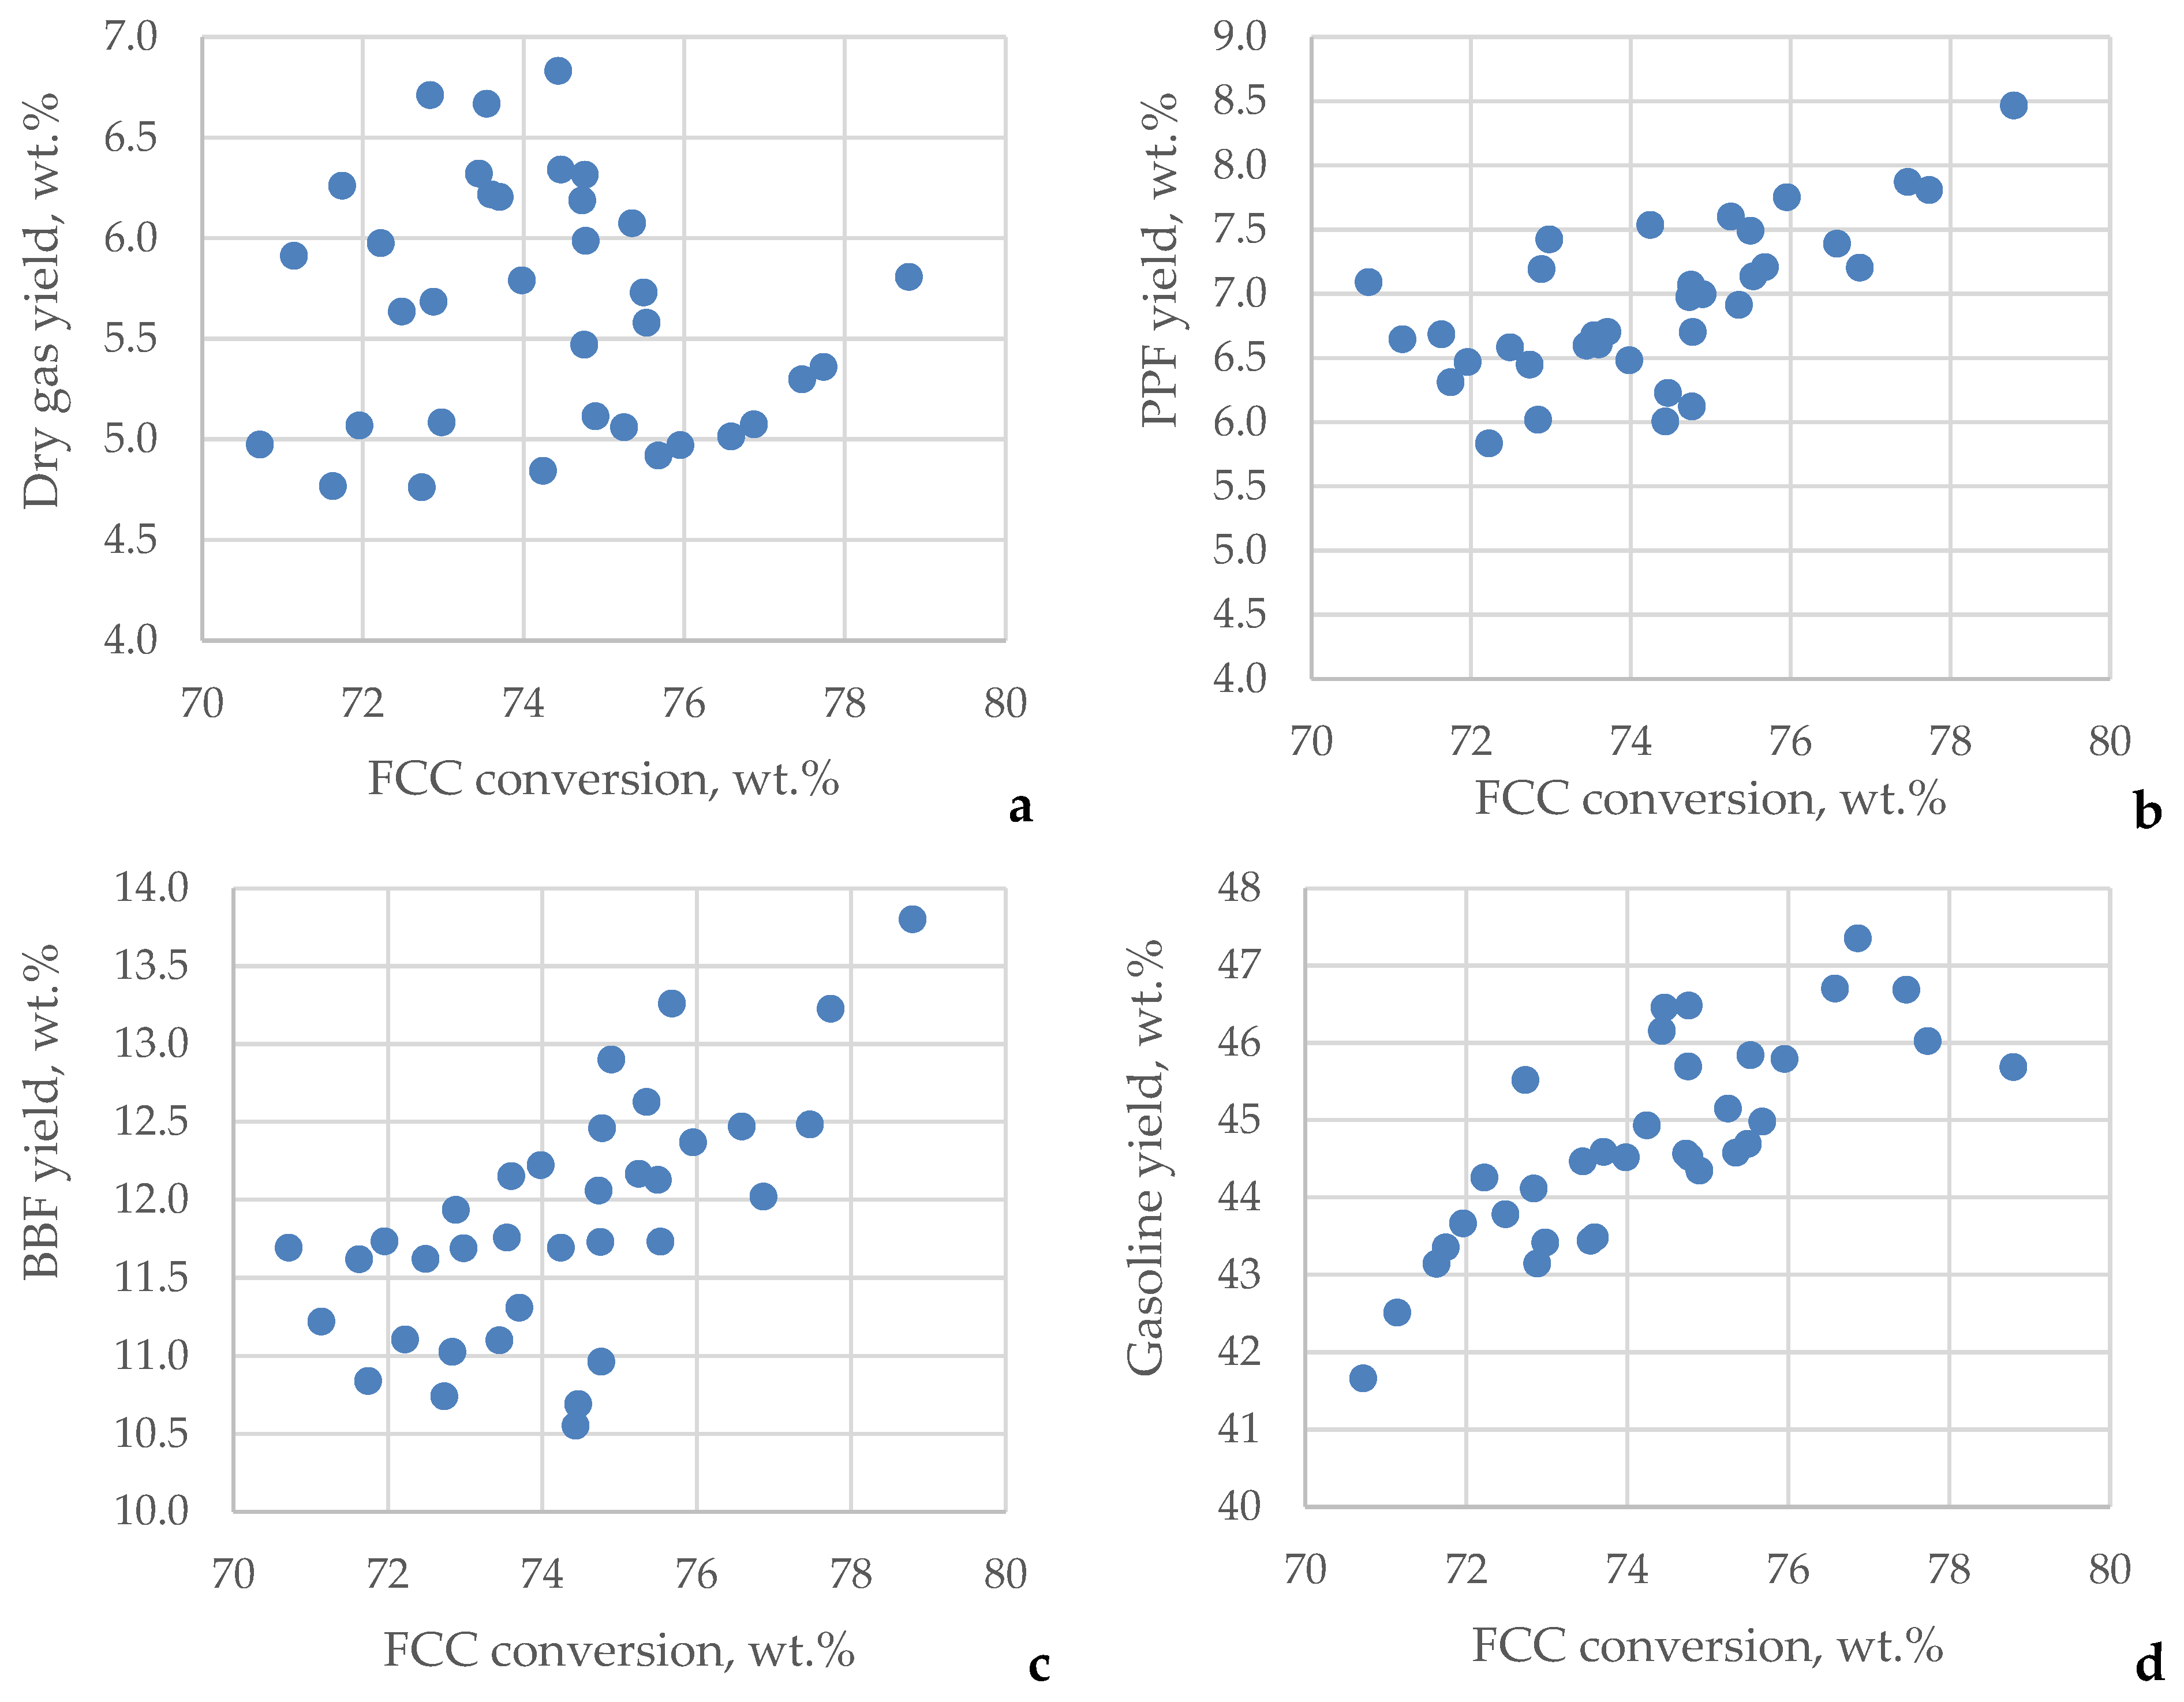
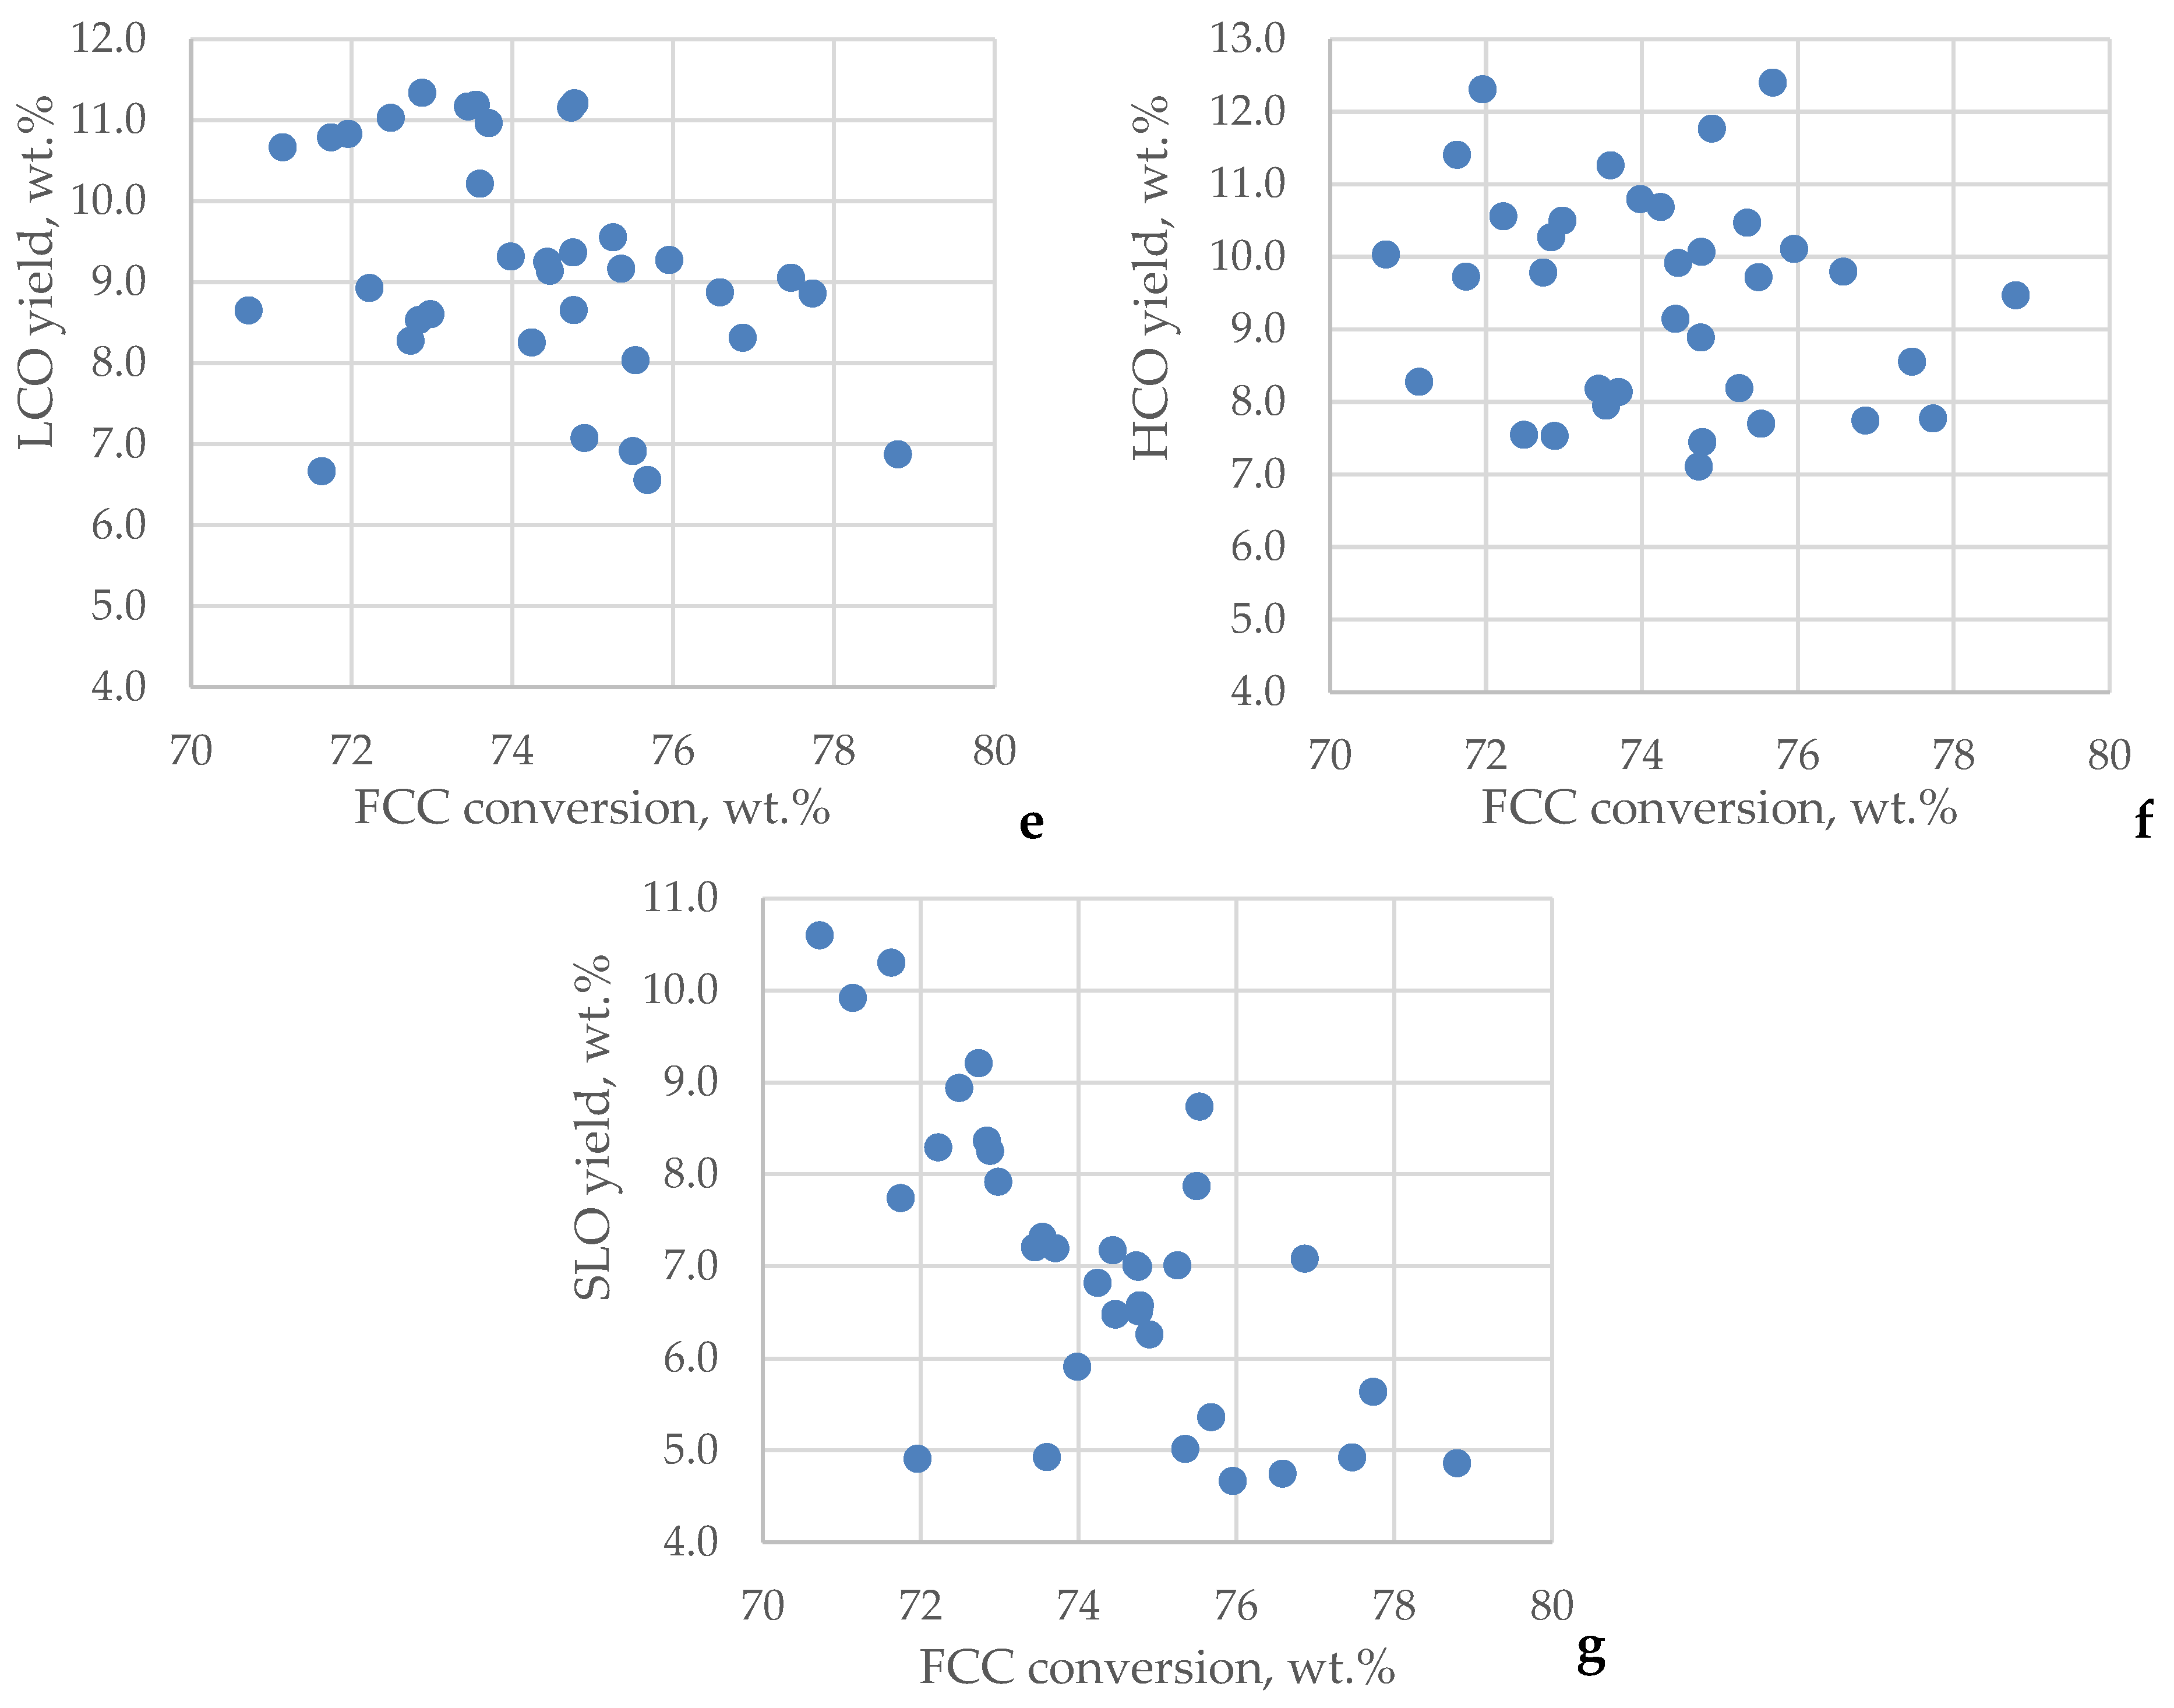
Figure 12 plots the variation of the FCC product yields as conversion changed.
Figure 12a indicates that yield of dry gas did not change with the conversion variation, supporting the thermal cracking nature of this product [45]. The PPF, BBF, and gasoline yields show an increasing trend with increasing conversion, while the LCO and SLO yields exhibited a decreasing trend with conversion augmentation. The HCO yield demonstrated a difficult-to-distinguish trend of reduction as conversion increased. The reason for the relatively large dispersion in the data of the yields of FCC gas oils may be attributed to the various separation efficiencies of the FCC main fractionator, the FCC gasoline stabilizer, and the section of absorption and gas fractionation in this study. This is related to the production of different grades of finished automotive gasoline and diesel fuels.
Tables S14 and S15 present the μ and υ values of ICrA evaluation of the relationships between the FCC performance variables and the H-Oil performance variables. The data in these tables indicate that the H-Oil conversion level showed a statistically meaningful positive association with the density of H-Oil VGO that was processed in the FCC unit; with coke yield, Δ coke; and with FCC HCO yield, as well as a statistically meaningful negative association with the FCC LCO yield.
This implies that increasing the H-Oil conversion is associated with an enhancement of the coke yield, Δ coke, and the FCC HCO yield, along with a decrease in the FCC LCO yield.
The TSP of PBFO showed a statistically meaningful negative association with the FCC HCO yield, meaning that a decrease in the HCO yield is accompanied by an increase of PBFO TSP.
The content of FCC SLO in the H-Oil feed had a statistically meaningful negative association with FCC conversion and a statistically meaningful positive association with the FCC SLO yield. This suggests that an increase in FCC SLO content in the H-Oil feed is accompanied by a decrease in the FCC conversion and an increase inthe FCC SLO yield. This may also imply that the FCC SLO does not convert in the H-Oil unit, and the recycling of this material between the H-Oil and FCC unit occurs. This finding supports Marques et al.’s [46] observation that the FCC SLO material was refractory to hydroconversion under ebullated bed hydroconversion conditions.
The content of the H-Oil VGO in the FCC feed had a statistically meaningful negative association with FCC conversion and FCC gasoline and a statistically meaningful positive association with the FCC SLO yield. This means that the enhancement of the H-Oil VGO share in the FCC feed is accompanied by FCC conversion reduction, a drop in the gasoline yield, and an increase in the FCC SLO yield.
The FCC conversion was found to depend on only two variables for the studied cases, and these were the content of H-Oil VGO in the FCC feed and the content of FCC SLO in the H-Oil feed. The dependence of FCC conversion on content of H-Oil VGO in the FCC feed and content of FCC SLO in the H-Oil feed is shown in Equation (14).
F C C   c o n v = 79.8 0.162 × F C C   S L O   i n   H O i l   F e e d   % 0.157 × H O i l   V G O   i n   F C C   f e e d   ( % ) ,   wt . %    R 2 = 0.64
where:
FCC conv = FCC conversion, wt.%;
FCC SLO in HOil feed (%) = content of FCC SLO in H-Oil feed, wt.% of H-Oil feed;
HOil VGO in FCC feed (%) = content of H-Oil VGO in FCC feed, wt.% of FCC feed.

4. Discussion

4.1. Discussion of the Results of the Investigation of H-Oil Vacuum Residue Hydrocracking

Using the data shown in Table 1 and Table 2 and in Figure 4, one can easily calculate the range of the variation of properties of the primary vacuum residual oil blend treated in the H-Oil hydrocracker. This, along with reactivity index, which presents the ratio of the vacuum residue hydrocracking reactivity to the reactivity of the Urals vacuum residue, is shown in Table 5. The reactivity index (RI) was calculated using the data shown in Table 2 and following the procedure described in our recent study [23].
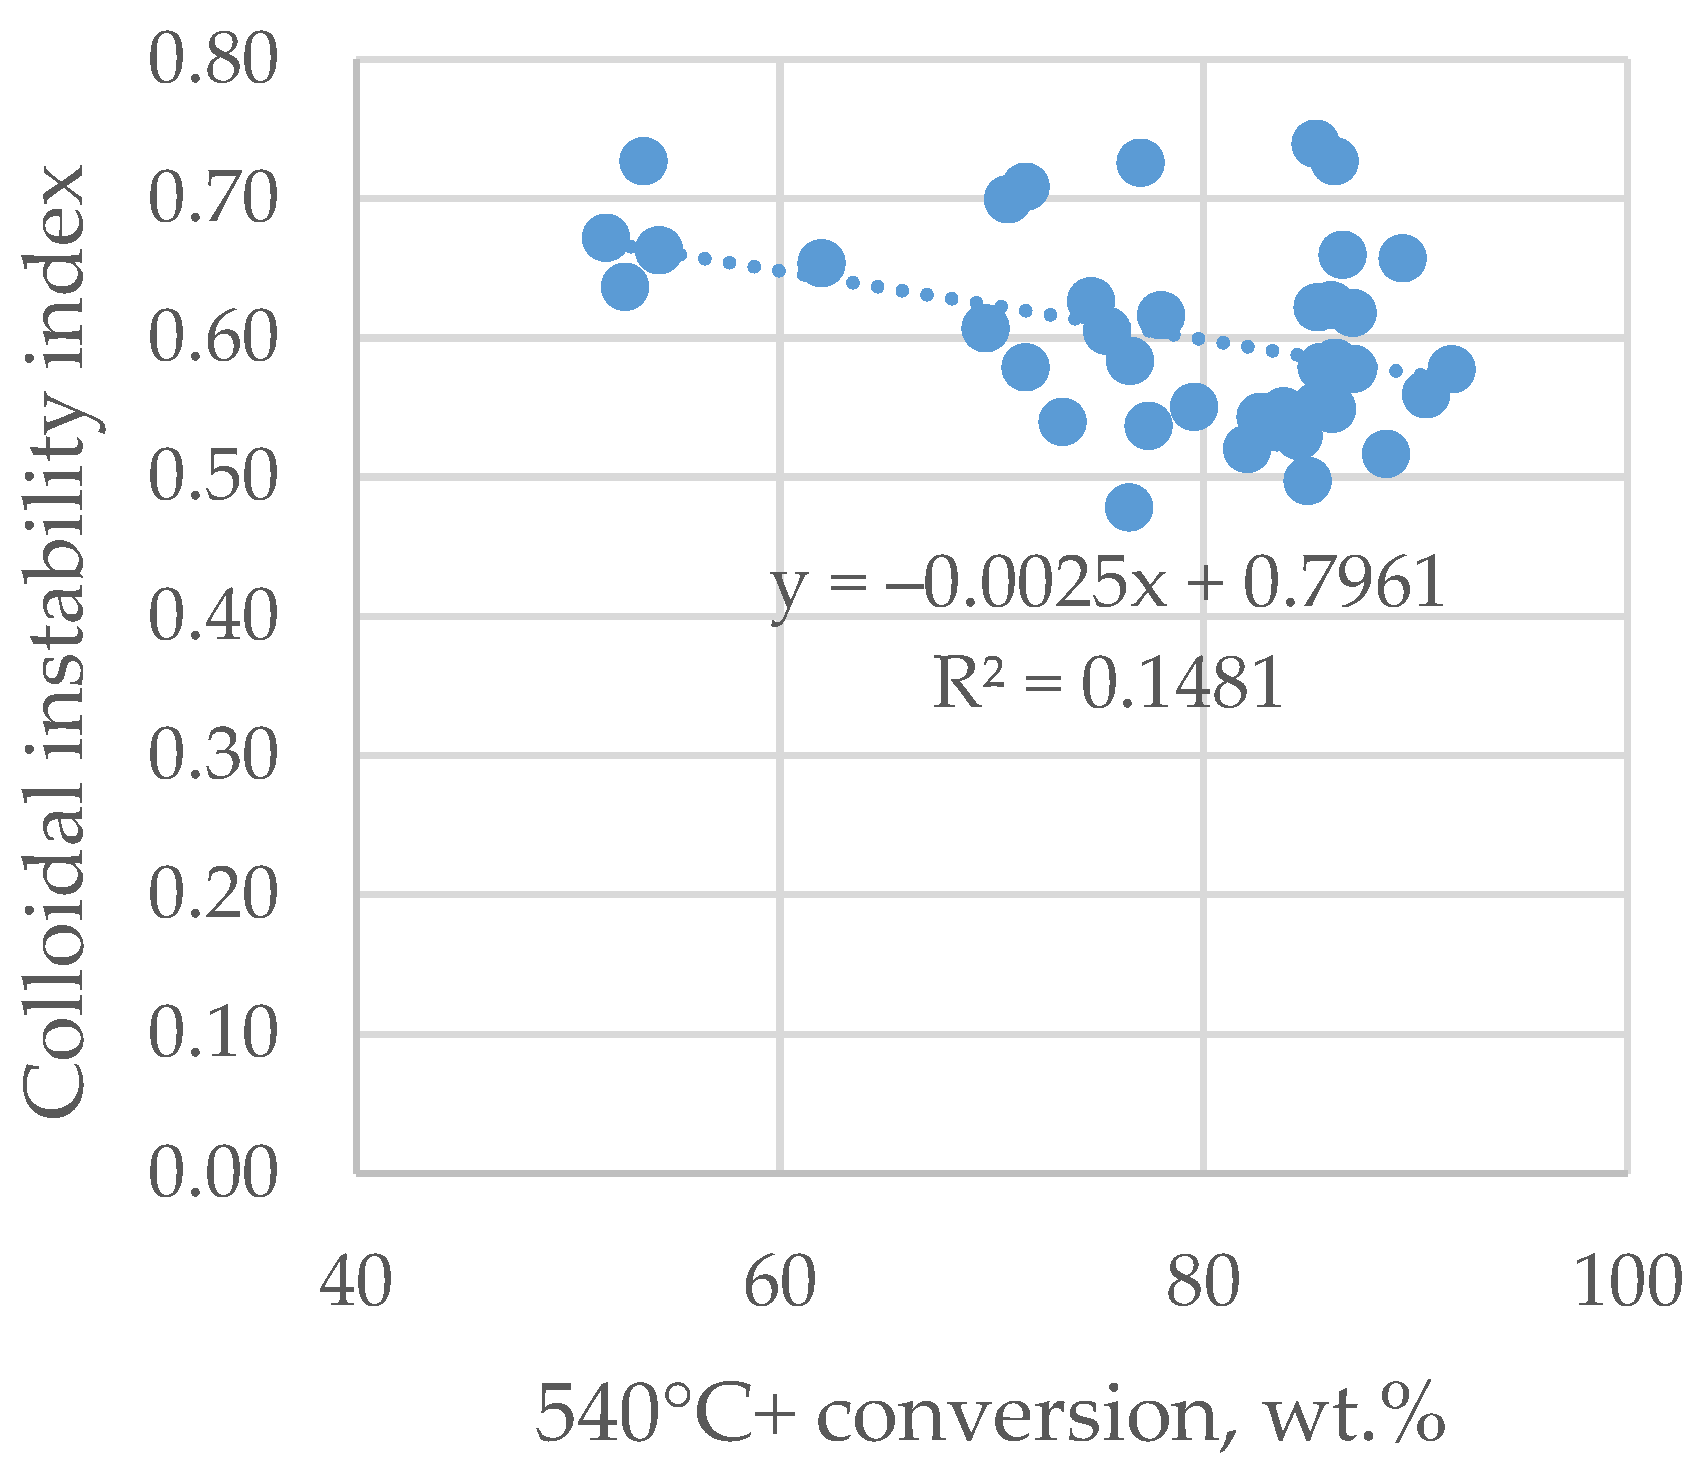
It is obvious from data in Table 5 that the reactivity of the primary vacuum residual oil blend treated in the H-Oil unit in the study was the same. Using the data in Table S4, the range of the variation of the RI of the H-Oil feed for the 40 cases explored was estimated, and it was established that the RI of the H-Oil feeds varied between 0.97 and 0.99, which means that practically no variation occurred in the H-Oil feed RI compared with that of the primary vacuum residual oil mixture. An interesting observation made in our earlier research [23] was that the vacuum residual oils with the same RI were expected to have the same sediment formation rate. Thus, we can expect that the processed H-Oil feeds for the 40 cases studied have the same sediment formation affinity. Therefore, we may deduce that the processed H-Oil feeds for the 40 cases studied should have the same sediment formation affinity. Indeed, the data in Figure 5 confirm that the ATB sediment content was almost the same, with some small variations. The curiosity in this case is that the ATB TSE was almost the same but at a different reaction temperature. Moreover, it is known that sedimentation increases exponentially with reaction temperature magnification [42,43]. Such an increase in the sediment formation rate with an increase in reaction temperature cannot be seen in the data in Figure 5. This may be attributed to the suitable catalyst addition rate strategy and the application of a parallel mode of fresh catalyst addition, as discussed in our recent research [31]. Sediment formation affinity during vacuum residue hydrocracking has been the subject of numerous investigations [36,37,38,39,40,41,42,43]. Alonso et al. [47] classified residual oil hydrocracking feeds as high-, medium-, and low-sediment formation feeds. They reported that the high-sediment formation feeds originated from heavy and extra-heavy crude oils. The medium sediment formation feeds originated from medium crude oils, and the low sediment formation feeds originated from light crude oils [47]. In our study, the crude oils processed were extra light, light, and medium, as apparent in the data in Table 1. Thus, light and medium sediment formation affinity may be expected during the processing of vacuum residual oils originating from the nine crude oils investigated in this study according to Alonso et al.’s [47] classification. However, Alonso et al. [47] also showed that the sediment formation rate increased exponentially as conversion was enhanced. The conversion level variation, as observed in data in Table S3, was between 51.8 and 91.7 wt.%, while the sediment content in the H-Oil ATB product (TSE), as seen in data in Figure 5, varied in a relatively narrow range between 0.02 and 0.46 wt.%. The colloidal instability index of the H-Oil VTB ( C I I = S a t u r a t e s + A s p h a l t e n e s A r o m a t i c s + R e s i n s ) used to evaluate the colloidal stability and hence the sediment formation affinity [48], as indicated in data in Figure 13, did not show any trend twoard enhancement as conversion increased, supporting the observed lack of sediment augmentation with the increase in conversion.
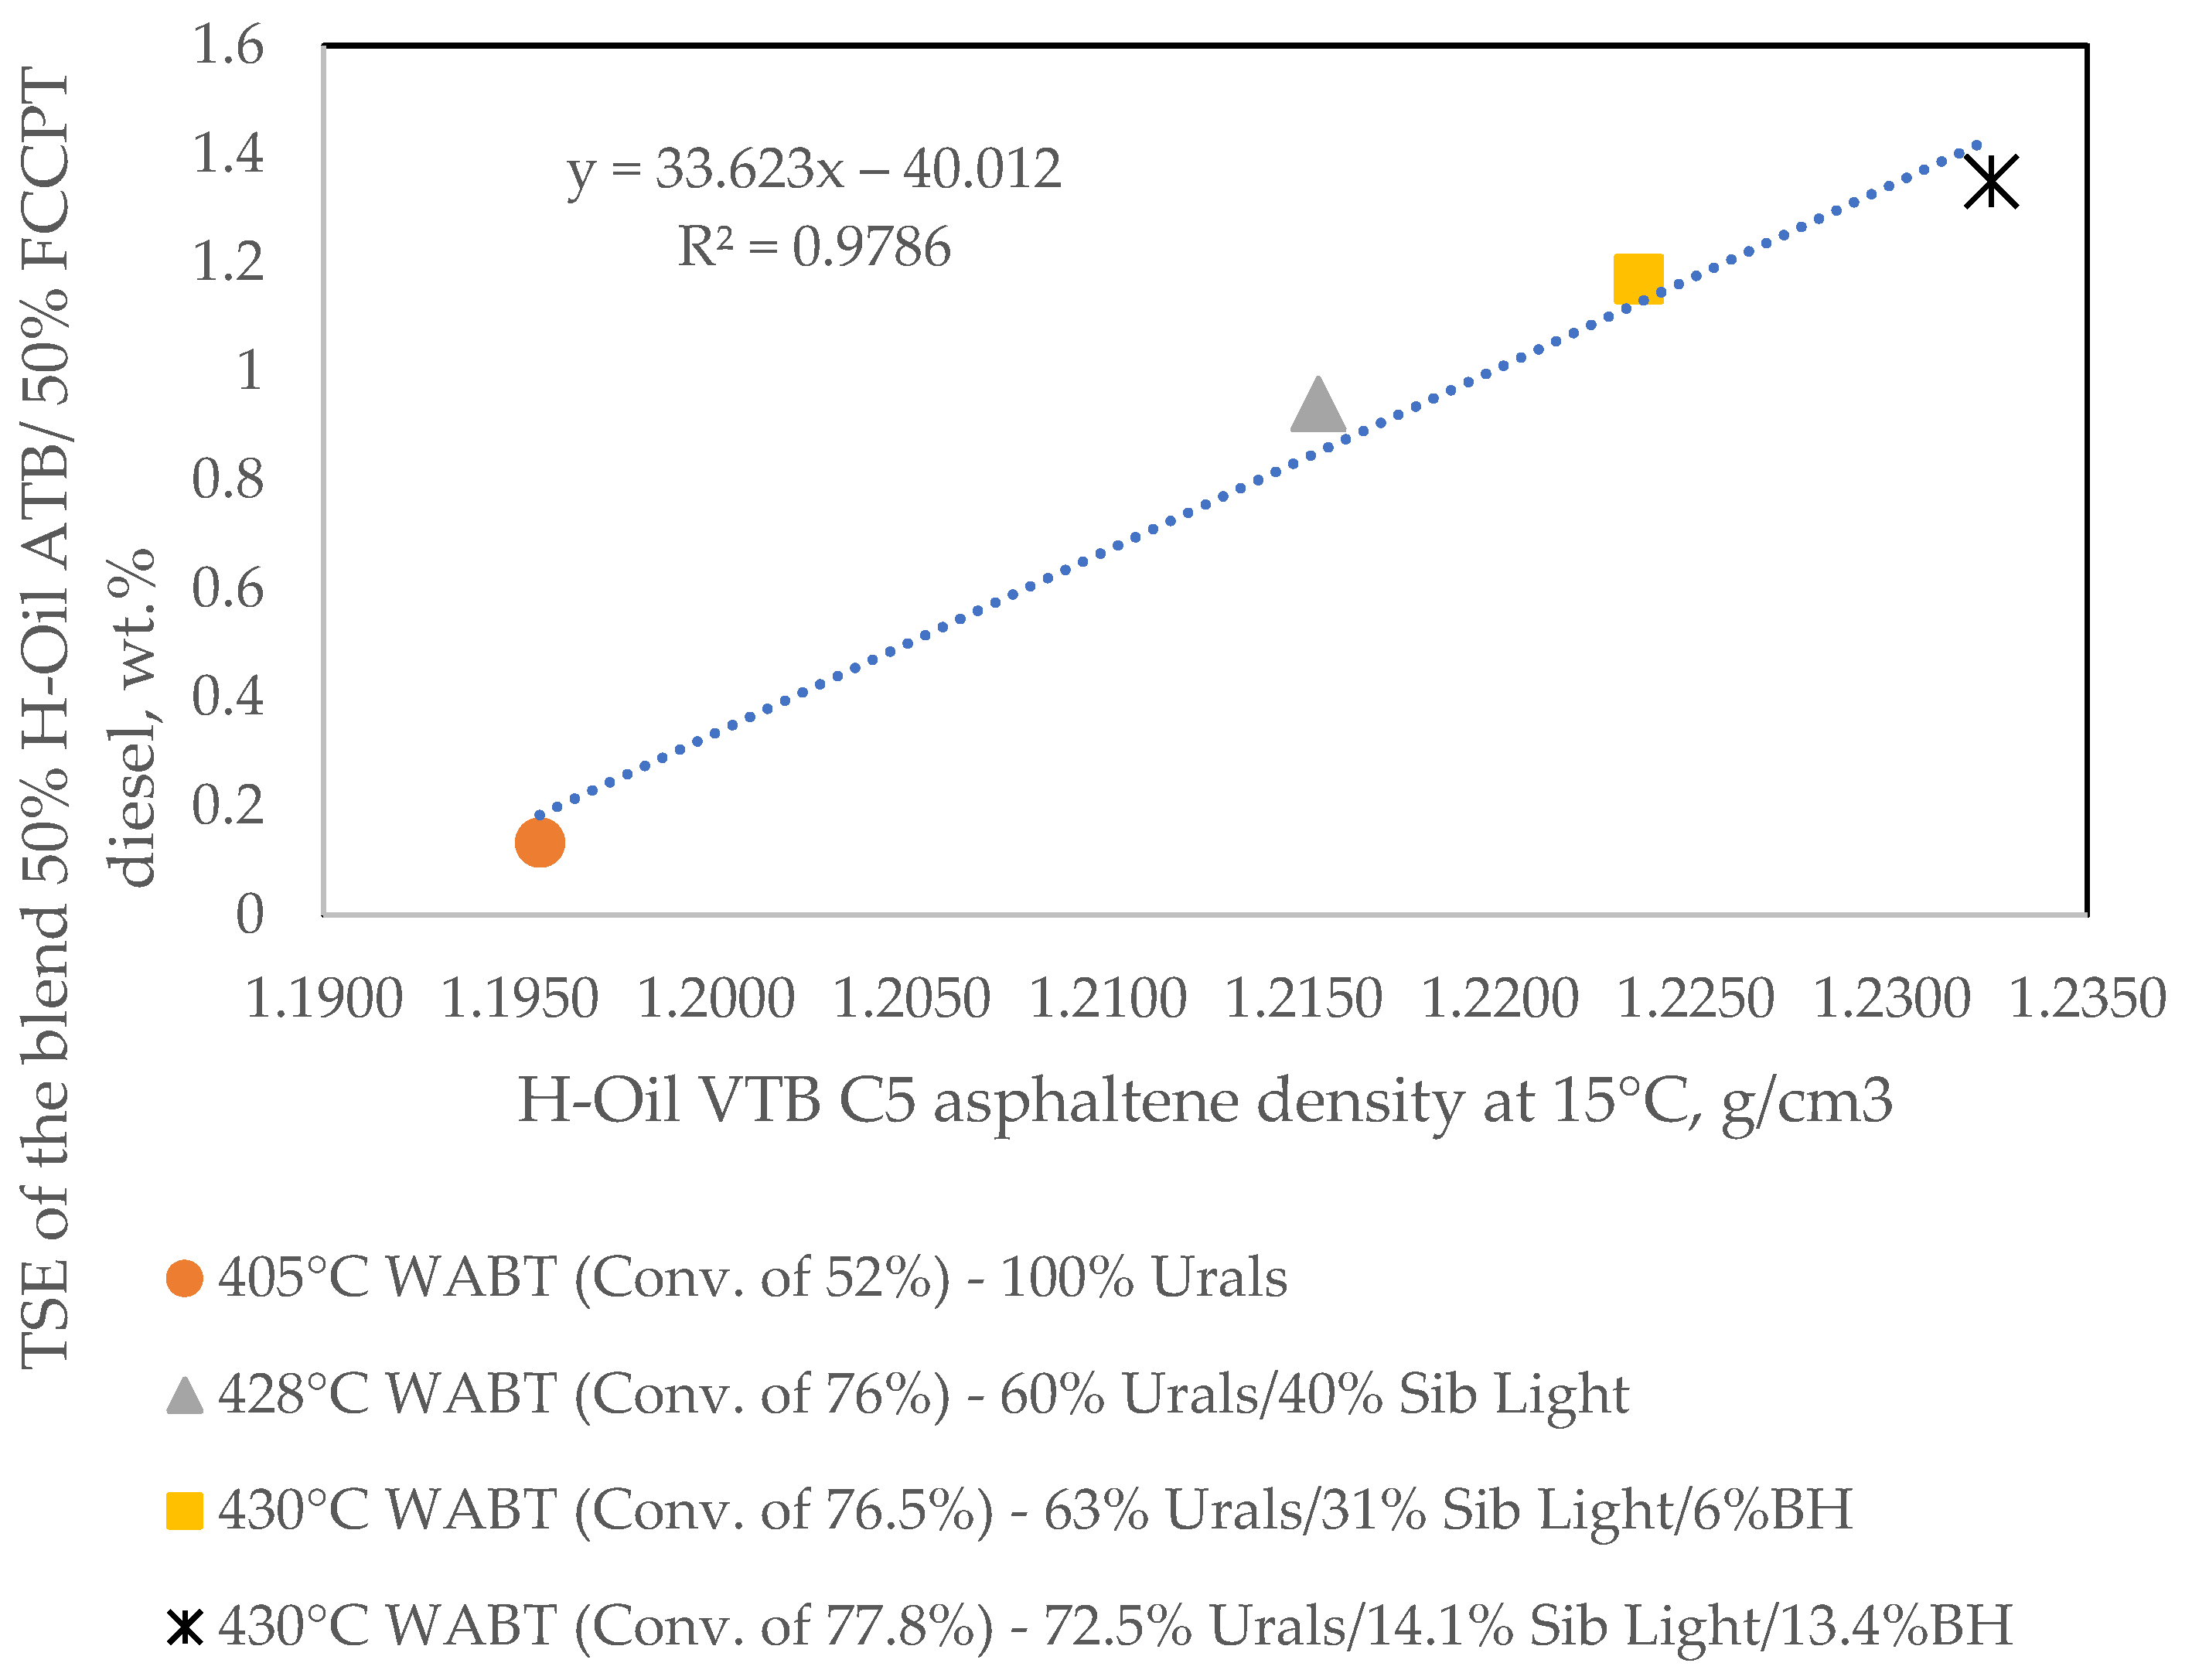
The increase in conversion, as shown in the data in Figure 9b, was accompanied by VTB density enhancement. As the density of VTB was correlated with the density of asphaltenes, as reported in our recent research [23], the density of asphaltenes is expected to grow with conversion magnification. Their higher density is related to their lower solubility, as discussed in our earlier study [49], and when blended with more paraffinic oil, they may facilitate the process of sediment formation. This hypothesis was verified with the experimental data on blending 50% of four H-Oil VTBs obtained at different reaction severities during the processing four different vacuum residual oil blends with 50% higher paraffinic FCCPT diesel. The data in Figure 14 clearly indicate that C5 asphaltene solubility, judged by its density, was correlated with the sediment content of the blend of 50% H-Oil VTB/50% FCCPT diesel.
Therefore, one may conclude that during conversion increment the asphaltenes become denser and less soluble, but at lower saturate concentration in the VTB, they do not have the driving force to flocculate and precipitate. The conversion enlargement is associated with saturate reduction due to their cracking, and although the asphaltenes concentrate in the VTB, the colloidal instability index does not grow. This might be a plausible explanation for the observed lack of an increase in the sediment formation rate as conversion was enhanced. Actually, the stability of asphaltenes and its relationship to sediment formation is much more complex than the oversimplified explanation given above, and it has been shown to depend on asphaltene structure [50,51,52,53,54,55,56,57,58,59,60], the presence of impurities [50,58], free radicals [59], the content of metals [60,61], the solubility of asphaltenes, and the solubility power of the maltene fraction [62,63,64,65,66,67]. An investigation by Dreillard et al. [24] also shoed that the hydrocracked residue sediment content at a high conversion depended not on asphaltene solubility, which was low, but on its concentration. The intricate matter of sediment formation is very well illustrated by the data shown in Figure 7. The data in Figure 7 indicate that the best sediment formation suppressor of the VTB obtained at a low severity (WABT of 405 °C) is the FCC HCO. This observation coincides with the findings of our resent research [18], indicating that FCC HCO was also the best sediment formation suppressor of the VTB obtained at a high severity (WABT of 430 °C) when Urals and Sib Light-derived vacuum residues were processed in H-Oil hydrocracker. However, when Basrah Heavy vacuum residue at a concentration of about 14% was processed along with Urals and Sib Light-derived vacuum residues, the FCC LCO became the best sediment formation suppressor of the VTB obtained at a high severity (WABT of 430 °C). Our first investigation dedicated to sediment formation in H-Oil hydrocracking demonstrated that among the high aromatic FCC gas oil diluents, there was no difference in their sediment formation inhibition when they were added to the H-Oil VTB [17]. Marques et al. [46] announced that poly-condensed tri-, tetra-, and penta- aromatics containing in FCC SLO retard the sediment formation rate during Urals vacuum residue hydrocracking. If we take a look at the data on the diluents used in this study (Table S2), we can see that the aromatic ring index (ARI)—a correlation developed by Abutaqiya et al. [68] to relate the refractive index and molecular weight of nonpolar hydrocarbons to the average number of condensed aromatic ring structures—of FCC SLO is 3.6, which coincides with the one obtained by data reported by Marques et al. [62]. The results reported in Figure 7 and Table S2, however, show that the FCC HCO with an ARI of 2.4 was much more efficient in the process of sediment formation retardation than the FCC SLO or the FCC LCO with an ARI of 1.5. Therefore, in this case, the polycondensed di- and tri- aromatics contained in the FCC HCO seem to be more efficient in sediment formation inhibition than the mono- and di-aromatics contained in the FCC LCO and the tri-, tetra-, and penta- aromatics contained in the FCC SLO. In a study by Tirado and Ancheyta [69], it was shown that mainly di-aromatics containing in the FCC LCO were the best suppressors of sediment formation during the hydroprocessing of a heavy crude oil. The results of Tirado and Ancheyta [69] indicated that the addition of 10 wt.% of FCC SLO led to more sediment formation than the hydrocracking of pure vacuum residue, which is a very convincing indicator of the very complex matter of sediment formation during vacuum residue hydrocracking. Understandably, such a process is very difficult to model and fully comprehend.
Another interesting observation was made during this study, and it was related to the content of metals in the hydrocracked vacuum residue (VTB) obtained at a low H-Oil reaction severity (WABT of 405 °C). The balance of aluminum over the H-Oil unit showed a higher amount of aluminum leaving the H-Oil unit with products than coming in with the vacuum residue feed. We hypothesized because of the lower viscosity of the oil in the H-Oil reactors, catalyst fines could be entrained with the hydrocracked vacuum residue (VTB) product. To verify this hypothesis, we measured the metal level in the VTB before and after filtration in the apparatus for the hot filtration test, and the results shown in Table S8 indicated that the metal level in the H-Oil VTB after filtration was considerably lower. The same procedure was applied to a sample of H-Oil VTB obtained at high reaction severity (430 °C), and the results showed no differences in metal level between the non-filtrated and filtrated samples, suggesting that operation at a low severity is conducive to the entrainment of catalyst fines, with the hydrocracked vacuum residue increasing its metal content.
While the sediment formation in vacuum residue hydrocracking depends on many factors, conversion enhancement maily depends on two process variables: reaction time (throughput) and reaction temperature. The feedstock quality also affects conversion level, as discussed in [23]. However, as mentioned at the beginning of this section, the quality of the mixed feed processing during this study did not vary substantially. Therefore, the process variables (reaction time and reaction temperature) were the only factors controlling the vacuum residue conversion. These two factors participate in the three models developed in this work to predict the conversion (see Equations (2), (8) and (9)). The data in Figure 8 and Table 4 suggest that the plug flow (Equation (8)) model had the highest accuracy of vacuum residue conversion in the LNB commercial ebullated bed H-Oil hydrocracker in comparison with the CSTR model (Equation (2)) and the linear regression (Equation (9)). The data in Figure 8 show some points with relatively a high dispersion for all three models. One may suppose that this high dispersion data concern the processing of feeds with different levels of quality. In fact, the main H-Oil feedstock was vacuum residue from Urals or a blend of Urals with Siberian Light, and the maximum content of other vacuum residues originating from different crudes was not higher than the 30% from the commissioning of the LNB H-Oil hydrocracker in 2015 [23]. For this reason, the effect of feedstock on the relatively high deviation of observed conversion from the predicted one should not be considered. Of 121 datasets, 5 (4% of total data set) exhibited high deviation between the observed and predicted conversion. These data are related to the initial exploitation of the H-Oil hydrocracker, and therefore, a suspicious incorrect measurement of the quantity of feed and products might be the reason for this high deviation during the first stages of H-Oil exploitation.
Figure 9 indicates that molecular weight of hydrocracked vacuum residue fell and the density grew as the conversion increased, which is easily explained by the cracking of the aliphatic (paraffinic and naphthenic) moieties, leaving a lower-molecular-weight, higher-aromatic unconverted hydrocracked vacuum residue. This observation is in line with the findings reported by Dreillard et al. [24].
The data in Figure 10 suggest not only that the hydrocracked vacuum residue cracked in the H-Oil process, making it denser and more aromatic as reaction proceeded, but also that the three gas oil fractions: HVGO, LVGO, and HAGO were subject to secondary cracking, making them denser and more aromatic. Surprisingly, for the studied period, no statistically meaningful relationships between H-Oil VGO density and FCC conversion were found, irrespective of the wider range of H-Oil conversion variation and the consequent alteration of H-Oil gas oil densities. The scope of the alteration of the density of H-Oil HAGO, LVGO, and HVGO for the studied period estimated from the VTB density data shown in Table S6 and the regression equations embedded in Figure 10 is presented in Table 6.
The H-Oil product yields variation during the study shown in Figure 11 indicate that they depend mainly on conversion level but also on the content of recycled material, FCC SLO, material boiling at up to 360 °C, and VGO in the H-Oil feed. Thus, by varying the content of these H-Oil feed components to different extents, a distinct product yield slate can be obtained.

4.2. Discussion the Results from the Investigation of the Fluid Catalytic Cracking (FCC)

The data in Table 3 exhibit a relatively wide variation in the quality of the FCC feedstock of SRVGOs originating from the nine crude oils processed in the LNB refinery in the study. Irrespective of the wide range of the variation of density (between 0.884 and 0.949 g/cm3) and the related content of saturates plus mononuclear aromatics (between 61 and 83.1 wt.%, see Table 3), which determines the FCC feedstock crackability [70], the density of the blended SRVGOs estimated on the basis of the data in Table 1 and Table 3 and the data in Figure 1 shows a very narrow variation between 0.913 and 0.922 g/cm3. This range of the variation of density corresponded to variation in the contents of saturates plus mononuclear aromatics between 70.3 and 73.3 wt.%, which is within the uncertainty of its determination. Therefore, the variation of the quality of the SRVGO as an FCC feed should be considered negligible.
The dispersion of the data in Figure 12 showing the relationship between the yields of dry gas, the propane–propylene fraction (PPF), the butane–butylene fraction (BBF), gasoline, LCO, HCO, and SLO and the FCC conversion is considerably higher than that observed in the H-Oil investigation (for comparison, see Figure 11). The reason for this high dispersion is the variable efficiency of the separation columns in the FCC unit, which was affected by the high natural gas prices, requiring maximum extraction of dry gas from the FCC unit while penalizing the quality of separation between dry gas and PPF. The production of different grades of gasolines with different specifications also affected the efficiency of the separation between gasoline and BBF and between gasoline and LCO.
In our previous research [23], we found that severity of the H-Oil unit affected FCC conversion and the regenerator temperature, whereas in this study, the only relationship between the quality of H-Oil gas oil, expressed by its density, and the FCC unit performance was the regenerator temperature (see Figure 15).
Probably, the reconstruction of the FCC unit implemented in late 2021 and discussed in our recent research [26] affected the performance of the FCC unit in a way that was less dependent on the severity of the H-Oil operation. Now, as regression Equation (13) shows, the FCC conversion for the operation condition window displayed in Table S13 is correlated with the amount of H-Oil VGO processed in the FCC unit and the amount of FCC SLO processed in the H-Oil unit. The optimization of the quantity of the FCC SLO processed in the H-Oil unit, considering its inhibiting impact on the sediment formation rate, can deliver higher FCC conversion while keeping the sediment formation rate and fouling in H-Oil hydrocracker within reasonable limits.

5. Conclusions

Nine distinct crude oils belonging to the extra light, light, and medium petroleum crude types were refined as diverse mixtures in the LNB refinery to study the combined performance of the two most profitable processes: FCC of VGO and VR ebullated bed H-Oil hydrocracking. Although the qualities of the individual vacuum residues and vacuum gas oils originating from the nine processed crude oils significantly differed, those of the blended SRVRs and SRVGOs were almost the same. The difference in the quality of the H-Oil feed came from the distinct amount of co-processed FCC SLO, recycled PBFO, and VGO with SRVR. The variation in the quality of the FCC feed came from the diverse amount and quality of co-processed H-Oil VGO with the SRVGO. For the studied range of operating conditions and feed quality, the H-Oil conversion level was found to depend on only two process variables: feed throughput and WABT. Three models were developed using CAS Maple 2023 Academic Edition Software: regression, a CSTR model, and a plug flow reactor model to predict the H-Oil vacuum residue conversion. The conversion level was found to be modeled best by the plug flow reactor model with fitted parameters of k 0 = 4.42875 × 10 15 ; E A = 215 kJ/mol; n = 1.59. The H-Oil product yields were found to depend on the conversion level and content of FCC SLO, recycled PBFO, the material boiling below 360 °C, and VGO in the H-Oil feed. The sediment formation rate in the H-Oil unit did not exhibit the typical exponential increase as conversion increased irrespective of the asphaltene density enhancement and its solubility reduction. It was found that the asphaltene density was correlated with the sediment content of the blend of 50% H-Oil VTB/50% high paraffinic FCCPT diesel. The molecular weight of the hydrocracked vacuum residue decreased while its density increased as the vacuum residue conversion was enhanced in the H-Oil hydrocracker. The density of the H-Oil gas oils HAGO, LVGO, HVGO followed the trend of the H-Oil VTB density augmentation with conversion magnification. It was found that during the low severity mode of H-Oil operation, the entrainment of catalyst fines with the hydrocracked vacuum residue product occurred, leading toa higher metal level in this product.
Among all the variables of the studied window of operating conditions of the FCC unit, only the H-Oil VGO content in the FCC feed and the FCC SLO share in the H-Oil feed were found to control the vacuum gas oil conversion in the FCC process. The empirical models developed in this research are intended to be used for performance improvement of both FCC and H-Oil units, including the amelioration of energy consumption and, subsequently, CO2 emissions reduction.

Supplementary Materials

The following supporting information can be downloaded at: https://www.mdpi.com/article/10.3390/pr11113174/s1, Table S1: Composition of the partially blended fuel oil (PBFO); Table S2: Properties of diluents used to blend with H-Oil VTB obtained at very low severity (WABT of 405 °C) Table S3: Hydrodeashaltization (HDAs) extent, vacuum residue (540 °C+) conversion, hydrodemetallization extent (HDM), reaction temperatures in both rectors, and reactor temperature ΔT; Table S4: Properties of H-Oil feed; Table S5: High-temperature simulated distillation data of H-Oil feed; Table S6: Properties of H-Oil VTB; Table S7: High-temperature simulated distillation data of H-Oil VTB; Table S8: Content of metals in H-Oil feed and VTB; Table S9: H-Oil product yields obtained in the study of the 40 cases; Table S10: μ-Value of the ICrA of relationships of HDAs, HDM, conversion, reactor temperatures, ATB TSE, PBFO TSP, product yields, and H-Oil VTB properties; Table S11: υ-Value of the ICrA of relationships of HDAs, HDM, conversion, reactor temperatures, ATB TSE, PBFO TSP, product yields, and H-Oil VTB properties; Table S12: Operating conditions and calculated parameters from the heat balance of the FCC unit for the studied cases; Table S13: Conversion and product yields obtained from the FCC unit for the studied cases; Table S14: μ-Value of the ICrA of relationships of H-Oil performance variables and FCC performance variables; Table S15: υ-Value of the ICrA evaluation of relationships of H-Oil performance variables and FCC performance variables.

Author Contributions

Conceptualization, D.S. and I.S.; methodology, V.T.; software, D.D.S., S.N., and V.B.; validation, D.P.; formal analysis, S.V.; investigation, V.T. and D.S.; resources, K.A.; data curation, S.V.; writing—original draft preparation, D.S.; writing—review and editing, D.S. All authors have read and agreed to the published version of the manuscript.

Funding

This research was funded by the European Union’s NextGenerationEU through the National Recovery and Resilience Plan of the Republic of Bulgaria project № BG-RRP-2.004-0002, “BiOrgaMCT”.

Data Availability Statement

Data are contained within the article.

Conflicts of Interest

The authors declare no conflict of interest.

Nomenclature

AR Atmospheric residue
ATB Atmospheric tower bottom product
BBF Butane–butylene fraction
Basrah H Basrah Heavy crude oil
CAS Computer algebra system
CII Colloidal instability index
CN Cracked naphtha (gasoline)
CPC Caspian pipeline consortium
CSTR Continuous stirred tank reactor
D15 Density at 15 °C, g/cm3
FCC Fluid catalytic cracking
FCCPT Fluid catalytic cracking pretreater (feed hydrotreater)
HAGO Heavy atmospheric gas oil
HCO Heavy cycle oil
HDAs Hydrodeasphaltization
HDAs (C5) Extent of removal of C5 asphaltenes, %
HDAs (C7) Extent of removal of C7 asphaltenes, %
HDM Hydrodemetallization
HDS Hydrodesulfurization
HVGO Heavy vacuum gas oil
IBP Initial boiling point
ICrA Intercriteria analysis
LCO Light cycle oil
LHSV Liquid hourly space velocity
LSCO Light Siberian crude oil
LNB LUKOIL Neftohim Burgas
LVGO Light vacuum gas oil
MNA Mono-nuclear aromatics
MW Molecular weight
PBFO Partially blended fuel oil
PPF Propane–propylene fraction
Sat. Saturate content
SLO Slurry oil
SRVGO Straight run vacuum gas oil
SRVR Straight run vacuum residue
Sul. Sulphur content
T50 Temperature at 50% evaporate
T-R1001 Temperature in the first ebullated bed reactor
T-R1002 Temperature in the second ebullated bed reactor
TSE Total sediment existent, wt.%
TSP Total sediment potential, wt.%
TBP True boiling point distillation
VDU Vacuum distillation unit
VGO Vacuum gas oil
VR Vacuum residue
VTB Vacuum tower bottom product = hydrocracked vacuum residue
WABT Weighted average bed temperature

References

  1. Wang, Z.; Li, S.; Jin, Z.; Li, Z.; Liu, Q.; Zhang, K. Oil and gas pathway to net-zero: Review and outlook. Energy Strategy Rev. 2023, 45, 101048. [Google Scholar] [CrossRef]
  2. Gautam, R.; AlAbbad, M.; Guevara, E.R.; Sarathy, S.M. On the products from the pyrolysis of heavy fuel and vacuum residue oil. JAAP 2023, 173, 106060. [Google Scholar] [CrossRef]
  3. Bozuwa, J.; Burke, M.; Cox, S.; Skandierd, C.S. Chapter 8. Democratic governance of fossil fuel decline. In Book Energy Democracies for Sustainable Futures, 1st ed.; Nadesan, M., Pasqualetti, M.J., Keahey, J., Eds.; Elsevier Inc.: Amsterdam, The Netherlands, 2022; pp. 73–82. [Google Scholar]
  4. Merdrignac, I.; Espinat, D. Physicochemical characterization of petroleum fractions: The state of the art. Oil Gas Sci. Technol.-Rev. IFP 2007, 62, 8–29. [Google Scholar] [CrossRef]
  5. Refined Petroleum Products Market Size Share and COVID-19 Impact Analysis by Product Type (Diesel, Gasoline, Fuel Oils, Kerosene, and Others by Application (Automobile Power Generation), Chemicals and Others) by Fraction (Light Distillates, Middle Distillates, and Heavy Oils), and Regional Forecast, 2021–2028. Available online: https://www.fortunebusinessinsights.com/refined-petroleum-products-market-106456 (accessed on 7 August 2023).
  6. Sharikov, F.Y.; Rudko, V.A.; Smyshlyaeva, K.I. Oxidation thermolysis kinetics of asphaltenes with various chemical prehistory. Thermochim. Acta 2023, 726, 179550. [Google Scholar] [CrossRef]
  7. Iusovskii, A.; Boldushevskii, R.; Mozhaev, A.; Shmelkova, O.; Pavlycheva, E.; Koklyukhin, A.; Nikulshin, P. Tailoring NiMo-Based Catalysts for Production of Low-Viscosity Sustainable Hydrocarbon Bases for Drilling Muds from Secondary Gas Oils. Energies 2023, 16, 5859. [Google Scholar] [CrossRef]
  8. Sultanbekov, R.; Denisov, K.; Zhurkevich, A.; Islamov, S. Reduction of Sulphur in Marine Residual Fuels by Deasphalting to Produce VLSFO. J. Mar. Sci. Eng. 2022, 10, 1765. [Google Scholar] [CrossRef]
  9. Rudko, V.A.; Derkunskii, I.O.; Gabdulkhakov, R.R.; Konoplin, R.R.; Pyagay, I.N. Kinetics of various hydrocarbon groups formation in distillates obtained during the production of needle coke via the delayed coking of decant oil. Egypt. J. Pet. 2022, 31, 33–38. [Google Scholar] [CrossRef]
  10. Kaiser, M.J.; De Klerk, A.; Gary, J.H.; Handwerk, G.E. Petroleum Refining: Technology, Economics, and Markets, 6th ed; CRC Press: Boca Raton, FL, USA, 2020. [Google Scholar]
  11. Rana, M.S.; Samano, V.; Ancheyta, J.; Diaz, J.A.I. A review of recent advances on process technologies for upgrading of heavy oils and residua. Fuel 2007, 86, 1216–1231. [Google Scholar] [CrossRef]
  12. Istadi, I.; Amalia, R.; Riyanto, T.; Anggoro, D.D.; Jongsomjit, B.; Putranto, A.B. Acids treatment for improving catalytic properties and activity of the spent RFCC catalyst for cracking of palm oil to kerosene-diesel fraction fuels. Mol. Catal. 2022, 527, 112420. [Google Scholar] [CrossRef]
  13. Xiong, P.; Yang, H.; Wu, P.; Liao, Y.; Tan, D.; Ma, Z.; Yan, X. Study on catalytic aquathermolysis of heavy oil by simple synthesis of highly dispersed nickel-loaded nitrogen-doped carbon catalysts. Mol. Catal. 2022, 529, 112528. [Google Scholar] [CrossRef]
  14. Vakhin, A.V.; Aliev, F.A.; Mukhamatdinov, I.I.; Sitnov, S.A.; Pyataev, A.V.; Kudryashov, S.I.; Afanasiev, I.S.; Solovev, A.V.; Sansiev, G.V.; Antonenko, D.A.; et al. Catalytic activity of bimetallic nanoparticles based on iron and nickel sulfides for hydrogenolysis of heavy oil in case of Boca de Jaruco reservoir. Mol. Catal. 2023, 546, 113261. [Google Scholar] [CrossRef]
  15. Efimov, I.; Smyshlyaeva, K.I.; Povarov, V.G.; Buzyreva, E.D.; Zhitkov, N.V.; Vovk, M.A.; Rudko, V.A. UNIFAC residual marine fuels stability prediction from NMR and elemental analysis of SARA components. Fuel 2023, 352, 129014. [Google Scholar] [CrossRef]
  16. Iuzmukhametova, R.; Boldushevskii, R.; Shmelkova, O.; Khamzin, Y.; Minaev, A.; Nikulshin, P. Adsorptive Treatment of Residues on Macroporous Adsorbent for Marine Fuel Production Scheme on Refinery. J. Mar. Sci. Eng. 2023, 11, 525. [Google Scholar] [CrossRef]
  17. Smyshlyaeva, K.I.; Rudko, V.A.; Kuzmin, K.A.; Povarov, V.G. Asphaltene genesis influence on the low-sulfur residual marine fuel sedimentation stability. Fuel 2022, 328, 125291. [Google Scholar] [CrossRef]
  18. Gabdulkhakov, R.R.; Rudko, V.A.; Povarov, V.G.; Ugolkov, V.L.; Pyagay, I.N.; Smyshlyaeva, K.I. Technology of Petroleum Needle Coke Production in Processing of Decantoil with the Use of Polystyrene as a Polymeric Mesogen Additive. ACS Omega 2021, 6, 19995–20005. [Google Scholar] [CrossRef] [PubMed]
  19. Li, L.; Yuan, X.; Wang, Y.; Sun, B.; Wu, D. A two-layer fuzzy synthetic strategy for operational performance assessment of an industrial hydrocracking process. Control Eng. Pract. 2019, 93, 104187. [Google Scholar] [CrossRef]
  20. Vivas-Baez, J.C.; Servia, A.; Pirngruber, G.D.; Anne-Claire Dubreuil, A.-C.; Perez-Martínez, D.J. Insights in the phenomena involved in deactivation of industrial hydrocracking catalysts through an accelerated deactivation protocol. Fuel 2021, 303, 120681. [Google Scholar] [CrossRef]
  21. Panariti, N.; Rispoli, G. The first EST Commercial Unit: Achieving the goal of residue conversion. In Proceedings of the 13th International Bottom of the Barrel Conference, Istanbul, Turkey, 13–14 May 2015. [Google Scholar]
  22. Konovnin, A.A.; Presnyakov, V.V.; Shigabutdinov, R.A.; Ahunov, R.N.; Idrisov, M.R.; Novikov, M.A.; Hramov, A.A.; Urazaikin, A.S.; Shigabutdinov, A.K. Deep Processing of Vacuum Residue on the Basis of Heavy Residue Conversion Complex of TAIF-NK JSC. Chem. Technol. 2023, 59, 1–6. [Google Scholar] [CrossRef]
  23. Stratiev, D.; Shishkova, I.; Dinkov, R.; Dobrev, D.; Argirov, G.; Yordanov, D. The Synergy between Ebullated Bed Vacuum Residue Hydrocracking and Fluid Catalytic Cracking Processes in Modern Refining—Commercial Experience; Professor Marin Drinov Publishing House of Bulgarian Academy of Sciences: Sofia, Bulgaria, 2022; ISBN 978-619-245-234-6. [Google Scholar]
  24. Dreillard, M.; Marques, J.; Barbier, J.; Feugnet, F. Deep conversion of vacuum residue while limiting sediment formation. In Proceedings of the 19th Annual Conference on Petroleum Phase Behavior and Fouling, Park City, UT, USA, 8–12 July 2018. [Google Scholar]
  25. Akhunov, R.N.; Idrisov, M.R.; Presnyakov, V.V.; Shigabutdinov, R.A.; Novikov, M.A.; Khramov, A.A.; Konovnin, A.A.; Urazaikin, A.S.; Shigabutdinov, A.K. Effect of Hydrocracking of Oil Distillation Heavey Residues on Production Efficiency of TAIF-NK JSC. Chem. Technol. 2023, 59, 7–10. [Google Scholar] [CrossRef]
  26. Bellussi, G.; Rispoli, G.; Landoni, A.; Millini, R.; Molinari, D.; Montanari, E.; Moscotti, D.; Pollesel, P. Hydroconversion of heavy residues in slurry reactors: Developments and perspective. J. Catal. 2013, 308, 189–200. [Google Scholar] [CrossRef]
  27. Stratiev, D.; Dinkov, R.; Shishkova, I.; Sharafutdinov, I.; Ivanova, N.; Mitkova, M.; Yordanov, D.; Rudnev, N.; Stanulov, K.; Artemiev, A.; et al. What is behind the high values of hot filtration test of the ebullated bed residue H-Oil hydrocracker residual oils? Energy Fuels 2016, 30, 7037–7054. [Google Scholar] [CrossRef]
  28. Stratiev, D.; Sotirov, S.; Sotirova, E.; Nenov, S.; Dinkov, R.; Shishkova, I.; Kolev, I.V.; Yordanov, D.; Vasilev, S.; Atanassov, K.; et al. Prediction of Molecular Weight of Petroleum Fluids by Empirical Correlations and Artificial Neuron Networks. Processes 2023, 11, 426. [Google Scholar] [CrossRef]
  29. Stratiev, D.; Ivanov, M.; Chavdarov, I.; Argirov, G.; Strovegli, G. Revamping Fluid Catalytic Cracking Unit, and Optimizing Catalyst to Process Heavier Feeds. Appl. Sci. 2023, 13, 2017. [Google Scholar] [CrossRef]
  30. Stratiev, D.; Shishkova, I.; Nikolova, R.; Tsaneva, T.; Mitkova, M.; Yordanov, D. Investigation on precision of determination of SARA analysis of vacuum residual oils from different origin. Pet. Coal 2016, 58, 109–119. [Google Scholar]
  31. Georgiev, B.E.; Stratiev, D.S.; Argirov, G.S.; Nedelchev, A.; Dinkov, R.; Shishkova, I.K.; Ivanov, M.; Atanassov, K.; Ribagin, S.; Nikolov Palichev, G.; et al. Commercial Ebullated Bed Vacuum Residue Hydrocracking Performance Improvement during Processing Difficult Feeds. Appl. Sci. 2023, 13, 3755. [Google Scholar] [CrossRef]
  32. Stratiev, D.; Shishkova, I.; Dinkov, R.; Kolev, I.; Argirov, G.; Ivanov, V.; Ribagin, S.; Atanassova, V.; Atanassov, K.; Stratiev, D.; et al. Intercriteria analysis to diagnose the reasons for increased fouling in a commercial ebullated bed vacuum residue hydrocracker. ACS Omega 2022, 7, 30462–30476. [Google Scholar] [CrossRef]
  33. Martinez, J.; Sanchez, J.L.; Ancheyta, J.; Ruiz, R.S. A review of process aspects and modeling of ebullated bed reactors for hydrocracking of heavy oils. Catal. Rev.-Sci. Eng. 2010, 52, 60–105. [Google Scholar] [CrossRef]
  34. Castañeda, L.C.; Muñoz, J.A.D.; Ancheyta, J. Chapter 10 Experimentation in Continuous Stirred Tank Reactors. In Experimental Methods for Evaluation of Hydrotreating Catalysts; Wiley: Hoboken, NJ, USA, 2020. [Google Scholar] [CrossRef]
  35. Schweitzer, J.M.; Kressmann, S. Ebullated bed reactor modeling for residue conversion. Chem. Eng. Sci. 2004, 59, 5637–5645. [Google Scholar] [CrossRef]
  36. Stanislaus, A.; Hauser, A.; Marafi, M. Investigation of the mechanism of sediment formation in residual oil hydrocracking process through characterization of sediment deposits. Catal Today 2005, 109, 167–177. [Google Scholar] [CrossRef]
  37. García, F.O.; Mar-Juárez, E.; Hernández, P.S. Controlling Sediments in the Ebullated Bed Hydrocracking Process. Energy Fuels 2012, 26, 2948–2952. [Google Scholar] [CrossRef]
  38. Sundaram, K.M.; Mukherjee, U.; Baldassari, M. Thermodynamic Model of Sediment Deposition in the LC-FINING Process. Energy Fuels 2008, 22, 3226–3236. [Google Scholar] [CrossRef]
  39. Rogel, E.; Ovalles, C.; Pradhan, A.; Leung, P.; Chen, N. Sediment formation in residue hydroconversion processes and its correlation to asphaltene behavior. Energy Fuels 2013, 27, 6587–6593. [Google Scholar] [CrossRef]
  40. Manek, E.; Haydary, J. Hydrocracking of vacuum residue with solid and dispersed phase catalyst: Modeling of sediment formation and hydrodesulfurization. FPT 2017, 159, 320–327. [Google Scholar] [CrossRef]
  41. Bannayan, M.A.; Lemke, H.K.; Stephenson, W.K. Fouling mechanisms and effect of process conditions on deposit formation in H-Oil. Stud. Surf. Sci. Catal. 1996, 100, 273–281. [Google Scholar]
  42. Kunnas, J.; Ovaskainen, O.; Respini, M. Mitigate fouling in ebullated-bed hydrocrackers. Hydrocarb. Process. 2010, 10, 59–64. [Google Scholar]
  43. Respini, M.; Ekres, S.; Wright, B.; Žajdlík, R. Strategies to Control Sediment and Coke in a Hydrocracker. PTQ 2013, Q2. Available online: www.digitalrefining.com/article/1000794 (accessed on 2 October 2023).
  44. Kolev, I.; Stratiev, D.; Shishkova, I.; Atanassov, K.; Ribagin, S.; Sotirov, S.; Sotirova, E.; Stratiev, D.D. Effect of Crude Oil Quality on Properties of Hydrocracked Vacuum Residue and Its Blends with Cutter Stocks to Produce Fuel Oil. Processes 2023, 11, 1733. [Google Scholar] [CrossRef]
  45. Corma, A.; Corresa, E.; Mathieu, Y.; Sauvanaud, L.; Al-Bogami, S.; Al-Ghrami, M.S.; Bourane, A. Crude oil to chemicals: Light olefins from crude oil. Catal. Sci. Technol. 2017, 7, 12–46. [Google Scholar] [CrossRef]
  46. Marques, J.; Maget, S.; Verstraete, M.J.J. Improvement of ebullated-bed effluent stability at high conversion operation. Energy Fuels 2011, 25, 3867–3874. [Google Scholar] [CrossRef]
  47. Alonso, F.; Ancheyta, J.; Centeno, G.; Marroquín, G.; Rayo, P.; Silva-Rodrigo, R. Effect of Reactor Configuration on the Hydrotreating of Atmospheric Residue. Energy Fuels 2019, 33, 1649–1658. [Google Scholar] [CrossRef]
  48. Guzmán, R.; Rodríguez, S.; Torres-Mancera, P.; Ancheyta, J. Evaluation of Asphaltene Stability of a Wide Range of Mexican Crude Oils. Energy Fuels 2021, 35, 408–418. [Google Scholar] [CrossRef]
  49. Stratiev, D.; Shishkova, I.; Nedelchev, A.; Kirilov, K.; Nikolaychuk, E.; Ivanov, A.; Sharafutdinov, I.; Veli, A.; Mitkova, M.; Tsaneva, T.; et al. Investigation of relationships between petroleum properties and their impact on crude oil compatibility. Energy Fuels 2015, 29, 7836–7854. [Google Scholar] [CrossRef]
  50. Prakoso, A.; Punase, A.; Rogel, E.; Ovalles, C.; Hascakir, B. Effect of Asphaltene Characteristics on Its Solubility and Overall Stability. Energy Fuels 2018, 32, 6482–6487. [Google Scholar] [CrossRef]
  51. Cui, Q.; Ma, X.; Nakabayashi, K.; Nakano, K.; Miyawaki, J.; Al-Mutairi, A.; Marafi, A.M.; Al-Otaibi, A.M.; Yoon, S.H.; Mochida, I. Changes in Composition and Molecular Structures of Atmospheric Residues during Hydrotreating. Energy Fuels 2019, 33, 10787–10794. [Google Scholar] [CrossRef]
  52. Chacón-Patiño, M.L.; Gray, M.R.; Rüger, C.; Smith, D.F.; Glattke, T.J.; Niles, S.F.; Neumann, A.; Weisbrod, C.R.; Yen, A.; McKenna, A.M.; et al. Lessons learned from a decade-long assessment of asphaltenes by ultrahigh-resolution mass spectrometry and implications for complex mixture analysis. Energy Fuels 2021, 35, 16335–16376. [Google Scholar] [CrossRef]
  53. Gray, M.R.; Chacón-Patiño, M.L.; Rodgers, R.P. Structure–reactivity relationships for petroleum asphaltenes. Energy Fuels 2022, 36, 4370–4380. [Google Scholar] [CrossRef]
  54. Gray, M.R.; Yarranton, H.W. Quantitative modeling of formation of asphaltene nanoaggregates. Energy Fuels 2019, 33, 8566–8575. [Google Scholar] [CrossRef]
  55. Gray, M.R.; Yarranton, H.W.; Chacón-Patiño, M.L.; Rodgers, R.P.; Bouyssiere, B.; Giusti, P. Distributed properties of asphaltene nanoaggregates in crude oils: A review. Energy Fuels 2021, 35, 18078–18103. [Google Scholar] [CrossRef]
  56. Chacón-Patiño, M.L.; Heshka, N.; Alvarez-Majmutov, A.; Hendrickson, C.L.; Rodgers, R.P. Molecular Characterization of Remnant Polarizable Asphaltene Fractions Upon Bitumen Upgrading and Possible Implications in Petroleum Viscosity. Energy Fuels 2022, 36, 7542–7557. [Google Scholar] [CrossRef]
  57. Li, M.; Ren, T.; Sun, Y.; Xiao, S.; Wang, Y.; Zhang, S.; Lu, M. Applicability and structural relevance of Hansen solubility parameters for asphaltenes. Fuel 2023, 333, 126436. [Google Scholar] [CrossRef]
  58. Punase, A.; de Aguiar, J.S.; Mahmoudkhani, A. Impact of Inorganic Salts and Minerals on Asphaltene Stability and Inhibitor Performance. In Proceedings of the SPE-193559-MS, SPE International Conference on Oilfield Chemistry, Galveston, TX, USA, 8–9 April 2019. [Google Scholar]
  59. Zhang, Y.; Siskin, M.; Gray, M.R.; Walters, C.C.; Rodgers, R.P. Mechanisms of Asphaltene Aggregation: Puzzles and a New Hypothesis. Energy Fuels 2020, 34, 9094–9107. [Google Scholar] [CrossRef]
  60. Zheng, F. Molecular Composition and Structure of Metal Compounds in Asphaltene. Ph.D. Thesis, Université de Pau et des Pays de l’Adour, Pau, France, 2020. [Google Scholar]
  61. Zheng, F.; Zhang, Y.; Zhang, Y.; Han, Y.; Zhang, L.; Bouyssiere, B.; Shi, Q. Aggregation of petroporphyrins and fragmentation of porphyrin ions: Characterized by TIMS-TOF MS and FT-ICR MS. Fuel 2021, 289, 119889. [Google Scholar] [CrossRef]
  62. van den Berg, F.G.A. History and Review of Dual Solvent Titration Methods. Energy Fuels 2022, 36, 8639–8648. [Google Scholar] [CrossRef]
  63. Powers, D.P.; Sadeghi, H.; Yarranton, H.W.; van den Berg, F.G.A. Regular solution based approach to modeling asphaltene precipitation from native and reacted oils: Part 1, molecular weight, density, and solubility parameter distributions of asphaltenes. Fuel 2016, 178, 218–233. [Google Scholar] [CrossRef]
  64. Rodriguez, S.; Baydak, E.N.; Schoeggl, F.F.; Taylor, S.D.; Hay, G.; Yarranton, H.W. Regular solution based approach to modeling asphaltene precipitation from native and reacted oils: Part 3, visbroken oils. Fuel 2019, 257, 116079. [Google Scholar] [CrossRef]
  65. Hernández, E.A.; Lira-Galeana, C.; Ancheyta, J. Analysis of Asphaltene Precipitation Models from Solubility and Thermodynamic-Colloidal Theories. Processes 2023, 11, 765. [Google Scholar] [CrossRef]
  66. Guerrero-Martin, C.A.; Montes-Pinzon, D.; Meneses Motta da Silva, M.; Montes-Paez, E.; GuerreroMartin, L.E.; Salinas-Silva, R.; Camacho-Galindo, S.; Fernandes Lucas, E.; Szklo, A. Asphaltene Precipitation/Deposition Estimation and Inhibition through Nanotechnology: A Comprehensive Review. Energies 2023, 16, 4859. [Google Scholar] [CrossRef]
  67. Fakher, S.; Ahdaya, M.; Elturki, M.; Imqam, A. Critical review of asphaltene properties and factors impacting its stability in crude oil. J. Petrol. Explor. Prod. Technol. 2020, 10, 1183–1200. [Google Scholar] [CrossRef]
  68. Abutaqiya, M.I.L.; Alhammadi, A.A.; Sisco, C.J.; Vargas, F.M. Aromatic Ring Index (ARI): A characterization factor for nonpolar hydrocarbons from molecular weight and refractive index. Energy Fuels 2021, 35, 1113–1119. [Google Scholar] [CrossRef]
  69. Tirado, A.; Ancheyta, J. A batch reactor study of the effect of aromatic diluents to reduce sediment formation during hydrotreating of heavy oil. Energy Fuels 2018, 32, 60–66. [Google Scholar] [CrossRef]
  70. Fisher, L.P. Effect of feedstock variability on catalytic cracking yields. Appl Catal. 1990, 65, 189–210. [Google Scholar] [CrossRef]
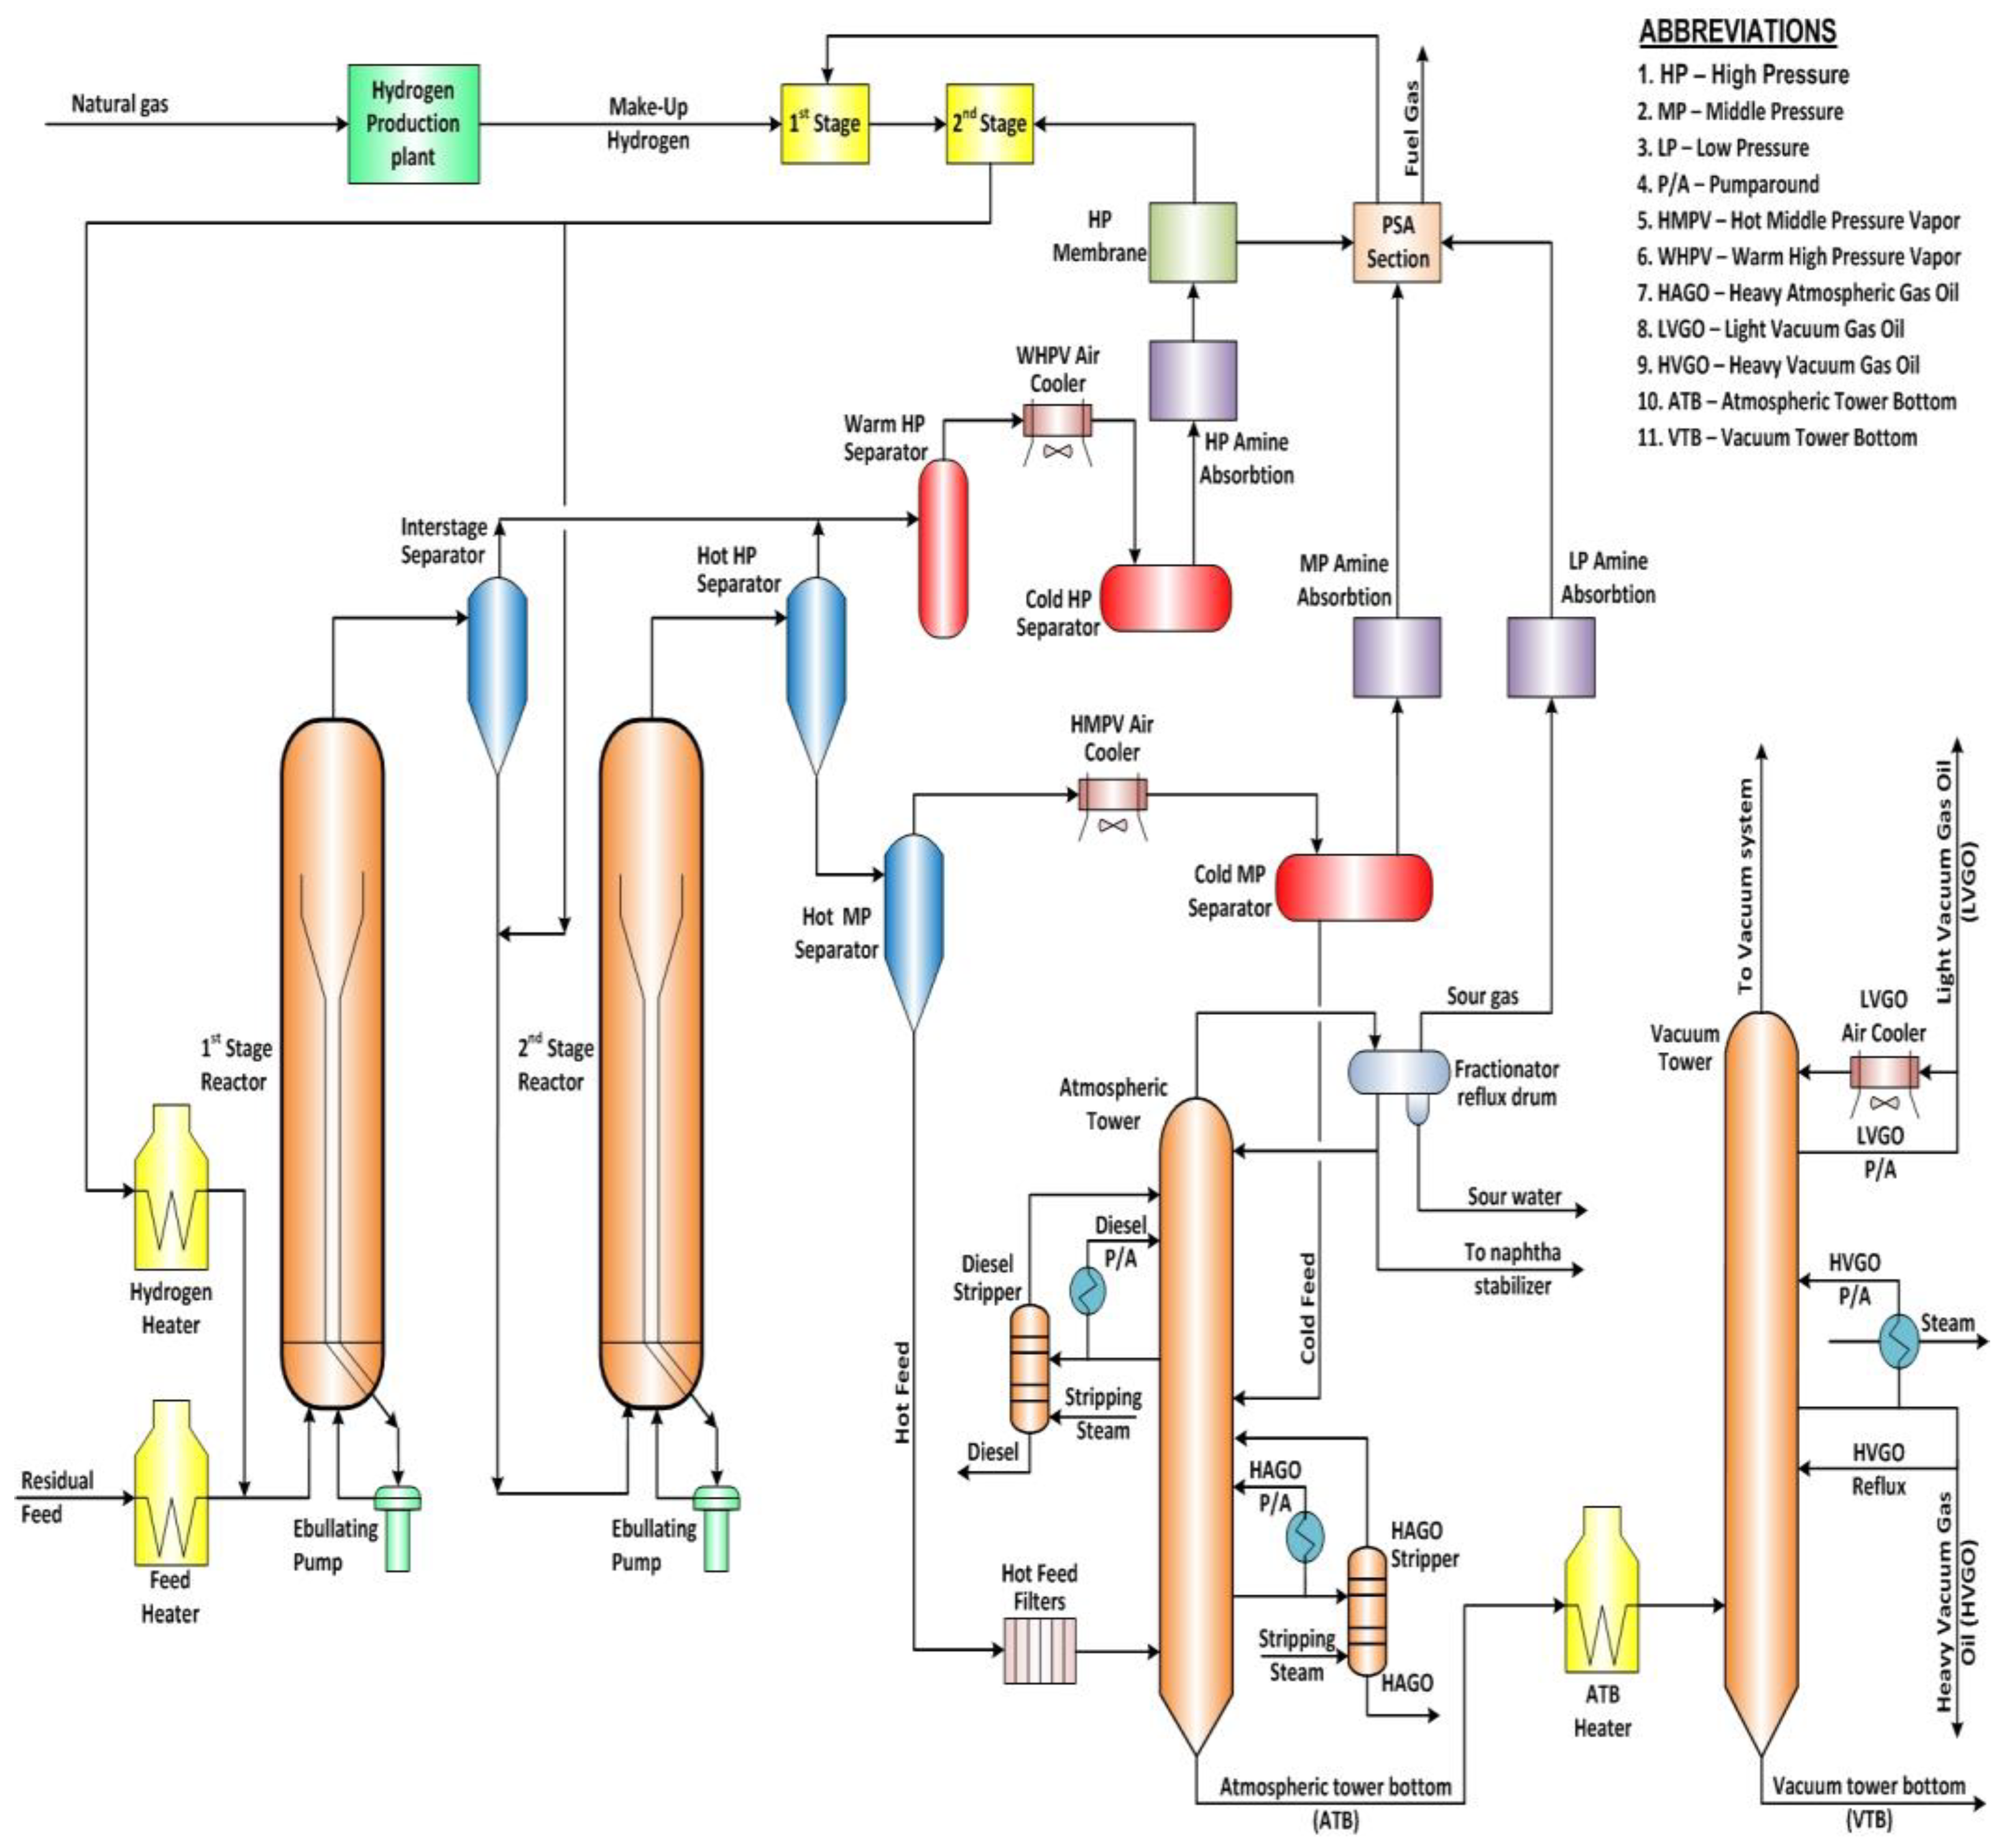
Figure 1. Technological scheme of industrial H-Oil ebullated bed residue hydrocracking unit.
Processes 11 03174 g001
Figure 2. Process scheme of LNB FCC feed hydrotreating and FCC reactor–regenerator sections.
Processes 11 03174 g002
Figure 3. A simplified layout of the heavy oil technological chain in LUKOIL Neftohim Burgas refinery.
Processes 11 03174 g003
Figure 4. Variation of individual crude oil contents in the refined petroleum mixture in the LNB refinery during the study.
Processes 11 03174 g004
Figure 5. Variation of ATB TSE, and PBFO TSP along with the WABT of both H-Oil hydrocracking reactors in the study.
Processes 11 03174 g005
Figure 6. Variation of atmospheric tower skin temperature and the difference between the ATB product temperature and the atmospheric tower bottom skin temperatures measured in diverse radial positions (denoted as DT1, DT2, DT3, and DT4).
Processes 11 03174 g006
Figure 7. TSE and TSP of blends of H-Oil VTB obtained at very low severity (405 °C) with FCC HCO (a), FCC LCO (b), FCC SLO (c), and FCCPT diesel (d) as a function of diluent content in the blend.
Processes 11 03174 g007aProcesses 11 03174 g007b
Figure 8. Parity graphs for measured versus predicted conversion by the use of Equation (2) (CSTR model) (a), Equation (8) (plug flow model) (b), and the regression model (Equation (9)) (c).
Processes 11 03174 g008
Figure 9. Variation of H-Oil VTB molecular weight (a) and density (b) with conversion alteration.
Processes 11 03174 g009
Figure 10. Relationship between H-Oil VTB density and the densities of the three H-Oil gas oils (HVGO, LVGO, and HAGO).
Processes 11 03174 g010
Figure 11. Dependence of yields of H-Oil gas (a), naphtha (b), diesel (c), VGO (d), and VTB (e) on conversion.
Processes 11 03174 g011
Figure 12. Dependence of the yields of dry gas (a), propane–propylene fraction (PPF) (b), butane–butylene fraction (BBF) (c), gasoline (d), LCO (e), HCO (f), SLO (g) on FCC conversion.
Processes 11 03174 g012aProcesses 11 03174 g012b
Figure 13. H-Oil VTB colloidal instability index (based on C7 asphaltenes) varying with conversion change.
Processes 11 03174 g013
Figure 14. Relationship between H-Oil VTB C5 asphaltene density and sediment content in blend 50% H-Oil VTB/50% FCCPT diesel.
Processes 11 03174 g014
Figure 15. Relationship between the H-Oil VGO density and the FCC regenerator dense bed temperature.
Processes 11 03174 g015
Table 1. Characteristics of investigated crude oils.
Indices UralsBasrah HeavyLSCOKirkukArab LightArab MediumJohan SverdrupWestern DesertCPC
Density at 15 °Cg/cm30.8770.9050.8540.87990.85920.87610.88670.82080.805
Kinematic viscosity at 40 °Cmm2/s12.637.210.811.810.113.812.34.46.9
Sulphurwt.%1.533.860.572.881.942.60.820.260.63
Saturateswt.%58.446.562.357.758.056.553.575.179.3
Aromaticswt.%35.238.731.434.237.737.141.623.018.5
Resinswt.%2.65.13.12.22.93.34.11.51.2
Aspaltenes (C7)wt.%3.89.73.264.75.64.21.01.0
Aspaltenes (C5)wt.%6.314.86.38.17.68.98.32.52.0
TBP yields
IBP-180 °Cwt.%1515.72020.920.919.015.1432.2838.64
180–240 °Cwt.%8.77.89.19.010.19.08.5110.4413.78
240–360 °Cwt.%2117.723.119.521.619.722.7723.5523.6
360–550 °Cwt.%30.325.929.624.525.725.029.3323.1817.9
>550 °Cwt.%23.931.917.325.120.726.323.259.555.56
Table 2. Characteristics of vacuum residual (VR) oils distilled from the studied crude oils by laboratory atmospheric and vacuum distillations.
Indices UralsBasrah HeavyLSCOKirkukArab LightArab MediumJohan SverdrupWestern DesertCPC
Density at 15 °Cg/cm30.9971.0710.9931.0541.02901.0311.0231.0110.981
Kinematic viscosity *mm2/s220.9731.9149.1308192338.3386 65
Softening point, °Cwt.%40.168.628.958.132.344.748.340.225.2
Molecular weight **g/mol784764741725745759782729684
T50 (high temperature simulated distillation)°C636646622630631636641622600.5
Concarbon contentwt.%17.528.91425.218.720.719.918.115.2
Sulphurwt.%37.11.585.94.95.41.771.782.10
Saturateswt.%25.612.32515.215.911.81923.144.6
Aromaticswt.%52.554.161.155.464.768.353.652.240.8
Resinswt.%7.85.86.157.35.311.06.810.3
C7 asphalteneswt.%14.127.77.824.312.114.616.417.93.4
C5 asphalteneswt.%17.63715.533.118.825.527.424.711
Notes: * This is the kinematic viscosity of mixtures of 70%VR/30% FCC HCO at 80 °C. ** The molecular weight was calculated using the correlation established in our recent research [28].
Table 3. Characteristics of vacuum gas oil (VGO) fractions distilled from the investigated crude oils.
Indices UralsBasrah HeavyLSCOKirkukArab LightArab MediumJohan SverdrupWestern DesertCPC
Density at 15 °Cg/cm30.92030.94910.90830.93370.92120.92530.92290.88410.8930
Sulphurwt.%2.014.200.823.162.542.940.930.431.26
Saturateswt.%51.940.956.946.551.549.850.868.263.9
Aromaticswt.%48.159.143.153.548.550.249.231.836.1
Saturates + MNA *wt.%70.961.174.966.370.669.270.083.180.1
Note: * MNA = mononuclear aromatics.
Table 4. Statistical analysis of Equations (2), (8) and (9) to predict vacuum residue (540 °C+) conversion in the LNB H-Oil hydrocracker.
Kinetic Equation (2) (CSTR)Kinetic Equation (8) (Plug Flow)Regression
Equation (9)
Standard Error41.110.711.9
Relative standard error56.714.716.4
Sum of squared errors (SSE)0.9490.2080.201
Relative average absolute deviation (%AAD)5.03.23.6
Sum of relative errors (SRE)248.461.449.8
Average absolute deviation (AAD)3.212.232.52
Table 5. Range of variation of properties of the primary vacuum residual oil blend processed in the H-Oil unit during the study, along with the reactivity index.
Density at 15 °C, g/cm3Conradson Carbon Content, wt.%C7 Asphaltene Content, wt.%Sulphur Content, wt.%Reactivity Index
min0.99515.813.62.40.96
max1.01118.219.73.70.94
Table 6. Range of the variation of the density of the H-Oil gas oils in the vacuum residue conversion range of 51.8–91.7 wt.%.
HAGO Density at 15 °C, g/cm3LVGO Density at 15 °C, g/cm3HVGO Density at 15 °C, g/cm3
min0.91070.91840.9272
max0.95040.97520.9846
Disclaimer/Publisher’s Note: The statements, opinions and data contained in all publications are solely those of the individual author(s) and contributor(s) and not of MDPI and/or the editor(s). MDPI and/or the editor(s) disclaim responsibility for any injury to people or property resulting from any ideas, methods, instructions or products referred to in the content.