Article

Analysis of the Effects of Surfactants on Extracellular Polymeric Substances

1
College of Engineering, Southwest Petroleum University, Nanchong 637001, China
2
School of Chemistry and Chemical Engineering, Southwest Petroleum University, Chengdu 610500, China
3
Oil & Gas Field Applied Chemistry Key Laboratory of Sichuan Province, Southwest Petroleum University, Chengdu 610500, China
*
Author to whom correspondence should be addressed.
Processes 2023, 11(11), 3212; https://doi.org/10.3390/pr11113212
Submission received: 12 September 2023 / Revised: 15 October 2023 / Accepted: 27 October 2023 / Published: 11 November 2023
(This article belongs to the Special Issue Advances in Microbial Biotechnology and Bioengineering Processes)

Abstract

:
Reservoirs after chemical flooding usually have residual chemicals, which can affect the driving effect of subsequent microbial drives. Among them, the effect of surfactants on the metabolites of oil-recovering bacteria is the most obvious. Therefore, this paper investigates the influence mechanism of sodium dodecyl sulfate (SDS) on the nature and structure of Extracellular Polymeric Substances (EPS) produced by metabolism of Enterobacter cloacae, through a variety of characterization to analysis the components and structure of EPS under SDS stress. The results showed that Enterobacter cloacae was identified as a glycolipid-producing strain, the main components of EPS were polysaccharides and proteins. The polysaccharide composition (%: w/w) was glucosamine, 37.2; glucose, 31.5; rhamnose, 26.3; xylose, 1.7; and unidentified sugar, 3.3; and the main component of proteins was polyglutamic acid. EPS under the stress of SDS showed an increase in the content of functional groups such as -C=O and -COOH and an increase in the cellular particle size, and production of EPS increased by 10.69 × 10³ mg/L when the SDS concentration was 2.5 × 10² mg/L; 3D-EEM results showed that the components of all three types of EPS The 3D-EEM results showed that all three types of EPS fractions contained tryptophan and protein-like substances, humic acid-like substances were only distributed in the solubilized extracellular polymers (SL-EPS), and aromatic proteins were only present in the loosely bound type (LB-EPS) and tightly bound type (TB-EPS). In addition, the peaks representing humic-like substances showed a blue shift, indicating that SDS had the greatest effect on SL-EPS. This study provides a guidance for refining the mechanism of strain EPS response to reservoir residual surfactant SDS, and provides a more comprehensive and in-depth understanding of surfactant-protein interactions.

1. Introduction

Microbial Enhanced Oil Recovery (MEOR) is a complementary technology to chemical flooding to enhance recovery and is an important method to extend the life cycle of an oil field by improving the properties of crude oil and reservoirs through the beneficial activities of microorganisms or their metabolites on crude oil and rocks [1,2]. Mainly through the injection of exogenous microbial spores and nutrient solution, microorganisms seal the relatively hypertonic channels through the biofilm composed of Extracellular Polymeric Substances (EPS) and bioflora produced in their growth, metabolism, and migration, in order to increase the coverage, thus enhancing the recovery rate [3]. However, in reservoirs, microorganisms need suitable environmental conditions to survive and reproduce, so MEOR technology is affected by environmental factors such as formation composition, temperature, crude oil properties, pH, and residual agents after chemical flooding, which restrict its widespread use. Microbial drive is generally followed by chemical drive, and there is surfactant residue on the rock surface after either the surfactant used in foam drive, or polymer surface binary drive. The residual surfactant has an effect on the properties and metabolites of the microorganisms in the subsequent oil drive. There are many studies focusing on the effect of surfactant on cell products [4]. Based on the binding of EPS to cells, microbial EPS are usually categorized into soluble EPS (soluble macromolecules, colloids, and mucilage) and bound EPS (sheaths, capsule polymers, cohesive gels, loosely bound polymers, and attached organic matter).
EPS are dense mesh materials secreted by microorganisms, which, due to their viscosity, can form a biofilm (bacteria together with a certain strength of the blocking material) through sealing and profile control to improve the oil recovery rate, creating a protective barrier for microorganisms to cope with the potential threat of toxic substances of the first barrier. There are a number of functional groups, such as carboxylic acid, phosphoric acid, sulfhydryl, phenolic, and hydroxyl groups, in EPS, which can be bound not only to heavy metals, but also to organic pollutants. Such amphiphilic compounds not only provide a nutrient source for epiphytes but also act as a protective barrier for toxic compounds such as non-essential trace metals. EPS of cyanobacteria have been reported to be closely associated with colony formation and development, which can further protect the bacteria from unfavorable environments [5]. In fact, for strains that can produce EPS, the main factors affecting the production of EPS include the culture substrate (e.g., carbon and nitrogen sources) [6], the growth conditions (e.g., temperature, pH, and oxygen supply) [7], and trace heavy metal ions (e.g., Cu2+, Fe3+) [8]. As far as the same strain is concerned, the temperature change has a significant effect on the polysaccharide content in EPS, CO2 can affect the protein content in EPS, the sugar yield in EPS of the bacterium is the highest at the optimum pH, the protein content in EPS is positively correlated with the pH value within the general environmental pH range, and the amino acid yield in EPS is positively correlated with the growth of the bacteria. Different strain species and the presence of nutrient metabolites significantly affected the composition of bacterial EPS [9].
Surfactants can affect the conformation and stability of intracellular membrane proteins, thereby influencing cellular metabolism and product yield [10]. Recent studies have found that surfactants can modulate the expression and structure of cell membrane proteins, thereby affecting cellular metabolic pathways and product synthesis. Nonionic surfactants have the ability to alter cell membrane permeability to enhance viral replication [11]. The EPS produced by oil-driving microorganisms play an important role both in the study of the mechanism of biological metabolism and in the enhancement of crude oil recovery. Therefore, the study of EPS produced by microorganisms under the influence of different surfactants and the conditions of production is indispensable to the study of the mechanism of microbial oil drive and the improvement of crude oil recovery, and needs to be strengthened. From the practical effect, the microbial oil drive effect after chemical oil drive is poor, and the recovery rate increase is limited, so it is especially important to study the microbial oil drive mechanism after surfactant; however, the specific growth model parameters of surfactant on the oil recovery bacteria are not clear.
EPS produced by oil-driving microorganisms play an important role in the study of the mechanism of biological metabolism as well as an important factor in the improvement of crude oil recovery. Therefore, the study on the characteristics and conditions of EPS produced under the influence of different surfactants in microbial oil flooding technology is indispensable for the study of microbial oil flooding mechanism and enhanced oil recovery. In this study, sodium dodecyl sulfate (SDS), the most commonly used reagent in surfactant flooding, was selected to deeply explore the effect of surfactant on EPS production of strains. We constructed the experimental program of strain media under different concentrations of surfactant stress, and obtained the EPS production and structural changes in microbial growth and metabolism under the influence of different stimulants. Through FT-IR, XRD, 3D-EEM, etc., we establish the invasion mechanism of surfactant on microbial bacterial membrane, speculate the entanglement mode of EPS protein and surfactant, and clarify the influence law of different EPS existed morphology on the protein components. It is of great significance to improve the response mechanism of oil recovery bacteria to the toxicity of reservoir residual surfactant SDS.

2. Materials and Methods

2.1. Extraction and Characterization of EPS

2.1.1. Medium Formulation

Seed medium: NH4NO3 2g/L, KH2PO4 1 g/L, MnCl2 0.2 g/L, K2HPO4 • 3H2O 0.5 g/L, MgSO4 • 7H2O 0.25 g/L, 1% glucose, pH 7.2.
LB liquid medium: Yeast powder 5 g/L, peptone 10 g/L, NaC1 10 g/L, glucose 10 g/L, pH 7.2–7.4.

2.1.2. Sample Preparation

In this experiment, using a standardized strain of Enterobacter cloacae (ATCC 13047), the strain can use crude oil as the only carbon source, facultative anaerobic, stable activity, and strong ability to produce extracellular polymers. The strain was activated by inoculation into 500 mL conical flasks containing 250 mL of seed medium, and incubated at 45 °C with 150 r/min shaking for 48 h. Then, the seed medium was inserted into 500 mL conical flasks containing LB liquid medium at 5% inoculum, and incubated at 45 °C on a constant temperature water bath shaker at 150 r/min for 48 h. Subsequently, the LB culture medium was configured to contain SDS at different concentrations. LB medium containing different concentrations of SDS solution (2.5 × 10² mg/L, 5 × 10² mg/L, 1 × 10³ mg/L, 2 × 10³ mg/L, and 4 × 10³ mg/L) was incubated at 45 °C for 7 d.
It is recognized that EPS extraction methods are divided into physical extraction methods (heating, ultrasound, and glass bead vibration) and chemical extraction methods (NaOH, H2SO4, and formaldehyde) [12,13,14]. In this experiment, we chose an ultrasound-centrifugation physical extraction method. The culture solution was sonicated in an ultrasonic vale for 10 min, and the voltage of the ultrasonic bath was reduced to 120 V in order to ensure that the samples were changed in a regular manner. The output power of the device was 18 W, the solution was centrifuged at 2000 r/min for 10min before 10 mL phosphate buffer salt solution was added 3 times, then again centrifuged at 4 °C for 33,000 r/min for 10min. Then the supernatant was removed and the sample EPS were obtained for subsequent analysis.

2.1.3. EPS Yield and Compositional Identification Methods

(1) Determination of total sugar yield phenol-sulfuric acid method [15]
A volume of 2 mL of microbial EPS solution with 1 mL of 6% phenol and 5 mL of H2SO4 was added to the colorimetric tube and shaken well and, then allowed to stand for 15 min. The absorbency value (measured by glucose) at the wavelength of 490 nm was measured by enzyme labeling instrument (DK-3518, DECCA).
(2) Determination of Total Protein Yield-Thomas Brilliant Blue Method [16]
A volume of 2 mL of EPS solution was taken and analyzed by Bio-Rad Protein Assay (protein concentration determination) kit. Next, 150 μL of the assay reagent and 50 μL of the sample to be tested were added into the microtiter plate and mixed well, and left to stand for 5 min. The absorbance value was measured at 595 nm using an enzyme labeling instrument (DK-3518, DECCA), and a standard curve was made with bovine serum protein solution.
(3) Thin Layer Chromatography (TLC)
The extracted EPS were hydrolyzed for 2 h using trifluoroacetic acid (TFA). Then, they were analyzed using thin layer chromatography (TLC) (n-butanol/acetic acid/water (6:2:2) as solvent system). In this study, plates were sprayed with α-naphthol and ninhydrin reagents to show sugar and protein fractions. 0.1 g of the EPS was dissolved in 10 mL of the above solution system and dextran with different molecular weights and in the same volume (2000 KD, 500 KD, 200 KD, 70 KD, 40 KD, 10 KD) was used as a standard for the assay.
(4) High performance liquid chromatography (HPLC)
The purified samples were detected by high performance liquid chromatography (LC-20A, Shimadzu Corporation, Kyoto, Japan, Shimadzu, Japan), mobile phase A (60% 10 mmol/L ammonium acetate mixed with 40% acetonitrile, pH 7.0), mobile phase B (acetonitrile), gradient elution, and the B phase changed from 10% to 25% within 0~10 min. The product yield was measured by mobile phase 1.0 mL/min, reversed phase C18 column and UV 215 nm. Liquid-phase gradient condition as shown in Table 1. Under normal circumstances, the product measured needs to be observed with color developing agent. The sample is developed with ethanol: concentrated sulfuric acid (volume ratio: 9:1), benzene solution of 1% anthrone, and the sample is qualitatively analyzed by comparing the color and development position with the standard product.

2.2. Structure and Size Analysis of EPS under SDS Stress

2.2.1. Fourier Transform Infrared Spectral Analysis

The EPS extracted from Section 2.1.2 was dried into powder by freeze-dryer (FD-1A-50, Khanno, Vancouver, BC, Canada) for subsequent testing using Fourier infrared spectroscopy (NICOLET iS50, Waltham, MA, USA). The lyophilized powders of the three types of EPS under the addition of 0 mg/L, 5 × 10² mg/L, and 2 × 10³ mg/L SDS, respectively, were freeze-dried and ground into transparent, homogeneous films or lumps by the KBr-pressing method [17] to ensure the transmittance and homogeneity of the samples to the infrared light, and the samples were placed in a transparent infrared absorption window to ensure the unobstructed contact between the samples and the instrumental optical path.

2.2.2. Particle Size Analysis

In this study, a laser particle size analyzer (Malvern 2000, MALVERN, Tokyo, Japan) was used to determine particle size at 45 °C using static light scattering (SLS). The particle size distribution of EPS before and after centrifugation in the absence of SDS and before and after centrifugation in the presence of SDS was measured by comparing four sets of EPS solutions before and after centrifugation. To ensure the reproducibility of the particle size determination, the study prepared three replicate solutions for each concentration.

2.2.3. Fluorescence Spectral Analysis

After the correlation between optimal dilution concentration or fluorescence peaks (electropherograms) and protein concentration established in the literature (see Table 2 below): a fluorescence model was proposed to explain the contribution of free and bound micelles to the overall fluorescence, and protein peaks were observed at 3 mM SDS as the optimal dilution concentration [18].
The concentration of 3 mM SDS was converted to approximately 1 × 10³ mg/L, so the fluorescence intensity of proteins in the EPS under 1 × 10³ mg/L SDS stress was determined, and the optimal excitation and emission wavelengths for the proteins were determined according to literature [19]. The optimal excitation and emission wavelengths of the proteins were determined in the literature and combined with the Gaussian function (1) and took the logarithm (2) to obtain the corresponding Gaussian curve fit.
y i = a × e [ ( x i c ) 2 b ]
l n y i = ( ln a c 2 b ) + 2 x i c b x i 2 b
where a represents the height of the Gaussian peak (nm); b represents the Gaussian peak position (nm); c represents the half-height width (nm).

2.2.4. Three-Dimensional Fluorescence Spectral Analysis

The supernatant of the purified EPS from Section 2.1.2 was collected as SL-EPS in a 50 mL centrifuge tube; the above samples were suspended with 0.05% NaCl solution and centrifuged at 5000 r/min for 15 min to carefully collect the second supernatant as LB-EPS; and thirdly, the remaining harvested samples were resuspended with 0.05% NaCl solution and heated in a thermostatic water bath at 60 °C for 30 min. the heated samples were centrifuged at 15,000 r/min for 20 min, and the supernatant was collected as TB-EPS. The three EPS were freeze-dried to make a lyophilized powder.
Following the above steps, the three EPS were extracted from the medium under the condition of 1 × 10³ mg/L of SDS, and the substrate was subsequently freeze-dried and set aside. The freeze-dried powders of the three EPS without added SDS and the three EPS with added 1 × 10³ mg/L of SDS were analyzed by 3D-EEM.
Three-dimensional-EEM maps were acquired by fluorescence spectrometer (F-8000, Hitachi, Chiyoda, Tokyo) with fluorescence excitation wavelengths of 300–500 nm at 3 nm intervals and emission wavelengths of 240–660 nm at 3 nm intervals; the instrumental parameters were, respectively, excitation slit of 5 nm, emission slit of 5 nm, photomultiplier tube (PMT) voltage of 400/700 V, and a scanning speed of 2400 nm/min. Measurements were made in a 1 cm quartz cuvette. The spectral feature parameters were resolved using a written spectral feature parameter extraction algorithm, and Rayleigh scattering was removed by Delaunay triangular interpolation. Data processing was run in MATLAB version 2012b.
Integral region method calculates the integral volume (Φi) and standardized volume (Φi,n, ΦT,n) of a fluorescence region, representing the relative value of the content of a certain structural organic compound in this region [20]. The calculation formula is shown in Equations (3)–(5).
Φ i , n = M F i Φ i = M F i e x e m I ( λ e x λ e m ) λ e x λ e m
Φ T , n = Φ i , n
P i , n = Φ i , n / Φ T , n × 100 %
where Φi,n are the integral standard volumes of fluorescence region i; Φi is the integral volume of the fluorescence region, au·nm2; λex is the excitation wavelength, nm; λem is the emission wavelength, nm; Iexλem) is the fluorescence intensity corresponding to the excitation and emission wavelengths, au; Pi,n is the proportion of the integral standard volume of a certain fluorescent region to the total integral standard volume; MFi is the multiplication coefficient, which is equal to the reciprocal of the integral area of a fluorescence region to the integral area of the total fluorescence region.

3. Results

3.1. Composition and Yield

3.1.1. EPS Component Identification

EPS are mainly composed of polysaccharides and proteins [21]. The EPS yields below are all polysaccharides and proteins added together. Among them, the linear regression equation between the absorbance value and concentration of polysaccharide standard solution was y = 0.00309x + 0.08342, R2 = 0.99156; the linear regression equation between the absorbance value and concentration of protein standard solution was y = 0.00278x + 0.4655, R2 = 0.993. It is worth mentioning that for the initial assay in LB liquid medium, a certain amount of protein and polysaccharide was measured at the beginning of the assay due to the addition of peptone and other substances in the composition of the LB liquid medium: the initial contents were 1.45 × 10³ mg/L protein and 0.79 × 10³ mg/L polysaccharide, respectively. As shown in Figure 1, the measured amounts of protein and polysaccharide were subtracted from their corresponding initial values to obtain the EPS sample content at 60h was 10.14 × 10³ mg/L, of which the polysaccharide content was 7.42 × 10³ mg/L and the protein content was 2.72 × 10³ mg/L.
Enterobacter cloacae were cultured in LB liquid medium pH (7.4) for 60 h (the optimum culture time shown in Figure 1). Fermentation supernatant and EPS obtained by isolation and purification were taken and subjected to TLC analysis and the results are shown in Table 3 TLC analysis.
The EPS obtained were glycolipids as shown by TLC analysis [22]. According to the residual amount of sugar (%: w/w) in the polysaccharide was determined using thin-layer chromatography (TLC) and high-performance liquid chromatography (HPLC): glucosamine, 37.2; glucose, 31.5; rhamnose, 26.3; xylose, 1.7; and unidentified sugar, 3.3. And the HPLC analysis showed that the main amino acid in the hydrolyzed solution of the EPS was glutamic acid, and the main component of the protein was polyglutamic acid.

3.1.2. Analysis of EPS Yield of Enterobacter Cloacae under Different Concentrations of SDS Stress

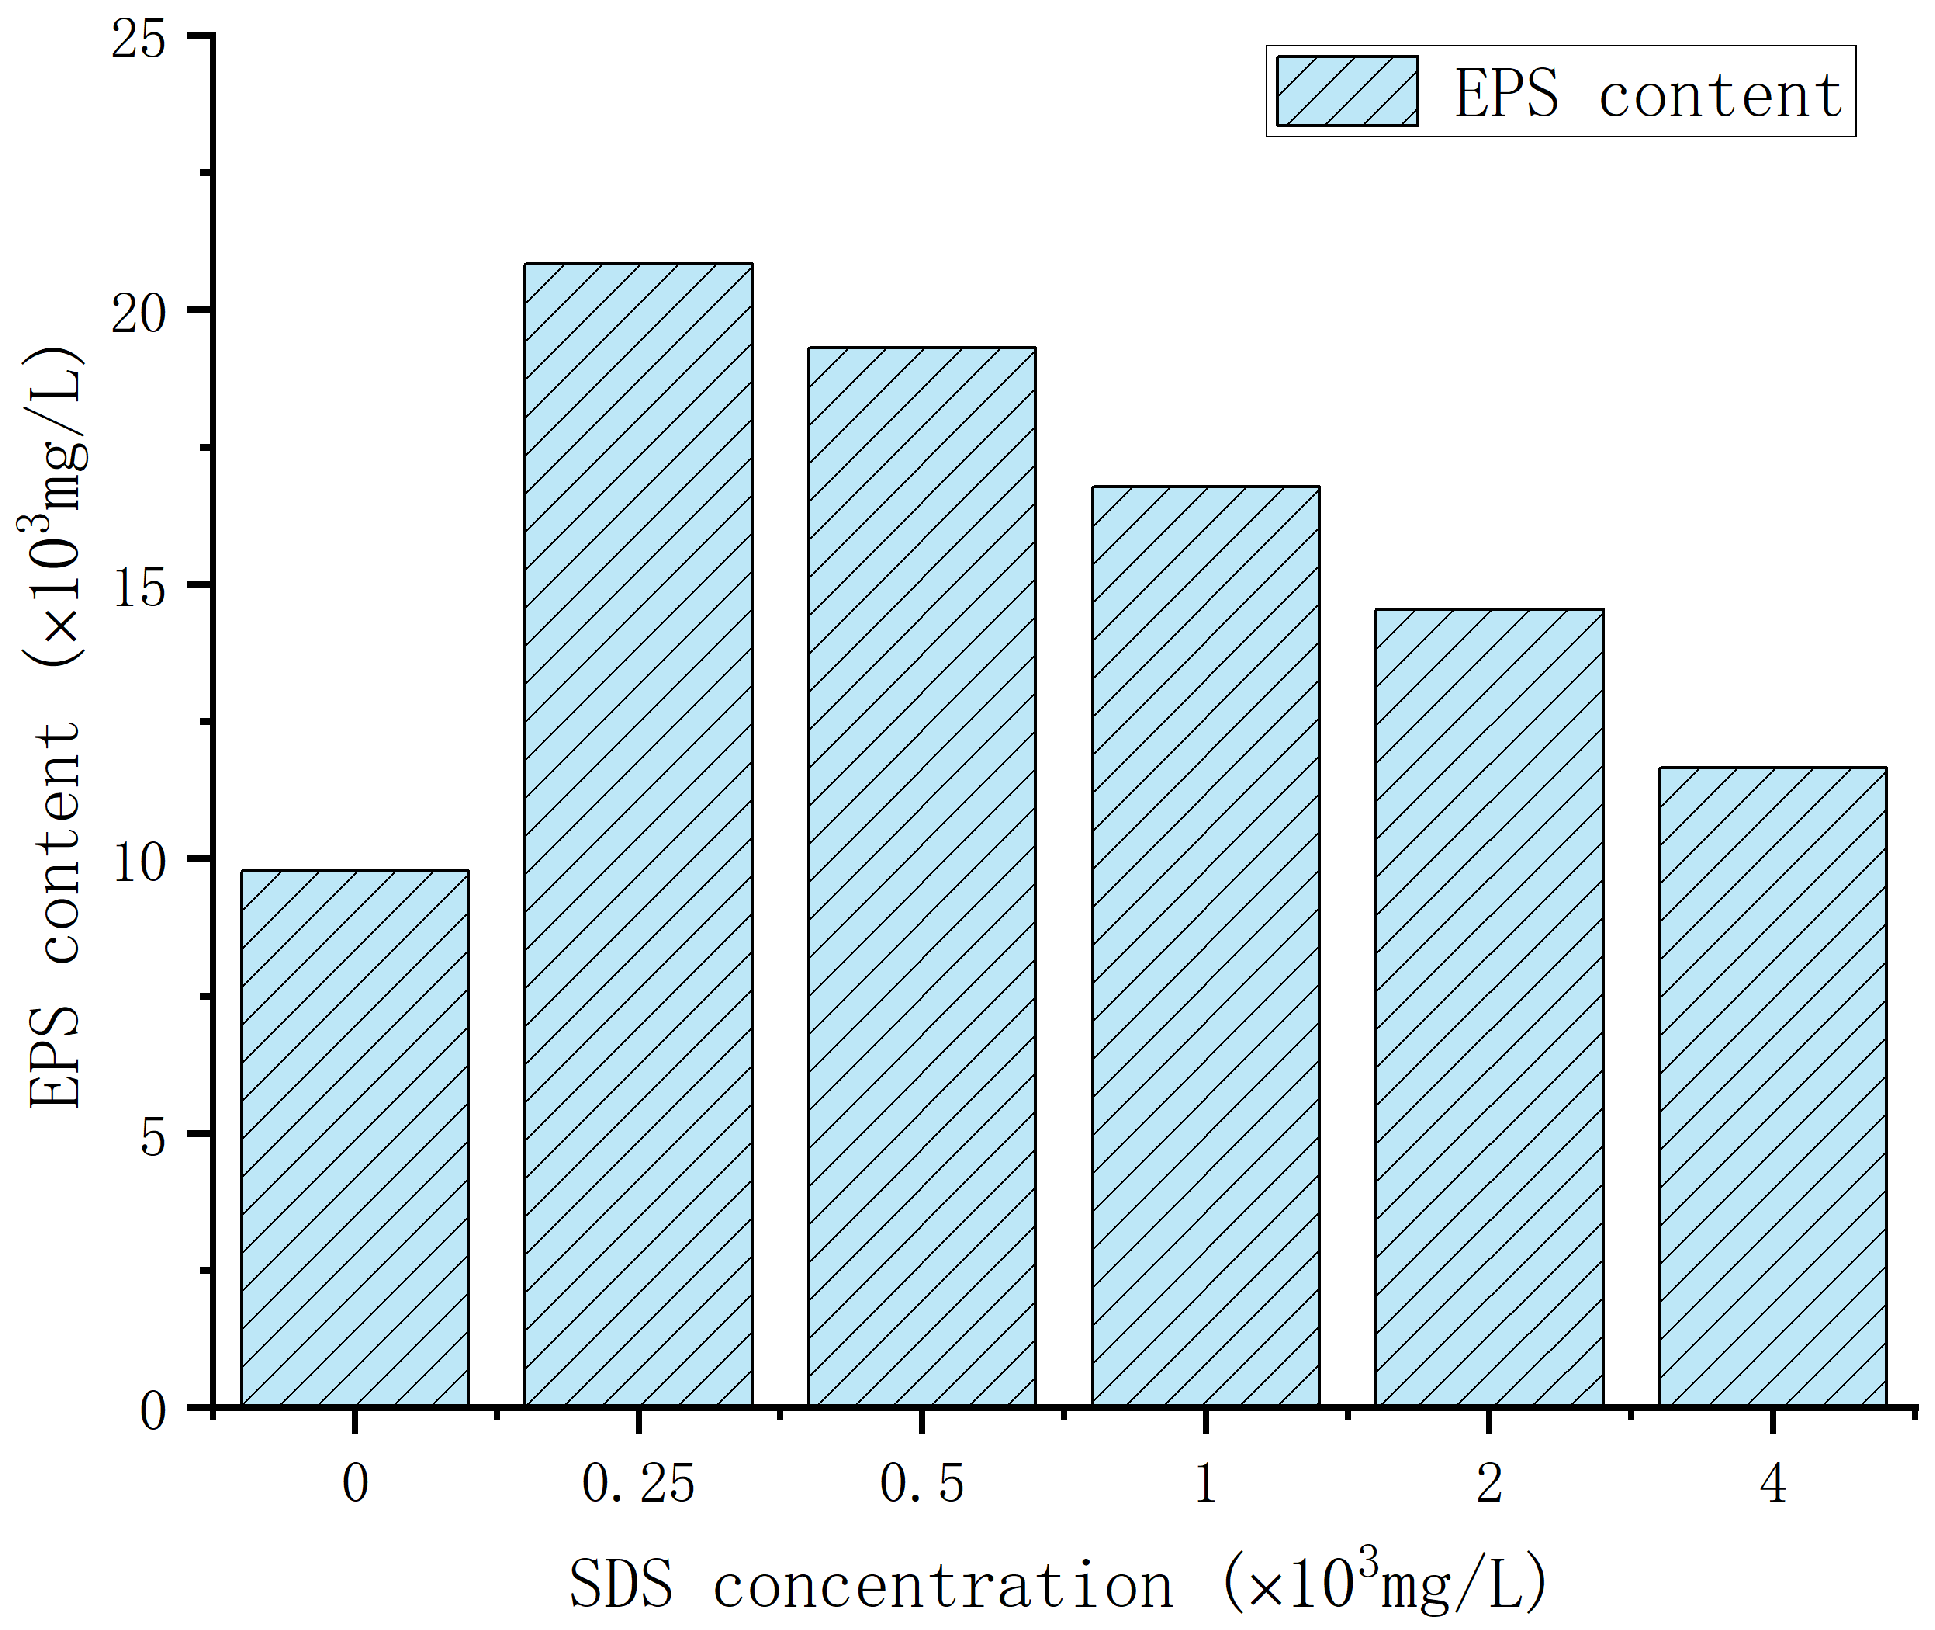
The cultured bacterial solution was fermented to the 7th day, and the surfactant induced the leakage of EPS from the intracellular to the extracellular, thus relieving the feedback inhibition of intracellular products, compared with the control group without surfactant addition. See Figure 2 below, when the concentration of SDS was 2.5 × 10² mg/L, the EPS production of Enterobacter cloacae reached a maximum of 20.8 × 10³ mg/L. In fact, the production of EPS was significantly increased after the addition of surfactant. Due to the different nature structure and concentration of surfactants, the effects of cell membrane permeability, leakage, and deletion will affect the fermentation metabolism of strain Enterobacter cloacae and produce different effects.

3.2. Changes in EPS under the Influence of SDS

3.2.1. EPS Functional Group Changes under the Influence of SDS

As shown in the IR spectral results of Figure 3, there was no significant change in the functional groups in all three EPS fractions in all experimental groups; in addition, the qualitative IR spectra of the three EPS were very similar. Bands ranging from 3200 to 1592 cm−1 were consistent with the results of protein and polysaccharide functional groups [14]. Polysaccharides (1120~1270 cm−1, C-O-C, and C-O stretching vibrations) and proteins (1420~1670 cm−1, C-N and N-H stretching) were detected in the three EPS. The infrared scanning spectrum shows that there is a strong absorption band at 3246 cm−1, indicating the presence of a large number of hydroxyl groups in the molecule, the absorption bands between 2120~3000 cm−1 and 1412 cm−1 are the absorption of the stretching vibration of the C-H bond on the carbon chain, 1659 cm−1 is the absorption band of the C=O, and 1101 cm−1 is the absorption band of the stretching vibration of the C-O-C bond, which suggests that the presence of an endo-structure and glycosidic bond in the molecule. As shown in Table 4. The absorption peak at 1265.32 cm−1 is a symmetric stretching vibration of CH2 on the methylene group indicating the presence of lipids. A strong shoulder peak can be seen at 2990 cm−1 which represents the presence of C=O stretching vibration in the sample indicating the presence of amide I (protein peptide bond).
After the addition of SDS, the peak intensities of most of the absorption peaks (3394, 1659, 1402 cm−1) of in the infrared spectra increased dramatically, and the content of functional groups increased. The increase in the content of amide and polysaccharide (3394, 1659, 1402 cm−1) indicates that a large number of proteins and polysaccharides were converted from insoluble to soluble state under the action of surfactant. The carboxyl group content increased substantially and significantly and hydrolyzed to carboxylic acids, carboxylates, etc. In summary, the extracted EPS were glycolipids, which is in agreement with the experimental results of the thin-layer chromatography method.

3.2.2. Particle Size Analysis of EPS under SDS Stress

The fermentation broth of the strain before and after centrifugation was subjected to laser particle size analysis. As shown in Figure 4I, the test results of the fermentation broth before filtration had two peaks with a measured particle size of d (0.5) = 30.392 μm. This indicates that not only free EPS, but also EPS bacterial film formed by the adhesion of EPS was present in the fermentation broth. The fermentation broth was filtered as shown in Figure 4II and the measured particle size was d (0.5) = 70.912 μm.
The main reason for the decrease in particle size after filtration is that the filter material consists mainly of bacterial membranes. Therefore, the particle size of the bacterial membrane can be preliminarily estimated as the difference between the particle size before and after filtration, which is 40.52 μm. This is closer to the particle size of the EPS bacterial membrane observed under the microscope. Using the polar method, it can be estimated that 10–45 bacterial cells can form a single-layer bacterial membrane by EPS adhesion. This means that the bacterial membrane is formed by a large number of microbial cells aggregated together, and these microbial cells adhere to each other through the extracellular polysaccharides produced.
As shown in Figure 5I, the measured particle size of the fermentation broth after the addition of SDS was d (0.5) = 41.393 μm, and the laser particle size results were analyzed for the pre-centrifugation and post-centrifugation fermentation broths of this experimental group. As shown in Figure 5II, the test result of the fermentation broth before filtration had two peaks and the measured particle size was d (0.5) = 117.24 μm. This indicates that the addition of surfactant SDS resulted in an increase in particle size.

3.2.3. Protein Fluorescence Intensity Analysis of EPS under SDS Stress

At high saturating concentrations above the critical micelle concentration (CMC), the binding of ionic surfactants to proteins leads to changes in the intrinsic structure of proteins, possibly through unfolding or denaturation processes. Although at low concentrations the binding of surfactant molecules is controlled by electrostatic forces, hydrophobic interactions become more important at concentrations above the CMC. Above CMC, surfactant molecules bind dynamically to the protein surface, leading to denaturation of the protein and imparting an additional charge, which results in a similar protein structure. Thus, at high saturating concentrations, surfactants can act as denaturing agents to induce protein unfolding and minimize their structural impact in electrophoresis.
Indeed, any surfactant may exhibit similar interaction patterns when bound to proteins. However, SDS–protein interactions have been extensively studied and characterized. It has been shown that submicelle SDS can bind to specific binding sites for a wide range of proteins, and that some proteins can be inserted into micelles close to the CMC in much the same way as mixed micelle formation. Furthermore, above the CMC, the same amount of SDS can bind cooperatively to most proteins, which then leads to structural denaturation and rearrangement [23].
The raw fluorescence spectra in the interval of 460~620 nm were subjected to Gaussian curve fitting [24], and the number of constituent peaks and their center positions are shown in Figure 6. The fluorescence intensity of EPS without additives was much higher than the fluorescence intensity of EPS containing 1 × 10³ mg/L SDS. It indicates that the fluorescence of EPS without the influence of SDS was received with higher intensity and changed more sensitively. In surfactant/protein systems, surfactants can interact with proteins, leading to changes in fluorescence intensity. The results showed that under the stress conditions of different surfactants, the fluorescence intensity basically decreased gradually at 490 nm, which might be due to the bursting effect of surfactants with proteins. In addition, it can be observed from Figure 6 that the shape of the emission peaks of the proteins did not change, in addition to the photon energy gap not being large, so the Stokes shift phenomenon was not obvious. This is because the effect of surfactant on extracellular proteins is mainly a bursting effect, and the structure of extracellular proteins is changed, indicating that there is a conjugate generated. Most of the experiments proved that the main roles of fluorescence bursting mechanisms are dynamic bursting, static bursting and non-radiative energy transfer. Therefore, some scholars [19] calculated the bursting constant Ksv, binding constant K, and thermodynamic parameters, and concluded that the stability of the surfactant–protein conjugate decreased with the increase in temperature, and Ksv decreased, so the process was static burst. Moreover, the Gibbs free energy (ΔG) is less than 0, and the enthalpy change (ΔH) and entropy change (ΔS) are greater than 0. The results showed that SDS acted as a hydrophobic force on proteins [25,26].
In addition, the decrease in fluorescence intensity may indicate the enhancement of burst fluorescence in the native state of tertiary interactions. This is because the presence of surfactants can break the structural stability of proteins, leading to changes in their original tertiary structure. Therefore, it is important to study the fluorescence properties of surfactant/protein systems for a deeper understanding of the interaction mechanism between surfactants and proteins.

3.2.4. Changes in Protein Results of under the Stress of SDS

EPS includes organic molecules with chromophore (light absorbing) and fluorophore (light emitting) parts that exhibit fluorescent properties. Three-dimensional excitation-emission matrix (3D-EEM) fluorescence spectroscopy is used as a fast, selective, and sensitive technique to capture specific fluorescent features and to distinguish between fluorescent compounds present in EPS [27]. Three-dimensional fluorescence spectroscopy was performed to explore the specific components in the conjugates generated by the interaction of surfactants with EPS. Chen [20] found that the red shift of fluorescence peak was related to the presence of carbonyl substituents, hydroxyl groups, alkoxy groups, amino groups, and carboxyl groups. Blue shift is associated with the splitting of macromolecules into smaller fragments and the elimination of specific functional groups, including carbonyl, hydroxyl, and amines. The standard atlas of tryptophan and other proteins refer to the autocorrelation literature [20,28,29,30].
Addition of the EPS to a dilute aqueous solution of ANS resulted in an increase in fluorescence intensity and a blue shift consistent with binding of ANS to the mixed protein. This suggests that the mixed protein exposes hydrophobic regions compatible with the amphiphilic nature of the molecule required for surfactant activity. Observations were made to see protein–SDS complexes. In Figure 7, it can be seen that peaks symbolizing various types of proteins were generated in the EPS. Among them, 36.8% (region II, tryptophan-like proteins) and 30.4% (region IV, soluble microbial by-products), followed by region I (tyrosine-like proteins) at 14.5%, region III (fulvic acid-like substances) at 11.5%, and region V (humic acid-like organics) at 6.8%. Tryptophan-like proteins and soluble microbial by-products, also known as proteins, were the major compounds in the EPS.
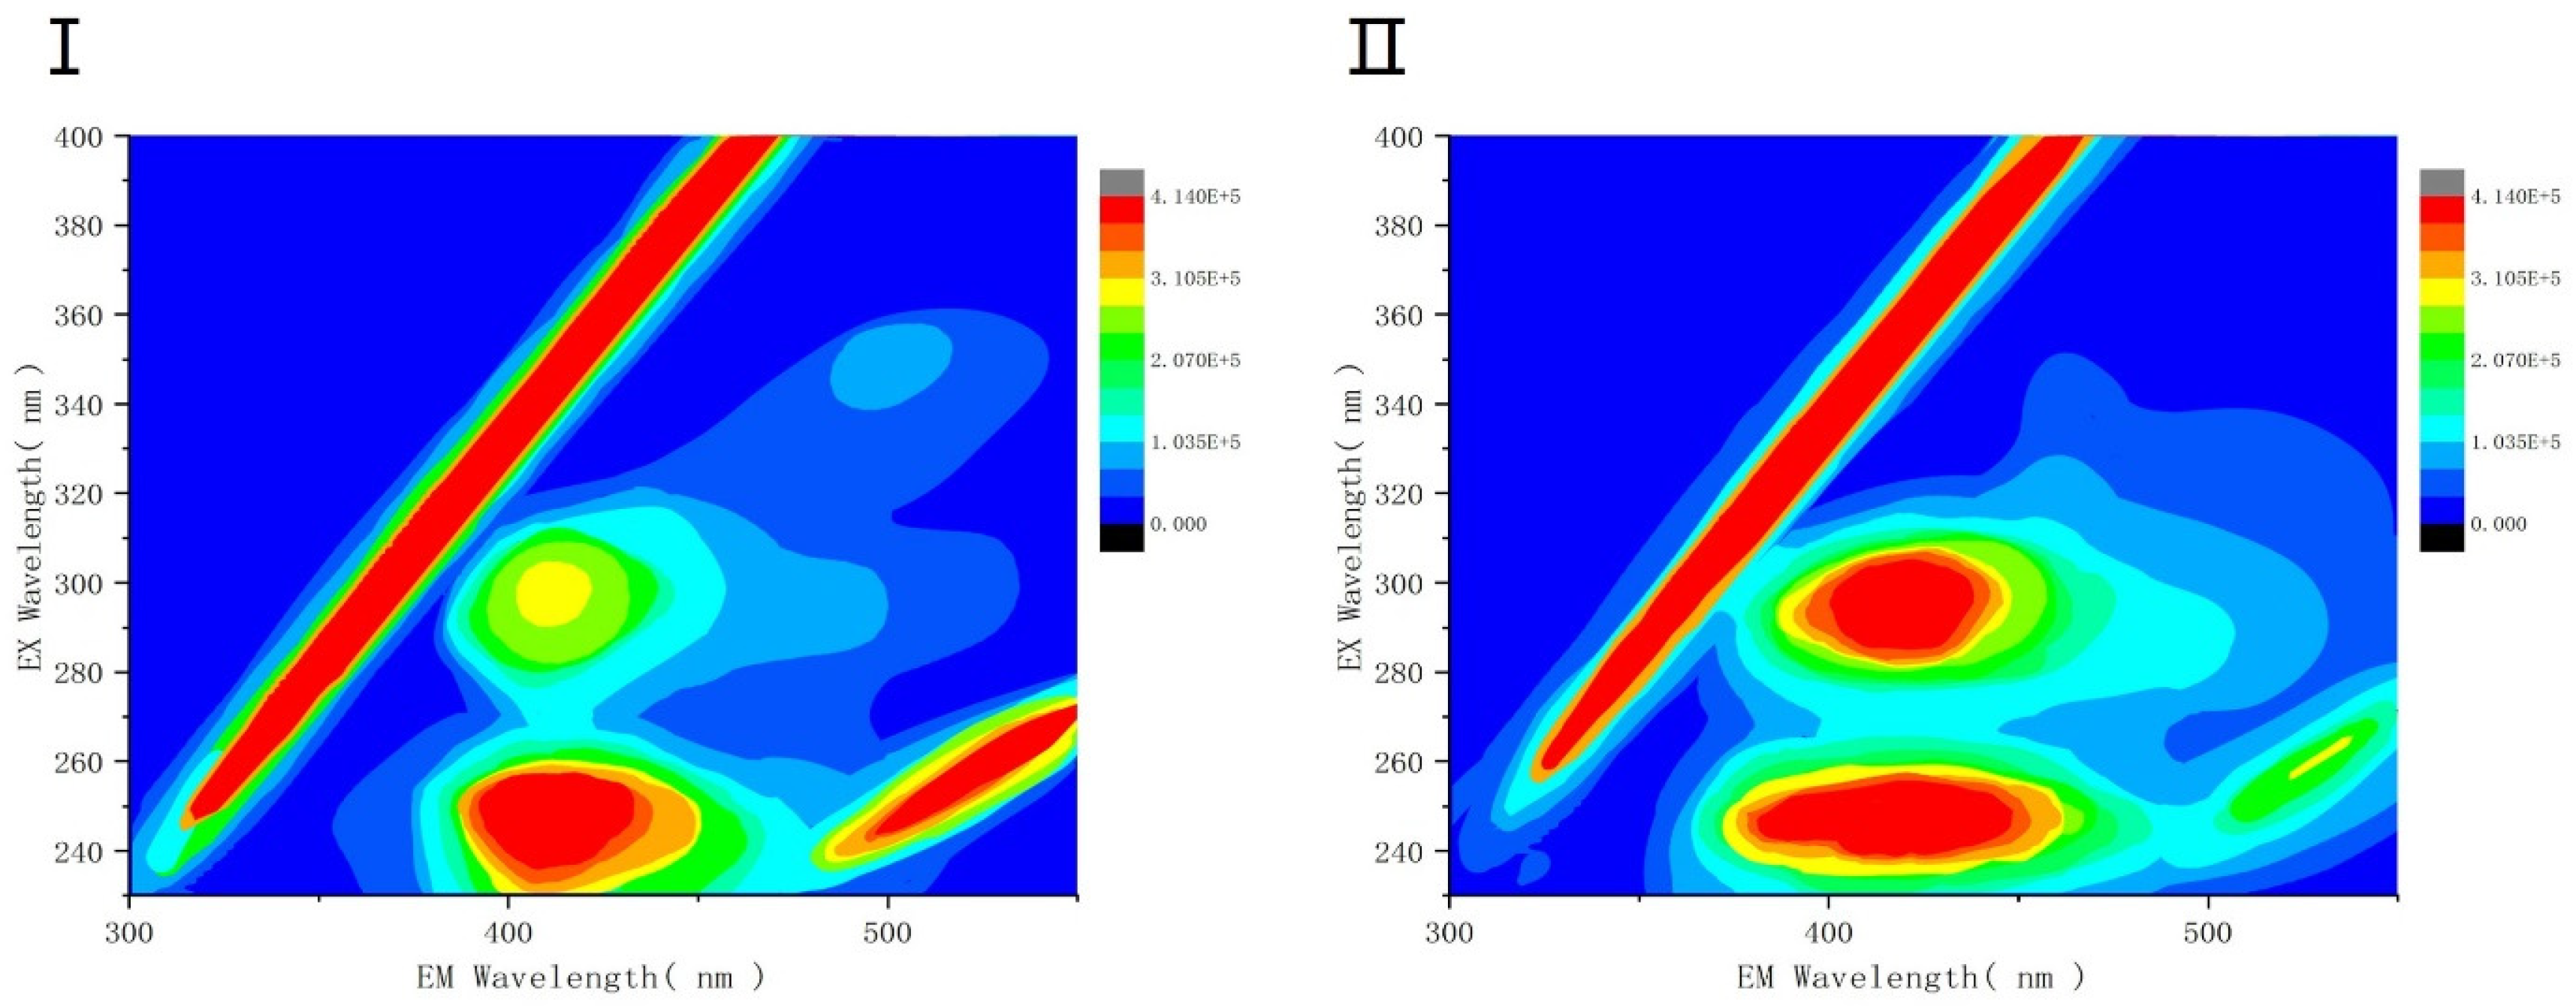
From Figure 8, it can be concluded that the main compounds of SL-EPS are tryptophan-like proteins and some protein-like soluble microbial by-products. The peak at region II 270/310–330 nm, which produces peaks indicating that the EPS contains tryptophan-like protein substances; the peak in region V produces a blue shift, which suggests that humic-like substances are present in SL-EPS and that the reason for the production of this humic substance is the natural decay during cell growth, which produces proteins that are degraded into humic substances.
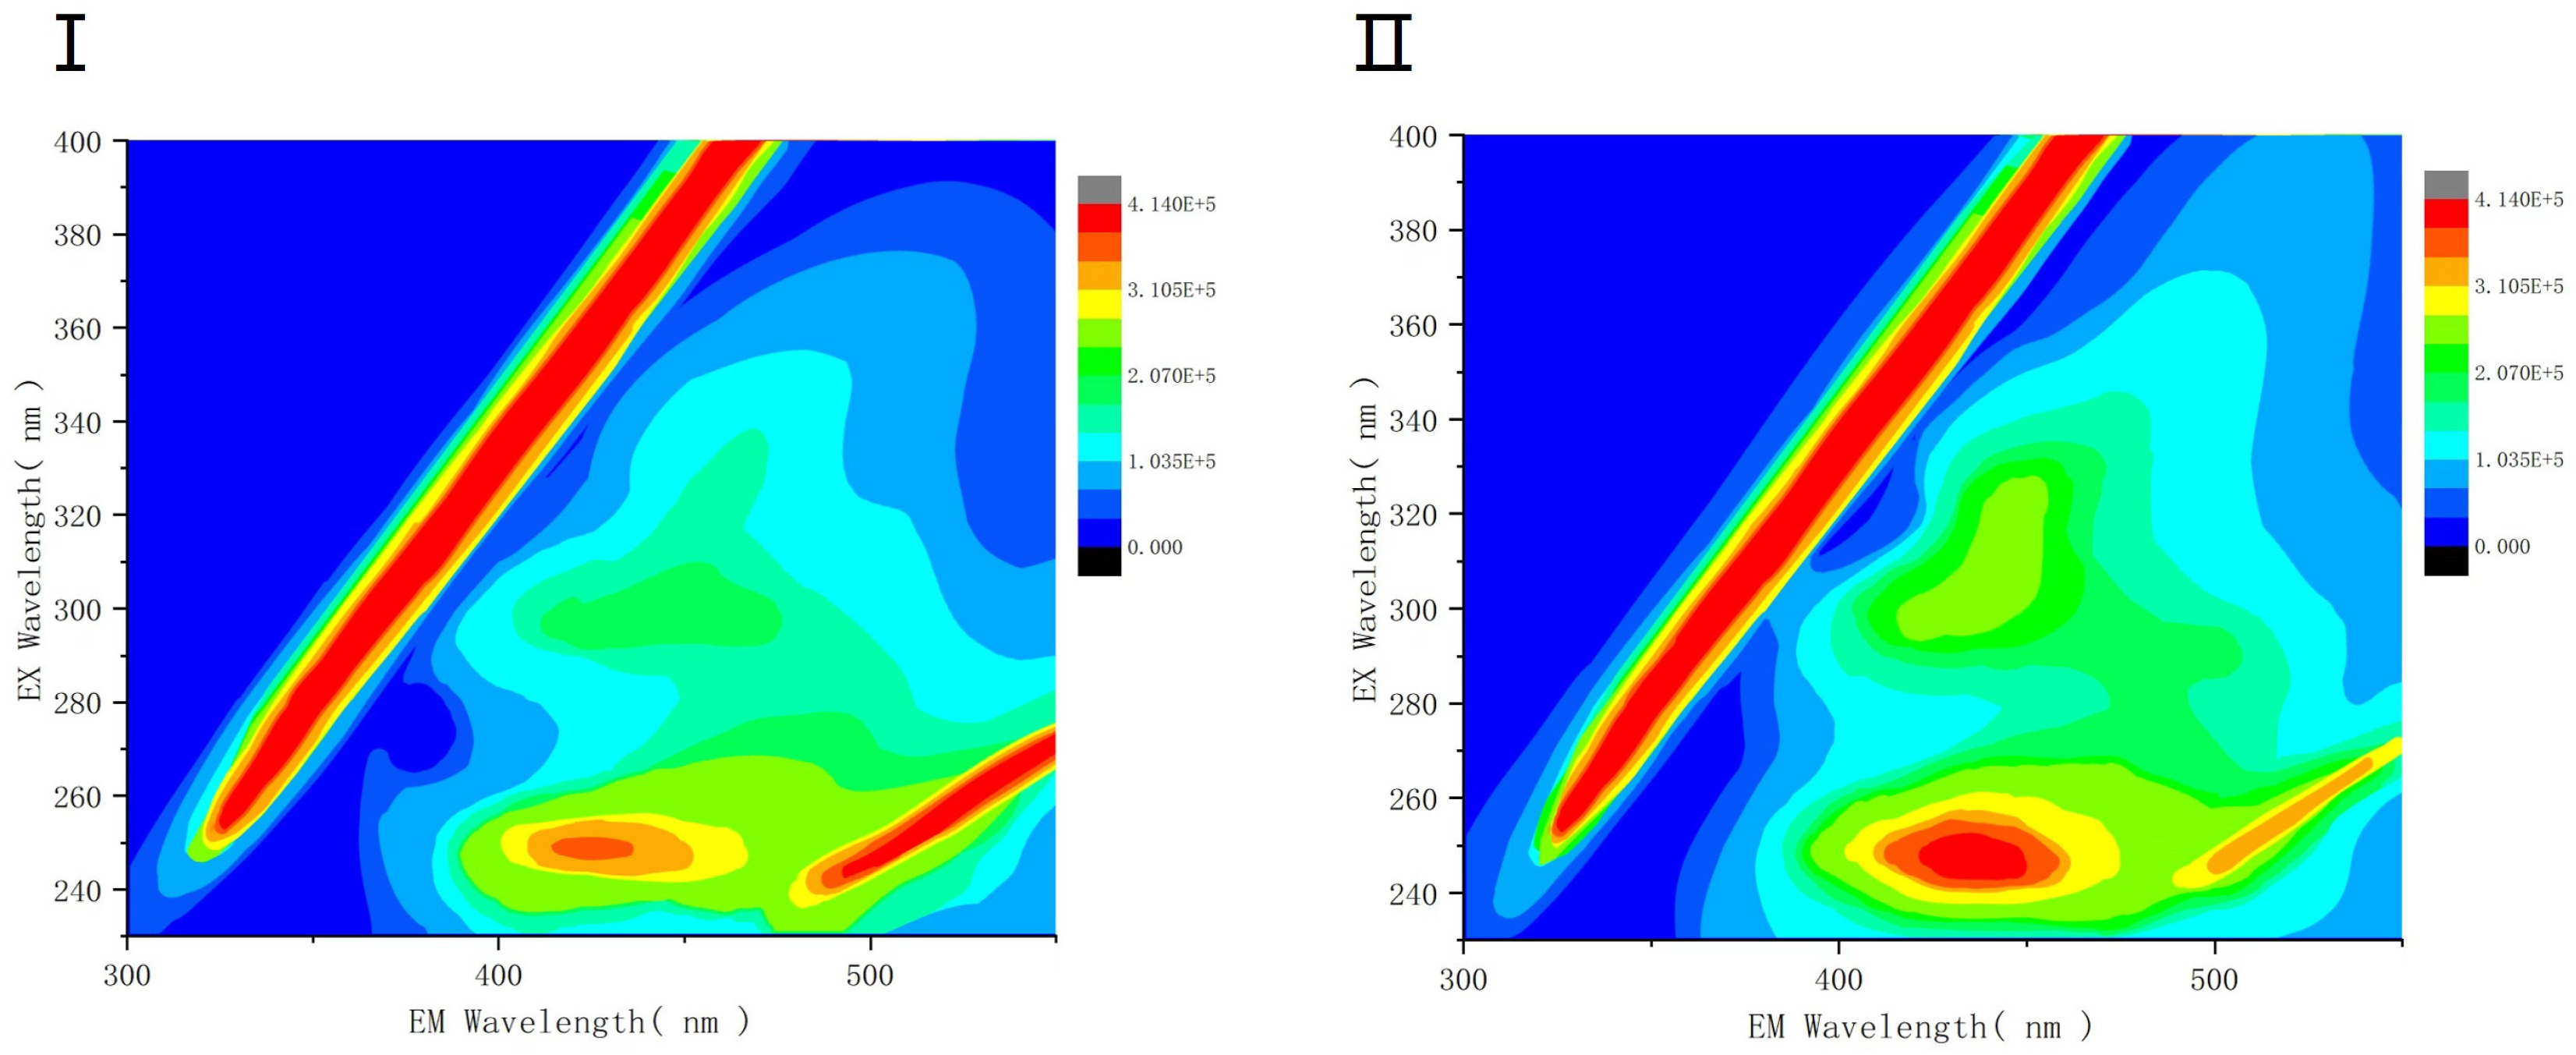
And from Figure 9, it can be concluded that peaks belonging to class tyrosine and aromatic proteins were detected simultaneously in both groups with and without added SDS. It indicates that LB-EPS contains tyrosine and aromatic proteins. In addition, the 3D-EEM spectra of LB-EPS showed region II and region IV, which represent tryptophan-like and protein-like substances. It is concluded that SDS surfactant may increase tryptophan substances in LB-EPS.
In the TB-EPS fractions (shown in Figure 10), region III appears in each group, which indicates the presence of fulvic acid. The 3D-EEM profile results showed that tryptophan-like substances, humic acid, aromatic compounds, and protein-like substances were also present. Tryptophan and protein-like substances were detected in three EPS fractions, while humic acid-like substances were distributed only in SL-EPS. Aromatic-like proteins were only present in LB-EPS and TB-EPS. And it was demonstrated that SDS surfactant had a greater effect on SL-EPS than on EPS. It is possible that the extracellular proteins in this fraction are essential for maintaining the structural stability of the EPS matrix. It was also found that the production of signaling molecules, such as autoinducer-2 (AI-2) and N-acylhomoserine lactone (AHL), was also inhibited, which may be due to Protease k hydrolyzes quorum sensing receptor proteins.

4. Discussion

4.1. Surfactant Stimulation of Enterobacter cloacae Membrane Mechanism

Differences in the concentration of surfactants will result in different effects such as cell membrane permeation, leakage, and deletion. Figure 11 presumed to be the mechanism of surfactant-infested activities of Enterobacter cloacae; when the surfactant concentration of 2.5 × 10² mg/L, it changes the ultrastructure of the outer layer of the cell membrane, forming transmembrane channels, reducing the clogging of the cell membrane, and accelerating the transport of products through the cell membrane. Surfactant also increases the rate of transmembrane transport of organic substances, and increases the secretion of metabolites from the cell about 10.69 × 10³ mg/L. This is because the amount of surfactant tolerated by the bacterial cell seems to contribute to the transport of substrates and metabolites, as well as enzymes involved in the synthesis and release of EPS various microbial bio-enzymes, such as extracellular endoglucanase, exoglucanase, and β-glucosidase, and enhance the microbial translocation of metabolites level. Palomares [31] found that surfactants interact with the cell membrane barrier of Gram-negative bacteria, such as Enterobacter cloacae, during Gram-negative stress cultures, resulting in increased cell damage and leakage.
SDS breaks the non-covalent bonds inside and outside the protein molecule, i.e., reduces the disulfide bonds within the molecule, and binds to the protein causing it to unfold, thus disrupting the [32] secondary and tertiary structure of the protein molecule, changing the original spatial conformation and denaturing the protein [33]. When the concentration of SDS is higher than 1 × 10³ mg/L, it causes severe damage to the cell barrier and prevents growth. On the other hand, fatty acids play an important role in forming positive or negative interactions with phospholipids, which enlarge the pores of the cell membrane. Thus, surfactants contribute to increase the production of EPS and enhance nutrient uptake by wetting the cell membrane.

4.2. Prediction of the Entanglement Pattern between EPS Protein and Surfactant

Through the international Protein Structure Database (RCSB PDB), as shown in Figure 12, the surfactant and the EPS formed a necklace-bead winding structure of SDS–protein. The increase in the particle size of the fermentation broth by 30 μm after the addition of SDS also verified the experimental results of a researcher who pointed out that the addition of surfactant increases the particle size. The protein molecule of EPS in its natural state has 12 sulfonate binding sites, and when the number of SDS bound to a protein molecule is 15, SDS can play a stabilizing role. When the number of bound SDS exceeds 15, it starts to tend to defold the structure, thus exposing more binding sites and leading to further destabilization of the protein conformation. When studying complexes of surfactants and proteins, it is important to understand the structure to gain insight into the nature and behavior of the complexes. The necklace-bead structure of the SDS–BSA and lysozyme–SDS complexes suggests that the proteins are entangled around the SDS micelles to form a highly ordered structure. This structure not only affects the physical properties of the complexes, but may also influence their biological activity and toxicity.
Therefore, studying the structures of these complexes is important for the design and synthesis of more efficient surfactant–protein complexes. In the future, by using electron spin resonance and nuclear magnetic resonance (NMR) techniques, a deeper understanding of the structure and properties of these complexes can be obtained, which, in turn, will provide a more comprehensive and in-depth understanding of surfactant-protein interactions.
Accordingly, this can be preliminarily inferred that due to the large particle size (d (0.5) = 117.24 μm), better ductility [34], and adsorption capacity of this mixed system. The ductility can improve the stress relaxation degree of the composite system; in addition, the increase in adsorption capacity can effectively reduce the oil–water separation and stratification in the reservoir. In non-homogeneous reservoirs, the distribution of oil and water is not uniform, and the presence of aqueous phase will lead to an increase in the water content in the reservoir and reduce the oil recovery efficiency. While utilizing the mixed system with large particle size and ductility, a plugging agent barrier [3] can be formed to avoid the water phase from entering the oil reservoir, while regulating the reservoir pressure and improving the oil recovery efficiency. In addition, fluorescence burst electron transfer in the mixed system can realize the detection and quantification of protein factors in the system, which provides a new means to study the oil-water separation mechanism and regulation of non-homogeneous reservoirs.

4.3. Changes in Protein Components in Different Forms of EPS

Figure 8, Figure 9 and Figure 10 show that tryptophan and protein-like substances were detected in the three EPS components, while humic acid-like substances were only distributed in SL-EPS, and aromatic proteins were only present in LB-EPS and TB-EPS. The protein-like fluorescence peaks of EPS under the influence of SDS are significantly elevated and dominate the total fluorescence intensity. This is due to the fact that the larger the emission wavelength, the larger the average molecular weight of the corresponding organic matter, and the more complex structure, such as having more aromatic rings or covalent bonds. Under the impact condition of SDS in a certain SDS concentration range, the mass fraction of each type of organic matter in LB-EPS showed a gradual increase, while the mass fraction of each type of organic matter in TB-EPS continued to decrease. The negative correlation analysis of the two results indicated that the increase in the mass fraction of some organics in LB-EPS mainly originated from the dissolution and release of the corresponding components in TB-EPS.

5. Conclusions

(1)
The EPS was used as the research object, and the total production of EPS without surfactant stimulation was the highest 10.14 × 10³mg/L, of which the polysaccharide content was 7.42 × 10³ mg/L, and the protein content was 2.72 × 10³ mg/L. The addition of surfactant could induce the leakage of EPS from the intracellular to the extracellular, and EPS production reached a maximum of 20.83 × 10³ mg/L at the concentration of SDS of 2.5 × 10³ mg/L.
(2)
The particle size of EPS, as well as its functional groups, changed under SDS stimulation conditions. After centrifugation, the laser particle size increased from d (0.5) = 70.912 μm to a particle size of d (0.5) = 117.24 μm. Most of the absorption peaks (3394, 1659, and 1402 cm−1) showed a substantial increase in peak intensity and an increase in the content of functional groups. The increased content of amide and polysaccharide (3394, 1659, 1402 cm−1) indicates that a large number of proteins and polysaccharides were converted from insoluble to soluble state under the action of surfactant. The content of carboxyl groups increased dramatically and significantly and were hydrolyzed to carboxylic acids and carboxylates.
(3)
By protein fluorescence spectroscopy, it was concluded that the fluorescence intensity of EPS under the influence of surfactant SDS at a concentration of 1 × 10³ mg/L were lower than that of the blank group, and the process occurred as a fluorescence bursting effect, suggesting that a conjugate was generated, and so the interaction of the three EPS with SDS was further combined with the 3D-EEM technique, which showed that tryptophan-like, humic acid-like, and humic acid-like species were present in the EPS, aromatic compounds, and protein-like proteins. Tryptophan- and protein-like substances were detected in the three EPS components, whereas humic acid-like substances were distributed only in SL-EPS and aromatic-like proteins were present only in LB-EPS and TB-EPS. It was demonstrated that SDS surfactant had a greater effect on SL-EPS than on other types of EPS.

Author Contributions

Methodology, H.Z.; Resources, X.Z.; validation, D.L. All authors have read and agreed to the published version of the manuscript.

Funding

The research was funded by the Scientific research starting project of Nanchong Science and Technology Bureau, grant number No.SXQHJH053; the Sichuan Science and Technology Program, grant number No. MZGC20230089; the National Natural Science Foundation of China, grant number No.51804265, No.51674208; the Opening Project of Oil & Gas Field Applied Chemistry Key Laboratory of Sichuan Province, grant number No.YQKF202109.

Data Availability Statement

The data presented in this study are available on request from the corresponding author.

Conflicts of Interest

The authors declare no conflict of interest. The funders had no role in the design of the study; in the collection, analyses, or interpretation of data; in the writing of the manuscript; or in the decision to publish the results.

References

  1. Patel, J.; Borgohain, S.; Kumar, M.; Rangarajan, V.; Somasundaran, P.; Sen, R. Recent Developments in Microbial Enhanced Oil Recovery. Renew. Sustain. Energy Rev. 2015, 52, 1539–1558. [Google Scholar] [CrossRef]
  2. Haddad, H.; Khaz’ali, A.R.; Mehrabani-Zeinabad, A.; Jazini, M. Investigating the Potential of Microbial Enhanced Oil Recovery in Carbonate Reservoirs Using Bacillus Persicus. Fuel 2023, 334, 126757. [Google Scholar] [CrossRef]
  3. Yunita Halim, A.; Marie Nielsen, S.; Eliasson Lantz, A.; Sander Suicmez, V.; Lindeloff, N.; Shapiro, A. Investigation of Spore Forming Bacterial Flooding for Enhanced Oil Recovery in a North Sea Chalk Reservoir. J. Pet. Sci. Eng. 2015, 133, 444–454. [Google Scholar] [CrossRef]
  4. Xu, W.; Song, X.; Qu, Q.; Gong, Z.; Xiao, W. Synergistic Effects of l-Theanine and Epigallocatechin Gallate in Alleviating Ovalbumin Allergy by Regulating Intestinal Immunity through Inhibition of Mast Cell Degranulation. Food Funct. 2023, 14, 2059–2073. [Google Scholar] [CrossRef]
  5. Van Hamme, J.D.; Ward, O.P. Physical and Metabolic Interactions of Pseudomonas sp. Strain JA5-B45 and Rhodococcus sp. Strain F9-D79 during Growth on Crude Oil and Effect of a Chemical Surfactant on Them. Appl. Environ. Microbiol. 2001, 67, 4874–4879. [Google Scholar] [CrossRef]
  6. Li, M.; Yu, J.; Cao, L.; Yin, Y.; Su, Z.; Chen, S.; Li, G.; Ma, T. Facultative Anaerobic Conversion of Lignocellulose Biomass to New Bioemulsifier by Thermophilic Geobacillus Thermodenitrificans NG80-2. J. Hazard. Mater. 2023, 443, 130210. [Google Scholar] [CrossRef]
  7. Liu, S.; Peng, X.; Yang, H.; Zhang, X.; Qu, Y.G.; Li, J.; Xu, H.; Xie, T. A Novel Iron Biomineralization on Basaltic Rocks from the Challenger Deep, Southern Mariana Trench. Chem. Geol. 2023, 635, 121617. [Google Scholar] [CrossRef]
  8. Pal, A.; Paul, A.K. Microbial Extracellular Polymeric Substances: Central Elements in Heavy Metal Bioremediation. Indian J. Microbiol. 2008, 48, 49–64. [Google Scholar] [CrossRef]
  9. Li, S.; Li, Y.; Hu, G.; Zhang, C.; Shen, T.; Liu, S.; Zhou, Y. Impacts of Surfactant Stress on the Growth of Four Kinds of Bacteria. Environ. Sci. Surv. 2021, 40, 1–4+46. [Google Scholar] [CrossRef]
  10. Groot, R.D.; Rabone, K.L. Mesoscopic Simulation of Cell Membrane Damage, Morphology Change and Rupture by Nonionic Surfactants. Biophys. J. 2001, 81, 725–736. [Google Scholar] [CrossRef]
  11. Berlin, E.; Lizano-Fallas, V.; Carrasco Del Amor, A.; Fresnedo, O.; Cristobal, S. Nonionic Surfactants Can Modify the Thermal Stability of Globular and Membrane Proteins Interfering with the Thermal Proteome Profiling Principles to Identify Protein Targets. Anal. Chem. 2023, 95, 4033–4042. [Google Scholar] [CrossRef] [PubMed]
  12. Shen, L.; Cheng, J.; Wang, J.; Cui, L.; Zhang, Y.; Liao, W.; Liu, Z.; Zhou, H.; Wu, X.; Li, J.; et al. Comparison of Extraction Methods for Extracellular Polymeric Substances (EPS) and Dynamic Characterization of EPS from Sessile Microorganisms during Pyrite Bioleaching. J. Environ. Chem. Eng. 2022, 10, 107922. [Google Scholar] [CrossRef]
  13. Mahata, C.; Dhar, S.; Ray, S.; Das, D. Flocculation Characteristics of Anaerobic Sludge Driven-Extracellular Polymeric Substance (EPS) Extracted by Different Methods on Microalgae Harvesting for Lipid Utilization. Biochem. Eng. J. 2021, 167, 107898. [Google Scholar] [CrossRef]
  14. Han, J.; Li, H.; Liu, Y.; Liu, P.; Song, Y.; Wang, Y.; Zhang, L.; Wang, W. Extraction of Extracellular Polymeric Substances (EPS) from Indigenous Bacteria of Rare Earth Tailings and Application to Removal of Thorium Ions (Th4+). Water Sci. Technol. 2023, 87, 83–98. [Google Scholar] [CrossRef]
  15. Wu, L.; Gao, Y.; Ren, W.; Su, Y.; Li, J.; Du, Y.; Wang, Q.; Kuang, H. Rapid Determination and Origin Identification of Total Polysaccharides Contents in Schisandra Chinensis by Near-Infrared Spectroscopy. Spectrochim. Acta Part A Mol. Biomol. Spectrosc. 2022, 264, 120327. [Google Scholar] [CrossRef]
  16. Kielkopf, C.L.; Bauer, W.; Urbatsch, I.L. Bradford Assay for Determining Protein Concentration. Cold Spring Harb. Protoc. 2020, 2020, 102269. [Google Scholar] [CrossRef]
  17. Zhang, M.; Xu, Y.; Xiao, K.-Q.; Gao, C.-H.; Wang, S.; Zhu, D.; Wu, Y.; Huang, Q.; Cai, P. Characterising Soil Extracellular Polymeric Substances (EPS) by Application of Spectral-Chemometrics and Deconstruction of the Extraction Process. Chem. Geol. 2023, 618, 121271. [Google Scholar] [CrossRef]
  18. Azadi, G.; Chauhan, A.; Tripathi, A. Dilution of Protein-surfactant Complexes: A Fluorescence Study. Protein Sci. 2013, 22, 1258–1265. [Google Scholar] [CrossRef]
  19. Huang, H.; Pan, J.; Spielberg, D.R.; Hanchard, N.A.; Scott, D.A.; Burrage, L.C.; Dai, H.; Murdock, D.; Rosenfeld, J.A.; Mohammad, A.; et al. A Dominant Negative Variant of RAB5B Disrupts Maturation of Surfactant Protein B and Surfactant Protein C. Proc. Natl. Acad. Sci. USA 2022, 119, e2105228119. [Google Scholar] [CrossRef]
  20. Chen, W.; Westerhoff, P.; Leenheer, J.A.; Booksh, K. Fluorescence Excitation−Emission Matrix Regional Integration to Quantify Spectra for Dissolved Organic Matter. Environ. Sci. Technol. 2003, 37, 5701–5710. [Google Scholar] [CrossRef]
  21. Bevia, V.; Calatayud, J.; Cortés, J.-C.; Jornet, M. On the Generalized Logistic Random Differential Equation: Theoretical Analysis and Numerical Simulations with Real-World Data. Commun. Nonlinear Sci. Numer. Simul. 2023, 116, 106832. [Google Scholar] [CrossRef]
  22. Palomares-Navarro, J.J.; Bernal-Mercado, A.T.; González-Aguilar, G.A.; Ortega-Ramirez, L.A.; Martínez-Téllez, M.A.; Ayala-Zavala, J.F. Antibiofilm Action of Plant Terpenes in Salmonella Strains: Potential Inhibitors of the Synthesis of Extracellular Polymeric Substances. Pathogens 2022, 12, 35. [Google Scholar] [CrossRef] [PubMed]
  23. Zhang, S.; Li, C.; Zhou, G.; Che, G.; You, J.; Suo, Y. Determination of the Carbohydrates from Notopterygium Forbesii Boiss by HPLC with Fluorescence Detection. Carbohydr. Polym. 2013, 97, 794–799. [Google Scholar] [CrossRef]
  24. Sun, J.; Zhang, L.; Xiao, M.; Li, S.; Chen, R.; Li, Y.; Yang, Y. Systematic Analysis and Case Series of the Diagnosis and Management of Trichilemmal Carcinoma. Front. Oncol. 2023, 12, 1078272. [Google Scholar] [CrossRef] [PubMed]
  25. Ross, P.D.; Subramanian, S. Thermodynamics of Protein Association Reactions: Forces Contributing to Stability. Biochemistry 1981, 20, 3096–3102. [Google Scholar] [CrossRef]
  26. Anamul Hoque, M.; Abdul Rub, M.; Majibur Rahman, M.; Abdullah Khan, M.; Kumar, D.; Asiri, A.M. Micellization, Interaction and Thermodynamics Behavior of BSA + SDS Mixture in Aqua-Organic Mixed Solvent: Influences of Temperature and Solvent Composition. J. Mol. Liq. 2021, 344, 117770. [Google Scholar] [CrossRef]
  27. Ravi, S.G.; Shadizadeh, S.R.; Moghaddasi, J. Core Flooding Tests to Investigate the Effects of IFT Reduction and Wettability Alteration on Oil Recovery: Using Mulberry Leaf Extract. Pet. Sci. Technol. 2015, 33, 257–264. [Google Scholar] [CrossRef]
  28. Meng, F.; Lin, W. Application of three-dimensional fluorescence technique in the detection of sarcosine oxidase of active protein. Chin. J. Anal. Lab. 2021, 40, 1257–1264. [Google Scholar] [CrossRef]
  29. Zhu, L.; Qi, H.; Lv, M.; Kong, Y.; Yu, Y.; Xu, X. Component Analysis of Extracellular Polymeric Substances (EPS) during Aerobic Sludge Granulation Using FTIR and 3D-EEM Technologies. Bioresour. Technol. 2012, 124, 455–459. [Google Scholar] [CrossRef]
  30. Peng, J.; Wen, K.; Liu, W.; Yue, X.; Wang, A.; Zhou, A. EPS Solubilization and Waste Activated Sludge Acidification Enhanced by Alkaline-Assisted Bi-Frequency Ultrasonic Pretreatment Revealed by 3D-EEM Fluorescence. RSC Adv. 2016, 6, 80493–80500. [Google Scholar] [CrossRef]
  31. Tatsumi, T.; Imai, Y.; Kawaguchi, K.; Miyano, N.; Ikeda, I. Antimicrobial Activity of Cationic Gemini Surfactant Containing an Oxycarbonyl Group in the Lipophilic Portion against Gram-Positive and Gram-Negative Microorganisms. J. Oleo Sci. 2014, 63, 137–140. [Google Scholar] [CrossRef] [PubMed]
  32. Salama, Y.; Chennaoui, M.; Sylla, A.; Mountadar, M.; Rihani, M.; Assobhei, O. Characterization, Structure, and Function of Extracellular Polymeric Substances (EPS) of Microbial Biofilm in Biological Wastewater Treatment Systems: A Review. Desalination Water Treat. 2016, 57, 16220–16237. [Google Scholar] [CrossRef]
  33. Xie, Y.; Zheng, D.; Yang, T.; Zhang, Z.; Xu, W.; Liu, H.; Li, W. Head-to-Head Comparison of High-Performance Liquid Chromatography versus Nuclear Magnetic Resonance for the Quantitative Analysis of Carbohydrates in Yiqi Fumai Lyophilized Injection. Molecules 2023, 28, 765. [Google Scholar] [CrossRef] [PubMed]
  34. Yu, Z.; Lau, D. Molecular Dynamics Study on Stiffness and Ductility in Chitin-Protein Composite. J. Mater. Sci. 2015, 50, 7149–7157. [Google Scholar] [CrossRef]
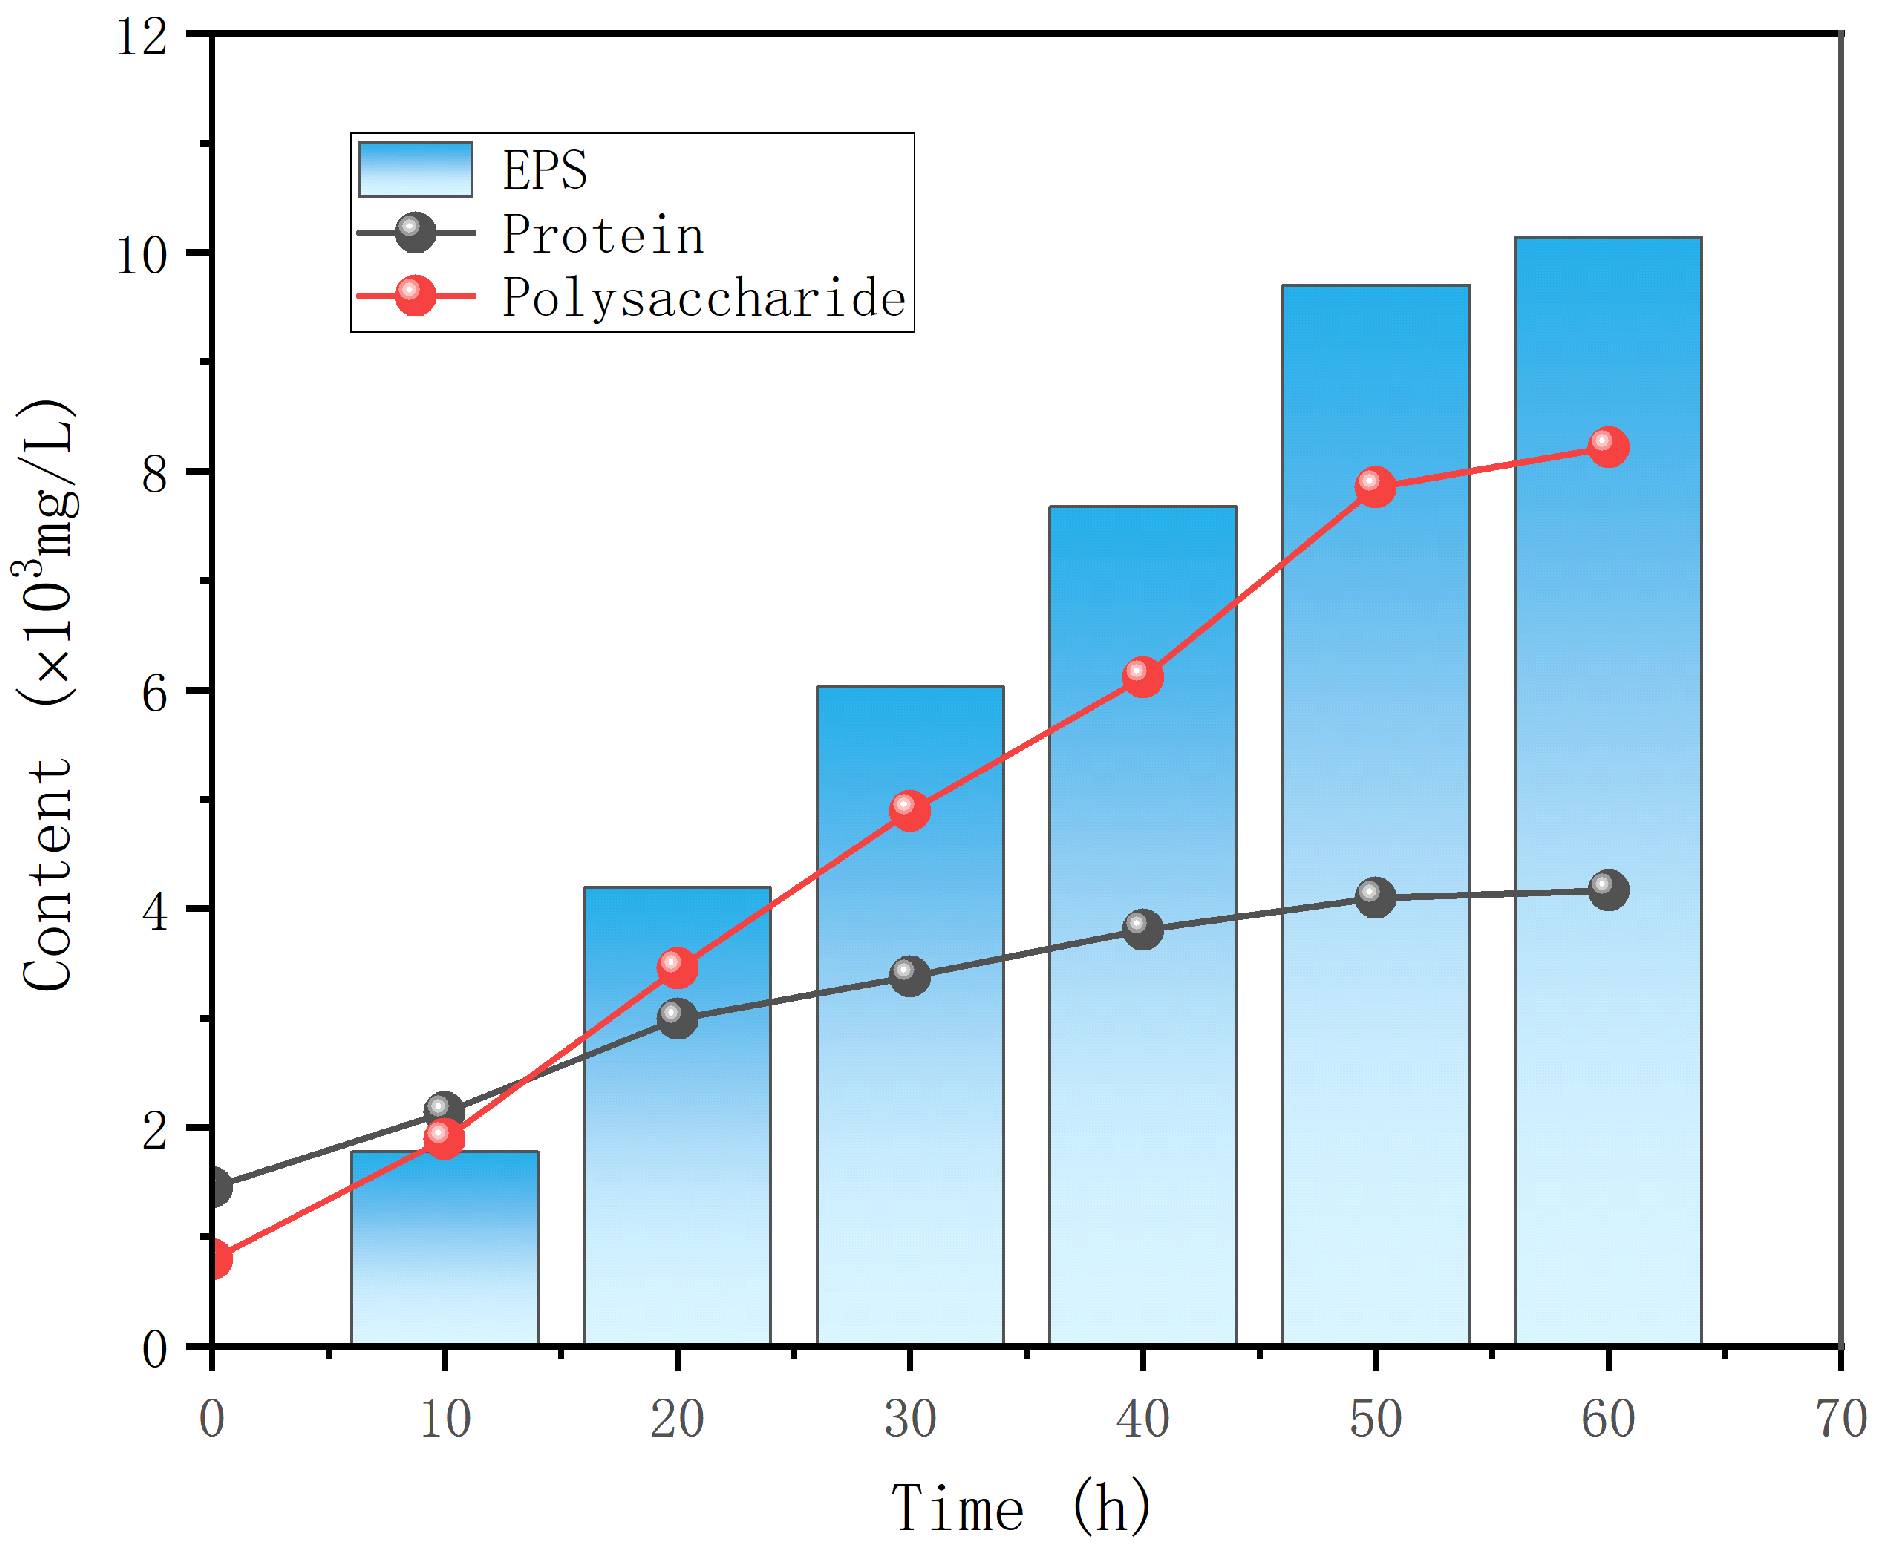
Figure 1. EPS composition content.
Processes 11 03212 g001
Figure 2. Effect of different surfactants on EPS production.
Processes 11 03212 g002
Figure 3. EPS FT-IR (I) 1 × 10³ mg/L SDS + EPS; (II) 5 × 10² mg/L SDS + EPS; (III) 0 mg/L SDS + EPS.
Processes 11 03212 g003
Figure 4. Particle size before and after centrifugation of fermentation broth without SDS addition (I,II).
Processes 11 03212 g004
Figure 5. Particle size of fermentation broth before and after centrifugation of 3 mM SDS-added (I,II).
Processes 11 03212 g005
Figure 6. Protein fluorescence intensity.
Processes 11 03212 g006
Figure 7. 3D-EEM spectrum of EPS.
Processes 11 03212 g007
Figure 8. 3D-EEM spectra of SL-EPS without SDS (I) and with SDS (II).
Processes 11 03212 g008
Figure 9. 3D-EEM spectra of LB-EPS without SDS (I) and with SDS (II).
Processes 11 03212 g009
Figure 10. 3D-EEM spectra of TB-EPS without SDS (I) and with SDS (II).
Processes 11 03212 g010
Figure 11. Mechanism of surfactant infestation of Enterobacter cloacae (DAB as dye).
Processes 11 03212 g011
Figure 12. EPS proteins with surfactant entangled structures.
Processes 11 03212 g012
Table 1. Liquid-phase gradient condition.
Time (min)A%B%
1496
143565
166040
1126040
112.1595
Table 2. Comparison of fluorescence model with CMC above experimental values.
SDS (mM)MicelleFl (Calculated Value)FI (Experimental Value)% Error
151.13 × 10201.67 × 1061.67 × 106
107.53 × 10191.11 × 1061.13 × 1061.12
126.02 × 101912.92 × 10512.122 × 1051.1
64.52 × 10196.69 × 10⁵6.60 × 1051.4
Note: Data in Table 2 are quoted from the literature [18].
Table 3. TLC results of biosurfactants.
MetaboliteNinhydrin
Color Development
Phenol-Sulfuric Acid
Color Development
supernatantno color changereddish brown
biosurfactantno color changereddish brown
Table 4. Peak positions of biopolymers observed by infrared spectroscopy.
Peak Position cm−1Functional Group
1402.27δ(C-H), δ(OH)
1265.32δ(C-O-C)
1153.45υ(C=O)
2164.168υ(C-H)
2990.68υ(C=O)
Disclaimer/Publisher’s Note: The statements, opinions and data contained in all publications are solely those of the individual author(s) and contributor(s) and not of MDPI and/or the editor(s). MDPI and/or the editor(s) disclaim responsibility for any injury to people or property resulting from any ideas, methods, instructions or products referred to in the content.