Article

Significance of Pressure Drop, Changing Molar Flow, and Formation of Steam in the Accurate Modeling of a Multi-Tubular Fischer–Tropsch Reactor with Cobalt as Catalyst

Department of Chemical Engineering, Center of Energy Technology (ZET), University of Bayreuth, 95440 Bayreuth, Germany
*
Author to whom correspondence should be addressed.
Processes 2023, 11(12), 3281; https://doi.org/10.3390/pr11123281
Submission received: 20 September 2023 / Revised: 15 November 2023 / Accepted: 16 November 2023 / Published: 23 November 2023
(This article belongs to the Special Issue Chemical Process Modelling and Simulation)

Abstract

:
A Fischer–Tropsch (FT) fixed-bed reactor was simulated with reactor models of different complexities to elucidate the impact of a pressure drop, a change in the total molar volume rate (induced by the reaction) along the tubes, and a change in the axial variation of the external radial heat transfer coefficient (external tube wall to cooling medium, here, boiling water) compared to disregarding these aspects. The reaction kinetics of CO conversion for cobalt as a catalyst were utilized, and the influence of inhibition of syngas (CO, H2) conversion reaction rate by steam, inevitably formed during FT synthesis, was also investigated. The analysis of the behavior of the reactor (axial/radial temperature profiles, productivity regarding the hydrocarbons formed, and syngas conversion) clearly shows that, for accurate reactor modeling, the decline in the total molar flow from the reaction and the pressure drop should be considered; both effects change the gas velocity along the tubes and, thus, the residence time and syngas conversion compared to disregarding these aspects. Only in rare cases do both opposing effects cancel each other out. The inhibition of the reaction rate by steam should also be considered for cobalt as a catalyst if the final partial pressure of steam in the tubes exceeds about 5 bar. In contrast, the impact of an axially changing heat transfer coefficient is almost negligible compared to disregarding this effect.

Graphical Abstract

1. Introduction

An option for producing liquid fuels, such as diesel oil or jet fuel, which is not based on crude oil, is the Fischer–Tropsch synthesis (FTS). Currently, the synthesis gas for FTS (CO, H2) is produced from coal or natural gas, e.g., in South Africa, Nigeria, Uzbekistan, and Qatar. In future, other, mainly non-fossil resources may also be considered for FTS: H2 can be produced via water electrolysis using renewable energy, such as solar and wind. CO2 is separated from the off-gases from power plants, from the off-gases from production of steel, cement, or industrial chemicals, or, in the future, also from air, as, for example, currently tested in the so-called Orca carbon-capture plant located near Reykjavik in Iceland.
Concentrated CO2 (after conversion to CO) is then used as a carbon source for FT syngas, a mixture of H2 and CO in a typical ratio of 2, e.g., via reverse water–gas shift (CO2 + H2 → CO + H2O) or, in future, potentially via the co-electrolysis of CO2 and H2O.
In two publications [1,2], we discussed the influence of the distribution of activity of a cobalt catalyst along the tubes on the operation of a cooled multi-tubular FT reactor with and without gas recycle and purge gas. However, the reactor model used so far to simulate the performance of a single tube—and, thus, in principle, of a technical FT reactor with up to 10,000 tubes by simply numbering up—still had drawbacks and simplifications as follows:
(1)
The velocity of the gas us in the tubes was assumed as constant, which was an (over)simplification.
(2)
The pressure drop, which affects the reaction rate and gas velocity (and, thus, residence time), was only calculated separately but not considered in the (as yet) isobaric reactor model.
(3)
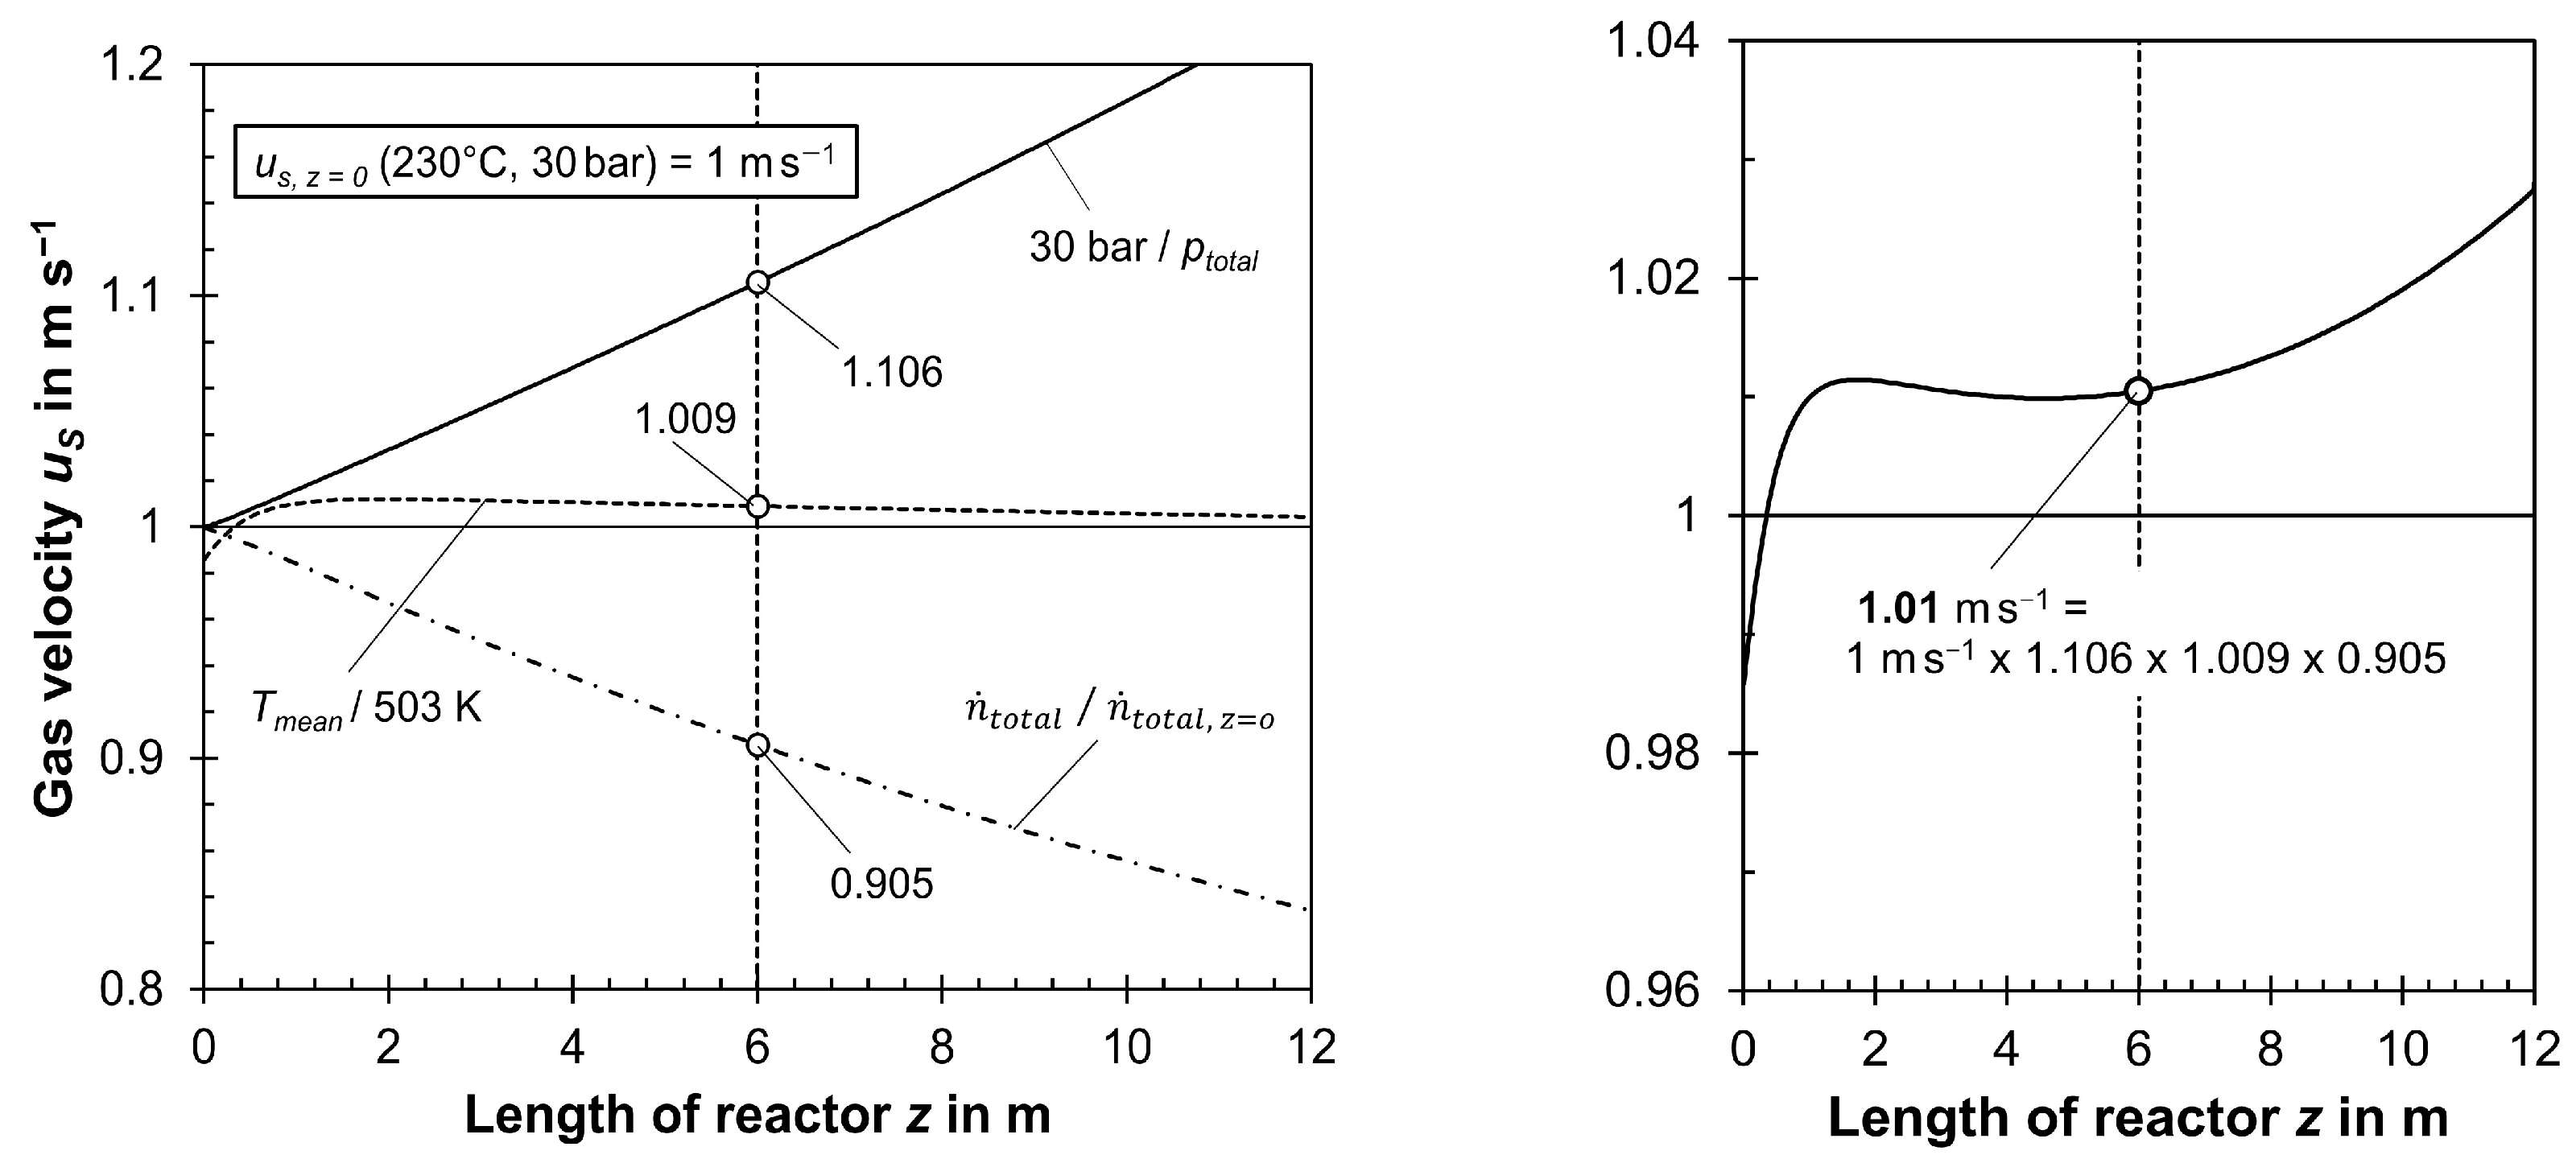
The decline in the total molar flow in the tubes via FT reaction—about 20% for a CO conversion of 50% (see Section 3.2)—was neglected, although this, accordingly, reduces gas velocity, increases residence time, and, through this—as explained descriptively—the conversion (to be precise, a lower molar flow raises the residual concentrations of CO and H2 and, thus, the reaction rate and conversion compared to disregarding this effect).
(4)
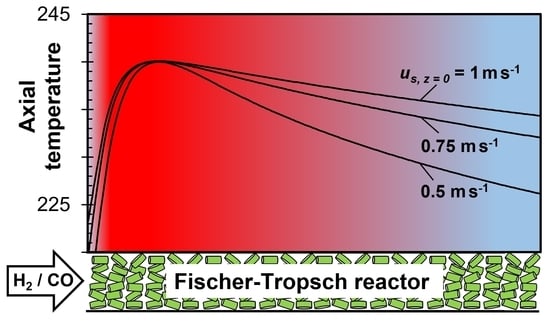
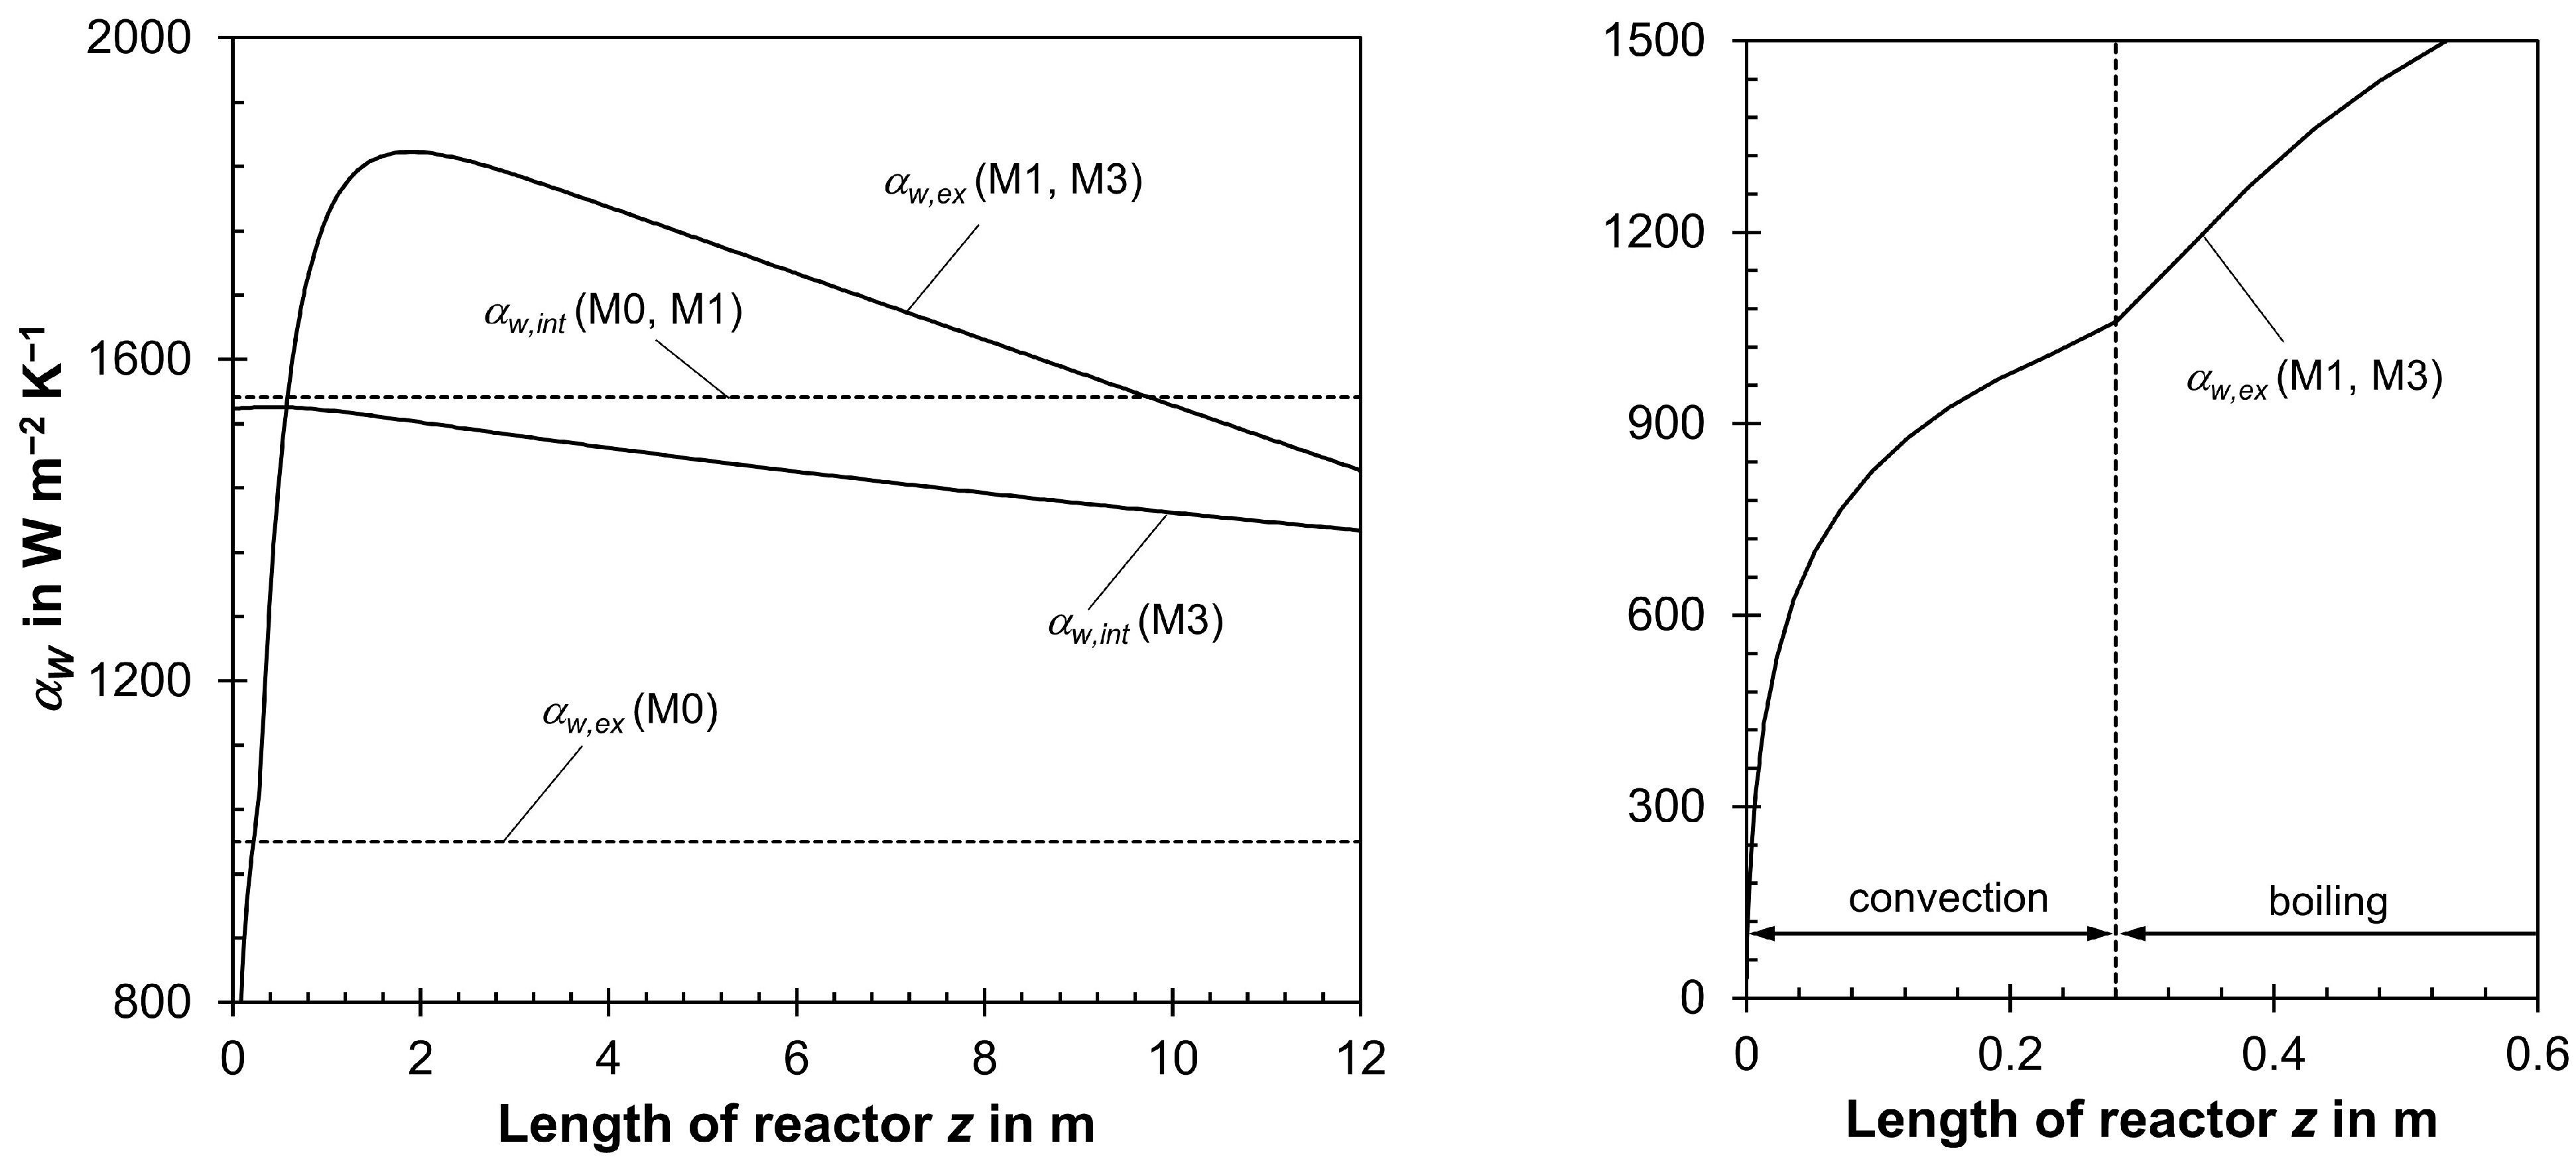
The heat transfer coefficient αw,ex (external tube wall to boiling water) was assumed to be constant, but this depends on the pressure and temperature of the boiling water and—even more importantly—on the local value of the radial heat flux. Hence, αw,ex varies along the tubes, and a maximum is located at the maximum of the axial temperature.
(5)
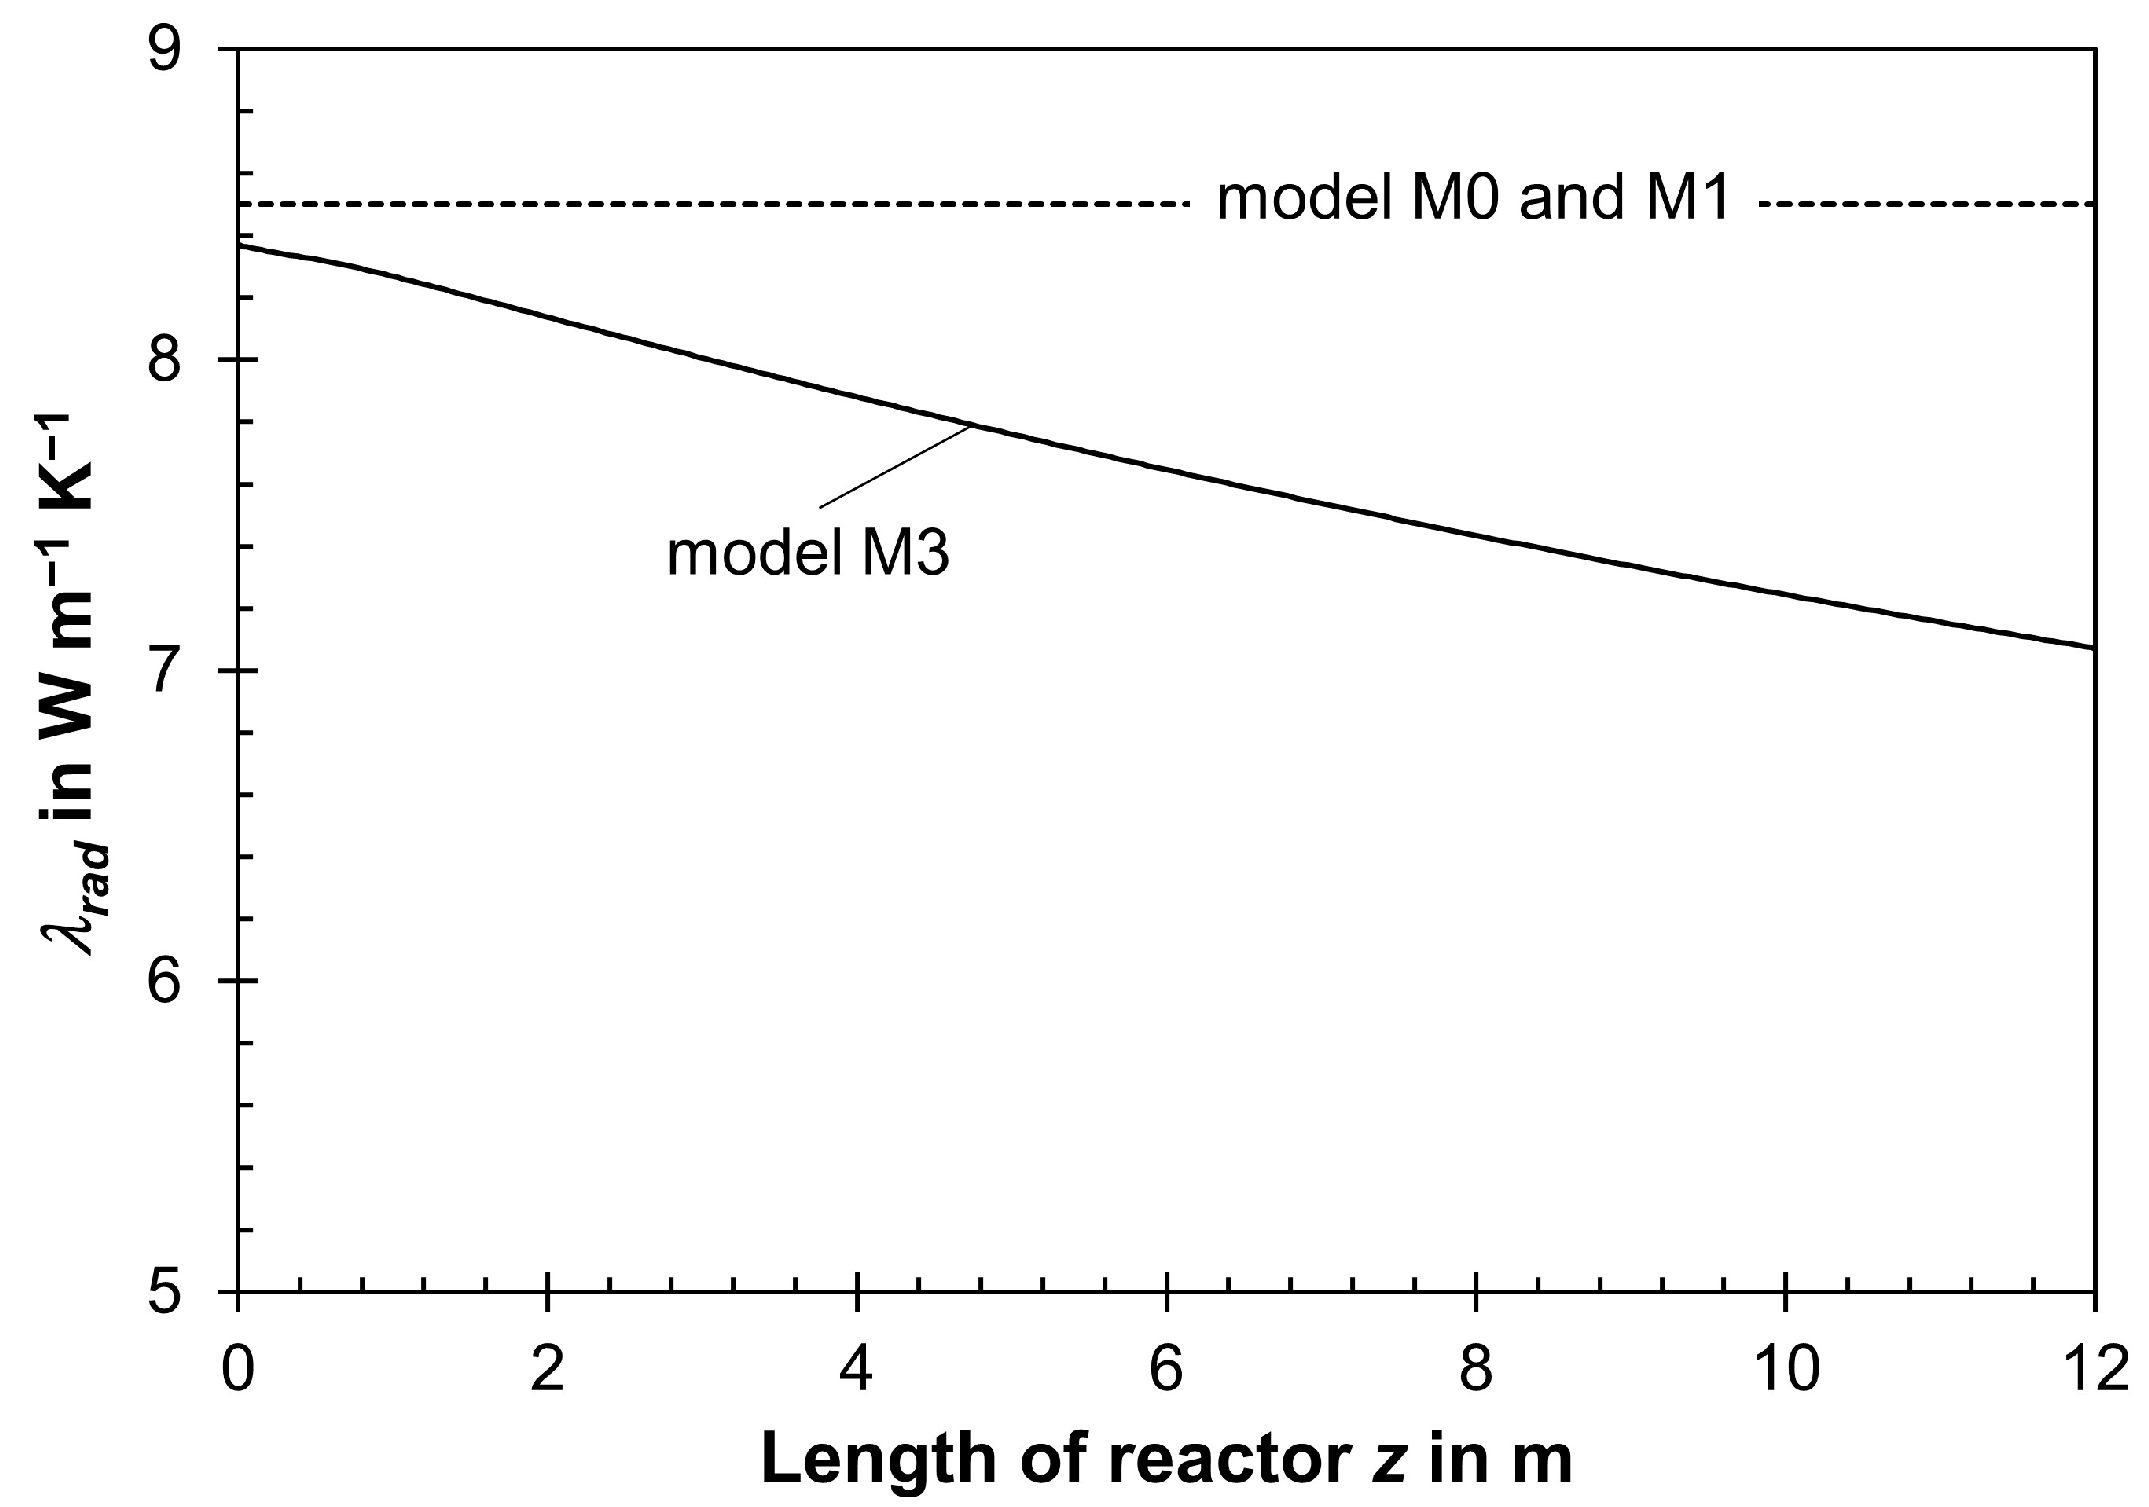
The effective radial thermal conductivity λrad and, also, the heat transfer coefficient on the internal side of the wall αw,int depend on us, but they were calculated simply based on the initial value of us, which was assumed to be constant and, hence, fixed in each model calculation. In reality, a change in gas velocity in the axial direction, induced by a pressure drop and/or a decrease in total molar flow from the reaction, changes both λrad and αw,in in the axial direction in the tubes.
(6)
The kinetic equations for the rate of CO conversion neglected any inhibiting influence of steam on the activity of the co-catalyst, which is not true for a high partial pressure of steam, particularly in the rear part of the tubes. Based on our experience, the influence is almost negligible for pH2O < 5 bar, but it may be relevant if a higher value is reached [3].
We now implemented all these aspects in advanced reactor models and discussed step by step their individual and combined influence on the outcome, evaluated and compared via CO conversion and production of C2+-hydrocarbons (HCs), in order to elucidate the significance of each factor in the accuracy of a model of an FT reactor and cooled fixed beds in general beyond FT. All these aspects have not been analyzed to date for a fixed-bed FT reactor.
The kinetics of FTS with Co as a catalyst, the methods of FT reactor modeling, and the data of technical FT reactors were presented in our own recent publication [1] and in the literature, e.g., [4,5,6,7].

2. Objectives and Methodology

2.1. Intrinsic and Effective Reaction Kinetics of Fischer–Tropsch Synthesis (FTS)

The main reaction of FTS is the formation of C2+-hydrocarbons:
CO + 2H2 → (-CH2-) + H2O  ∆RHCH20298 = −152 kJ mol−1
The term (-CH2-) represents a methylene group of a paraffinic hydrocarbon. In a (formal) kinetic description of the FTS, the formation of methane is often treated as a separate reaction:
CO + 3H2 → CH4 + H2O  ∆RHCH40298 = −206 kJ mol−1
The equations of the chemical rates of CO to CH4 and C2+-HCs in the absence of mass transfer limitations with cobalt as a catalyst (following an approach according to Langmuir–Hinshelwood) were already reported with all kinetic parameters [1]. Here, we only treat important aspects, such as the coefficient Ca (see below) and the impact of pore diffusion, in order to facilitate reading.
The intrinsic chemical rate of CO (without influence of mass transfer) is given by the formation rate of CH4 and C2+-HCs, as CO2 formation by water–gas shift is negligible for a Co catalyst:
r m ,   C O = d n ˙ C O d m c a t = C a   r m , C O ,   C H 4 + r m , C O ,   C 2 +  
The intrinsic rates rm,CO,CH4 and rm,CO,C2+ were experimentally determined with a Pt-promoted (0.03 wt.% Pt to facilitate Co reduction) 10 wt.% Co/γ-Al2O3 catalyst [1]. The coefficient of activity Ca in Equation (3) considers the Co content and thus the purely chemical activity. Ca is set to one for 10% Co, and an increase/decline in Ca is considered to be realized by a rise or drop in the Co content. FT catalysts typically contain up to 30% Co (Ca ≈ 3), a value mostly assumed in this study.
In this work, we have also extended the intrinsic rate equations by a term considering the inhibition by steam, which is relevant if a high concentration is reached in the rear part of the tubes. The re-evaluation of our experiments [3] yields the following (rough) approximation:
r m ,   C O , H 2 O = r m ,   C O   1 c H 2 O 472   mol   m - 3  
For example, a partial pressure of steam of 5 bar (120 mol/m3 at 230 °C) leads to a decline in the intrinsic chemical reaction rate by 25%.
Equations (3) and (4) only reflect the intrinsic rate, but pore diffusion limitations decrease the effective rate compared to the intrinsic one for a particle size of several millimeters (here, dp = 3 mm), relevant for FT fixed bed reactors to avoid an excessive pressure drop; the pores are filled with liquid hydrocarbons, and diffusion of CO and H2 in liquid HCs is slow. As outlined in [1,2], the effectiveness factor ηpore and the related Thiele modulus ϕ are:
η p o r e = r m , C O , e f f r m , C O = tanh ϕ ϕ     1 ϕ   for   ϕ > 2
ϕ = d p 6 ρ c a t D e f f , C O , l i q     R   T   H C O     r m , C O   c C O   = C ϕ   C a r m , C O ,   C H 4 + r m , C O ,   C 2 +     c C O  
For the particle diameter of 3 mm, as assumed here, Cϕ is 300 kg0.5 s0.5 m−1.5; see previous publication [1]. The effective rate of CO conversion is then given based on Equations (3)–(6) by:
r m , C O , e f f = η p o r e   r m , C O
For a diameter of the particles of 3 mm, ηpore is lower than 1 above 180 °C and reaches a value of around 0.2 for 240 °C (Ca = 3) [1,2]. The mean molar H2-to-CO ratio within the particles is then higher compared to the free gas phase with a value of about two. The unwanted formation of CH4 then rises and lower HCs are formed, as the diffusion coefficient of H2 in liquid HCs is by a factor of two higher compared to CO. This impact is strong above 240 °C and the CH4 selectivity (SCH4) then exceeds 20% by weight compared to 10% in the absence of diffusion limitations [1]. In this study, we therefore limited the temperature to 240 °C and assumed that SCH4 is constant at 20%, i.e., 80% of CO is converted to C2+-HCs. We fixed the H2-to-CO ratio in the fresh syngas to 2.2, and the H2 conversion then equals that of CO, which simplifies all mass balances [2].
It should be mentioned that a limitation of the effective reaction rate by external mass transfer does not play a role in Fischer–Tropsch synthesis as FTS is a rather slow reaction; the strong influence of internal mass transfer only occurs if the pores are filled with liquid hydrocarbons. In case of gas-filled pores, i.e., in the initial phase of FTS with a fresh catalyst, even internal diffusion limitations are negligible.
If inhibition of the effective rate by steam is considered, Equations (5) and (6) with rm,CO,H2O instead of rm,CO are valid. For a strong limitation by pore diffusion (ϕ > 2: rm,CO,H2O,eff = ηpore rm,CO,H2O~rm,CO,H2O0.5), as typical for fixed-bed FT synthesis, inhibition of the effective rate by steam is weaker than that of the intrinsic rate, e.g., for a partial pressure of steam of 5 bar, the effective rate drops only by 13% and not by 25%, as stated before for the decline of the intrinsic rate.

2.2. Models (Examined in This Work) of a Multi-Tubular FT Reactor Cooled by Boiling Water
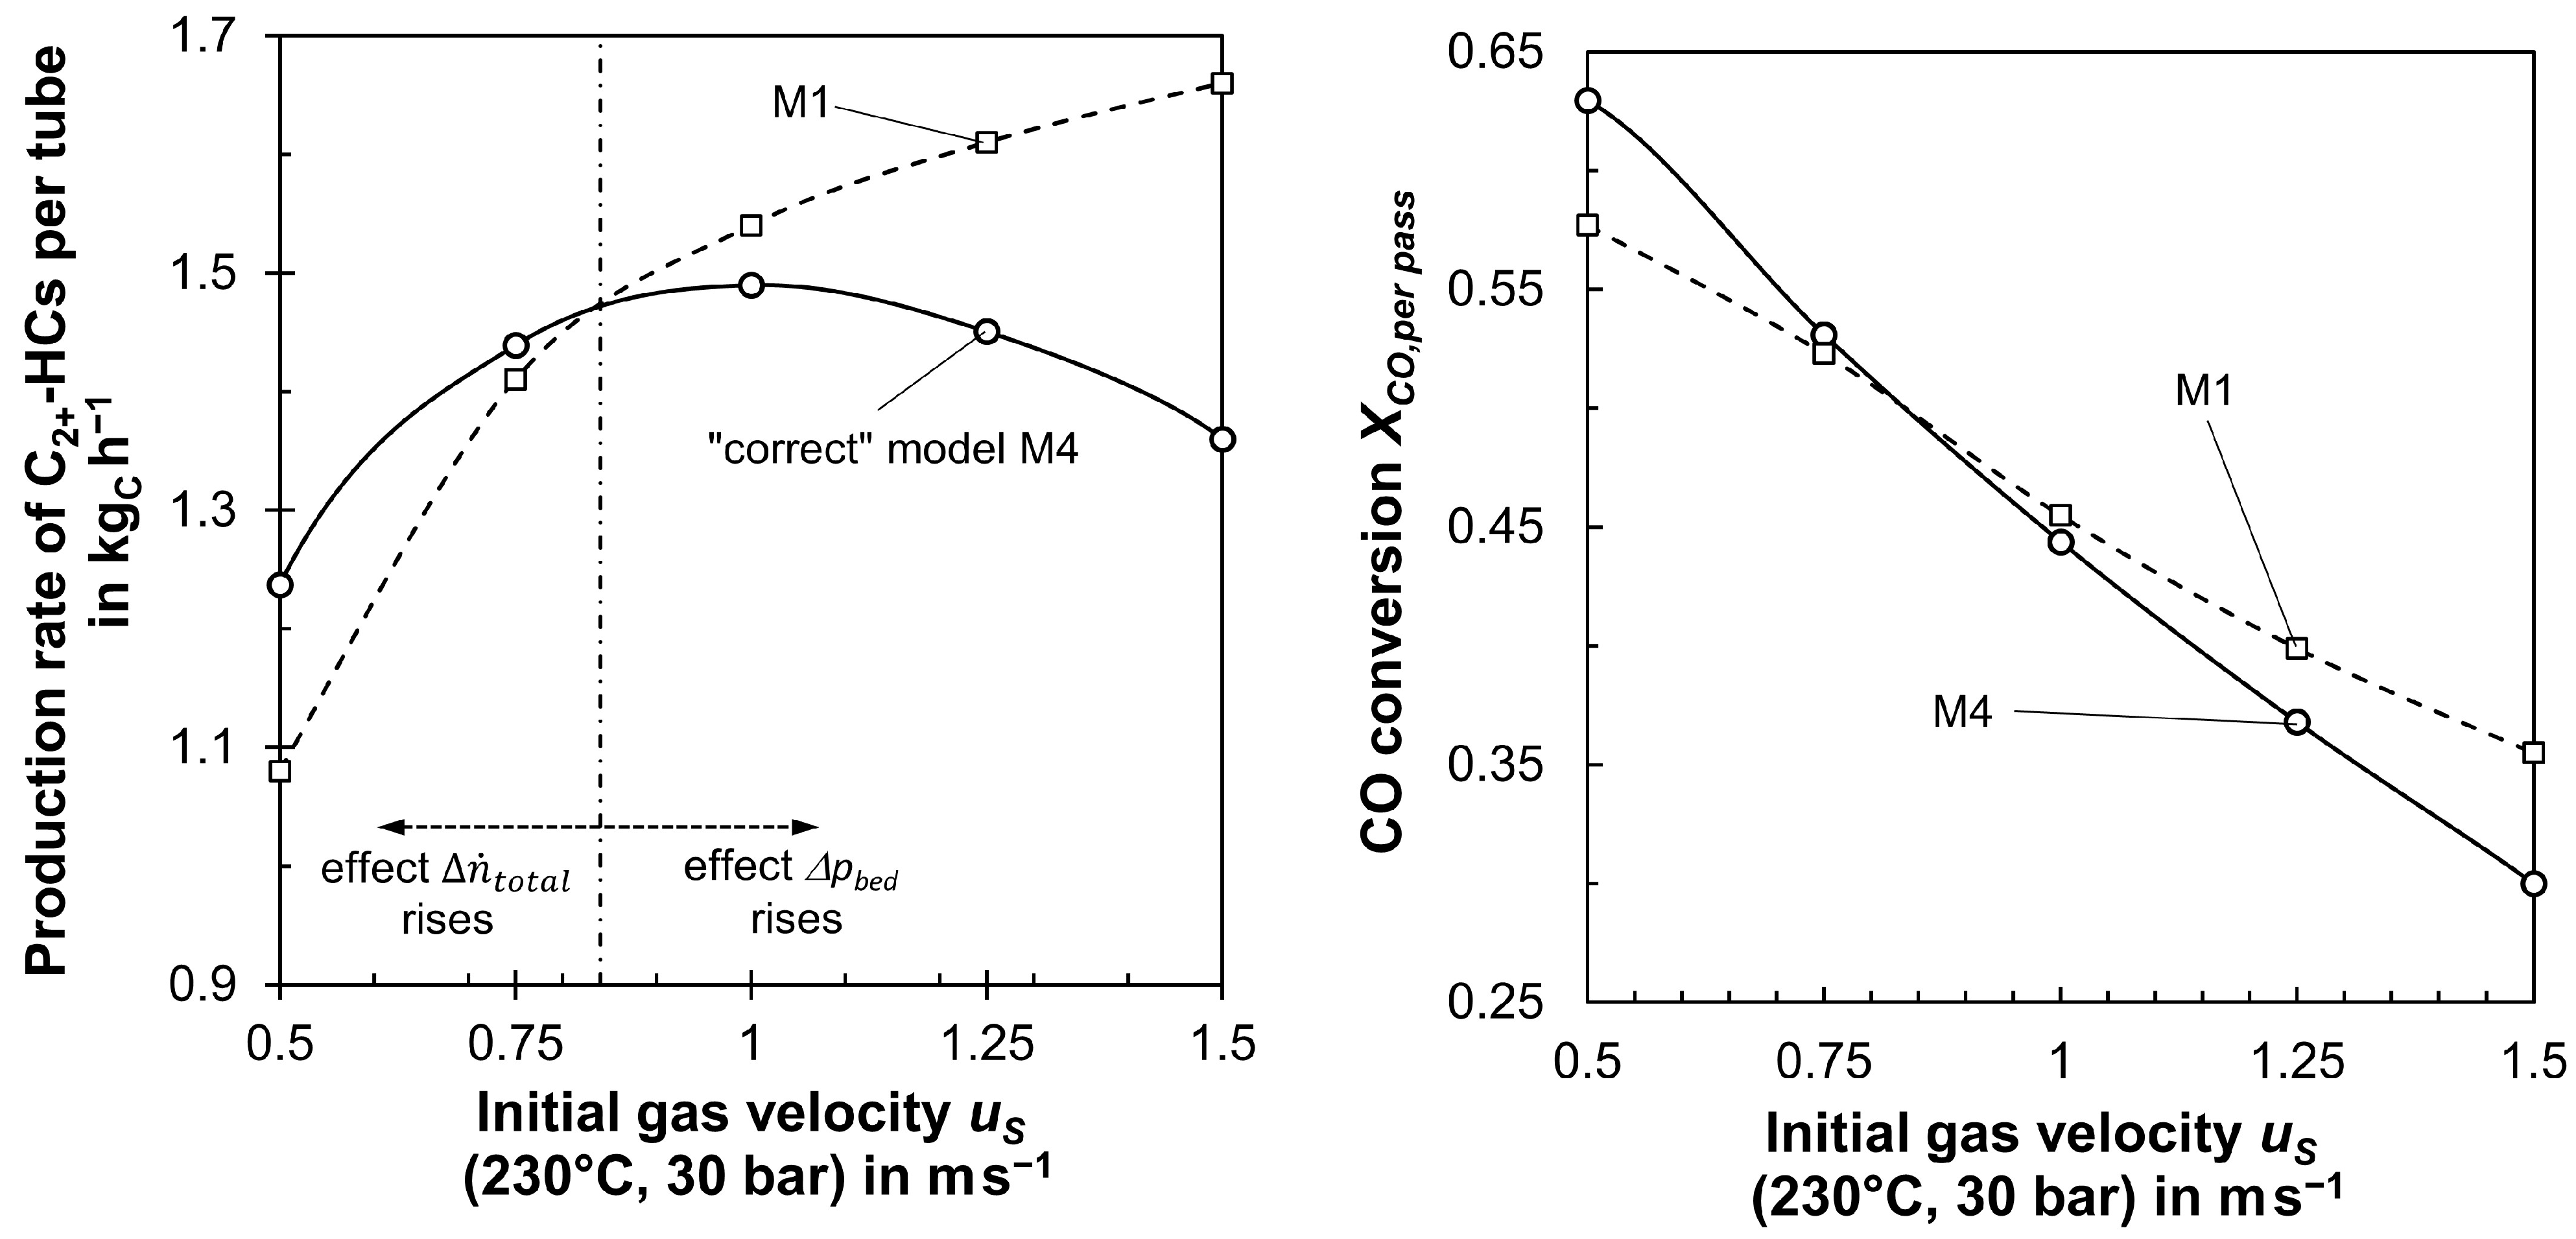
The model to simulate a single tube of a multi-tubular fixed-bed reactor is a pseudo-homogenous two-dimensional model already presented [1,2].
The mass and the heat balance in a differential axial tube section are given by the following Equations (8) and (9):
d c i   u s d z = ν i , R 1   r m , C O , R 1 , e f f + ν i , R 2   r m , C O , R 2 , e f f   ρ b e d
c p   ρ g d T   u s d z = λ r a d 1 r d T d r + λ r a d d 2 T d r 2 +   r m , C O , R 1 ,   e f f Δ R H R 1 + r m , C O , R 2 , e f f Δ R H R 2   ρ b e d
Radial temperature gradients in the bed are taken into account to achieve a reliable calculation of the operation of the FT reactor (temperature profiles in the axial and radial direction, CO conversion, and thermal stability). Each reactor tube has an inner diameter dt,int of 3 cm. The heat produced by FTS is radially transferred through the pseudo-homogenous phase consisting of catalyst and gas from the fixed bed to the inner tube wall. The radial heat flux within the bed is governed by the radial effective thermal conductivity λrad and the internal heat transfer coefficient αw,int, taking into account the thermal resistance very near the internal side of the wall resulting from the high porosity of the bed at the wall. Finally, heat transfer by conduction in the wall, which only negligibly contributes to the total thermal resistance, and the heat transfer from the external side of the tubes to the boiling water are also considered in the reactor model.
Both the axial dispersion of mass and of heat were deliberately neglected in the reactor model as they are only relevant if very steep axial gradients of concentration or temperature over a length of a few particles are present. This may be different for radial dispersion of mass if the radial difference in temperature in the fixed bed becomes large, e.g., near or during temperature runaway. We then may have a difference of 50 K or more over a length of about 5 particles (radius of tube: 15 mm; particle diameter 3 mm) and not only about 10 K as during “normal” operation (see Figure S14 in the Supporting Information), and the reaction rate near the (cooler) wall is then much lower compared to the center region of the tubes. In the former case, the syngas conversion is relatively low (high concentration) near the wall and high (low concentration) in the center region. Hence, radial dispersion then may lead to a radial “mixing”, i.e., to an adjustment of radial concentration gradients by “dispersive” supply of CO and H2 from the near-wall region to the tube center. This effect may then, for example, decrease the ignition temperature to a certain extent compared to the case of no radial dispersion of mass. This aspect is, here, not further considered but will be analyzed in future work in more detail.
Table 1 shows parameter values utilized to model an FT reactor with gas recycle (unconverted CO and H2, and CH4), a purge gas stream, and an assumed total CO conversion of 95%. The values are given for a superficial gas velocity of 1 m/s.
It should be mentioned that the results of modeling of an FT reactor depend on the specific catalyst used, e.g., on the main active metal, here, Co and not Fe, as also industrially used for FTS. Here, we concentrate on cobalt as a catalyst and used our own experimental results of the kinetics.
As mentioned in the introduction, we have now modified and improved the reactor model by considering the pressure drop as well as the decline in the total molar flow, which both influence the gas velocity and residence time. An axially changing gas velocity also influences the radial conductivity λrad and the internal heat transfer coefficient αw,int. All heat transfer parameters were calculated by literature correlations [8,9,10,11,12,13,14]; see Supporting Information.
The influence of pressure of the boiling water and of the radial heat flux was also taken into account for an accurate determination of the local value of the external heat transfer coefficient αw,ex.
Finally, we also analyzed the impact of the inhibition of the CO reaction rate by steam on the outcome of a model of a cooled multi-tubular FT reactor.
Table 2 introduces the used models and the respective parameters considered or deliberately neglected to clearly elucidate step by step the influence of all these aspects on the outcome of each model, i.e., the FT reactor performance, mainly “measured” by XCO,per pass and production rate of C2+-HCs.
Details on the general performance of an FT reactor including a gas recycle and a purge gas stream were already outlined in our very recent publication [2]. Here, we have always assumed a total syngas conversion (CO, H2) of 95%, realized by a respective recycle ratio R and a purge gas stream, which is needed as an outlet for all unwanted methane produced as a by-product.
The gas velocity and the syngas composition at the reactor entrance, depending on the total and per pass conversion of CO (XCO,total, XCO,per pass), were varied, but the geometry of the tubes (internal diameter 3 cm, length 12 m), the initial total pressure (30 bar), and Tmax (240 °C) were fixed. The critical cooling (ignition) temperature Tig, where thermal runaway occurs, was determined in every modeling case. For a safe operation, the maximum of the cooling temperature was fixed to be 5 K below the temperature of ignition (Tig).
The equations of the mass and heat balances (listed in Supporting Information) were solved by the program Presto, a solver of differential equations (CiT GmbH, Rastede, Germany).
During reactor modeling, the catalytic activity (coefficient Ca) was mostly regarded as constant. Only in two cases an axial activity distribution was considered, a two-zone fixed-bed and a graded distribution with Ca,initial until Tmax of 240 °C was reached followed by a continuous increase in Ca to keep the temperature at 240 °C, as presented in the Supporting Information (Table S1).
In this work, we use a value for Ca of three (ideally 30% Co) as the appropriate value for a superficial gas velocity around 1 m/s (and Ca = 2 for 0.5 m/s) to guarantee a safe operation of the reactor; details are given in a former publication [2].
The initial superficial gas velocity at the entrance of the tubes (us,z=0) was varied in a broad regime from 0.25 m/s to 1.6 m/s, as this has a strong influence on ∆pbed, XCO,per pass, production rate of C2+-HCs, heat transfer parameters, and on the change in us in axial direction:
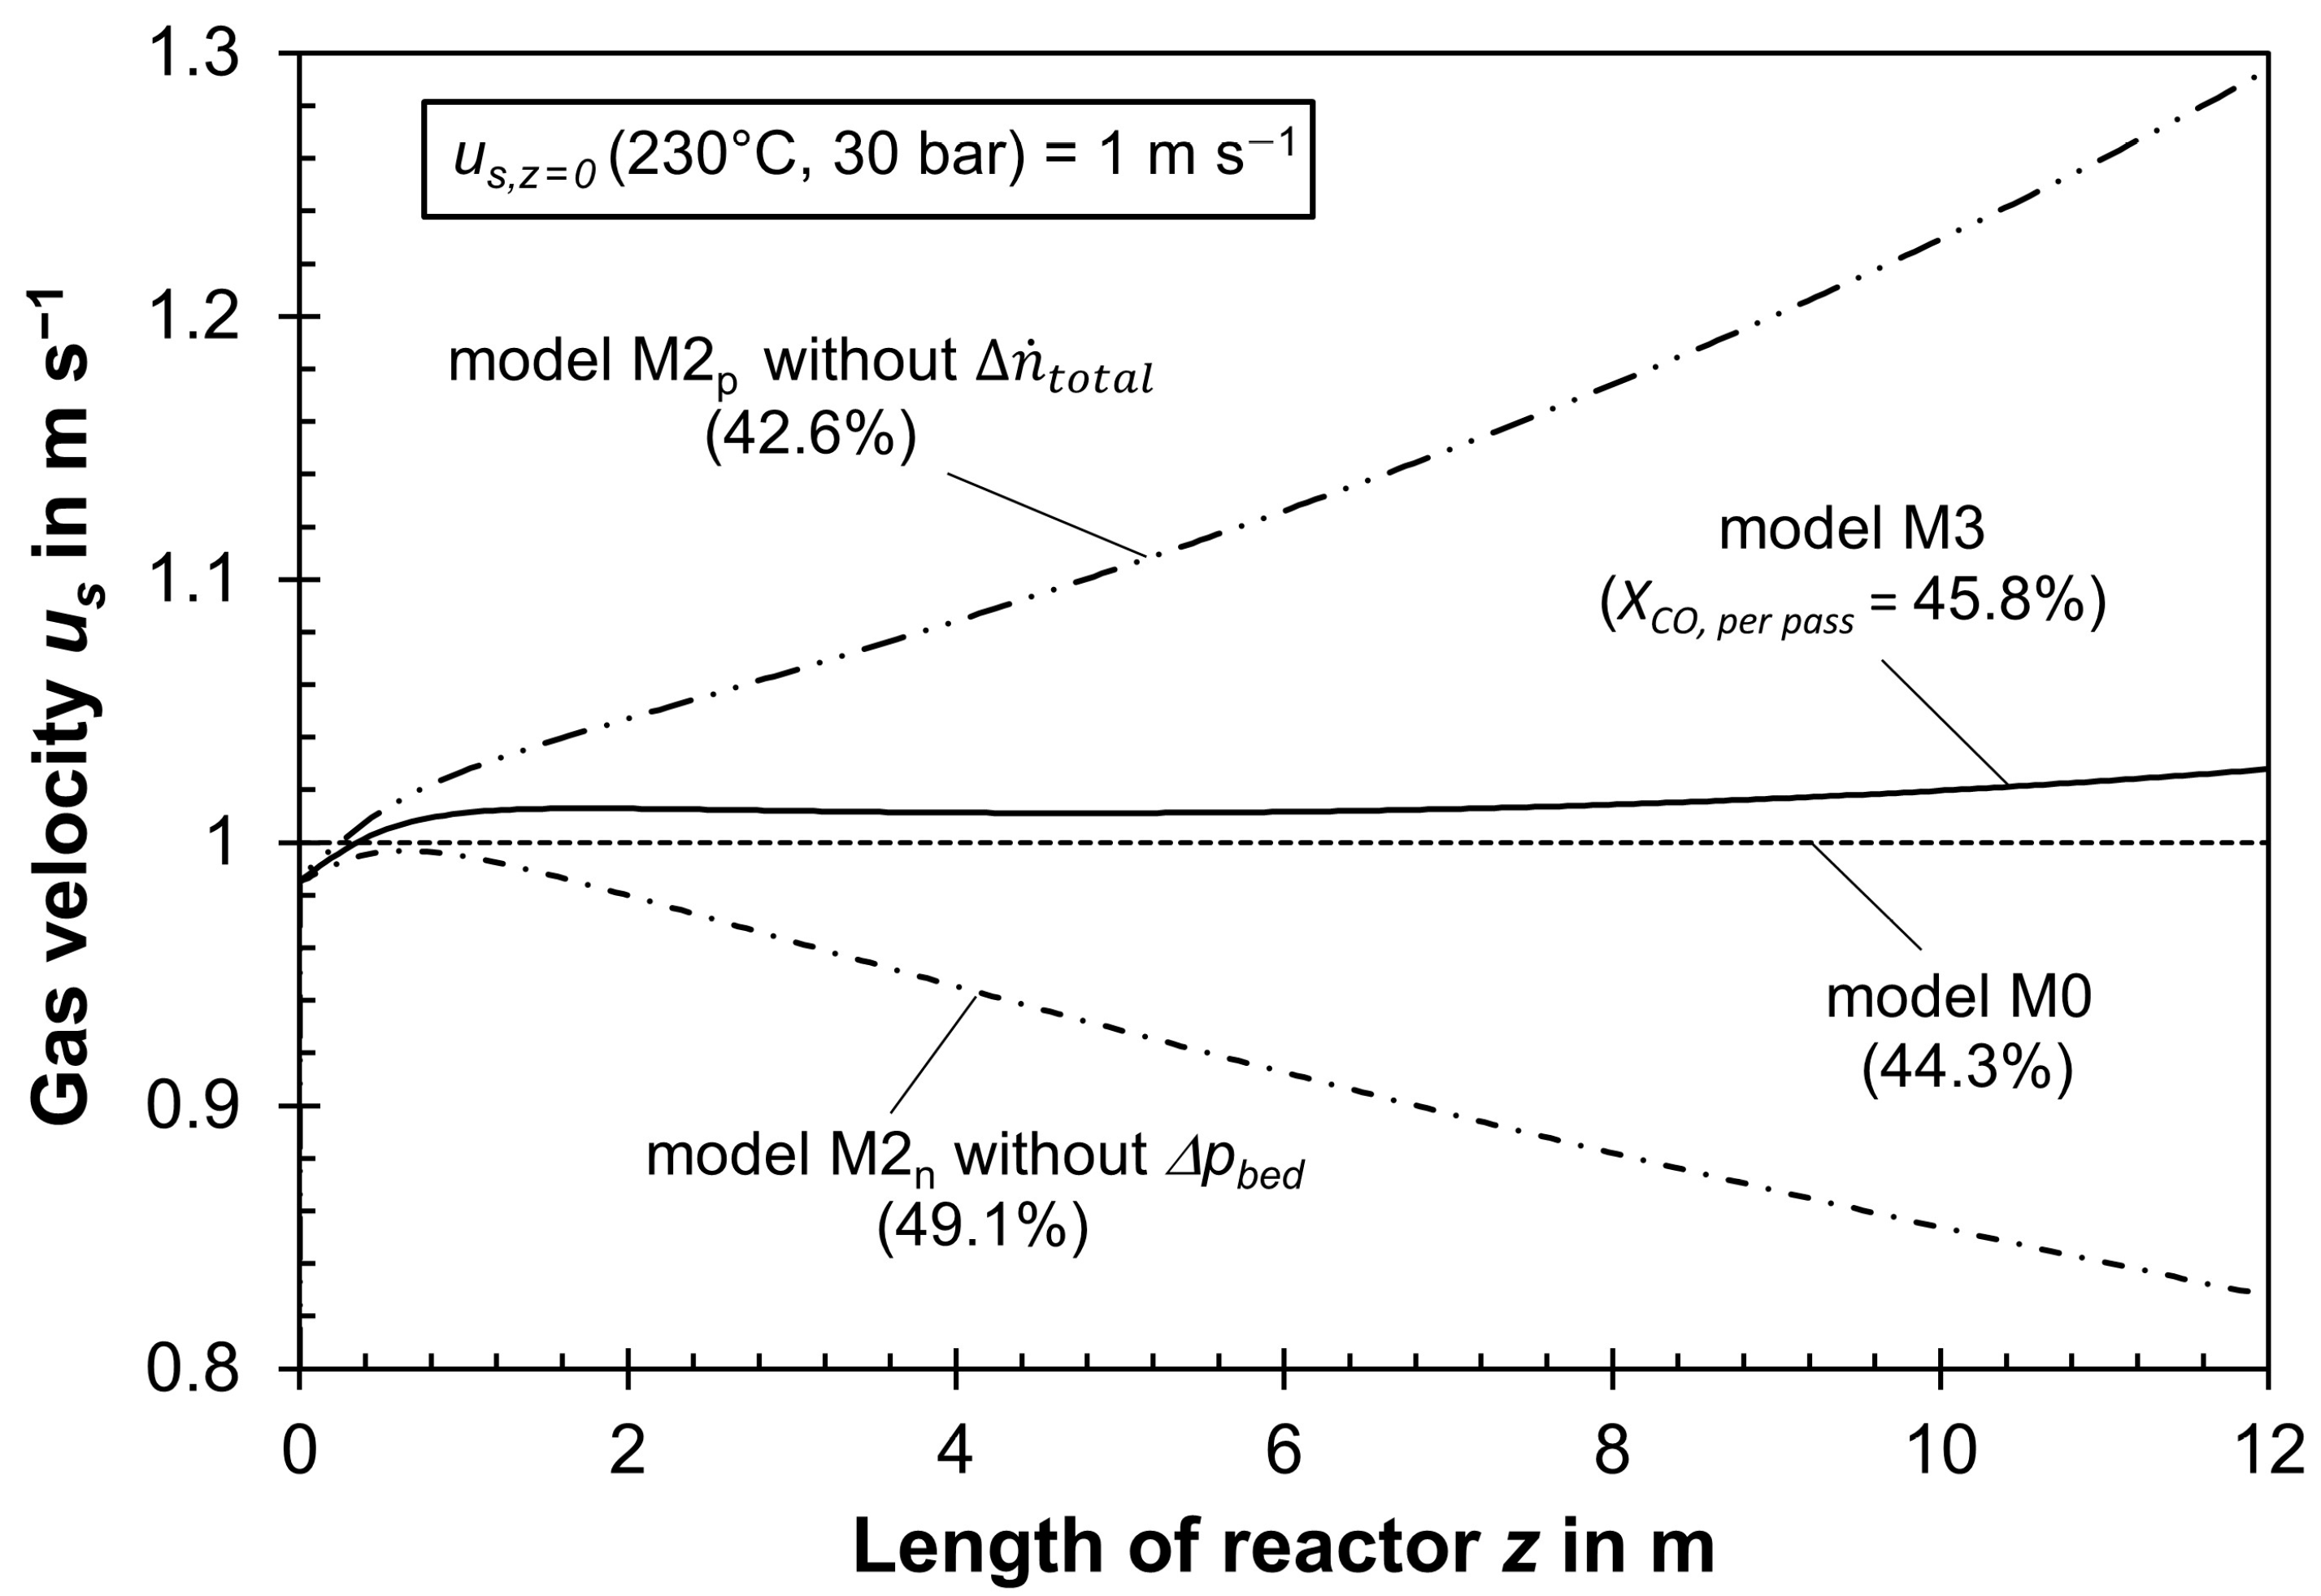
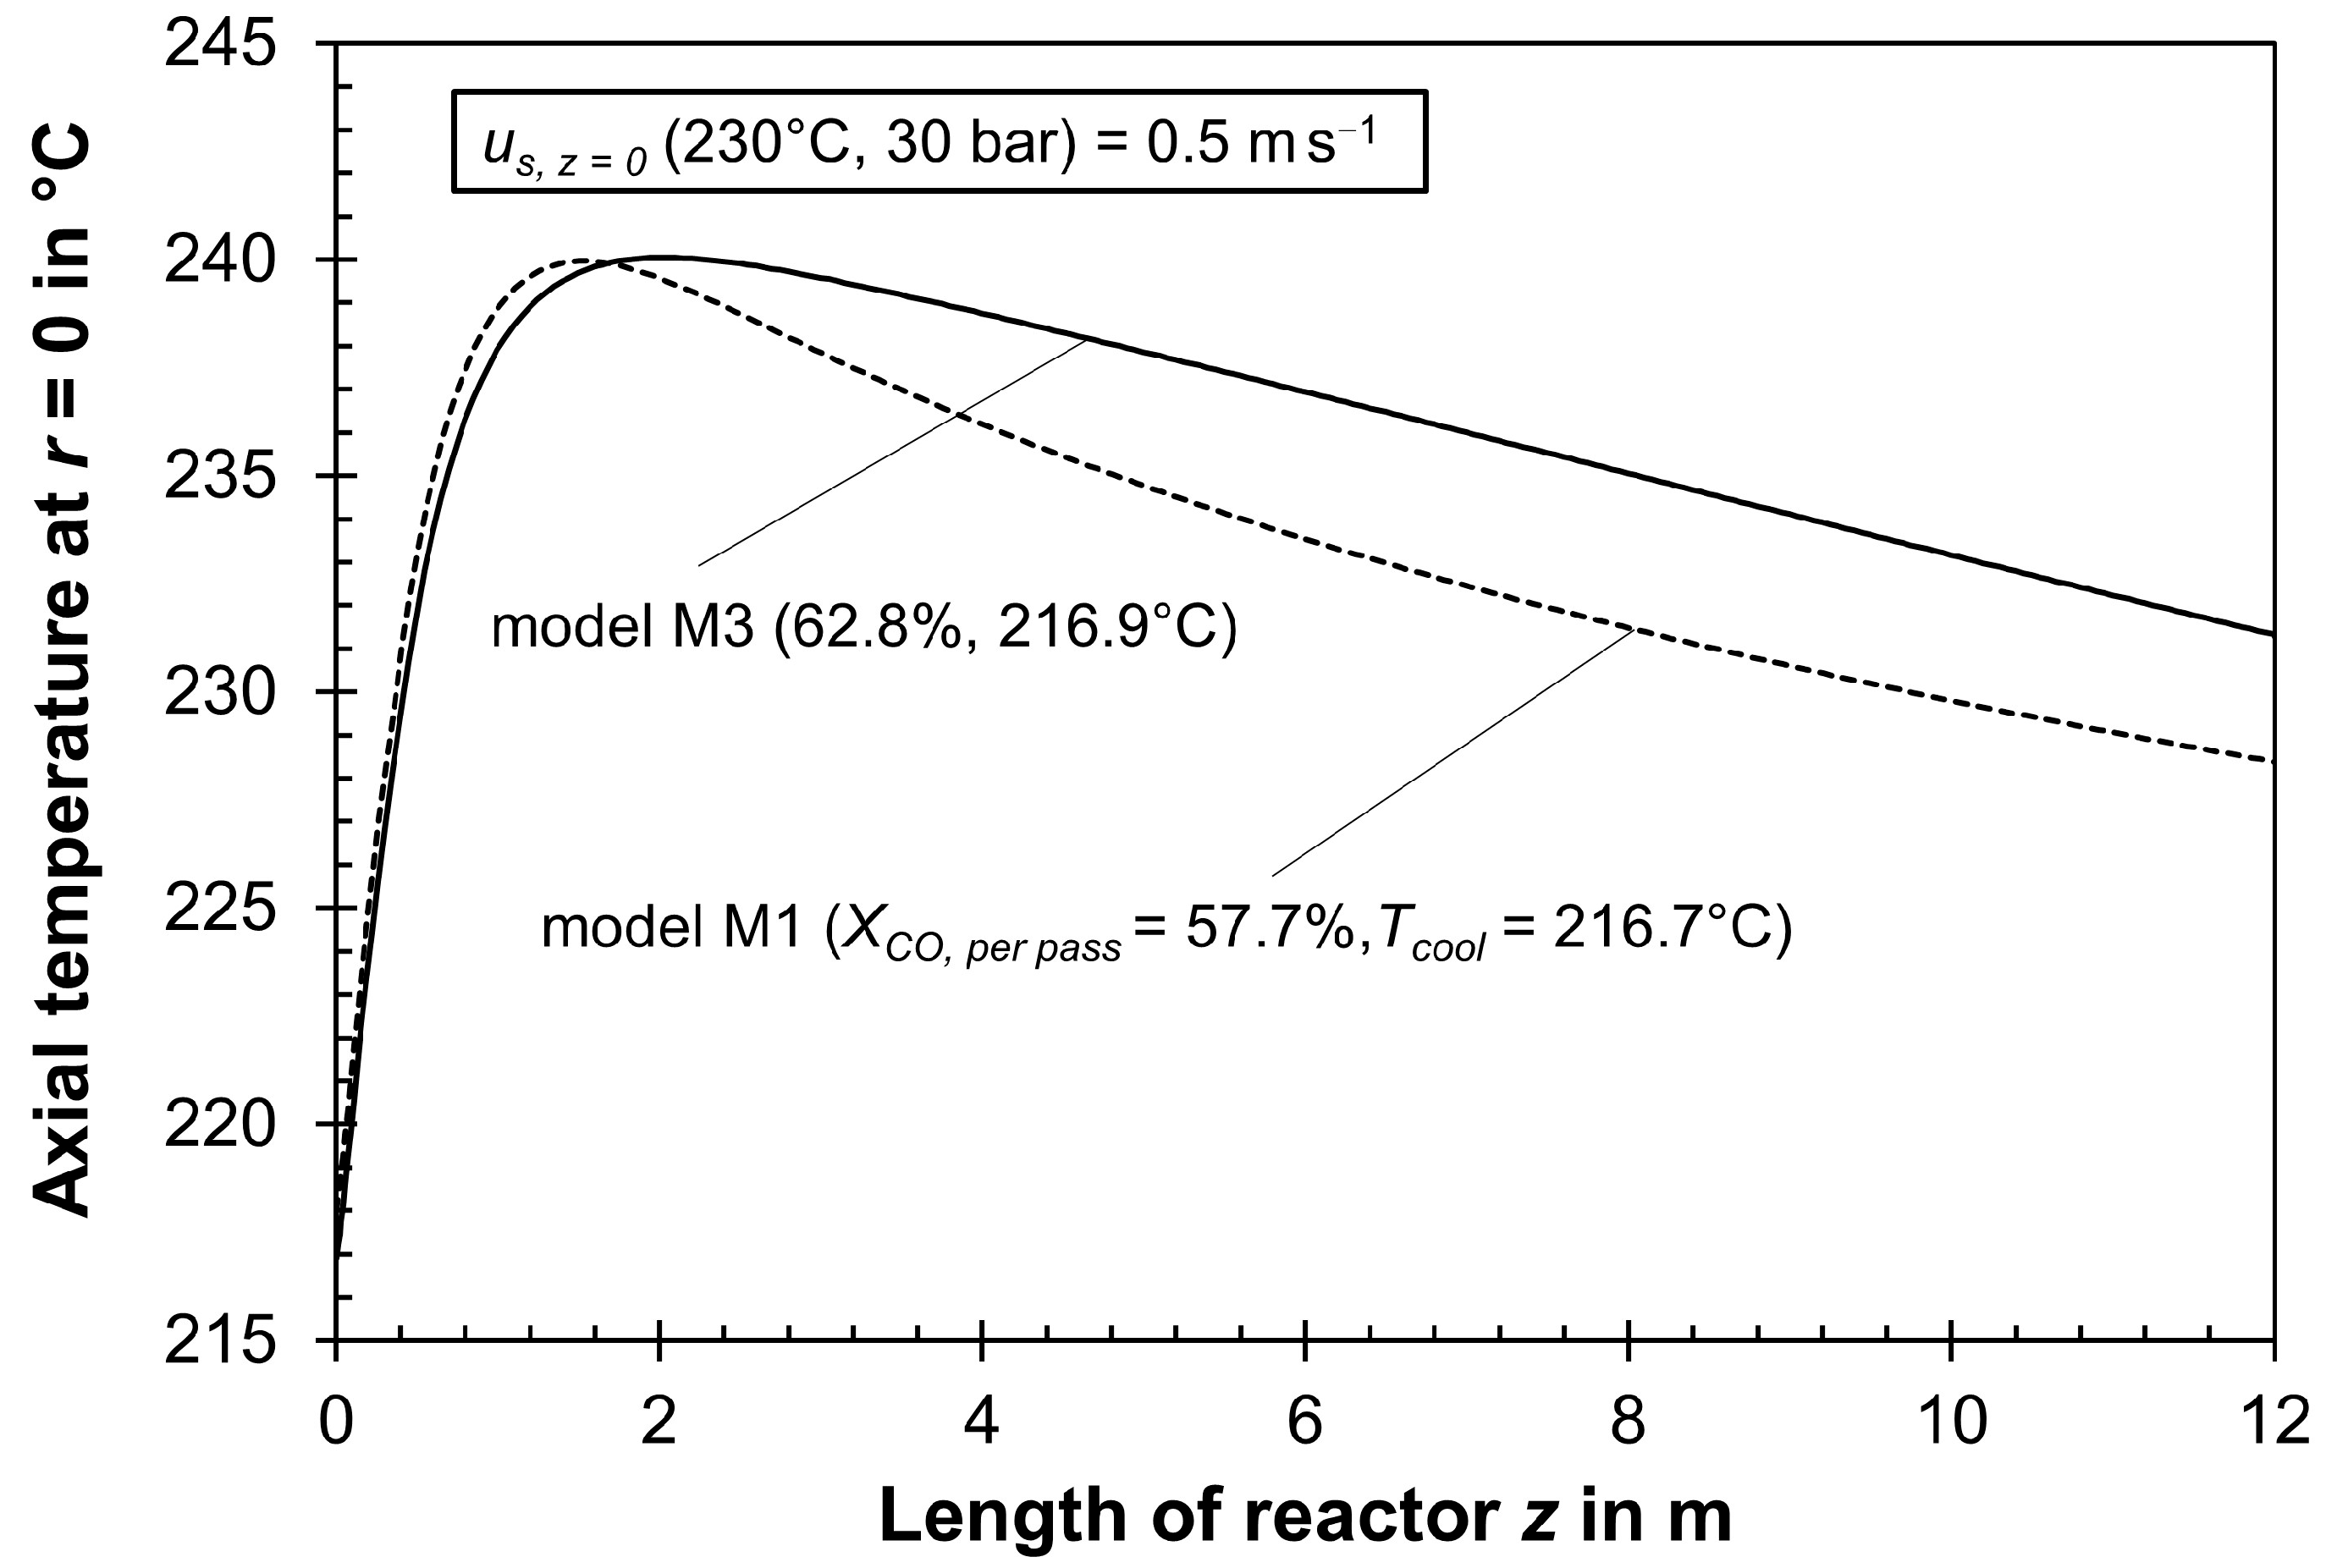
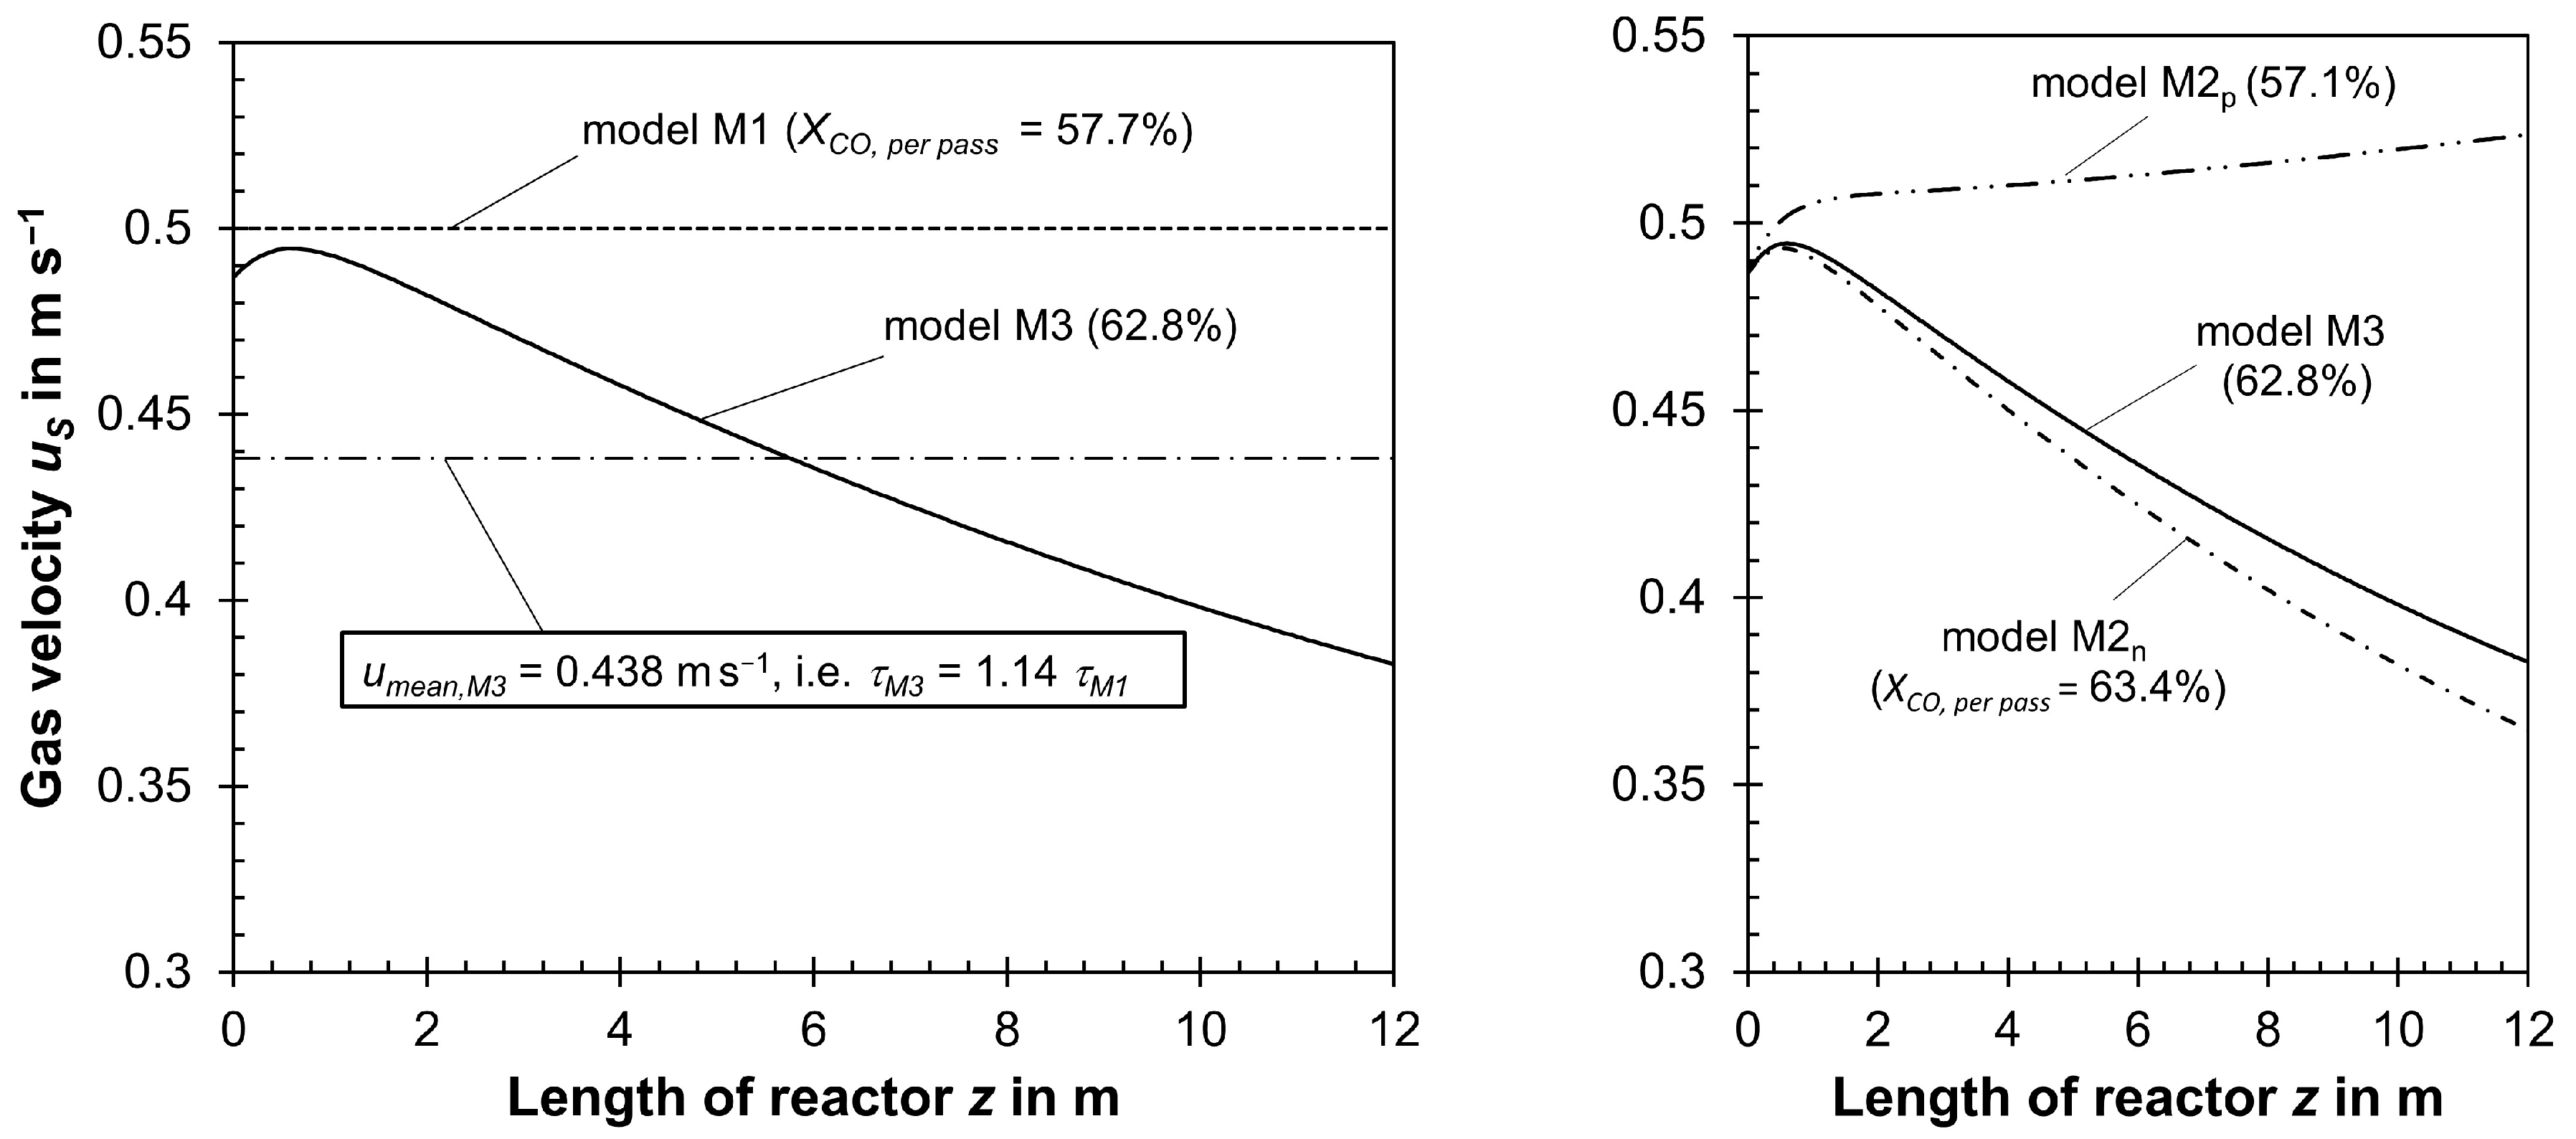
If ∆pbed is low (low us,z=0), us drops along the tubes and, in return, the residence time (compared to constant us) increases by the then dominating effect of the drop in the total molar flow rate. This, in return, has an influence on the local values (axial direction) of αw,int and λrad. In total, XCO,per pass is then higher compared to a model (as M0 or M1, Table 2) simplified assuming a constant us.
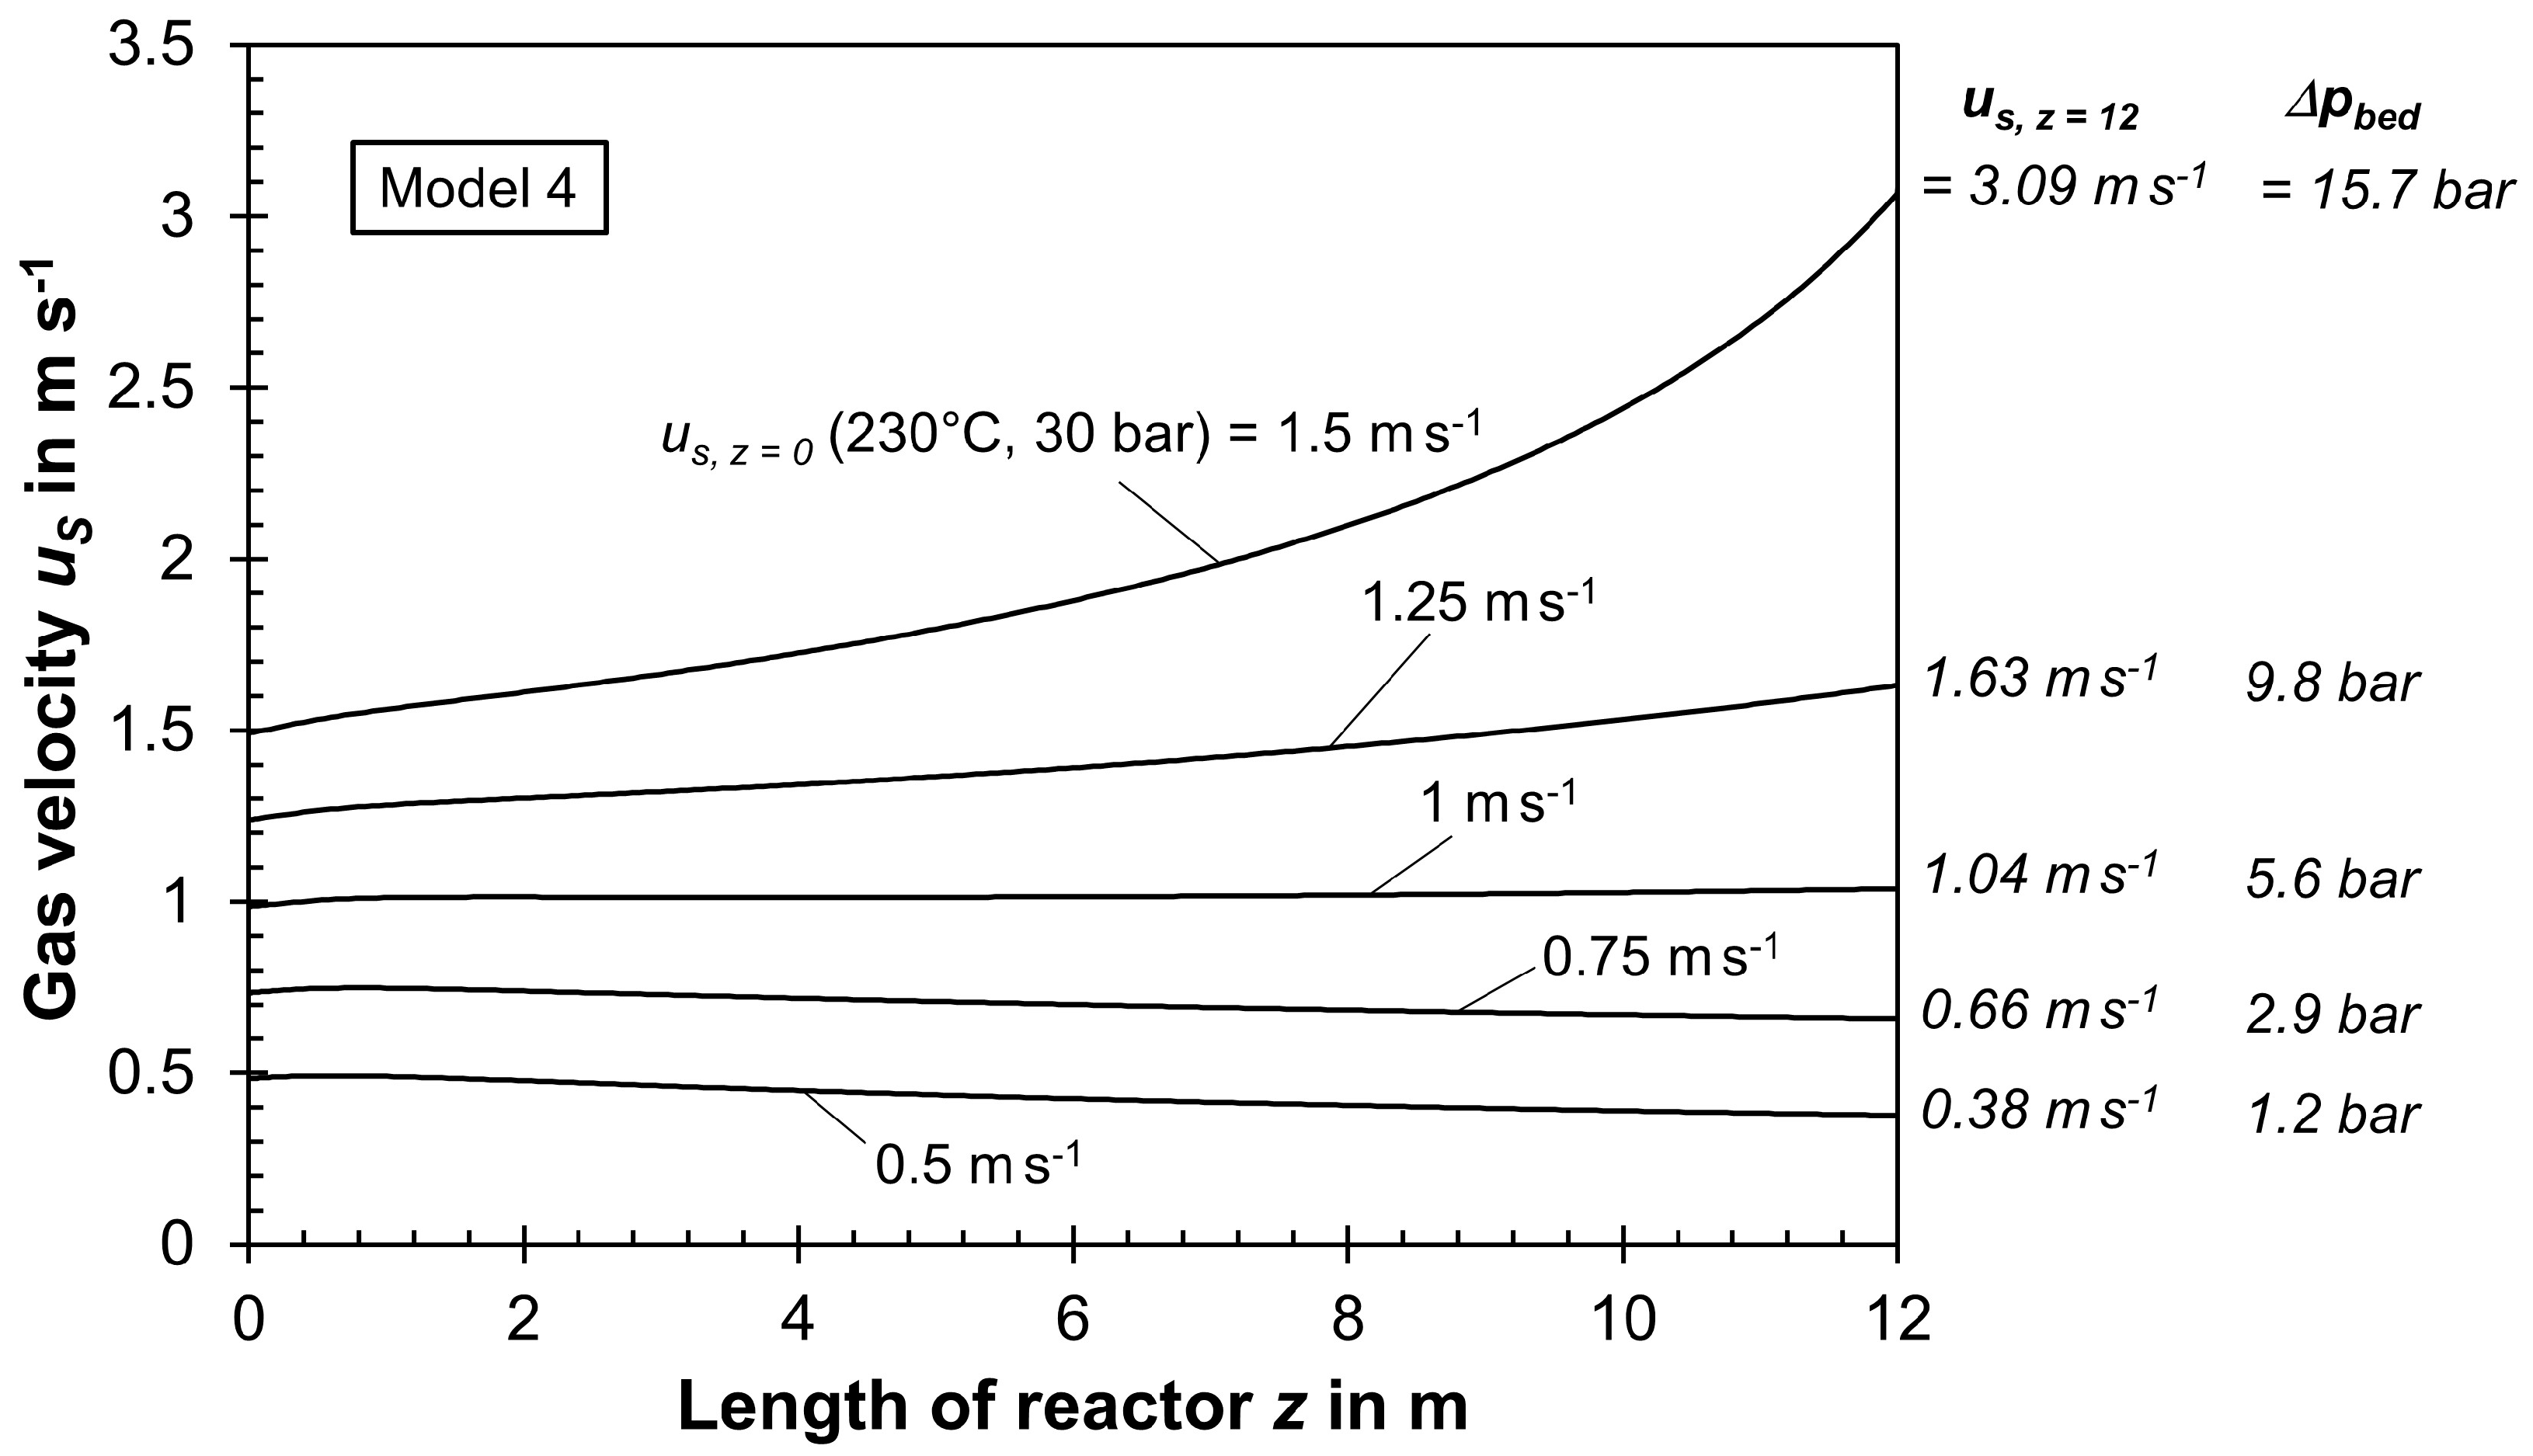
If ∆pbed is high (high us,z=0), this yields an increase in us in axial direction (decrease in residence time compared to constant us), as the drop in us by the decreasing total molar flow rate is then overcompensated; this again has an impact on the local values of αw,ex and λrad, and, in total, XCO,per pass is then lower compared to a model assuming constant us.
For a “medium-sized” ∆pbed (medium-sized us,z=0), we may obtain an almost constant gas velocity along the tubes, i.e., the opposite influence of ∆pbed and drop in total molar flow on us cancel each other out. In this rare case, a model with or without considering both aspects coincidentally yields similar results with regard to XCO,per pass or production rate of C2+-HCs.

3. Results of Simulation of a Single Tube of a Cooled Multi-Tubular FT Reactor

3.1. Influence of External Heat Transfer Coefficient αw,ex on Reactor Modeling

In contrast to the “simple” model M0, used in our previous publications [1,2], all other models consider the influence of the pressure of the boiling water and of the local radial heat flux, which changes in axial direction (Figure 1), on the external heat transfer coefficient αw,ex based on literature correlations (Supporting Information) [12,13,14]. This effect was neglected in model M0, where an estimated constant value of αw,ex (1 kW m−2 K−1) was used (Figure 1). The heat transfer parameters λrad and αw,int, both depending via Rep on the gas velocity, Figure S1, were calculated by literature correlations [4,5,6,7,8] (Supporting Information). For M0 and M1, both assuming constant us and ptotal, λrad and αw,int are constant (Figure 1 and Figure 2).
For model M1 (and also M2 to M4), the external heat transfer coefficient αw,ex passes a maximum at z = 2 m (Figure 1), corresponding to the location of the maximum temperature (Figure 3) and the highest radial heat flux. The comparison of M0 and M1, which only differ in value and calculation of αw,ex (Figure 1), shows that the model data are similar, e.g., XCO,per pass is 44.3% (model M0) and 45.5% (M1), Table 3. Nevertheless, the more accurate calculation of αw,ex, implemented in all models except model M0, should be preferred and was, here thereafter, utilized.

3.2. Influence of Pressure Drop and Change in Total Molar Gas Flow on Reactor Modeling

Table 4 and Figure 3, Figure 4 and Figure 5 show the results of the reactor simulation by models M1, M2p, M2n, and M3 for an initial superficial gas velocity us,z=0 of 1 m/s (230 °C, 30 bar).
According to the “correct” model 3 (within the four models compared here), which considers ∆pbed as well as   Δ n ˙ t o t a l , the gas velocity us is almost constant, as discussed below in detail. Nevertheless, both the effective radial thermal conductivity λrad (Figure 2) and the internal heat transfer coefficient αw,int (Figure 1) decrease to a certain extent along the tubes by the decline in Rep (=us dp/νg), Figure S2, as the gas viscosity (νg) rises with decreasing pressure (νg~1/ptotal). But this effect only leads to minor differences in the axial profiles of temperature (center of tube) and reaction rate for models M1 and M3 (Figure 3 and Figure S4), and the CO conversion per pass and production rate of C2+-HCs are very similar, Table 4 (first and fourth row).
If only the decline in n ˙ t o t a l (and not ∆pbed) is implemented in the model (as for M2n), the conversion is much larger (49.1%) as for the models M1 (45.5%) and M3 (45.8%), see Table 4. For model M2p, considering only ∆pbed, this is reversed and XCO,per pass is only 42.6%. Hence, an accurate model should consider both ∆pbed and Δ n ˙ t o t a l (as M3) and not only one of these two aspects (M2p and M2n), as this even leads to less reliable data than neglecting both aspects (M1).
Figure 5 shows the individual (left) and combined influence (right) of temperature, ∆pbed, and drop in total molar flow rate on the gas velocity us in more detail for model M3. For an initial value of us,z=0 of 1 m/s, the influence of Δ n ˙ t o t a l and ∆pbed on us cancel each other out; the impact of temperature on us is negligible, as the (mean) value only varies in a range of 223 to 240 °C.
Table 5 and the Figure 6 and Figure 7 show the results of models M1, M2n, M2p, and M3 but, now, for a relatively low initial gas velocity us of 0.5 m/s (230 °C, 30 bar). For this rather low gas velocity, ∆pbed is almost negligible, only 1.2 bar compared to 5.6 bar for us,z=0 = 1 m/s, and the gas velocity substantially decreases along the tubes by up to about 25% (Figure 7) if models M3 and M2n are used, both considering the drop of the molar flow rate by the FT reaction. In return, the CO conversion per pass (62.8% and 63.4%, respectively) is then higher compared to the “simple” model 1 (56.9%; Table 5), which assumes (too simplifying) a constant gas velocity. Hence, for a low gas velocity, a model not implementing Δ n ˙ t o t a l should not be used or only for rough estimations. Model M2p, only considering ∆pbed compared to M1, shows that the implementation of (low) ∆pbed only is of minor importance (Table 5).
Two additional figures are given in the Supporting Information: Figure S4 depicts axial profiles of the effective rate at r = 0 (center of tube) for model 1 and 3 for us,z=0 = 1 m/s and Figure S5 for 0.5 m/s. Again, note that effectiveness factor ηpore (center of tube, i.e., at r = 0) is, here, always only around 0.2.

3.3. Influence of Inhibition of Steam on the Performance of an FT Reactor

Table 6 compares the influence of considering the inhibition of the reaction rate of CO conversion by steam on the reactor modeling for initial gas velocities (at 230 °C and 30 bar) of 0.5 and 1 m/s. Now, only the “advanced”, most accurate models M3 and M4 are considered, i.e., both Δ n ˙ t o t a l and ∆pbed are implemented but either without (M3) or with (M4) steam inhibition.
For model M4, which correctly considers inhibition by steam, the CO conversion per pass is, as expected, in general, lower at 44.4% compared to 45.8% for M3 for us,z=0 of 1 m/s, which is still a small deviation, as pH2O only reaches 2.5 bar at the end of tubes. For a lower initial gas velocity of 0.5 m/s, the deviation of conversion is already quite pronounced at 59% for model M4 compared to 62.8% for M3. Now, a rather high value of pH2O of 4.8 bar is reached at the reactor outlet. In conclusion, an accurate FT reactor model should include inhibition by steam if the conversion per pass is above 50% and if pH2O finally approaches 5 bar, respectively.
In order to spotlight the even more pronounced influence of inhibition by steam on the reactor modeling for XCO >> 50%, we then used “extreme” parameters, a low value for us,z=0 of 0.5 m/s, a high value of Ca of 4, and a syngas consisting only of CO and H2. In addition, the reactor was (contrary to industrial reality) considered as isothermal (∆RHi was then just zeroized in the model), and a high temperature of 240 °C was chosen to reach a high CO conversion and, thus, a high partial pressure of steam in the rear part of the tubes (Table 7, see also Figures S6 and S7 in the Supporting Information). Now, the CO conversion is 81% and 92% with and without inhibition. Thus, model M4 considering inhibition by steam is then clearly needed for a reliable simulation.

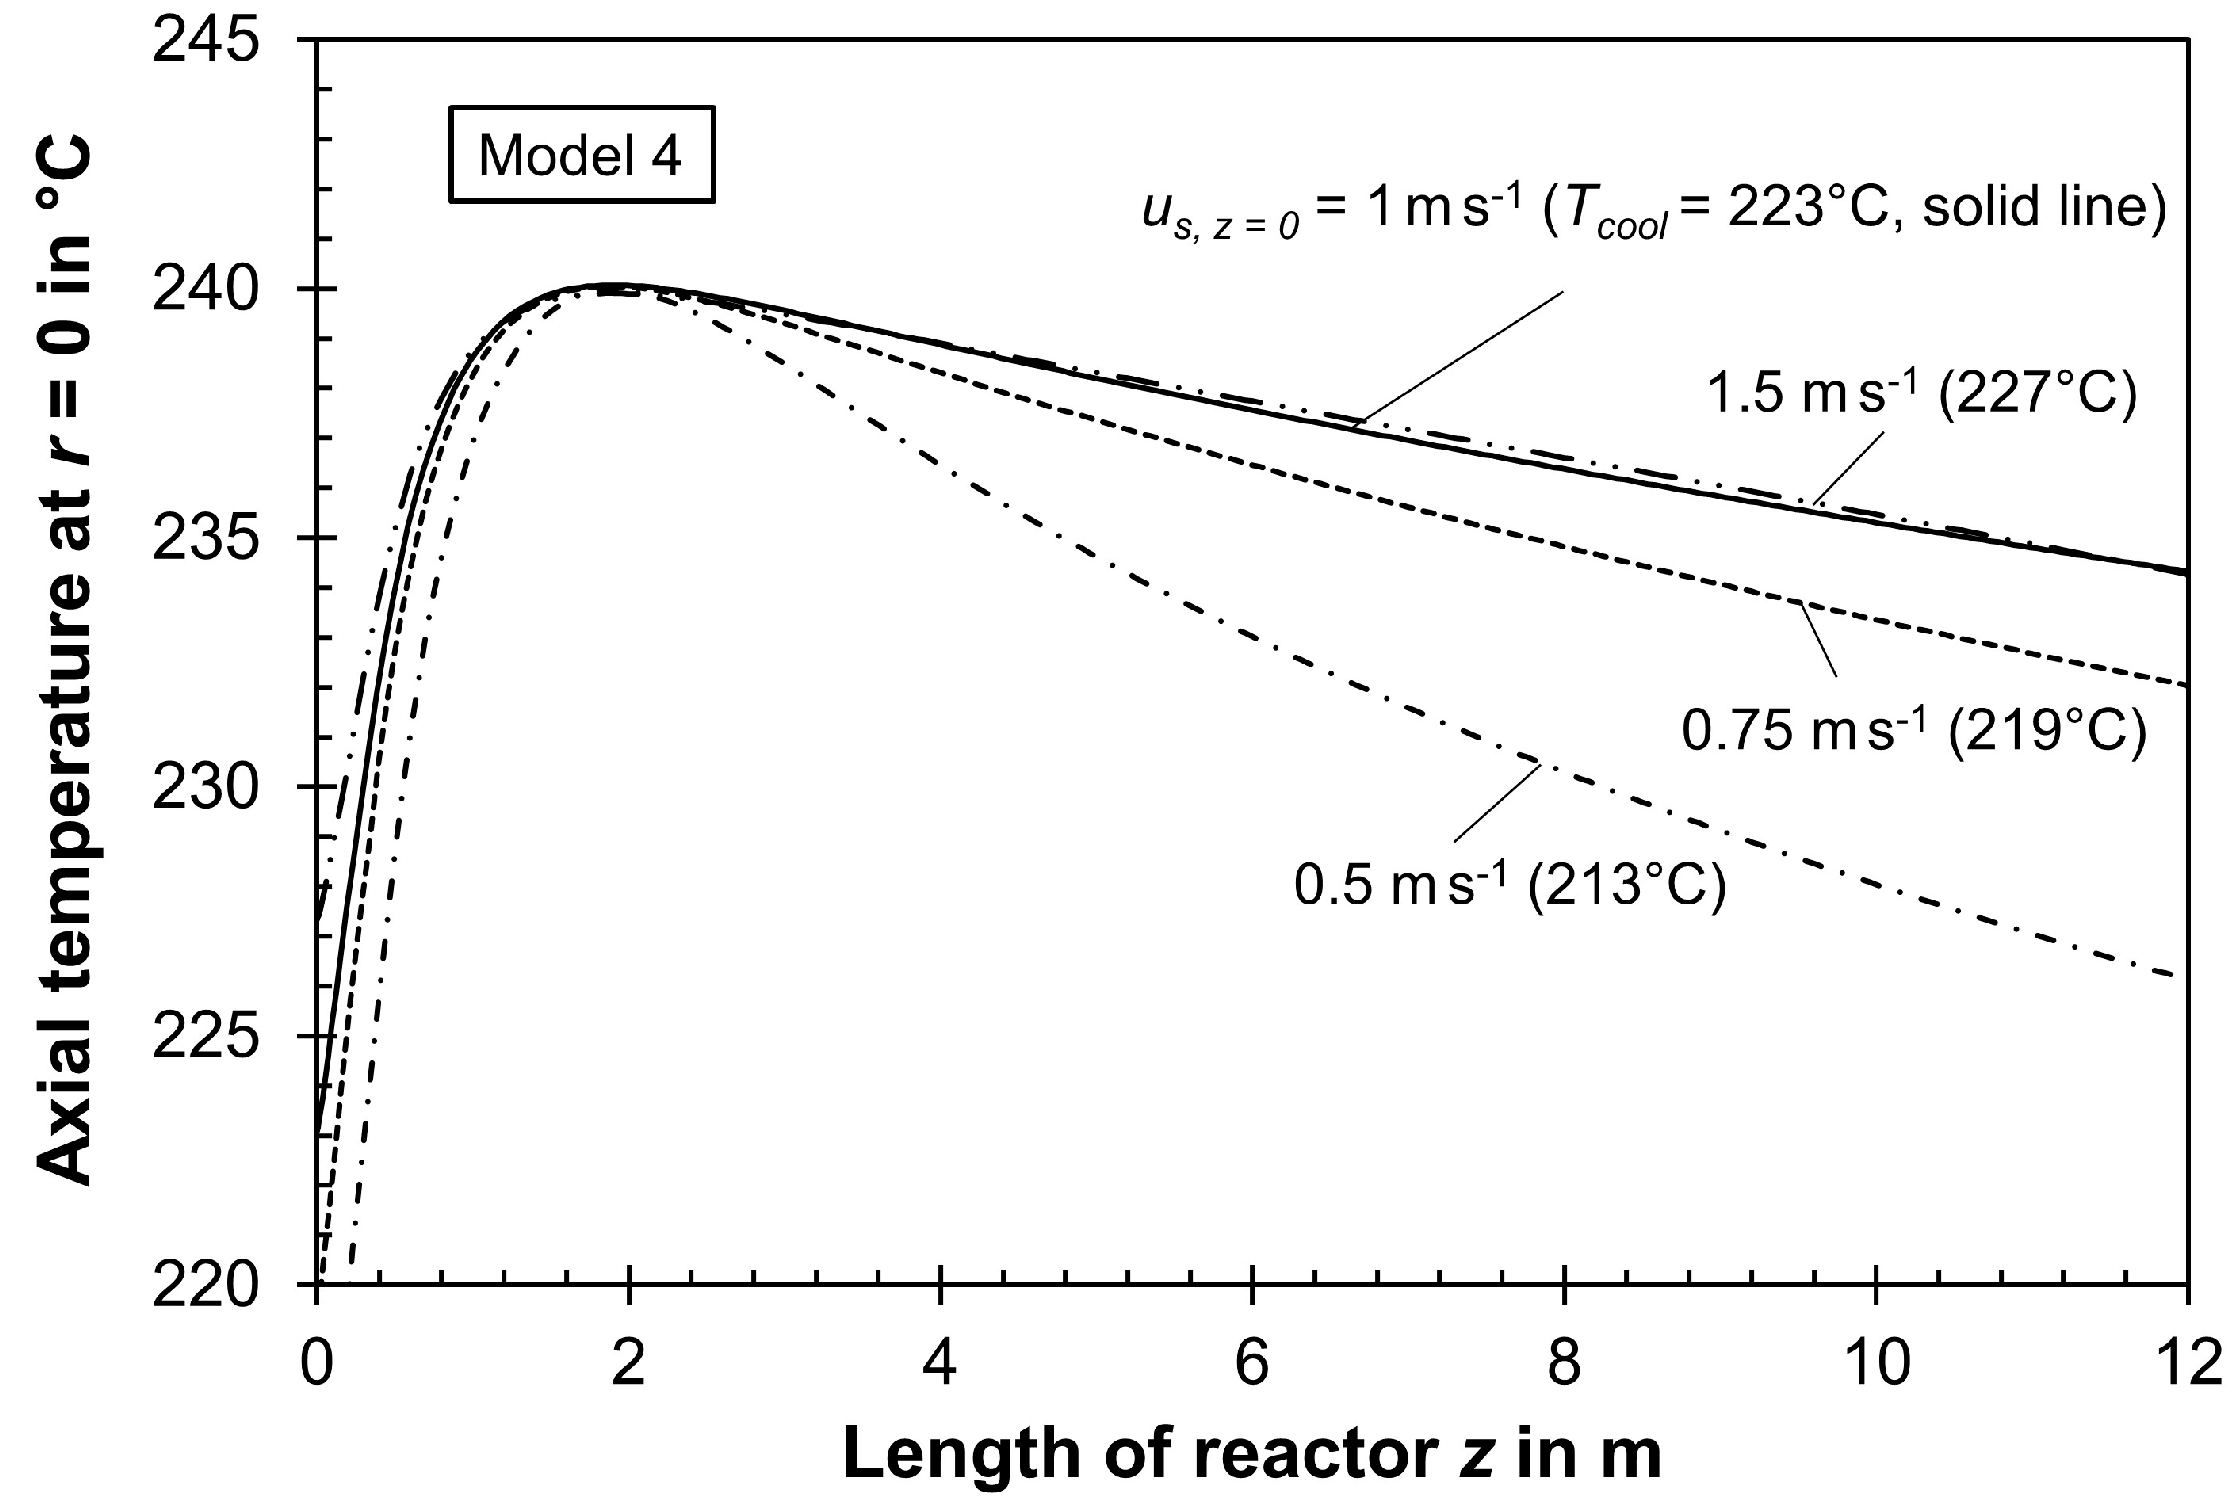
3.4. Impact of Gas Velocity on Modeling an FT Reactor if Pressure Drops, Change in Total Molar Flow Rate, and Inhibition of Reaction Rate by Steam Are Correctly Considered

Finally, the initial gas velocity us,z=0 was varied for the “best” model M4 and the activity Ca was 3 (Figure 8, Figure 9 and Figure 10, Table 8). As already outlined at the end of Section 2.2, the degree and direction (decline or increase) of the change in gas velocity us strongly depends on the initial velocity.
If ∆pbed is less than 3 bar (us,z=0 ≤ 0.75 m/s), us decreases along the tubes by the decreasing total molar flow rate (Figure 8), and the residence time rises compared to a constant us by the dominating effect of the drop in the total molar flow rate; this, in return, increases XCO,per pass, i.e., the “true” value (model M4) is higher compared to M1 neglecting Δ n ˙ t o t a l and ∆pbed (Figure 10).
For ∆pbed > 9 bar (us,z=0 ≥ 1.25 m/s), the effect is reverse; then, us increases in axial direction, the residence time decreases compared to a constant us, and XCO,per pass (“correct” value according to model 4) is lower compared to model 1, oversimplifying an assumed constant us in axial direction.
For a moderate value of ∆pbed of around 6 bar (us,z=0 = 1 m/s), the gas velocity almost remains constant in axial direction (Figure 8), i.e., the influence of Δ n ˙ t o t a l and ∆pbed on us cancel each other out (see Figure 5). For this specific case, a model with or without considering these two aspects coincidentally leads to similar results of XCO,per pass and production rate of C2+-HCs (Figure 10). It should be also noted that, for this superficial gas velocity, the maximum of the rate of production of C2+-HCs is reached (Figure 10, Table 8), which is contrary to the too simple model M1.
For completeness, it should be mentioned here that the effectiveness factor (pore diffusion) is below 0.7 for all cases listed in Table 8 (except the last two rows, where any influence of pore diffusion is deliberately neglected), even at the inlet of the fixed bed with the initially low temperature of Tcool, and always around 0.2 at z ≈ 2 m, where the maximum of 240 °C is reached (Figure 9). Hence, the influence of internal mass transfer on the effective reaction rate is always strong for the given conditions, a well-known phenomenon for FT fixed-bed synthesis. For example, in the best case with regard to production of C2+-HCs (us,z=0 = 1 m/s), ηpore (r = 0) is initially 0.34 at the entrance of the tubes (223 °C), drops to a minimum of 0.18 at z = 2 m, where Tmax (240 °C) is reached, and then only slightly increases towards the end of the tubes to a value of 0.20 at z = 12 m (234 °C).
It is interesting that, in the purely hypothetic but technically not at all realistic case of the absence of any pore diffusion limitations in FT synthesis, i.e., if ηpore = 1 is used for the reactor simulation, XCO,per pass and, thus, also the production of C2+-HCs per tube would unexpectedly even strongly decrease, e.g., for us,z=0 = 1 m/s from 1.49 to 0.84 kgC h−1 (last row in Table 8). The allowable value of Tcool with regard to thermal runaway of the reactor is then only 198 °C, the maximum temperature only 208 °C, and XCO,per pass drops to 28% compared to 44% in the case correctly considering pore diffusion. For us,z=0 = 0.5 m/s, this effect is more pronounced and the output of C2+-HCs per tube drops to 0.43 kgC h−1 compared to 1.24 kgC h−1 if pore diffusion is (correctly) included in the reactor simulation; see second to last row in Table 8.
The reason for this on first sight really surprising effect is the much higher reactor sensitivity if pore diffusion would not dampen the effective rate and the apparent activation energy (by a factor of about two). The thermal reactor stability without pore diffusion limitation is then only reached at a much lower cooling and maximum temperature; see Table 8 (last two rows). In other words, for FT synthesis, pore diffusion unexpectedly not only “helps” with regard to thermal stability of a multi-tubular reactor but also with regard to reaching a high CO conversion and production of HCs. This important aspect is often disregarded in evaluations of FT fixed-bed synthesis.
Additional instructive figures and a table are given in the Supporting Information:
Figure S8 depicts the impact of us,z=0 on the axial profile of the total pressure in the tubes.
Figure S9 shows the influence of us on the rate of heat removal from fixed bed to boiling water.
The influence of us on the heat transfer coefficient αw,ex is shown in Figure S10.
Figure S11 shows the influence of us,z=0 on the axial profile of αw,int, and Figure S12 the corresponding figure for λrad in the bed of the tubes.
Figure S13 depicts temperature profiles at different radial positions, and Figure S14 presents a selected radial temperature profile for z = 2 m (location of maximum in temperature).
Figure S15 depicts the influence of us,z=0 on pressure drop and final gas velocity us,z=12m, indicating a strong rise both in ∆pbed and us,z=12m with increasing us,z=0.
Axial profiles of the radial heat fluxes in the tubes (heat removal, heat production, and heat flux from/to gas) are given by Figure S16.
The parametric sensitivity of the FT reactor with and without influence of pore diffusion is also discussed in the Supporting Information (Figures S17 and S18), which explains in detail that pore diffusion “helps” with regard to thermal stability of a fixed-bed FT reactor.
Table S1 compares an FT reactor with constant activity (Ca = 3; simulation by “optimal” model M4) with a two-zone reactor (Ca = 2.5 for z < 6 m and 3.5 for 6 m < z < 12 m) and a reactor with optimal activity distribution (Ca,mean = 3). The data indicate that the output of C2+-HCs can be improved by 4% and 8%, respectively.
Axial profiles of ηpore (r = 0) for us (230 °C, 30 bar) of 0.5 and 1 m/s are shown in Figure S19; selected values at different temperatures are listed in Table S2.

4. Summary

In this work, a cooled multi-tubular FT reactor with a common gas recycle and purge gas stream was simulated by reactor models of different complexity, e.g., with regard to neglect or considering the pressure drop, the change in total molar flow along the tubes, or axial changes in radial heat transfer parameters. The effective reaction kinetics of CO conversion for cobalt as a catalyst were utilized in all reactor models.
An accurate and thus recommendable FT fixed-bed reactor model should consider both the change (decline for FT) in the total molar flow by the reaction and the (general) decrease in total pressure in a fixed-bed reactor by the unavoidable pressure drop. Both effects opposingly change the superficial gas velocity us and thus the residence time and syngas conversion, respectively, along the tubes compared to a (too) simple isobaric and isochoric (neglect of change in number of moles during reaction) reactor model presuming constant us. Only in rare cases do both effects cancel each other out, such as here coincidentally for us of 1 m/s.
A changing gas velocity as well as a drop in the total pressure along the tubes also have an impact on the radial heat transfer, i.e., on the effective thermal conductivity λrad and the heat transfer coefficient αw,int at the internal side of the tube. Hence, these aspects should also be considered for an accurate FT reactor model.
The inhibition of the effective reaction rate by steam should be at least taken into account if a partial pressure of steam at the end of the tubes reaches more than around 5 bar. For typical reaction conditions and a common gas recycle, only a high conversion of CO of more than 50% per pass leads to such a high value of pH2O at the reactor outlet.

Supplementary Materials

The following supporting information can be downloaded at: https://www.mdpi.com/article/10.3390/pr11123281/s1. Figure S1: Influence of superficial gas velocity on the heat transfer parameters λrad and αw,int; Figure S2: Axial profile of Reynolds number in the tubes of a multi-tubular FT reactor and values of λrad, αw,int, us, ptotal, and νg for two selected values of Rep; Figure S3: Profiles of thermal resistance of tube wall and external heat transfer to boiling water and individual contributions of wall and external heat transfer alone as calculated by all models except M0; Figure S4: Profiles of reaction rate in the center of a tube of a multi-tubular FT reactor for model 3; Figure S5: Profiles of reaction rate in the center of a tube of a multi-tubular FT reactor for the model 3; Figure S6: Profiles of reaction rate of CO conversion at center of tube and CO conversion in an isothermal FT reactor for model M3 and model M4; Figure S7: Influence of CO conversion on the effective reaction rate at center of tube and steam content in an isothermal FT reactor for model M3 and model M4; Figure S8: Influence of initial superficial gas velocity on axial profile of total pressure in the tubes of a multi-tubular FT reactor; Figure S9: Influence of initial superficial gas velocity on axial profile of rate of heat removal from fixed bed to boiling water in the tubes of a cooled multi-tubular FT reactor; Figure S10: Influence of initial superficial gas velocity on axial profile of heat transfer coefficient from tube to boiling water in the tubes of a cooled multi-tubular FT reactor; Figure S11: Influence of initial superficial gas velocity on axial profile of heat transfer coefficient from fixed bed to internal tube wall in the tubes of a cooled multi-tubular FT reactor; Figure S12: Influence of initial superficial gas velocity on axial profile of effective radial thermal conductivity in the fixed bed of the tubes of a cooled multi-tubular FT reactor; Figure S13: Axial temperature profiles at different radial positions; Figure S14: Radial T-profile at the position of the axial temperature maximum; Figure S15: Influence of initial superficial gas velocity on the pressure drop and final gas velocity in the tubes of a cooled multi-tubular FT reactor; Figure S16: Axial profiles of heat fluxes in the tubes; Figure S17: Arrhenius plot of intrinsic and effective reaction rate of CO conversion at the reactor entrance; Figure S18: Influence of Tcool on Tmax,ax at r = 0 and on difference between Tmax,ax and Tcool if pore diffusion is present and for hypothetic case of absence of pore diffusion limitations; Figure S19: Axial profiles of pore effectiveness factor for a superficial gas velocity of 0.5 and 1 m/s; Table S1: Comparison of different axial distributions of the catalytic activity; Table S2: Values of pore effectiveness factor at different temperatures. References [15,16] are cited in the supplementary materials.

Author Contributions

Conceptualization, A.J.; methodology/validation, A.J. and C.K.; software/modeling, C.K.; writing, review, and editing, A.J. and C.K. All authors have read and agreed to the published version of the manuscript.

Funding

The authors gratefully acknowledge the support of the Open Access Publishing Fund of the University of Bayreuth.

Data Availability Statement

Data are contained in the article and Supporting Information.

Conflicts of Interest

The authors declare no conflict of interest.

Nomenclature

ACross-sectional area of tube (π rt2) m2
cCOConcentration of COmol m−3
CaCoefficient of catalytic activity
cCOConcentration of CO (gas phase)mol m−3
cgTotal concentration (molar density) of gas phasemol m−3
cpHeat capacity of gasJ mol−1 K−1
CϕConstant factor in Equation (6) (valid for dp = 3 mm)kg0.5 s0.5m−1.5
dpParticle diameterm
dt,intInternal tube diameterm
Deff,CO,liqEffective diffusion coefficient of CO in liquid filled pore systemm2 s−1
fbedFriction factor of a packed bed of spherical particles
HCOHenry coefficient for CO in liquid HCsJ mol−1
LtLength of tube (fixed bed)m
MgMolar mass of gas mixturekg mol−1
pfinalTotal pressure at outlet of tubesPa
ptotalTotal pressure (inlet of tubes)Pa
pH2OPartial pressure of steamPa
PrPrandtl number (=νg cg cp/λg)
n ˙ total Total molar flux of gas in the tubesmol s−1
rRadial coordinate in fixed bed (radial distance from center of tube)m
rm,COTotal intrinsic reaction rate of CO, see Equation (3)molCO kgcat−1 s−1
rm,CO,H2OTotal intrinsic rate of CO, if inhibition by steam is consideredmolCO kgcat−1 s−1
rm,CO,CH4Intrinsic reaction rate of CO to of methanemolCO kgcat−1 s−1
rm,C2+Intrinsic reaction rate of CO to C2+-hydrocarbonsmolCO kgcat−1 s−1
rm,CO,effTotal effective reaction rate of COmolCO kgcat−1 s−1
rm,CO,H2O,effTotal effective rate of CO, if steam inhibition is consideredmolCO kgcat−1 s−1
rtInternal radius of tubem
RGas constant (8.314) in Equation (6)J mol−1 K−1
RRecycle ratio (ratio of recycle gas to fresh syngas)
RbedThermal resistance related to heat conduction (≈0.25 dt,int/λrad)m2 K W−1
RepReynolds number related to particle diameter (=us dp/νg)
RoverallOverall thermal resistance (Rbed + Rw,int + Rth,ex,total)m2 K W−1
Rth,ex.totalThermal resistance of wall (conduction) and boiling waterm2 K W−1
Rth,H2OThermal resistance of boiling water (convection)m2 K W−1
Rth,wallThermal resistance of wall (conduction)m2 K W−1
Rw,intThermal resistance related to heat transfer at internal wall (1/αw,int)m2 K W−1
swallThickness of tube wallm
SCH4Selectivity to methane related to carbon (in CO)
TTemperature of gas and catalyst (pseudo-homogeneous model)°C, K
TcoolCooling temperature (constant along the tube)°C, K
TigCooling temperature, where thermal runaway takes place°C, K
TmaxMaximum axial temperature at r = 0 (center of tubes)°C, K
Tmean,bedMean temperature of fixed bed in radial direction (≈T at r = 0.7 rt)°C, K
Trt,bedTemperature of fixed bed directly at inner wall of tube, where a jump (related to αw,int) from Trt,bed to Tw,int is assumed°C, K
Tw,exTemperature at external wall of the tube°C, K
Tw,intTemperature at internal wall of the tube°C, K
usSuperficial gas velocity (initial/final value: index z = 0 or z = 12 m)m s−1
XCO,per passConversion of CO per pass through a single tube
XCO,totalTotal conversion of CO reached in the reactor including the gas recycle
yCH4,inMolar content of CH4 at reactor inlet
yCH4,recycleMolar content of CH4 in recycle and purge gas stream
yCO,inMolar content of CO at reactor inlet
yH2,inMolar content of H2 at reactor inlet
zAxial coordinate in fixed bedm
Greek letters
αH2OHeat transfer coefficient (external area of tube to boiling water)W m−2 s−1
αw,exHeat transfer coefficient (tube to boiling water incl. heat transfer by conduction through wall, see Equation (S18))W m−2 s−1
αw,intHeat transfer coefficient (bed to internal tube wall)W m−2 s−1
RHiEnthalpy of reaction (i = reaction of CO to methane or to C2+-HCs)J molCO−1
∆pbedPressure drop of fixed bed (tube)Pa
εbedPorosity of fixed bed Thiele modulus (defined by Equation (6))
ηporePore effectiveness factor (defined by Equation (5))
λgThermal conductivity of gas mixtureW m−1 K−1
λradEffective radial thermal conductivity in fixed bedW m−1 K−1
λwallThermal conductivity of wall material (steel)W m−1 K−1
νgKinematic viscosity of gas (mixture)mol m−3
ν i ,   R n Stoichiometric coefficient of component i (i = CO, H2, CH2, CH4, or H2O) in reaction n (n = 1 for methane formation and 2 for formation of C2+-HCs)
ρbedBulk density of fixed bedkg m−3
Abbreviations
C2+Hydrocarbons with two and more carbon atoms (all HCs without CH4)
FT(S)Fischer–Tropsch (synthesis)
HCsHydrocarbons

References

  1. Kern, C.; Jess, A. Performance of a multi-tubular Fischer-Tropsch reactor with two catalytic zones of different intrinsic chemical activity. Catal. Sci. Technol. 2023, 13, 516–527. [Google Scholar] [CrossRef]
  2. Kern, C.; Jess, A. Improvement of a multi-tubular Fischer-Tropsch reactor with gas recycle by appropriate combination of axial activity distribution and gas velocity. Catal. Sci. Technol. 2023, 13, 2212–2222. [Google Scholar] [CrossRef]
  3. Poehlmann, F. Zusammenspiel von Chemischer Reaktion und Porendiffusion bei der Kobaltkatalysierten Fischer-Tropsch-Synthese unter Einsatz von CO2-Haltigem Synthesegas. Ph.D. Thesis, University Bayreuth, Bayreuth, Germany, 2017. [Google Scholar]
  4. Dry, M.E. FT Catalysts; Fischer-Tropsch Technology, Studies in Surface Science and Catalysis; Steynberg, A.P., Dry, M.E., Eds.; Elsevier: Amsterdam, The Netherlands, 2004; Volume 152, pp. 533–600. [Google Scholar]
  5. Bartholomew, C.H.; Farrauto, R.J. Fundamentals of Industrial Catalytic Processes; Chapter 6.5, Fischer-Tropsch Synthesis; Wiley Interscience: Hoboken, NJ, USA, 2006; pp. 398–464. [Google Scholar]
  6. Gholami, Z.; Tisler, Z.; Rubas, V. Recent advances in Fischer-Tropsch synthesis using cobalt-based catalysts: A review on supports, promoters, and reactors. Catal. Rev. 2021, 63, 512–595. [Google Scholar] [CrossRef]
  7. Fox, J.M. Fischer-Tropsch reactor selection. Catal. Lett. 1990, 7, 281–292. [Google Scholar] [CrossRef]
  8. Jess, A.; Wasserscheid, P. Chemical Technology: From Principles to Processes, 2nd ed.; Wiley VCH: Weinheim, Germany, 2020. [Google Scholar]
  9. Verein Deutscher Ingenieure (Ed.) VDI-Waermeatlas: Berechnungsblaetter für den Waermeuebergang, 9th ed.; Springer: Berlin/Heidelberg, Germany, 2002. [Google Scholar]
  10. Schluender, E.-U.; Tsotsas, E. Waermeuebertragung in Festbetten, Durchmischten Schuettguetern und Wirbelschichten; Georg Thieme Verlag: Stuttgart, Germany, 1988. [Google Scholar]
  11. Nilles, M. Waermeübertragung an der Wand Durchstroemter Schuettungsrohre. Ph.D. Thesis, University Karlsruhe, Karlsruhe, Germany, 1991. [Google Scholar]
  12. Schluender, E.-U. Einfuehrung in die Waermeuebertragung; Vieweg, Braunschweig: Wiesbaden, Germany, 1986. [Google Scholar]
  13. Stephan, K. Mechanismus und Modellgesetz des Waermeuebergangs bei der Blasenverdampfung. Chem. Ing. Techn. 1963, 35, 775–784. [Google Scholar] [CrossRef]
  14. Stephan, K. Waermeuebergang Beim Kondensieren und Beim Sieden; Springer: Berlin/Heidelberg, Germany; New York, NY, USA; London, UK; Paris, France; Tokyo, Japan, 1988. [Google Scholar]
  15. Ergun, S. Fluid Flow through Packed Columns. Chem. Eng. Prog. 1952, 48, 89–94. [Google Scholar]
  16. Fritz, W. Grundlagen der Waermeuebertragung beim Verdampfen von Fluessigkeiten. Chem. Ing. Tech. 1963, 35, 753–764. [Google Scholar] [CrossRef]
Figure 1. Heat transfer coefficient from fixed bed to inner tube wall at r = rt (αw,int) and heat transfer coefficient from external tube wall to boiling water (αw,ex) of a multi-tubular FT reactor according to the models M0, M1, and M3. (left) shows the profiles of αw,int and αw,ex in the whole tube (0 < z < 12 m). Conditions: Ca = 3, us,z=0 = 1 m/s, ptotal = 30 bar, dp = 3 mm, dt,int = 3 cm, Lt = 12 m, H2/CO = 2.2. Axial profile of Rep is shown in Figure S2. Details of αw,ex (right) in the entrance region (z < 0.6 m) show that convection boiling dominates in the front section (z < 0.24 m) with a still rather low heat flux; for z > 0.24 m, we then have nucleate boiling and a strong rise in αw,ex. Also note that αw,ex formally also includes heat conduction through the tube wall, see Equation (S18) and Figure S3, although this contribution is rather small.
Processes 11 03281 g001
Figure 2. Radial thermal conductivity in the fixed bed (λrad) of a multi-tubular FT reactor according to model M0, M1, and M3 (Ca = 3, us,z=0 = 1 m/s, ptotal = 30 bar, dp = 3 mm, dt,int = 3 cm, Lt = 12 m, molar H2-to-CO ratio = 2.2). For axial profile of Rep, see Figure S2.
Processes 11 03281 g002
Figure 3. Temperature profiles in axial direction at r = 0 (center of tube) for model M3 (considering ∆pbed and change in total molar flow rate by reaction). The results of model M0 and M1 (both assuming constant us) are also shown (Ca = 3; us,z=0 (230 °C, 30 bar) = 1 m/s; other conditions in Table 4). Profiles of the reaction rate are shown in Figure S4.
Processes 11 03281 g003
Figure 4. Axial profiles of gas velocity us for model M3 (considering ∆pbed and change in total molar flow rate). Results of model M2n and M2p (considering only change in molar flow rate and not of ∆pbed or vice versa) and M0 (assuming constant us and constant αw,ex) are also shown (Ca = 3; us,z=0 (230 °C, 30 bar) = 1 m/s; other data in Table 4).
Processes 11 03281 g004
Figure 5. Individual (left) and combined contributions (right) to change in gas velocity us (1 m/s at reactor entrance for 230 °C and 30 bar) according to model M3: (1) change in ptotal by ∆pbed, i.e., us~30 bar/ptotal = 30 bar/(30 bar − ∆pbed); (2) change in T, i.e., us~T/503 K; (3) change in total molar flow rate by reaction, i.e., us~ n ˙ t o t a l / n ˙ t o t a l ,   z = o . Conditions: Ca = 3; us,z=0 (230 °C, 30 bar) = 1 m/s; other conditions in Table 4.
Processes 11 03281 g005
Figure 6. Profiles of axial temperature at r = 0 (center of tube) in a tube of a cooled multi-tubular FT reactor for model M3 (considering ∆pbed and change in total molar flow rate by reaction). For comparison, model M1 (without ∆pbed and assuming constant us) is also shown. Conditions: Ca = 2; us,z=0 (230 °C, 30 bar) = 0.5 m/s; other conditions are listed in Table 4. The corresponding profiles of the reaction rate are depicted in Figure S5.
Processes 11 03281 g006
Figure 7. Profiles of gas velocity us in a single tube for model M3 (considering ∆pbed and change in molar flow rate). For comparison, results of model M1 (left; assuming constant us), model M2n, and M2p (right; considering only change of total molar flow rate or of total pressure, respectively) are also shown. Conditions: Ca = 2; us,z=0 (230 °C, 30 bar) = 0.5 m/s; other conditions in Table 5. Horizontal lines (left) represent mean values.
Processes 11 03281 g007
Figure 8. Influence of initial superficial gas velocity us,z=0 (230 °C, 30 bar) on axial profiles of us for the “best” model M4 (considering ∆pbed, change in total molar flow rate by FT reaction, and inhibition by steam/water). Reaction conditions are listed in Table 8.
Processes 11 03281 g008
Figure 9. Axial temperature profiles for the “best” model M4 (considering ∆pbed, change in total molar flow rate by FT reaction, and inhibition by steam/water) for us,z=0 (230 °C, 30 bar) in a range of 0.5 to 1.5 m/s. Further reaction conditions are listed in Table 8.
Processes 11 03281 g009
Figure 10. Influence of initial gas velocity us (230 °C, 30 bar) on production of C2+-HCs per tube and hour of a multi-tubular reactor (left) and on CO conversion per pass (right) for the “best” model M4 (considering ∆pbed, change in total molar flow rate by FT reaction, and inhibition by steam/water) and for the “simple” model M1 (without considering these three factors). (Ca = 3; other reaction conditions and data are listed in Table 8.)
Processes 11 03281 g010
Table 1. Parameter values used to model the FT reactor with gas recycle and a total CO conversion of 95% (details on heat transfer in Supporting Information).
Constant Parameters (230 °C, 30 bar) Not Varied during ModelingValue
Length of reactor (single tube) Lt12 m a
Internal tube diameter dt,int3 cm
Thickness of tube wall swall0.3 cm
Content of CO (in fresh syngas) yCO,fresh,SG0.3125
Content of H2 (in fresh syngas) yH2,fresh,SG = 1 − yCO,fresh,SG0.6875
Total pressure ptotal30 bar
Diameter of spherical catalyst particles dp3 mm
Bulk density of bed/catalyst ρbed960 kg m−3
Porosity of fixed bed εbed0.4
Heat capacity of gas mixture cp29 J mol−1 K−1
Thermal conductivity of gas mixture λg0.016 W m−1 K−1
Kinematic viscosity of gas mixture νg2.3 × 10−6 m2 s−1
Thermal conductivity of wall material (steel) λwall15 W m−1 K−1
Parameters varied during modelingCommentTypical value
Content of CO (inlet of reactor) yCO,reactor,independs on XCO
and corresponding
recycle ratio R
0.19 b
Content of H2 (inlet of reactor) yH2,reactor,in0.42 b
Content of CH4 (inlet of reactor) yCH4,reactor,in c0.39 a
Pressure drop ∆pbeddepends on us5.6 bar b
Initial superficial gas velocity us,z=0 (230 °C, 30 bar)varied1 m s−1
Heat transfer coefficient (wall to boiling water) αw,exdepends on us d1850 W m−2 K−1
Effective radial thermal conductivity λrad8.4 W m−1 K−1
Heat transfer coefficient (bed to internal tube wall) αw,int1540 W m−2 K−1
a The length of the tubes of industrial multi-tubular FT reactors are typically in a range of 12 to 20 m [6,7]. b Values according to model M4 for us,z=0 = 1 m/s and Ca = 3. c The recycle and purge gas is considered to contain only unconverted CO and H2 and CH4. It is assumed that H2O and all C2+-HCs are separated as liquids downstream of the reactor (see [2]). d λrad and αw,int depend on us, which changes along the tubes due to pressure drop and decreasing total molar flow rate. The values listed are initial values at the tube inlet for us,z=0 = 1 m/s. αw,ex mainly depends on the local radial heat flux. The listed value is the one at z = 1.9 m, where the maximum axial temperature of 240 °C is just reached for us = 1 m/s and Ca = 3. αw,ex also includes heat conduction through the wall; see Equation (S18) in the Supporting Information.
Table 2. Reactor models used here for a multi-tubular fixed-bed FT reactor.
Label of ModelParameter Considered
(+)or Neglected (−)
Comment
Δ n ˙ t o t a l pbedImpact of H2O
M0“Simple” model used in previous publications [1,2]
( constant   u s ,   p total ,   n ˙ t o t a l , and αw,ex (1 kW m−2 K−1)
M1As model M0, but accurate calculation of αw,ex
(for details see Section 3.1)
M2n+ Used   to   show   only   effect   of   Δ n ˙ t o t a l (and of corresponding axial drop of us), i.e., neglecting pbed
M2p+ Used   to   show   only   effect   of   p b e d   ( and   of   corresponding   axial   rise   of   u s ) ,   i . e . ,   neglecting   change   of   n ˙ t o t a l
M3++Accurate model, if inhibition by steam is negligible
M4+++As M3, but also considering inhibition by steam
Table 3. Data of multi-tubular FT reactor according to the models M0 (with constant value of αw,ex) and M1 (improved calculation of αw,ex; see text and Figure 1) for constant us of 1 m/s (230 °C, 30 bar) and Ca = 3. Conditions: XCO,total = 95%; SCH4 = 20%; molar H2-to-CO ratio = 2.2; Tmax = 240 °C; 1825 mol/h syngas per tube at reactor inlet.
Tcool
in °C
XCO,per pass
in %
yCH4,reactor,in
in %
RProd. of C2+-HCs per Tube in kgC per hReactor Model and Parameter Considered (+) or Neglected (−)
Modelαw,ex = f(z) Δ n ˙ t o t a l pbed
219.944.3 a38.72.501.48M0
223.045.538.12.381.54M1+ (see Figure 1)
a Throughout this work, we have chosen a precision for the CO conversion (and other parameters) of three significant digits (e.g., here, 44.3%). A higher precision is not justified (also with regard to the insufficient knowledge of the “exact” values of kinetic, heat transfer parameters, etc.). In addition: for a constant maximum axial temperature (here, 240 °C), the value calculated by the model is not exactly 240.00 °C but typically in a range of 239.98 and 240.02 °C to limit the time needed for the variation in the cooling temperature to reach the target value of 240.00 °C. Hence, the normalized rate and thus the conversion are then in a range of 0.9993 and 1.007 of the “true” value of 1.000.
Table 4. Data of multi-tubular fixed-bed FT reactor according to the reactor models M1, M2n, M2p, and M3 for us,z=0 = 1 m/s (230 °C, 30 bar) and Ca = 3. Conditions: XCO,total = 95%, SCH4 = 20%, molar H2-to-CO ratio = 2.2, Tmax = 240 °C, 1825 mol/h syngas per tube at reactor inlet. Further details are shown in the Figure S4.
Tcool
in °C
XCO,per pass
in %
yCH4,reactor,in
in %
RProd. of C2+-HCs per Tube
in kgC per h
Reactor Model and Parameters Considered (+) or Neglected (−)
Model Δ n ˙ t o t a l pbedImpact of H2O
223.045.538.12.381.54M1
222.549.136.22.051.72M2n+
223.542.639.62.691.41M2p+
222.845.837.92.351.56M3++
Table 5. Data of a multi-tubular FT reactor according to models 1, 2n, 2p, and 3 for us,z=0 = 0.5 m/s (230 °C, 30 bar) and Ca = 2. Conditions: XCO,total = 95%; SCH4 = 20%; molar H2-to-CO ratio = 2.2; Tmax = 240 °C; 912.5 mol/h syngas per tube at reactor inlet.
Tcool
in °C
XCO,per pass
in %
yCH4,reactor,in
in %
RProd. of C2+-HCs per Tube
in kgC per h
Reactor Model and Parameters Considered (+) or Neglected (−)
Model Δ n ˙ t o t a l pbedImpact
of H2O
218.057.731.41.411.08M1
216.663.427.91.091.25M2n+
218.257.131.71.451.07M2p+
216.962.828.31.121.23M3++
Table 6. Data for model M3 (no inhibition by steam) and model M4 (inhibition). Conditions: XCO,total = 95%; SCH4 = 20%; molar H2-to-CO ratio = 2.2; Tmax = 240 °C; 1825 or 912 mol/h syngas per tube at inlet for us,z=0 of 1 or 0.5 m/s (details in Figures S6 and S7).
Tcool
in °C
XCO,per pass
in %
yCH4,reactor,in
in %
RProduction of C2+-HCs per Tube
in kgC per h
Reactor Model and Parameters Considered (+) or Neglected (−)
Model Δ n ˙ t o t a l pbedImpact
of H2O
us,z=0 = 1 m/s (230 °C, 30 bar); Ca = 3
222.845.837.92.351.56M3++
223.144.4 a38.72.491.49M4+++
us,z=0 = 0.5 m/s (230 °C, 30 bar); Ca = 2
216.962.828.31.121.23M3++
217.659.0 b30.61.341.12M4+++
a pH2O at the end of the tubes (z = 12 m) is 2.5 bar, i.e., the intrinsic rate (Equation (4) is about 13% lower compared to no inhibition by steam; the effective rate then declines by only 7%, Equations (5) and (6). b pH2O at z = 12 m is 4.8 bar, i.e., the intrinsic rate is 25% lower compared to no inhibition; the effective rate then declines by 13%.
Table 7. Data of isothermal FT reactor (240 °C) for model M4 (considering ∆pbed, change in total molar flow, and inhibition by steam) and for M3 (as M4 but without influence of steam) for us,z=0 of 0.5 m/s and Ca of 4 (syngas with 31.3% CO and 68.7% H2).
CO Conversion XCO
at Axial Position z
pH2O (yH2O)
at z = 12 m
us
at z = 12 m
Reactor Model and Parameters Considered (+) or Neglected (−)
Model Δ n ˙ t o t a l pbedInhibition
by H2O
3 m6 m12 m
30.8%57.7%92.0%18.4 bar (63%)0.24 m/sM3++
29.5%53.1%81.4%14.3 bar a (49%)0.27 m/sM4+++
a The intrinsic rate (Equation (4)) at z = 12 m is 73% lower (M4) compared to no inhibition by steam (M3), and the effective rate declines by 52%, see Figures S6 and S7. ∆pbed is, in both cases, low (0.9 bar).
Table 8. Results of “best” reactor model M4: impact of initial gas velocity us,z=0 on the performance of a multi-tubular fixed-bed FT reactor for an axial activity Ca of 3 (XCO,total = 95%; SCH4 = 20%; molar H2-to-CO ratio = 2.2; Tmax = 240 °C). The axial profiles of ηpore (r = 0) for us (230 °C, 30 bar) of 0.5 and 1 m/s are shown in Figure S19.
us, in m/spbed
in bar
Tcool
in °C
pcool
in bar
XCO,per pass
in %
yCH4,reactor,in
in %
RC2+-HCs/Tube
in kgC per h
z = 0 az = 12 m
0.230.170.3199.6 b15.266.126.51.040.64
0.480.381.2213.3 c20.163.228.41.101.24
0.730.662.9219.422.953.134.01.731.44
0.991.045.6223.124.644.438.72.491.49
(best case)
1.241.639.8225.525.736.842.43.461.45
1.493.0916.7227.426.630.044.84.741.36
1.595.1921.5 d228.026.926.446.85.691.23
For comparison and illustration:
Hypothetic cases for absence of mass transfer resistance by pore diffusion (ηpore = 1)
0.460.441.4191 e12.928.945.85.010.43
0.941.075.7198 f14.928.446.05.130.84
a The values of us,z=0 for simulation are 0.25, 0.5, 0.75, 1, 1.25, 1.5, and 1.6 m/s and are related to 230 °C and 30 bar; the listed values at the reactor entrance are slightly lower, as Tcool = Tin < 230 °C. b In this case, the maximum temperature of 240 °C cannot be realized (runaway): the ignition temperature (Tig) is 204.6 °C and, for Tcool = 199.6 °C (5 K below Tig), Tmax is only 226 °C. c In this case, the maximum of 240 °C can just be realized without risk of thermal runaway; the ignition temperature (Tig) is 220 °C and, thus, Tcool,max is 215 °C. dpbed and us,z=12m increase strongly for us,z=0 > 1.6 m/s, see also Figure S15, e.g., for us,z=0 = 1.65 m/s (230 °C, 30 bar), we obtain us,z=12m = 10.2 m/s (!) and ∆pbed = 25.5 bar (pfinal = 4.5.bar). For such low total pressures, the kinetics were not evaluated and the model is not really reliable anymore. e Tmax of 240 °C cannot be realized, Tig is 196 °C, and, for Tcool,max = 191 °C, Tmax is only 199 °C. f Tmax of 240 °C cannot be realized, Tig is 203 °C, and Tcool,max = 198 °C, and Tmax = 208 °C. If Ca is decreased, e.g., to a value of two, Tig, Tcool,max, and Tmax are higher at 208 °C, 203 °C, and 212 °C, respectively, but, nevertheless, the CO conversion per pass is even lower (27.4%).
Disclaimer/Publisher’s Note: The statements, opinions and data contained in all publications are solely those of the individual author(s) and contributor(s) and not of MDPI and/or the editor(s). MDPI and/or the editor(s) disclaim responsibility for any injury to people or property resulting from any ideas, methods, instructions or products referred to in the content.

