
Integrated Thermal and Metallurgical Simulation Framework for Selective Laser Melting Multi-Component and Multi-Phase Alloys

Abstract
:1. Introduction
2. Theoretical Model
2.1. Thermal Model
2.1.1. Heat Input
2.1.2. Heat Dissipation
2.1.3. Initial Conditions
2.2. Metallurgical Model
2.2.1. Principles of the JMA Model
- It is assumed that within the SLM process, the material’s phase transition under thermal cycling is characterized as a diffusion phase transition, and its phase transition kinetics are related to physical mechanisms, such as nucleation and growth, at the level of the atomic lattice of the substances;
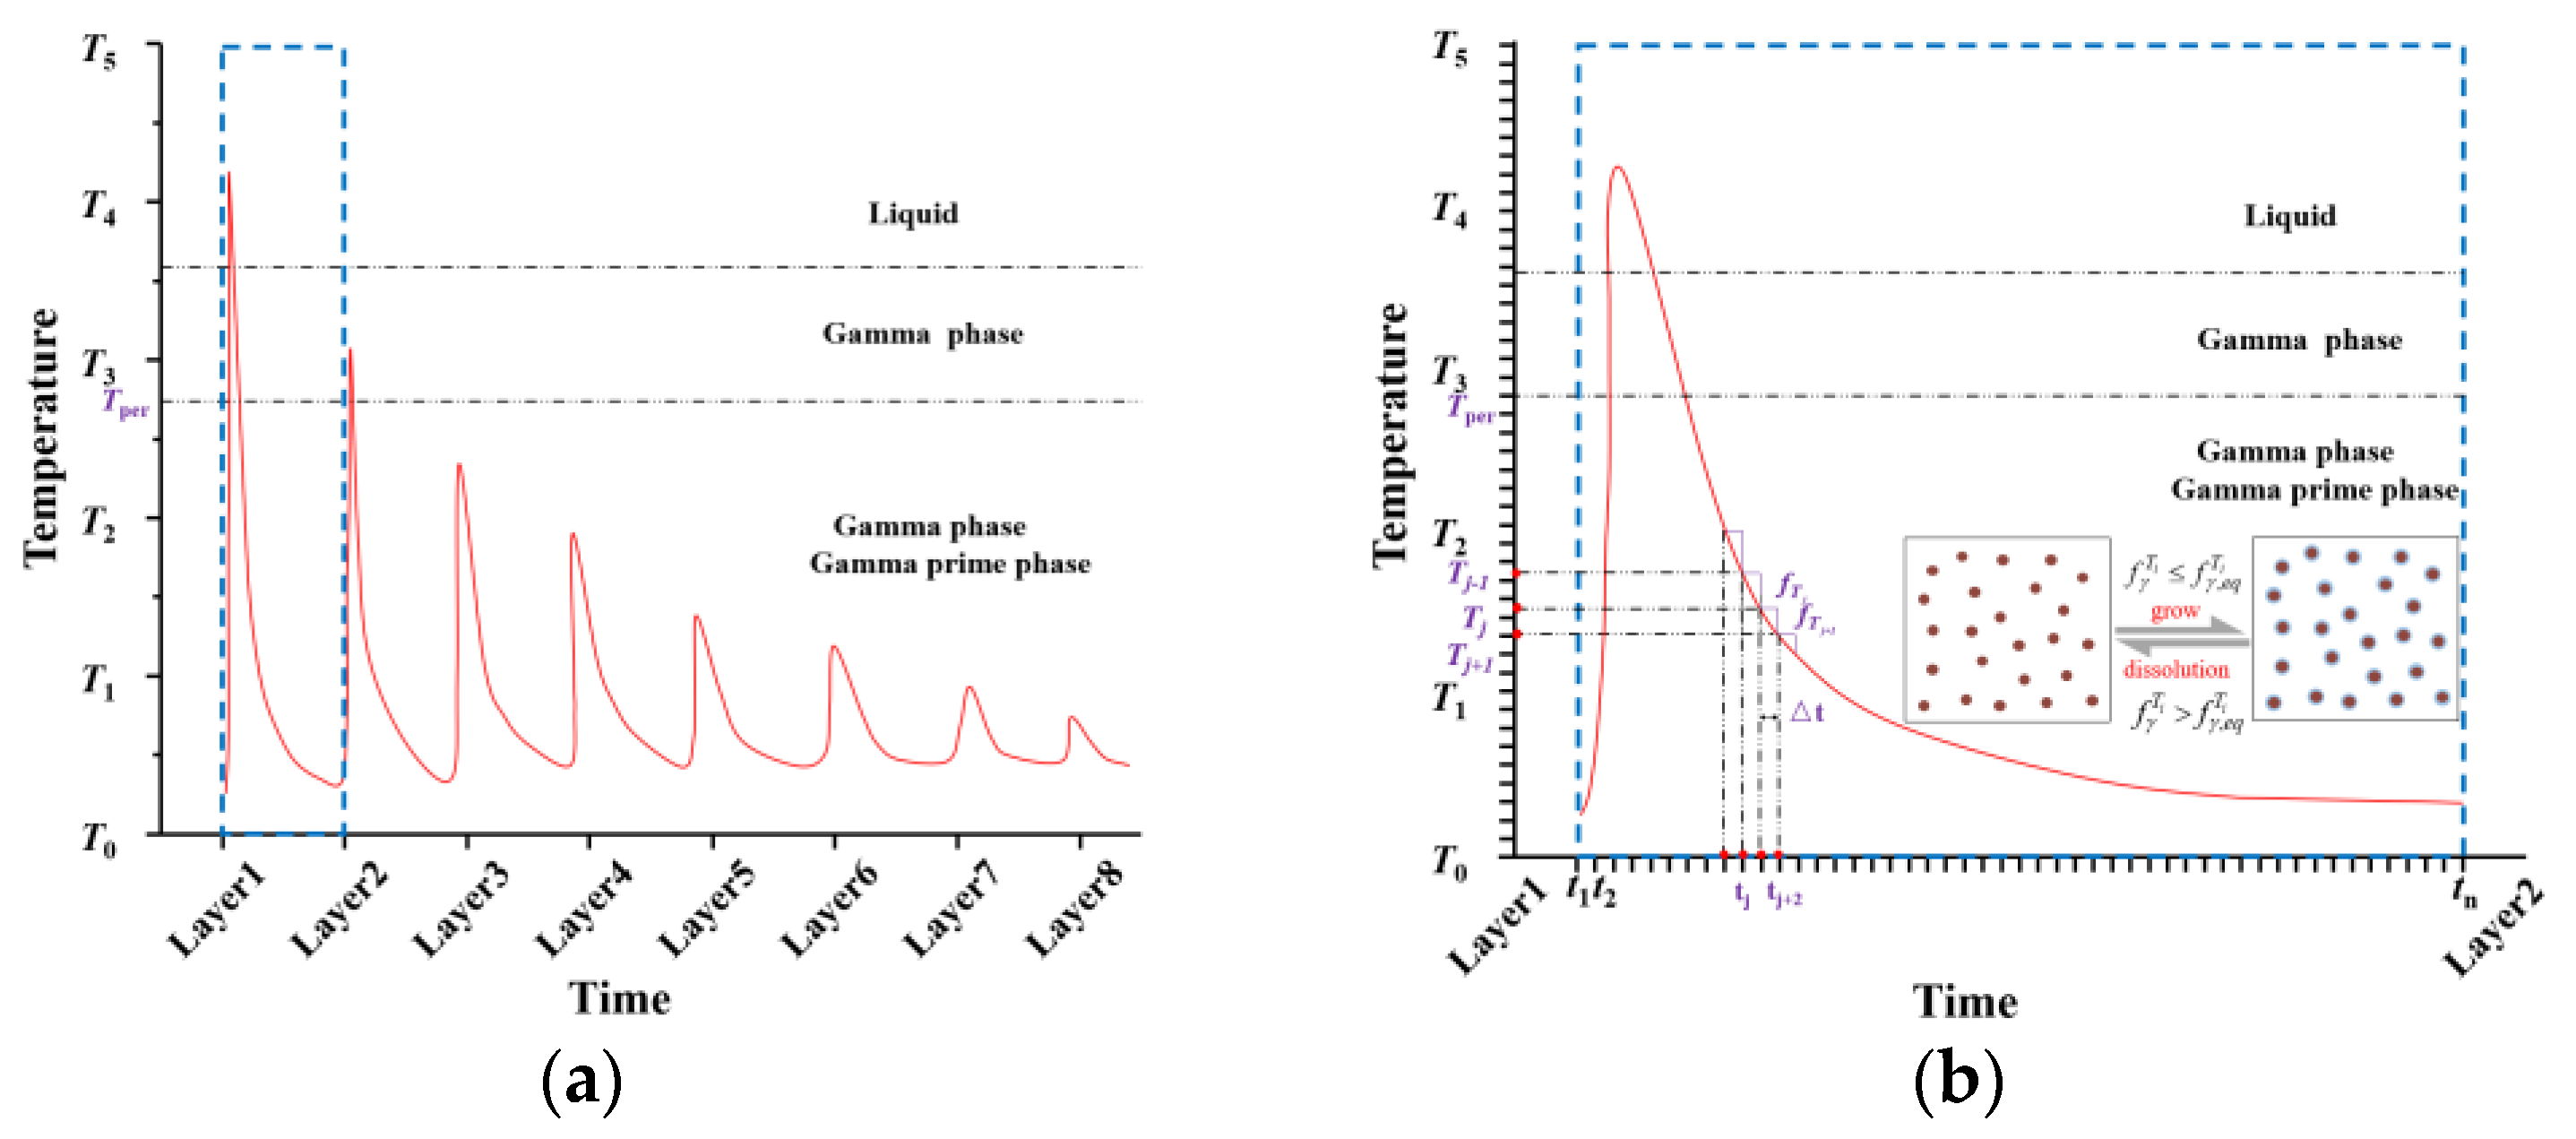
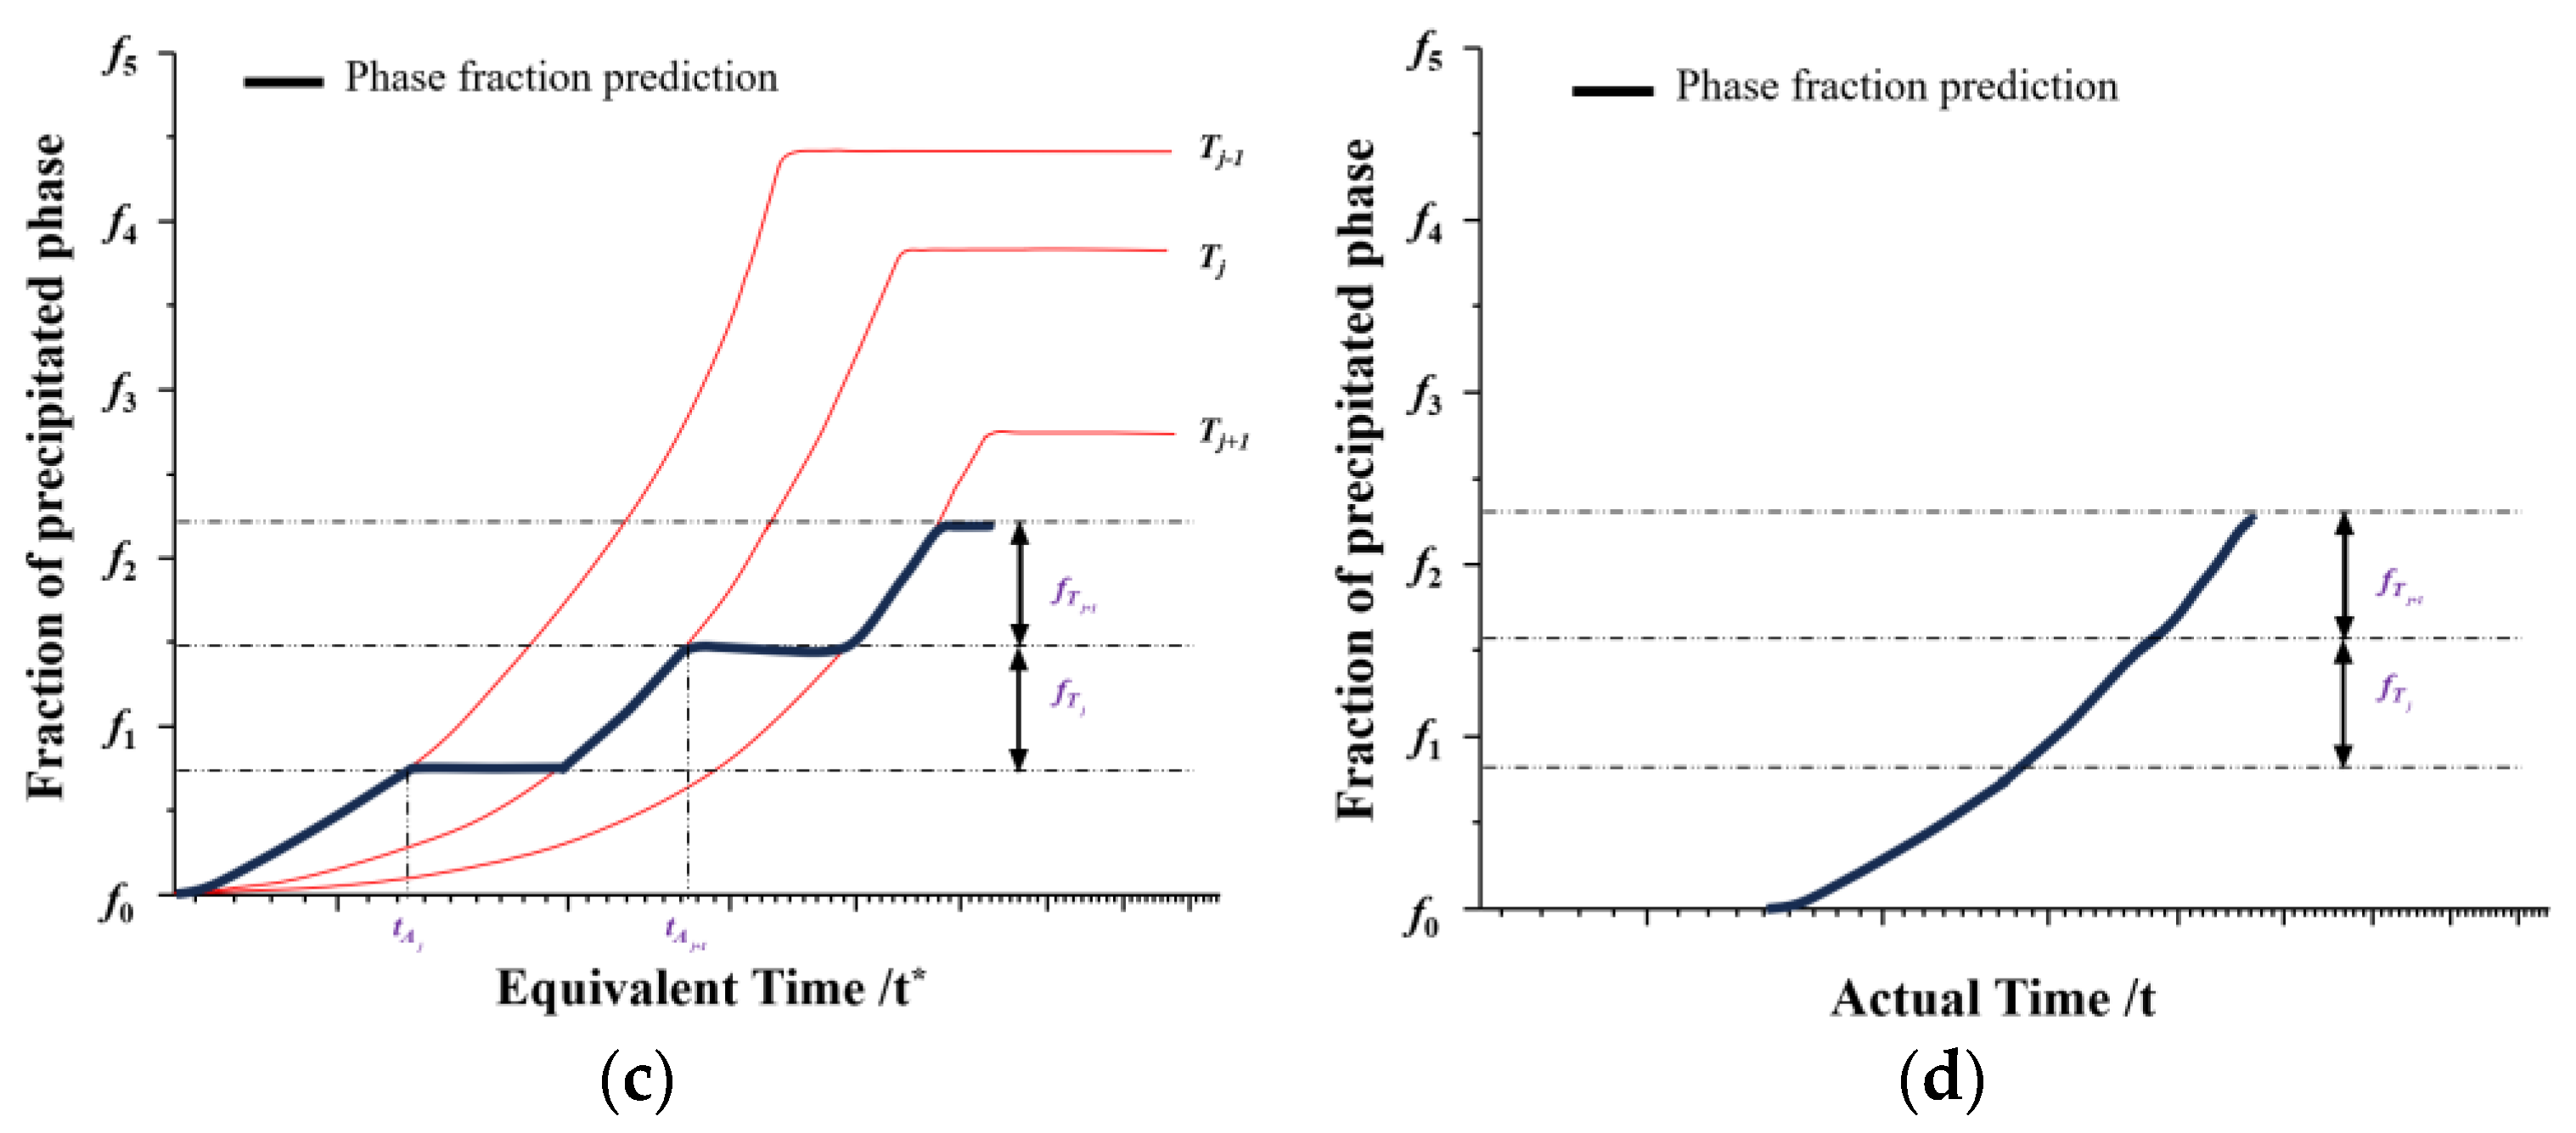
- It is assumed that the SPTB of the material during the printing process can be superimposed by the precipitation behavior of the isothermal section, in which the isothermal section is obtained by dispersing the temperature history over time;
- It is assumed that the phase transition occurring in the isothermal section is contingent upon the degree of reaction and the equilibrium phase fraction.
2.2.2. Kinetic Calculation of JMA Model
- It is assumed that within the ti-ti+n time interval, the γ′ phase in the IN738 superalloy continues to precipitate and grow. At the outset, the volume fraction of the γ′ phase at ti is , and the total time is divided into n parts;
- It is assumed that the time interval and the temperature interval are both sufficiently small positive values, and the material′s temperature remains constant within each period, in which the interval time ti-ti+1 corresponds to the temperature Ti, while the interval time ti+1-ti+2 corresponds to the temperature Ti+1, etc.
3. Numerical Model
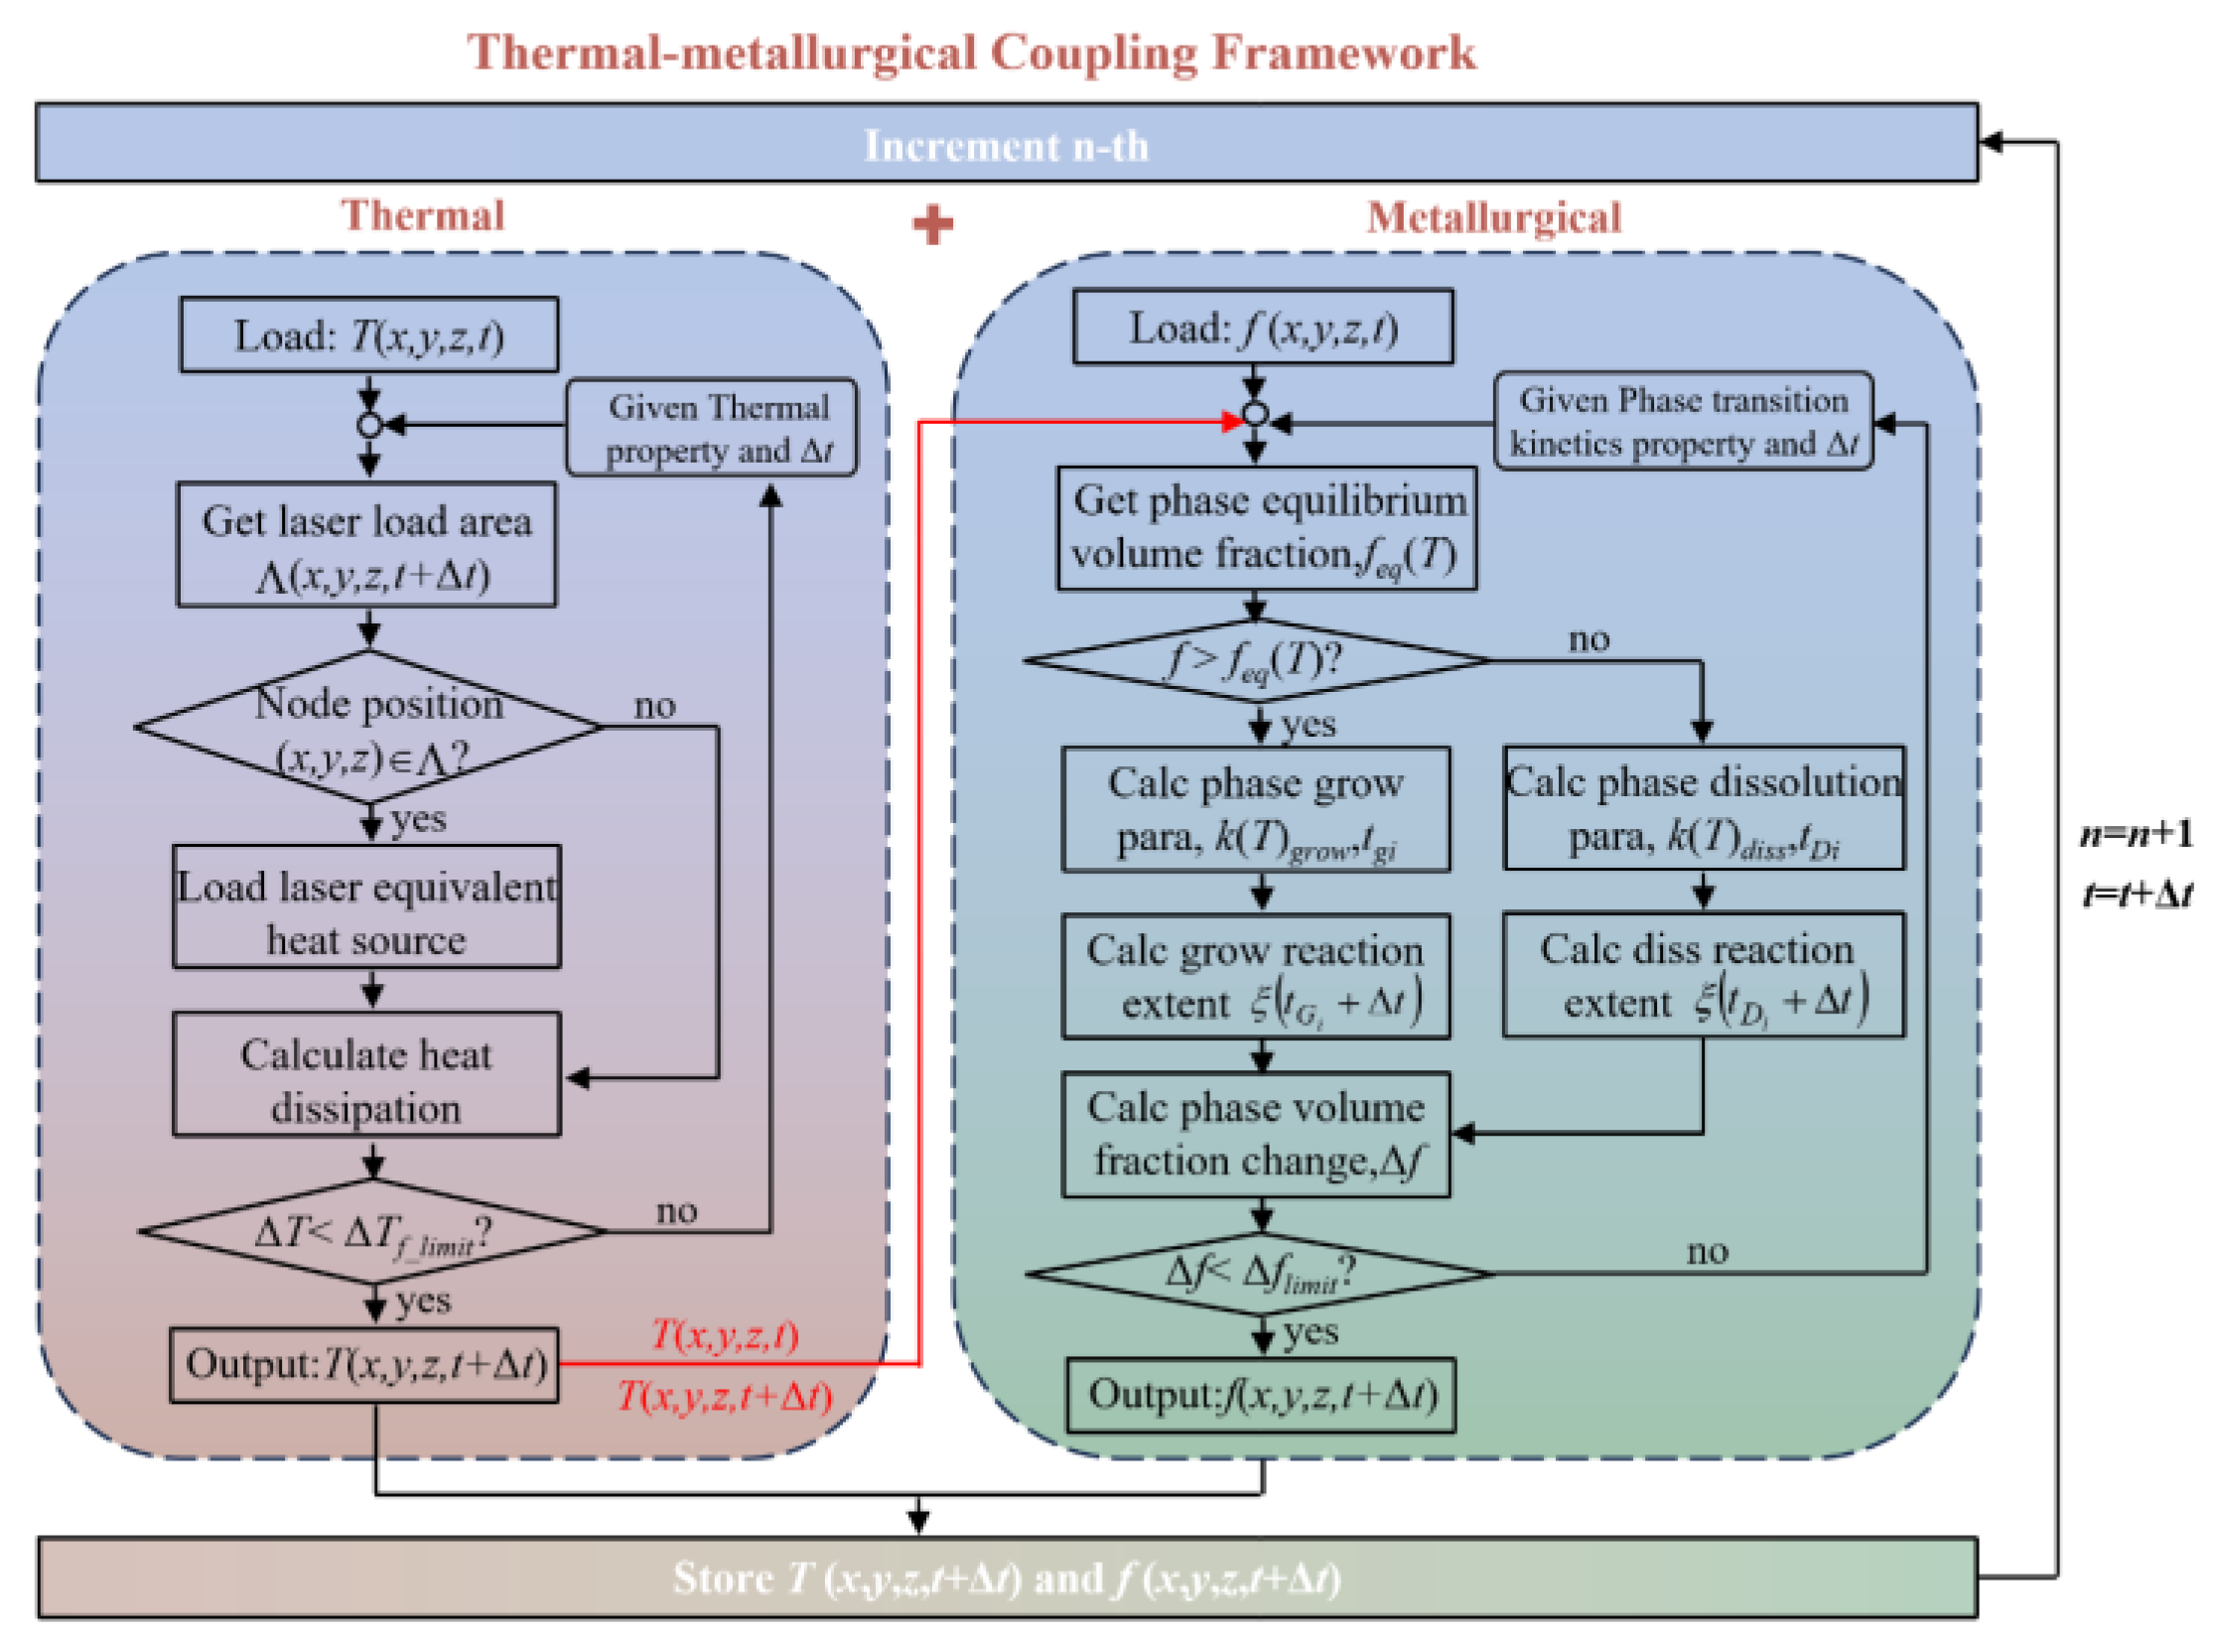
3.1. TMCF Modeling
- It is assumed that the layer-by-layer printing in the actual process can be described using the “birth and death method” to activate the dead unit layer by layer, wherein the thickness of the powder layer of the model is the same as that of the actual physical layer;
- The JMA model is mainly used to describe the phase change behavior at the microscopic scale (μm), and the computational domain in this work is the powder bed at the mesoscopic scale (mm). There are scale differences when applying this model, so it is assumed that the node’s phase fraction in the powder bed model (the horizontal distance between nodes is 50 μm) can represent the average phase fraction within the node’s neighboring microregions;
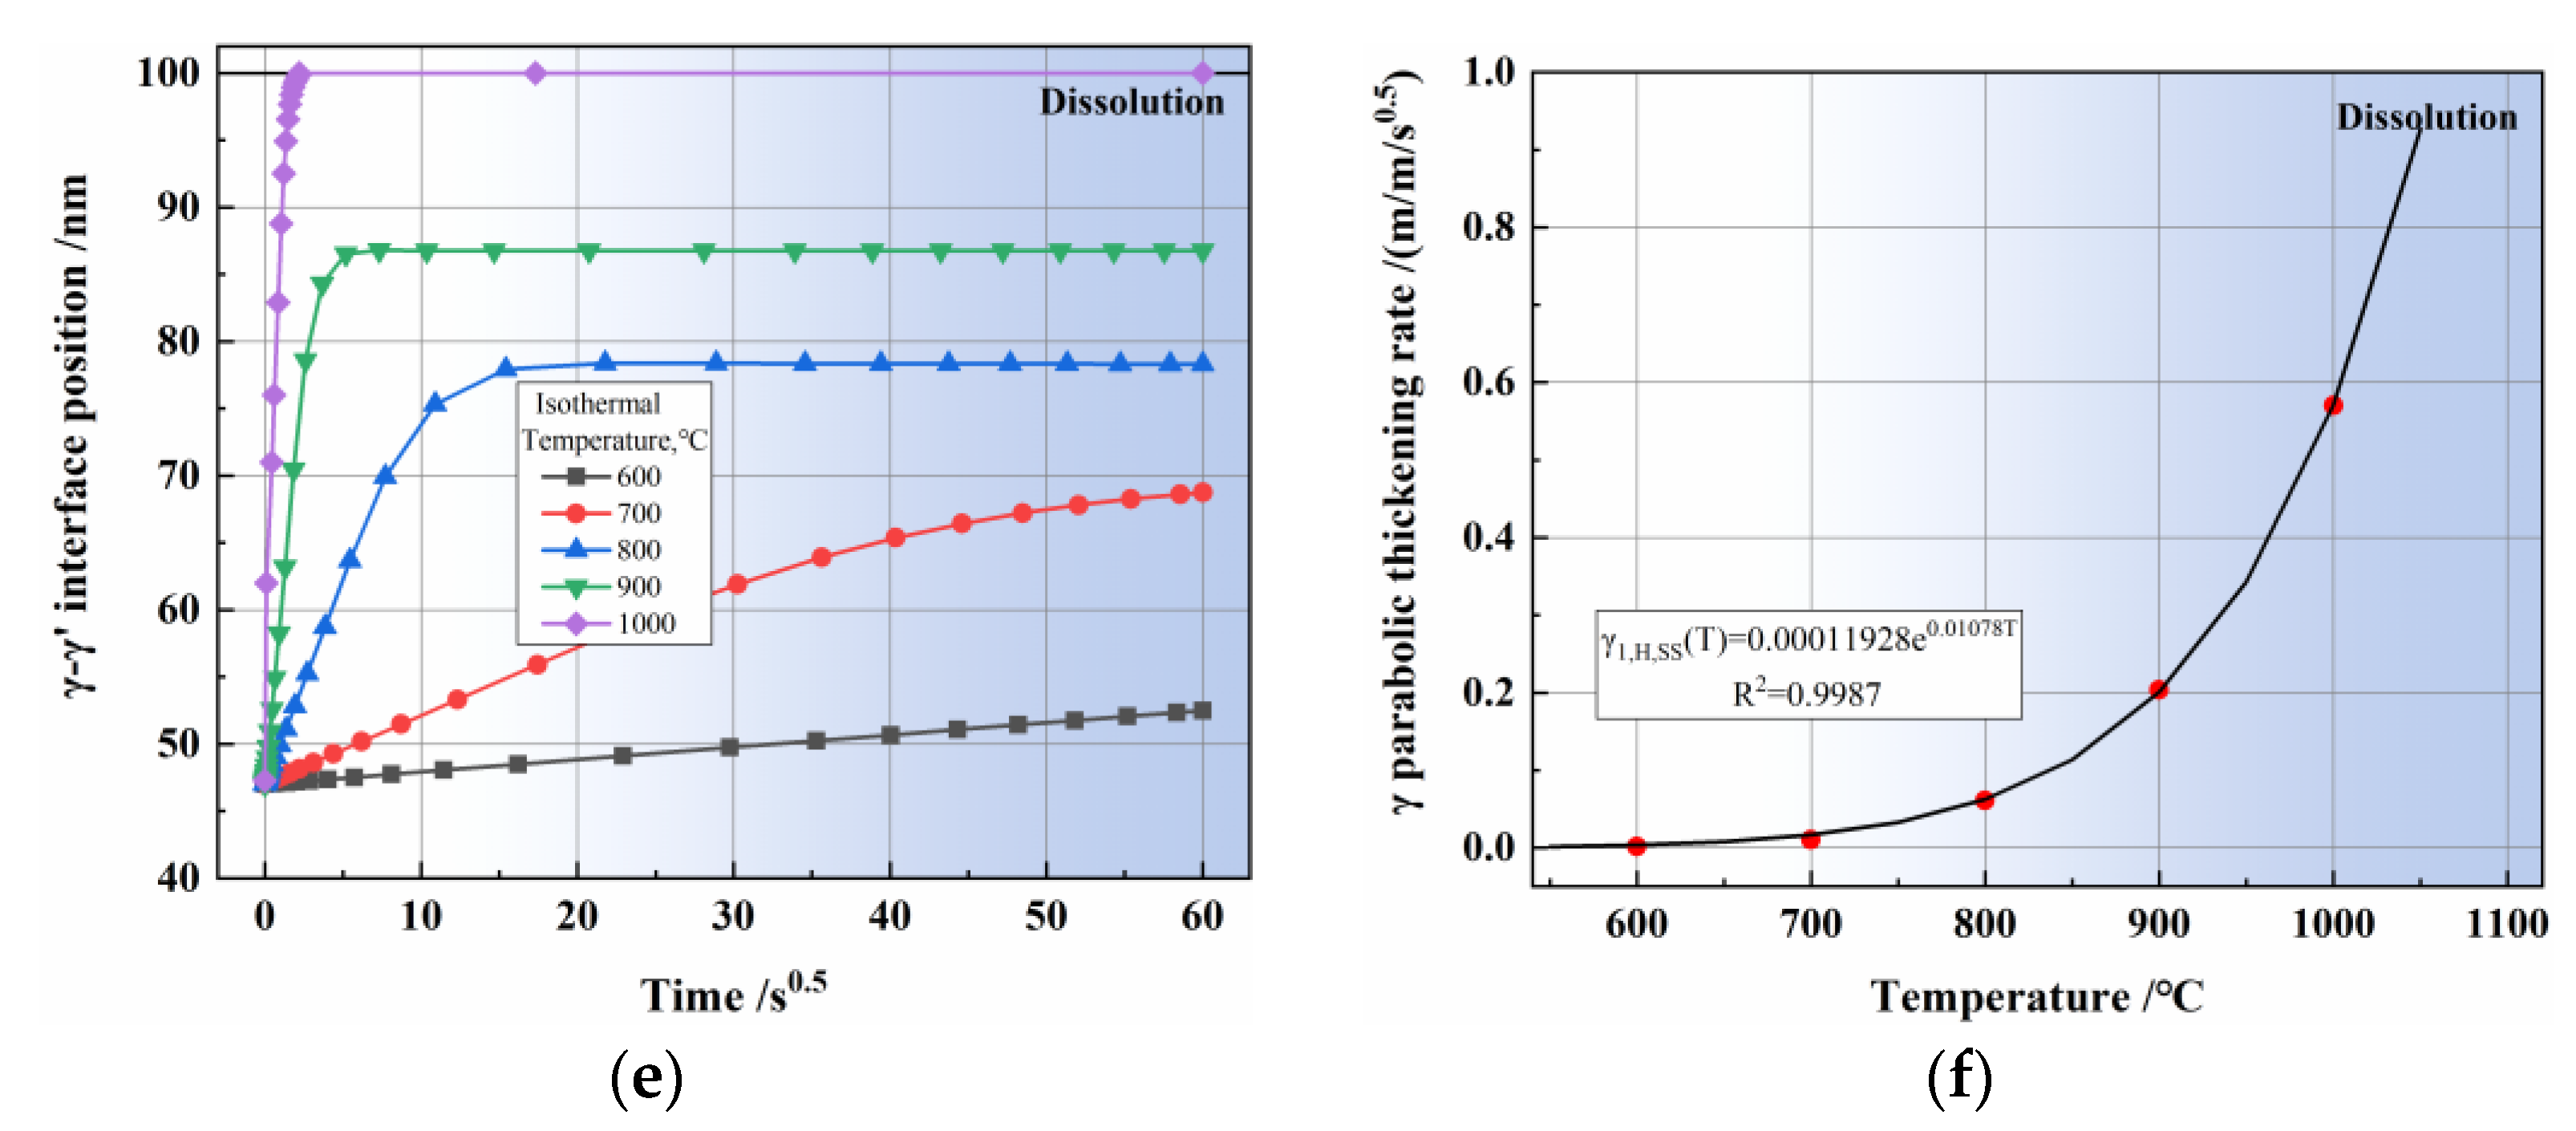
- Considering the slow diffusion-type phase transformation reaction rate at low temperatures, only the phase transformation behavior of the IN738 superalloy at temperatures above 600 °C is considered.
3.2. Simulation Parameters
3.3. Simulation Schemes
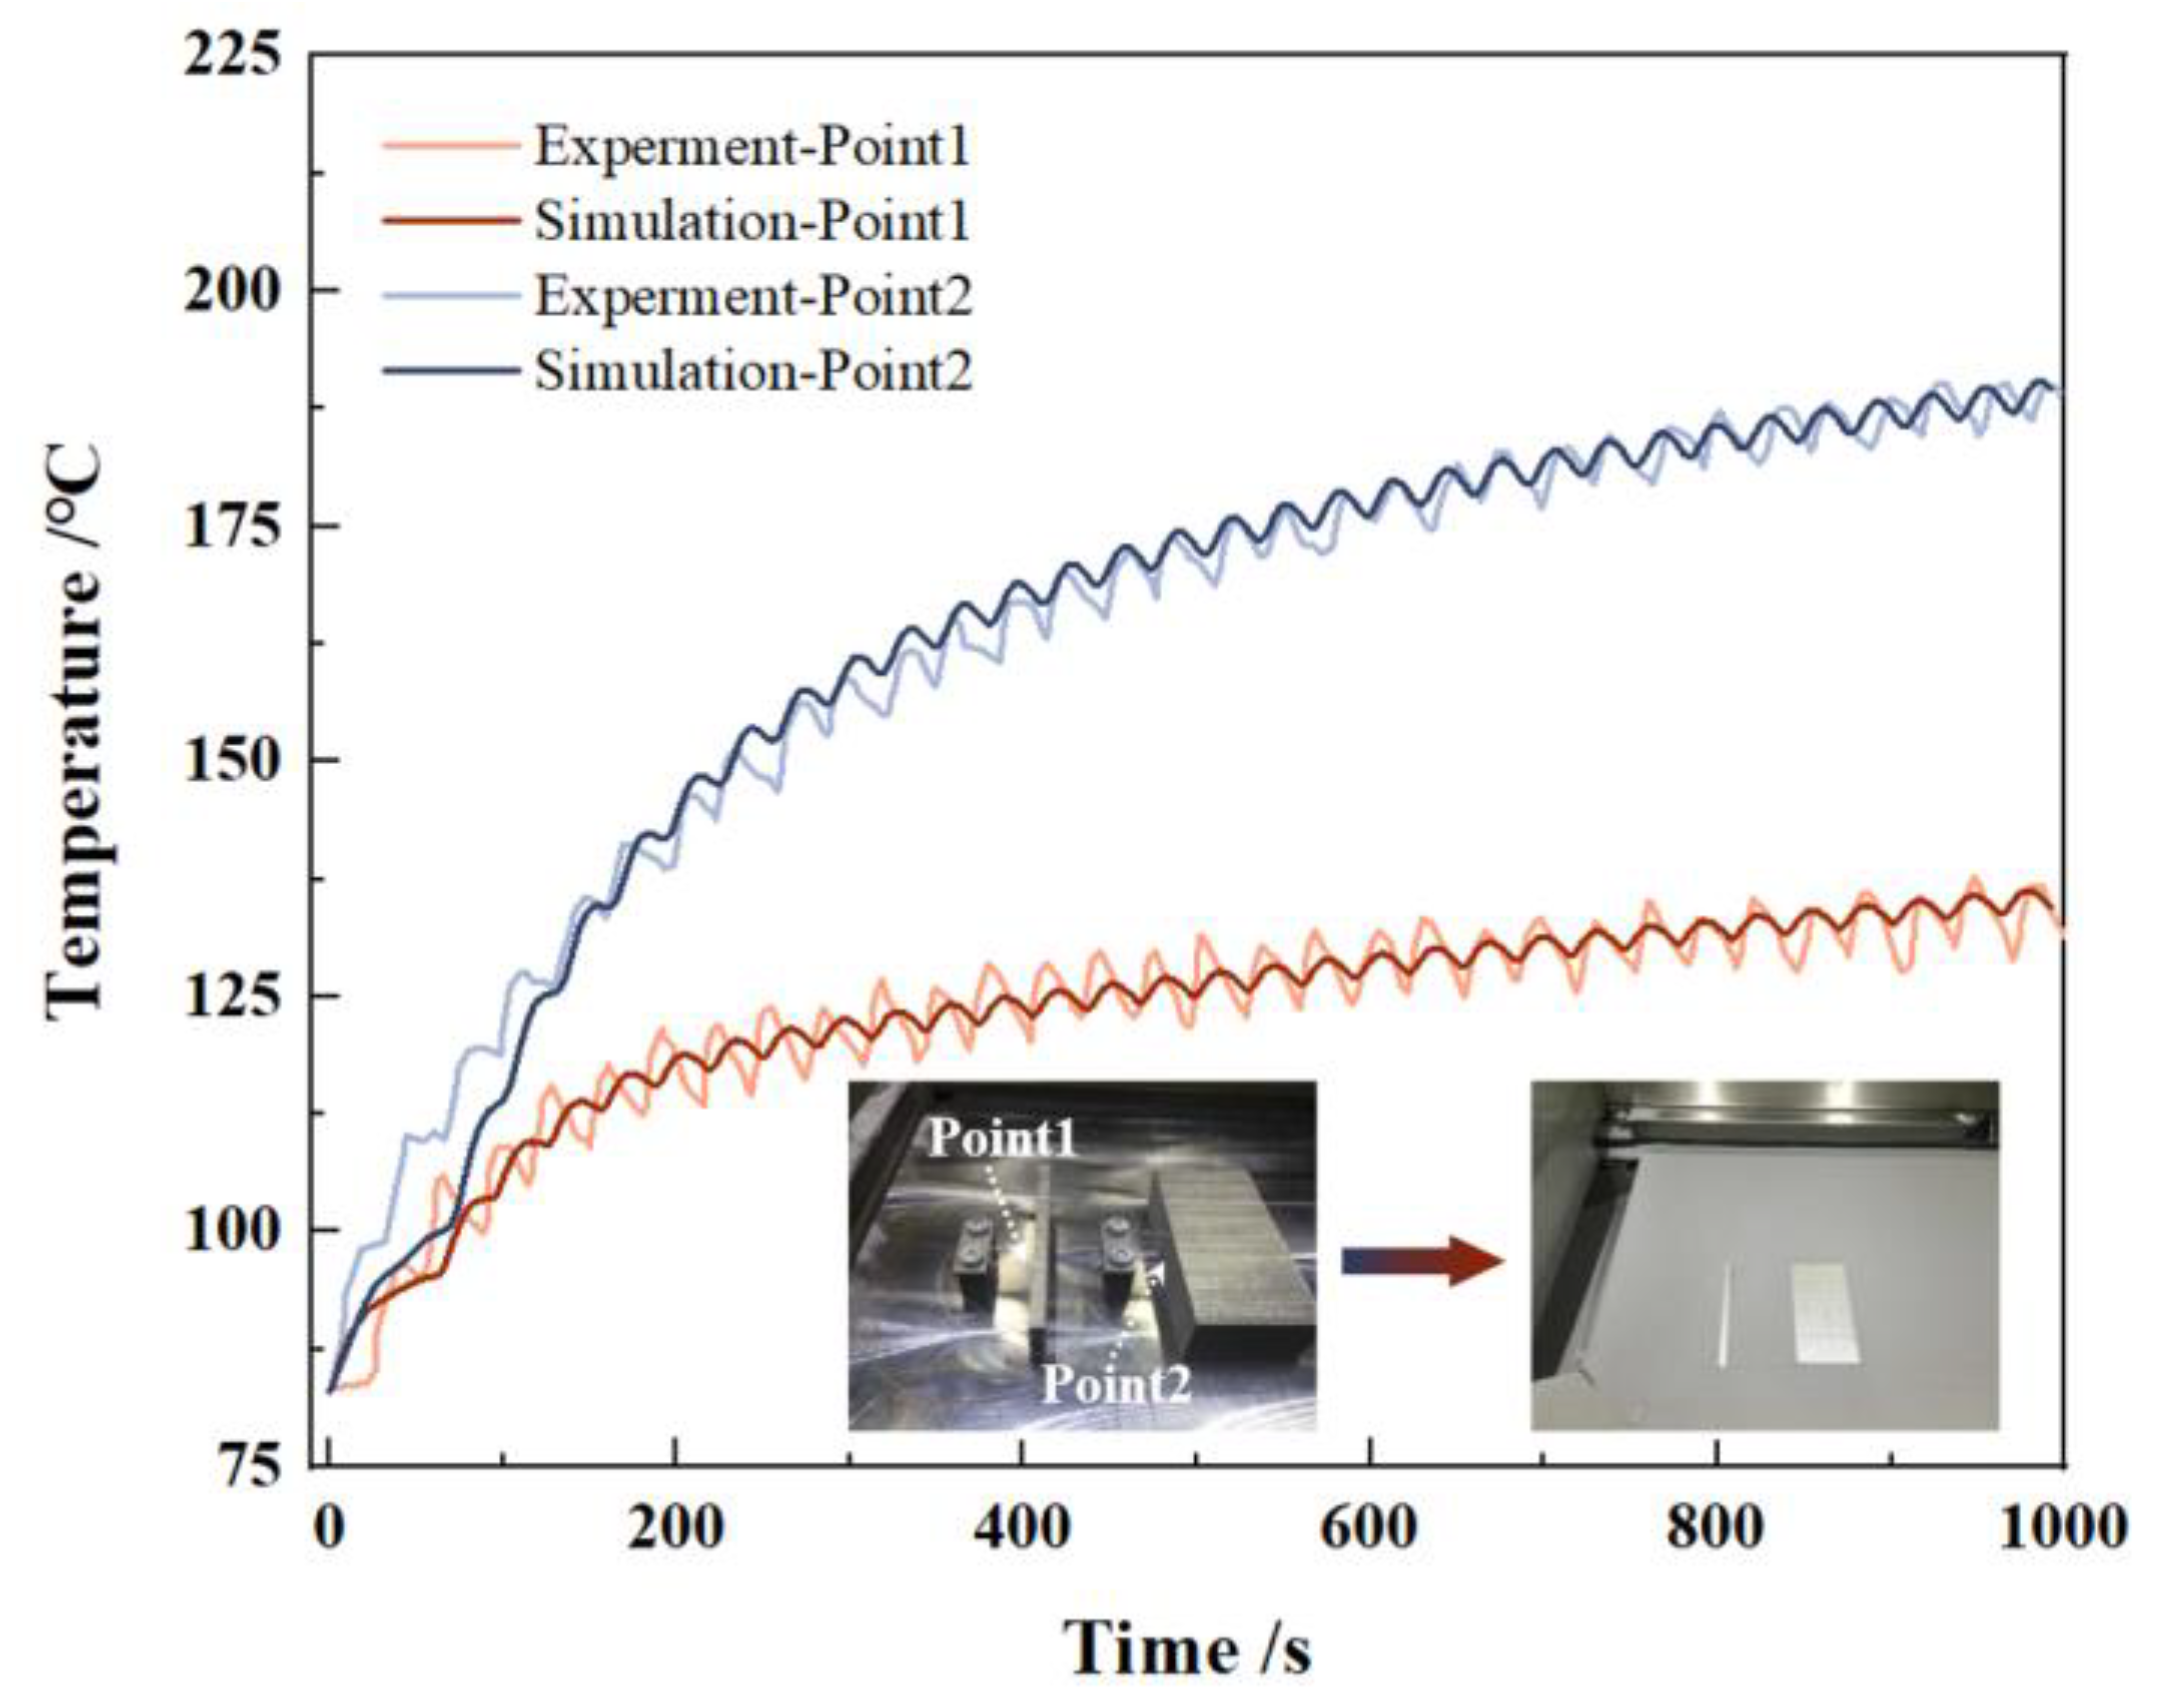
3.4. Thermal Model Verification
4. Results
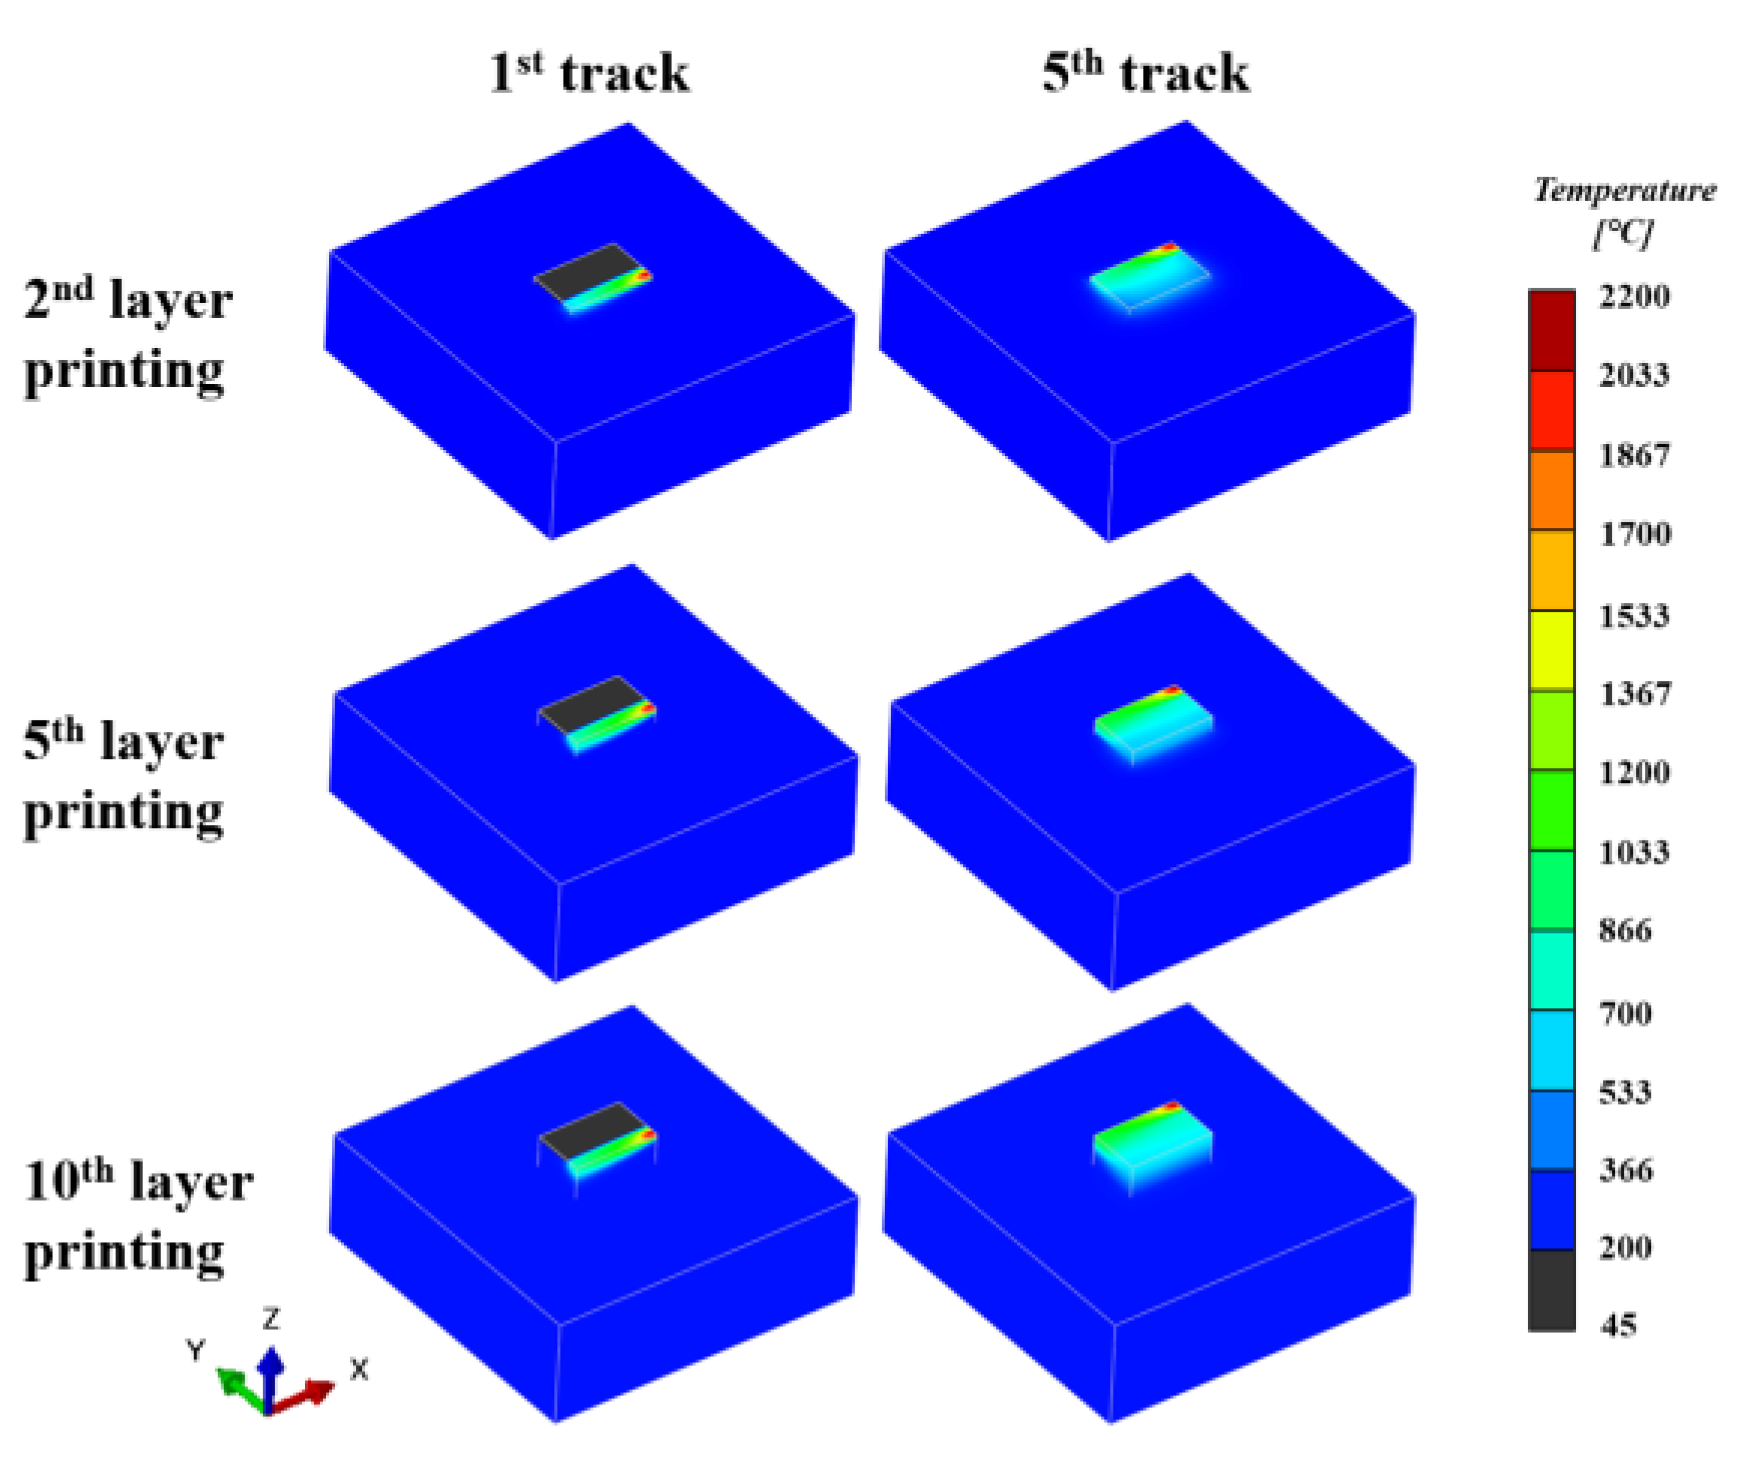
4.1. Temperature Field and Precipitation Evolution
4.2. Effect of Process Parameters on Precipitation Behavior
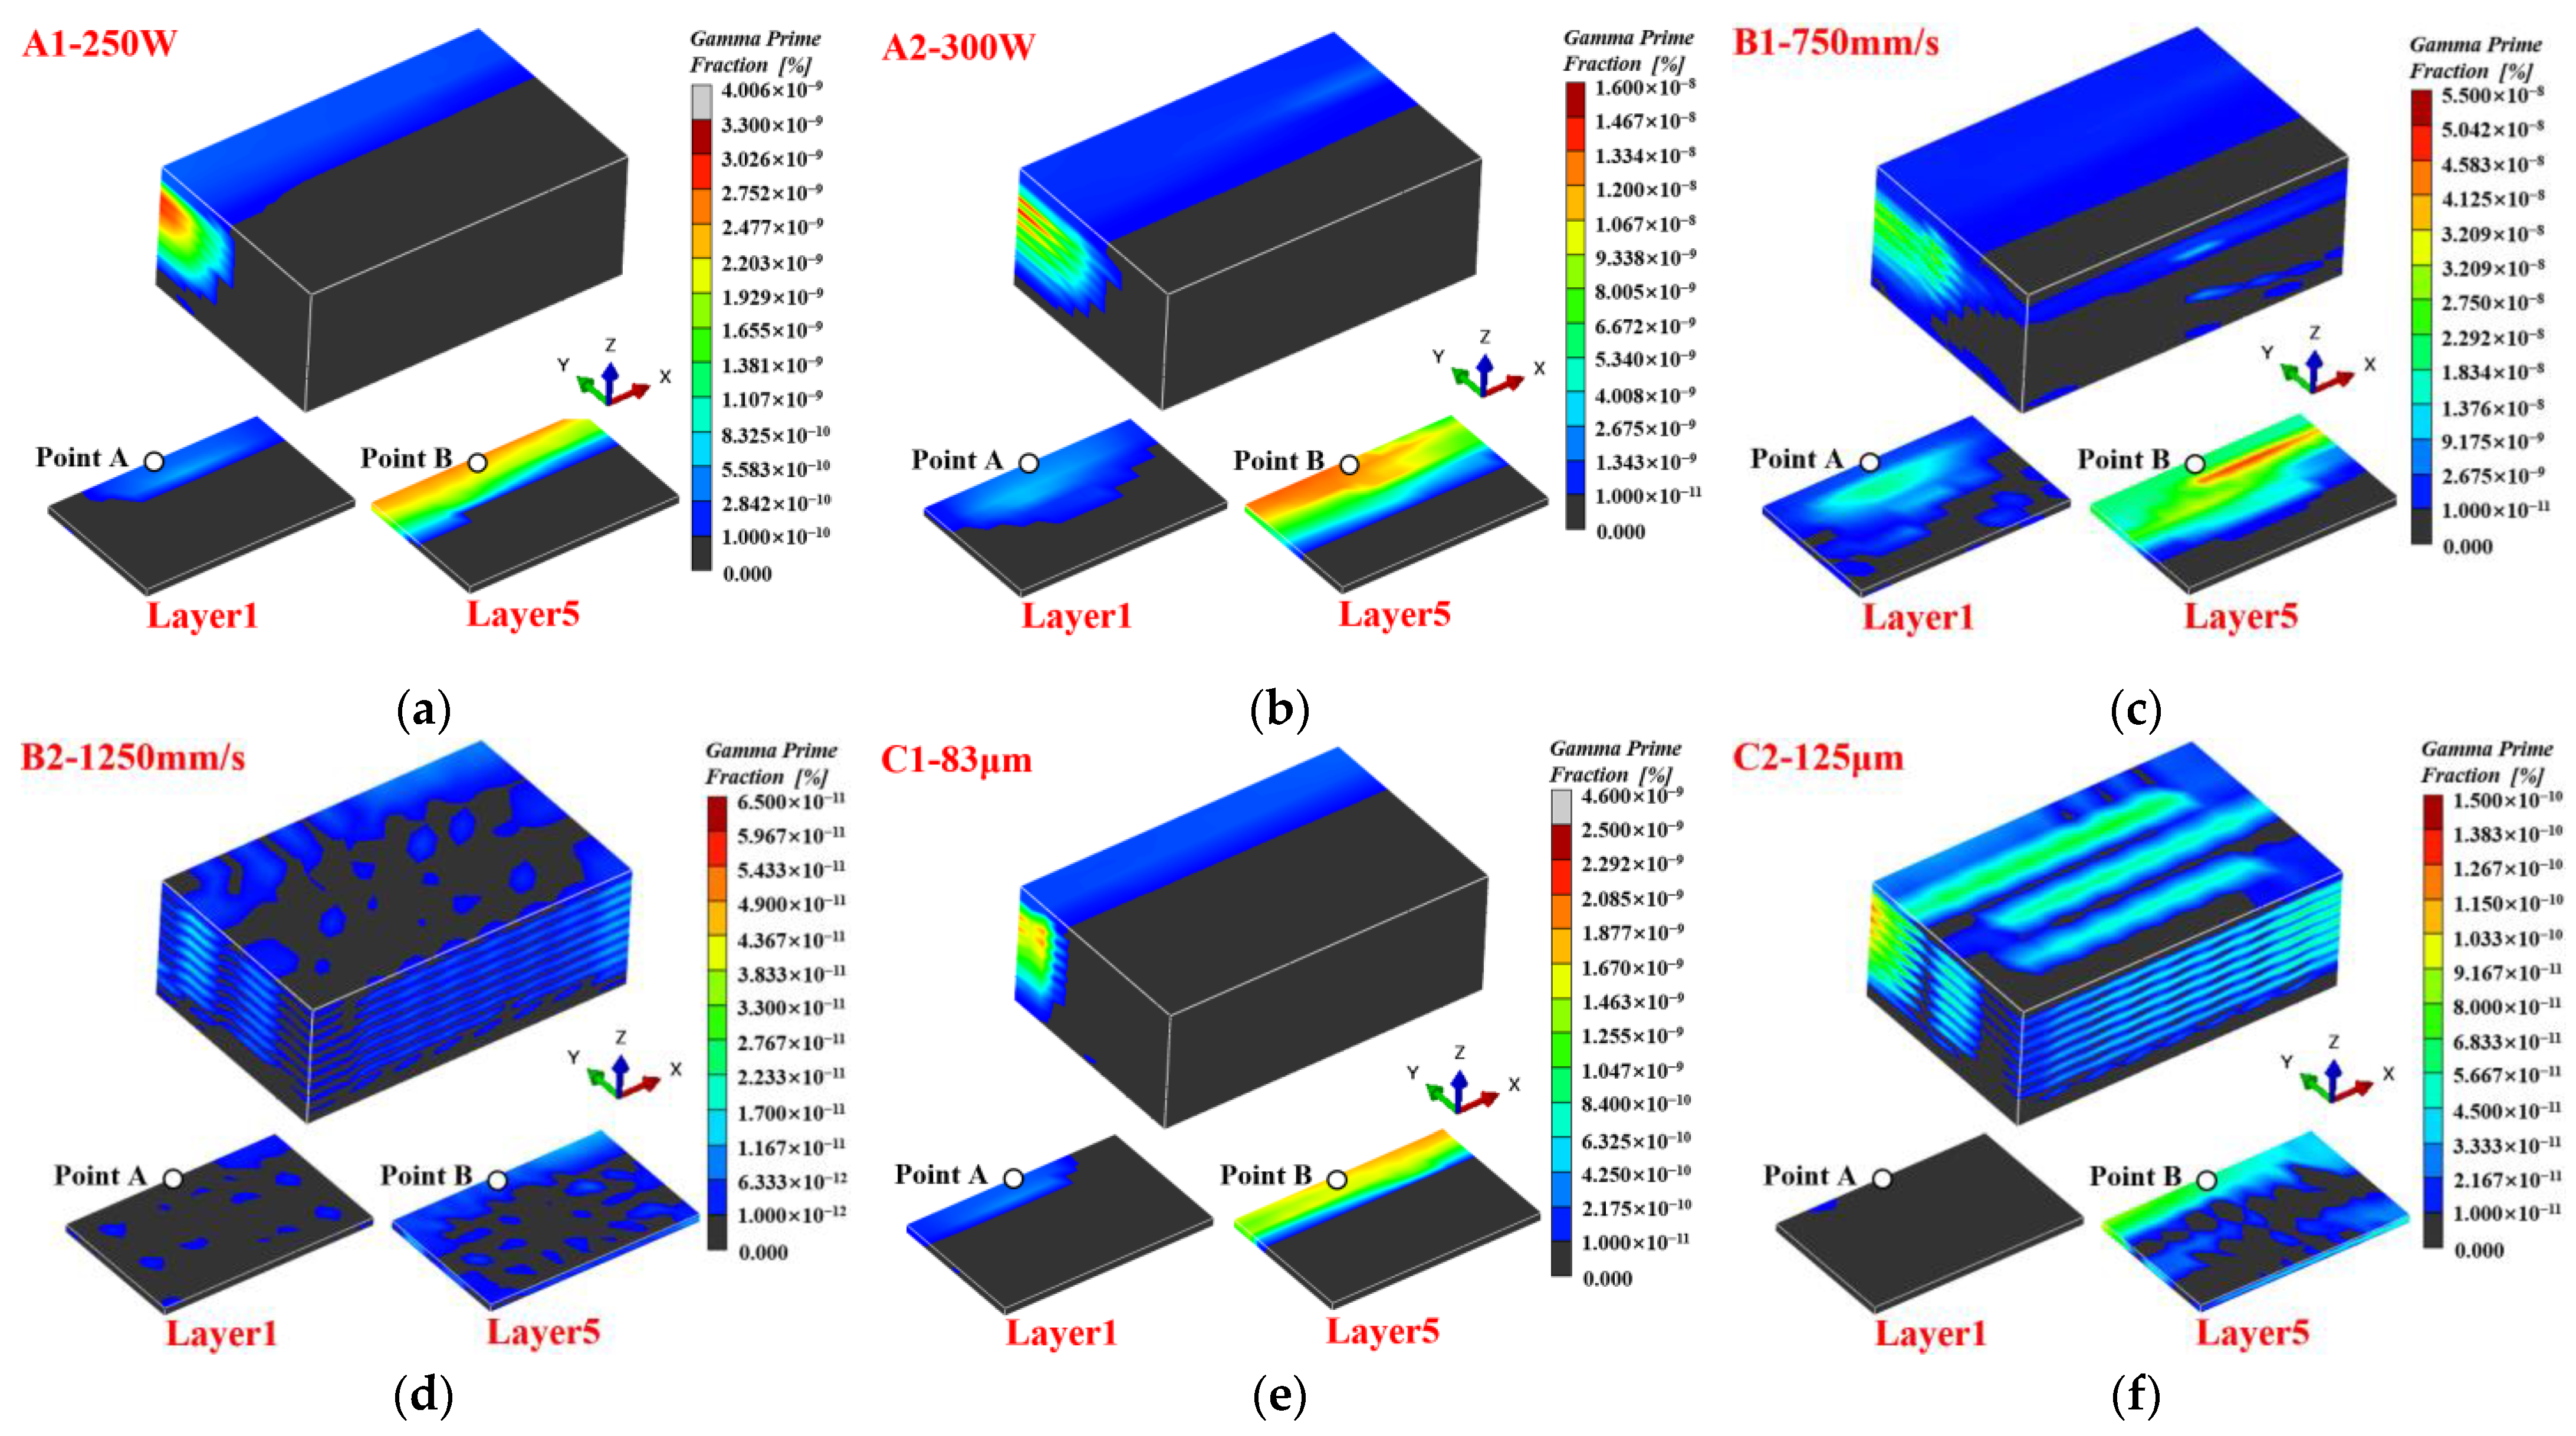
4.2.1. Characteristics of the As-Deposited γ′ Phase
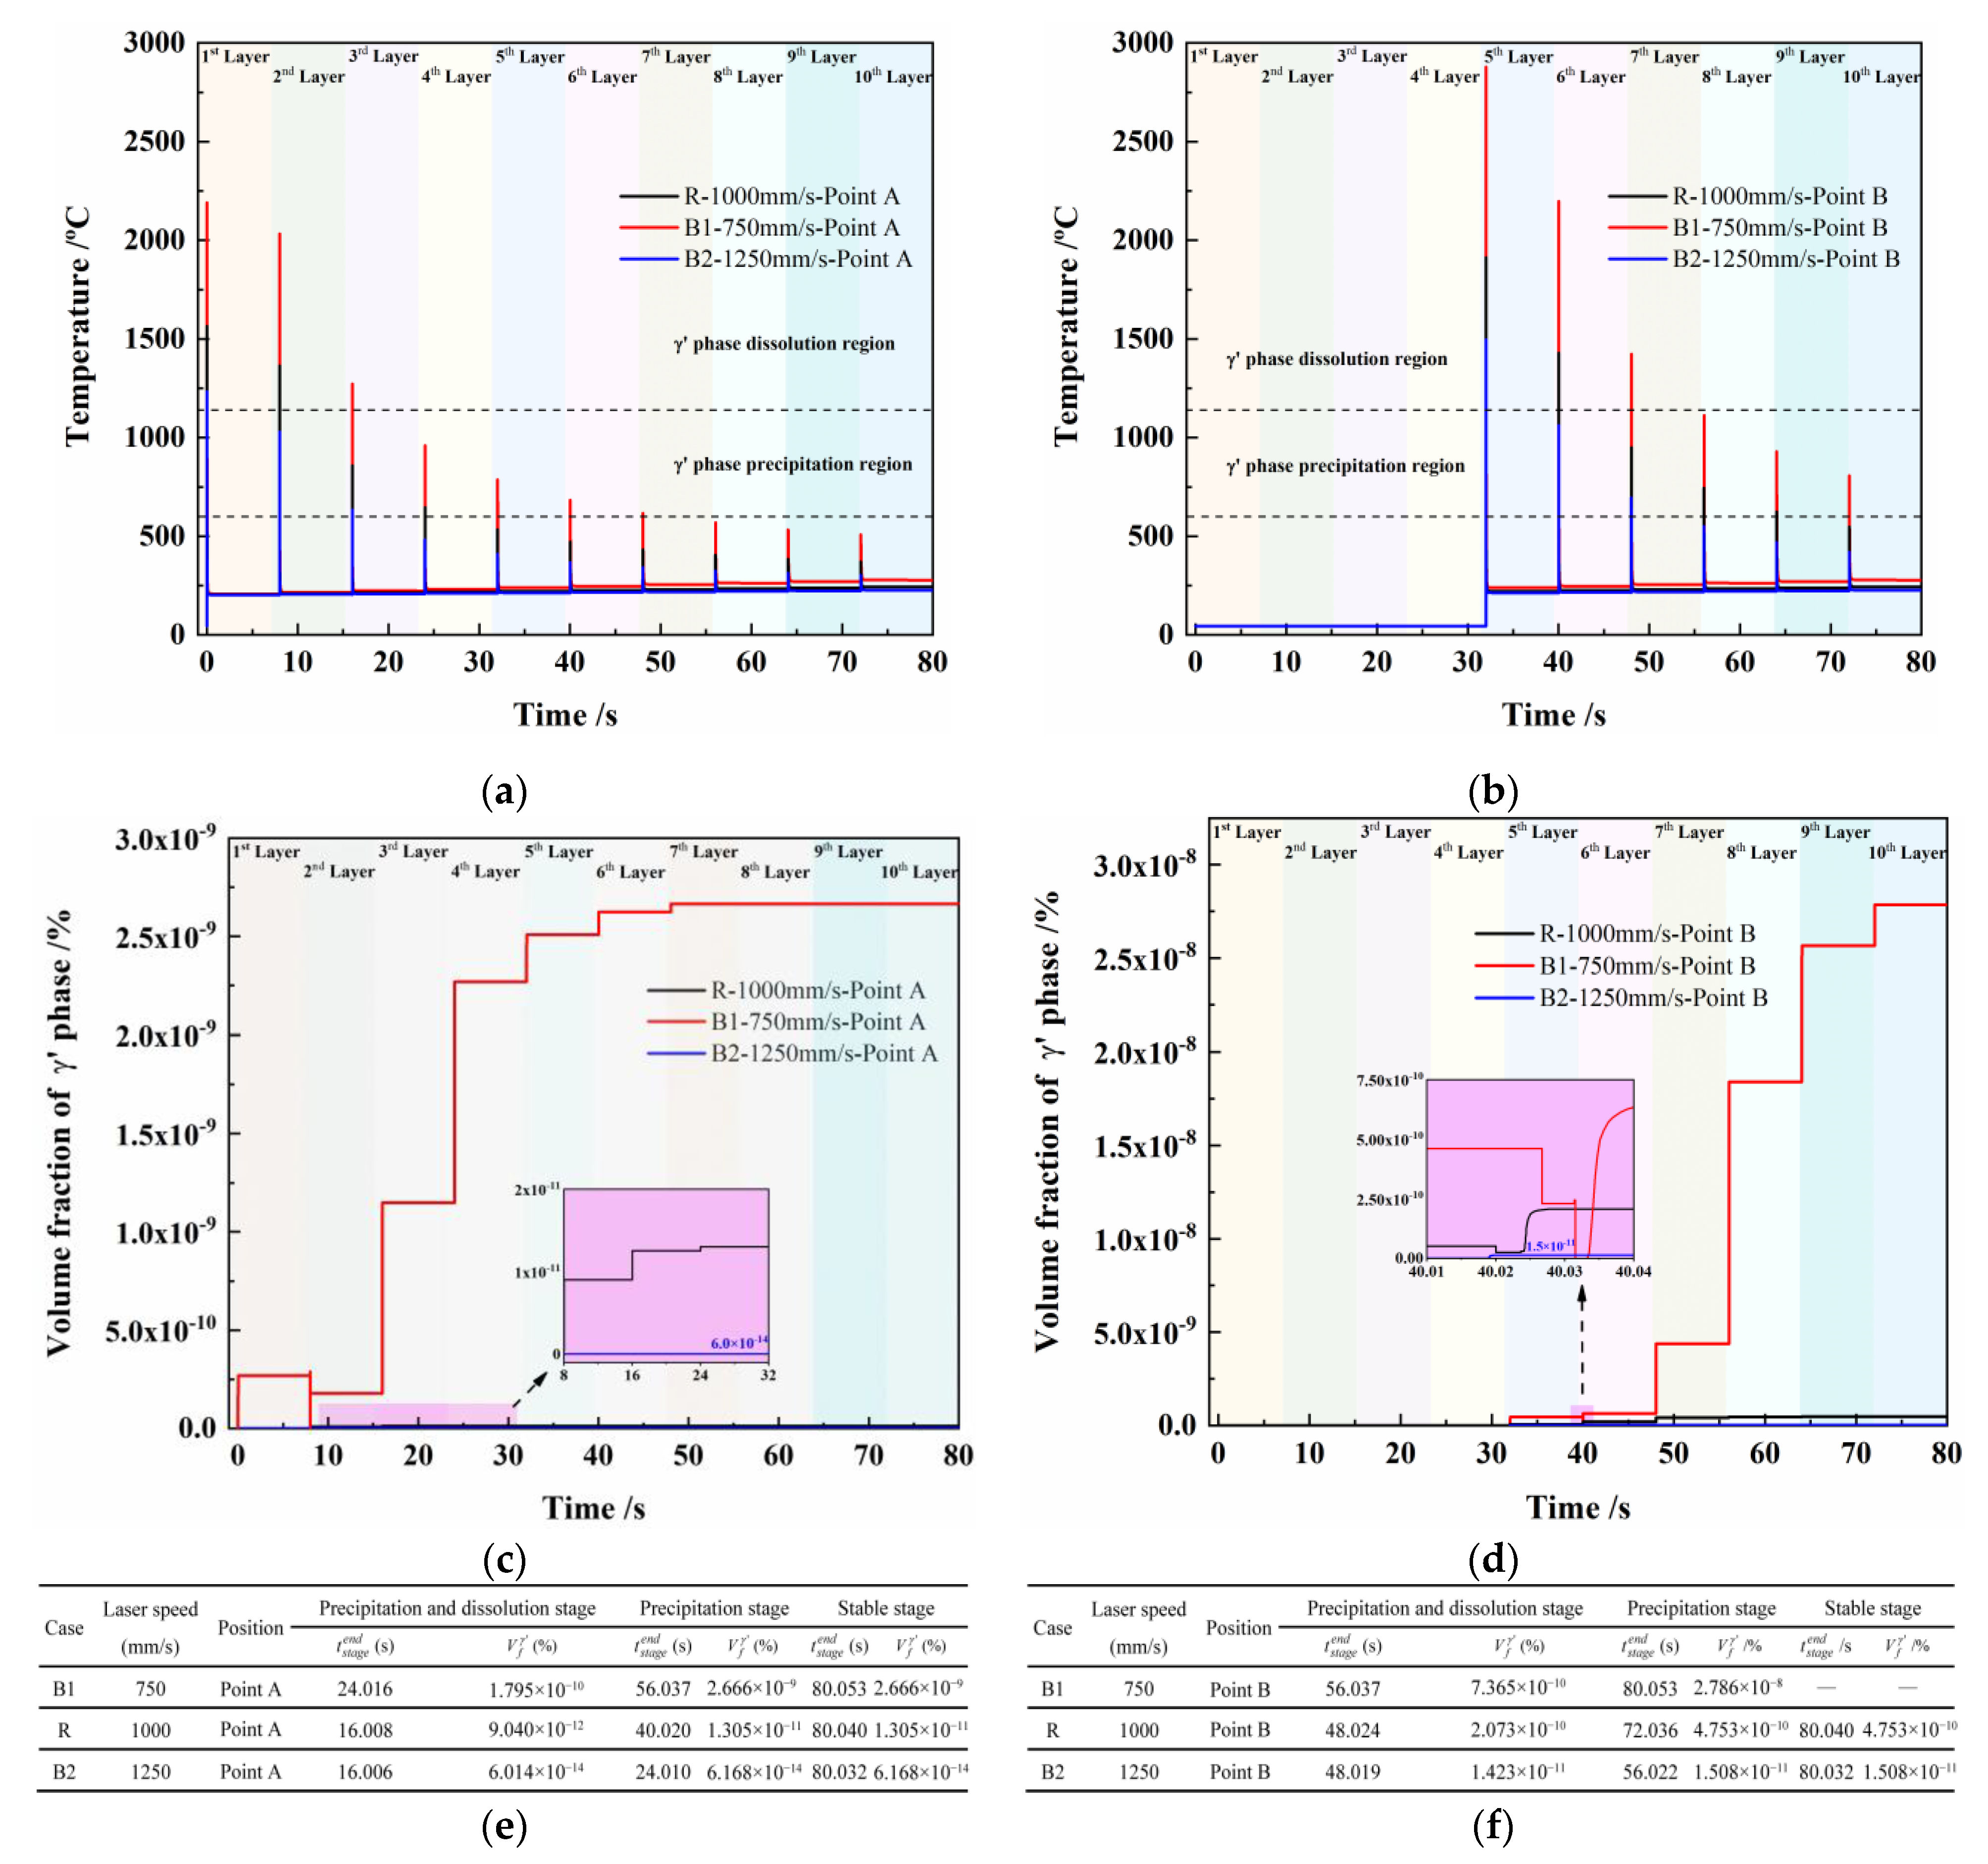
4.2.2. Evolution Rules of the γ′ Phase in the Printing Process
4.2.3. Influence of the Process Parameters on the SPTB
5. Conclusions
Author Contributions
Funding
Data Availability Statement
Acknowledgments
Conflicts of Interest
References
- Sanchez, S.; Smith, P.; Xu, Z.K.; Gaspard, G.; Hyde, C.J.; Wits, W.W.; Ashcroft, I.A.; Chen, H.; Clare, A.T. Powder Bed Fusion of nickel-based superalloys, A review. Int. J. Mach. Tools Manuf. 2021, 165, 103729. [Google Scholar] [CrossRef]
- Fu, J.; Li, H.; Song, X.; Fu, M.W. Multi-scale defects in powder-based additively manufactured metals and alloys. J. Mater. Sci. Technol. 2022, 122, 165–199. [Google Scholar] [CrossRef]
- Hussain, S.Z.; Kausar, Z.; Koreshi, Z.U.; Sheikh, S.R.; Rehman, H.Z.; Yaqoob, H.; Shah, M.F.; Abdullah, A.; Sher, F. Feedback control of melt pool area in selective laser melting additive manufacturing process. Process 2021, 9, 1547. [Google Scholar] [CrossRef]
- Pilgar, C.M.; Fernandez, A.M.; Segurado, J. Microstructure sensitive fatigue life prediction model for SLM fabricated Hastelloy-X. Int. J. Fatigue 2023, 168, 107372. [Google Scholar] [CrossRef]
- He, Y.X.; Ma, Y.; Zhang, W.H.; Wang, Z.H. Effects of build direction on thermal exposure and creep performance of SLM Ti6Al4V titanium alloy. Eng. Fail. Anal. 2022, 135, 106063. [Google Scholar] [CrossRef]
- Wu, S.; Song, H.Y.; Peng, H.Z.; Hodgson, P.D.; Wang, H.; Wu, X.H.; Zhu, Y.M.; Lam, M.C.; Huang, A.J. A microstructure-based creep model for additively manufactured nickel-based superalloys. Acta Mater. 2022, 224, 117528. [Google Scholar] [CrossRef]
- Malý, M.; Nopová, K.; Klakurková, L.; Adam, O.; Pantělejev, L.; Koutný, D. Effect of Preheating on the Residual Stress and Material Properties of Inconel 939 Processed by Laser Powder Bed Fusion. Materials 2022, 15, 6360. [Google Scholar] [CrossRef]
- Adegoke, O.; Andersson, J.; Brodin, H.; Pederson, R. Review of laser powder bed fusion of gamma-prime-strengthened nickel-based superalloys. Metals 2020, 10, 996. [Google Scholar] [CrossRef]
- Hu, X.A.; Zhao, G.L.; Liu, F.C.; Liu, W.X. Microstructure and mechanical behavior of Inconel 625 alloy processed by selective laser melting at high temperature up to 1000 °C. Rare Met. 2020, 39, 1181–1189. [Google Scholar] [CrossRef]
- Shahwaz, M.D.; Nath, P.; Sen, I. A critical review on the microstructure and mechanical properties correlation of additively manufactured nickel-based superalloys. J. Alloys Compd. 2022, 907, 164530. [Google Scholar] [CrossRef]
- Zhou, R.H.; Liu, H.S.; Wang, H.F. Modeling and simulation of metal selective laser melting process, a critical review. Int. J. Adv. Manuf. Technol. 2022, 121, 5693–5706. [Google Scholar] [CrossRef]
- Hosseini, E.; Popovich, V.A. A review of mechanical properties of additively manufactured Inconel 718. Addit. Manuf. 2019, 30, 100877. [Google Scholar] [CrossRef]
- Simon, B.; Josef, S.; Lukas, K.; Gerhard, L. Enhancing equiaxed grain formation in a high-alloy tool steel using dual laser powder bed fusion. Addit. Manuf. 2023, 74, 103727. [Google Scholar]
- Leung, C.L.A.; Marussi, S.; Atwood, R.C.; Towrie, M.; Withers, P.J.; Lee, P.D. In situ X-ray imaging of defect and molten pool dynamics in laser additive manufacturing. Nat. Commun. 2018, 9, 1355. [Google Scholar] [CrossRef] [PubMed]
- Rees, D.T.; Leung, C.L.A.; Elambasseril, J.; Marussi, S.; Shah, S.; Marathe, S.; Brandt, M.; Easton, M.; Lee, P.D. In situ X-ray imaging of hot cracking and porosity during LPBF of Al-2139 with TiB2 additions and varied process parameters. Mater. Des. 2023, 231, 112031. [Google Scholar] [CrossRef]
- Wahlmann, B.; Krohmer, E.; Breuning, C.; Schell, N.; Staron, P.; Uhlmann, E.; Körner, C. In Situ Observation of γ′ Phase Transformation Dynamics During Selective Laser Melting of CMSX-4. Adv. Eng. Mater. 2021, 23, 2100112. [Google Scholar] [CrossRef]
- Ioannidou, C.; König, H.H.; Semjatov, N.; Ackelid, U.; Staron, P.; Körner, C.; Hedström, P.; Lindwall, G. In-situ synchrotron X-ray analysis of metal Additive Manufacturing, Current state.; opportunities and challenges. Mater. Des. 2022, 219, 110790. [Google Scholar] [CrossRef]
- Luo, Z.B.; Zhao, Y.Y. A survey of finite element analysis of temperature and thermal stress fields in powder bed fusion Additive Manufacturing. Addit. Manuf. 2018, 21, 318–332. [Google Scholar] [CrossRef]
- Shi, Q.M.; Gu, D.D.; Xia, M.J.; Cao, S.N.; Rong, T. Effects of laser processing parameters on thermal behavior and melting/solidification mechanism during selective laser melting of TiC/Inconel 718 composites. Opt. Laser Technol. 2016, 84, 9–22. [Google Scholar] [CrossRef]
- Mukherjee, T.; Wei, H.L.; De, A.; Debroy, T. Heat and fluid flow in additive manufacturing—Part I, Modeling of powder bed fusion. Comput. Mater. Sci. 2018, 150, 304–313. [Google Scholar] [CrossRef]
- Chiumenti, M.; Neiva, E.; Salsi, E.; Cervera, M.; Badia, S.; Moya, J.; Chen, Z.; Lee, C.; Davies, C. Numerical modelling and experimental validation in Selective Laser Melting. Addit. Manuf. 2017, 18, 171–185. [Google Scholar] [CrossRef]
- Wang, L.; Zhang, Y.M.; Chia, H.Y.; Yan, W.T. Mechanism of keyhole pore formation in metal additive manufacturing. NPJ Comput. Mater. 2022, 8, 22. [Google Scholar] [CrossRef]
- Sunny, S.; Yu, H.L.; Mathews, R.; Malik, A.; Li, W. Improved grain structure prediction in metal additive manufacturing using a dynamic kinetic Monte Carlo framework. Addit. Manuf. 2021, 37, 101649. [Google Scholar] [CrossRef]
- Miller, J.R.; Markanday, J.F.S.; Fairclough, S.M.; Wise, G.J.; Rae, C.M.F.; Owen, L.R.; Stapleton, D.; D’Souza, N.; Bagot, P.A.J.; Stone, H.J. Gamma prime precipitation in as-deposited Ni-based superalloy IN713L.C. Scr. Mater. 2024, 239, 115775. [Google Scholar] [CrossRef]
- Liu, Z.Y.; Zhao, X.Y.; Wu, Y.W.; Chen, Q.; Yang, B.H.; Wang, P.; Chen, Z.W.; Yang, C. Homogenization heat treatment for an additively manufactured precipitation-hardening high-entropy alloy. Rare Met. 2022, 41, 2853–2863. [Google Scholar] [CrossRef]
- McNamara, K.; Ji, Y.Z.; Lia, F.; Promoppatum, P.; Yao, S.C.; Zhou, H.L.; Wang, Y.; Chen, L.Q.; Martukanitz, R.P. Predicting phase transformation kinetics during metal additive manufacturing using non-isothermal Johnson-Mehl-Avrami models, Application to Inconel 718 and Ti-6Al-4V. Addit. Manuf. 2022, 49, 102478. [Google Scholar] [CrossRef]
- Adomako, N.K.; Haghdadi, N.; Dingle, J.F.L.; Kozeschnik, E.; Liao, X.Z.; Ringer, S.P.; Primig, S. Predicting solid-state phase transformations during metal additive manufacturing, A case study on electron-beam powder bed fusion of Inconel-738. Addit. Manuf. 2023, 76, 103771. [Google Scholar] [CrossRef]
- Danis, Y.; Lacoste, E.; Arvieu, C. Numerical modeling of inconel 738LC deposition welding, Prediction of residual stress induced cracking. J. Mater. Process Technol. 2010, 210, 2053–2061. [Google Scholar] [CrossRef]
- Boumerzoug, Z.; Cherif, S. Thermal cycle simulation of welding process in Inc 738 LC superalloy. Key Eng. Mater. 2017, 735, 75–79. [Google Scholar] [CrossRef]
- Pant, P.; Sjöström, S.; Simonsson, K.; Moverare, J.; Proper, S.; Hosseini, S.; Luzin, V.; Peng, R. A simplified layer-by-layer model for prediction of residual stress distribution in additively manufactured parts. Metals 2021, 11, 861. [Google Scholar] [CrossRef]
- Perevoshchikova, N.; Rigaud, J.; Sha, Y.; Heilmaier, M.; Finnin, B.; Labelle, E.; Wu, X.H. Optimisation of selective laser melting parameters for the Ni-based superalloy IN-738 LC using Doehlert’s design. Rapid Prototyp. J. 2017, 23, 881–892. [Google Scholar] [CrossRef]


| Bulk Property | Powder Property Expression | Ref. |
|---|---|---|
| ρbulk | [20] | |
| kbulk | [19] | |
| Cp,bulk | [20] |
| Element | C | Si | Cr | Co | Mo | W | Nb | Ti | Ta | Al | B | Ni |
|---|---|---|---|---|---|---|---|---|---|---|---|---|
| Wt% | 0.11 | 0.02 | 15.85 | 8.37 | 1.8 | 2.66 | 0.89 | 3.39 | 1.8 | 3.38 | 0.007 | Bal. |
| T [°C] | Kbulk [W·m−1·°C−1] | Cp,bulk [J·kg−1·°C−1] | ρbulk [kg·m−3] | T [°C] | Kbulk [W·m−1·°C−1] | Cp,bulk [J·kg−1·°C−1] | ρbulk [kg·m−3] |
|---|---|---|---|---|---|---|---|
| 25 | 8.55 | 414.7 | 8190 | 800 | 21.75 | 658.7 | 7900 |
| 200 | 11.57 | 468.8 | 8130 | 1000 | 25.14 | 717.6 | 7790 |
| 400 | 14.96 | 529.0 | 8060 | 1200 | 28.54 | 782.5 | 7650 |
| 600 | 18.36 | 589.2 | 7990 | 1400 | 28.54 | 855.2 | 7250 |
| Influencing Factor | Case | Laser Power [W] | Laser Speed [mm·s−1] | Hatch Spacing [μm] | Layer Thickness [μm] | Laser Energy Density [J·mm3] |
|---|---|---|---|---|---|---|
| Reference | R | 200 | 1000 | 100 | 30 | 66.7 |
| Laser power | A1 | 250 | 1000 | 100 | 30 | 83.3 |
| A2 | 300 | 1000 | 100 | 30 | 100.0 | |
| Laser speed | B1 | 200 | 750 | 100 | 30 | 88.9 |
| B2 | 200 | 1250 | 100 | 30 | 53.3 | |
| Hatch spacing | C1 | 200 | 1000 | 83 | 30 | 80.0 |
| C2 | 200 | 1000 | 125 | 30 | 53.3 |
| Case | R | A1 | A2 | B1 | B2 | C1 | C2 | |
|---|---|---|---|---|---|---|---|---|
| Phase Fraction | ||||||||
| 8.822 × 10⁻¹⁰ | 4.006 × 10⁻⁹ | 1.533 × 10⁻⁸ | 5.362 × 10⁻⁸ | 7.648 × 10⁻¹¹ | 4.600 × 10⁻⁹ | 3.146 × 10⁻¹⁰ | ||
| 1.000 | 4.541 | 17.377 | 60.780 | 0.087 | 5.214 | 0.357 | ||
Disclaimer/Publisher’s Note: The statements, opinions and data contained in all publications are solely those of the individual author(s) and contributor(s) and not of MDPI and/or the editor(s). MDPI and/or the editor(s) disclaim responsibility for any injury to people or property resulting from any ideas, methods, instructions or products referred to in the content. |
© 2023 by the authors. Licensee MDPI, Basel, Switzerland. This article is an open access article distributed under the terms and conditions of the Creative Commons Attribution (CC BY) license (https://creativecommons.org/licenses/by/4.0/).
Share and Cite
Kong, H.; Hou, Y.; Qin, H.; Xie, J.; Bi, Z.; Su, H. Integrated Thermal and Metallurgical Simulation Framework for Selective Laser Melting Multi-Component and Multi-Phase Alloys. Processes 2023, 11, 3289. https://doi.org/10.3390/pr11123289
Kong H, Hou Y, Qin H, Xie J, Bi Z, Su H. Integrated Thermal and Metallurgical Simulation Framework for Selective Laser Melting Multi-Component and Multi-Phase Alloys. Processes. 2023; 11(12):3289. https://doi.org/10.3390/pr11123289
Chicago/Turabian StyleKong, Haohao, Yaqing Hou, Hailong Qin, Jinli Xie, Zhongnan Bi, and Hang Su. 2023. "Integrated Thermal and Metallurgical Simulation Framework for Selective Laser Melting Multi-Component and Multi-Phase Alloys" Processes 11, no. 12: 3289. https://doi.org/10.3390/pr11123289