Article

Analysis of Factors Impacting CO2 Assisted Gravity Drainage in Oil Reservoirs with Bottom Water

1
School of Petroleum Engineering, Yangtze University, Wuhan 430100, China
2
Hubei Key Laboratory of Oil and Gas Drilling and Production Engineering, Yangtze University, Wuhan 430100, China
3
School of Petroleum Engineering, National Engineering Research Center for Oil & Gas Drilling and Completion Technology, Yangtze University, Wuhan 430100, China
*
Authors to whom correspondence should be addressed.
Processes 2023, 11(12), 3290; https://doi.org/10.3390/pr11123290
Submission received: 2 November 2023 / Revised: 20 November 2023 / Accepted: 22 November 2023 / Published: 24 November 2023

Abstract

:
In recent years, there has been significant focus on the issue of global carbon emissions. One of the most prominent areas of research in this regard is the use of carbon capture, utilization, and storage (CCUS) technology in the petrochemical industry. At present, the utilization of CO2 Assisted Gravity Drainage (CAGD) in oil reservoirs, particularly those containing bottom water, is considered to be in the early stages of exploration and development. In this study, a mechanistic model was built, and five key factors influencing CAGD were analyzed. These factors included the reservoir structure, CO2 injection site, initial formation pressure, reservoir thickness, and CO2 injection rate. Then, the applicable rules governing CAGD in oil reservoirs with bottom water were obtained. Finally, these rules were employed in an actual reservoir to optimize the injection-production parameters. The results of the influence factor analysis indicated that CAGD was more suitable for anticline structural reservoirs. The combined top-waist CO2 injection could fully utilize gravity differentiation in a short timeframe to expand the lateral sweep range of the CO2. CAGD was more effective when the reservoir pressure was greater than the minimum miscible pressure and the reservoir thickness was between 25–50 m. The generation of a secondary CO2 cap was favored when the CO2 injection rate was 35,000 m3/d. Results from A Oilfield applications indicated that, following the application of CAGD technology, A Oilfield experienced an increase in cumulative oil production of 15.76 × 10⁴ t, a 10% reduction in water cut, and an amount of 82.15 × 10⁶ m3 of CO2 that was sequestered in the subsurface. These findings can offer practical insights and guidance for the future development of CAGD techniques in similar reservoirs.

1. Introduction

The advancement of human society and the continuous evolution of scientific and technological civilization have brought to light the significant environmental and public health risks posed by CO2 and other pollutants generated from fossil energy sources [1]. To ensure the sustainable progression of human civilization, every industry must collectively strive towards two pivotal objectives: achieving carbon peak and carbon neutrality [2,3]. Hence, it is imperative for individuals and industries to explore innovative technologies aimed at mitigating carbon emissions. Currently, the primary methods for carbon emission reduction revolve around carbon capture, utilization, and storage (CCUS). This approach is widely recognized as the most cost-effective and practical means to curtail greenhouse gas emissions and mitigate the pace of global warming in the future [4]. At present, the concept of CCUS is widespread in the crude oil industry, and the relevant technology is being constantly updated [5,6]. Several oilfields have currently initiated CCUS-enhanced oil recovery (EOR) projects. Yanchang Oilfield has established four demonstration areas for CO2 EOR and storage while Qilu Petrochemical Company and Shengli Oilfield have completed a million-ton-scale CCUS-EOR project [7]. However, the research on the utilization technology of CO2 still needs to be strengthened so as to solve the problem of carbon neutralization while ensuring economic benefits [8,9,10].
The most commonly employed method in oilfields involves injecting CO2 into oil and gas reservoirs to enhance oil recovery while simultaneously sealing a portion of the CO2 underground [11,12]. D.H. Stright et al. [13] explored the application of CO2 miscible flooding technology in heavy oil reservoirs with bottom water and conducted field experiments. The results indicated that when injecting only a small quantity of CO2, the efficiency of enhanced oil recovery through CO2 miscible flooding in reservoirs with bottom water was limited. This limitation was attributed to the bottom water coning. Li et al. [14] employed physical simulation techniques for CO2 flooding and CO2 huff and puff in a bottom water model. Their research focused on assessing the impact of these methods on oil recovery in oil reservoirs with bottom water. The study revealed that CO2 flooding following water flooding could enhance oil recovery. However, it was observed that the increase in oil recovery achieved through CO2 huff and puff was significantly greater than that achieved through CO2 flooding alone. CO2 was injected into a reservoir with bottom water followed by a soaking period, wherein a portion of the CO2 dissolved into both the oil and water phases. This dissolution process served to increase energy levels, reduce viscosity, and assist in facilitating production. As such, these mechanisms collectively contribute to an improvement in oil recovery of the reservoir. Hao et al. [15] demonstrated the mechanism and influencing factors of CO2 huff and puff synergistic flooding in an edge water fault block reservoir through laboratory experiments. Findings were made that the mechanism of synergistic effect could be divided into formation energy supplementation, gas flooding, gravity differentiation, and CO2-assisted edge water flooding. Injecting CO2 supplementary energy into lower wells could effectively control edge water invasion. After gas injection at different positions of the well group, multi-well cooperation could be realized, thereby achieving a better cooperative oil displacement effect. Chen [16] conducted a study on phase mixing and gravity on the efficiency and storage potential of EOR and designed a series of displacement experiments. By comparing the displacement results under various combinations of phase behavior and gravity, the optimal method for enhancing oil recovery through CO2 injection was confirmed. The experimental results indicated that, for oil recovery in the absence of miscible, top gas injection was the most effective, followed by horizontal gas injection, while bottom gas injection was the least effective. In miscible displacement, reservoir thickness and injection direction were no longer the critical factors influencing CO2 displacement results. Regarding CO2 storage capacity, in immiscible conditions, maximizing the use of gravity through top gas injection obtained the highest CO2 storage capacity, with a storage rate of 65.35%. As pressure increased, the influence of gravity on CO2 storage capacity diminished. In miscible conditions, irrespective of the injection direction, CO2 exhibited a remarkably high storage potential. Zhou et al. [17] constructed a polynomial response surface model for a fault block low-permeability reservoir in Jiangsu Oilfield and analyzed the factors affecting the oil exchange rate of CO2 gravity-stable flooding from the aspects of reservoir dip, reservoir thickness, permeability, crude oil viscosity, and permeability difference. Ultimately, a method suitable for CO2 gravity-stable flooding reservoir optimization in Jiangsu Oilfield was established. The results revealed that the effect of CO2 gravity-stable flooding in reservoirs with large permeability differences and high crude oil viscosity was poor, while the effect of CO2 gravity stable flooding in reservoirs with larger dip angle, higher permeability, and thicker thickness was better. While significant progress has been made globally in enhancing oil recovery through CAGD, the application of this technology to mitigate the rise of bottom water remained primarily in the exploratory phase. The effective containment of bottom-water coning is a crucial factor that directly impacts the overall success of reservoirs with bottom water development. However, for oil reservoirs with bottom water, this technology is still in the exploration stage and has not made significant progress.
A Oilfield is a bottom water sandstone reservoir with structural anticline features, situated at depths ranging from 2500 m to 4700 m. The reservoir exhibits an average porosity of 17.6% and an average permeability of 12.63 mD. The average formation pressure is 33.69 MPa, and through slimtube experiments the minimum miscibility pressure has been determined to be 22 MPa. Following natural energy development, the reservoir has experienced significant bottom water invasion, leading to a rapid rise in the oil-water interface. Based on the analysis of oil saturation (Figure 1), it is evident that certain blocks are experiencing severe bottom water invasion. The remaining oil is concentrated primarily in the upper portion of the reservoir, resulting in a higher oil saturation in this zone. In the initial stages of development, the oilfield exhibited relatively high oil production due to the natural bottom water energy. However, this was accompanied by a rapid increase in water cut. Once the water cut reached 90% (Figure 2), crude oil extraction in the lower portions of the structure essentially concluded, leaving the remaining crude oil primarily in the middle and upper section of the reservoir. The water cut has transitioned from a phase of rapid increase to a phase of slow growth. After a certain period, the water cut in the oilfield exceeded 98%.
In the case of A Oilfield, conventional gas flooding has limitations as it can only partially displace the crude oil in the reservoir [18]. Moreover, it is not effective in addressing the high water cut issue resulting from the positioning of production well perforations below the oil-water interface. CO2 EOR technology is typically employed as a significant means to enhance recovery in the later development stages of low-permeability, high-pressure sandstone reservoirs. CAGD, as one of the main CO2 EOR technologies, involves injecting a significant amount of CO2 into the upper part of the reservoir, creating a CO2 cap at the upper structural position of the reservoir. The technique primarily relies on gravity as the main driving force, while using the gas cap formed by CO2 injection for gas displacement. The process utilizes the expansion energy of the gas, gravity, and pressure difference resulting from CO2 injection to displace the crude oil from higher to lower regions. This process lowers both the gas-oil interface and the oil-water interface (Figure 3 and Figure 4). Additionally, CO2 can cause the release of bound water from clay minerals, leading to a reduction in the particle size of clay minerals. When CO2 dissolves in formation water, it forms a carbonic acid solution, capable of dissolving minerals such as carbonates and silicates in the formation, effectively improving the physical properties of the reservoir. The miscibility of CO2 with crude oil not only reduces the interfacial tension and viscosity of the crude oil, thereby enhancing crude oil displacement efficiency, but also, owing to its strong diffusion and mobility, can displace crude oil from small pores that are hard to reach by water flooding [19]. Finally, when CO2 or miscible liquid encounters an impermeable cap rock and cannot migrate upward, it becomes trapped within the cap rock, effectively storing the CO2 [20]. Therefore, CAGD is suitable for A Oilfield.
In this study, a corresponding mechanism model was established according to the characteristics of A Oilfield, and the factors affecting CAGD applied in this type of oilfield were studied from the aspects of reservoir structure, CO2 injection site, initial formation pressure, reservoir thickness, and CO2 injection rate. The applicable rules of CAGD technology are derived and subsequently applied to optimize injection-production parameters in A Oilfield. Findings were made that CAGD technology can be highly effective in extracting the remaining oil from the upper sections of oil reservoirs with bottom water, especially in areas with low-permeability flow channels. Additionally, this technology has the capability to restrain bottom-water coning, leading to an improvement in water cut and an overall enhancement in oil recovery. Simultaneously, it plays a crucial role in sequestering a significant amount of CO2 underground, thereby reducing carbon emissions. This approach offers a dual benefit, promoting both environmental conservation and economic advantages [21].

2. Methods

2.1. Establishment of Mechanism Model

To combine the actual geological characteristics of A Oilfield with pressure-volume-temperature properties and the relative permeability relationship between oil-water and oil-gas, the tNavigator reservoir numerical simulation software was utilized to establish a three-dimensional mechanism model for the reservoir with bottom water. The grid number, grid size, the initial porosity, the initial permeability, the initial oil-water interface, the minimum miscible pressure, and the rock compression coefficient, respectively, are 12 × 10 × 22, 100 m × 100 m × 5 m, 15%, 20 Md, 3250 m, 22 Mpa, and 1.45 × 10⁻⁴ Mpa. The basic parameters of the model are shown in Table 1 and Table 2, and the relative permeability curve is displayed in Figure 5 and Figure 6. There are 11 wells in the model, including 8 production wells (P2–P9) and 3 gas injection wells (INJ1–INJ3). The well locations are shown in Figure 7.

2.2. Analysis of the Mechanism and Influencing Factors of CAGD

In this study, the mechanism and influencing factors of CAGD were explored by establishing a mechanism model, and the effects of CAGD under different reservoir structures, CO2 injection sites, initial formation pressures, reservoir thicknesses, and CO2 injection rates were simulated, respectively, thereby providing theoretical guidance for exploring the development scheme and adjustment scheme of CAGD in anticline reservoirs with bottom water.
  • Reservoir structure;
To investigate the influence of reservoir structure on the effect of CAGD, two kinds of reservoir structures with or without anticline were set up for the numerical simulation model, and the sweep range and gas saturation after CO2 injection were compared.
  • CO2 injection site;
The CO2 injection position directly affects the scale and range of CO2 cap formation. According to the established numerical simulation model, three kinds of CO2 injection sites were set up under the condition of the same total CO2 injection volume, including waist CO2 injection on both sides, CO2 injection at the top and combined CO2 injection at the waist and top, so as to analyze their influence on oil displacement effect.
  • Initial formation pressure;
For investigating the influence of initial formation pressure on the effect of CAGD, considering that the minimum miscible pressure of crude oil is 22 MPa, three different initial formation pressures (12 MPa, 22 MPa, and 32 MPa) were set.
  • Reservoir thickness;
To explore the influence of reservoir thickness on the effect of CAGD, models with 5, 10, and 15 layers were established to simulate the oil saturation before and after CAGD.
  • CO2 injection rate.
To investigate the impact of CO2 injection rate on the effect of CAGD, three CO2 injection rates were chosen: 25,000 m3/d, 35,000 m3/d, and 45,000 m3/d, while keeping the other parameters constant.

2.3. Filed Application

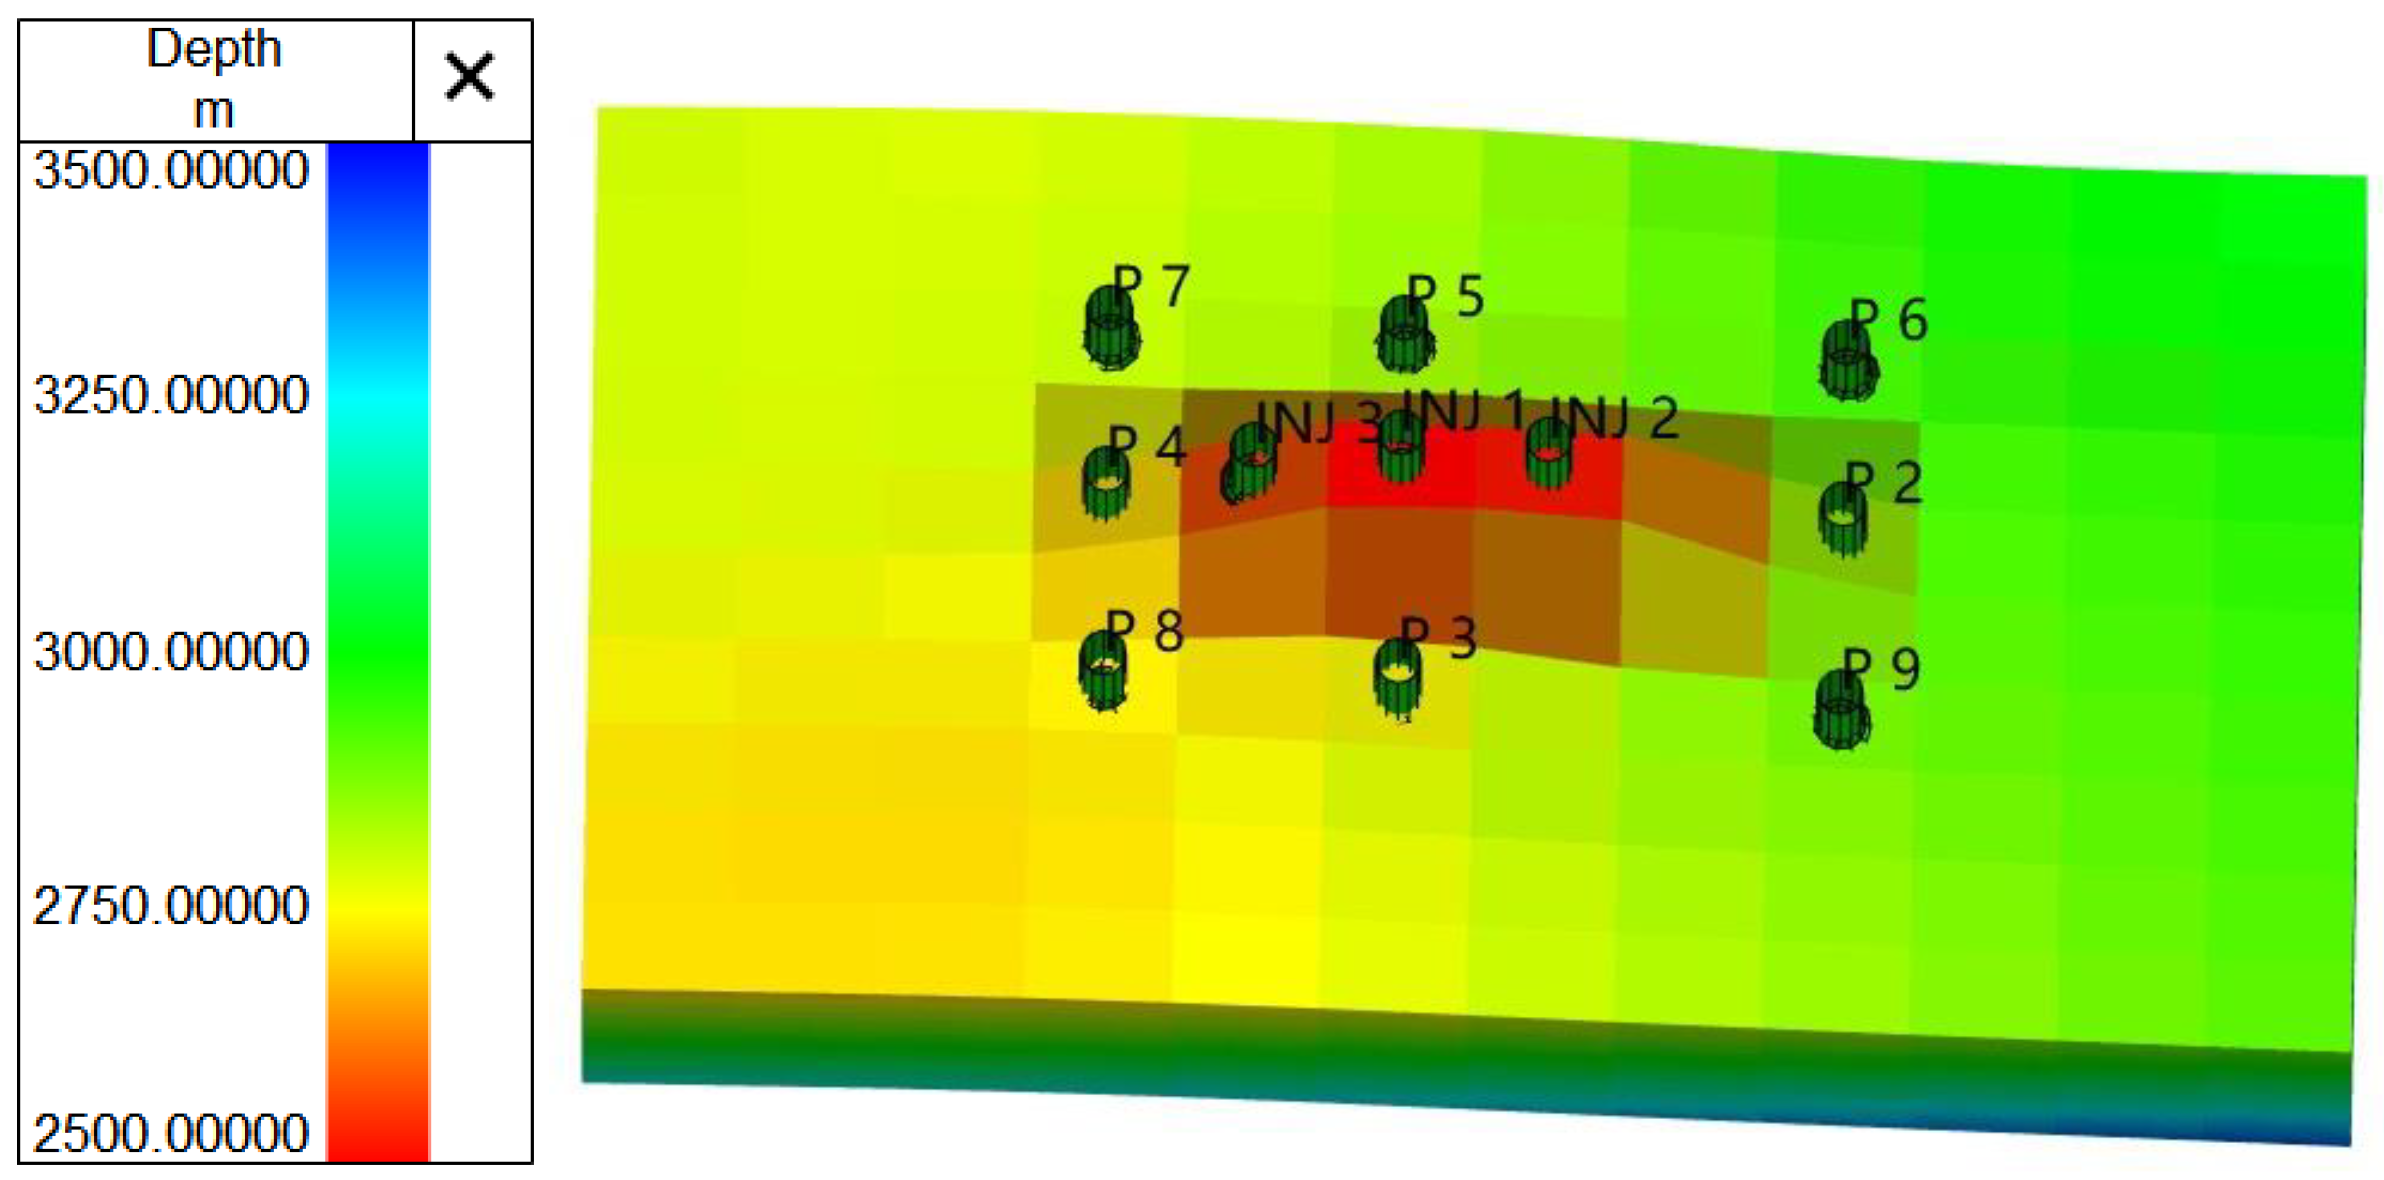
2.3.1. Well Pattern Conformation of CAGD

Considering the previous production status of A Oilfield and aiming to minimize workload, no new additional wells were established. Instead, the well layout was arranged based on the positions and production conditions of existing wells.

2.3.2. Optimization of Injection-Production Parameters

Various CO2 injection modes, CO2 injection rates, injection-production ratios, and supplementary CO2 injection were simulated to identify and select the optimal parameters for implementing CAGD.
  • Optimization of CO2 injection mode
Two different CO2 injection methods (Table 3), continuous CO2 injection and intermittent CO2 injection, were designed to compare the CO2 sweep range.
  • Optimization of CO2 injection rate;
CO2 injection rate is one of the most sensitive factors affecting the scale and development effect of secondary gas caps. In this study, four kinds of CO2 injection rates were designed: 50,000 m3/d, 70,000 m3/d, 90,000 m3/d, and 110,000 m3/d. These rates were simulated over a period of ten years.
  • Optimization of injection-production ratio;
In order to explore the optimal injection-production ratio, five injection-production ratio schemes were designed wherein the injection-production ratios were 0.7, 0.8, 0.9, 1.0, and 1.1, respectively. Those parameters were predicted over 10 years and the cumulative oil production was compared.
  • Supplementary CO2 injection.
The limited number of CO2 injection wells led to CO2 retention near the wellbore. Subsequently, pressure differentials within the reservoir, following oil production, resulted in the susceptibility of CO2 to viscous fingering along the oil well paths [22]. When multiple wells collaborate for CO2 injection, gas channels can form between injection wells. This effectively mitigated viscous fingering between wells, maintained a stable oil-gas interface, slowed the rise of the oil-water interface, allowed for a more comprehensive exploitation of gravity differentiation, and increased CO2 utilization. Therefore, in the later stages, there are plans to add new wells for supplemental CO2 injection.

3. Results and Discussion

3.1. Influencing Factors of CAGD

3.1.1. Reservoir Structure

Through comparing Figure 8 and Figure 9, an observation could be made that after CO2 injection, the CO2 in the non-anticline structure reservoir spread around and failed to form a significant CO2 cap in the upper region. Conversely, after CO2 injection in the anticline structure reservoir, the remaining oil collected at the top miscible with CO2, significantly reducing the viscosity of crude oil. This allowed the remaining oil in the upper part to be preferentially extracted. As a result, the subsequent injected CO2 could accumulate in the upper region (Figure 10). This accumulation of CO2 helped push down the oil-water interface, resulting in the desired effect of gravity drainage [23]. Additionally, it effectively sequestered the gathered CO2.

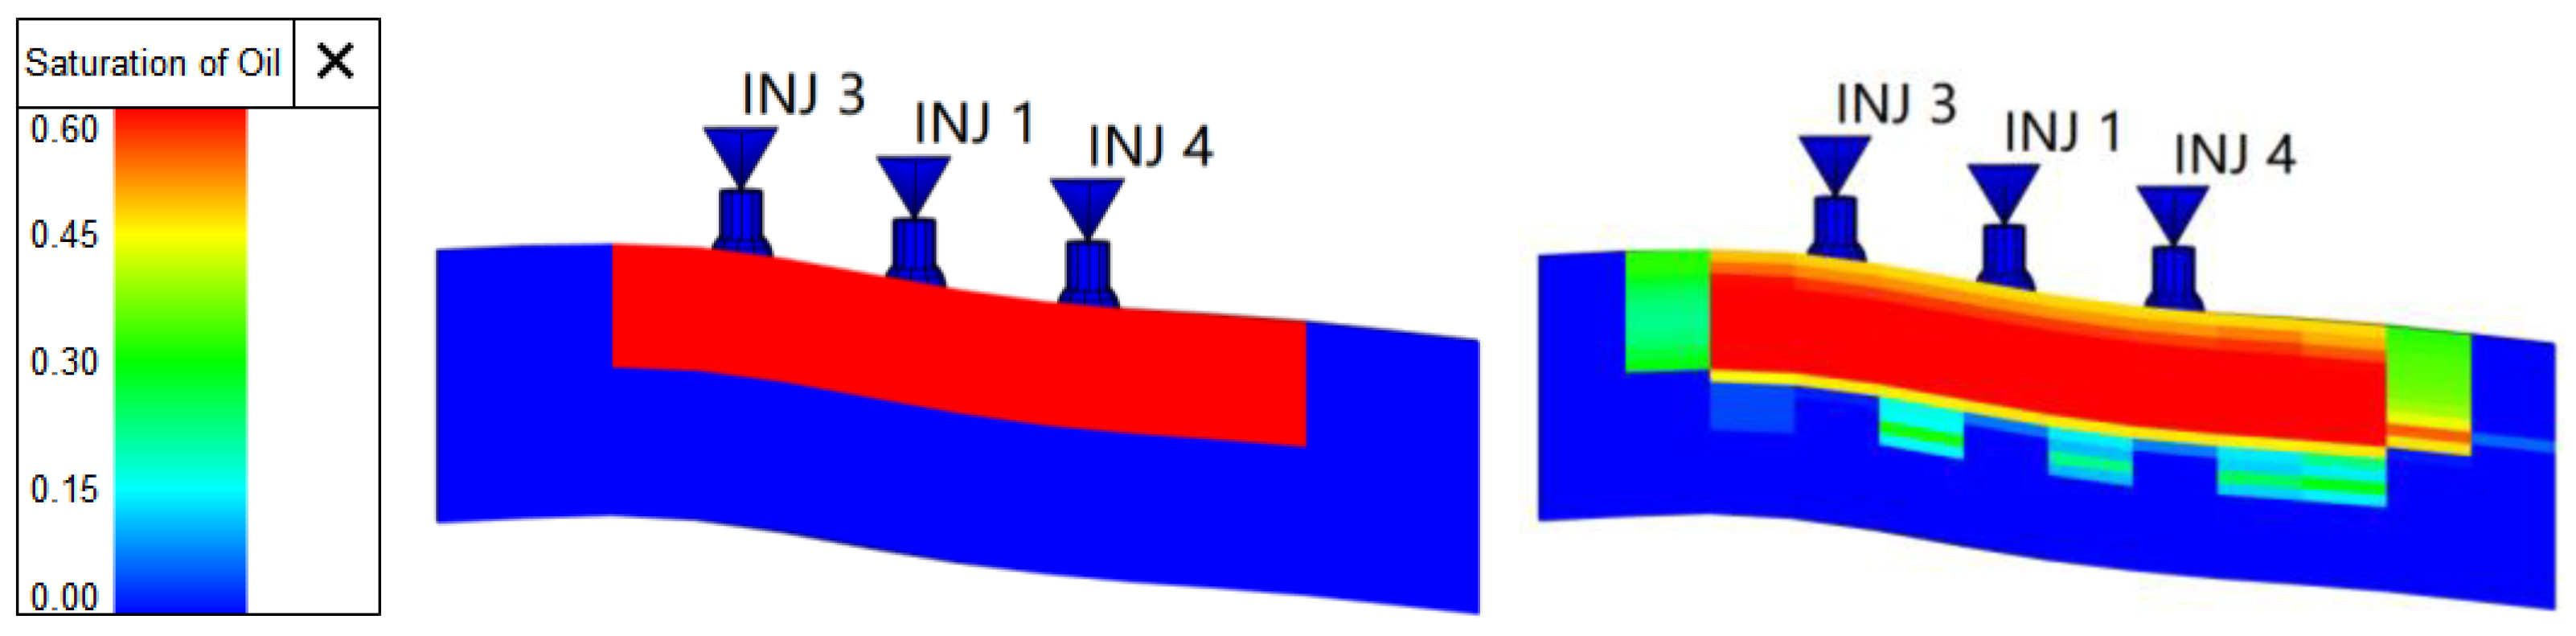
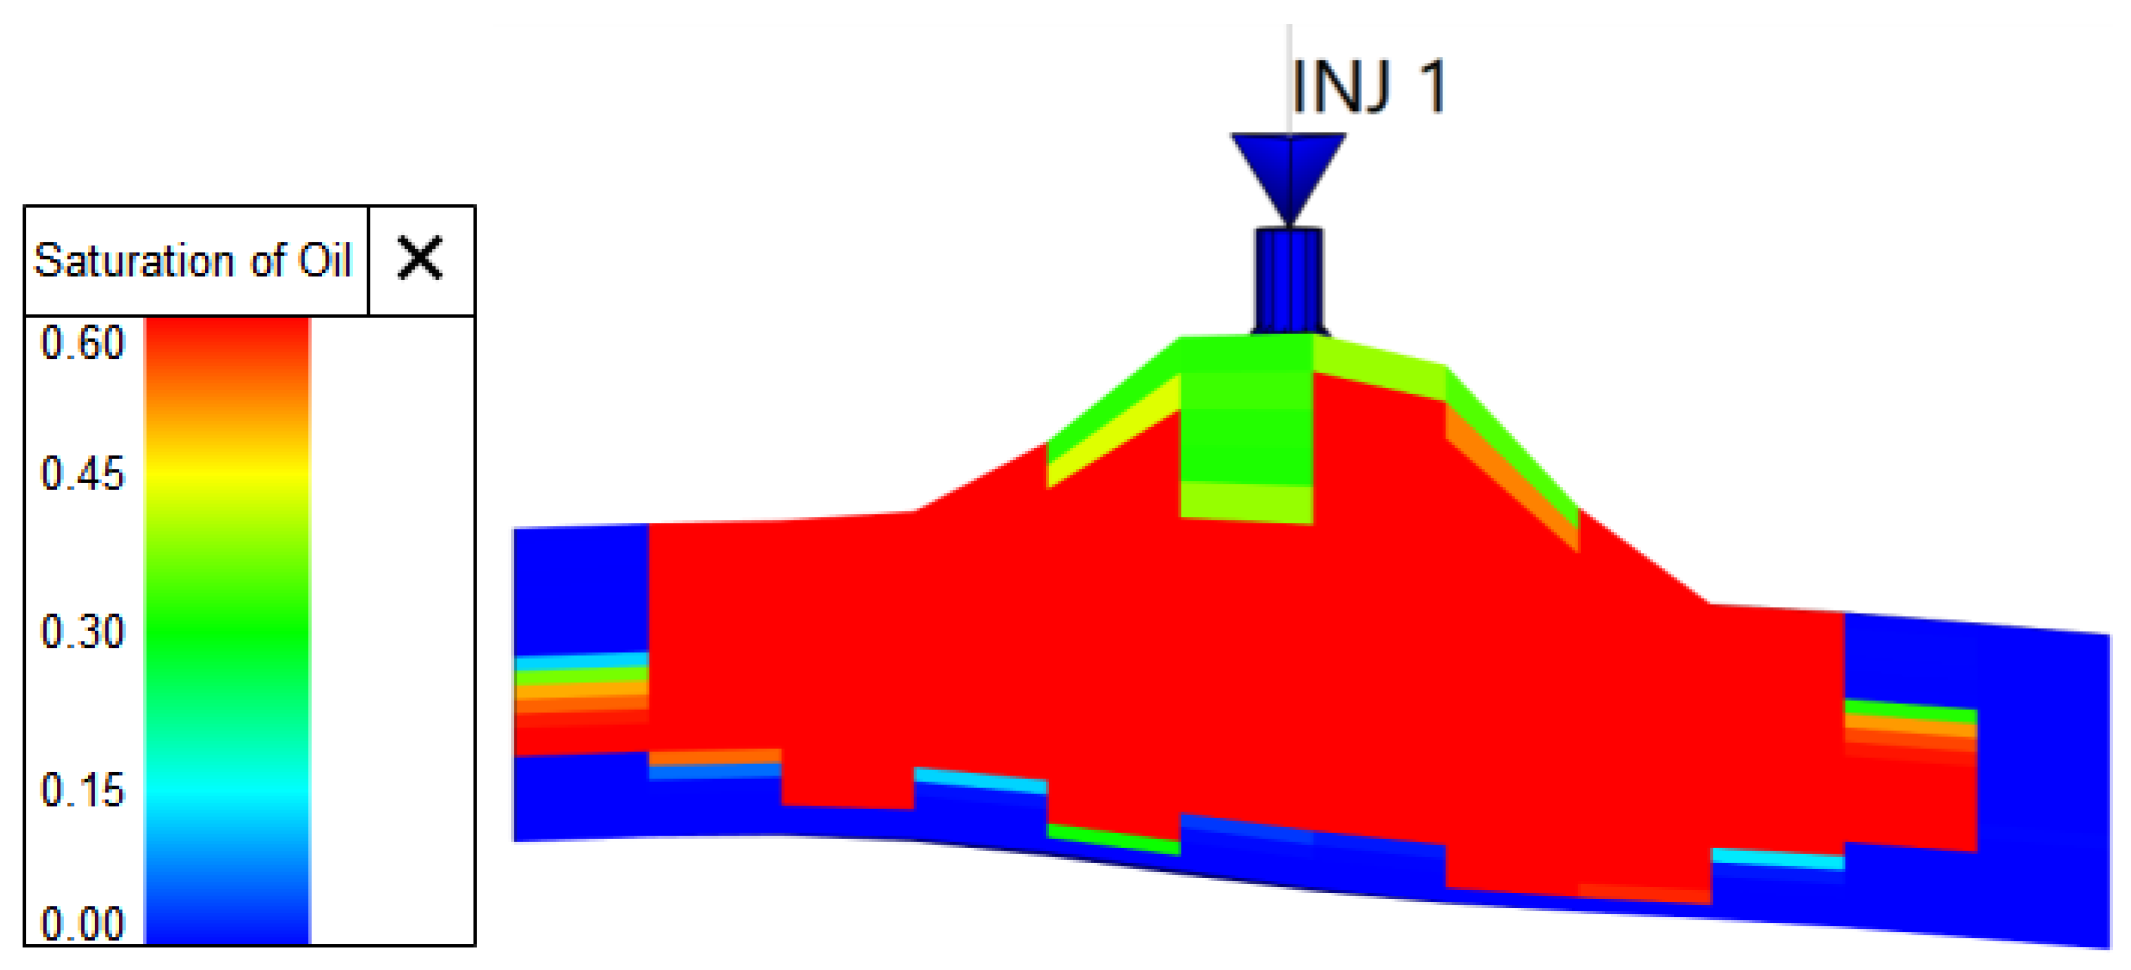
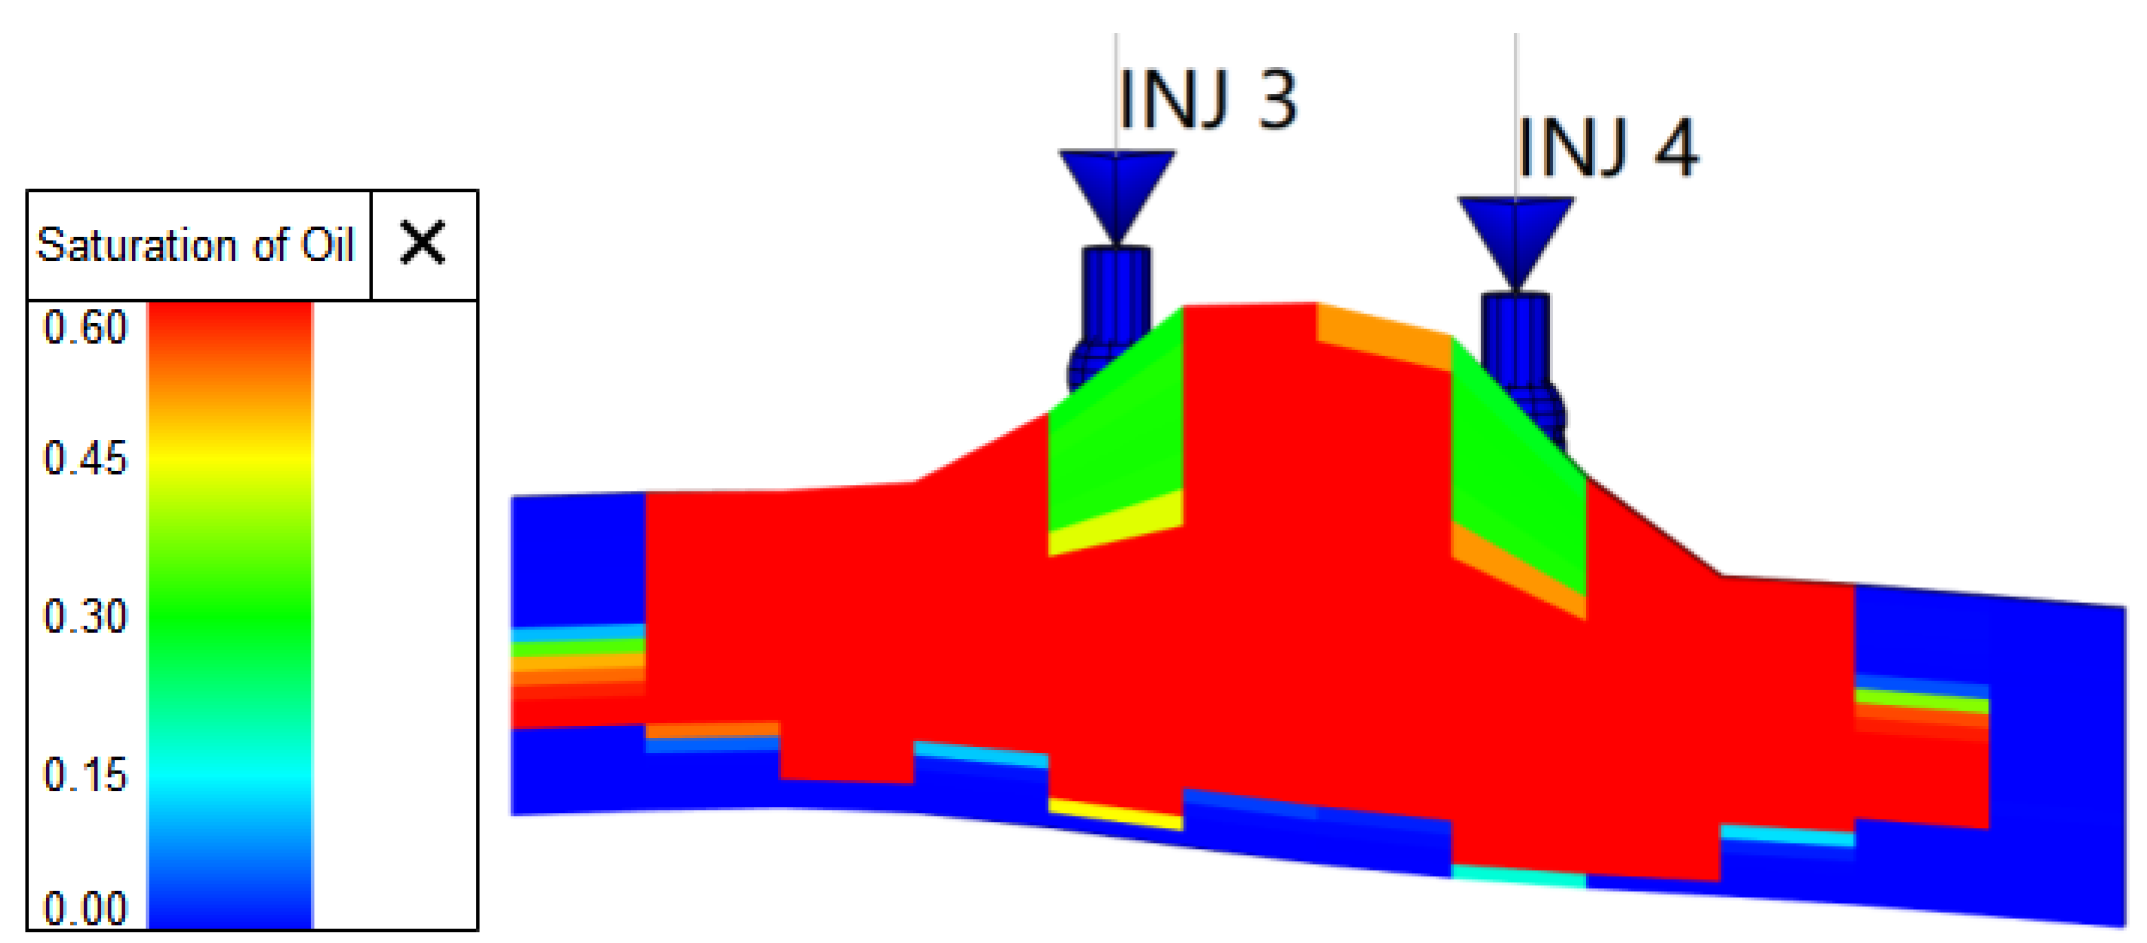
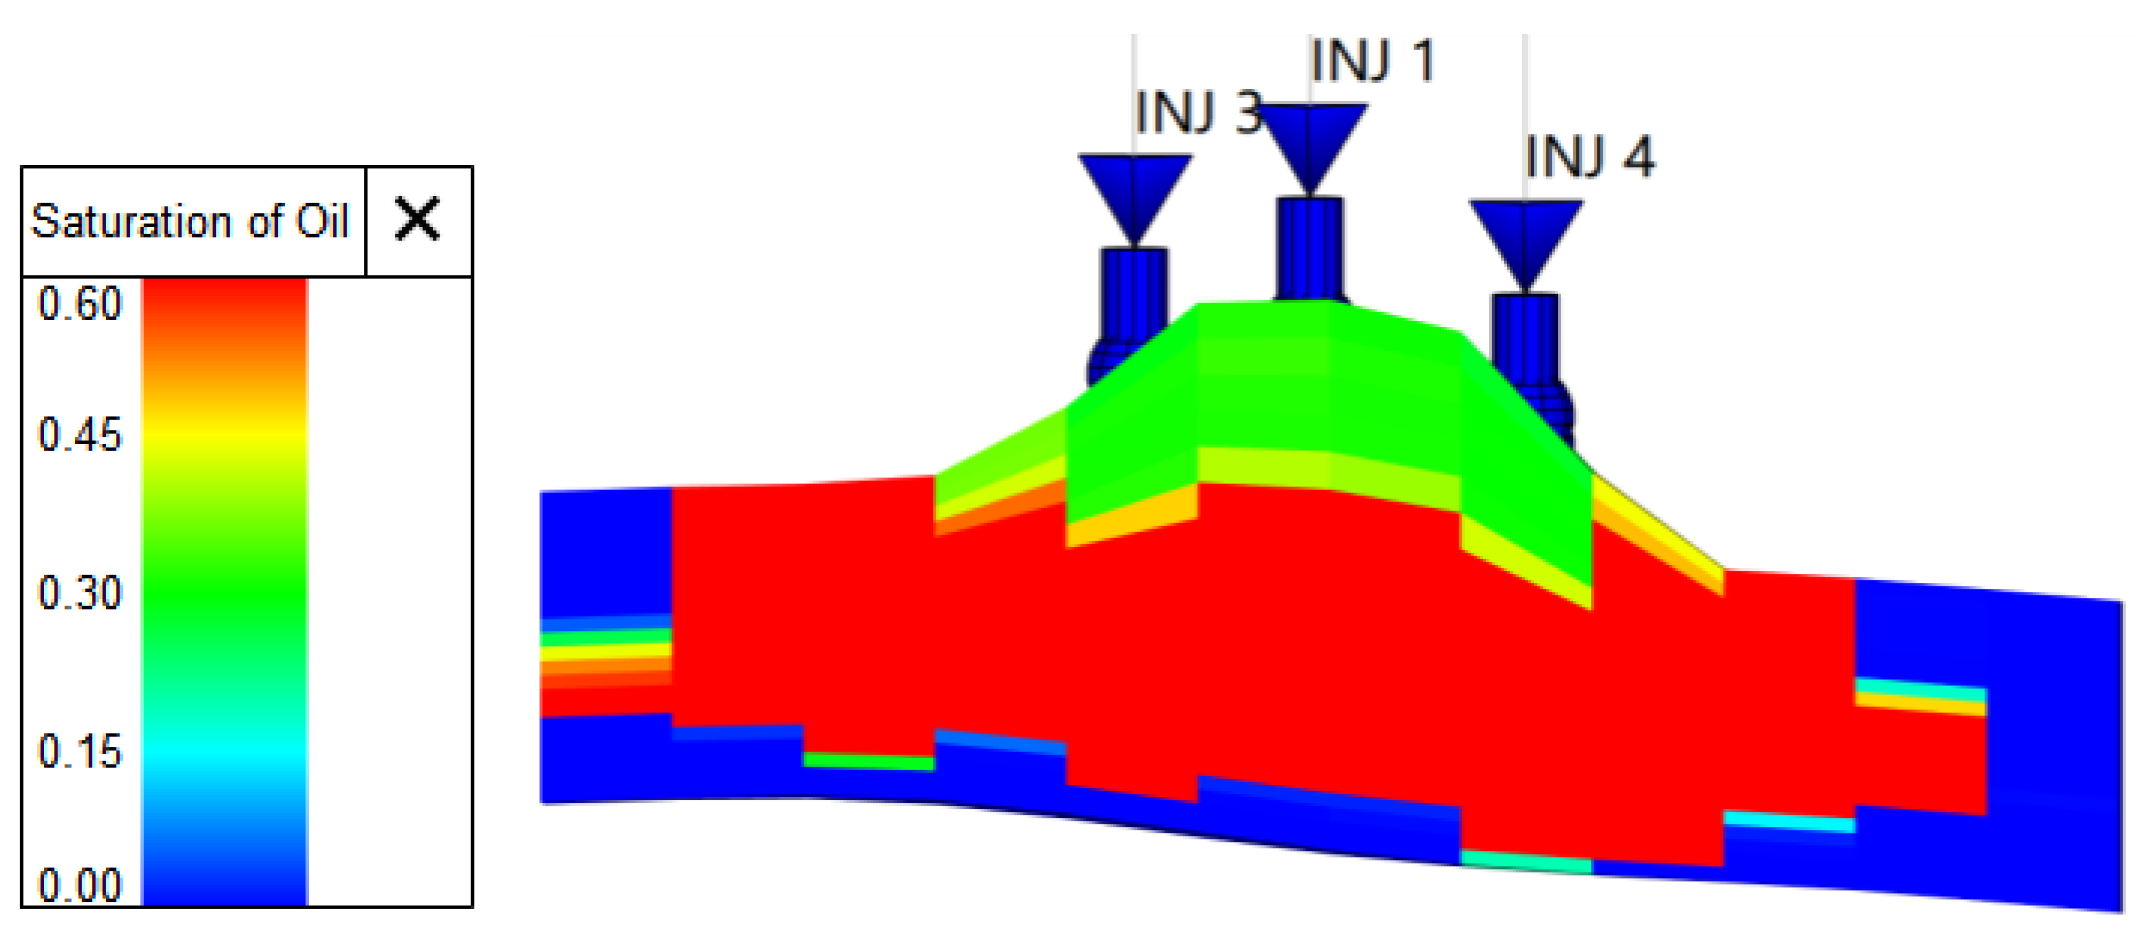
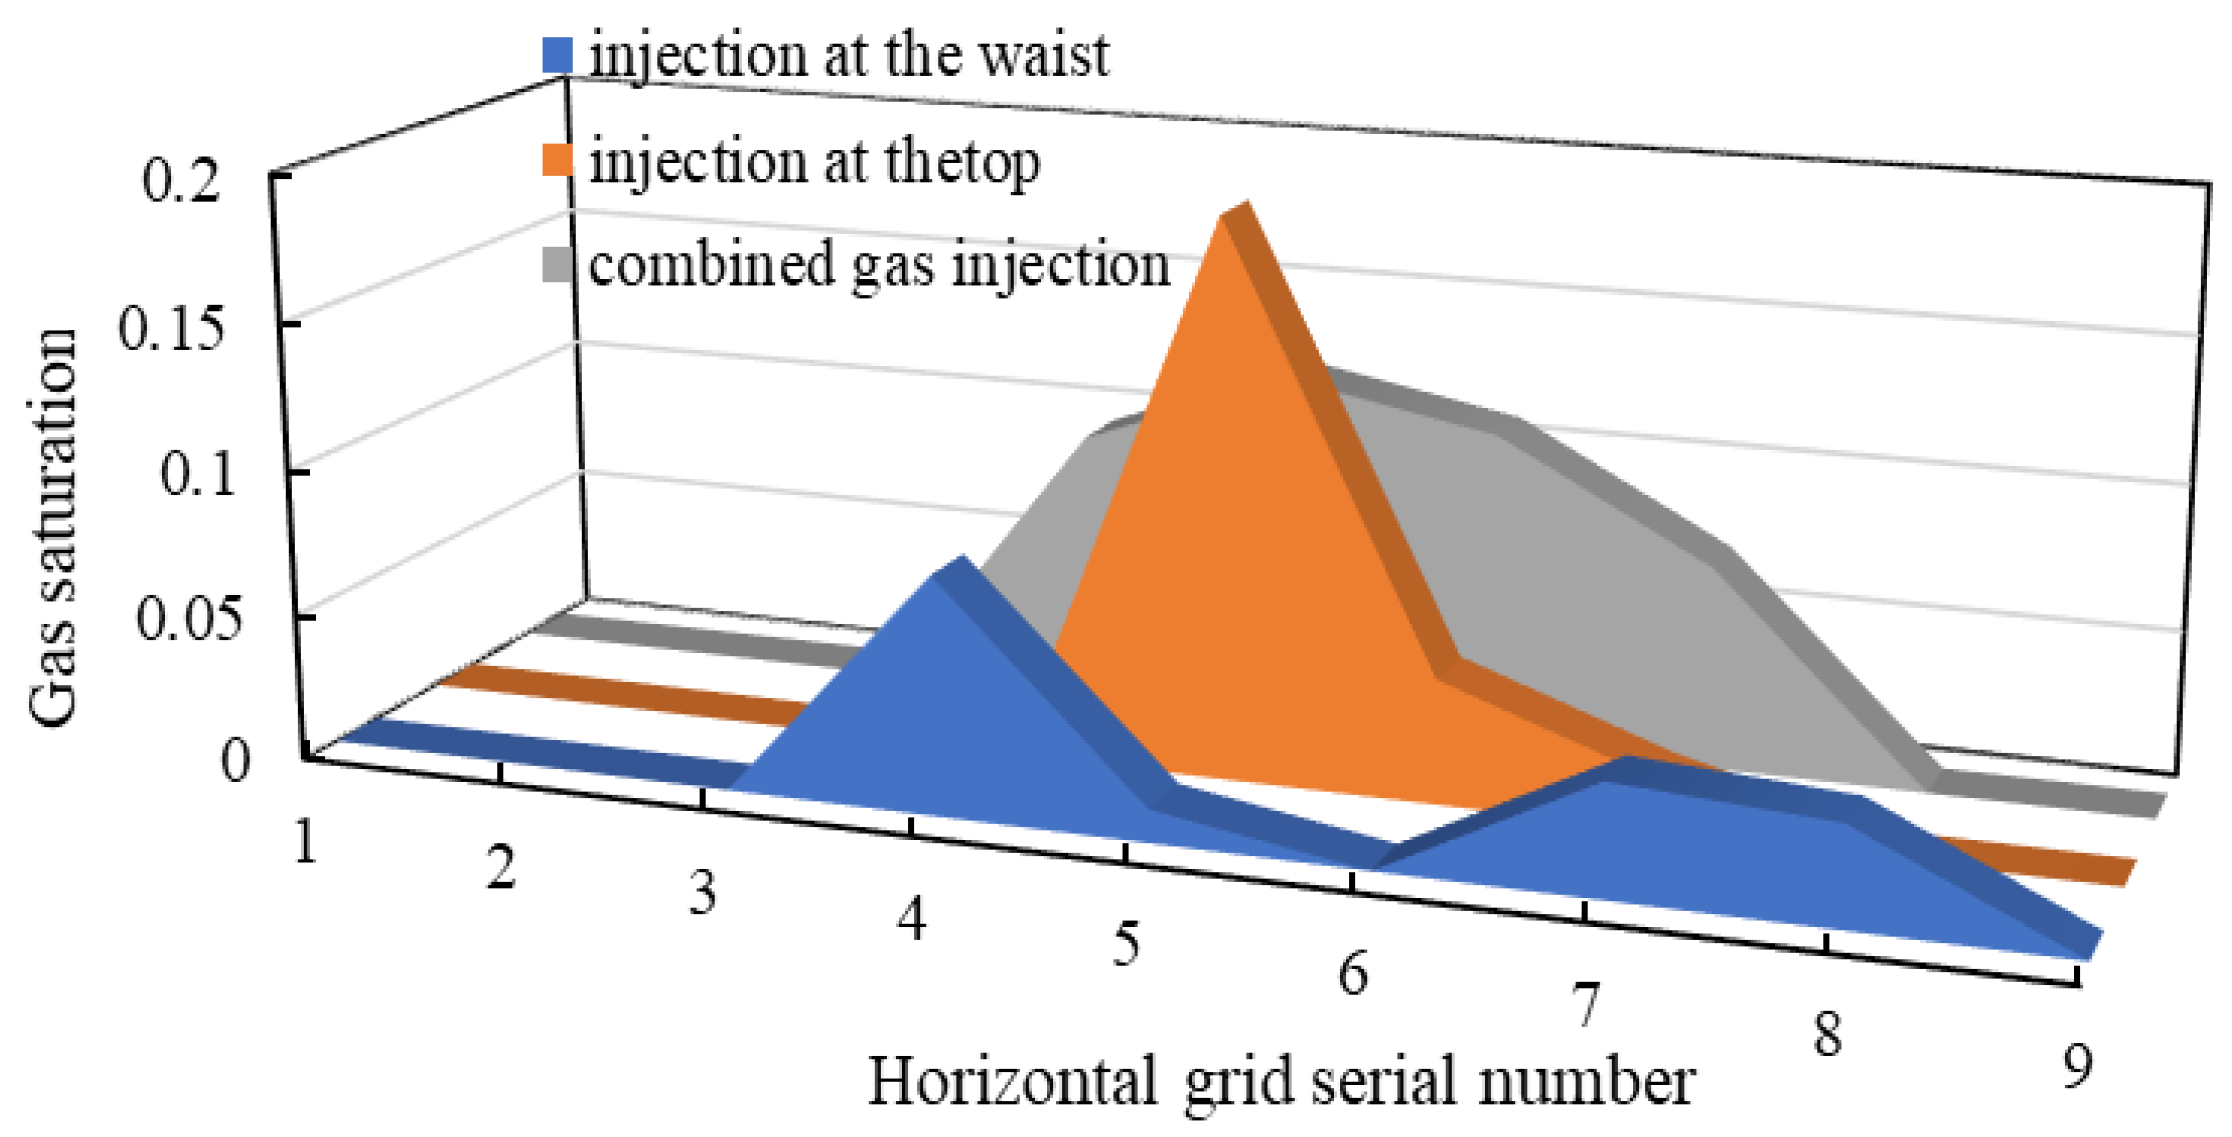
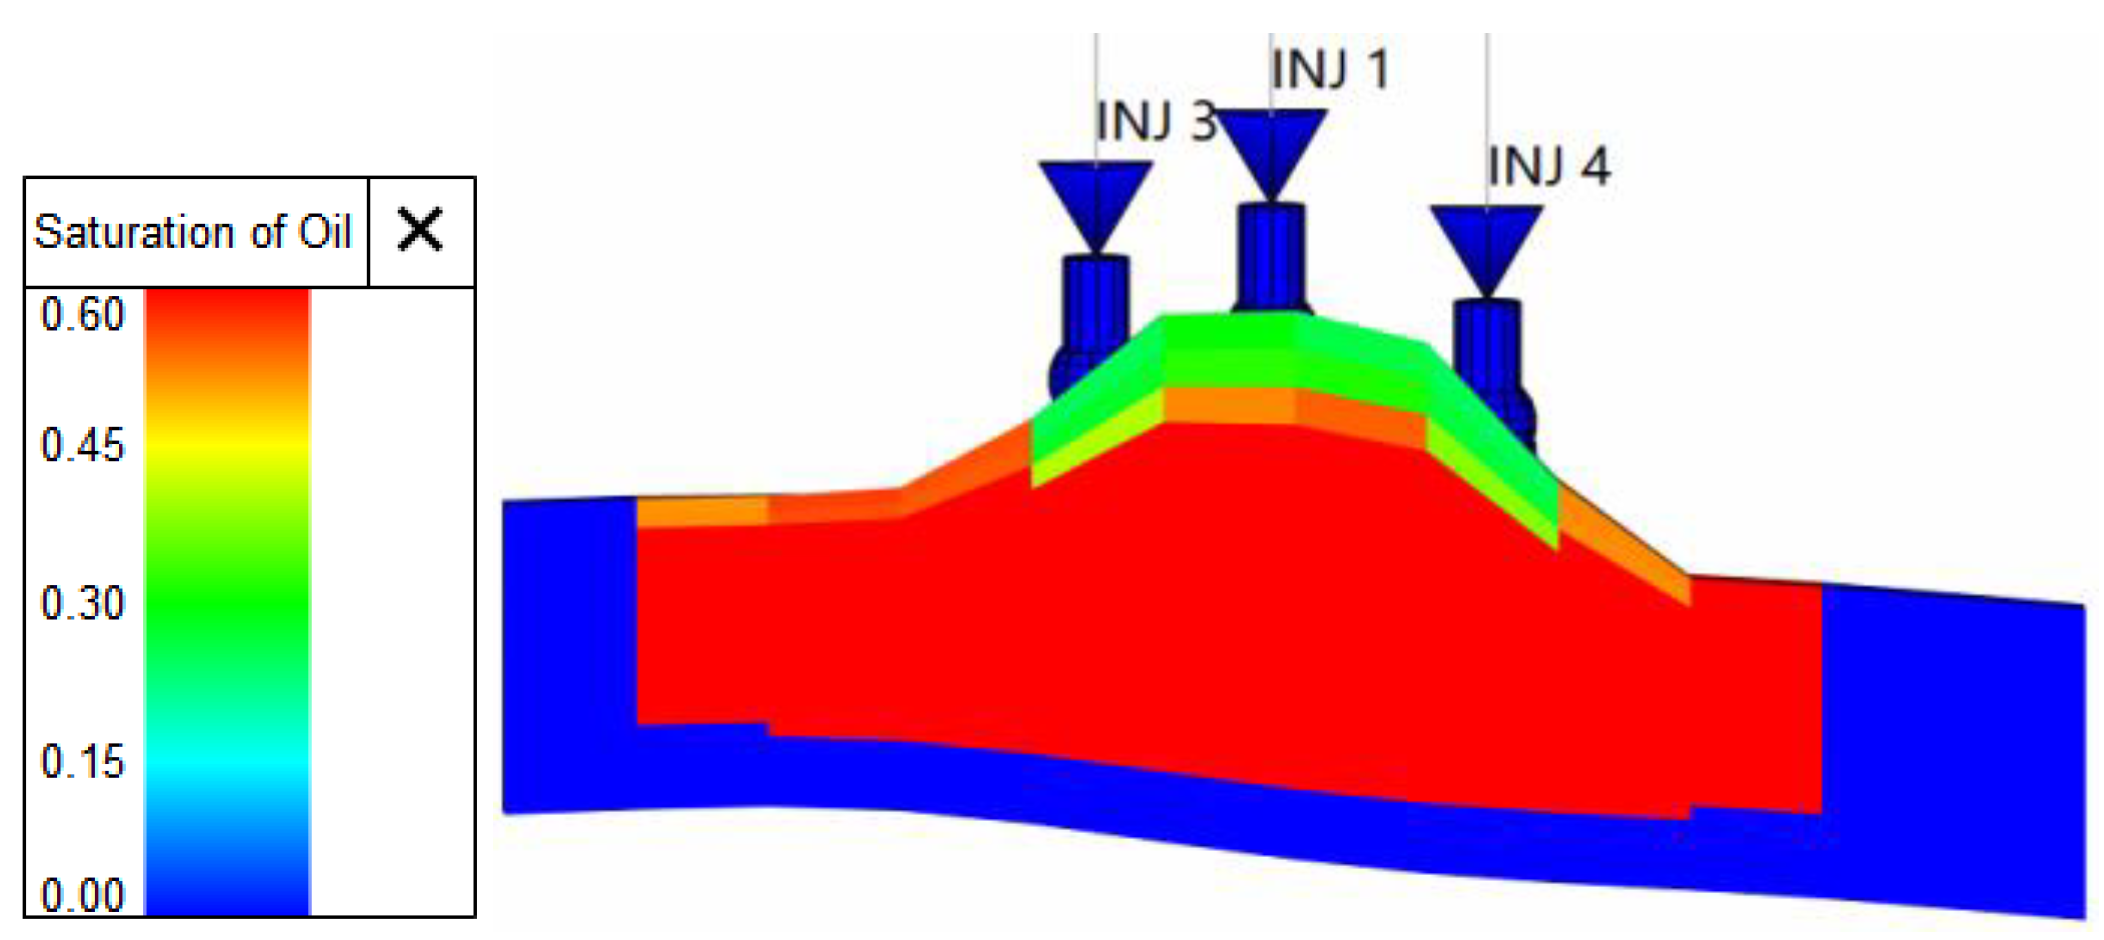
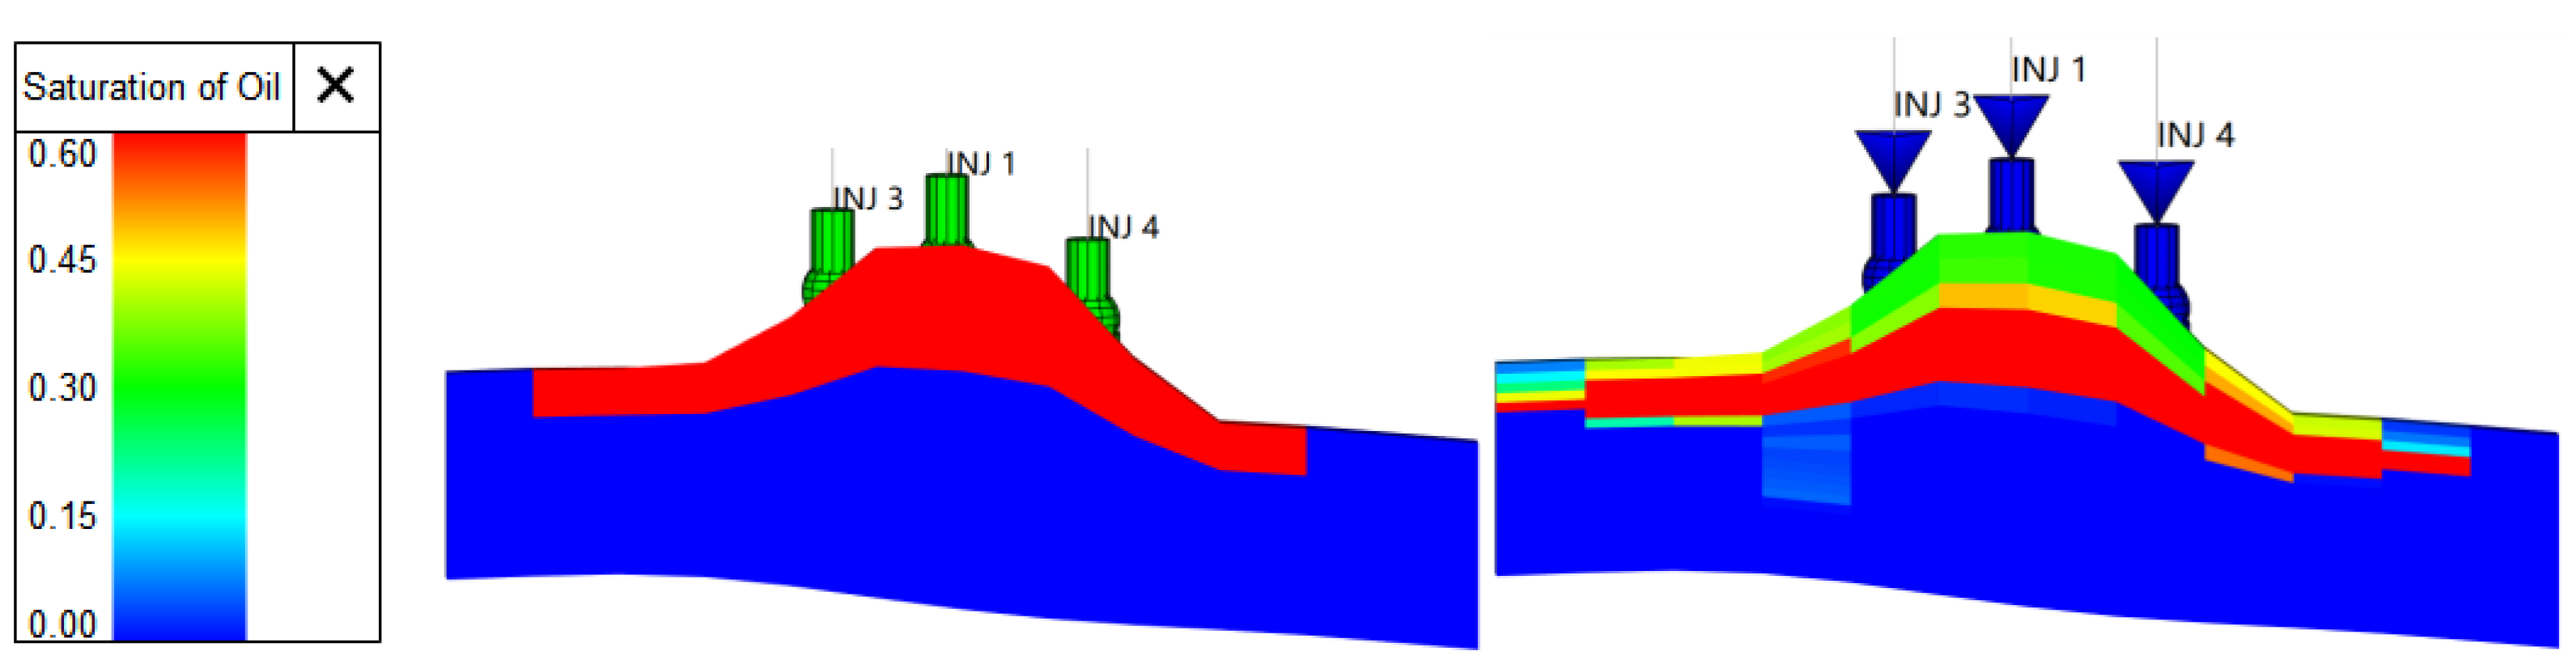
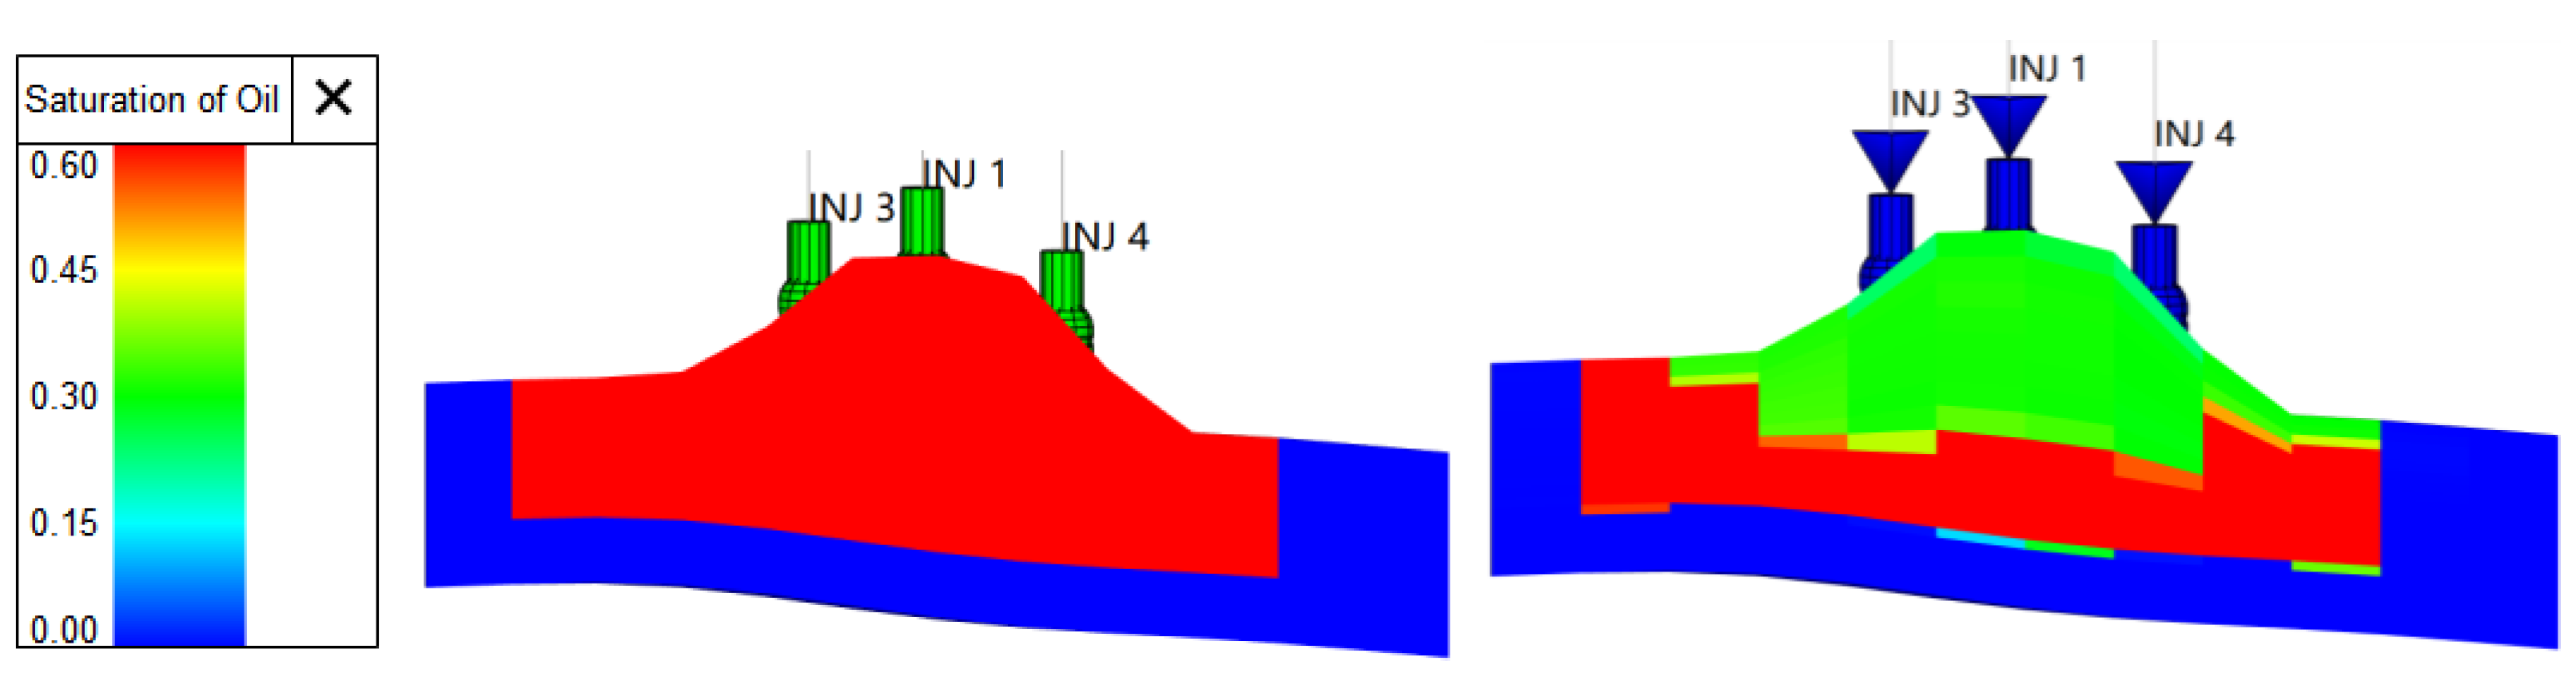
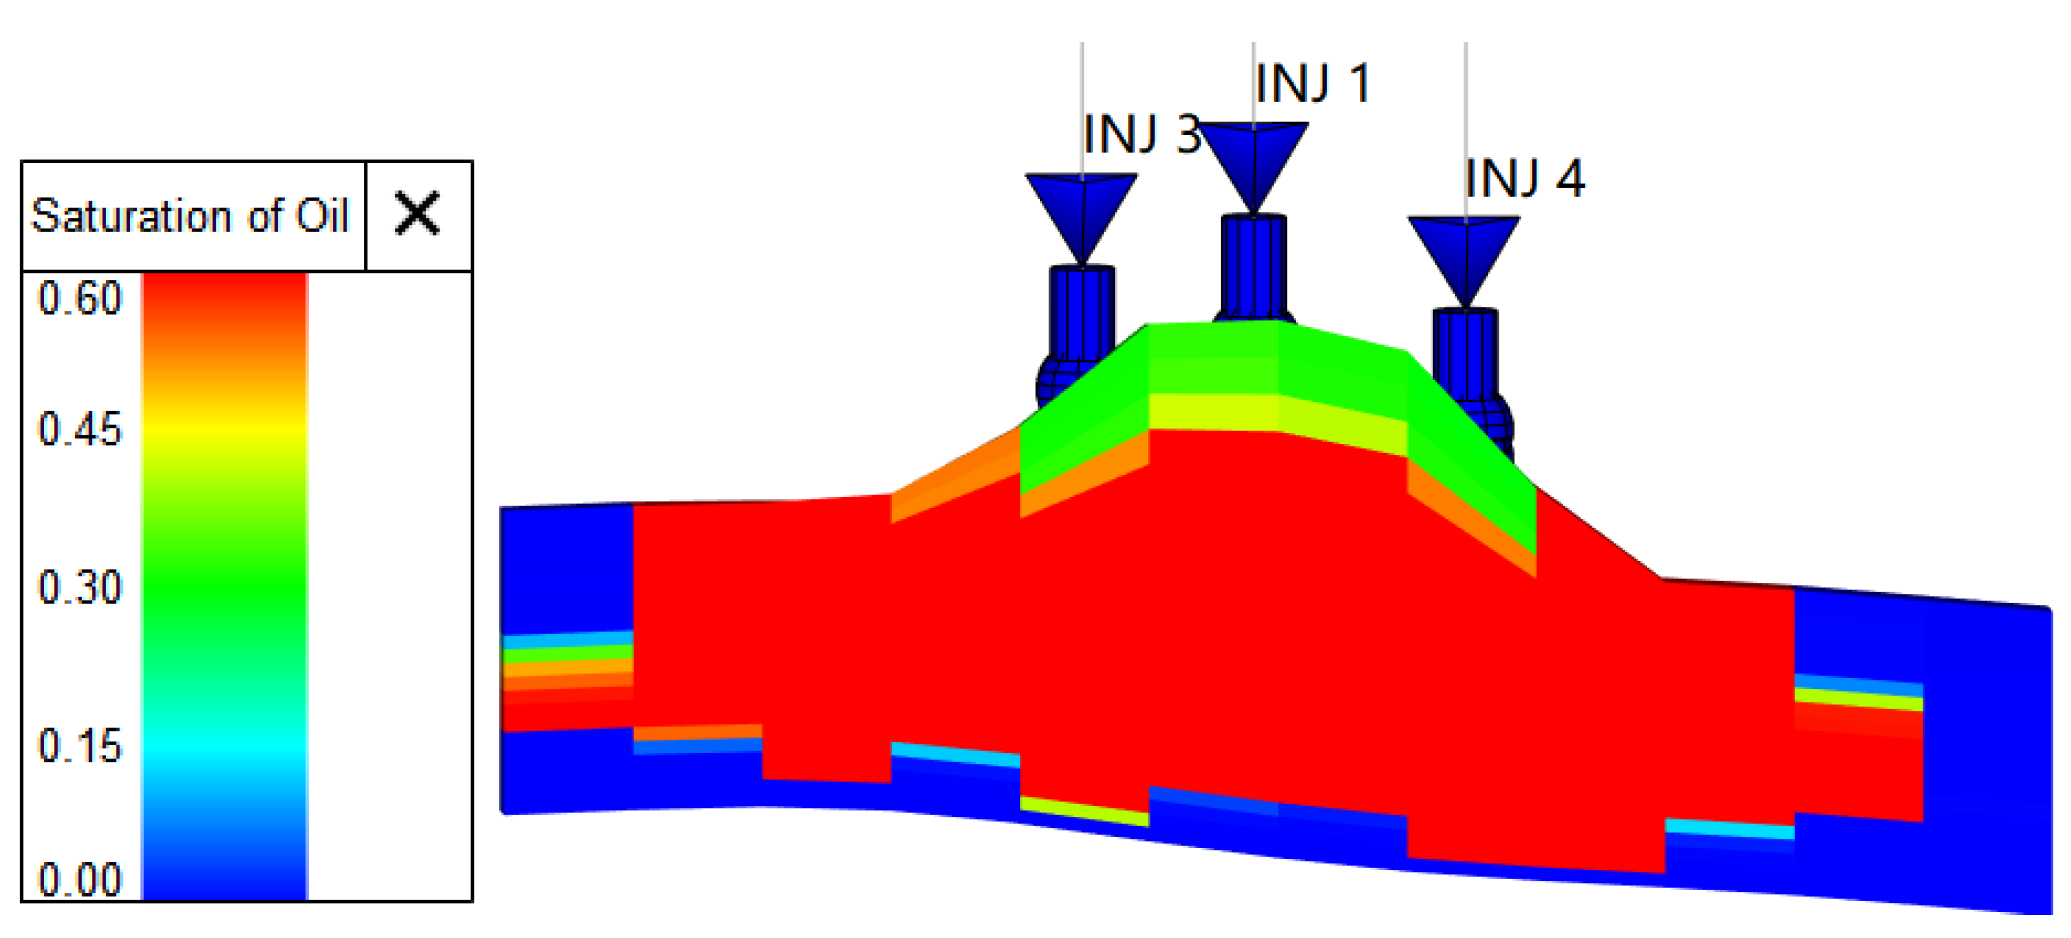
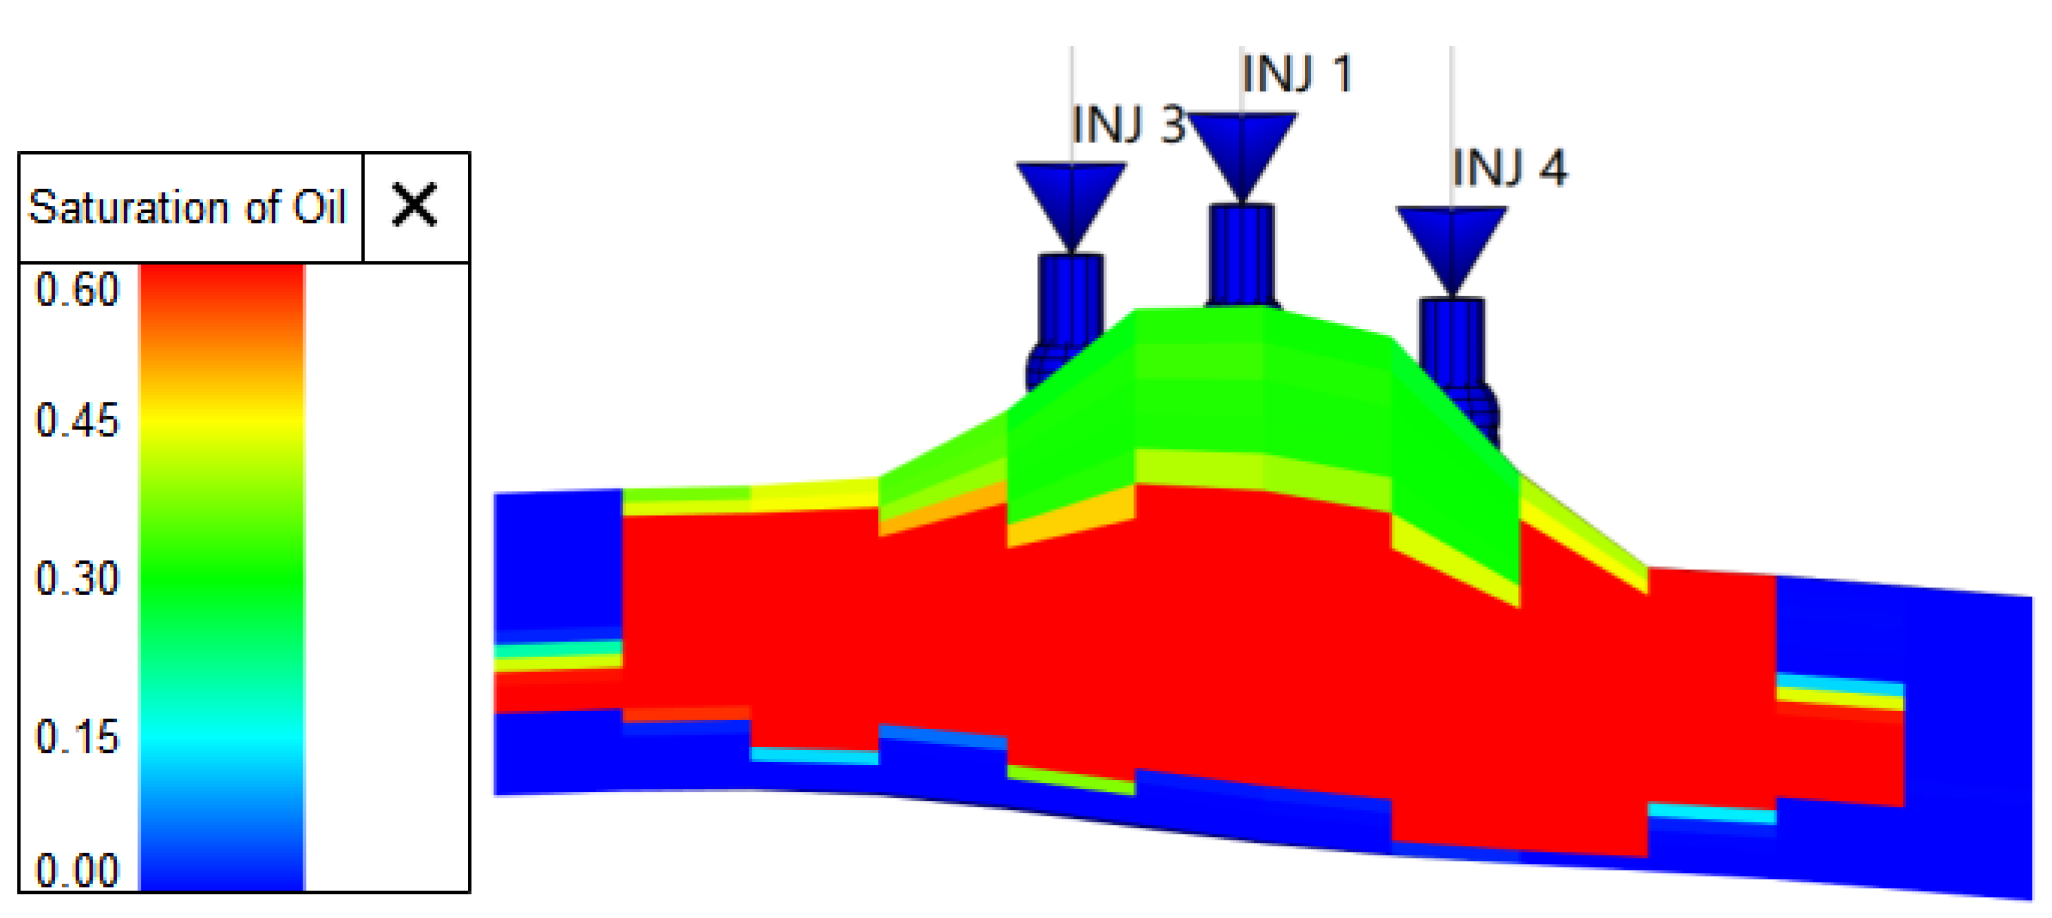
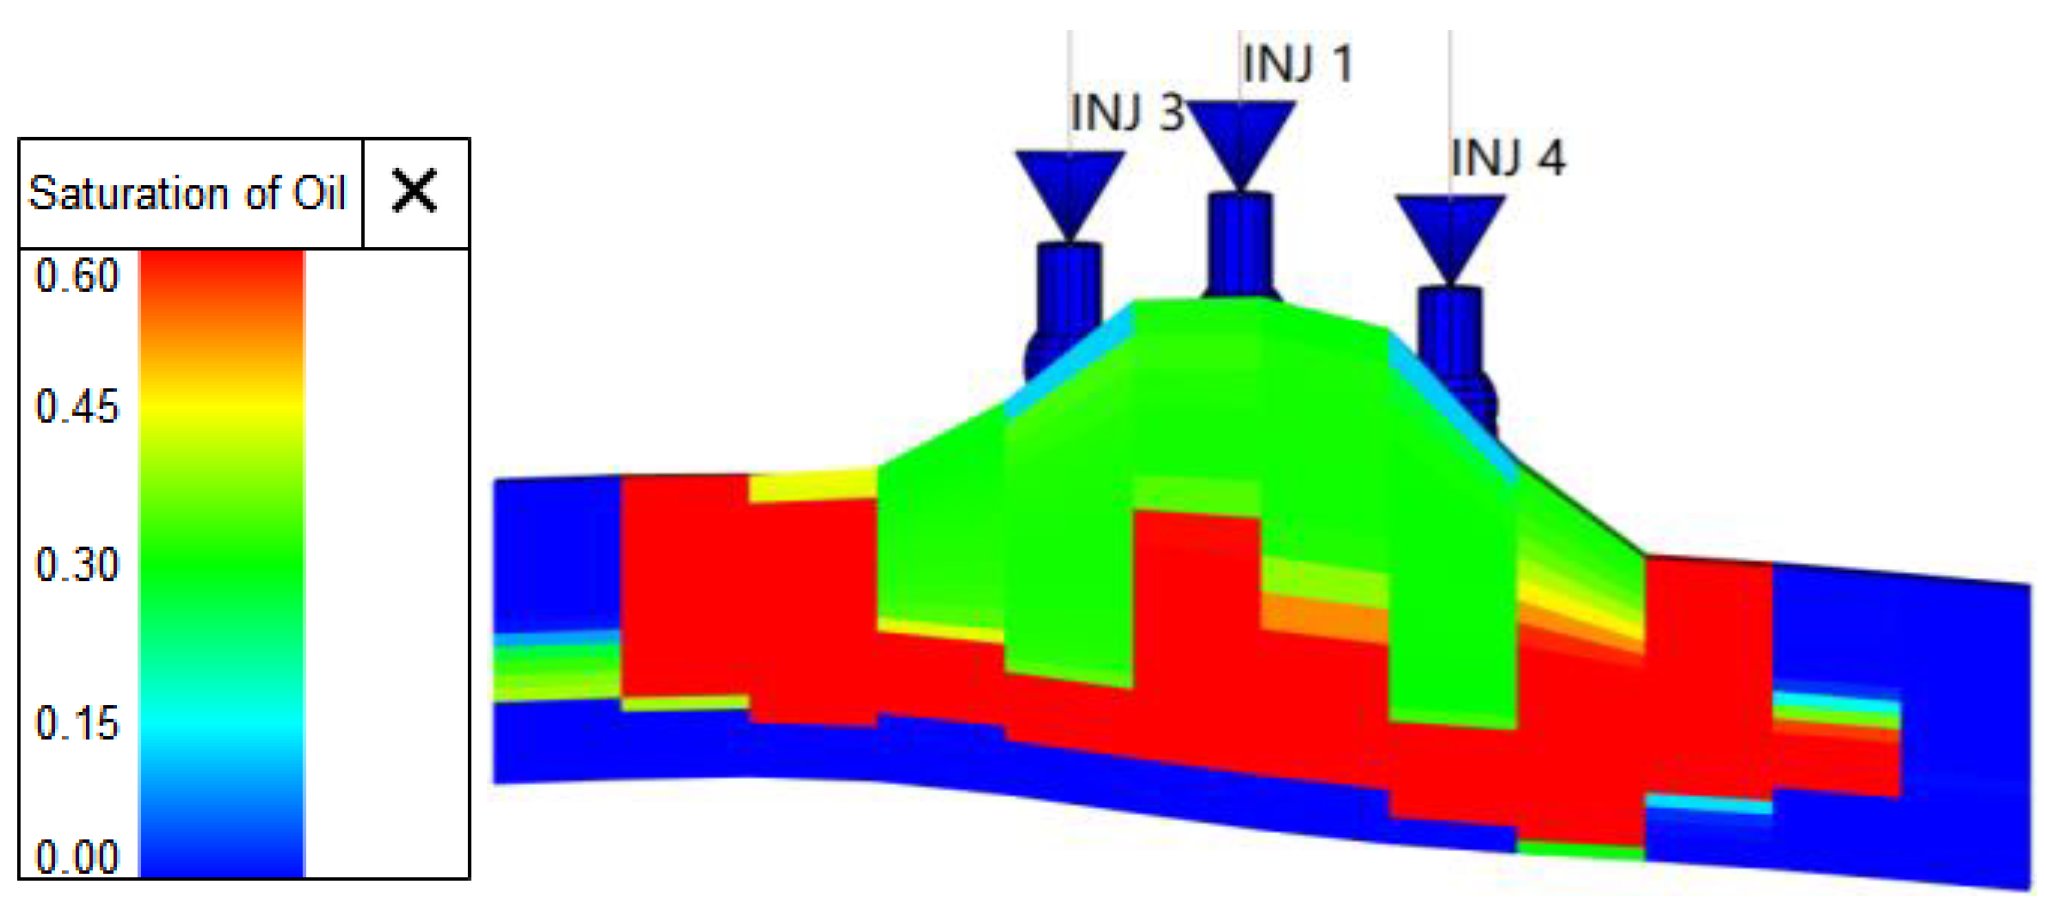
3.1.2. CO2 Injection Site

According to the following figures (Figure 11, Figure 12 and Figure 13), when the same amount of CO2 was injected, injecting CO2 at the waist of the anticline resulted in the injected CO2 becoming miscible with the remaining oil in the middle of the structure. This prevented CO2 from effectively accumulating at the top of the anticline structure, thus affecting the efficiency of gravity differentiation. While CO2 injection at the top of the anticline structure could quickly establish gravity differentiation, prolonged and excessive CO2 injection at the top could lead to downward gas breakthrough [24]. This resulted in higher gas saturation in grid No. 6 and No. 7 (Figure 14) and a less effective lateral CO2 sweep. On the other hand, combined CO2 injection at both the top and waist of the anticline structure could achieve effective gravity differentiation throughout the anticline quickly and maintain a good lateral CO2 sweep effect. This approach was beneficial for the formation of a large-scale CO2 cap.

3.1.3. Initial Formation Pressure

An observation could be made that when the formation pressure was higher, the effect of miscible flooding was better, which was more conducive to CO2 accumulation (Figure 15, Figure 16 and Figure 17). As the initial reservoir pressure decreased, the gas compressibility factor also decreased, resulting in a larger underground volume for the same surface volume of injected CO2 [25]. Consequently, gas coning occurred earlier in the production well, and the injected CO2 dispersed, as depicted in Figure 18. This dispersion was not conducive to the formation of a large-scale CO2 cap.

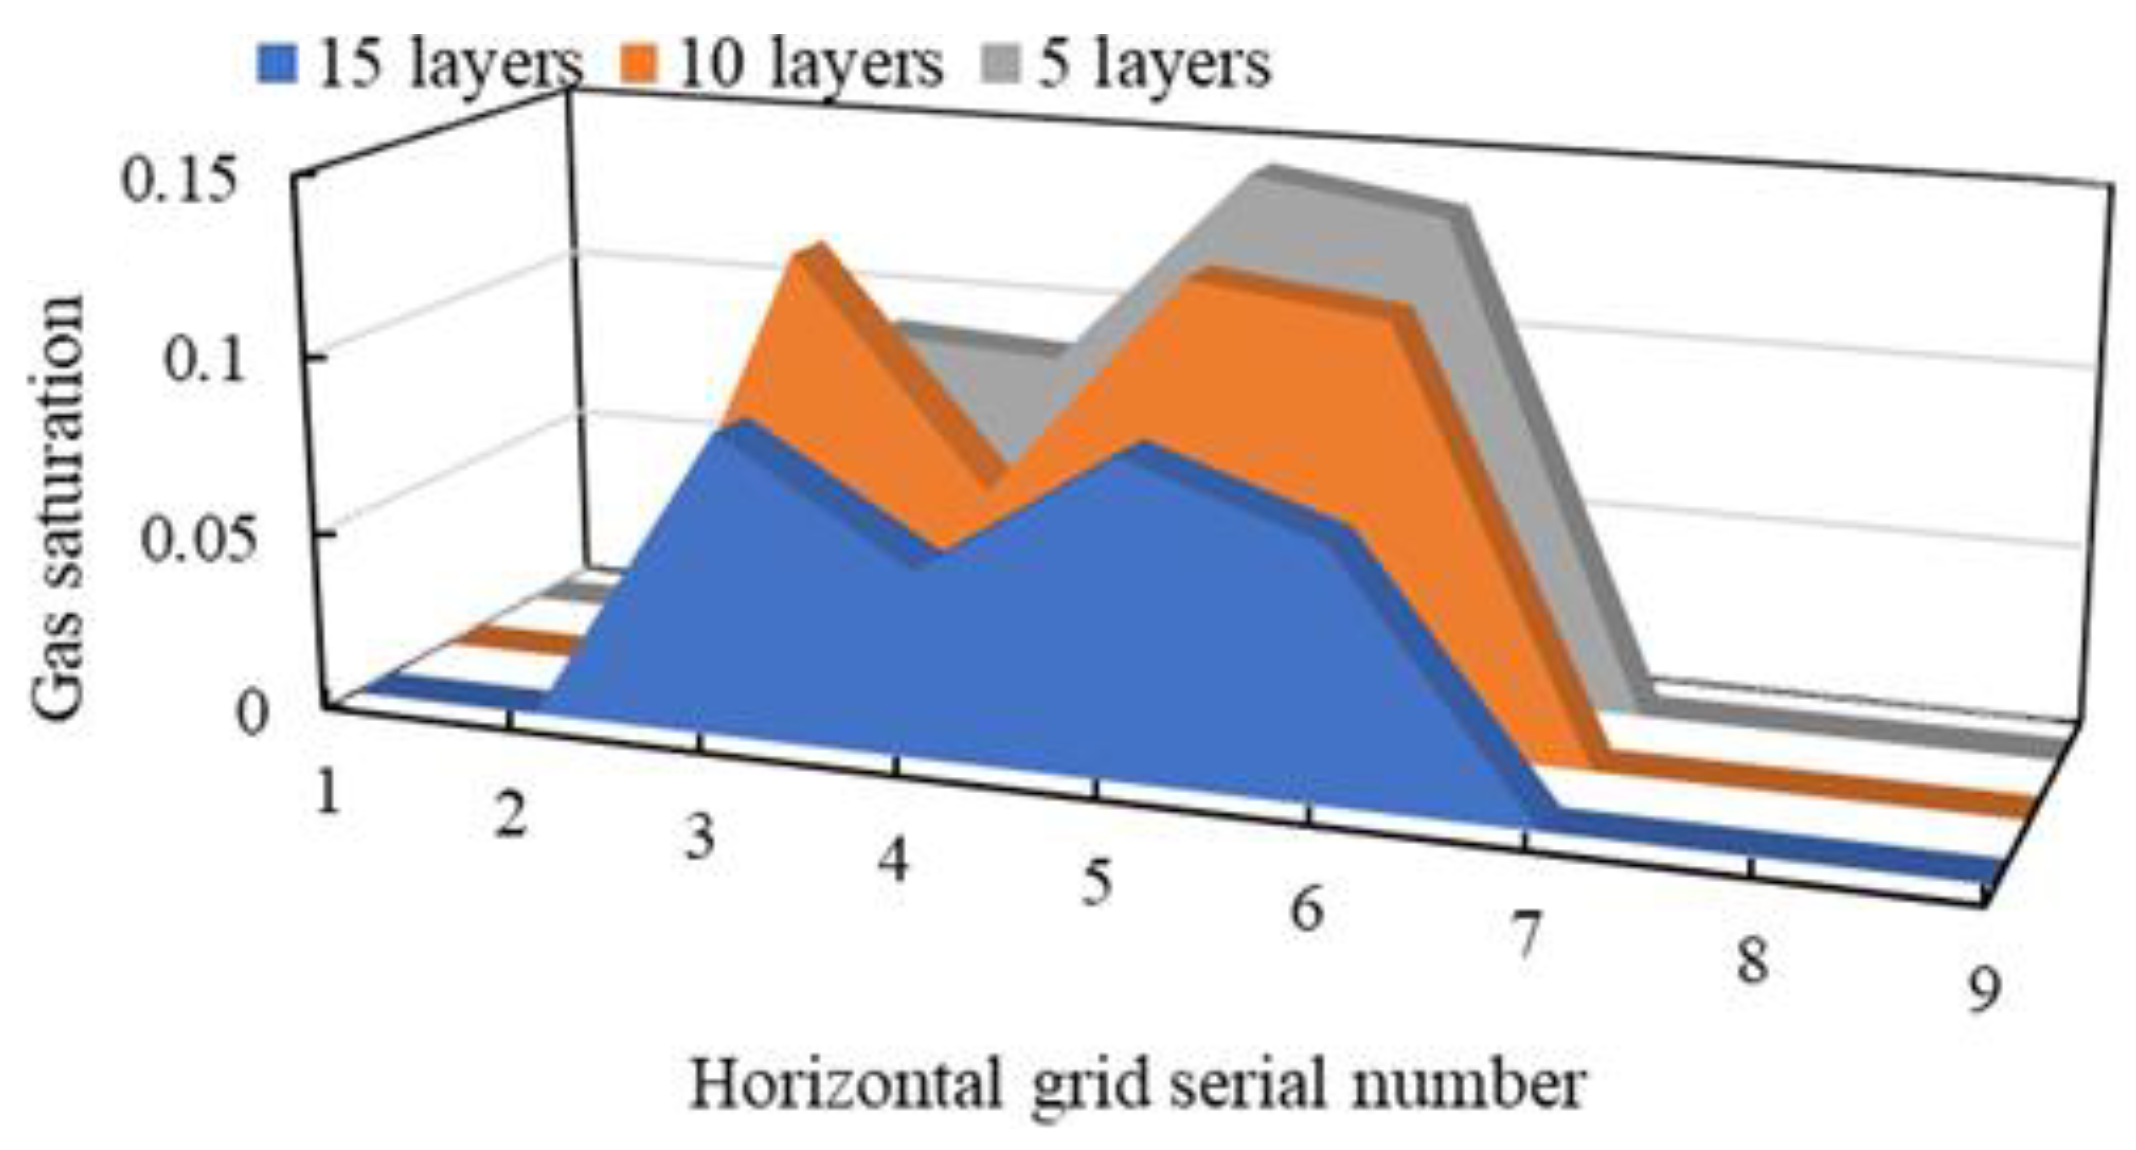
3.1.4. Reservoir Thickness

A thicker reservoir, on the other hand, led to increased CO2 dissolution in crude oil, promoting miscibility and requiring a larger CO2 injection volume to establish an effective CO2 cap [26]. In a scenario where only the reservoir thickness was varied while keeping the CO2 injection volume constant, when the reservoir thickness became excessively large, both the descent of the oil-water interface and the oil-gas interface was not substantial, as indicated in Figure 19, Figure 20 and Figure 21. When the reservoir thickness was smaller, injected CO2 tended to disperse along the oil-gas interface, which hindered the gravity differentiation of oil and gas and the development of a CO2 cap (Figure 22). These observations suggested that CAGD technology was particularly suitable for the anticlinal reservoirs with thicknesses ranging from 25 m to 50 m.

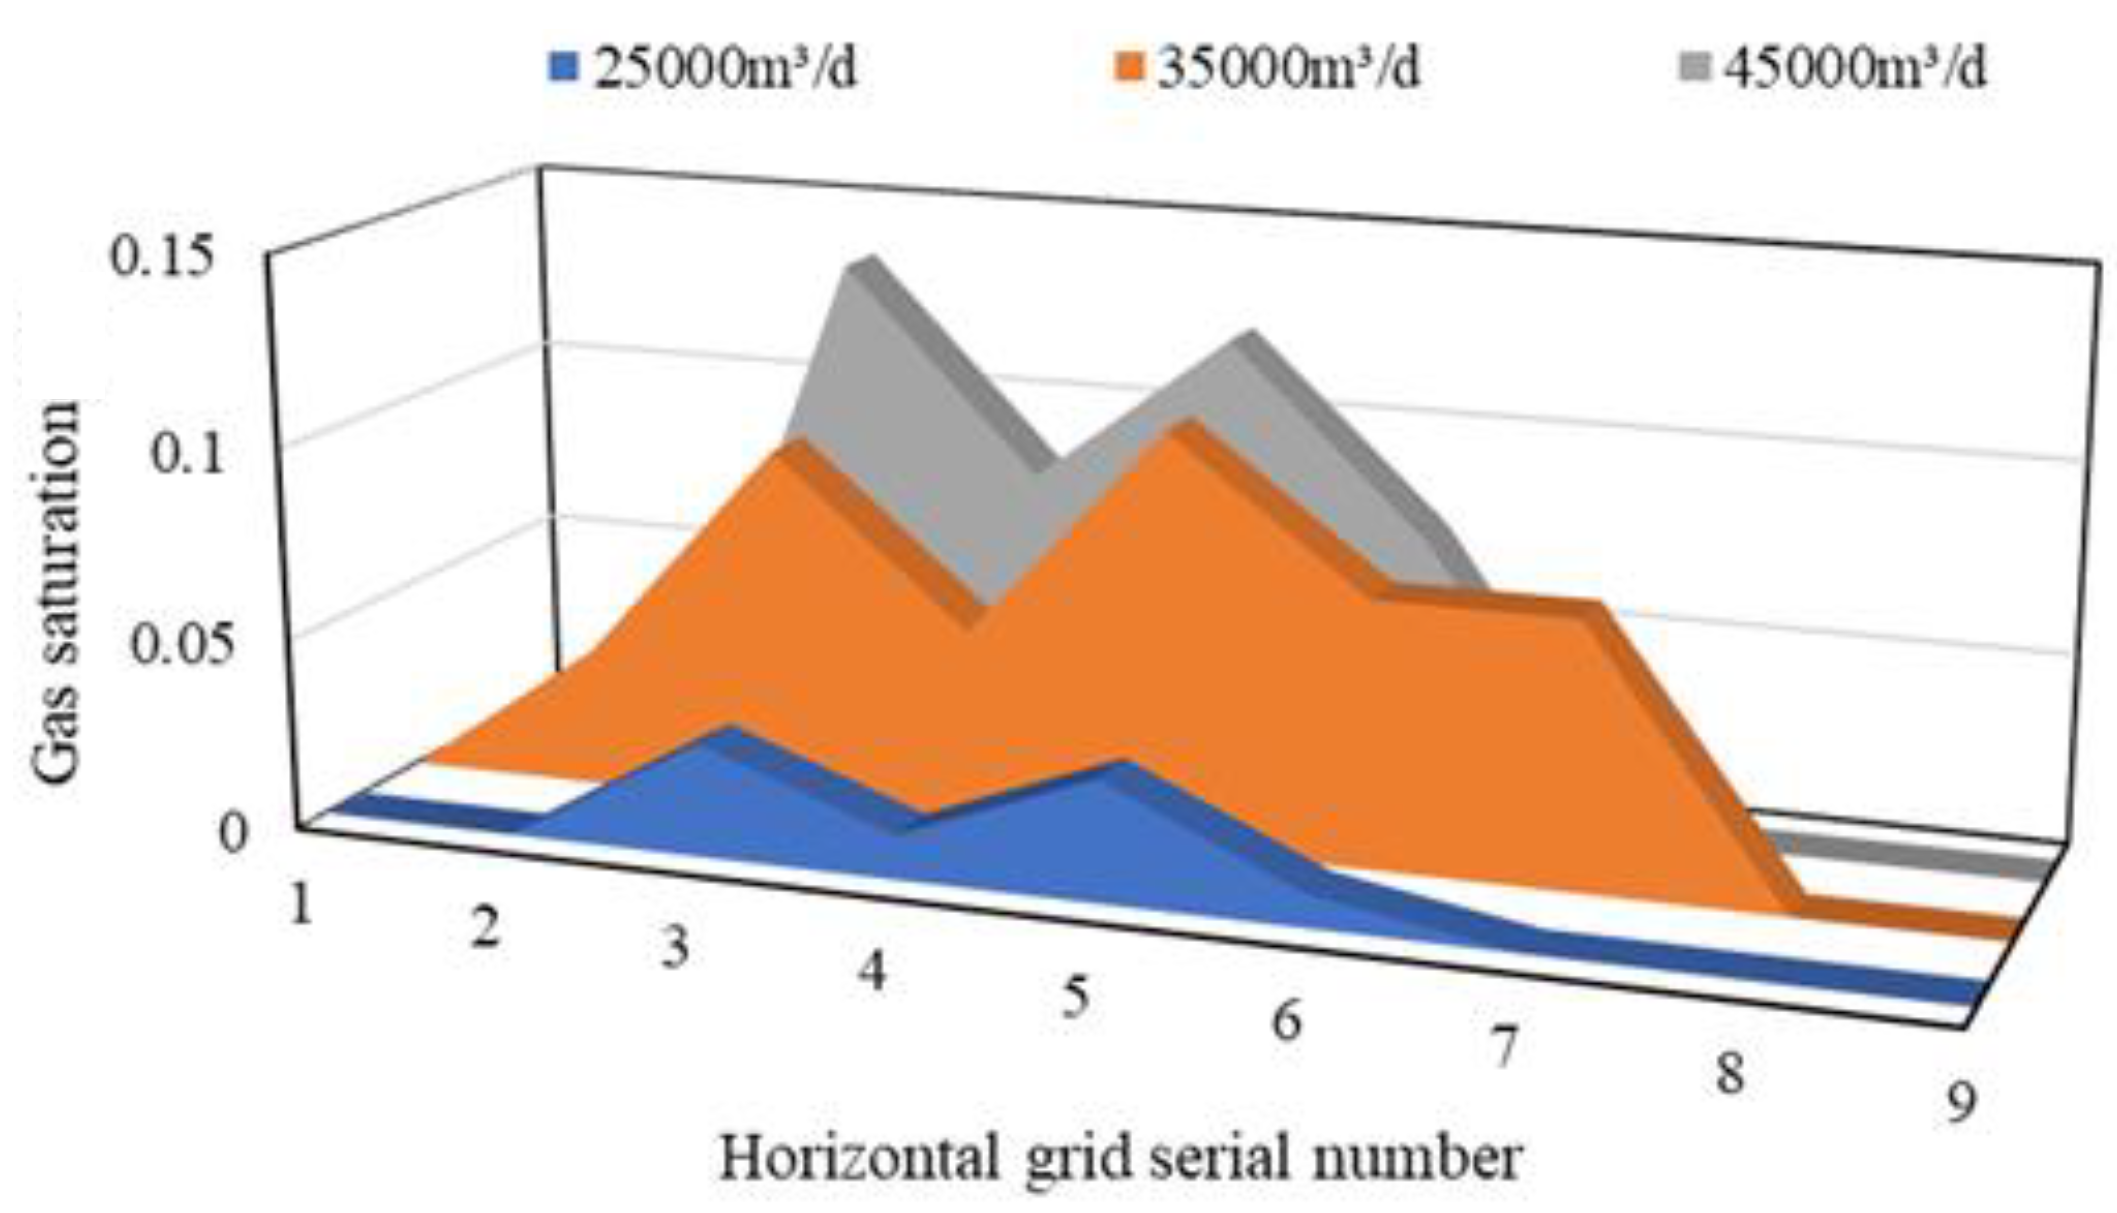
3.1.5. CO2 Injection Rate

From Figure 23, Figure 24, Figure 25 and Figure 26, it was evident that as the CO2 injection rate increased, the CO2 cap development occurred more rapidly, resulting in a wider lateral sweep range and a more pronounced effect on the recovery of residual oil at the top. However, when the CO2 injection rate was excessively high, it could lead to CO2 breakthrough downward, diminishing the lateral sweep efficiency [27]. Conversely, when the CO2 injection rate was too low, it prolonged the development of the CO2 cap, which could impact cost-effectiveness. Therefore, optimizing the CO2 injection rate was crucial in practical oil field development.

4. Application of CAGD

4.1. Filed Application

Well Pattern Conformation of CAGD

The initial well pattern involved injecting CO2 at the top of the anticline structure and providing supplementary CO2 injection and oil production at the waist of the anticline structure. During the formation of gravity differentiation at the top, the production well was shut in, and the boundary between oil and gas, driven by CO2, moved downward. Subsequently, the production wells at the waist of the anticline structure were restarted, while continuously replenishing CO2. Therefore, T1, T2, and T3 were chosen as CO2 injection wells, while the remaining wells were designated as production wells (Figure 27).

4.2. Optimization of Injection-Production Parameters

4.2.1. Optimization of CO2 Injection Mode

Utilizing three wells, T1, T2, and T3, continuous CO2 injection and intermittent CO2 injection (inject 4 months; stop for 2 months) were performed separately. Both injection schemes maintained an equal total injection volume of 6.48 × 10⁸ m3. The simulation was conducted to predict the performance over a period of ten years. By comparing the CO2 sweep range demonstrated by the two injection methods, findings were made that intermittent CO2 injection was more conducive to the effective utilization of gravity differentiation and resulted in better lateral sweep range (Figure 28). This was because the soaking period of intermittent CO2 injection was the optimal period for molecular diffusion, and when a large number of gas molecules enter a high-temperature and high-pressure reservoir environment, intense diffusion occurs, resulting in significant expansion energy [28]. In contrast, continuous CO2 injection could lead to rapid gas migration towards the reservoir bottom, diminishing its effectiveness in lateral sweep range.

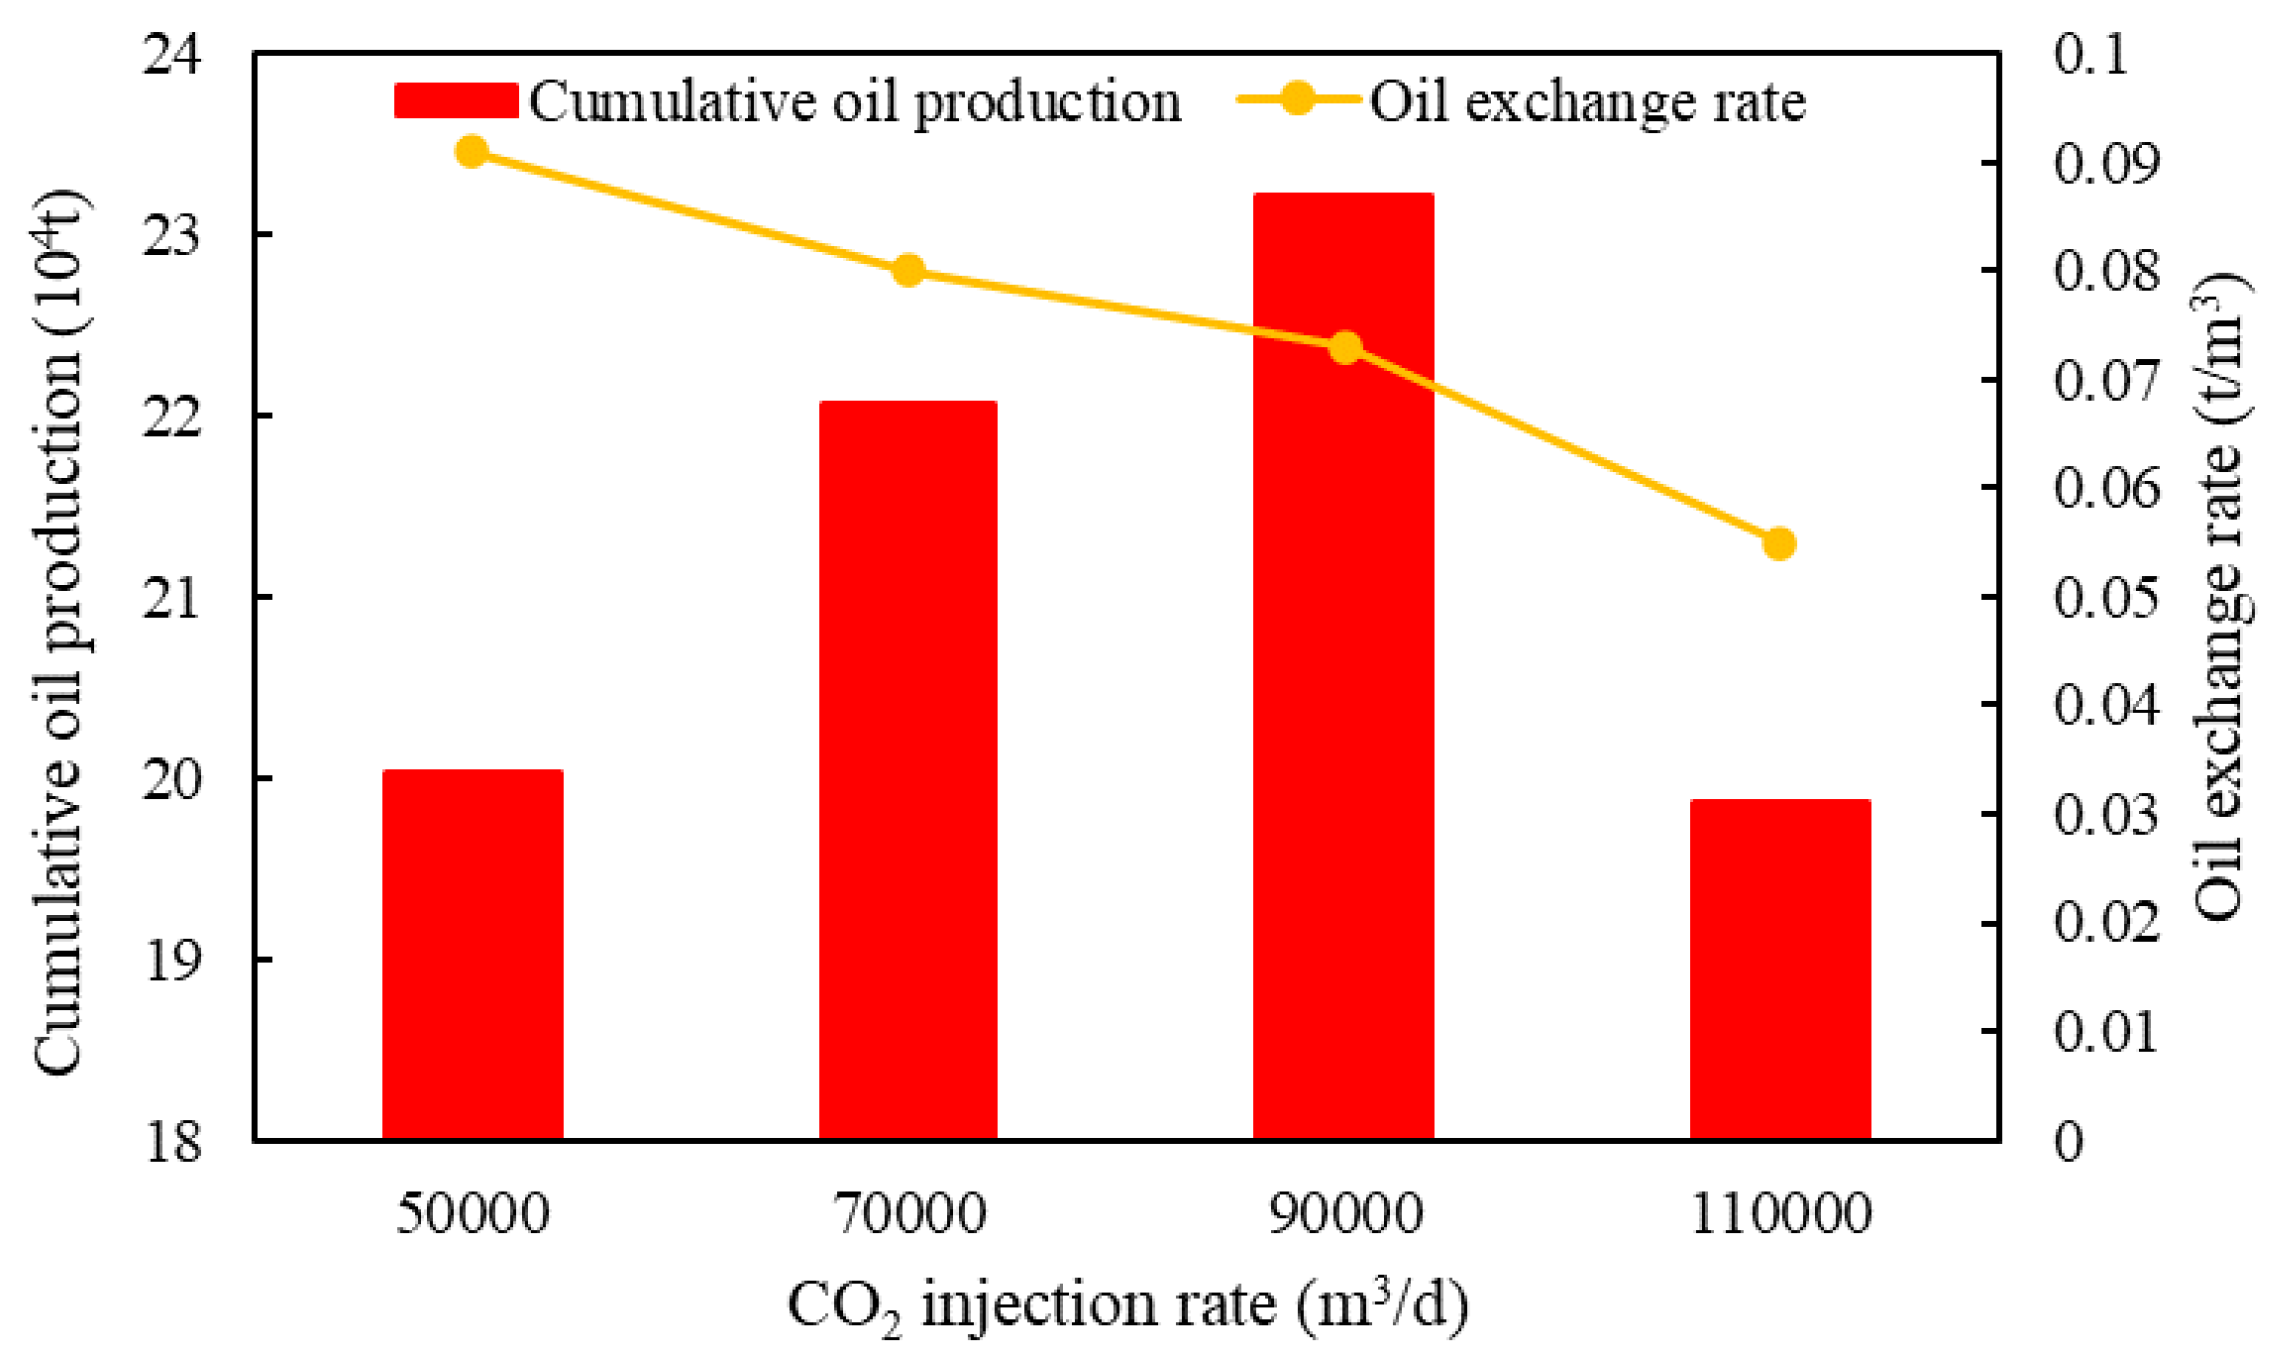
4.2.2. Optimization of CO2 Injection Rate

From the analysis of influencing factors of CAGD in the previous sections, it was evident that optimizing CO2 injection rate was crucial when CAGD technology applied in actual reservoirs. If the CO2 injection rate was too high, the occurrence of displacement CO2 fingering would be accelerated, and the CO2 would breakthrough prematurely so as to reduce the effect of CO2 injection [29]. Conversely, if the CO2 injection rate was too low, the effective period of CO2 injection would be prolonged and the economic benefit would be affected. Table 4 and Figure 29 show that the cumulative oil production increased with the increase in CO2 injection rate, and the oil exchange rate decreased with the decrease in CO2 injection rate, but when the CO2 injection rate was greater than 90,000 m3/d, the cumulative oil production decreased gradually and the oil exchange rate decreased. The CO2 injection rate affected the stability of the gas-oil interface. Considering the cumulative oil production and oil exchange rate, the CO2 injection rate adopted in the present study was 90,000 m3/d.

4.2.3. Optimization of Injection-Production Ratio

In Table 5 and Figure 30, an observation could be made that as the injection-production ratio (I-P ratio) increased, the cumulative oil production increased. However, the upward trend in cumulative oil production slowed when the I-P ratio exceeded 1.0. Additionally, when the I-P ratio became too high, it led to an increase in CO2 injection costs, which could have a negative impact on economic returns. Therefore, opting for an I-P ratio of 1.0, the simulation predicts a cumulative oil production of 232.185 × 10⁴ t after ten years.

4.3. Supplementary CO2 Injection

In the case of A Oilfield, following the CO2 injection until June 2024, the upward trend in cumulative crude oil production showed a noticeable slowdown. The two production wells, T4 and T5, situated in the anticlinal structure of the mid-section, were converted into CO2 injection wells with a gradual CO2 supplementation rate of 50,000 m3/d. Additionally, the production wells continued to operate with a I-P ratio of 1.0. As indicated in Figure 31, after implementing supplementary CO2 injection in A Oilfield, cumulative oil production increased by 5.5 × 10⁴ t, accompanied by an obvious improvement in oil recovery.

4.4. Optimization Result

4.4.1. Enhancing Oil Recovery

According to the optimization result of injection-production parameters, the development plan for CAGD in A Oilfield was determined as follows:
In the initial stage, three CO2 injection wells located at the top of the anticlinal structure were used at an injection rate of 90,000 m3/d for intermittent injection, and the production wells were operated under the condition of an I-P ratio of 1.0. Once the oil-gas interface stabilized, two gas injection wells at the midsection of the anticlinal structure were used with an injection rate of 50,000 m3/d, in conjunction with the three top gas injection wells, for intermittent gas supplementation.
As shown in Figure 32 and Figure 33, the implementation of CAGD led to a substantial decrease in water cut and an increase in cumulative oil production. Compared to the scenario where CAGD was not employed, implementing CAGD resulted in effects whereby the water cut decreased by approximately 10%, the cumulative oil production increased by 15.76 × 10⁴ t, the sweep range expanded, and a favorable oil recovery was obtained.

4.4.2. CO2 Storage

From Figure 34, an observation could be made that using the CAGD method, a significant amount of CO2 remained within the reservoir. In this scheme, a total of 84 × 106 m3 of CO2 was injected, and the total gas production from the oil field amounted to 1.85 × 10⁶ m3. Considering that the produced gas from the production wells consisted of not only CO2 that had undergone miscible with the crude oil but also dissolved gases from the crude oil, it could be reasonably inferred that after ten years of implementation, a substantial amount of CO2 gas still accumulates at the top of the reservoir (Figure 35), with at least 82.15 × 10⁶ m3 of CO2 effectively sequestered in the reservoir. This signified a storage rate exceeding 90%, indicating highly effective CO2 storage.

5. Conclusions

In this study, the challenges of extracting residual oil in high water cut reservoirs with bottom water during development were addressed, and a CAGD technique was proposed. The oil displacement and CO2 storage mechanisms in CAGD were also explored. By establishing mechanistic models, the influencing factors of CAGD in oil reservoirs with bottom water were analyzed and investigated. The proposed technology was applied to an actual reservoir for simulation and optimization of the development program, resulting in the following conclusions and insights:
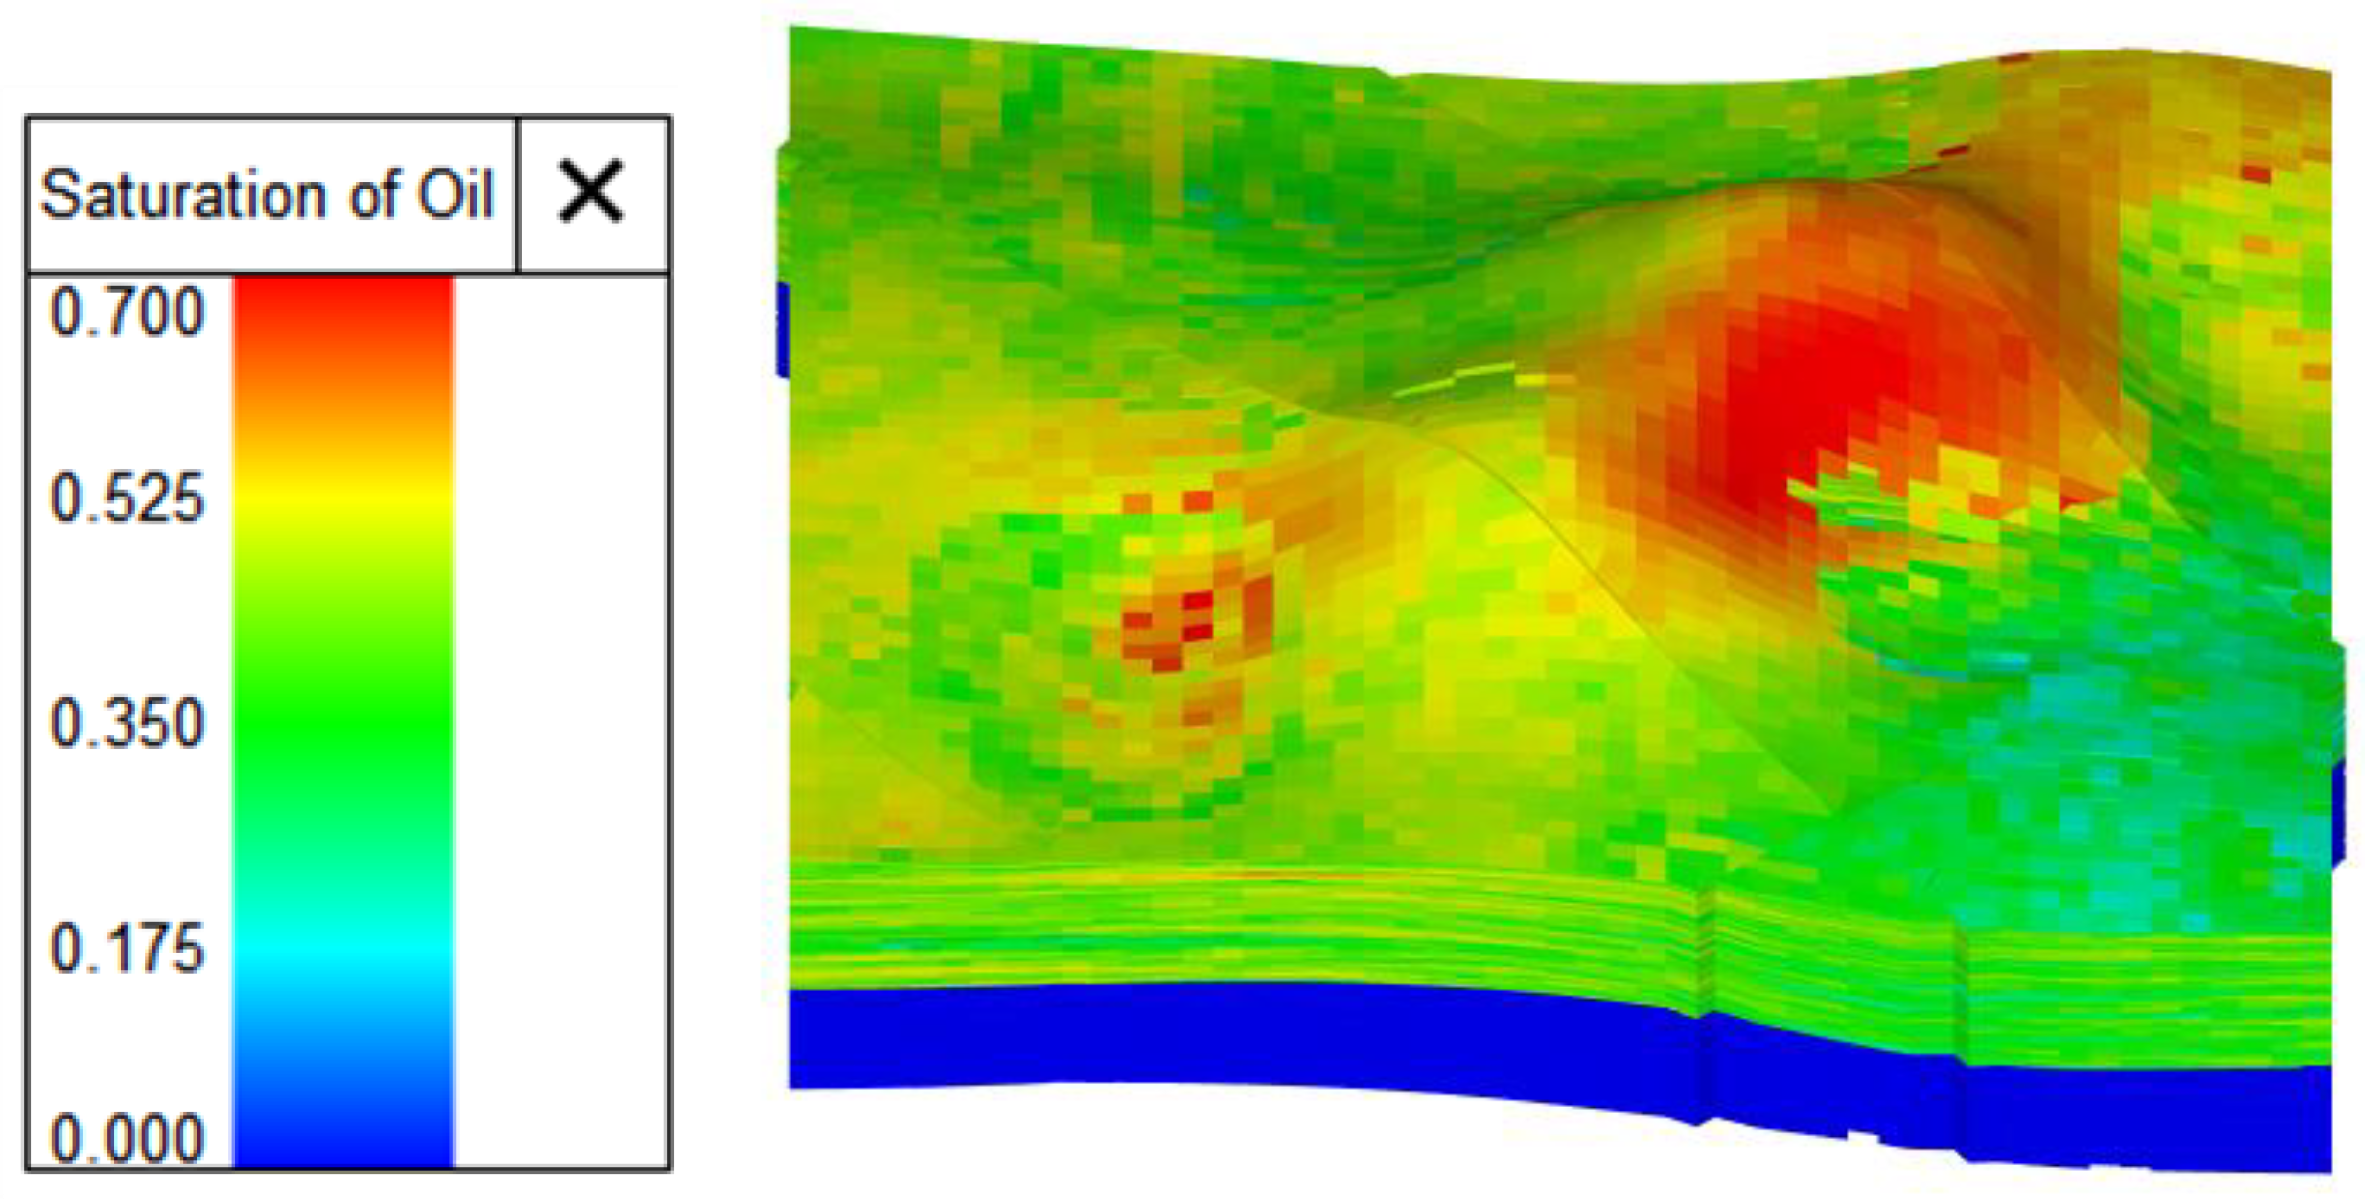
  • Reservoir structure, CO2 injection site, initial formation pressure, reservoir thickness, and CO2 injection rate were all significant factors that affected the effect of CAGD in oil reservoirs with bottom water. When there was an anticline in the reservoir, it was easier for CO2 to accumulate in the top to form a CO2 cap. In the context of CO2 injection, combining CO2 injection at both the top and waist regions achieved effective gravity differentiation in the shortest time while considering lateral sweep effects. When only top CO2 injection was employed, the lateral sweep effect was poor, and waist CO2 injection prolonged the gravity differentiation period. When the initial formation pressure was greater than the minimum miscible pressure, CO2 was prone to undergo miscible with the crude oil. This not only enhanced oil recovery but also improved the storage efficiency of CO2. In cases where the reservoir thickness was greater, achieving gravity differentiation became more challenging. Conversely, in reservoirs with insufficient reservoir thickness, CO2 spread rapidly. Moreover, as the CO2 injection rate increased, the CO2 sweep range gradually expanded. However, excessive CO2 injection rate could lead to CO2 breakthrough downward, thereby diminishing the effectiveness of lateral sweep.
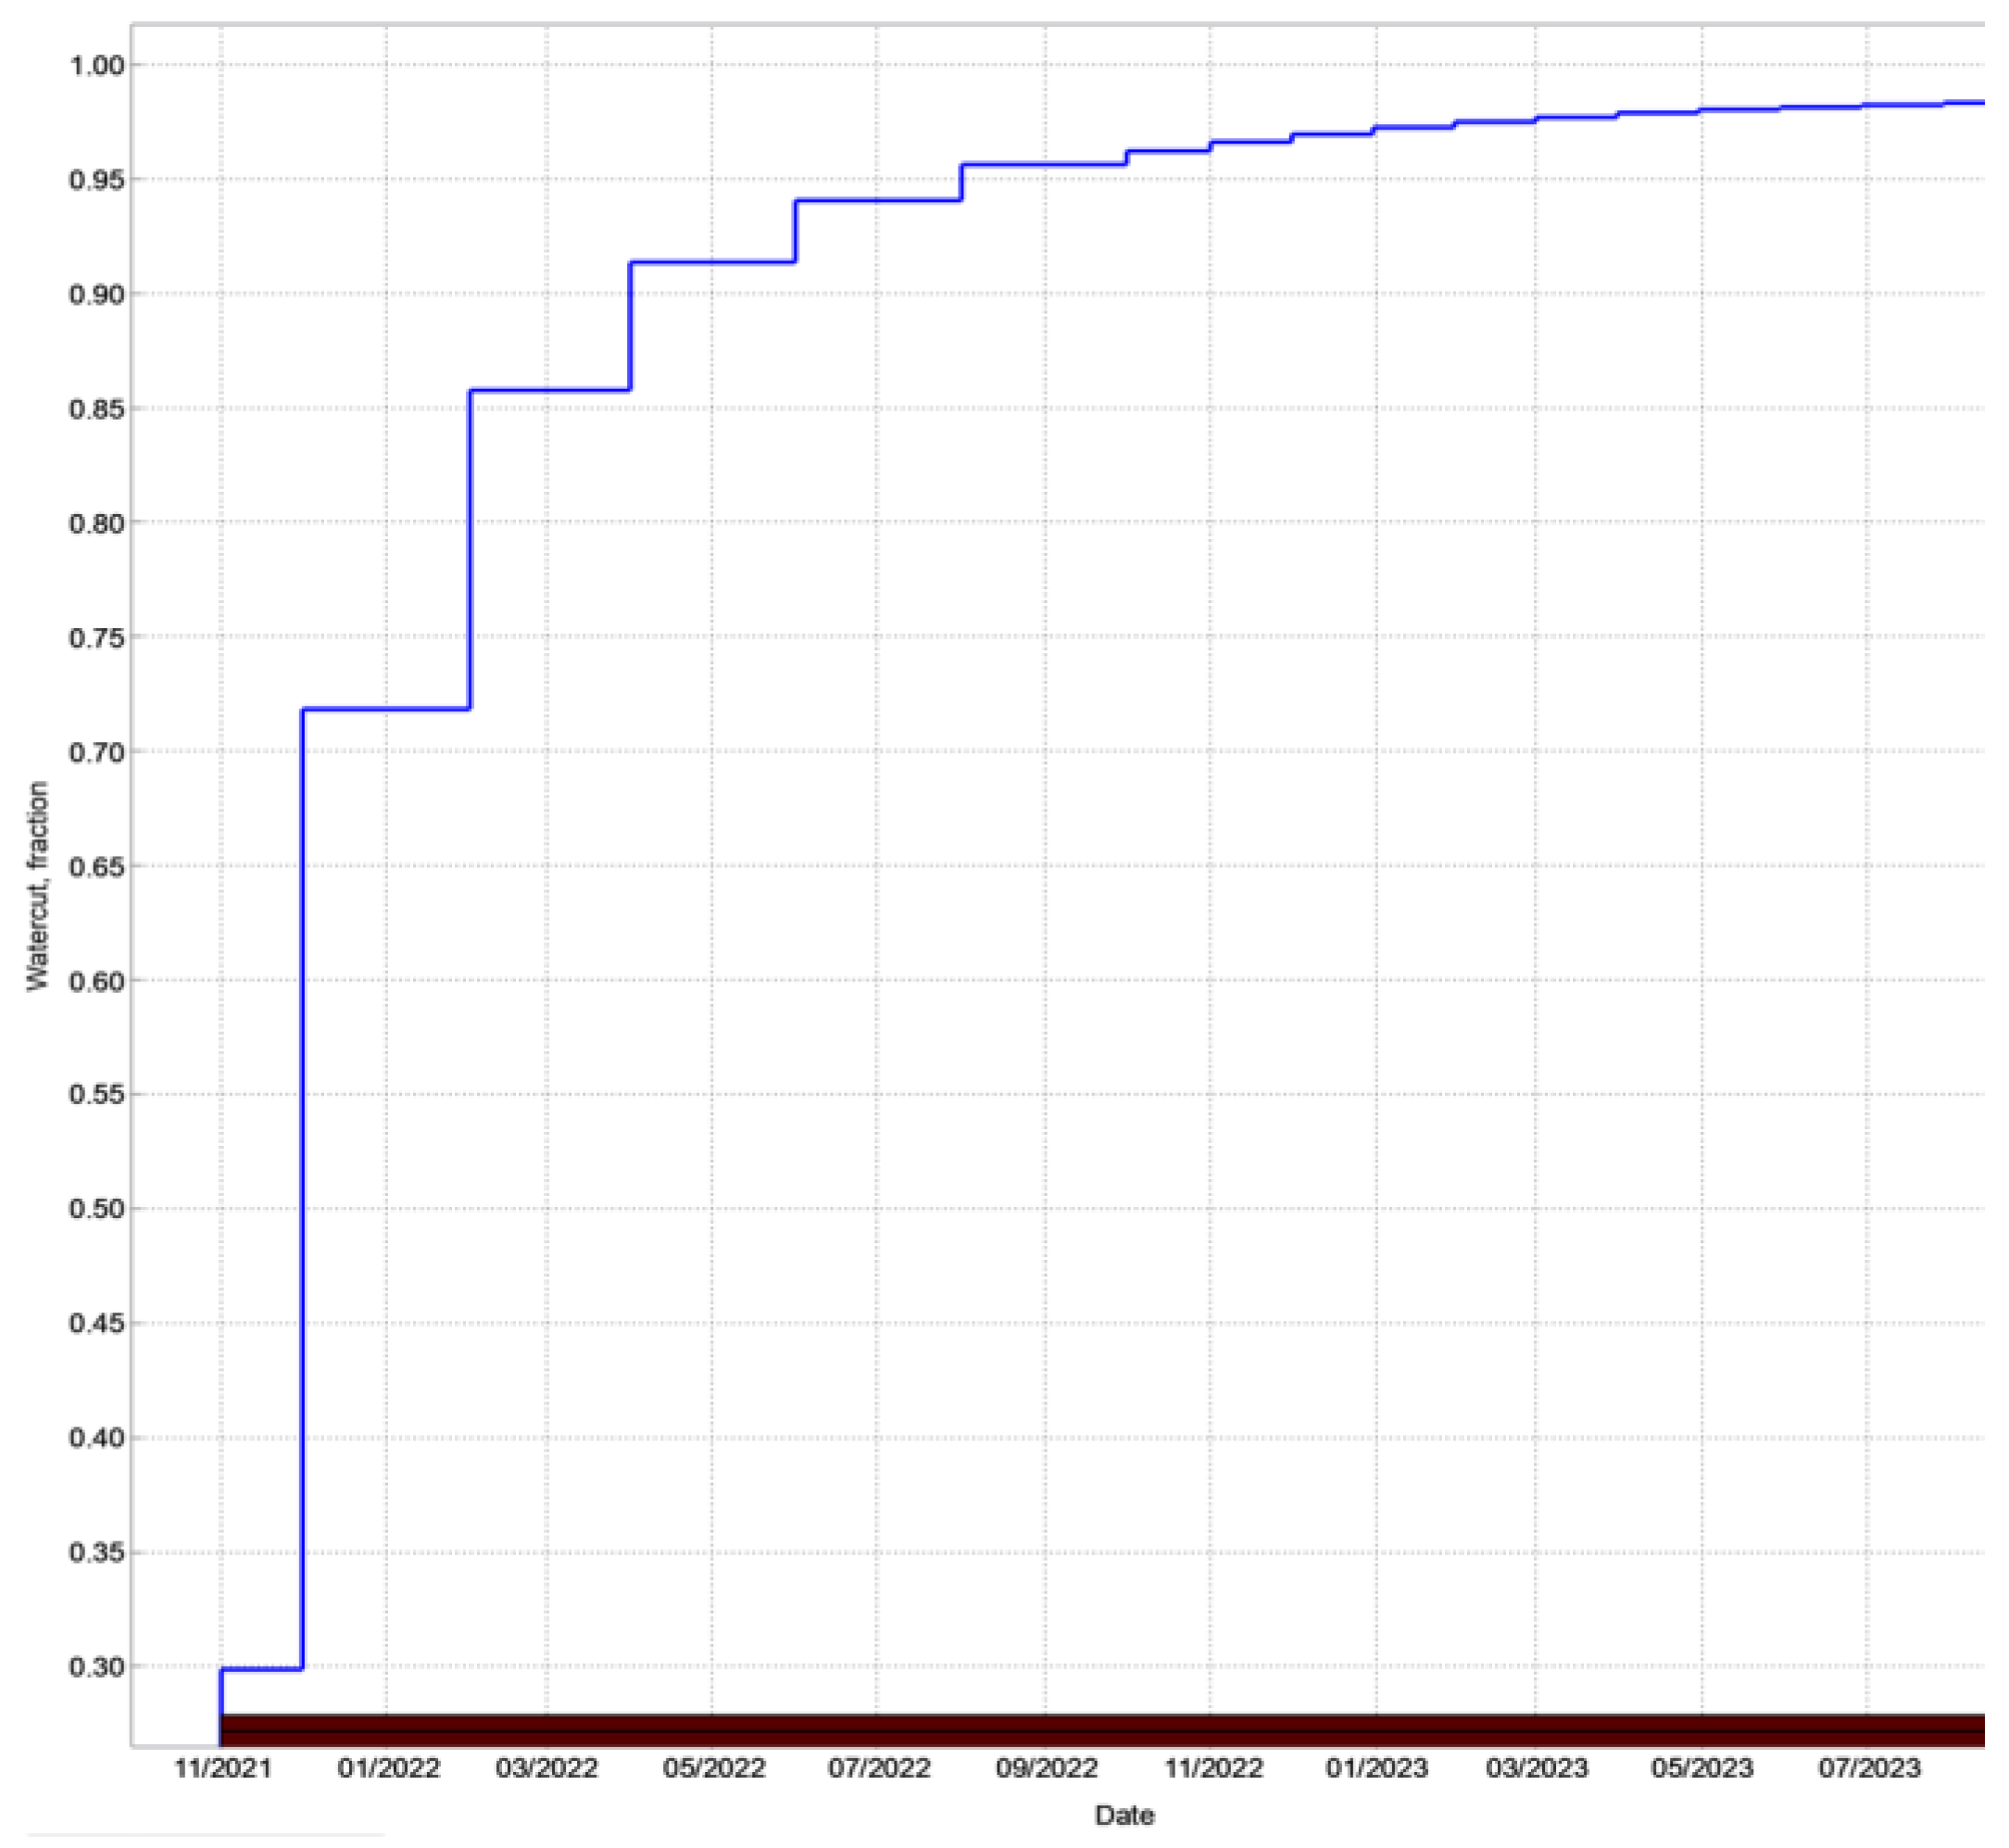
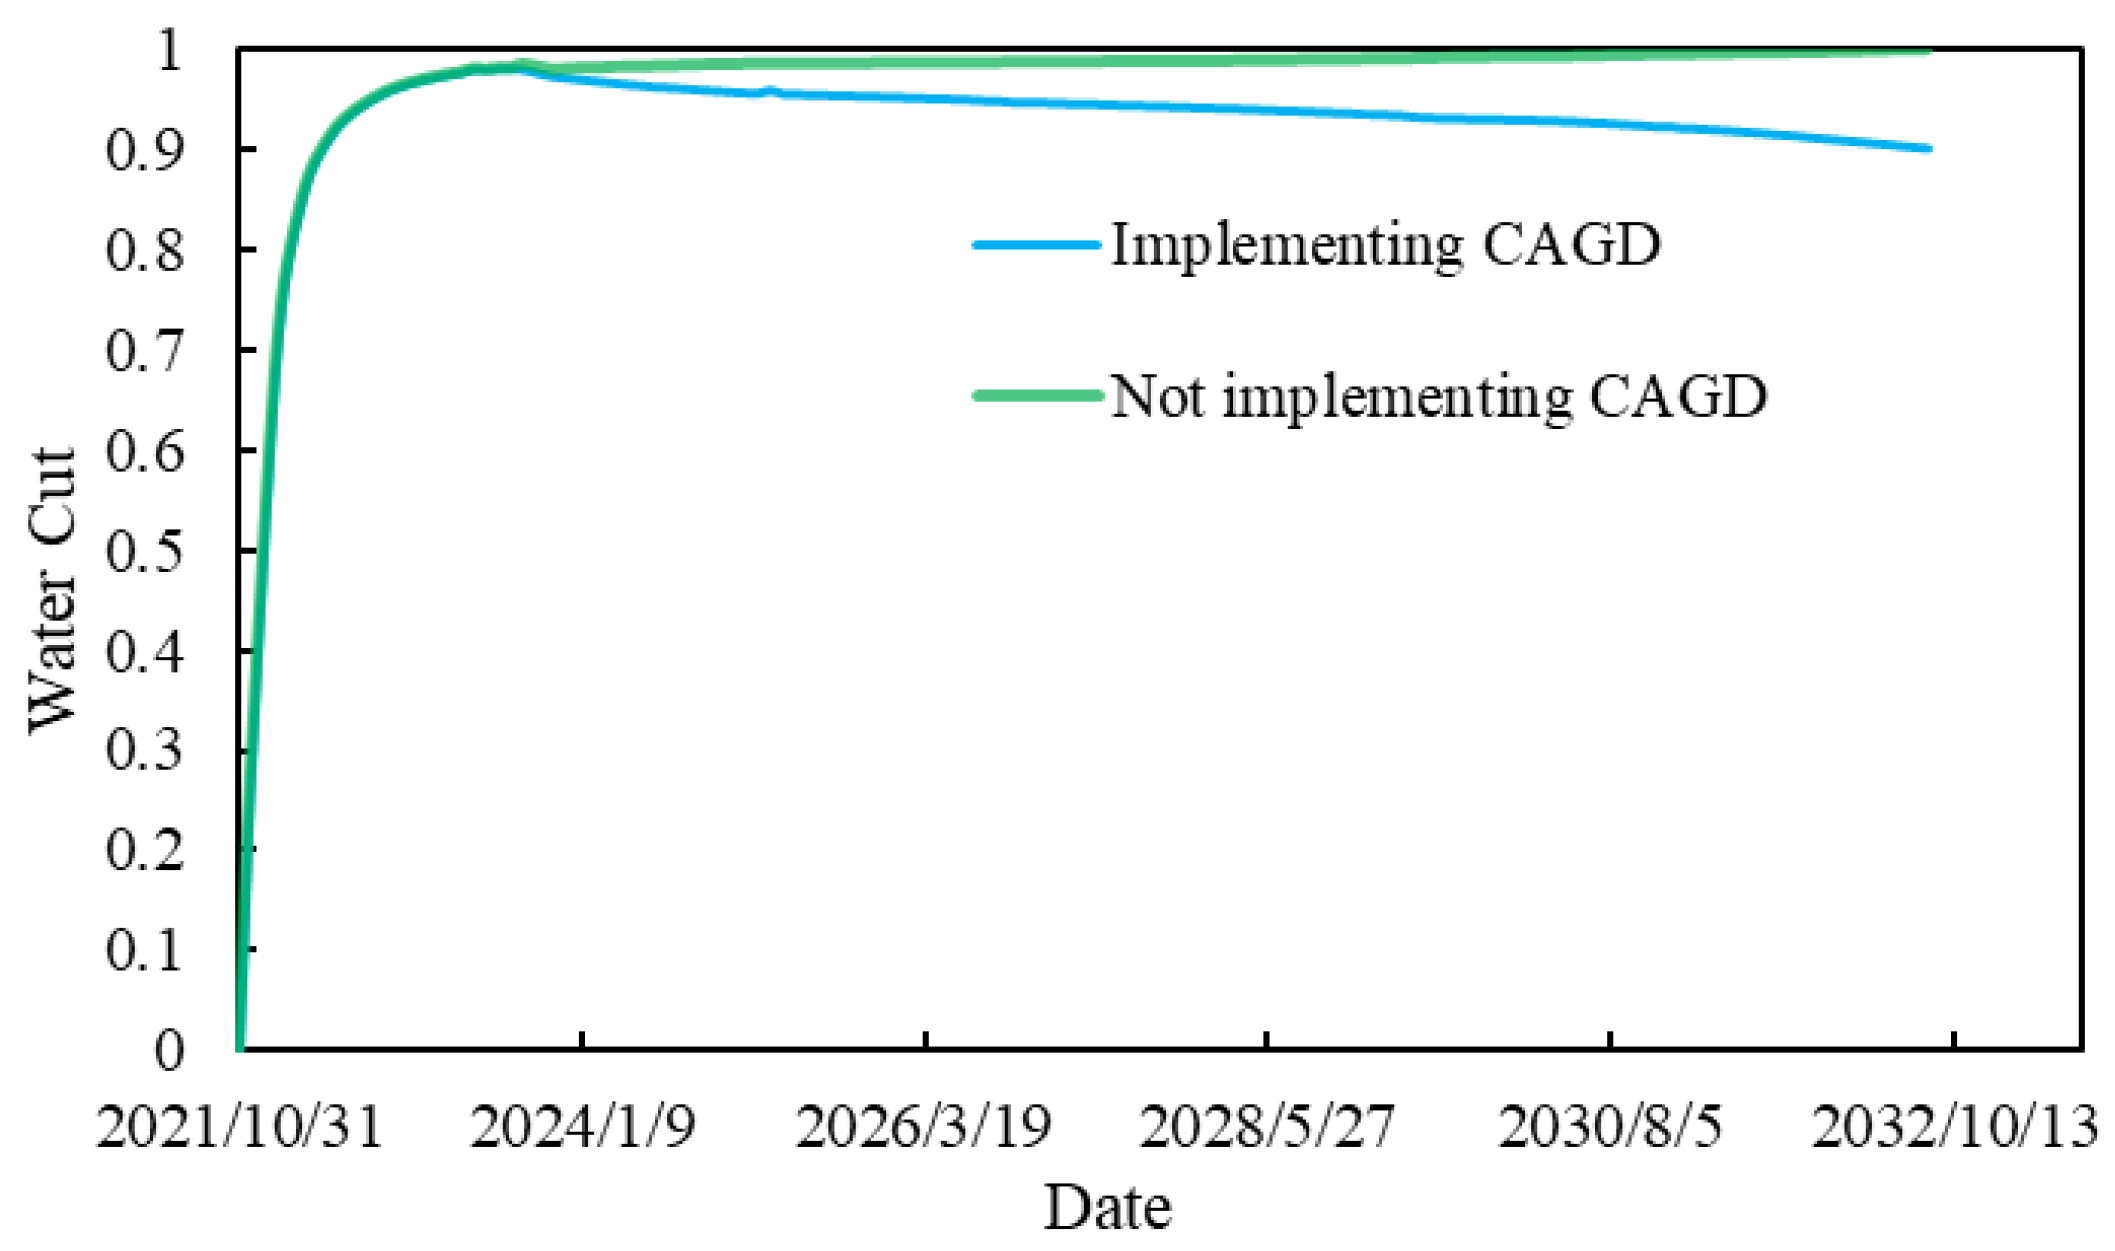
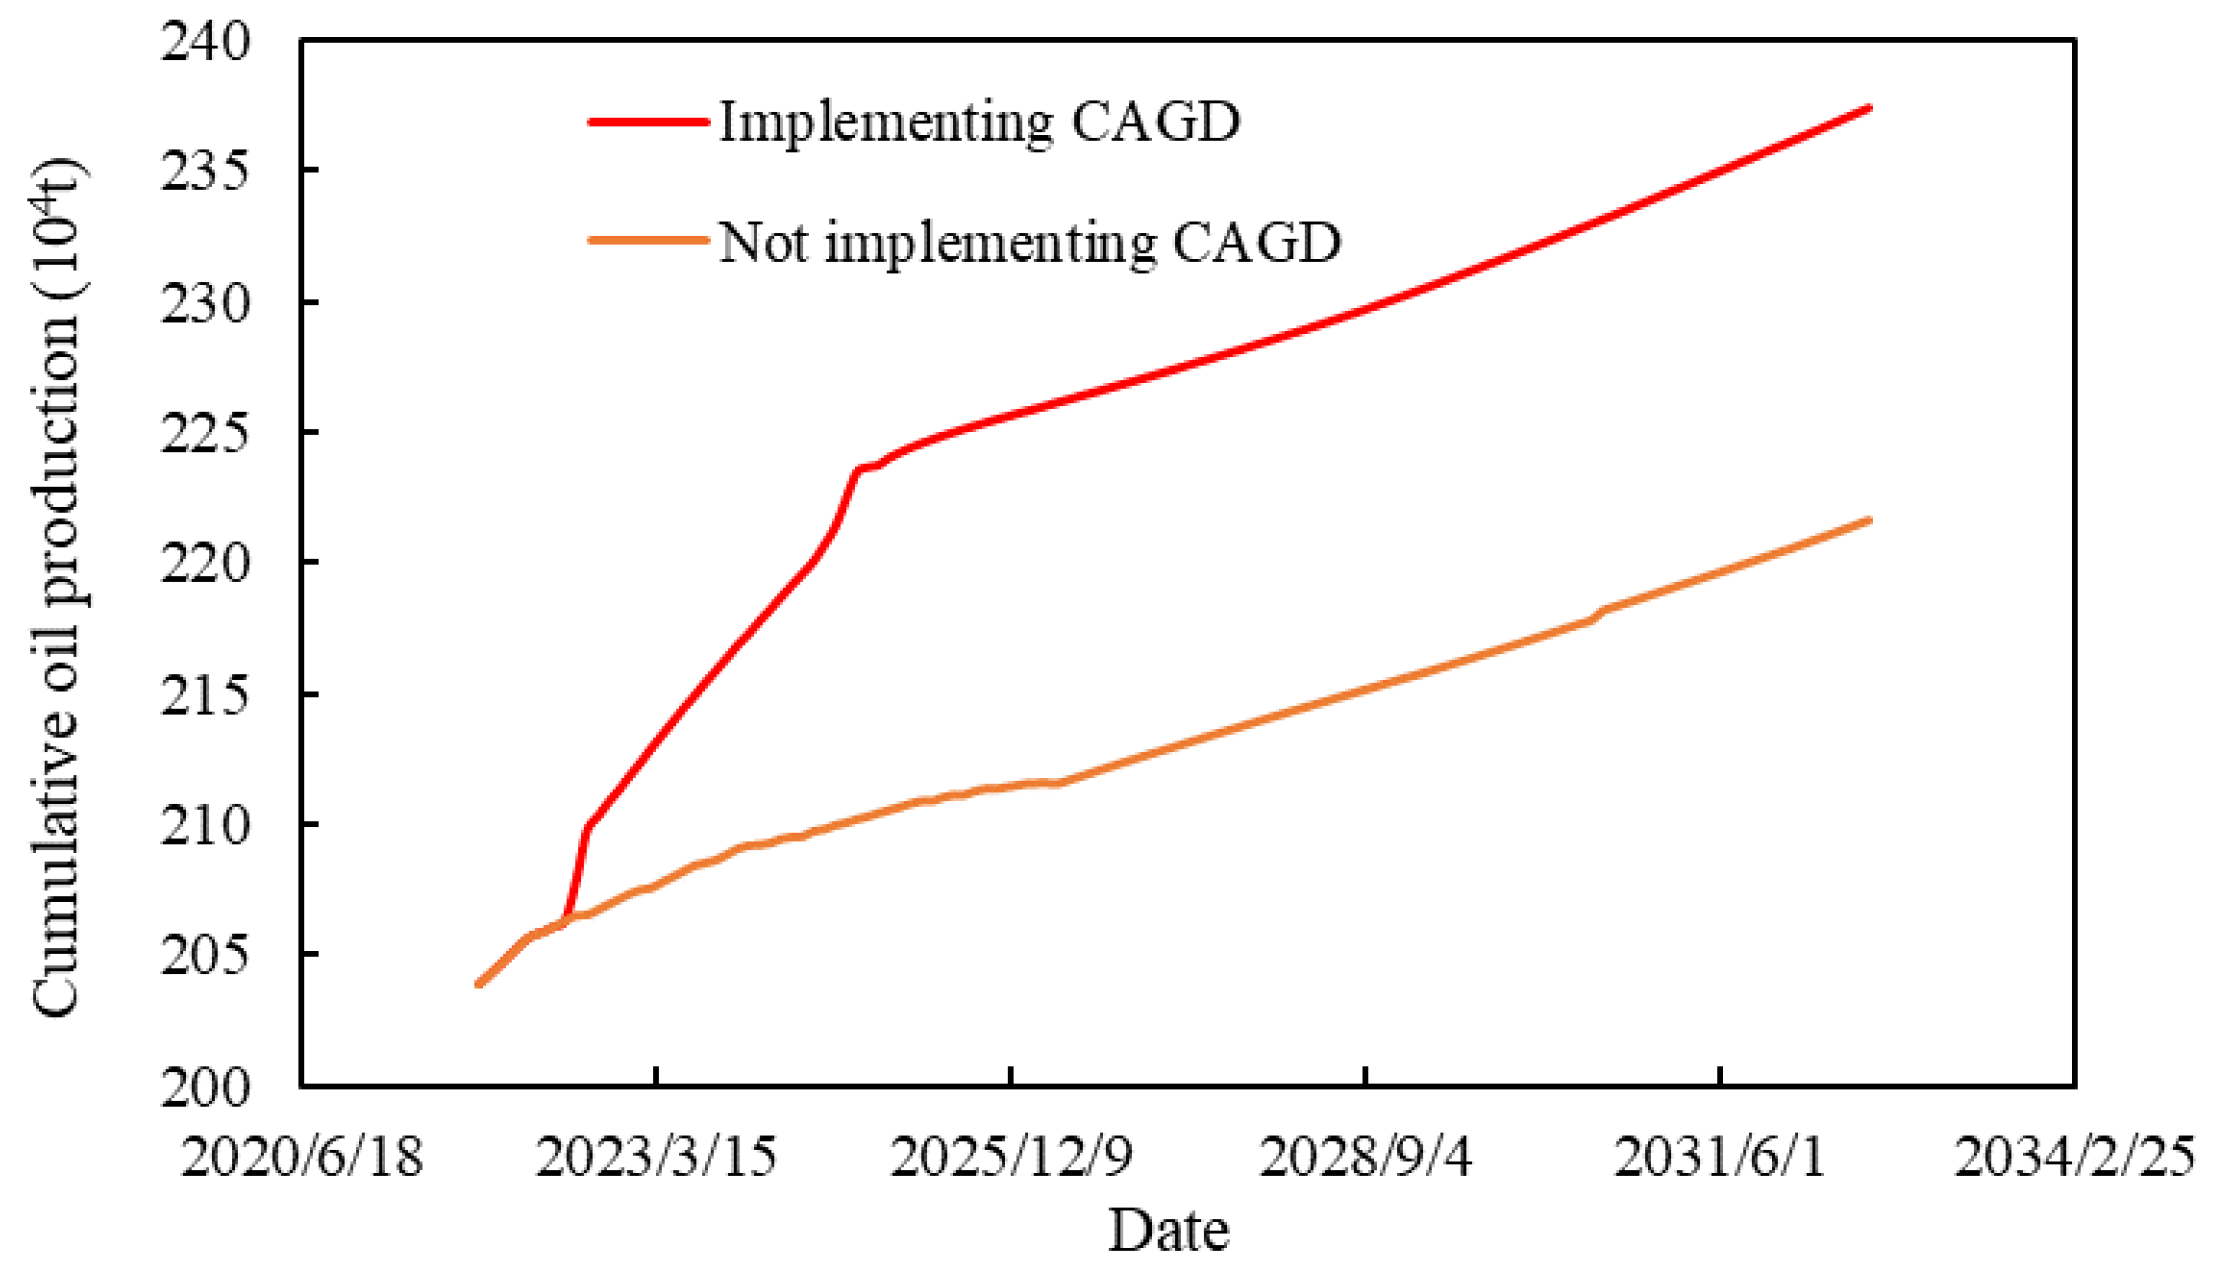
  • The application of the CAGD technique in extracting high position remaining oil in high water cut anticline reservoirs with bottom water was simulated using tNavigator software (V22.1) over a ten-year development period. After a decade of development, there was a significant reduction in water cut and the previously challenging-to-produce high position residual oil was effectively mobilized. The cumulative oil production in the A oilfield reached 23.74 × 10⁴ t, with a reduction in water cut of approximately 10%. Additionally, the CO2 storage effect was quite favorable, with a storage volume of approximately 82.15 × 10⁶ m3.
  • This paper investigated the influencing factors of CAGD and applied it to practical reservoirs, achieving favorable results. It provided theoretical and methodological guidance for implementing CAGD in similar reservoirs and also offered directions for researching CAGD technology in other types of reservoirs.

Author Contributions

Conceptualization, X.X. and H.L.; methodology, X.X.; software, G.Y.; validation, X.X., G.Y. and H.L.; formal analysis, J.Y.; investigation, J.Y.; resources, X.X.; data curation, X.X.; writing—original draft preparation, H.L.; writing—review and editing, X.X.; visualization, H.L.; supervision, X.X.; project administration, H.L. All authors have read and agreed to the published version of the manuscript.

Funding

This research was funded by the National Natural Science Foundation of China, grant number 52104020.

Data Availability Statement

All data generated or analyzed during this study are included in this published article.

Conflicts of Interest

The authors declare no conflict of interest.

References

  1. Lotrecchiano, N.; Sofia, D.; Giuliano, A.; Barletta, D.; Poletto, M. Pollution dispersion from a fire using a Gaussian plume model. Int. J. Saf. Secur. Eng. 2020, 10, 431–439. [Google Scholar] [CrossRef]
  2. Carpenter, C. Study Describes Challenges, Opportunities of CO2 EOR in China. J. Pet. Technol. 2022, 74, 87–89. [Google Scholar] [CrossRef]
  3. Novikov, D.A.; Dultsev, F.F.; Yurchik, I.I.; Sadykova, Y.V.; Derkachev, A.S.; Chernykh, A.V.; Maksimova, A.A.; Golovin, S.V.; Glavnov, N.G.; Zhukovskaya, E.A. Regional forecast of the outlooks for underground disposal of carbon dioxide at the territory of the Russian Federation. Oil Ind. J. 2022, 2022, 36–42. (In Russian) [Google Scholar] [CrossRef]
  4. Kaipov, Y.; Theuveny, B.; Maurya, A.; Alawagi, A. CO2 Injectivity Test Proves the Concept of CCUS Field Development. In Proceedings of the ADIPEC, Abu Dhabi, United Arab Emirates, 2–5 October 2023. [Google Scholar] [CrossRef]
  5. Zakharevich, Y.S.; Erikssen, K.I. Carbon dioxide sequestration technology—Assessment of efficiency improvement opportunities. Oil Ind. J. 2022, 2022, 137–141. (In Russian) [Google Scholar] [CrossRef]
  6. Jenvey, N. Technology Focus: Decarbonization (July 2022). J. Pet. Technol. 2022, 74, 80. [Google Scholar] [CrossRef]
  7. Dou, L.; Sun, L.; Lu, W.; Wang, M.; Gao, F.; Cao, M.; Jiang, H. Trend of global carbon dioxide capture, utilization and storage industry and challenges and countermeasures in China. Pet. Explor. Dev. 2023, 50, 1083–1096. [Google Scholar] [CrossRef]
  8. Feder, J. Industry Continues to Make Progress on Carbon Capture. J. Pet. Technol. 2019, 71, 24–30. [Google Scholar] [CrossRef]
  9. Jacobs, T. CO2 EOR Could Be Industry’s Key to a Sustainable Future or Its Biggest Missed Opportunity. J. Pet. Technol. 2020, 72, 17–20. [Google Scholar] [CrossRef]
  10. Guo, X.; Feng, J.; Wang, P.; Kong, B.; Wang, L.; Dong, X.; Guo, S. Review on the Mechanism of CO2 Storage and Enhanced Gas Recovery in Carbonate Sour Gas Reservoir. Processes 2023, 11, 164. [Google Scholar] [CrossRef]
  11. Zhigulina, D.I.; Prudskiy, M.Y.; Malyshev, B.V.; Klimov, V.Y.; Liutkov, A.V.; Litra, A.N.; Rudnov, I.R.; Cheriavco, A.V. Carbon capture, use and storage pilot project on the example of Salym group of fields (Russian). Oil Ind. J. 2022, 2022, 64–69. [Google Scholar] [CrossRef]
  12. Cui, W.; Wang, C. Carbon Capture, Utilization and Storage (CCUS) in Tight Oil Reservoir. In Proceedings of the ADIPEC, Abu Dhabi, United Arab Emirates, 2–5 October 2023. [Google Scholar] [CrossRef]
  13. Stright, D.H.; Aziz, K. Carbon Dioxide Injection Into Bottom-Water, Undersaturated Viscous Oil Reservoirs. J. Pet. Technol. 1977, 29, 1248–1258. [Google Scholar] [CrossRef]
  14. Li, Y.; Lu, X.G.; Li, H.R.; Zhang, J.; Wang, X.; Cui, D.; Kuai, J. Study on CO2 huff and puff effect of increasing oil production after chemical flooding based on bottom water reservoir simulation model: Take bottom water reservoir of Dagang A OILFIELDs an example. Pet. Geol. Dev. Daqing 2022, 41, 101–111. [Google Scholar] [CrossRef]
  15. Hao, H.; Hou, J.; Zhao, F.; Wang, Z.; Fu, Z.; Li, W.; Wang, P.; Zhang, M.; Lu, G.; Jian, Z. Synergetic CO2 Huff-n-Puff for Edge-Water Fault-Block Reservoir: Experimental and Numerical Simulation. In Proceedings of the Carbon Management Technology Conference, Houston, TX, USA, 17–20 July 2017. [Google Scholar] [CrossRef]
  16. Chen, X. Influence of miscibility and gravity on CO2 flooding for oil recovery enhancement and storage potential. Pet. Geol. Dev. Daqing 2023, 1–7. [Google Scholar] [CrossRef]
  17. Zhou, Y.; Zhao, S.; He, Y.; Wang, R. Optimum selection of CO2 gravity-stable flooding reservoir based on response surface methodology. Fault Block Oil Gas Field 2019, 26, 761–765. [Google Scholar]
  18. Tham, S.L. A Simulation Study of Enhanced Oil Recovery Using Carbon Dioxide Foam in Heterogeneous Reservoirs. In Proceedings of the SPE Annual Technical Conference and Exhibition, Houston, TX, USA, 28–30 September 2015. [Google Scholar] [CrossRef]
  19. Shtepani, E. Experimental and Modeling Requirements for Compositional Simulation of Miscible CO2-EOR Processes. In Proceedings of the SPE/EAGE Reservoir Characterization and Simulation Conference, Abu Dhabi, United Arab Emirates, 28–30 October 2007. [Google Scholar] [CrossRef]
  20. Xu, S.; Al Keebali, A.; Baslaib, M.; BinAmro, A.A.; Ali, I.; Vantala, A.; El Yosef, B.; Abdelazim, M.F.; Perumalla, S.; Mascagnini, C.; et al. CO2 Storage in a Giant Depleted Carbonate Gas Reservoir-Addressing Feasibility and Design Challenges with Field Data. In Proceedings of the ADIPEC, Abu Dhabi, United Arab Emirates, 2–5 October 2023. [Google Scholar] [CrossRef]
  21. Nasralla, R.; Farajzadeh, R.; Ketkar, S.; Van Wunnik, J.; Mahruqi, D.; Al Mjeni, R. Towards Low Carbon Oil—A Comprehensive Portfolio Analysis for CO2 EOR/CCUS Opportunities in Oil Reservoirs in the Sultanate of Oman. In Proceedings of the ADIPEC, Abu Dhabi, United Arab Emirates, 31 October–3 November 2022. [Google Scholar] [CrossRef]
  22. Zhao, L. Study on Development Technical Countermeasures of Artificial Gas Cap Drive in Fault Block Reservoir; China University of Petroleum (Beijing): Beijing, China, 2021. [Google Scholar] [CrossRef]
  23. Zhao, R.B.; Ke, W.Q.; Wu, Y.H.; Zhao, H.Y.; Yue, X.A. Enhanced Heavy Oil Recovery from Fractured Vuggy Carbonated Reservoir of Tahe Oilfield with N2/CO2 Gas Mixture. In Proceedings of the International Oil and Gas Conference and Exhibition in China, Beijing, China, 8–10 June 2010. [Google Scholar] [CrossRef]
  24. Song, Z.; Hou, J.; Liu, Z.; Zhao, F.; Huang, S.; Wang, Y.; Wu, J.; Bai, B. Nitrogen Gas Flooding for Naturally Fractured Carbonate Reservoir: Visualisation Experiment and Numerical Simulation. In Proceedings of the SPE Asia Pacific Oil & Gas Conference and Exhibition, Perth, Australia, 25–27 October 2016. [Google Scholar] [CrossRef]
  25. Madahar, A.; George, S.; Gringarten, A.C. Effect of Material Balance on Well Test Analysis. In Proceedings of the SPE Annual Technical Conference and Exhibition, New Orleans, LA, USA, 4–7 October 2009. [Google Scholar] [CrossRef]
  26. Xu, T.; Liao, H.; He, Y.; Nie, J.; Cui, M.; Guo, Y. Favorable Target Optimization for CO2 Flooding in Deep Block Sandstone Reservoir with Bottom Water: A Case Study of Northwest Oilfield M Reservoir. In Proceedings of the International Petroleum Technology Conference, Riyadh, Saudi Arabia, 21–23 February 2022. [Google Scholar] [CrossRef]
  27. Zeng, X. The Study on Policy Optimization of Huff and Puff Type of Secondary Gas Cap Drive Technique; China University of Petroleum (East China): Dongying, China, 2021. [Google Scholar] [CrossRef]
  28. Seyyedsar, S.M.; Farzaneh, S.A.; Sohrabi, M. Enhanced Heavy Oil Recovery by Intermittent CO2 Injection. In Proceedings of the SPE Annual Technical Conference and Exhibition, Houston, XT, USA, 28–30 September 2015. [Google Scholar] [CrossRef]
  29. Zhao, Y. Research on Technology Policy of Fault Block Oil Reservoir Artificial Gas Cap Displacement of Oil; China University of Petroleum (Beijing): Beijing, China, 2020. [Google Scholar] [CrossRef]
Figure 1. Distribution of oil saturation in A Oilfield.
Processes 11 03290 g001
Figure 2. Schematic diagram of water cut change in A Oilfield.
Processes 11 03290 g002
Figure 3. Oil and water distribution before CAGD.
Processes 11 03290 g003
Figure 4. Oil, gas, and water distribution after CAGD.
Processes 11 03290 g004
Figure 5. Oil-water relative permeability curve.
Processes 11 03290 g005
Figure 6. Oil-gas relative permeability curve.
Processes 11 03290 g006
Figure 7. Diagram of well locations and perforation arrangement.
Processes 11 03290 g007
Figure 8. Oil saturation profile before (left) and after (right) CO2 injection in non-anticline reservoir.
Processes 11 03290 g008
Figure 9. Oil saturation profile before (left) and after (right) CO2 injection in anticline reservoir.
Processes 11 03290 g009
Figure 10. Horizontal grid gas saturation diagrams after CO2 injection with different structures.
Processes 11 03290 g010
Figure 11. Oil saturation after top CO2 injection.
Processes 11 03290 g011
Figure 12. Oil saturation after lumbar CO2 injection.
Processes 11 03290 g012
Figure 13. Oil saturation after top-waist combined CO2 injection.
Processes 11 03290 g013
Figure 14. Horizontal grid gas saturation diagram after CO2 injection with different CO2 injection sites.
Processes 11 03290 g014
Figure 15. Oil saturation after CO2 injection under an initial formation pressure of 12 MPa.
Processes 11 03290 g015
Figure 16. Oil saturation after CO2 injection under an initial formation pressure of 22 MPa.
Processes 11 03290 g016
Figure 17. Oil saturation after CO2 injection under an initial formation pressure of 32 MPa.
Processes 11 03290 g017
Figure 18. Horizontal grid gas saturation after CO2 injection with different initial formation pressure.
Processes 11 03290 g018
Figure 19. Oil saturation profile before (left) and after (right) CO2 injection when the reservoir thickness was 5 layers.
Processes 11 03290 g019
Figure 20. Oil saturation profile before (left) and after (right) CO2 injection when the reservoir thickness was 10 layers.
Processes 11 03290 g020
Figure 21. Oil saturation profile before (left) and after (right) CO2 injection when the reservoir thickness was 15 layers.
Processes 11 03290 g021
Figure 22. Horizontal grid gas saturation diagram after CO2 injection with different reservoir thicknesses.
Processes 11 03290 g022
Figure 23. Oil saturation under CO2 injection rate of 25,000 m3/d.
Processes 11 03290 g023
Figure 24. Oil saturation under CO2 injection rate of 35,000 m3/d.
Processes 11 03290 g024
Figure 25. Oil saturation under CO2 injection rate of 45,000 m3/d.
Processes 11 03290 g025
Figure 26. Horizontal grid gas saturation diagram after CO2 injection with different injection rates.
Processes 11 03290 g026
Figure 27. Sketch diagram of CO2 injection well locations.
Processes 11 03290 g027
Figure 28. Top view of gas saturation of continuous CO2 injection (left) and intermittent CO2 injection (right).
Processes 11 03290 g028
Figure 29. Cumulative oil production and oil exchange rate at different CO2 injection rates.
Processes 11 03290 g029
Figure 30. Cumulative oil production under different I-P ratios.
Processes 11 03290 g030
Figure 31. Cumulative oil production before and after supplementary CO2 injection.
Processes 11 03290 g031
Figure 32. Water cut comparison chart between implementing CAGD and not implementing CAGD.
Processes 11 03290 g032
Figure 33. Cumulative oil production comparison chart between implementing CAGD and not implementing CAGD.
Processes 11 03290 g033
Figure 34. Three-phase saturation diagram after CAGD.
Processes 11 03290 g034
Figure 35. Gas saturation profile of formation after CAGD.
Processes 11 03290 g035
Table 1. Basic parameters of the model.
ParameterNumerical Value
grid number12 × 10 × 22
grid size in X, Y, Z direction, m100, 100, 5
Initial porosity, %15
Initial permeability in X direction, mD20
Initial permeability in Y direction, mD20
Initial permeability in Z direction, mD20
Initial oil-water interface, m3250
Minimum miscible pressure, MPa22
Rock compression coefficient, MPa−11.45 × 10⁻⁴
Table 2. Information about crude oil components.
Crude Oil ComponentMolar Content (%)
N20.29
CO21.17
C153.78
C26.93
C3–68.14
C7–1722.50
C18+7.20
Table 3. Design of injection mode.
SchemeGas Well Injection Mode
1Continuous gas injectionMonthly
2Intermittent gas injectionInject 4 months; stop for 2 months
Table 4. Cumulative oil production and oil exchange rate at different CO2 injection rates.
Gas Injection Rate
(m3/d)
Cumulative Oil Production
(104 t)
Oil Exchange Rate
(t/m3)
50,000200.2640.091
70,000220.6250.080
90,000232.1850.073
110,000198.7170.055
Table 5. Cumulative oil production under different I-P ratios.
I-P RatioCumulative Oil Production (104 t)
0.7207.064
0.8214.269
0.9224.357
1.0232.185
1.1235.185
Disclaimer/Publisher’s Note: The statements, opinions and data contained in all publications are solely those of the individual author(s) and contributor(s) and not of MDPI and/or the editor(s). MDPI and/or the editor(s) disclaim responsibility for any injury to people or property resulting from any ideas, methods, instructions or products referred to in the content.

