Article

Effect of Interaction between Carbon Dioxide and Fluid Phase/Rock Interface on Carbon Dioxide Storage

1
School of Petroleum Engineering, China University of Petroleum (East China), Qingdao 266580, China
2
Exploration and Development Research Institute, Shengli Oilfield Company, Sinopec, Dongying 257015, China
*
Author to whom correspondence should be addressed.
Processes 2023, 11(12), 3331; https://doi.org/10.3390/pr11123331
Submission received: 23 October 2023 / Revised: 15 November 2023 / Accepted: 17 November 2023 / Published: 30 November 2023

Abstract

:
The interaction between CO2, formation water, and rock surfaces after CO2 flooding and the mechanism by which it affects CO2 storage were studied in this paper. The results show that variations in the solubility of CO2 in crude oil under pressure are similar to those observed in formation water. The solubility of CO2 increases as pressure increases under a low-pressure conditions. The solubility of CO2 in crude oil increases significantly when crude oil is in a low-viscosity state, and this makes it easier to diffuse CO2 into the oil phase at high temperatures. More resistance is encountered when CO2 diffuses into the liquid-containing space of an irregular core, making the coefficient of diffusion into the oil–water two-phase flow in the porous medium smaller. After the core is corroded by a CO2-saturated aqueous solution, the quartz content in the mineral component increases and the plagioclase and potassium feldspar content significantly decrease. The dissolution of the feldspar leads to the formation of a large amount of secondary kaolinite, thus increasing the kaolinite content. In the early stage of CO2 erosion during dynamic displacement, the combined effect of particle migration and inorganic precipitation leads to a slow growth in core permeability and porosity. As the erosion progresses, the influence of particle migration and inorganic precipitation on permeability gradually decreases, while the porosity of the core gradually increases. The secondary pores play a role, and the erosion of the CO2–water system makes the permeability and porosity of the core gradually increase. During dynamic displacement, CO2 is mainly stored in the reservoir in free and irreducible states. Under the pressure of the reservoir, some of the CO2 participates in erosion reactions and is stored in the rock or the solution in the form of minerals or ions. In addition, a small portion of the CO2 is dissolved in the residual water and residual oil that remain after the dynamic displacement. The results of this paper can provide some theoretical support for the design of a CO2 storage site.

1. Introduction

The storage of CO2 in oil and gas reservoirs is the best among the various methods of CO2 storage. Although the theoretical storage amount is small, oil and gas reservoirs are the preferred sites for underground CO2 storage from the perspective of economy and safety [1,2]. An oil reservoir is a closed environment with a high temperature and high pressure, and it contains crude oil and formation water. The properties of the rock in an underground reservoir are completely different from those of rocks found aboveground. After the injection of CO2, the temperature and pressure of the formation gradually return to their initial state, and the interaction between the CO2, crude oil, and formation water also rebalance [3,4]. After CO2 is injected into the formation, some will displace the space in the reservoir originally occupied by the oil and water, and some will be dissolved in the residual oil and formation water. New minerals are generated by geochemical reactions between the CO2 and the rock. Due to the multiphase flow of oil and gas/water in the capillaries of porous media, some of the CO2 is confined in the pores and cannot flow in its bound state, while the rest of the undissolved CO2 exists in a free state [5]. In addition, the static parameters and injection parameters of the CO2 in the CCUS (Carbon Capture, Utilization, and Storage) project affect the final storage capacity and storage state of the CO2 [6,7,8].
Detailed laboratory studies on the physical properties of CO2–crude oil systems and CO2–formation water systems have been carried out by many scholars at home and abroad. The effects of different temperatures and pressures on the solubility and diffusion coefficient of CO2 in oil/water have been measured through laboratory experiments [9,10,11,12,13]. The ability of CO2 to dissolve in oil/water after injection into a reservoir has significance for the study of the laws affecting the storage of CO2 in reservoirs. The law governing the erosion of CO2 in heavy oil systems was studied in detail by Miller and Jones using dehydrated and degassed heavy oil from three different oilfields in the eastern United States [14]. Experimental temperatures of 25 °C, 50 °C, and 90 °C were selected, and the experimental pressure range was 1.5~36 MPa. When the experimental temperature was 25 °C, the CO2 solubility curve had an inflection point at its saturation pressure. After exceeding the saturation pressure, the physical properties of the CO2 changed. The diffusion coefficient determines the erosion rate and diffusion efficiency of CO2 in reservoir fluid and ultimately affects the spread range and storage rate of CO2 as well as the crude oil recovery. Therefore, it is very important to establish a diffusion mass transfer model using molecular diffusion and to study the diffusion law of CO2 in its liquid phase. A physical model of the diffusion of CO2 into its liquid phase using a constant-volume PVT cell was constructed by Riazi [15]. The pressure change–time function and the liquid level position–time function were linked with the diffusion coefficient by Riazi. The diffusion coefficient was obtained by determining the change in the gas–liquid boundary position with time and the change in pressure with time at a constant temperature. This method was used to obtain measurements from a methane–pentane system at 311 K and 7 MPa, and the corresponding data errors were all below 5%.
After CO2 is injected into a formation, some of the CO2 is retained in the formation water in a dissolved state, and the rest of the CO2 produces an acidic liquid with the formation water which corrodes the rock minerals. CO2 is consumed via the mineralization reaction. New secondary minerals are generated and stored in the formation or extracted with the fluid. The CO2–water–rock interactions play a role in the storage of CO2, that is, mineralized storage [16,17,18]. The erosion reaction between CO2 and albite was studied by Ryzhenko et al. at different temperatures [19]. Their results showed that the degree to which the albite eroded intensified as the temperature increased, and dawsonite was formed at 150 °C. lzgec et al. [20] evaluated the influence of CO2 injection pressure, reservoir temperature, and formation water salinity on the chemical equilibrium of carbonate rocks and feldspar minerals as well as the variability of porosity and permeability parameters by means of various laboratory experiments. According to their experimental data, the permeability and porosity trends were basically the same when the temperature was between 20 °C and 60 °C. When the CO2 injection pressure was 2.0 MPa, the permeability decreased by 58.4%.
Some research into methods for improving CO2 storage rates during dynamic flooding has been carried out by experts and scholars at home and abroad in recent years [21,22,23,24]. Numerical simulation software was used by Yao et al. [25] to study the influences of reservoir porosity, permeability parameters, fluid properties, and injection methods on CO2 flooding/storage. By analyzing the retention ratio of CO2 and the recovery degree of crude oil, insight into the influences of these different factors on the storage rate and recovery rate of CO2 flooding was obtained.
The purpose of this paper is to systematically study the static parameters and the dynamic parameters of CO2 after it is injected into reservoirs through various macro and micro means, including ICP (ion chromatography), XRD (X-ray diffraction), SEM (scanning electron microscopy), NMR (nuclear magnetic resonance), static erosion, and core flooding. In addition, the interactions between CO2, crude oil, formation water, and the rock surface after the CO2 entered the formation was also analyzed to assist in the analysis of the internal mechanisms and the potential of CO2 storage in reservoirs. This will provide a theoretical basis for the design of CO2 flooding/storage sites.

2. Experimental Part

2.1. Experimental Materials

Carbon dioxide was produced by Hubei New Reed Special Gas Company (Wuhan, China) with a purity of 99.9%. The formation water was derived from the Shengli Oilfield. The specific ion composition and salinity data of the formation water samples are shown in Table 1. The oil samples were also derived from the Shengli Oilfield, and the basic physical properties and composition of the three crude oil samples are shown in Table 2. The cores used in the experiments were natural sandstone, which was derived from a block from the Shengli Oilfield. The cores were deoiled and dehydrated with toluene and alcohol before the experiments, and the basic data of the cores are shown in Table 3, Table 4 and Table 5. The basic core data for the diffusion of porous media and static erosion are shown in Table 3 and Table 4, respectively. The physical parameters of the long cores used in the dynamic flooding experiment are shown in Table 5.

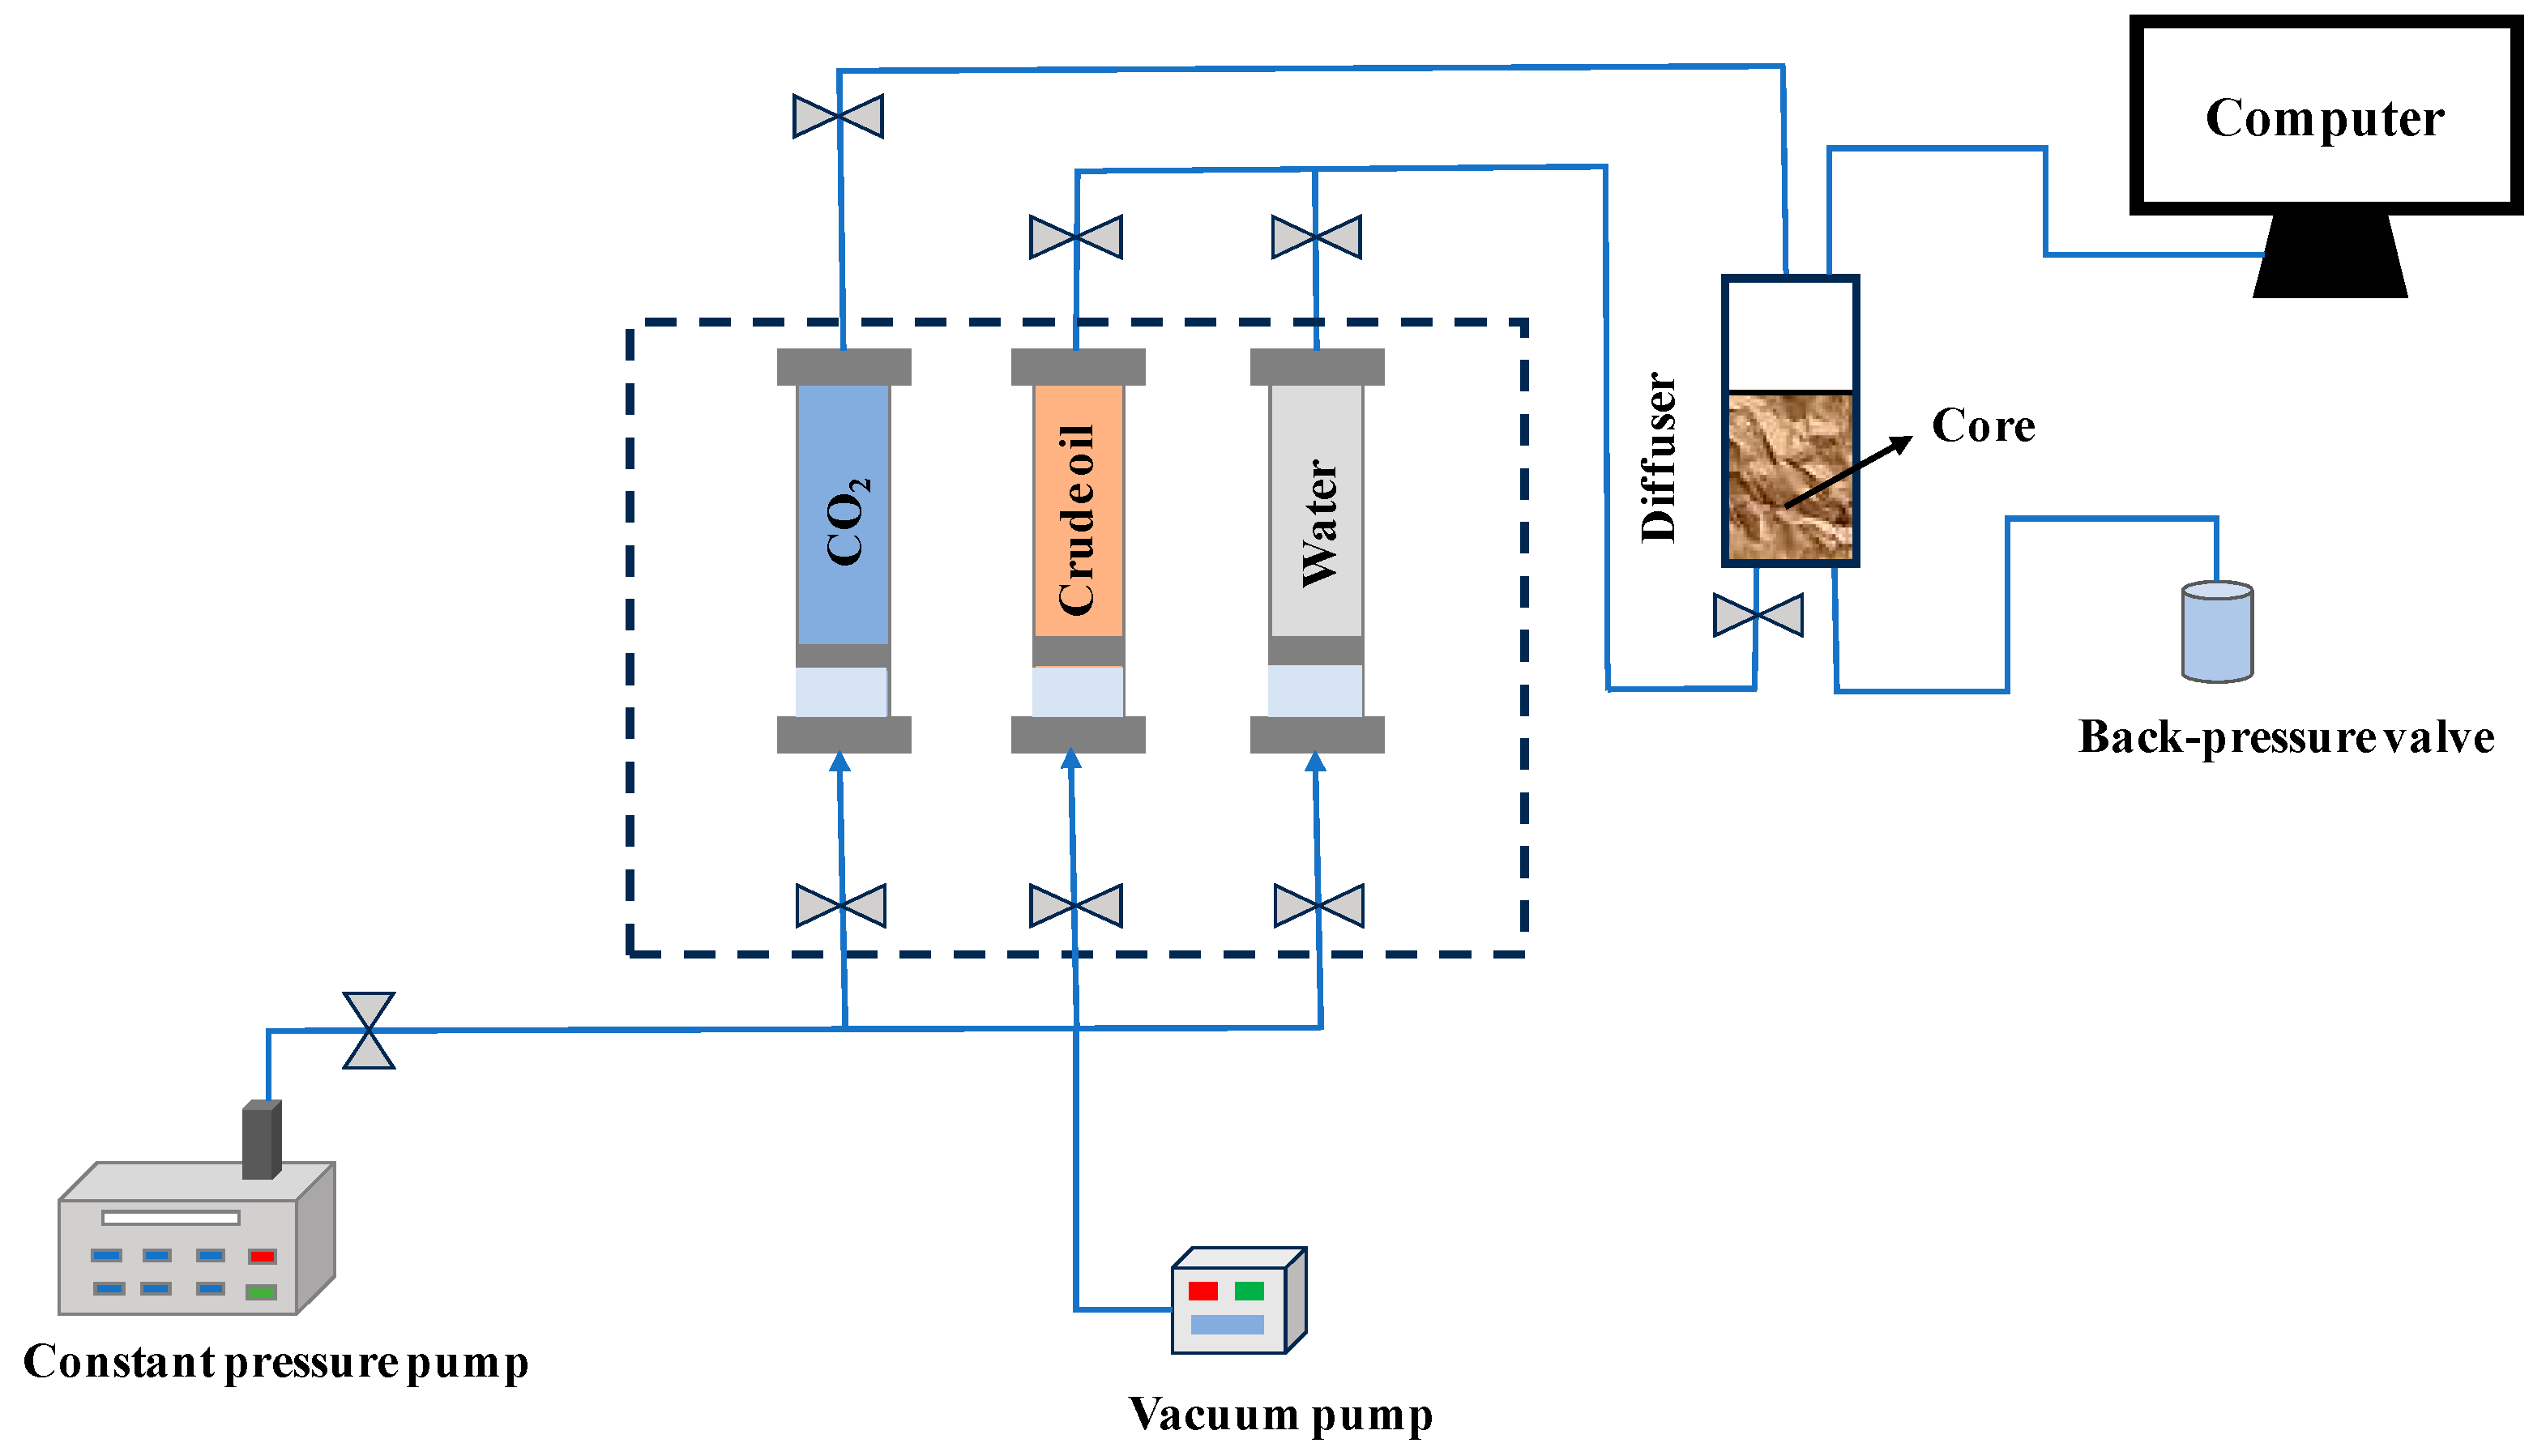
2.2. Experimental Devices

The experimental devices included a high-temperature and high-pressure reactor, a constant-pressure and constant-flow pump, a gas-liquid separation device, a gas flowmeter, and an MCR-302 rheometer (Anton paar, Graz, Austria). The specifications of the customized porous medium diffusion cylinder are as follows: the radius is 2.5 cm, the core is polished to 2.5 cm, and the core can be fitted to the cylinder wall such that side leakage of CO2 can be avoided when it diffuses into the porous medium in the cylinder.

2.3. Experimental Methods

2.3.1. Solubility Measurement of CO2 in Pure Liquid

For this paper, the solubility of CO2 in fluid was calculated using the gas PVT method [10,26].

2.3.2. Diffusion Experiment with CO2 in Pure Liquid

For this paper, the diffusion coefficients of CO2 in different fluids were measured using the pressure drop method [11,27].

2.3.3. Diffusion Measurement of CO2 in Porous Medium

(1) First, the air-tightness of the whole device was checked. After vacuuming the reaction kettle and the diffusion tube, the porous medium saturated with oil and water in the core was placed in the diffusion tube. (2) The CO2 in the intermediate container was pressurized using a constant-pressure pump until it reached the experimental pressure and was then pumped to the core above the PVT chamber at an extremely slow speed. (3) After the upper end of the diffusion cylinder core reached the experimental pressure, the closed reactor started the experiment. (4) The pressure in the diffusion tube during the whole process was recorded using a computer. The experiment stopped when the pressure decreased to less than 1 kPa within 30 min. (5) In accordance with Formula (1), the collected pressure–time relationship data were nonlinearly fitted using the OriginLab 8.5 software to obtain the parameter k1 of the fitting curve.
D e f f = 4 ϕ z 0 2 ( ϕ 3 4 0.35 ) k 1 π 2
Given k1 and the porosity of the porous medium ϕ , the liquid phase height z0 can be considered to be approximately equal to the length L of the porous medium, and the diffusion coefficient Deff of the CO2 diffusion into the saturated oil–water porous medium can be obtained. The experimental process of the diffusion of the CO2 into the porous medium is shown in Figure 1.

2.3.4. Static Erosion Experiment

A static erosion experiment involving the CO2-saturated formation water in the core was carried out. The ion content of the rock erosion solution was determined at different times using an ICP (ion chromatograph) (Thermo Fisher Diane ICS-2100, Waltham, MA, USA). The sample was diluted to a suitable concentration for the subsequent measurements, and the sample was atomized, vaporized, and ionized to generate an ionic state in the ICP spectrometer. The ions in the sample were analyzed and the relative strength of the ions was measured using an ICP spectrometer. Based on the data of the known standard solutions, the amount of each element in the sample used in this study was calculated. The changes in the amounts of different mineral components in the rock before and after the erosion reaction were detected using an X-ray diffractometer (XRD) (Bruker D8 QUEST, Karlsruhe, Germany). The amount of core powder before and after the dissolution of the carbon dioxide was detected via XRD and used to analyze the impact of carbon dioxide dissolution on the mineral composition of the core. The above methods were used to study the law according to which CO2–formation water erodes rock.

2.3.5. Dynamic Erosion Experiment

The experimental steps are were follows: (1) After the porous medium was saturated with the formation water, the wet weight and the pore volume of the core were calculated. (2) The experimental temperature was set at 60 °C and the formation water was injected to start the water permeability test. (3) After the initial permeability was measured using water, the CO2-saturated aqueous solution was injected into the core at a constant pressure of 12 MPa, and the produced liquid was collected at regular intervals. (4) The liquid permeability of the core was calculated using the Darcy formula, and the permeability, porosity, and injection curves were drawn. The variation law of the core permeability and porosity was analyzed. In addition, the core was scanned before and after the dynamic dissolution of carbon dioxide, and the changes in the size distribution, permeability, and porosity of the rock pores were analyzed using NMR.

2.3.6. Dynamic Flooding Experiment

The steps of the indoor CO2-flooding/storage simulation experiment were as follows: (1) Three short cores were spliced into a long core of about 30 cm. After the core was saturated with water, the wet weight was weighed and the water phase permeability was measured. Finally, the pore volume of the core was calculated. (2) The core was then saturated with oil. After the outlet end of the core no longer produced water, the valves at the inlet and outlet ends were closed. The core was then aged for 24 h and the initial oil saturation S0 was calculated. (3) CO2 was injected into the injection end of the core holder at a constant pressure (12 MPa). The gas injection stopped after the outlet end of the core no longer produced oil. The oil and gas output of the core was then recorded. Finally, the oil recovery and storage and the rate of CO2 flooding were calculated.

3. Results and Discussion

3.1. Solubility of CO2 in the Formation Fluid

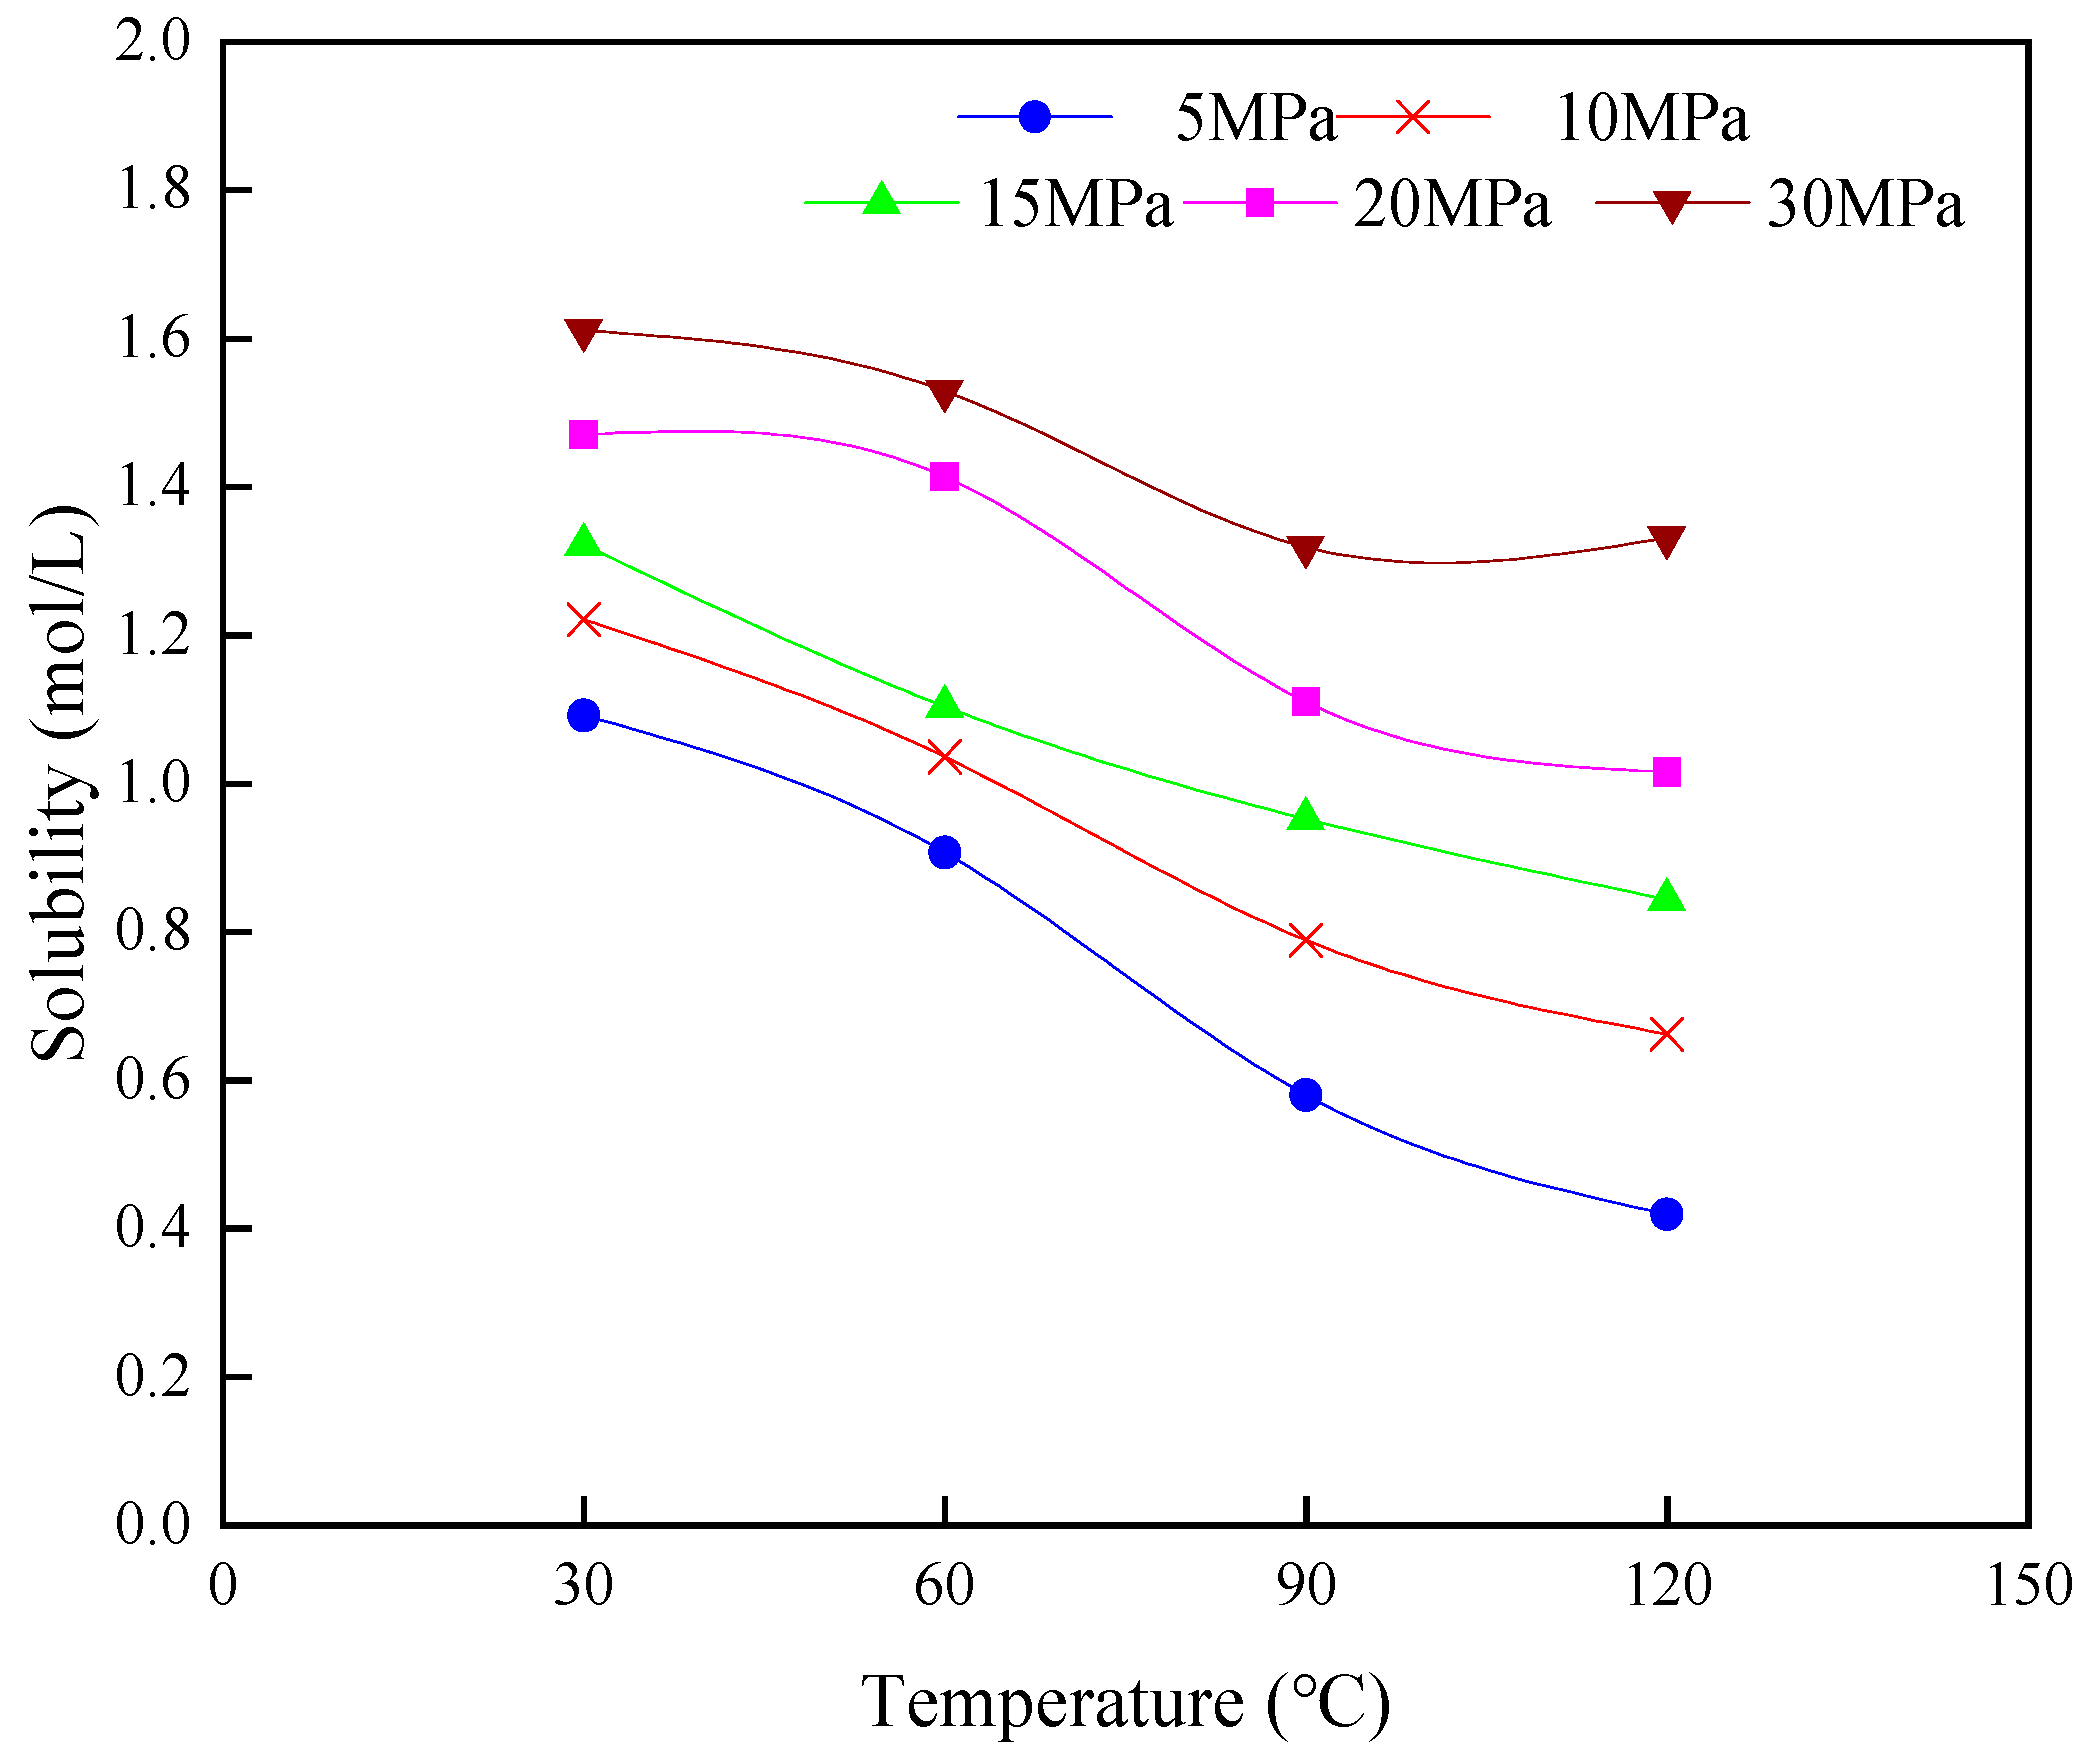
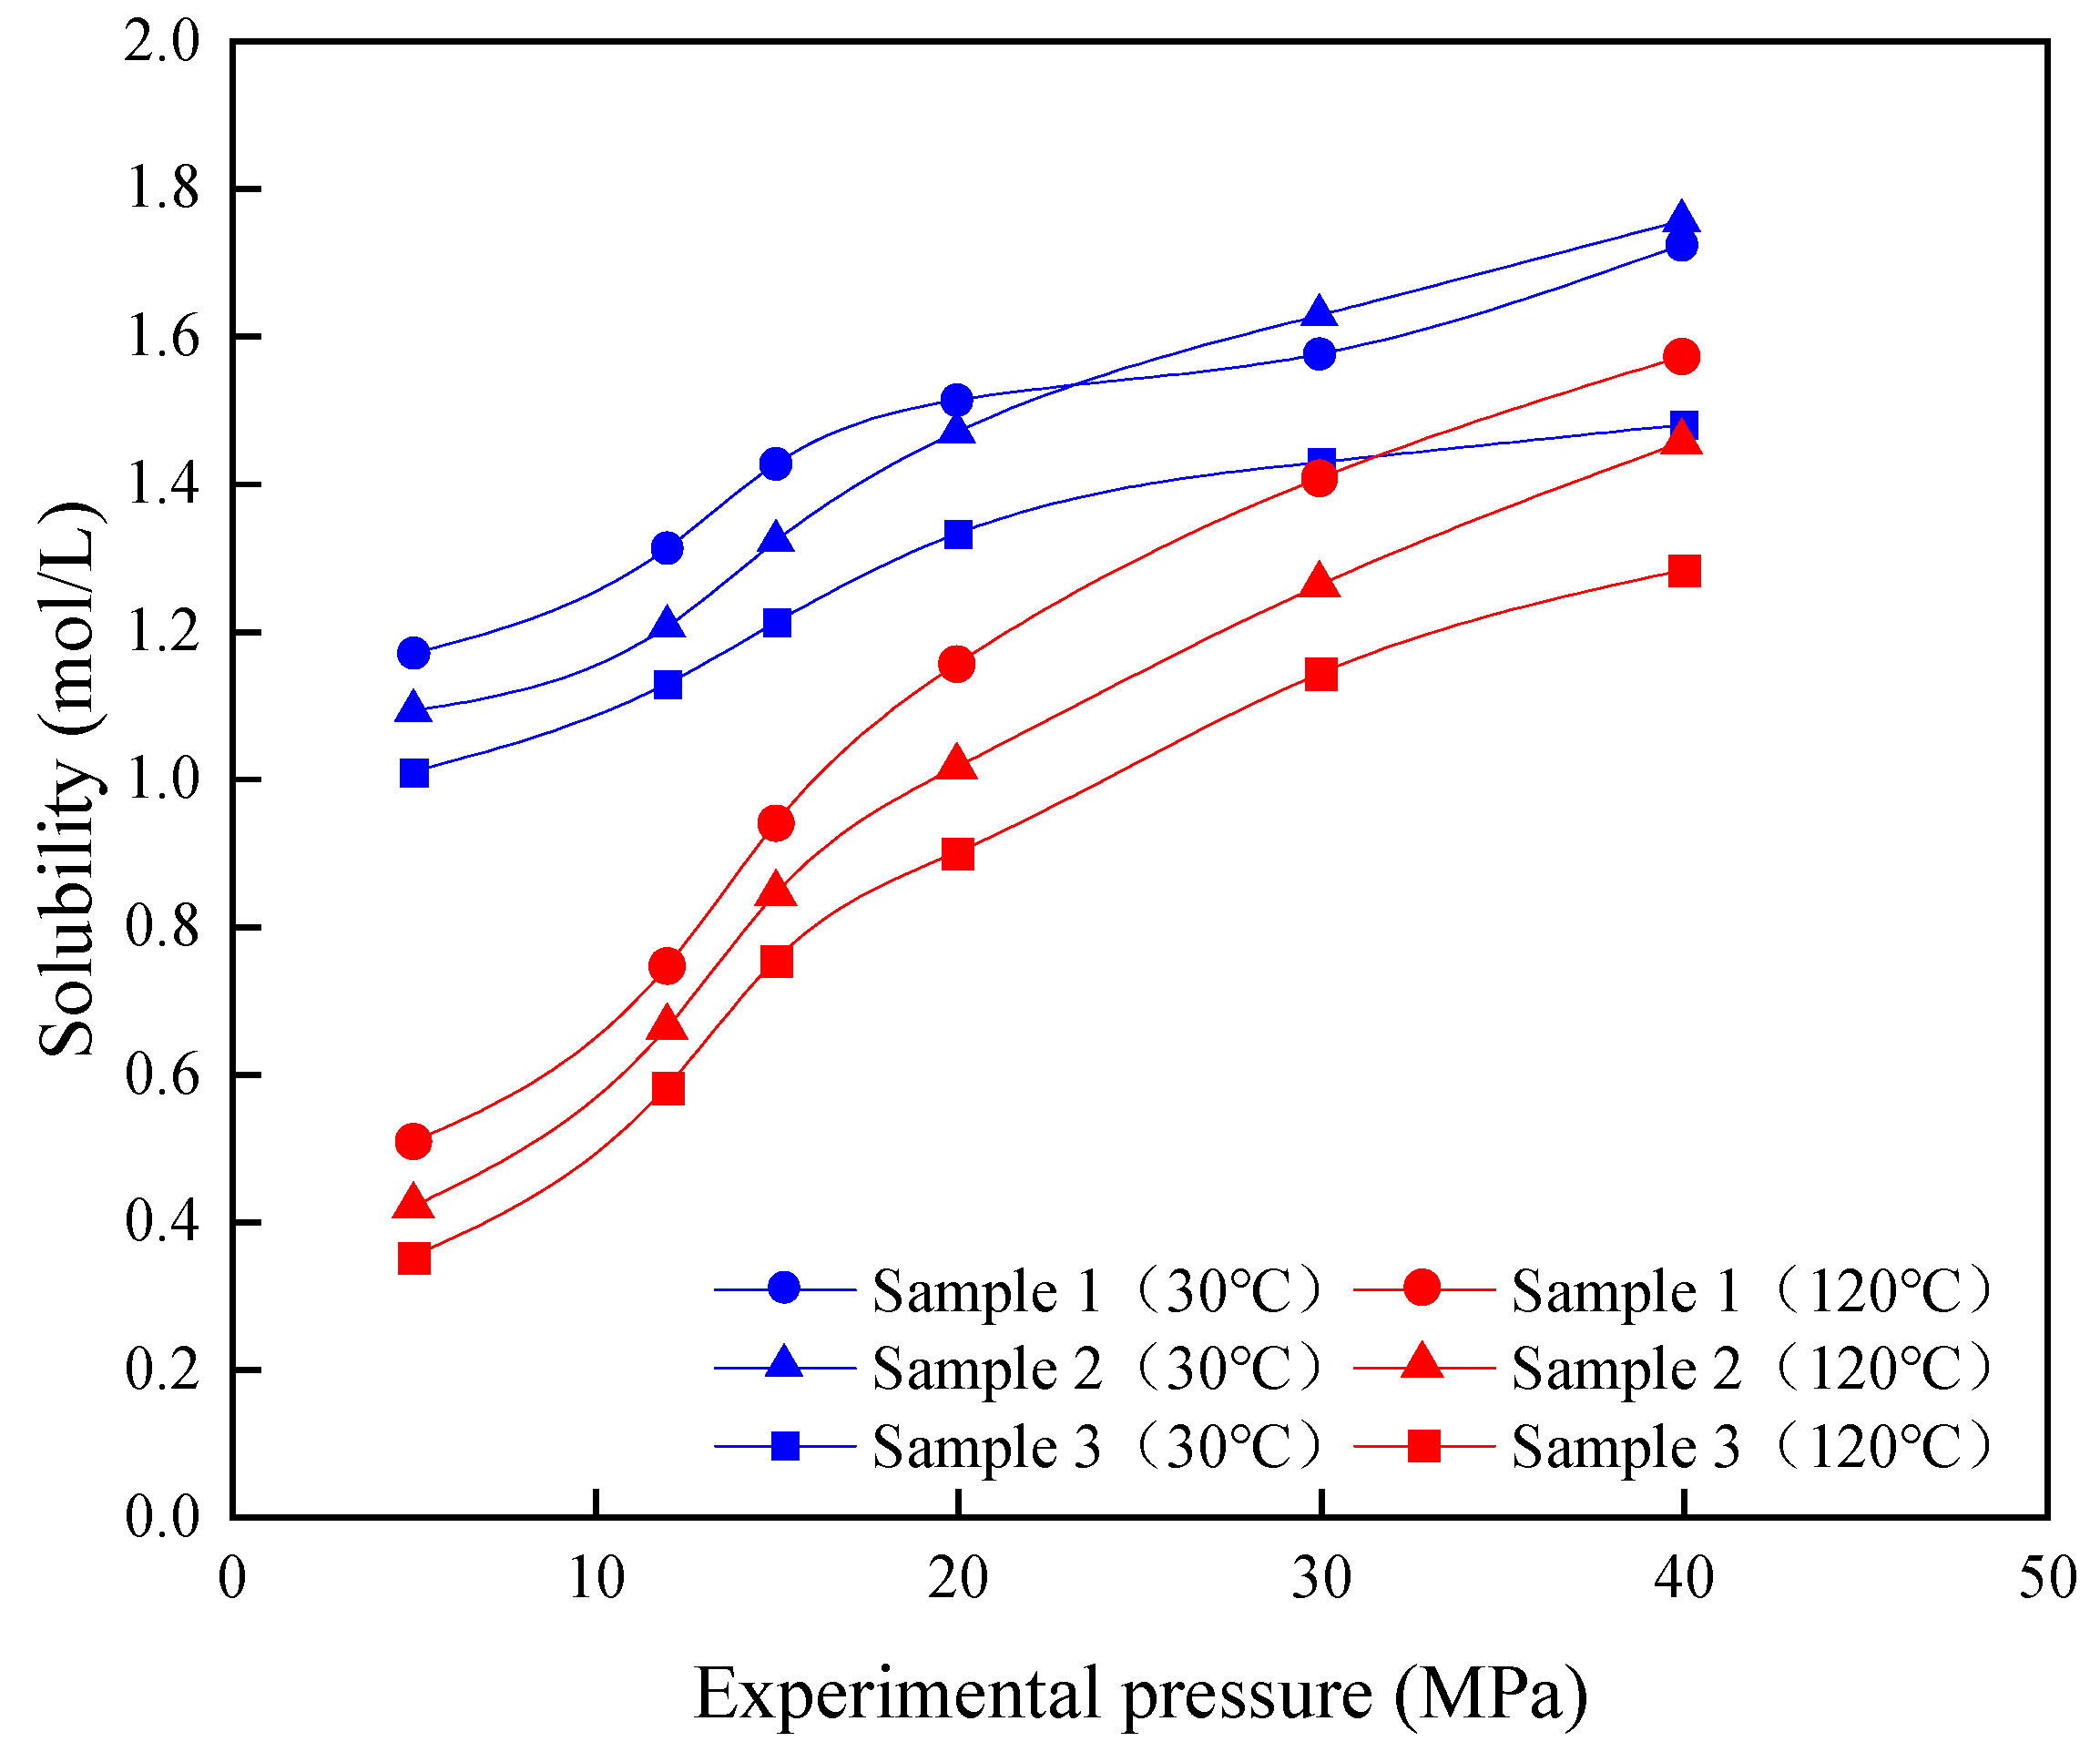
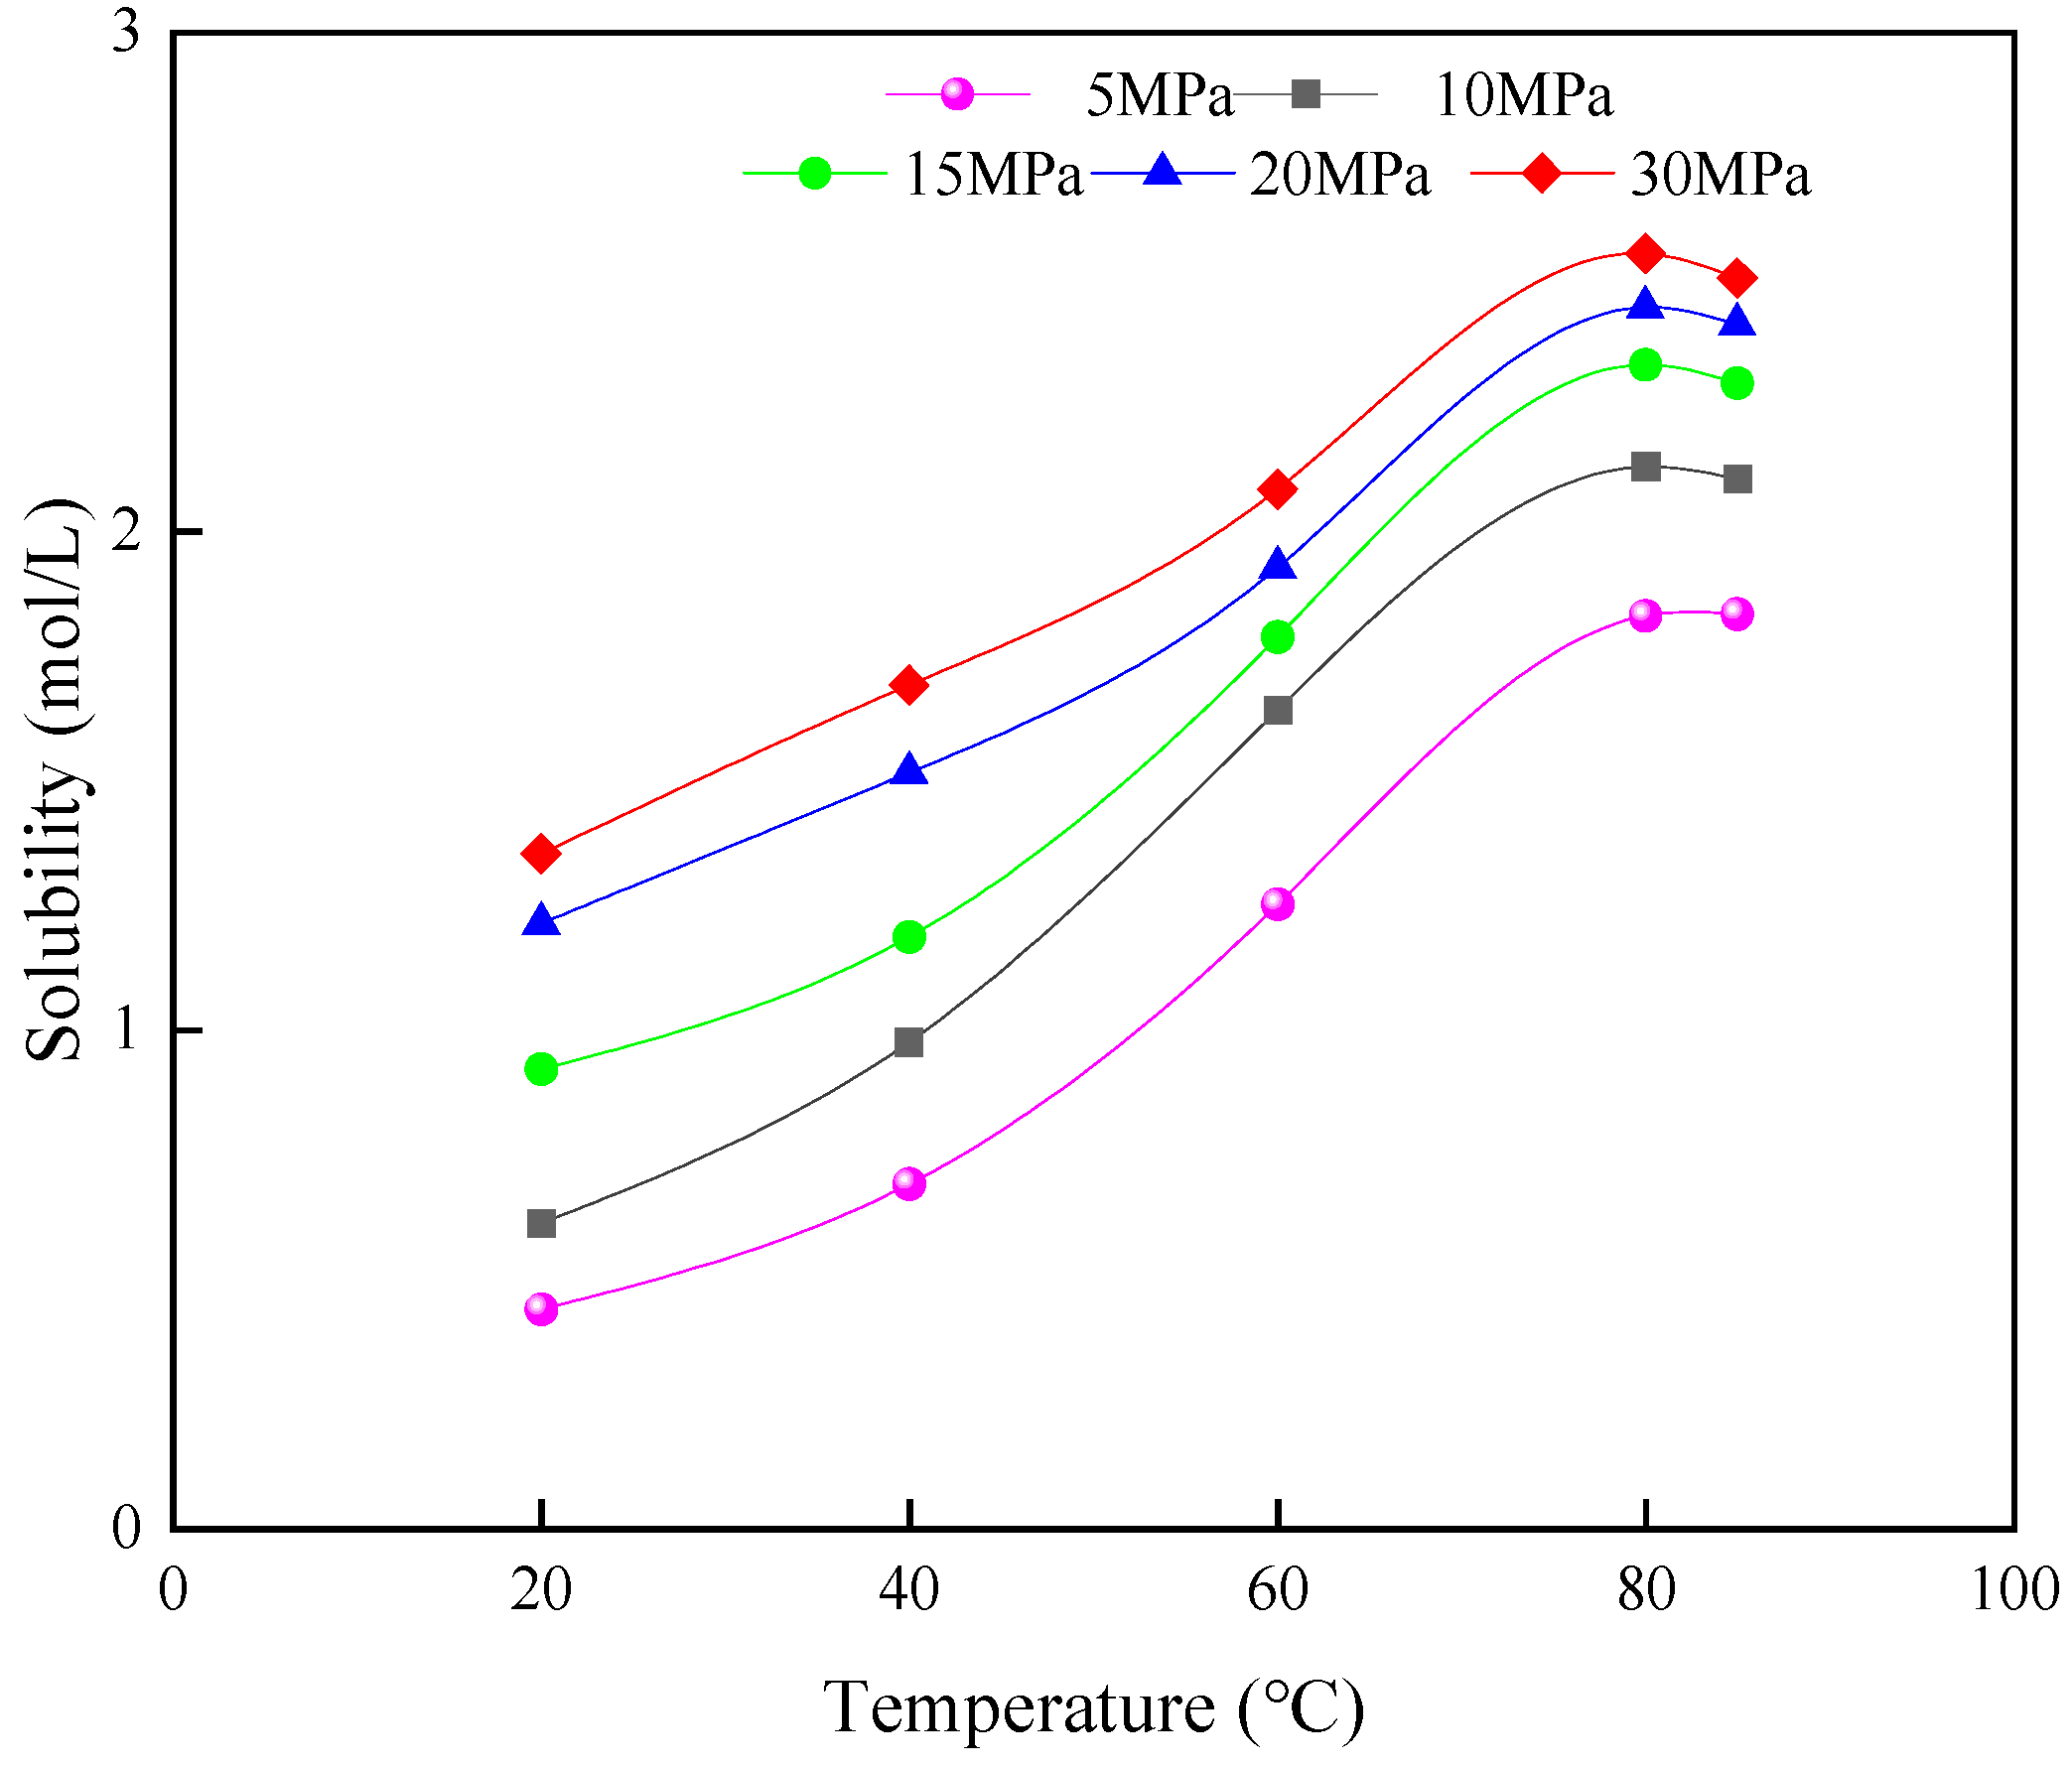
3.1.1. Solubility of CO2 in the Formation Water

As Figure 2 shows, the solubility of CO2 in formation water increases as the pressure increases. The solubility coefficient of CO2 in water is higher under low pressure, and the solubility increases rapidly with pressure. However, when the pressure rises to a certain value, the solubility coefficient of CO2 in formation water decreases gradually, and the rising trend of solubility tends to be stable and slow. The solubility curve has an obvious inflection point near 20 MPa. As Figure 3 shows, the solubility of CO2 in formation water decreases as the temperature increases. The higher the temperature, the faster the movement of the carbon dioxide molecules in the water. In this case, the CO2 molecules tended to escape from the aqueous phase, resulting in a decrease in the solubility of the CO2. When the temperature was above 100 °C and the pressure was above 20 MPa, the solubility of the CO2 in the water changed significantly compared with that observed at low temperatures. When the pressure exceeded 20 MPa, the solubility still increased steadily with the increase in pressure and finally exceeded the solubility below 100 °C. The properties of CO2 change under high temperatures and high pressures, and its solubility increases as the temperature increases, indicating the great potential for the dissolution and storage of CO2 in high-temperature and high-pressure reservoirs.
As Figure 4 shows, as the mineralization degree of the formation water increases, the solubility of the CO2 in the formation water decreases. The solubility of different samples under the same temperature and pressure conditions basically conforms to this law. The solubility of CO2 decreases as mineralization increases, mainly due to the “salting out effect” caused by the addition of NaCl into the aqueous phase. When ionic salts are added into the water phase, on the one hand, the activity coefficient of water is reduced, but on the other hand, complex compounds are formed by the dissolution of ionic salts, and these absorb water molecules (this is known as the “solvent effect”). Due to the above two effects, the solubility of CO2 in aqueous solutions decreases as NaCl concentrations increase [28].

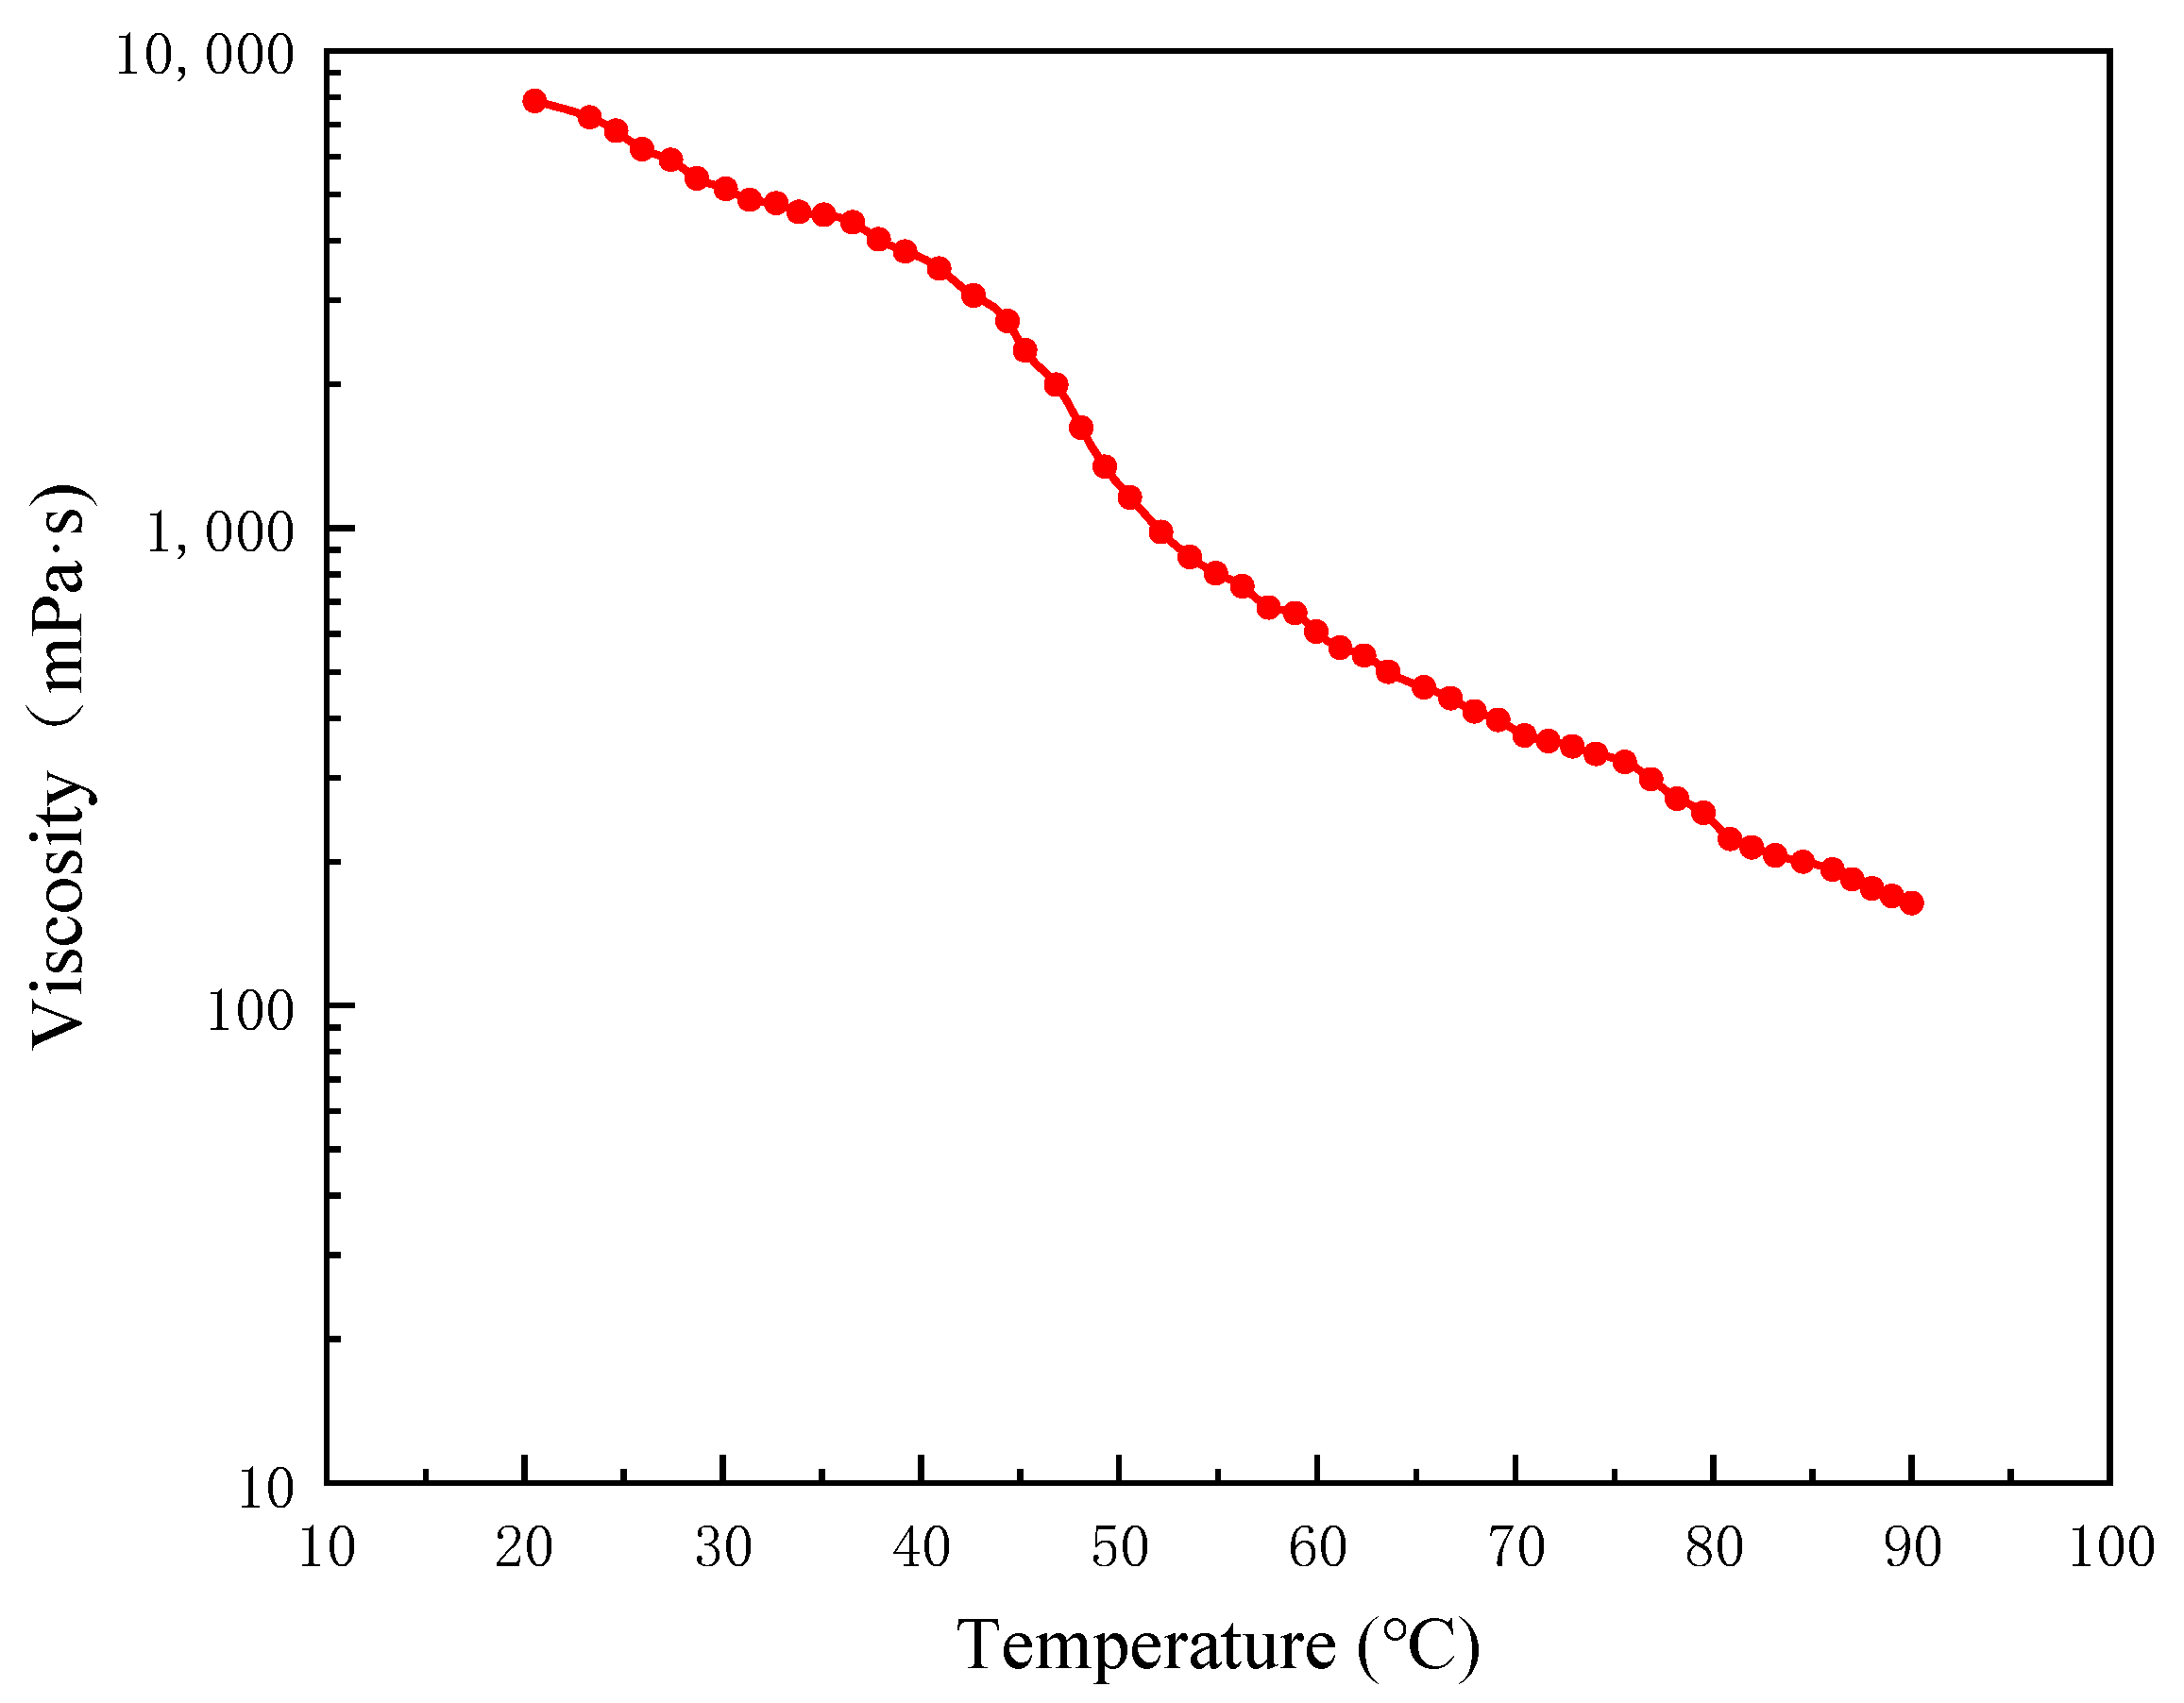
3.1.2. Solubility of CO2 in Crude Oil

The viscosity–temperature relationship curve of the dehydrated and degassed crude oil was measured using a rheometer, and the viscosity–temperature semi-logarithmic curve of the crude oil sample is shown in Figure 5. As the temperature increased, the viscosity of the crude oil sample decreased significantly. Between 20 °C and 85 °C, the logarithm of viscosity showed a linear relationship with temperature. When the experimental temperature was 20 °C, the viscosity of the oil sample was 7841 mPa·s. When the experimental temperature reached 85 °C, the viscosity of the oil sample was 200 mPa·s. After the temperature reached 85 °C, the viscosity of the oil sample decreased.
It can be seen from Figure 6 that the pressure-related variations in CO2 solubility in the crude oil were similar to those observed in the formation water. The solubility increased as the pressure increased at low pressures. As the pressure increased, the number of carbon dioxide molecules escaping from the crude oil phase decreased, and this led to an increase in the solubility of the carbon dioxide molecules in the crude oil. When the pressure increased to about 20 MPa, the solubility–pressure curve showed an obvious plateau, and the solubility reached a saturation state. It can be seen from Figure 7 that the solubility of the CO2 in the same crude oil increased as the temperature increased. As the temperature increased, the viscosity of the crude oil decreased greatly, and the solubility of the CO2 in the low viscosity state increased greatly. It can be seen from Figure 5 that the viscosity of crude oil decreased as the temperature increased, and that the effect of the temperature on solubility began to weaken. The movement of the CO2 gas molecules was intensified due to the increase in temperature, causing the solubility of the CO2 in the crude oil to decrease. At higher reservoir temperatures, the solubility of CO2 in crude oil is significantly higher than that in formation water, and CO2 has a stronger dissolution and storage potential in crude oil.

3.2. Diffusion Law of CO2 in the Formation Fluid

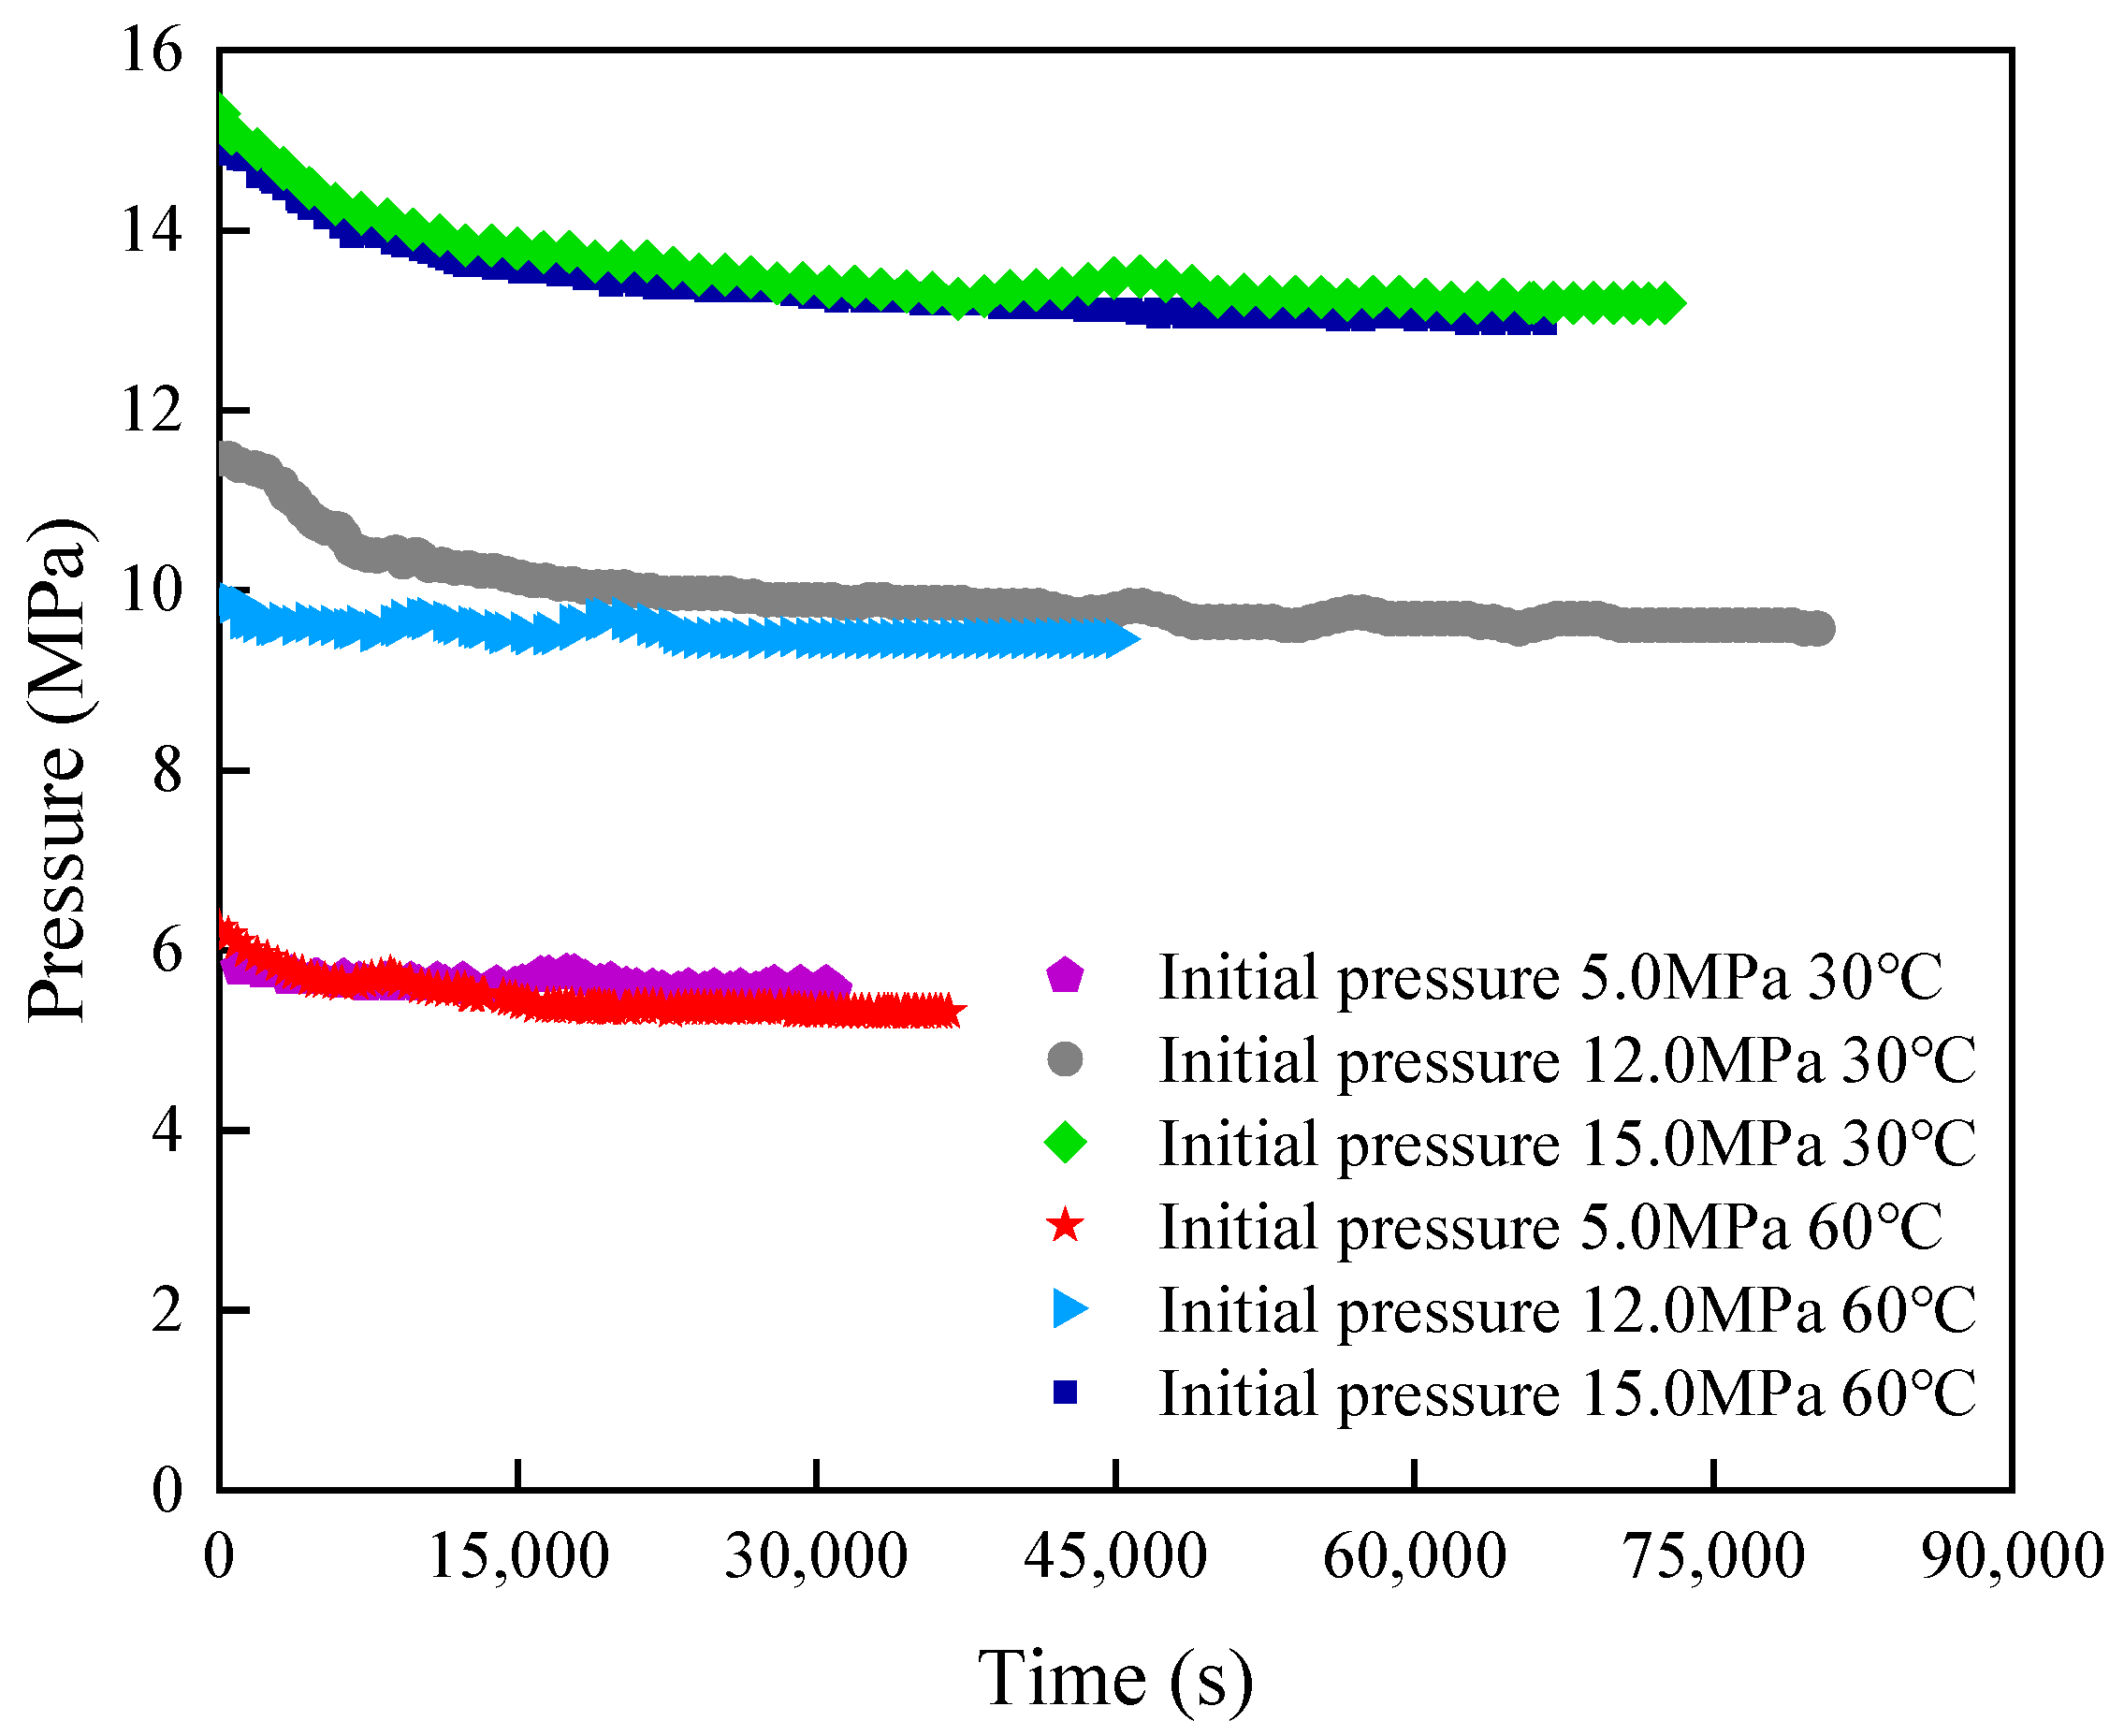
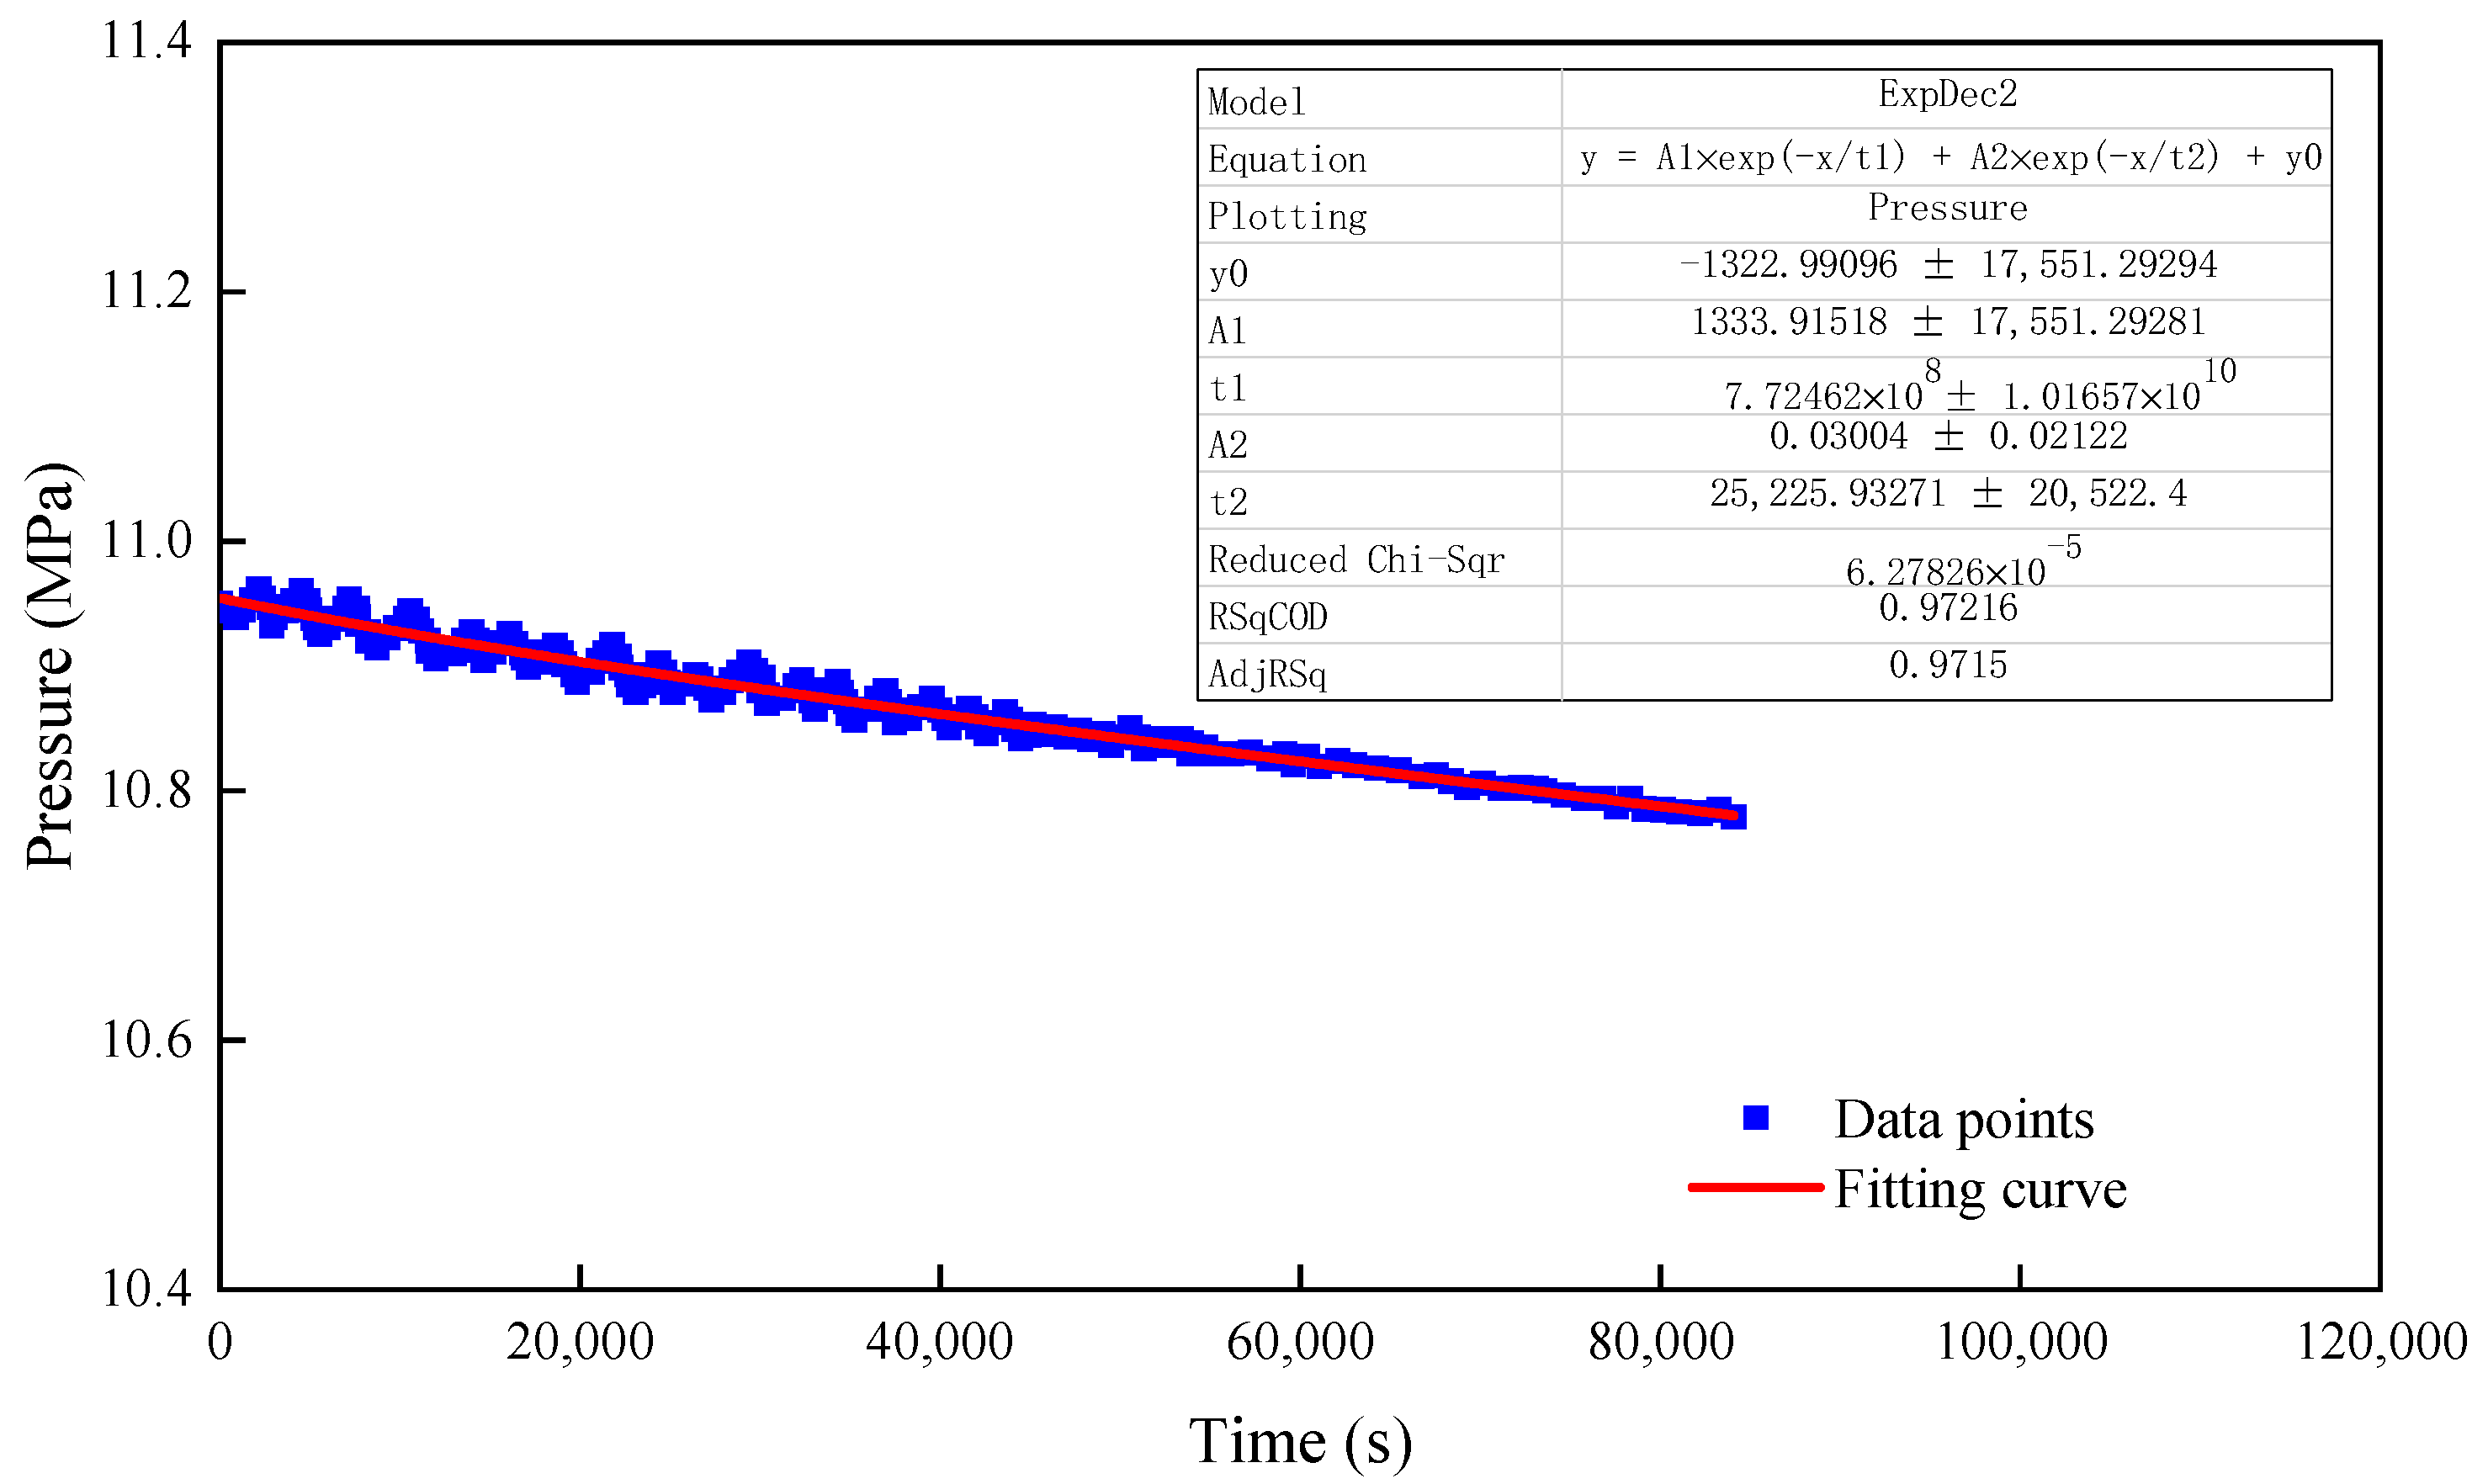
3.2.1. Diffusion Experiment Involving CO2 in Pure Water

The pressure–time relationship curve for the process of CO2 diffusion into the water phase is shown in Figure 8. The pressure was converted into the logarithm of the pressure difference, and the slope k of each curve was obtained via the linear fitting of the curve before the equilibrium pressure (Figure 8). The height of the liquid phase in the visible reactor was also measured. The diffusion coefficient of the CO2 in the fluid is shown in Table 6, and the diffusion coefficient of the CO2 was positively correlated with the pressure at different temperatures. The diffusion coefficient of the CO2 at 60 °C was higher than that at 30 °C under the same pressure conditions. As the pressure increased, the concentration of CO2 molecules in the gas phase increased, and the rate of solubility of the CO2 into the liquid phase increased, causing the diffusion coefficient of the CO2 to increase. The movement of the CO2 was more active and the rate of its diffusion into the aqueous phase was higher when the temperature was increased.

3.2.2. Diffusion Experiment Involving CO2 in Crude Oil

The pressure–time relationship for the process of CO2 diffusion into the oil phase is shown in Figure 9. The diffusion coefficient results of the CO2 in the oil phase are shown in Table 7. The diffusion coefficient of the CO2 in the oil phase was roughly consistent with that in the water phase. The diffusion coefficient of the CO2 in the oil phase also increased when the temperature and pressure increased. Due to the reduction in the viscosity of the crude oil brought about by the increase in temperature, the solubility of the CO2 in the crude oil increased, and the capacity of the liquid phase to accommodate CO2 was thereby improved, making it easier to diffuse the CO2 into the oil phase at high temperatures. As the pressure increased, the number of carbon dioxide molecules per unit volume increased, and the probability of collisions between the carbon dioxide molecules increased. The thermal motion of the molecules intensified and the diffusion of the CO2 molecules accelerated. In addition, as the temperature increased, the viscosity of the crude oil decreased, and the kinetic energy of the fluid molecules increased. The degree of thermal motion intensified, promoting the diffusion of the CO2. The order of magnitude for the diffusion coefficient of the CO2 in the oil phase and the water phase was 10−8 m2/s. However, the diffusion coefficient of the CO2 in the oil phase was higher than that in the water phase under the same temperature and pressure conditions.

3.2.3. Diffusion Experiment Involving CO2 in Porous Medium

The pressure changes that occurred in the diffusion tube during the diffusion of the CO2 into the oil–water two-phase flow in the porous medium at 60 °C are shown in Figure 10, Figure 11 and Figure 12. Due to the tortuosity of the porous medium, the pressure of the CO2 diffusion into the porous medium fluctuated more than the pressure of the CO2 diffusion into the pure liquid medium. As the initial pressure increased, the pressure–time curve fluctuated more obviously, and the variance of the fitting curve was larger. The greater the initial pressure, the higher the diffusion coefficient. The k1 parameters corresponding to the different initial pressures can be obtained from the fitting curve. The liquid phase height in the porous medium and the coefficient of the CO2 diffusion into the oil–water two-phase flow in the porous medium were both obtained (Table 8). It can be seen from Table 8 that the order of magnitude for the coefficient of the CO2 diffusion into the oil–water two-phase flow in the porous media was 10−10 m2/s at 60 °C. The diffusion coefficient of the CO2 increases greatly as the initial pressure increased. The tortuosity represents the bending degree of the extension space of the core channel. More resistance was encountered when the CO2 diffused into the liquid-containing space of the irregular core, and this caused the diffusion coefficient of the carbon dioxide to decrease. The coefficient of the CO2 diffusion into the oil–water two-phase flow in the porous medium was the smallest, and the greater were the tortuosity and the initial pressure of the porous medium, the stronger were the fluctuations in the pressure–time curve [29].

3.3. Interaction of CO2–Water–Rock System

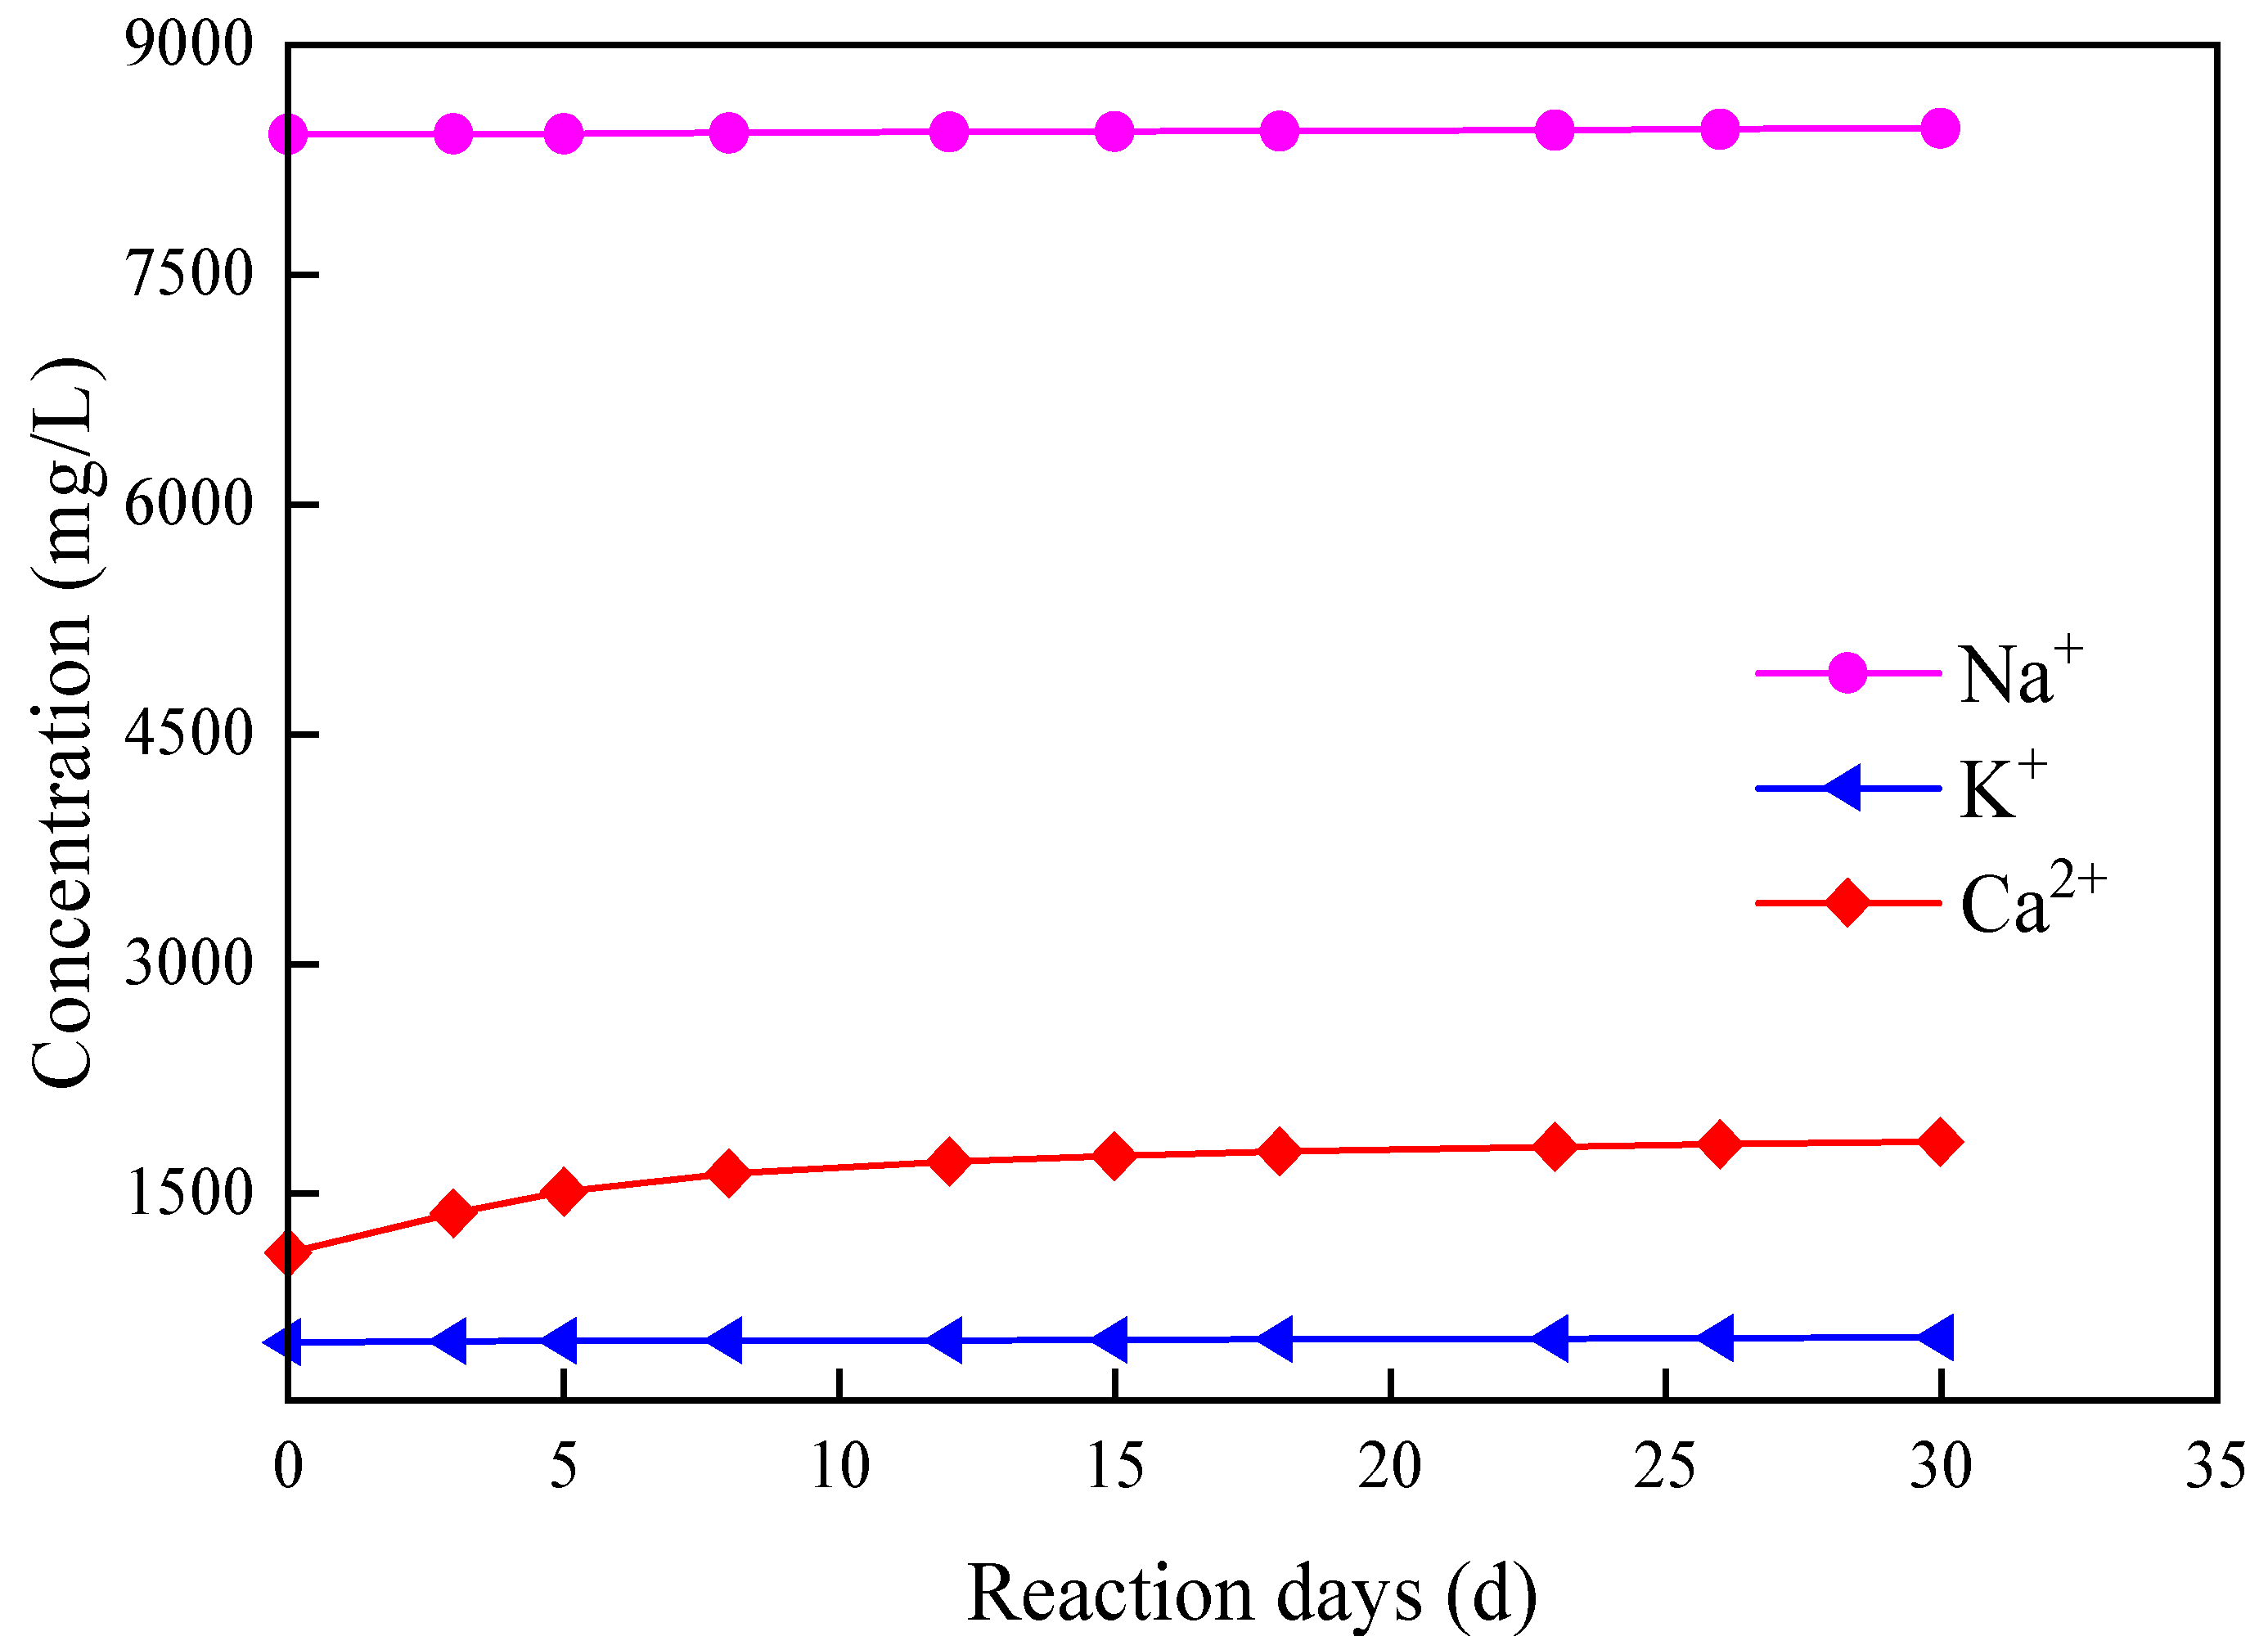
3.3.1. Static Erosion Experiment

(1) Changes in ion concentration in the erosion solution
A small amount of erosion liquid was taken out at regular intervals to filter out the precipitate. After the filtrate was diluted 10 times with distilled water, the concentrations of metal ions such as potassium, calcium, and sodium in the erosion liquid were detected using ion chromatography (ICP). Changes in the concentrations of the different metal ions after corrosion are shown in Figure 13. The concentration of Ca2+ increased as the erosion time increased, and it increased rapidly in the early stage of erosion. There was an obvious plateau at which the concentration of Ca2+ gradually reached equilibrium after 23–30 days. During the dissolution process, the CO2 reacted with the formation water to generate H2CO3, which was partially hydrolyzed into CO32− and HCO3. The formation of H+ increased the acidity of the soaking solution. The main reaction is shown in Formula (2):
C O 2 + H 2 O H 2 C O 3 H + + H C O 3 2 H + + C O 3 2
It can be seen from Figure 13 that Na+ and K+ exhibited a slight upward trend as the erosion time increased. The CO2–water system had a certain erosion effect on the albite and potassium feldspar. Corrosion reactions involving sodium feldspar are more likely to occur than reactions involving potassium feldspar. The concentrations of Na+ and K+ still showed an increasing trend after 25–30 days, indicating that the reaction equilibrium had not yet been reached. The change trend in the concentration of Ca2+ was generally consistent with that of Na+ and K+ concentration (Figure 13). The increase in the concentration of Ca2+ was the largest, indicating that the corresponding mineral components have a certain potential for mineralized storage [30]. In the process of the mineralization reaction between the carbon dioxide, the water, and the rocks, calcium feldspar was one of the most important mineral components; it can react extensively with carbon dioxide and has a significant impact on the storage of carbon dioxide.
(2) Changes in the mineral compositions of the cores
The core was crushed and milled into powder form and the whole rock was tested using an X-ray diffractometer to analyze the experimental powder (Figure 14). The XRD test showed that the highest mineral fraction concentration in the tested core was that of quartz (45.8%). There was plagioclase feldspar (19.5%) and potassium feldspar (16.3%) among the feldspar minerals, while the other mineral fraction content values were relatively low. According to the experimental protocol, one sample of core powder from the experimental groups under different pressures was taken out of the closed container on the 7th, 14th, and 21st day. The changes in the mineral fraction content values were then determined.
The results of the XRD analysis of the mineral content changes in the core before and after erosion are shown in Figure 15. The basic mineral composition determined via XRD analysis before the core was corroded by CO2 was as follows (%): quartz: 45.8; plagioclase feldspar: 19.50; potassium feldspar: 16.30; chlorite: 2.55; illite: 1.10; kaolinite: 5.10; calcium montmorillonite: 0.45; and sodium montmorillonite: 0.55. The quartz content increased as the erosion time increased, and the plagioclase and K-feldspar content decreased greatly due to the erosion reaction with the CO2. Due to the erosion of the feldspar, a large amount of secondary kaolinite was generated, resulting in a significant increase in the kaolinite content. The main minerals in the core skeleton were quartz, plagioclase feldspar, and potassium feldspar. Among these three main minerals, plagioclase feldspar and potassium feldspar can react directly with CO2, and secondary minerals such as quartz and kaolinite can be generated by reacting with both of them. The related chemical reactions are shown in Formulas (3)–(5).
2 NaAlSi 3 O 8 + 2 H + Al 2 Si 2 O 5 ( OH ) 4 + 4 SiO 2 + 2 Na +
2 KAl 3 Si 8 O 3 + 2 H + Al 2 Si 2 O 5 ( OH ) 4 + 4 SiO 2 + 2 K +
2 CaAlSiO 3 + 4 H + + 6 H 2 O 2 Al 2 Si 2 O 5 ( OH ) 4 + 2 SiO 2 + 2 Ca +

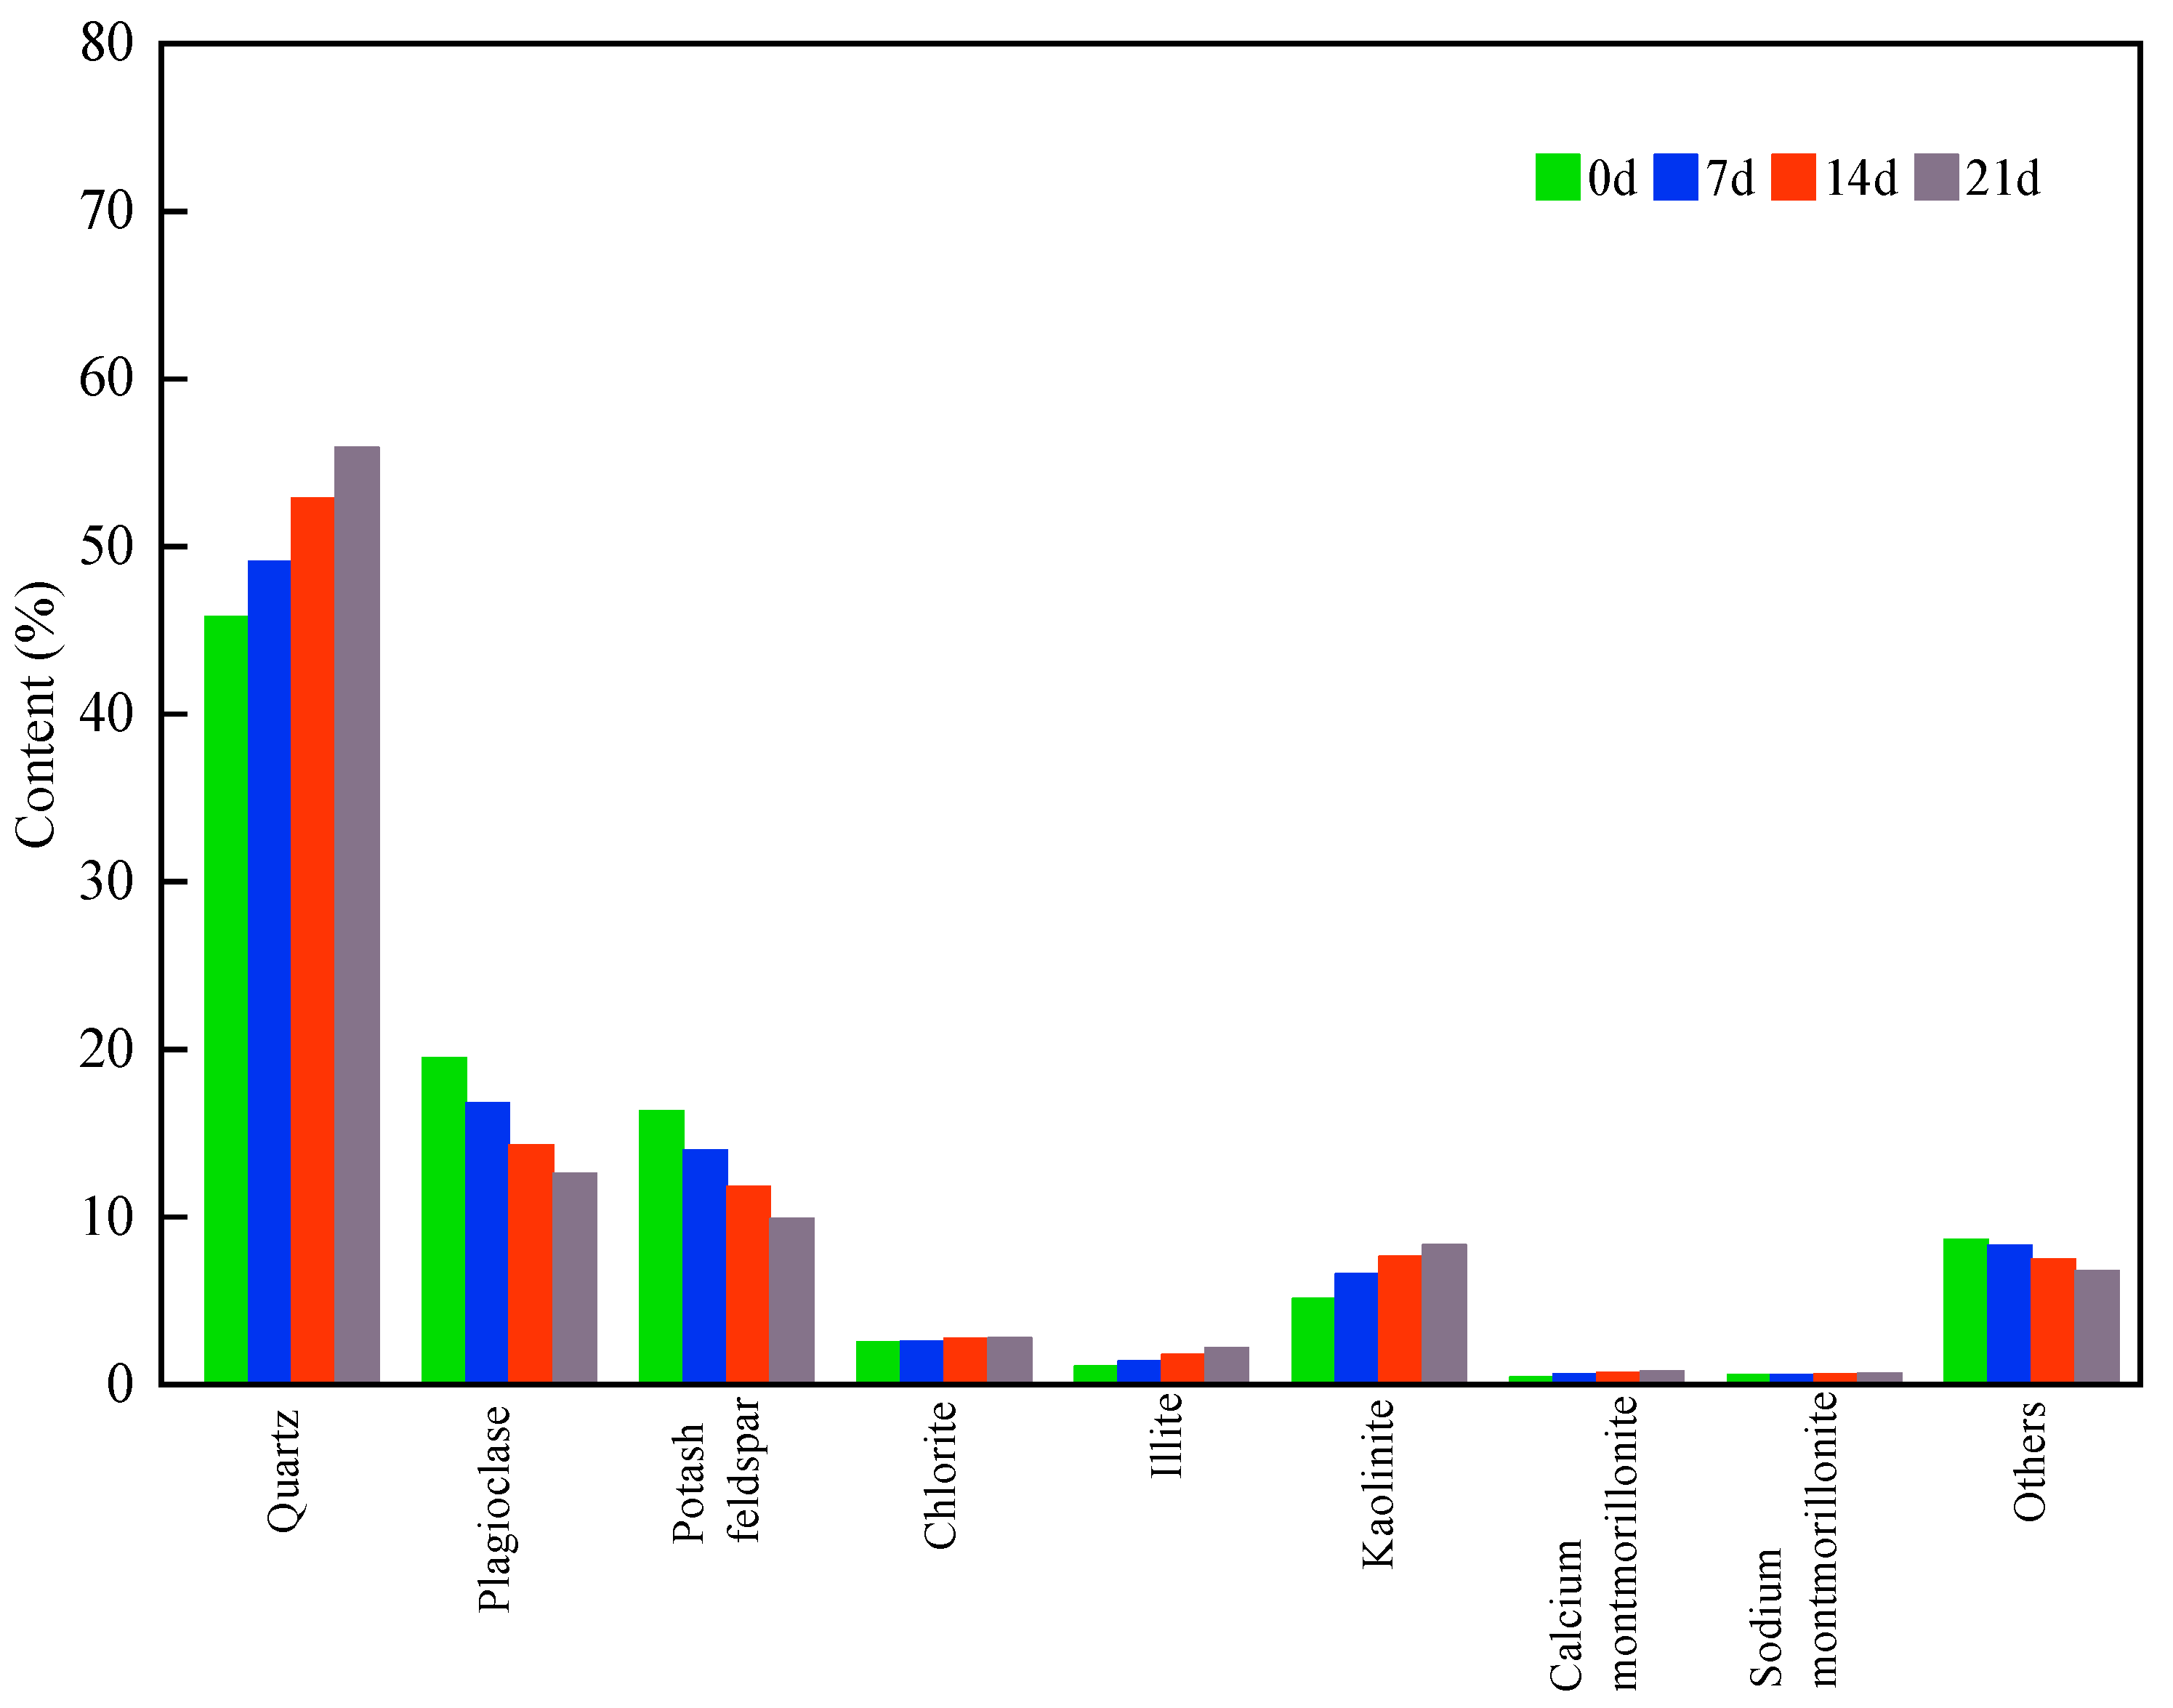
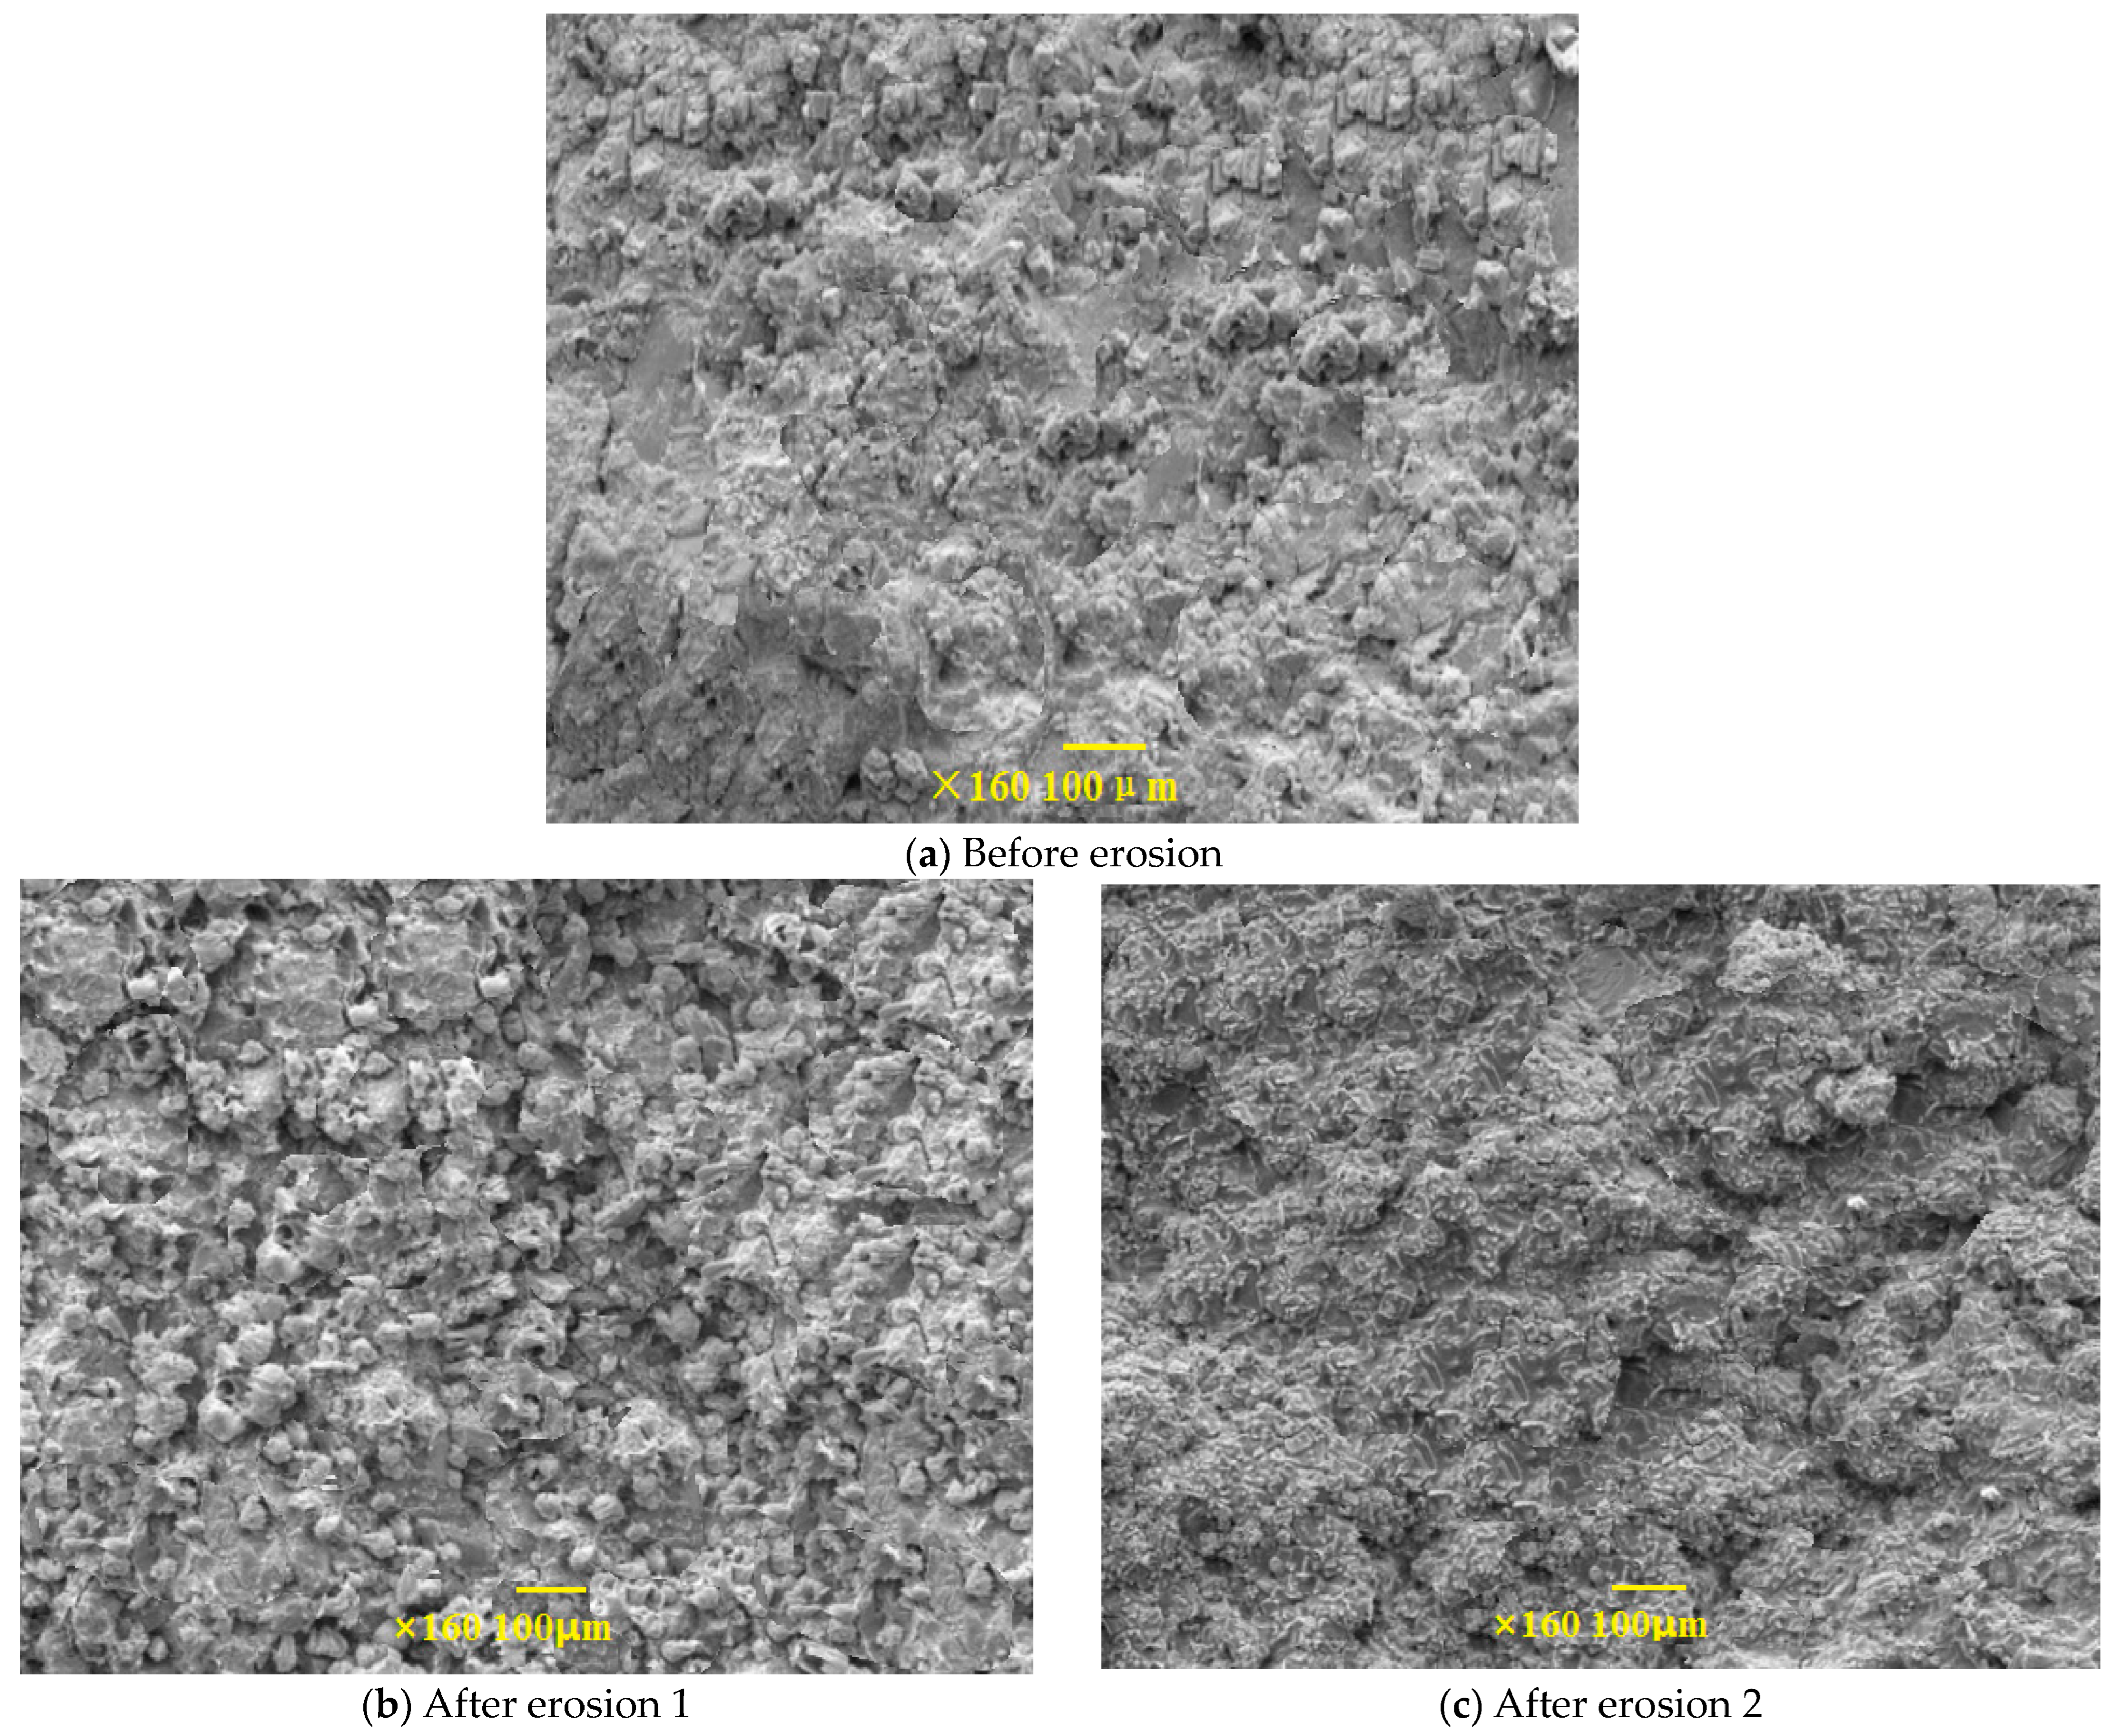
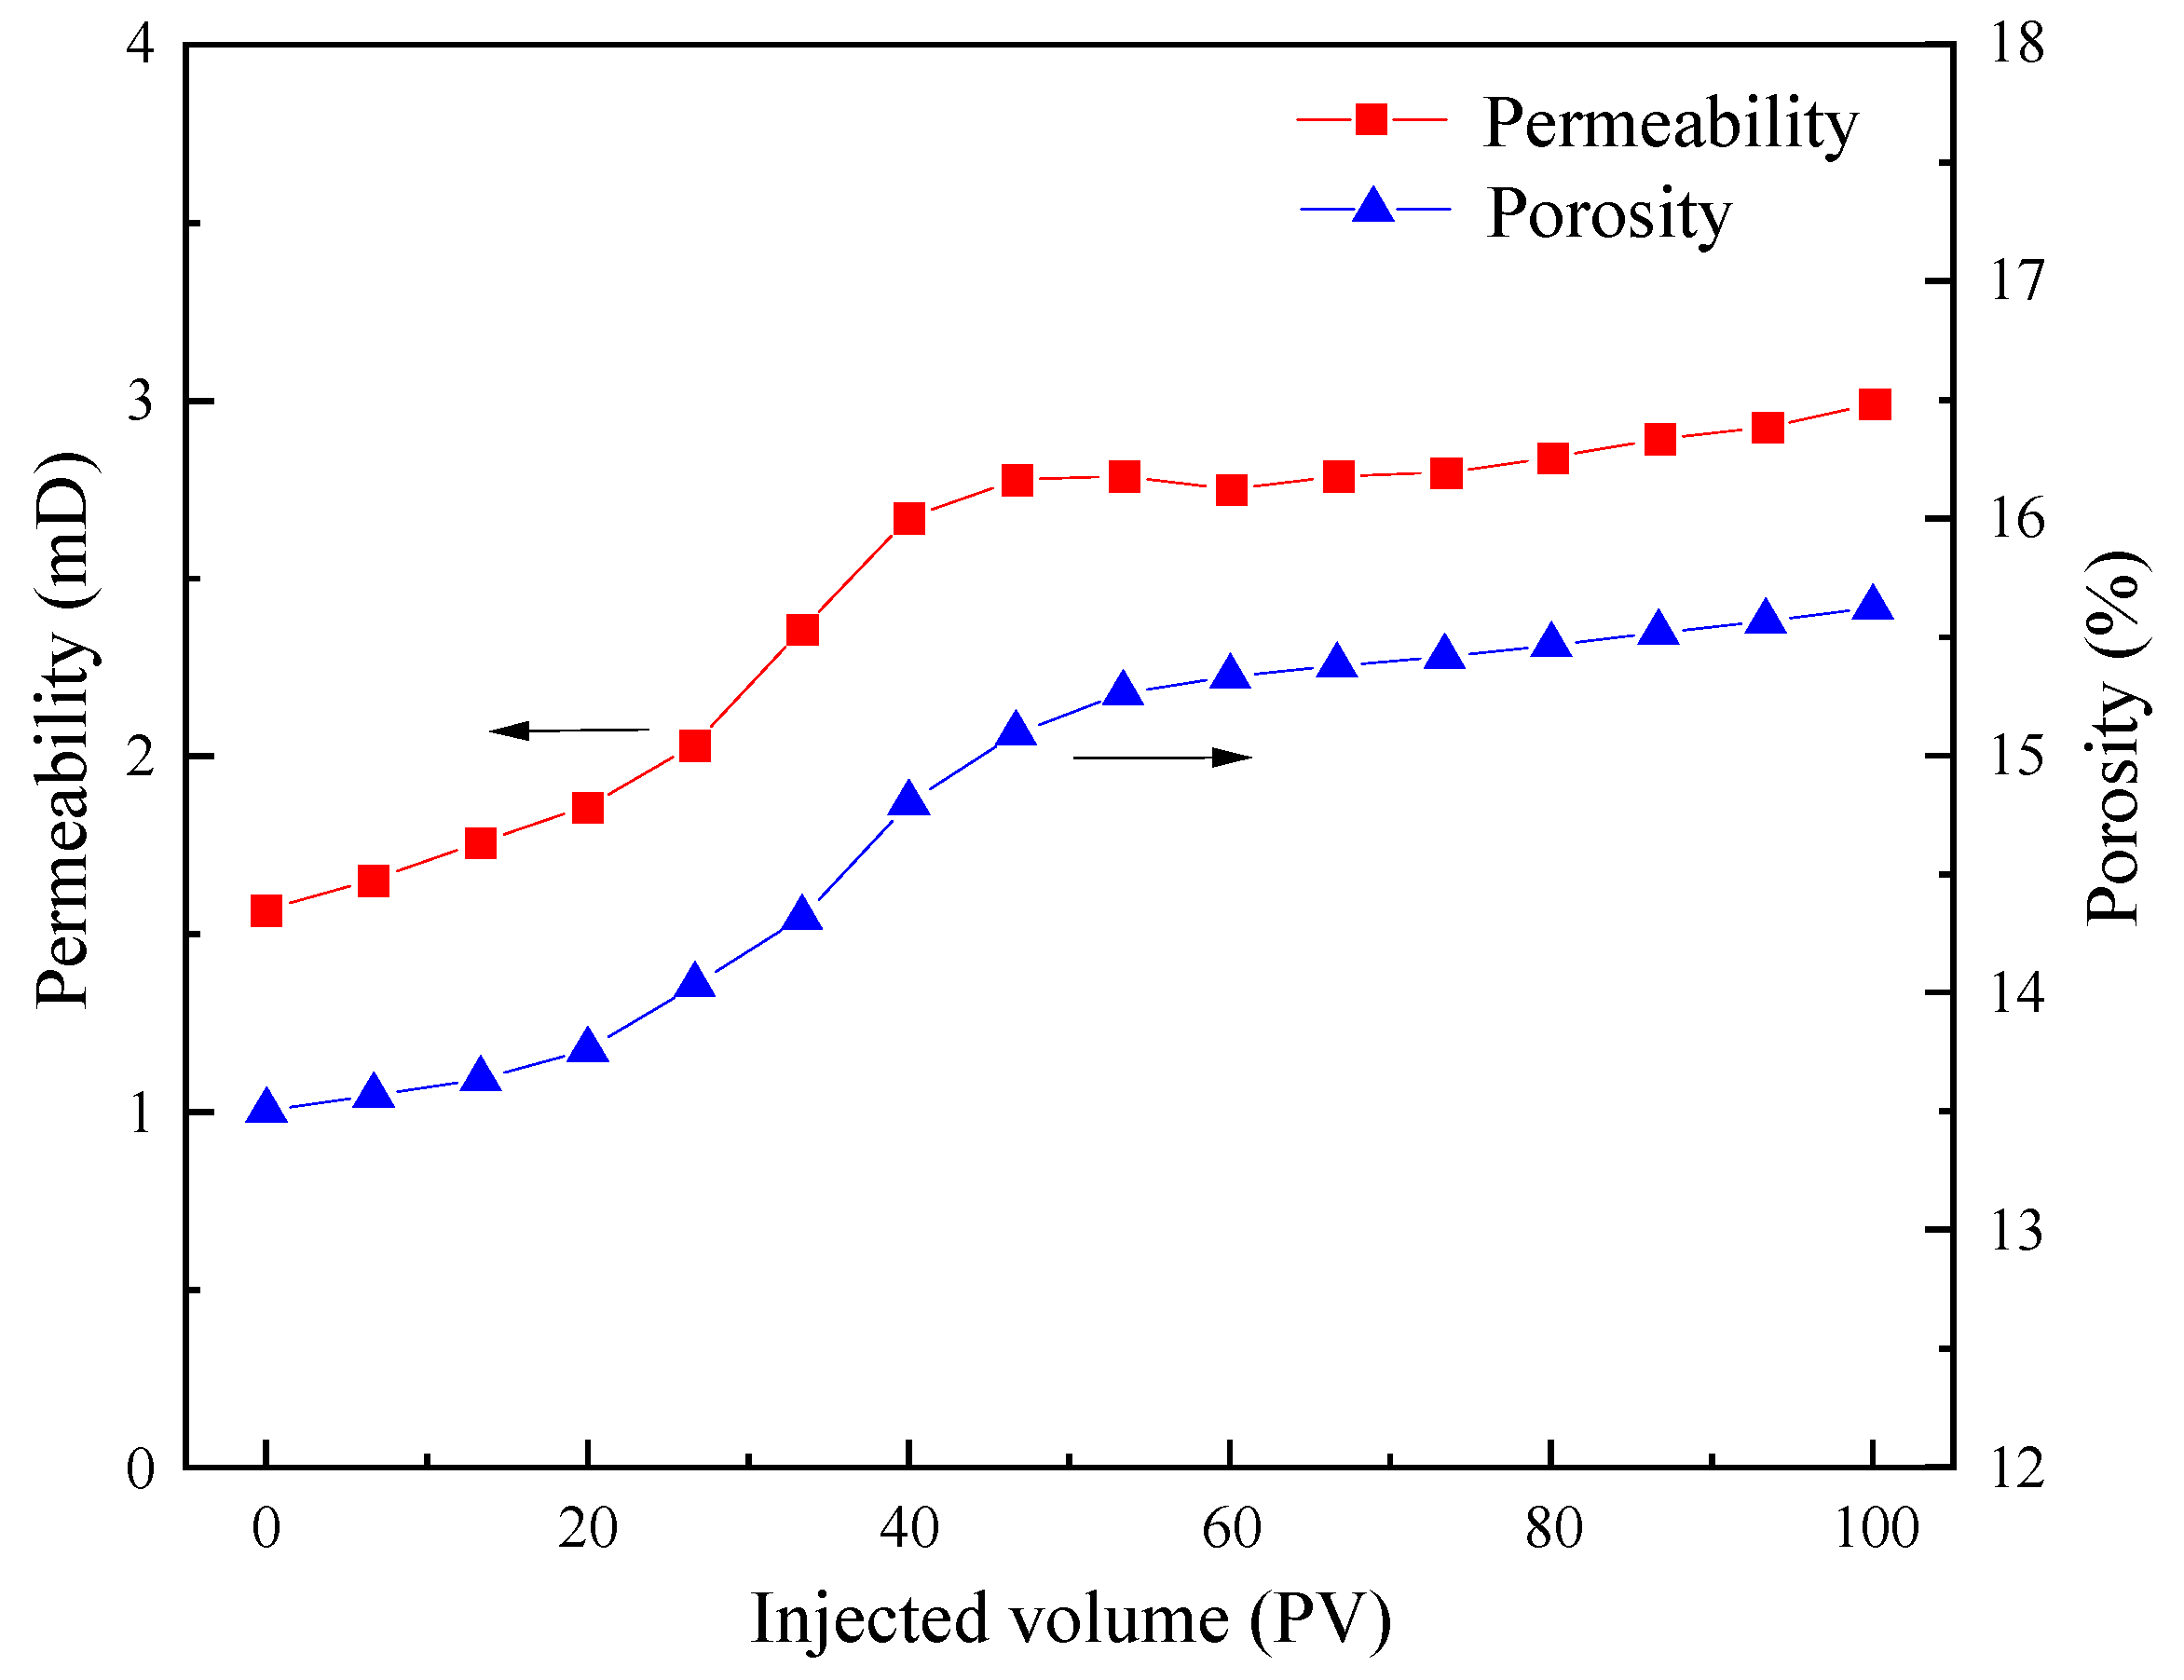
3.3.2. Dynamic Erosion Experiments

(1) Effect of flooding erosion on the micromorphology of rock cores
The internal structure of the core was tortuous and complex. In order to observe the morphological changes in the core before and after erosion, a scanning electron microscope (SEM) (SU8020, produced by Hitachi, Tokyo, Japan) was used to test the core slices and to analyze the mechanism of the interaction between CO2, the water, and the rocks. The SEM microscopic morphology of the minerals before and after the erosion reaction with the CO2 is shown in Figure 16. The micropores and the pores were poorly connected with the rock particles, the iron dolomite, and the small amount of paged kaolinite on the surface before the flooding. After the erosion reaction with the CO2, the micropores and the pores were more developed, and their connectivity was improved. Furthermore, intergranular pores were generated due to the erosion.
(2) Effect of flooding erosion on the permeability of the sandstone
Weak erosion of the sandstone skeleton structure was caused by the CO2–water system under the formation conditions. The generated secondary minerals blocked the pores or were discharged from the formation through fluid migration, and this affected the permeability of the reservoir and the storage potential after CO2 flooding. The effect of the CO2–water system on the permeability and porosity of the core is shown in Figure 17. The permeability increased from 1.57 mD to 2.99 mD (an increase of 90.45%). The porosity increased from 13.502% to 15.624%. In the early stage of erosion, the combined effect of particle migration and inorganic precipitation caused by erosion led to a slow growth in the permeability and porosity of the core. As the erosion proceeded, the effect of particle transport on the permeability and porosity of the core gradually decreased while the effect of inorganic precipitation gradually increased. The permeability and porosity of the core gradually increased as the erosion caused by the CO2–formation water system continued.
(3) Effect of flooding erosion on the sandstone pore structure
An NMR test was conducted and the NMR T2 spectra of the cores were analyzed to investigate the effect of the CO2–water erosion on the pore structure. It can be observed from Figure 18 that the core with the smaller pore structure was characterized and had a very small number of large pores. The T2 spectral curve from after the carbon dioxide flooding is shifted to the right, and the relaxation time grew longer, indicating that the volume of the pores increased to a certain degree. Furthermore, judging from the magnitude of the rightward shift of the curve, the smaller pores had a stronger corrosion effect than the larger pores.

3.4. Storage following the Process of CO2 Flooding

The final variations in oil recovery and CO2 retention rate following CO2 flooding are shown with the injection volume in Figure 19. The CO2 retention rate is the amount of CO2 retained in the porous medium to the total amount of CO2 injected, and the final retention rate of CO2 is the storage rate.
The forms of CO2 storage in reservoirs include free and irreducible storage, dissolved storage, and mineralized storage. Based on the above studies of CO2 storage mechanisms, a method for calculating the amount and percentage of CO2 stored in different forms during CO2 flooding was confirmed in this paper.
(1) Calculation of total storage capacity
Total storage is the difference between the total volume of injected CO2 and produced CO2. A conversion factor (the ratio of the volume at atmospheric pressure to the volume at 12 MPa) was introduced to standardize the criteria (Table 9). The following CO2 volumes were converted to the corresponding volumes at atmospheric pressure using the conversion factors. The total storage volume obtained in this paper was 1057.034 mL, and the corresponding formulas are shown in Formulas (6) and (7):
(Total volume of injected CO2)atmospheric pressure = (Total volume of injected CO2)12 MPa × Conversion factor
(Total volume of storage)atmospheric pressure = (Total volume of injected CO2)atmospheric pressure − (Total volume of produced CO2)atmospheric pressure
(2) Calculation of free and irreducible storage capacity
Free and irreducible CO2 exists in the reservoir in a free state and replaces a portion of the volume of the oil and water under the pressure of the reservoir. This replaced portion of the oil and water is then driven out of the reservoir to the production well. Therefore, the volume of liquid produced is approximately equal to the volume of CO2 stored in this form (free and irreducible state). The free and irreducible storage volume obtained in this paper was 640.871 mL, and the corresponding formulas are shown in Formulas (8) and (9):
(Volume of free and irreducible storage)12 MPa = Volume of produced liquid
(Volume of free and irreducible storage)atmospheric pressure = (Volume of free and irreducible storage)12 MPa × Conversion factor
(3) Calculation of mineralized storage capacity
The capacity of the eroded and stored CO2 (g/g) per unit mass of minerals was calculated using the equations shown below (Formulas (10)–(13)) for the chemical reactions of various rocks with CO2. The calculated amounts of mineralized storage are shown in Table 10. The amounts of various mineral components contained in the rock before and after CO2 flooding were detected using XRD, and the amount of mineralized CO2 storage was also obtained. The minerals that undergo erosion reactions are mainly feldspar and kaolinite, and the amount of other eroded minerals is negligible. The total mineralized storage capacity is obtained by summing the amount of mineralized stored CO2 for each mineral. The density of CO2 at atmospheric pressure is 1.977 g/L, and the unit used for mineralized CO2 storage was converted from mass to volume at atmospheric pressure. The equations relating to the erosion reaction are shown in Formulas (10)–(13). The total amount of mineralized CO2 was 0.583 g, and 294.912 mL of CO2 (volume at atmospheric pressure) was stored in the reservoir in mineralized form.
2 KAlSi 3 O 8 + 2 CO 2 + 3 H 2 O Al 2 Si 2 O 5 ( OH ) 4 + 2 KHCO 3 + 4 SiO 2
2 NaAlSi 3 O 8 + 2 CO 2 + 3 H 2 O Al 2 Si 2 O 5 ( OH ) 4 + 2 NaHCO 3 + 4 SiO 2
CaAl 2 Si 2 O 8 + 2 CO 2 + 3 H 2 O Al 2 Si 2 O 5 ( OH ) 4 + Ca ( HCO 3 ) 2
Al 2 Si 2 O 5 ( OH ) 4 + H 2 O + 2 CO 2 + 2 Na + NaAlCO 3 ( OH ) 2 + 2 SiO 2 + 2 H +
(4) Dissolved storage capacity
Some CO2 is dissolved in the residual water and residual oil after CO2 flooding. When the free and irreducible storage, mineralized storage, and total storage values are obtained, the remaining CO2 can be assumed to exist in dissolved form in the reservoir. The volume of dissolved storage obtained in this paper was 121.559 mL, and the calculation formula is shown in Formula (14):
(Volume of dissolved storage)atmospheric pressure = (Volume of total storage)atmospheric pressure − (Volume of free and irreducible storage)atmospheric pressure − (Volume of mineralized storage)atmospheric pressure
The free and irreducible storage, mineralized storage, and dissolved storage percentages were 60.6%, 27.9%, and 11.5%, respectively (Table 11). CO2 is mainly stored in a free and irreducible state in the reservoir. Some of the CO2 participates in the erosion reaction and is stored in the rock or solution in mineralized form, or as ions. In addition, a small portion of the CO2 is dissolved in the residual water and oil after CO2 flooding [31].

4. Conclusions

In this study, the static and dynamic parameters of CO2 after being injected into a reservoir were systematically studied using various macro and micro methods. The interaction between CO2, formation water, and the rock surface as well as the mechanism by which this interaction influences CO2 storage were also studied in this paper. The main conclusions are as follows:
(1) The variation in the solubility of CO2 in crude oil with pressure is similar to that in formation water. The solubility of CO2 increases as the pressure increases under low-pressure conditions. As the temperature increases, the viscosity of crude oil decreases significantly, and the solubility of CO2 is significantly increased in low-viscosity crude oil.
(2) The ability of crude oil to accommodate CO2 can be improved; it is easier for CO2 to diffuse into the oil phase at a high temperature. More resistance is encountered when CO2 diffuses into the liquid-containing space of the irregular core, causing the coefficient of diffusion into the oil–water two-phase flow in the porous medium to become smaller.
(3) Because CO2–water has a certain erosion effect on albite and potassium feldspar, the Na+ and K+ content increased as the erosion time increased. The change trend of the Ca2+ concentration was roughly consistent with that of the Na+ and K+. The quartz content in the mineral component increased and the plagioclase and potassium feldspar content significantly decreased due to the erosion reaction with CO2. The dissolution of the feldspar led to the formation of a large amount of secondary kaolinite, causing the kaolinite content to increase.
(4) In the early stage of erosion by CO2 during the dynamic flooding, the core permeability and porosity increased slowly. As the erosion progressed, the degree of influence of particle migration on the permeability and porosity of the cores gradually decreased while the influence of inorganic precipitation increased. The secondary pores played a role during the flooding, causing the permeability and porosity of cores to gradually increase.
(5) The percentages of free and irreducible storage, mineralized storage, and dissolved storage were 60.6%, 27.9%, and 11.5%, respectively. CO2 is mainly stored in a free and irreducible state in the reservoir. Some of the CO2 participates in the erosion reaction and is stored in the rock or solution in mineralized form or as ions. In addition, a small portion of the CO2 is dissolved in the residual water and oil after CO2 flooding.

Author Contributions

Methodology, Q.F.; Software, X.C. and Y.J.; Validation, X.C. and Y.J.; Formal analysis, X.C. and Y.J.; Investigation, X.C. and Y.J.; Resources, X.C.; Writing—original draft, X.C. and Y.J.; Supervision, Q.F. All authors have read and agreed to the published version of the manuscript.

Funding

This research received no external funding.

Data Availability Statement

Data are contained within the article.

Acknowledgments

The authors wish to thank the researchers who provided technical and economic assistance during this study.

Conflicts of Interest

Author Xiaopeng Cao and Yanfeng Ji were employed by the company Shengli Oilfield Company. The remaining authors declare that the research was conducted in the absence of any commercial or financial relationships that could be construed as a potential conflict of interest.

References

  1. Lokhorst, A.; Wildenborg, T. Introduction on CO2 Geological storage-classification of storage options. Oil Gas Sci. Technol. 2005, 60, 513–515. [Google Scholar] [CrossRef]
  2. Streit, J.E.; Hillis, R.R. Estimating fault stability and sustainable fluid pressures for underground storage of CO2 in porous rock. Energy 2004, 29, 1445–1456. [Google Scholar] [CrossRef]
  3. Zendehboudi, S.; Khan, A.; Carlisle, S.; Leonenko, Y. Ex situ dissolution of CO2: A new engineering methodology based on mass-transfer perspective for enhancement of CO2 sequestration. Energy Fuels 2011, 25, 3323–3333. [Google Scholar] [CrossRef]
  4. Tayeb, F.; Rouabhi, A.; AbuAisha, M.; Valtz, A. Kinetics of CO2 dissolution for underground applications. Geoenergy Sci. Eng. 2023, 230, 212061. [Google Scholar] [CrossRef]
  5. Damen, K.; Faaij, A.; Turkenburg, W. Health, safety and environmental risks of underground CO2 storage-overview of mechanisms and current knowledge. Climatic Change 2006, 74, 289–318. [Google Scholar] [CrossRef]
  6. Zhang, Z.; Wang, T.; Blunt, M.J.; Anthony, E.J.; Park, A.-H.A.; Hughes, R.W.; Webley, P.A.; Yan, J. Advances in Carbon Capture, Utilization and Storage; Elsevier: Amsterdam, The Netherlands, 2020; Volume 278, p. 115627. [Google Scholar]
  7. Nocito, F.; Dibenedetto, A. Atmospheric CO2 mitigation technologies: Carbon capture utilization and storage. Curr. Opin. Green Sustain. Chem. 2020, 21, 34–43. [Google Scholar] [CrossRef]
  8. Orr, F.M., Jr. Carbon capture, utilization, and storage: An update. Spe J. 2018, 23, 2444–2455. [Google Scholar] [CrossRef]
  9. Gilfillan, S.M.; Lollar, B.S.; Holland, G.; Blagburn, D.; Stevens, S.; Schoell, M.; Cassidy, M.; Ding, Z.; Zhou, Z.; Lacrampe-Couloume, G. Solubility trapping in formation water as dominant CO2 sink in natural gas fields. Nature 2009, 458, 614–618. [Google Scholar] [CrossRef]
  10. Ahmadi, P.; Chapoy, A. CO2 solubility in formation water under sequestration conditions. Fluid Phase Equilibria 2018, 463, 80–90. [Google Scholar] [CrossRef]
  11. Zhang, W.; Wu, S.; Ren, S.; Zhang, L.; Li, J. The modeling and experimental studies on the diffusion coefficient of CO2 in saline water. J. CO2 Util. 2015, 11, 49–53. [Google Scholar] [CrossRef]
  12. Li, S.; Li, Z.; Dong, Q. Diffusion coefficients of supercritical CO2 in oil-saturated cores under low permeability reservoir conditions. J. CO2 Util. 2016, 14, 47–60. [Google Scholar] [CrossRef]
  13. Askari, G.; Rostami, B.; Ghasemi, M. Impact of water saturation on diffusion coefficients determined by constant volume diffusion method. J. Pet. Sci. Eng. 2022, 212, 110290. [Google Scholar] [CrossRef]
  14. Miller, J.S.; Jones, R.A. A Laboratory Study to Determine Physical Characteristics of Heavy Oil after CO2 Saturation. In SPE/DOE Enhanced Oil Recovery Symposium; OnePetro: Richardson, TX, USA, 1981. [Google Scholar]
  15. Riazi, M.R. A new method for experimental measurement of diffusion coefficients in reservoir fluids. J. Pet. Sci. Eng. 1996, 14, 235–250. [Google Scholar] [CrossRef]
  16. Geerlings, H.; Zevenhoven, R. CO2 mineralization-bridge between storage and utilization of CO2. Annu. Rev. Chem. Biomol. Eng. 2013, 4, 103–117. [Google Scholar] [CrossRef]
  17. Kelemen, P.; Benson, S.M.; Pilorgé, H.; Psarras, P.; Wilcox, J. An overview of the status and challenges of CO2 storage in minerals and geological formations. Front. Clim. 2019, 1, 9. [Google Scholar] [CrossRef]
  18. Assen, A.H.; Belmabkhout, Y.; Adil, K.; Lachehab, A.; Hassoune, H.; Aggarwal, H. Advances on CO2 storage. Synthetic porous solids, mineralization and alternative solutions. Chem. Eng. J. 2021, 419, 129569. [Google Scholar] [CrossRef]
  19. Ryzhenko, B. Genesis of dawsonite mineralization: Thermodynamic analysis and alternatives. Geochem. Int. 2006, 44, 835–840. [Google Scholar] [CrossRef]
  20. Izgec, O.; Demiral, B.; Bertin, H.; Akin, S. CO2 injection into saline carbonate aquifer formations I. Transp. Porous Media 2008, 72, 1–24. [Google Scholar] [CrossRef]
  21. Tiong, M.; Gholami, R.; Abid, K.; Rahman, M.E. Nanomodification: An efficient method to improve cement integrity in CO2 storage sites. J. Nat. Gas Sci. Eng. 2020, 84, 103612. [Google Scholar] [CrossRef]
  22. Zhao, X.; Liao, X.; He, L. The evaluation methods for CO2 storage in coal beds, in China. J. Energy Inst. 2016, 89, 389–399. [Google Scholar] [CrossRef]
  23. Ajoma, E.; Sungkachart, T.; Saira; Yin, H.; Le-Hussain, F. A laboratory study of coinjection of water and CO2 to improve oil recovery and CO2 storage: Effect of fraction of CO2 injected. SPE J. 2021, 26, 2139–2147. [Google Scholar] [CrossRef]
  24. Li, Z.; Su, Y.; Shen, F.; Huang, L.; Ren, S.; Hao, Y.; Wang, W.; Meng, Y.; Fan, Y. Investigation of CO2 storage and EOR of alternating N2 and CO2 injection using experiments and numerical simulation. Fuel 2023, 340, 127517. [Google Scholar] [CrossRef]
  25. Yao, Y.; Li, X. A study on CO2 flooding effectiveness and its geologic storage. Xinjiang Pet. Geol. 2009, 30, 493. [Google Scholar]
  26. Yang, Z.; Wu, W.; Dong, Z.; Lin, M.; Zhang, S.; Zhang, J. Reducing the minimum miscibility pressure of CO2 and crude oil using alcohols. Colloids Surf. A: Physicochem. Eng. Asp. 2019, 568, 105–112. [Google Scholar] [CrossRef]
  27. Kavousi, A.; Torabi, F.; Chan, C.W.; Shirif, E. Experimental measurement and parametric study of CO2 solubility and molecular diffusivity in heavy crude oil systems. Fluid Phase Equilibria 2014, 371, 57–66. [Google Scholar] [CrossRef]
  28. Li, W.; Nan, Y.; You, Q.; Jin, Z. CO2 solubility in brine in silica nanopores in relation to geological CO2 sequestration in tight formations: Effect of salinity and pH. Chem. Eng. J. 2021, 411, 127626. [Google Scholar] [CrossRef]
  29. Rezk, M.G.; Foroozesh, J.; Abdulrahman, A.; Gholinezhad, J. CO2 diffusion and dispersion in porous media: Review of advances in experimental measurements and mathematical models. Energy Fuels 2021, 36, 133–155. [Google Scholar] [CrossRef]
  30. Farquhar, S.; Pearce, J.; Dawson, G.; Golab, A.; Sommacal, S.; Kirste, D.; Biddle, D.; Golding, S. A fresh approach to investigating CO2 storage: Experimental CO2-water-rock interactions in a low-salinity reservoir system. Chem. Geol. 2015, 399, 98–122. [Google Scholar] [CrossRef]
  31. Li, Z.; Su, Y.; Li, L.; Hao, Y.; Wang, W.; Meng, Y.; Zhao, A. Evaluation of CO2 storage of water alternating gas flooding using experimental and numerical simulation methods. Fuel 2022, 311, 122489. [Google Scholar] [CrossRef]
Figure 1. Experimental flow chart of CO2 diffusion into the saturated liquid porous medium.
Processes 11 03331 g001
Figure 2. Curves showing the relationship between solubility and pressure.
Processes 11 03331 g002
Figure 3. Curves showing the relationship between solubility and temperature.
Processes 11 03331 g003
Figure 4. Solubility and pressure curves of multiple samples (30 °C, 120 °C).
Processes 11 03331 g004
Figure 5. The semi-logarithmic viscosity–temperature curve for the used crude oil sample.
Processes 11 03331 g005
Figure 6. Solubility–pressure curves of CO2 in the crude oil.
Processes 11 03331 g006
Figure 7. Solubility–temperature curves of CO2 in the crude oil.
Processes 11 03331 g007
Figure 8. CO2 pressure–time curves for the pure water system.
Processes 11 03331 g008
Figure 9. CO2 Pressure–time curves for the diffusion system.
Processes 11 03331 g009
Figure 10. P–t nonlinear fitting curve of CO2 diffusion into saturated oil–water porous medium (initial pressure 5.0 MPa, 60 °C).
Processes 11 03331 g010
Figure 11. P–t nonlinear fitting curve of CO2 diffusion into saturated oil–water porous medium (initial pressure 12.0 MPa, 60 °C).
Processes 11 03331 g011
Figure 12. P–t nonlinear fitting curve of CO2 diffusion into saturated oil–water porous medium (initial pressure 15.0 MPa, 60 °C).
Processes 11 03331 g012
Figure 13. Concentrations of different metal ions after corrosion reactions.
Processes 11 03331 g013
Figure 14. X-ray diffraction spectra of whole rock minerals.
Processes 11 03331 g014
Figure 15. Diagram of changes in mineral composition and content.
Processes 11 03331 g015
Figure 16. SEM images of the core before and after erosion.
Processes 11 03331 g016
Figure 17. Curves showing effect of CO2–water system on core porosity and permeability. (The right arrow represents porosity, and the left arrow represents permeability.)
Processes 11 03331 g017
Figure 18. Distribution of NMR T2 spectra of low-permeability cores.
Processes 11 03331 g018
Figure 19. Variations in oil recovery and retention rate according to the amount of injected fluid.
Processes 11 03331 g019
Table 1. Ion composition of the simulated water.
Sample NumberIonic SpeciesNa+ + K+Ca2+Mg2+ClSO42−CO32−HCO3Total Mineralization
1Concentration (mg/L)228142021532504910013,500
289221105242716,280227028829,249
327387206505227,74000611062,428
Table 2. Basic physical properties and components of the used crude oil.
Density/
(g·cm−3)
Ground Viscosity/
(mPa·s)
Saturates/wt%Aromatics
/wt%
Resin
/wt%
Asphaltene
/wt%
0.91212646.125.827.061.04
Table 3. Basic core data for the diffusion of porous media.
Core NumberLength/cmDiameter/cmPorosity/%Irreducible Water Saturation/%Fluid Measuring Permeability/mD
Sample 16.6352.50113.3427.841.65
Sample 26.8162.50513.4627.561.77
Sample 36.1302.49614.4127.441.68
Table 4. Basic core data for static erosion.
Core NumberLength/cmDiameter/cmPorosity/%Fluid Measuring Permeability/mD
Sample 16.7312.50413.571.55
Sample 27.8152.50613.891.67
Sample 38.1342.49614.161.71
Table 5. Physical parameters of the long cores used in the dynamic flooding experiment.
Diameter/cmLength/cmPorosity/%Fluid Measuring Permeability/mD
2.5830.1413.5021.57
Table 6. Results of CO2 diffusion coefficient in pure water.
ParameterLevel
Temperature/°C30.060.0
Initial pressure/MPa5.012.015.05.012.015.0
Coefficient of diffusion/m2·s−1 (×10−8)3.153.513.654.014.624.96
Table 7. Results of CO2 diffusion coefficient in crude oil.
ParameterLevel
Temperature/°C30.060.0
Initial pressure/MPa5.012.015.05.012.015.0
Coefficient of diffusion/m2·s−1 (×10−8)4.975.325.525.976.356.62
Table 8. Experimental parameters and CO2 diffusion into saturated oil–water porous medium.
ParameterLevel
Temperature/°C60.0
Initial pressure/MPa5.012.015.0
Diffusion coefficient/m2·s−1 (×10−10)3.203.674.16
Table 9. CO2 conversion factor.
Experiment Number Volume of Injected Water, mLConversion FactorAverage Value of Conversion Factors
1 496.55 144.8142.1
2496.42 139.6
3496.48 142.0
Table 10. Calculated amounts of mineralized storage.
Mineral TypeCapacity of Solidified CO2 per Unit Mass of Mineral (g/g)Mineral Consumption (g)Amount of Solidified CO2 (g)
NaAlSi3O80.1670.240.040
Ca(AlSi3O8)20.1700.620.105
KAlSi3O80.7210.550.397
Al2Si2O5(OH)40.3410.120.041
Table 11. Amount of CO2 Stored in different forms (atmospheric pressure).
Form of StorageFree and Irreducible StorageMineralized StorageDissolved Storage
Storage volume, mL640.871294.912121.559
Storage proportion, %60.627.911.5
Disclaimer/Publisher’s Note: The statements, opinions and data contained in all publications are solely those of the individual author(s) and contributor(s) and not of MDPI and/or the editor(s). MDPI and/or the editor(s) disclaim responsibility for any injury to people or property resulting from any ideas, methods, instructions or products referred to in the content.

