Article

New Equipment for Determining Friction Parameters in External Conditions: Measurements for the Design

1
ENET Centre, CEET, VSB—Technical University of Ostrava, 17. listopadu 15/2172, 708 33 Ostrava, Czech Republic
2
Department of Mining Engineering and Safety, Faculty of Mining and Geology, VSB—Technical University of Ostrava, 17. listopadu 15/2172, 708 33 Ostrava, Czech Republic
*
Author to whom correspondence should be addressed.
Processes 2023, 11(12), 3348; https://doi.org/10.3390/pr11123348
Submission received: 31 October 2023 / Revised: 27 November 2023 / Accepted: 29 November 2023 / Published: 1 December 2023
(This article belongs to the Topic Advances in Power Science and Technology)

Abstract

:
Friction parameters such as the angle of internal friction and the external friction of soils (bulk materials) show the possibilities of further material use. These are, for example, possibilities for soil processing, handling, and storage. The determination of friction parameters is usually carried out under laboratory conditions. For the possibility of determining the properties of soils outside the laboratory in terms of immediate material response, a laboratory prototype was developed. The main objective for its development was to determine the effect of the shape of the friction surface when “sliding” on the soil. This was achieved with the help of validation equipment designed to measure, test, and validate the processes of raking, material piling, material transfer and removal, and tool movement or sliding on or in a material. It was found that by using an appropriate speed and normal load, the Jenike method can be applied to determine the angle of external friction over a shorter distance with an error of about 6–7.5% from the values measured on a calibrated shear machine. The results also showed that the method can be applied to detect the shear stresses that arise when a tool is plunged into a material, and thus predict the possible increase in energy loss during the process.

1. Introduction

For the transport, handling, processing, storage, and other processes with soils (bulk materials), it is important to determine the mechanical and physical properties. These properties are determined primarily to predict the process behavior of bulk/particle materials and to possibly find the critical points, of both a given equipment and the critical conditions of the bulk material [1]. In some cases, the mechanical properties, transport, and storage of the material can be improved by the slight addition of a suitable additive [2,3,4]. In others, pretreatment of the material, such as milling, to change the behavior of the process [5] or pre-homogenization of alloys to improve their mechanical properties [6] are sufficient. The selected properties are measured mainly in accredited laboratories on standardized equipment under laboratory conditions. However, many times these properties do not correlate with the properties of the material in its raw state, which is also closely related to the place of collection. It is important to observe the sampling method of the different samples and also to determine the possible sampling error rate [7]. Measuring the mechanical and physical properties of soils in real conditions is difficult due to environmental influences such as rain, sun, wind, and temperature. Sample deterioration occurs during collection and transport. The sample should have the same characteristics as when it was collected. Loose material can degrade, change temperature, absorb moisture, or become soft or compacted if improperly transported and stored [8]. A sample so affected may not have the same properties as when it was collected. It would be appropriate to measure the parameters at a given location and under given conditions (climatic, stress, and dynamic effects), which is only possible when portable equipment is available [9,10,11]. For soil shear tests, a simple portable device has been developed to determine friction parameters in clay soils under different climatic conditions [12]. The device works on the principle of pushing the measuring head into the soil, and when the desired value of the normal load is reached, the shear head rotates at a defined depth. For accurate determination of the properties of soils, bulk materials, or other powders under realistic conditions, this approach is the right choice.
The friction parameters (angle of internal friction and external friction) of the soils affect all processes where the soil is further manipulated. They are important indicators of possibilities for material use in a multitude of applications [13,14,15,16]. Friction parameters affect both the life of the tools in contact with the soil and the soil itself, in the form of possible intoxication by residues resulting from wear or degradative reactions in the soil. Experience shows where it is essential to determine the necessary parameters on site [17,18]. These include field experiments in snow conditions, where portable instruments can determine the instantaneous cohesion of the snow. This can be used to analyze how cohesion and friction affect the increase in avalanche pressure. Therefore, portable devices that determine the angle of external friction are very important with respect to the instantaneous response of the material. Therefore, this study focuses on the development of such a device that determines the external friction angle based on the dynamic motion and response of the tool. Similar issues are also being addressed by ski manufacturers. It is necessary to know the reactions and interactions that occur between the ski motion and the snow [19,20].
This study consists of several parts. First, the validation system (device) on which the measurements were performed and its calibration and methodologies are described. Of course, a characterization of the bulk material used is presented. In order to ensure accurate measurements, the calibration of the process under static as well as dynamic loading was performed and is described below. The experiment itself, where a set of determinations was carried out to analyze the possibility of determining the friction parameters of the soils, was carried out and is described in detail on two different soils and at three working speeds. The initial shear stress and the partial reaction of the material as the tool (friction surface) moved within it were monitored in the measurement line. The final part of the paper is devoted to a discussion of the above-mentioned issues.

2. Materials and Methods

This study describes the design of a device for determining the dynamic frictional properties of a soil. It highlights the problem of the sliding of a solid body over the soil and the effect of increased wall friction when the tool penetrates the soil under the application of a specified normal load.

2.1. Materials

The soil type was determined using the composition and particle size of the coarse sandy soil (>0.6 mm to 2 mm) according to the norm CSN EN ISO 14688-1 [19].
Two samples with different fractions were used in the study. Silica sand with a grain size of 0.3–1 mm (sample 1) and silica sand with a grain size of 1.4–2 mm (sample 2) were measured. PLA filament was used as the contact material, which was used in the 3D printing of the tool. The active parts of the tools were smoothed/sanded after printing (with 120 grit sandpaper). Other materials used were aluminum (strain gauge, validation device frame), clear polycarbonate (plastic plates), steel (rails, guides, fasteners), and chipboard (dividing plate, bottom). The following parameters were measured: angle of external friction, bulk density, volume density, and particle size distribution.

2.2. Devices

In this study, five devices and measurement methods were used to measure the mechanical and physical properties of the bulk material. A Jenike shear tester was used to measure the angle of external friction of the bulk material (Figure 1). The volume density of the bulk material was measured using an Anton Paar gas pycnometer, type Ultrapyc 5000 [21,22]. The bulk density was measured via an experiment of pouring bulk material into a measuring cylinder [23] and the particle size distribution was measured on a Camsizer particle size analyzer [24].
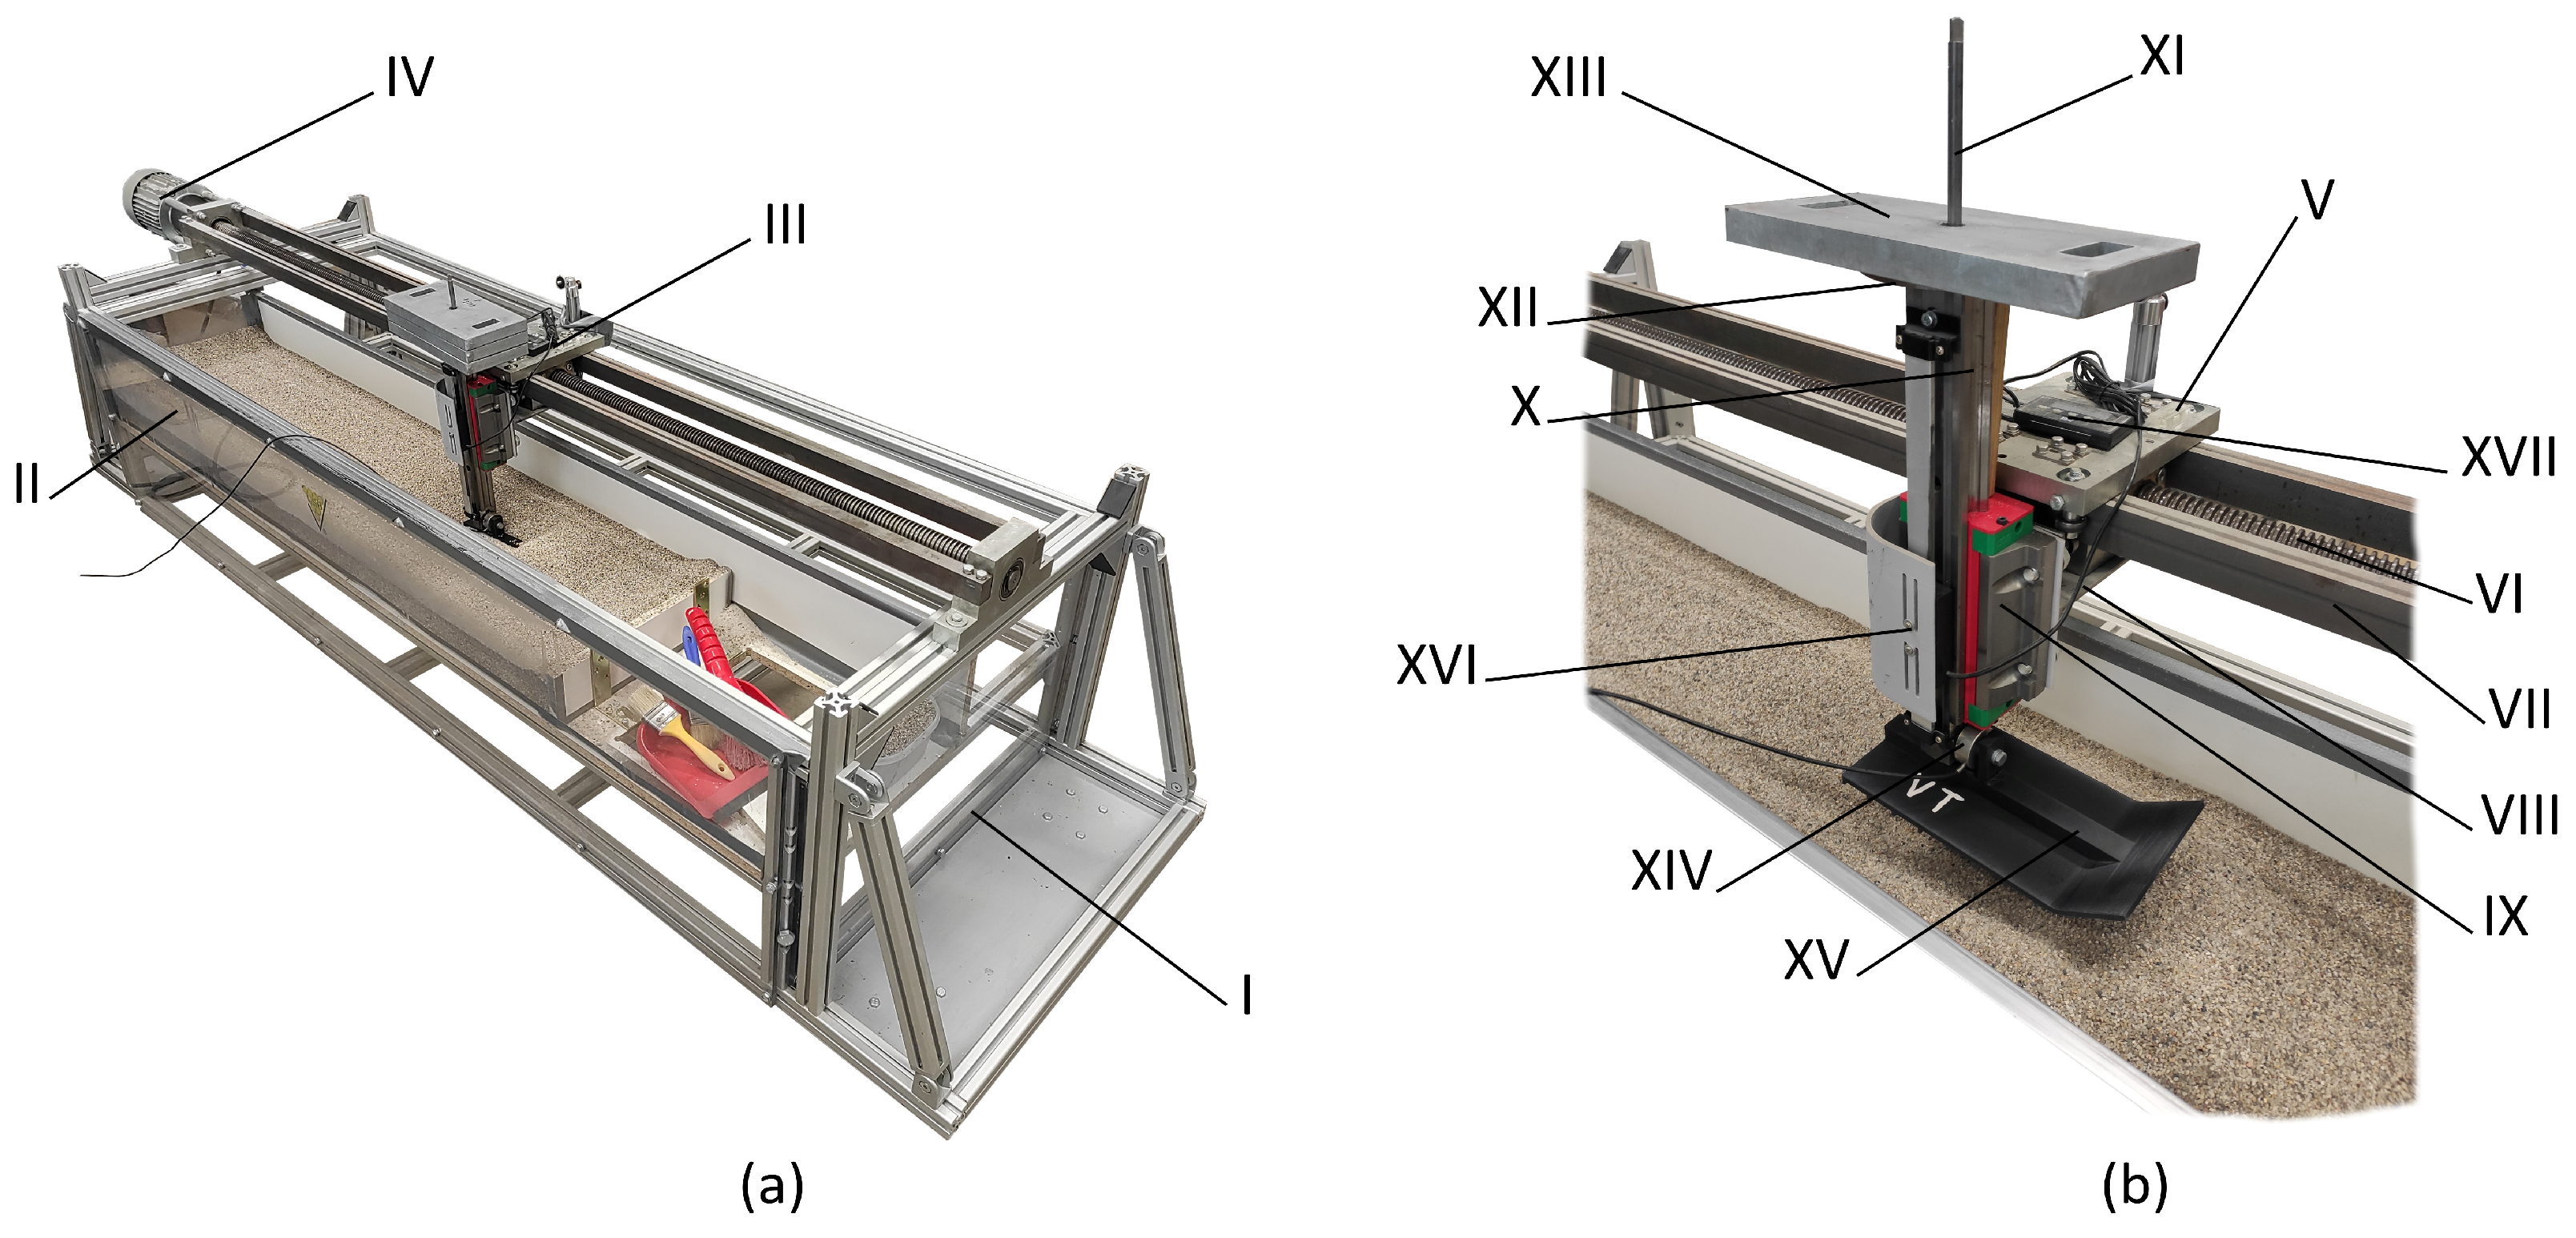
An alternative way of measuring the friction parameters and the penetration of the tool into the bulk material was measured on a validation system for pulling and pushing tools (hereafter validation system, Figure 2). Also, the apparatus was used to dynamically run the system. The validation system was patented by the VSB—Technical University of Ostrava [25].
The Jenike shear tester [26,27] uses the rectilinear movement of the measuring cell with the measured bulk material to determine the shear stress between the bulk material and the friction surface (angle of external friction). During the measurement, the bulk material is loaded into the shear cell/ring (I). The cell/ring (I) is then placed on the contact material (II) (shear surface of the tool). A lid (III) is placed on the bulk material, which is placed in the cell/ring (I), and contains a spike on the top. This spike is used to place a holder (IV) on which a weight (V) is placed to apply a normal load. The piston (VI) produces a straight-line movement, which is transferred to the lid (III) and cell/ring (I) via the tensiometer (VII) and thorn (VIII). The shear stress is measured using a tensiometer (VII). The normal and friction parameters are then entered into tables and evaluated by linearizing the set of measurements and reading the angle of the linearized curve and the horizontal axis of the graph. The working speed of the Jenike shear machine used in our laboratory is v = 25 mm min−1 and the volume of the shear cell/ring is S = 6.78 × 10⁻³ m2. Normal tension was induced using 1–4 weights with a weight of 4.4 kg per weight.
The Anton Paar gas pycnometer Ultrapyc 5000 (Anton Paar GmbH, Graz, Austria) is a device for measuring the real/volume density of solid porous and bulk materials. It works on the principle of measuring the volume of a gas (most commonly helium) [28].
The validation system is primarily designed to provide the necessary data in the areas of material raking, material piling, material transfer and removal, and tool movement or sliding on or in a material. Figure 2 describes the validation system, which consists of a support structure (I) composed of aluminum profiles and clear polycarbonate plates, an adjustable bottom (II), a linear guide (III), and a drive (IV). The linear guide (III) consists of the travel (V), the threaded rod TR40x7 (Libor Muron PERFEKT, Ostrava, Czech Republic) (VI), and the guide rods (VII). A weldment (VIII) is attached to the travel (V) using fasteners, to which the flange carriage with ball guide HGW 45HC Z0H (HIWIN s.r.o., Brno, Czech Republic) (IX) is attached in the same way. The T-rail HIWIN HGR45T-0364 (HIWIN s.r.o., Brno, Czech Republic) (X) is inserted through the groove of the ball guide. A holder (XII) is attached to the head of the rail (X) by means of a rod (XI), on which a weight (XIII) is placed. A diaphragm force transducer (MEG30, 500 N, MEGATRON, s.r.o., Prague, Czech Republic) (XIV) is placed at the foot of the rail (X), on which is the skid/tool (XV). The normal load on the bulk material was set at 1–4 weights (XIII) (where one weight has a mass of 4.4 kg). In addition, a digital caliper (HMB Machines, Moordrecht, The Netherlands) (XVI) is attached to the device, where the values can be read from the panel (XVII), which is located on the travel (V). The drive (IV) is started using the Sinamics G110 AIN frequency converter.
After the drive (IV) is put into operation, the threaded rod TR40x7 (VI) starts to rotate. Using the RT40x7 nut, which is located in the linear guide (III), the rotary motion is converted into a straight-line motion. The linear guide (III) then moves back and forth in the axis of the threaded rod TR40x7 (VI). This motion is transferred from the weldment (VIII), the ball guide HGW 45HC Z0H (IX), the T-rail HIWIN HGR45T-0364 (X), and the diaphragm force transducer (MEG30, 500 N) (XIV) to the tool (XV), which moves parallel to the axis of the threaded rod TR40x7 (VI).
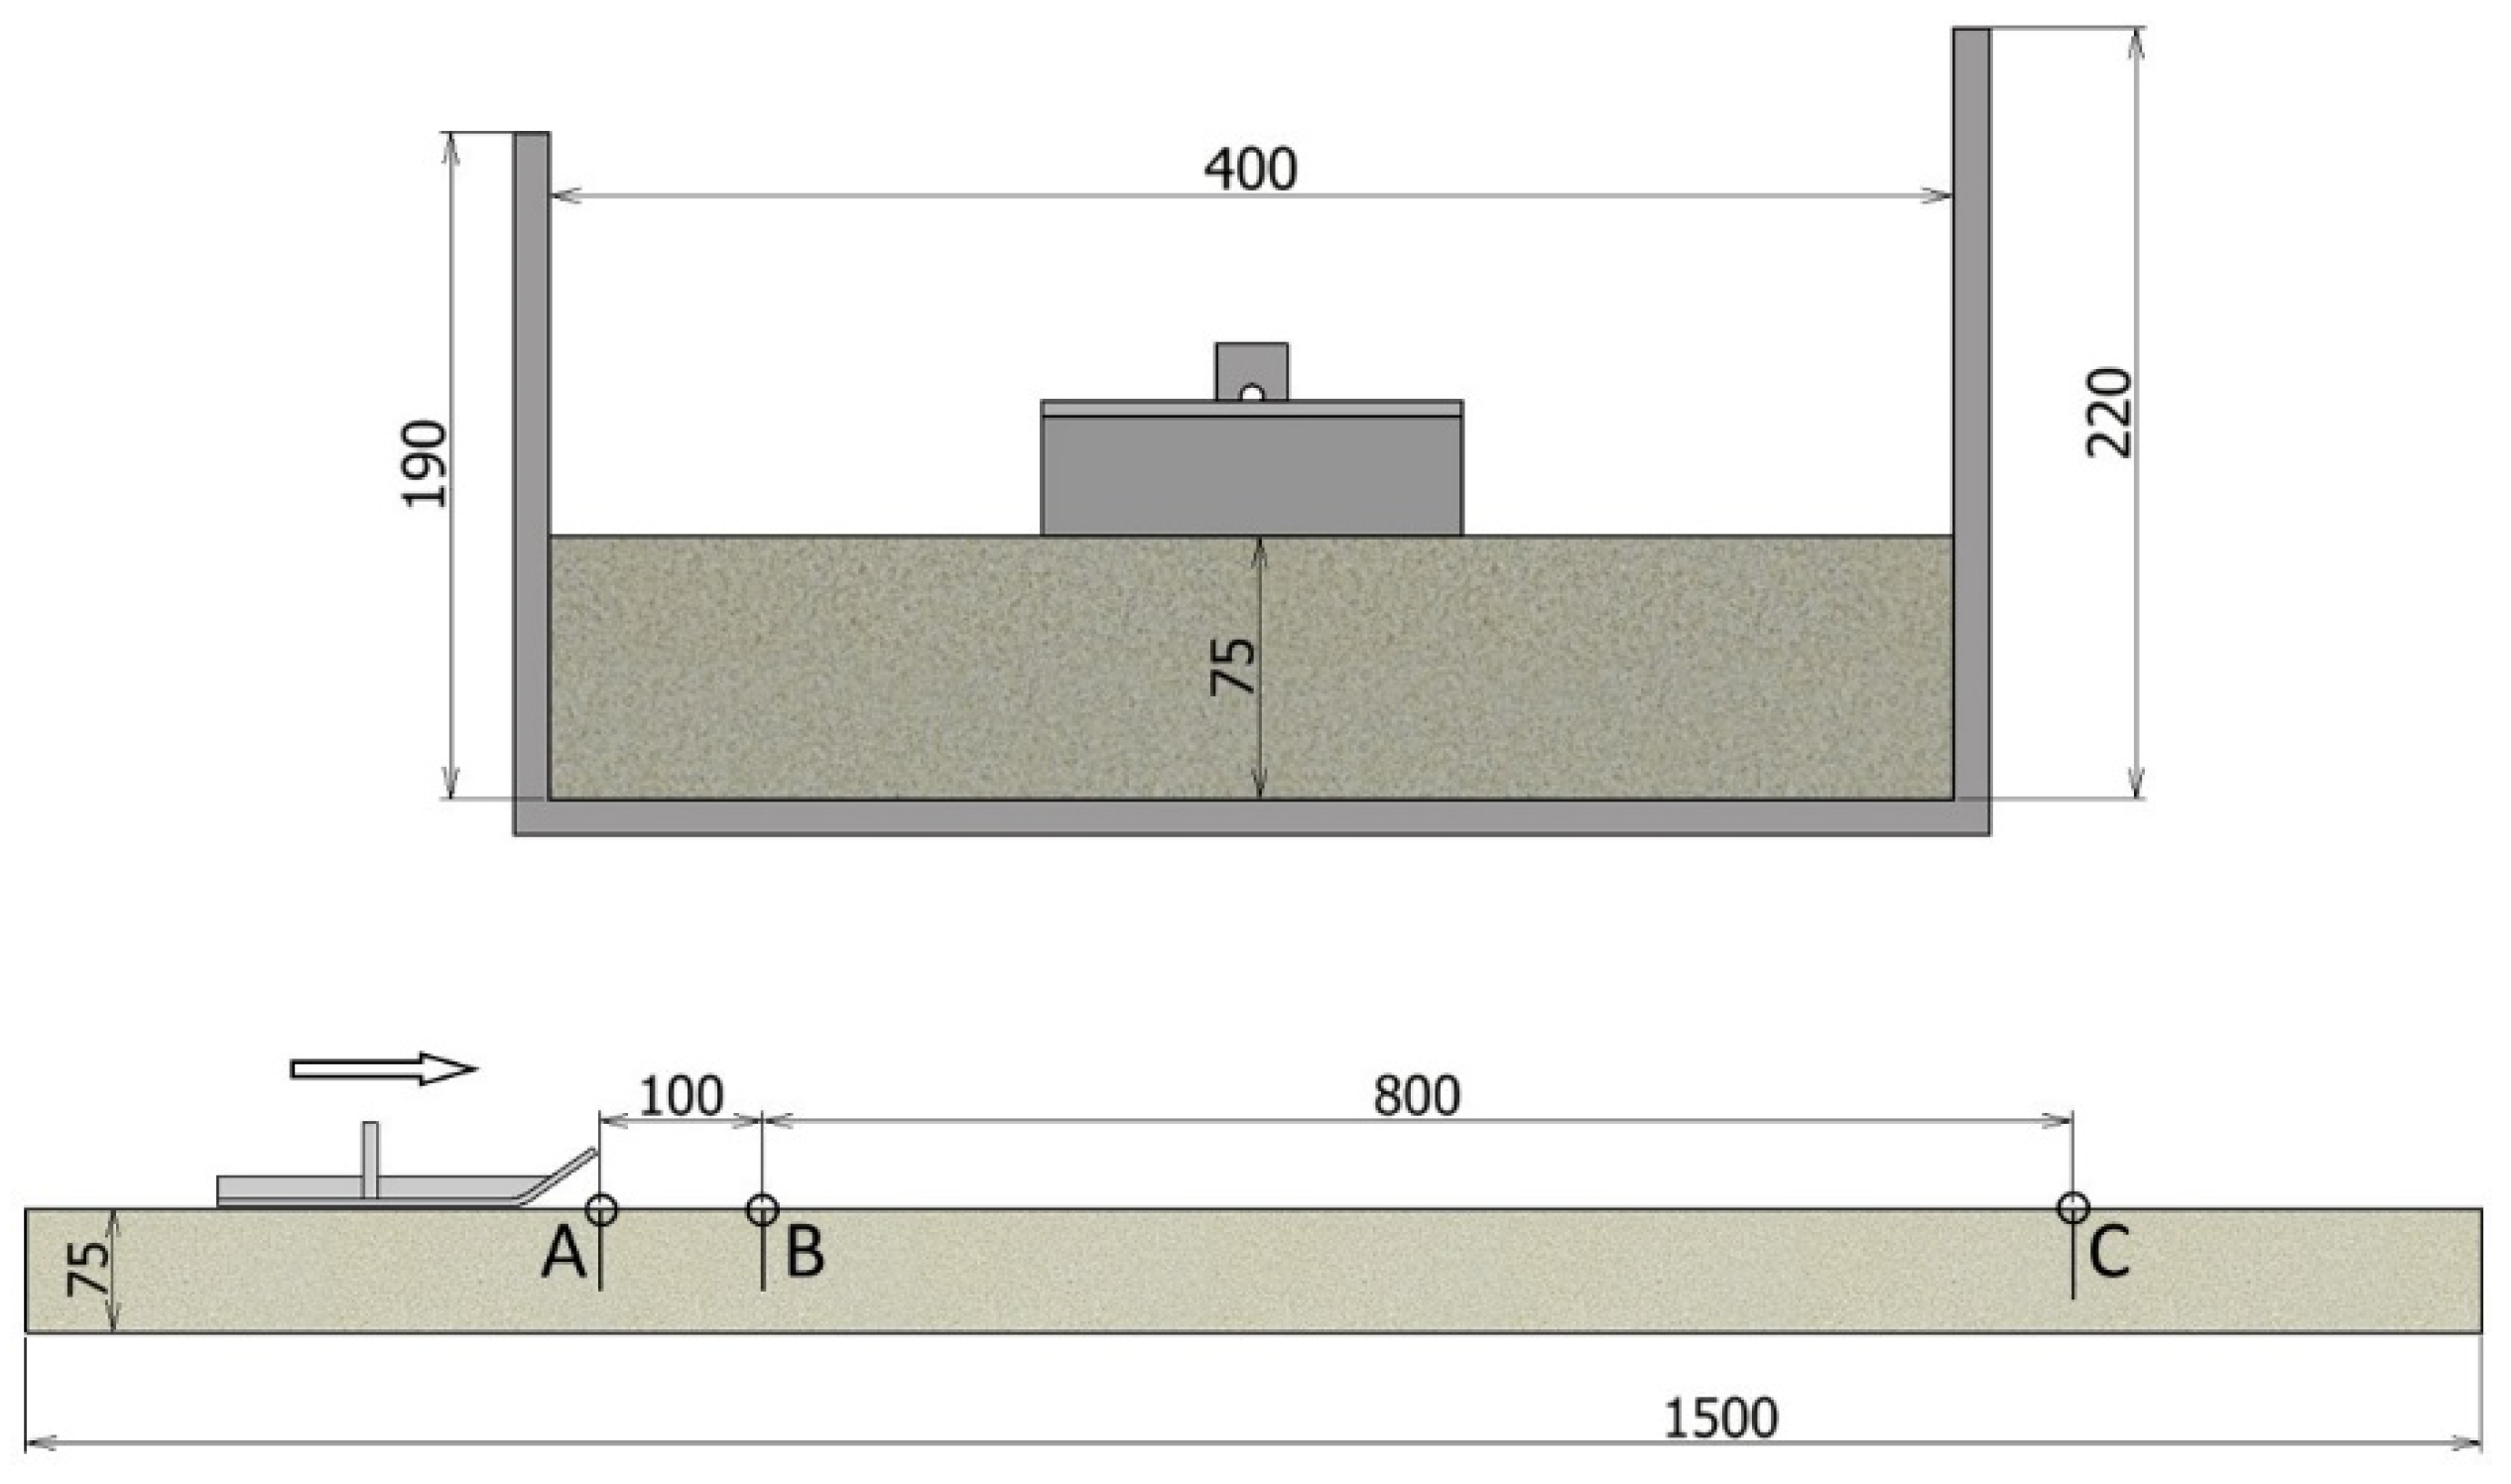
Figure 3 shows the basic geometrical parameters of the experiment, the length of the tool movement, its direction of movement, and the height of the material in the validation device. Three working speeds were used for the experiment. The tool start-up length was then run between points A and B and the measurement itself was run between points B and C.
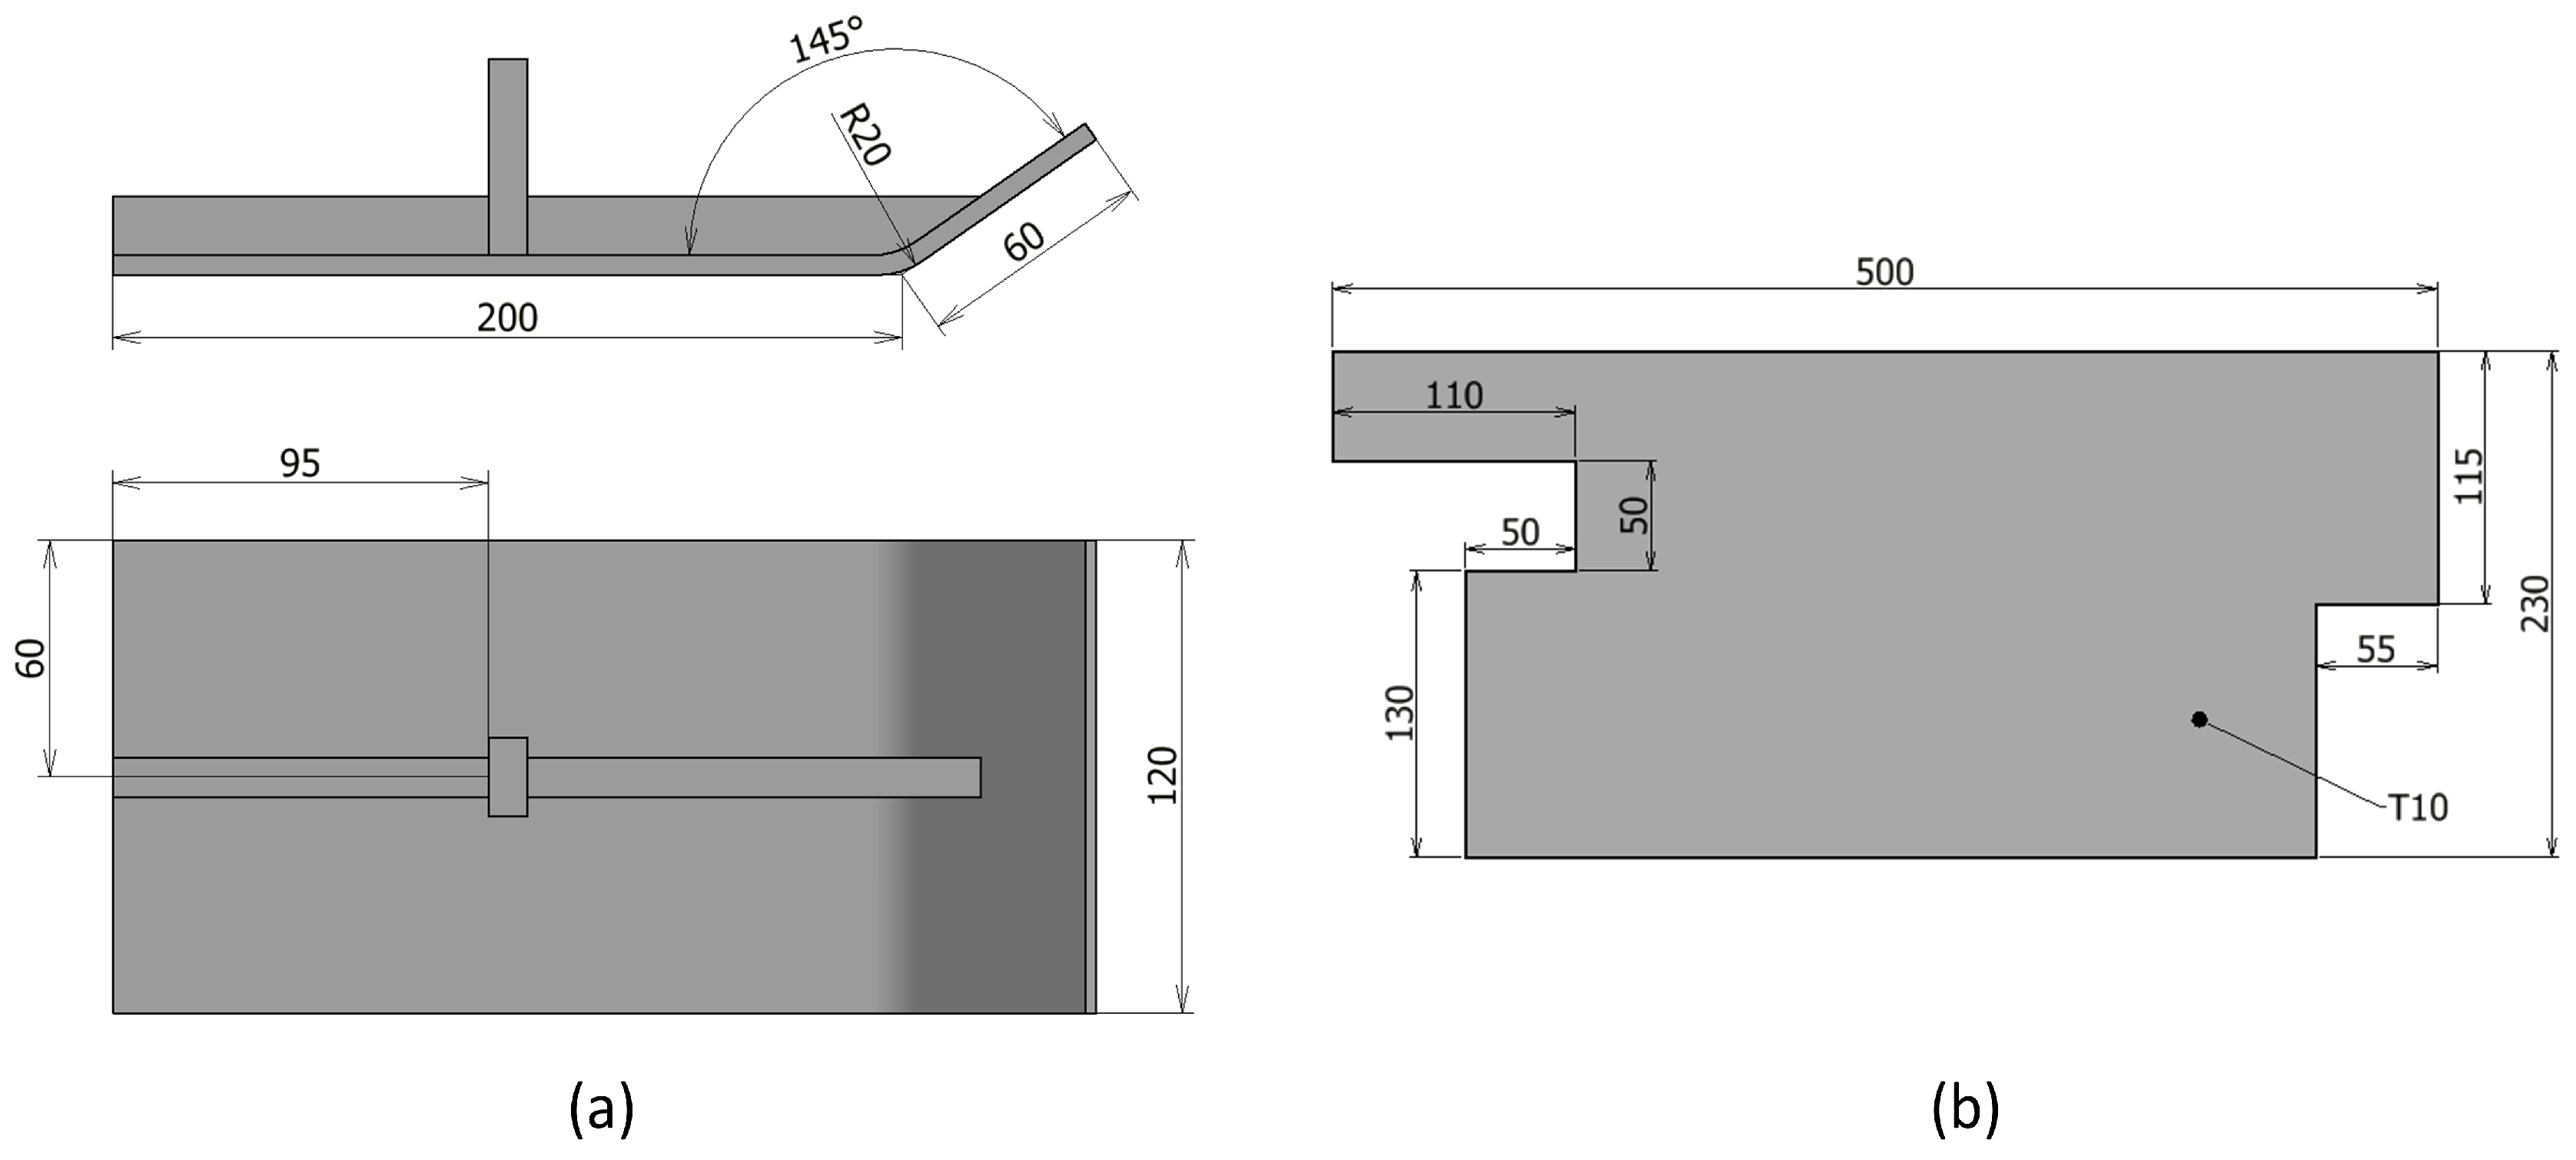
The active element of the experiment that is in contact with the soil is the tool shown in Figure 4a. To maintain the same height and level of the soil, a raking plate was created (Figure 4b).
The steady-state shear friction values were then evaluated and read using a strain gauge attached to the tool.
For accurate measurement values, it was important to determine the individual weights of the components in the unfolded state (Mettler Toledo PG5002-SDR scale, Greifensee, Switzerland), as well as the weight of the overall assembly as a dynamic system. The actual weight of the dynamic motion was determined using a gauge created for this dynamic motion (Figure 5). On the ball guide rail (IX), the gauge structure (I) (made of aluminum profiles) was placed for dynamic operation, to which a diaphragm force transducer (MEG30, 500 N) (II) was attached in the lower part by means of a screw (III). The dynamic effects of motion and load acting on the rail (V) are transmitted to the diaphragm transducer (II) by means of a pin (IV).
During motion, the diaphragm transducer (III) senses the dynamic effects and normal forces that were inferred from the experiment from the movement over the soil. Measurements were made for the unloaded system and with weights 1–4.
The theoretical speed of the tool movement was set using the current frequency f [Hz] on the frequency converter (Siemens SINAMICS G110, SIEMENS, Munich, Germany). This value was calculated using the measured revolutions nm (rpm) read by a revolution sensor (Voltcraft, DT-30LK, Conrad Electronic SE, Hirschau, Germany) on the shaft with thread pitch p (m) of the TR40x7 lead screw. The theoretical velocity vt was then determined using Equation (1).
v t = n m · p   [ m · s 1 ]
where p is the pitch of the lead screw and nm is the measured revolutions of the lead screw.
The measuring tools were 3D-printed with fused filament fabrication (FFF) on a Prusa I MKS3 printer (Prague, Czech Republic), and the filament used was PLA produced by Prusament. The printing method used was FFF, which uses a hot–cold–hot environment. The 3D printer head scoops and melts the PLA wire and deposits individual layers of material onto a pre-heated bed, where they are cooled to form the desired tool shape. This leads to better mechanical properties, where the adhesion between layers is strengthened, and prevents warping and curling of the printed parts. The G-codes for the prints were sliced in PrusaSlicer version 2.3.0 with a layer height of 0.20 (mm). The fillers were set at 20%. The filling pattern was chosen to be gyroid except for 100% of the filling, which is forced rectilinear. The PLA tools were printed at an extrusion temperature of 210 °C and a bed temperature of 60 °C.

2.3. Methods

This study is based on Jenike’s method for determining wall friction. Iqbal T. [29], Chen P. [30], and resp. Teunou E. [31] describe the standard procedure, cell dimensions, loads, and conditions for measurement and evaluation using the Jenike method. On this basis, an innovative alternative method has been developed where, unlike the existing method, the friction surface (tool surface) moves over the bulk material, at a higher speed and on a longer trajectory.
The required soil (approximately 65–70 kg) was first loaded into the validation device. The surface of the soil was then leveled to the desired height using a rake plate (used before each measurement to compare the surface of the soil and to keep the material at the same height). Next, a diaphragm force transducer (MEG30, 500 N) and a skid/tool were attached to the rail. Before the actual slipping/sliding process of the skid/tool on the soil, the skid was carefully and slowly placed on the soil. Then, the diaphragm force transducer (MEG30, 500 N) was reset, and the measurement started.
During calibration, the diaphragm force transducer (MEG30, 500 N) was placed firmly on a stable nonmoving frame and successively loaded with 1 to 4 calibrated weights. It was then calibrated to these values using DEWESoft 7.1 software.
The normal forces were measured using a diaphragm force transducer (MEG30, 500 N), which was attached to the dynamic effects measuring device. These forces were induced by a weight placed on the bracket while the device was moving (Figure 5).
To determine the initial shear stress, the tool was in position A (Figure 3). Then, a normal load was applied to the tool using weights. After placing the weights on the holder, the diaphragm force transducer (MEG30, 500 N) was reset to zero. The device was then put into operation. The force against the sliding motion of the tool on the soil was measured using the diaphragm force transducer at the distance between points A and B (Figure 3). The average steady-state values were then used in the evaluation. The data were entered into tables and graphs. Measurements were made for 1–4 weights. These values were compared with the angle of external friction measurements using Jenike’s straight-line method.
To ensure the same conditions for the next experiment, we proceeded as follows: The tool was placed on the soil at point A (Figure 3), the diaphragm force transducer was then reset to zero. The device was put into operation and set into motion. Without weights, the slide moved to point B. Once the tool passed point B (Figure 3), 1–4 weights were added to the bracket. The measurement section then ran between points B and C in Figure 3. At point C, the measurement was stopped.
The forces resisting the movement of the skid over the soil were sensed using a membrane force transducer. The DEWESoft measuring system was used for the evaluation.
The result was data that determined the magnitude of the resistance of the skid against movement on the soil at the chosen normal load. All experiments were performed 10 times due to possible errors and dynamic shocks. Inaccurate values were then remeasured, and the resulting data were statistically evaluated.
When comparing the data from the experiment and the data measured on the calibrated device, statistical evaluation method xs [-] Equation (2) was used to determine the percentage deviation of the experiment from the measurements on the calibrated device.
x s = A B S X e x p X k a l · 100 100
where Xexp [-] is the parameters measured in the experiment on the validation device and Xkal [-] is the parameters measured on the calibrated devices.

3. Discussion and Results

In this section of the article, we will discuss the measured parameters of the soil and the results of the process of the tool sliding on the soil, the overall evaluation of the experiments, and the determination of the deviations and measurement errors. From the measured data, the deviations in the theoretically calculated and measured basic parameters were compared and determined. All parameters were statistically evaluated and are presented in the table and graphs below.

3.1. Characterization of Soil Using Standardized Methods

The following parameters were measured to compare the results and individual dependencies: particle size distribution, volume weight, bulk density, angle of external friction, and angle of repose (Table 1). These parameters were measured at BSC (Bulk Solid Center), Czech Republic, VŠB TU-Ostrava, CENET.

3.2. Basic Parameters of Experimental Measurements of Dynamic Friction Parameters

First, it is important to point out the difference between the theoretical calculation and the experimental measurement. It is important to identify the difference and thus the possible bias for the theoretical calculations. The two values will always be different; this can be caused by many parameters, such as an inappropriate choice of drive, resistance to movement in the movement screw, a not-strong-enough device for the rail attachment, or dynamic shocks in the system.
This section contains all the necessary theoretical, calculated, and experimental basic parameters. These are mainly the parameters of the frequency converter, drive, screw line, rotational speed, and feed rate (Table 2), and also the normal loads, component weights, and frequency sensing parameters. The parameters were experimentally determined to be smeared for the smooth running and calibration of the measuring experimental device of tool sliding on the soil.
The frequency converter was used to set three transport speeds for frequencies (5 Hz, 10 Hz, 15 Hz). The speed of the screw line was read using a Voltcraft DT-30LK laser tachometer, directly on the threaded rod. The measured speeds for each frequency are shown in Table 2. Equation (1) was used to calculate the transport speed.
The individual components of the dynamic system were considered both individually and as a whole. They were also weighed both statically and dynamically in motion. The weights of the individual components of the linear-line travel (Figure 2b) are as follows: The rail weighs 3.81 kg, the diaphragm force transducer XIV 0.04 kg, the weight holder and axle XI and XII 0.42 kg, the drop/height device 0.14 kg, the slide/tool XVI 0.12 kg, and the weight XIII 4.43 kg. Subsequently, the total weight of the moving unit was determined for weights 1–4. As the rail moves in the line, there is friction and consequently a loss of normal load. The theoretical static loads and a comparison of the weights of the components individually weighted and weighted in the guideway are shown in Table 3. The in-line parameter is the weight of the moving components in the normal direction stored in the line on the validation device.
Therefore, it can be predicted that the resistance of the ball guideway at rest absorbs approximately 8 to 15% of the applied normal load. The weight in the guideway’s mean absolute deviation (MAD) ranged from 0.06 kg to 0.12 kg, the root mean square error (RMSE) ranged from 0.45 kg to 0.98 kg, and the coefficient of determination (R-squared) was 1.

3.3. Calibration of a Strain Gauge for Measuring Shear Parameters

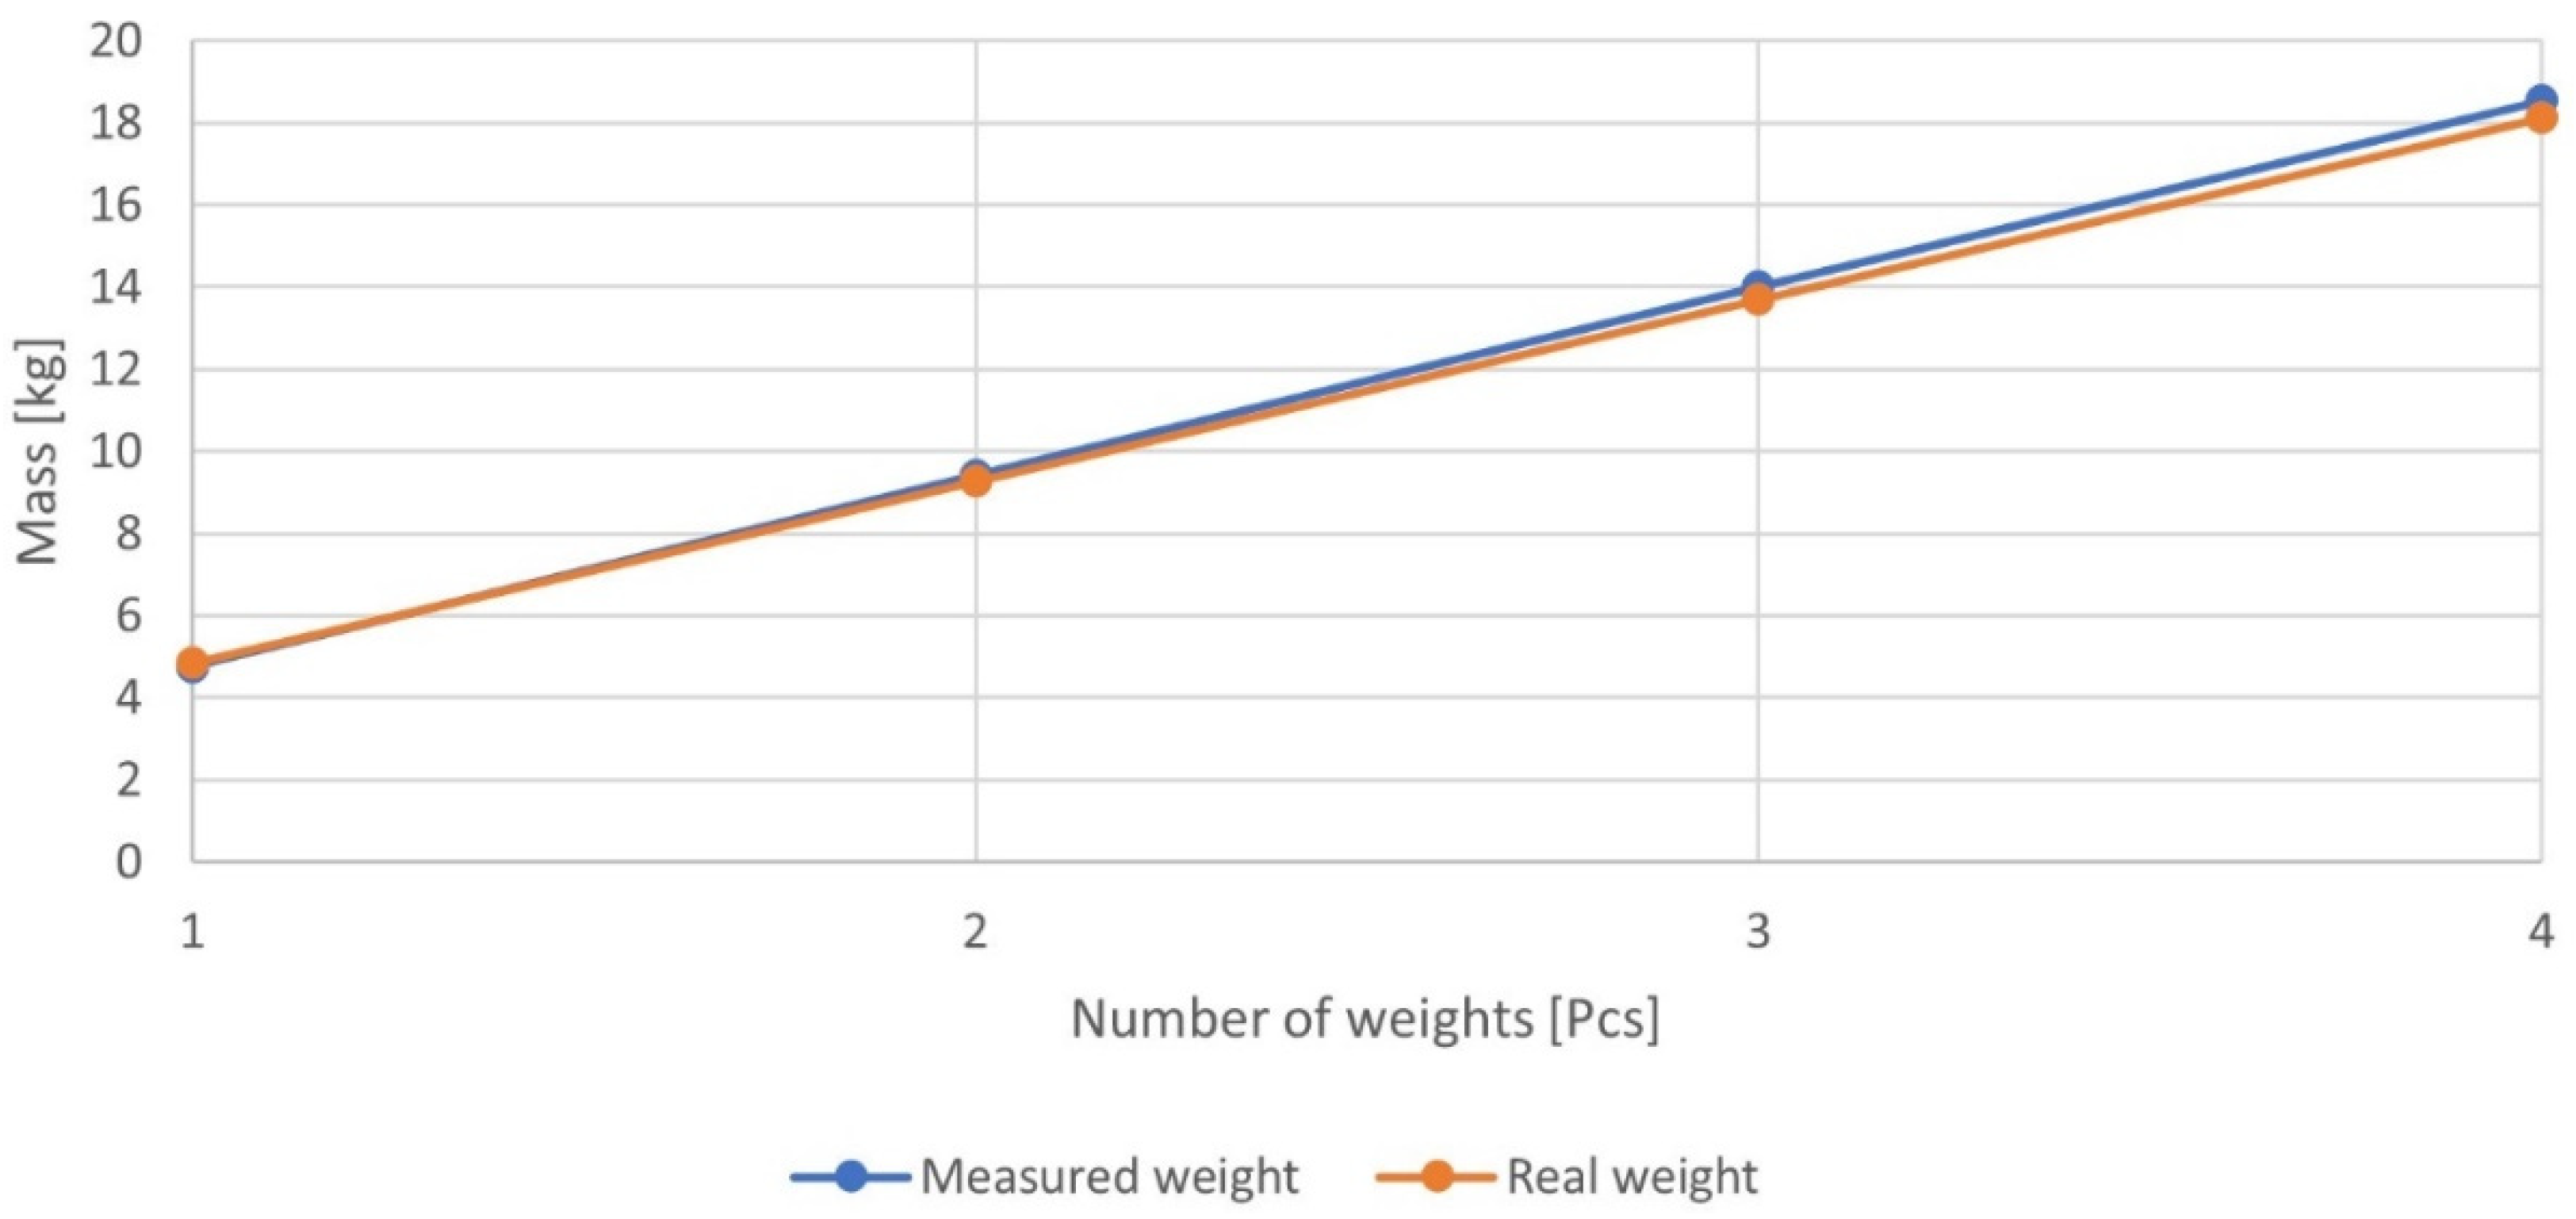
The calibration of the diaphragm force transducer (MEG30, 500 N, Figure 2 (XIV) and 5 (II)) was carried out by successively loading the strain gauge with four weights from 4.43 kg to 17.6 kg. A holder was attached to the strain gauge for firm fixing. The measuring system and DEWESoft software were used for the evaluation. The values were read after the load curve had stabilized. This calibration was performed for both the strain gauge used for the shear readings and the strain gauge used on the device to read the dynamic effects during motion. The strain gauge was reset before each measurement (Figure 6).
It was found that the deviation of the strain gauge from the real weight increases with increasing load, up to a maximum of 2.35%. MAD ranged from 0.06 N to 0.12 N, RMSE ranged from 0.09 N to 0.43 N, and R-squared was 1. The calibration of the strain gauge was successful.

3.4. Measurement of Weighted, Static, and Dynamic Normal Loads

The average shift times were 5 Hz/48 s, 10 Hz/23.80 s, and 15 Hz/15.53 s. For accurate measurements at such a dynamic motion, it was important to set and evaluate the normal load for our chosen parameters of tool movement over the soil. Therefore, four normal loads were compared, and different dynamic effects were applied in each.
Normal loads were compared, with loads applied to the soil from the rail (X), the diaphragm force transducer (XIV), the weight holder and axis (XI, XII), and the equipment for determining draft/height and weight; see Figure 5.
The normal load was measured in three ways: (I) The individual components were measured separately. The end weight was obtained by summing the partial values (weighted). (II) The second method was static weighting of the normal load, where the rail was placed in the line and loaded. The values were read using a calibrated balance directly on the equipment (static, see Section 3.2). (III) The third method was the reading of the normal load using a dynamic effect measuring device (Figure 5). The normal load values were read in straight line motion for 3 speeds of the screw linear guideway (Dyn. 5 Hz, Dyn. 10 Hz, Dyn. 15 Hz). For all three methods of reading the normal load, 1 to 4 weights were used. The resulting data are shown in Figure 7.
For the values read statically (II), it is clear that the rail guide absorbs part of the normal load. For the data readings of the linear guideway motion (III), the normal load gradually increases compared to the static load to values equal to the weighted component data (I). For this experiment, this is the ideal condition where the losses that occurred in the static method (I) disappear. MAD ranged from 0.07 kg to 0.13 kg, RMSE ranged from 0.11 kg to 0.45 kg, and R-squared was 1.

3.5. Determination of Shear Parameters of Soils on a Validation Stand

When measuring the shear parameters, emphasis was placed on three important values. The first was the initial shear stress at start-up, the second was the shear stress generated between the soil and the tool after start-up, and the third was the steady-state shear stress after the measurement distance had been completed. As the tool sank/was immersed into the soil, it was important to account for the increasing cross-sectional area through which the tool was sliding on the soil.
When sensing the movement of the tool on the loose material, it was found that the tool came into contact the soil with an area of S1 = 0.024 m2 during the start-up, and after the start-up distance it sank by the measured value hx, and therefore exerted an average shear area Sx = 0.0265 m2. After traveling the measured runway, it sank to such an extent that it exerted a full shear area, and therefore a maximum shear area of S2 = 0.03 m2 was calculated at the end of the measurement.
Several sets of measurements were made. The first set (a) was for initial shear friction and angle of external friction, and the second set (b) was for steady-state shear forces during motion.
A total of 15 measurements were evaluated for each speed (5 Hz, 10 Hz, 15 Hz) and for individual weights (1–4 weights). Subsequently, erroneous measurements with interfering elements or fluctuations were removed. For illustration, Figure 8 shows the evaluation of the shear force data, induced by 1 weight at 10 Hz speed. In the results of this measurement, measurement numbers 6, 10, 11, 12, and 15 were removed due to measurement deviations.
Subsequently, the values of the 10 measurements were evaluated and entered into curves. For the given normal stresses, the given shear stresses were determined. For this example, the average value of the steady-state shear stress is 1.86 kPa.
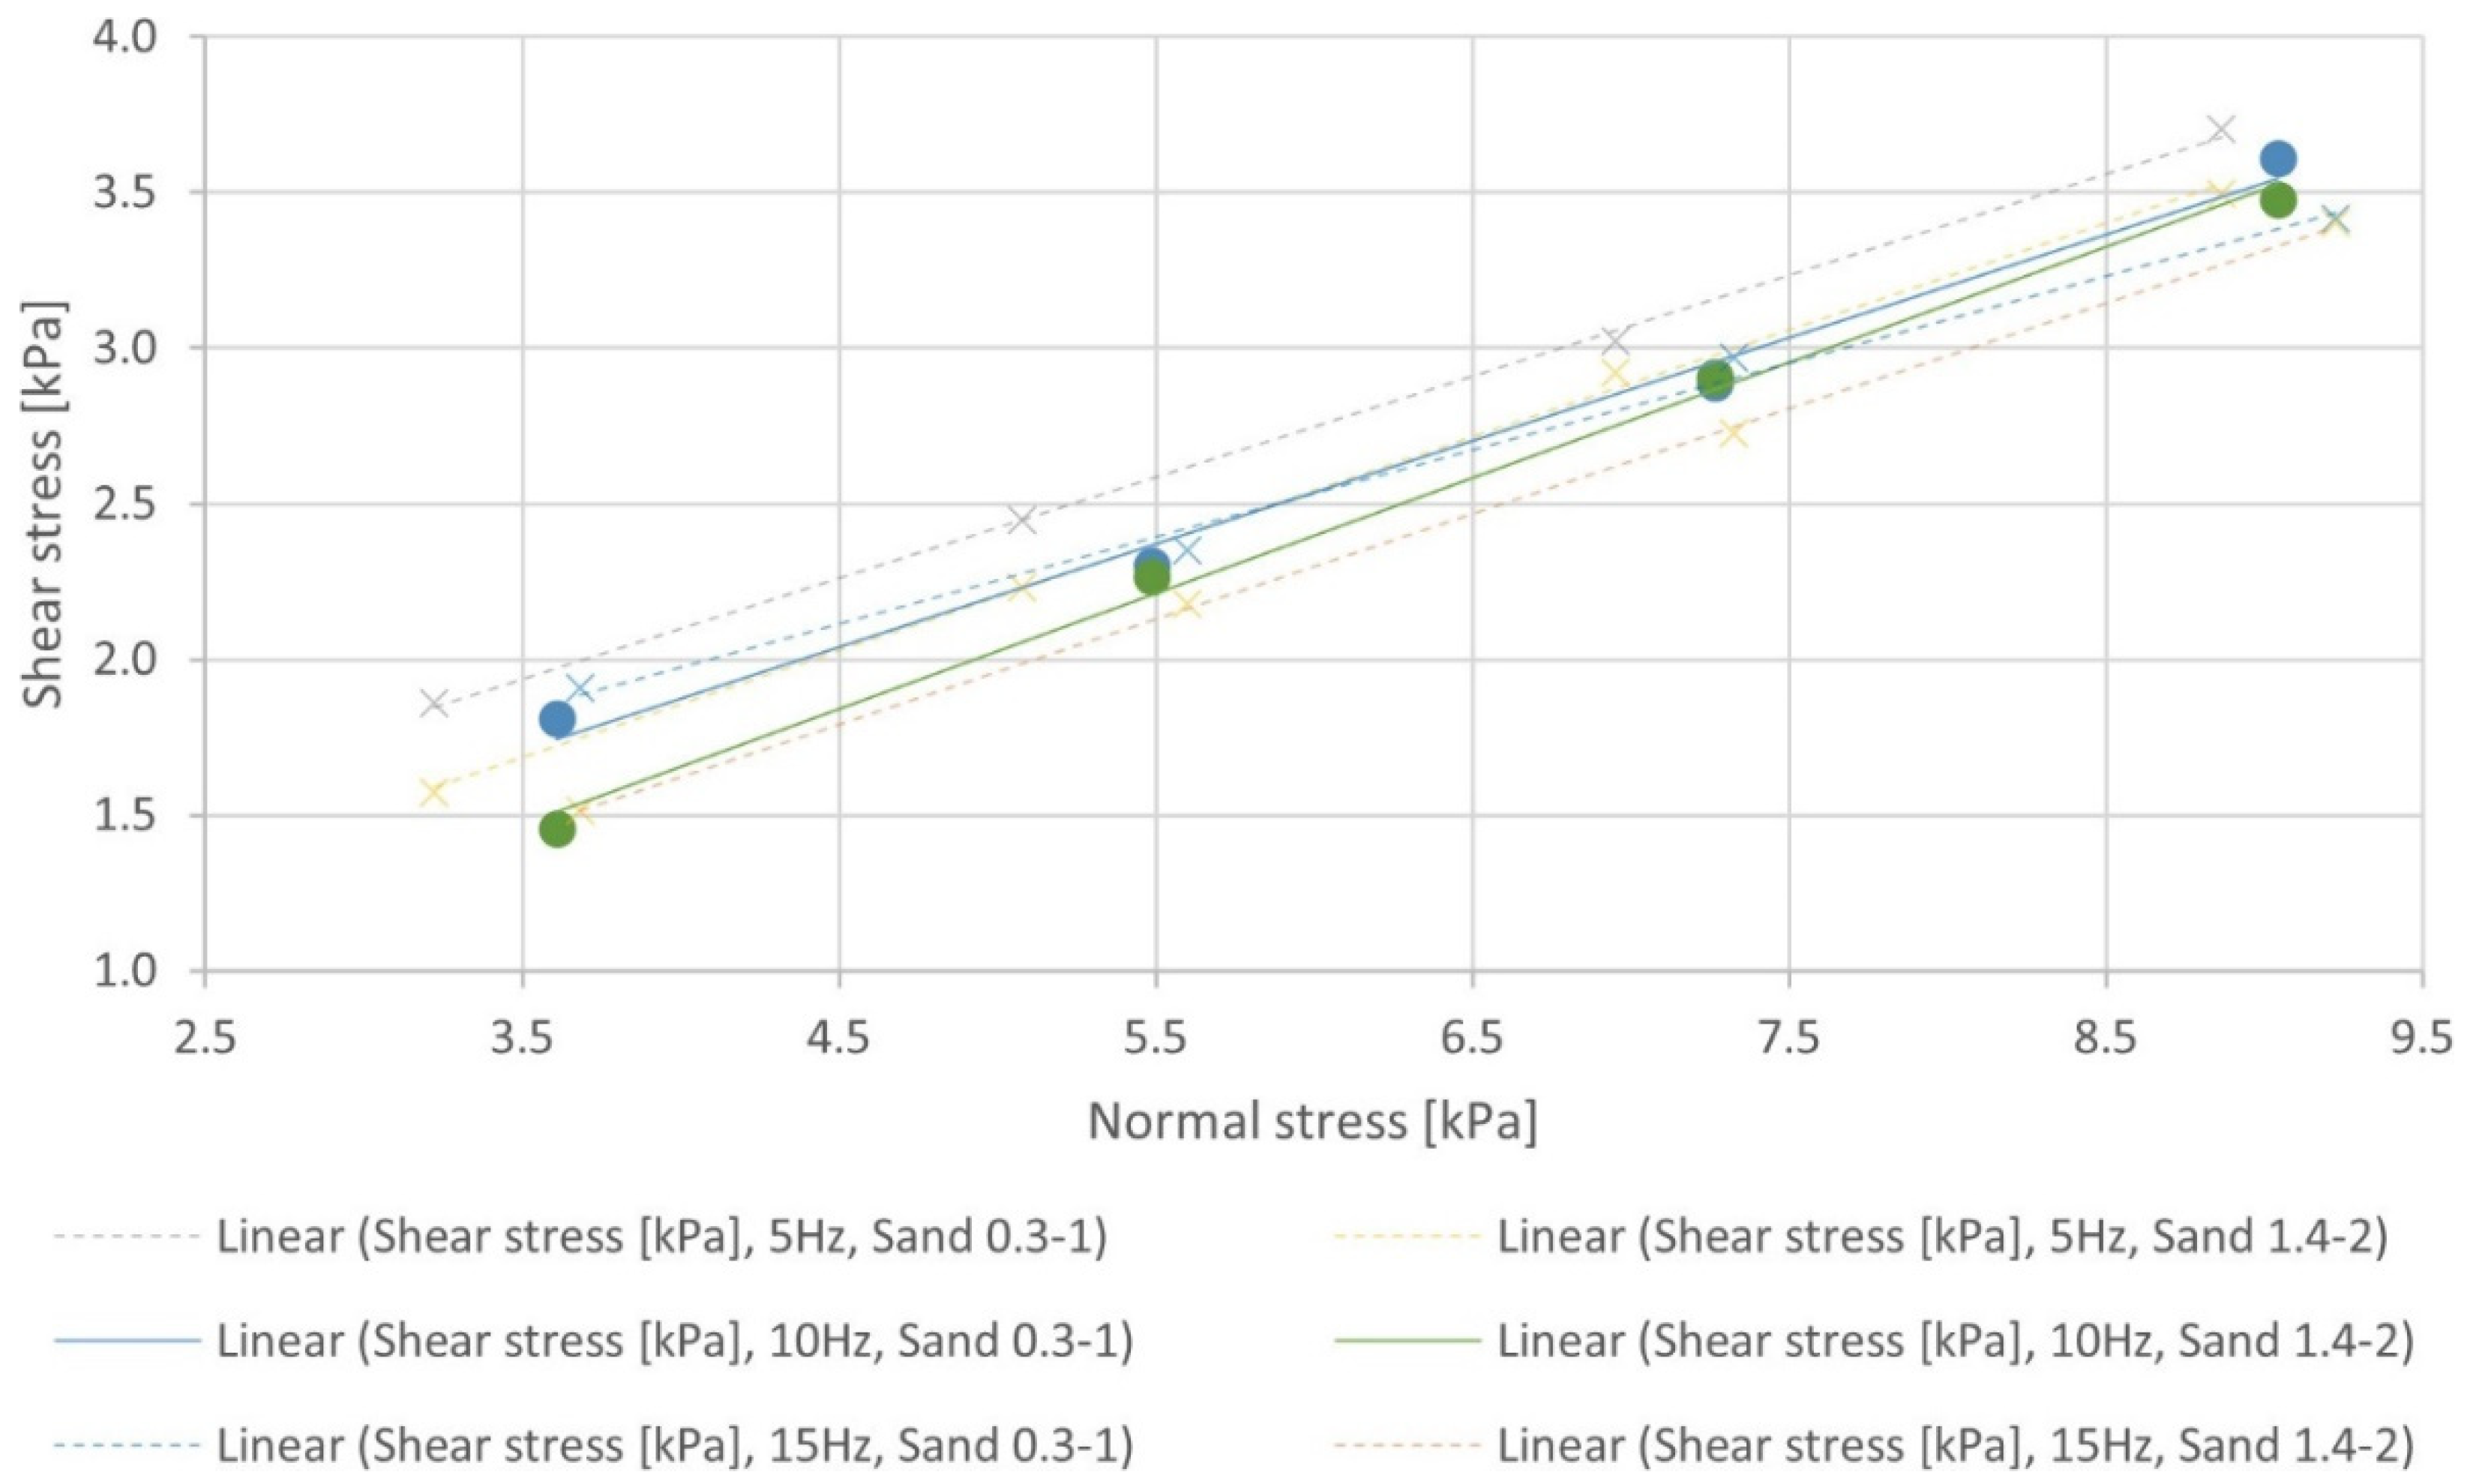
For the first set of measurements (a), the initial shear stress, the tool was placed on the soil. It was then loaded with the required number of 1–4 weights and the strain gauge was set to zero. After starting, the shear force of the tool was then read. This was carried out for three transport speeds (5 Hz, 10 Hz, 15 Hz). The parameters were evaluated, and the initial shear stress and the angle of external friction when the tool was run over the soil were determined (Figure 9). This angle was then compared with the angle of external friction, which was determined via Jenike’s method.
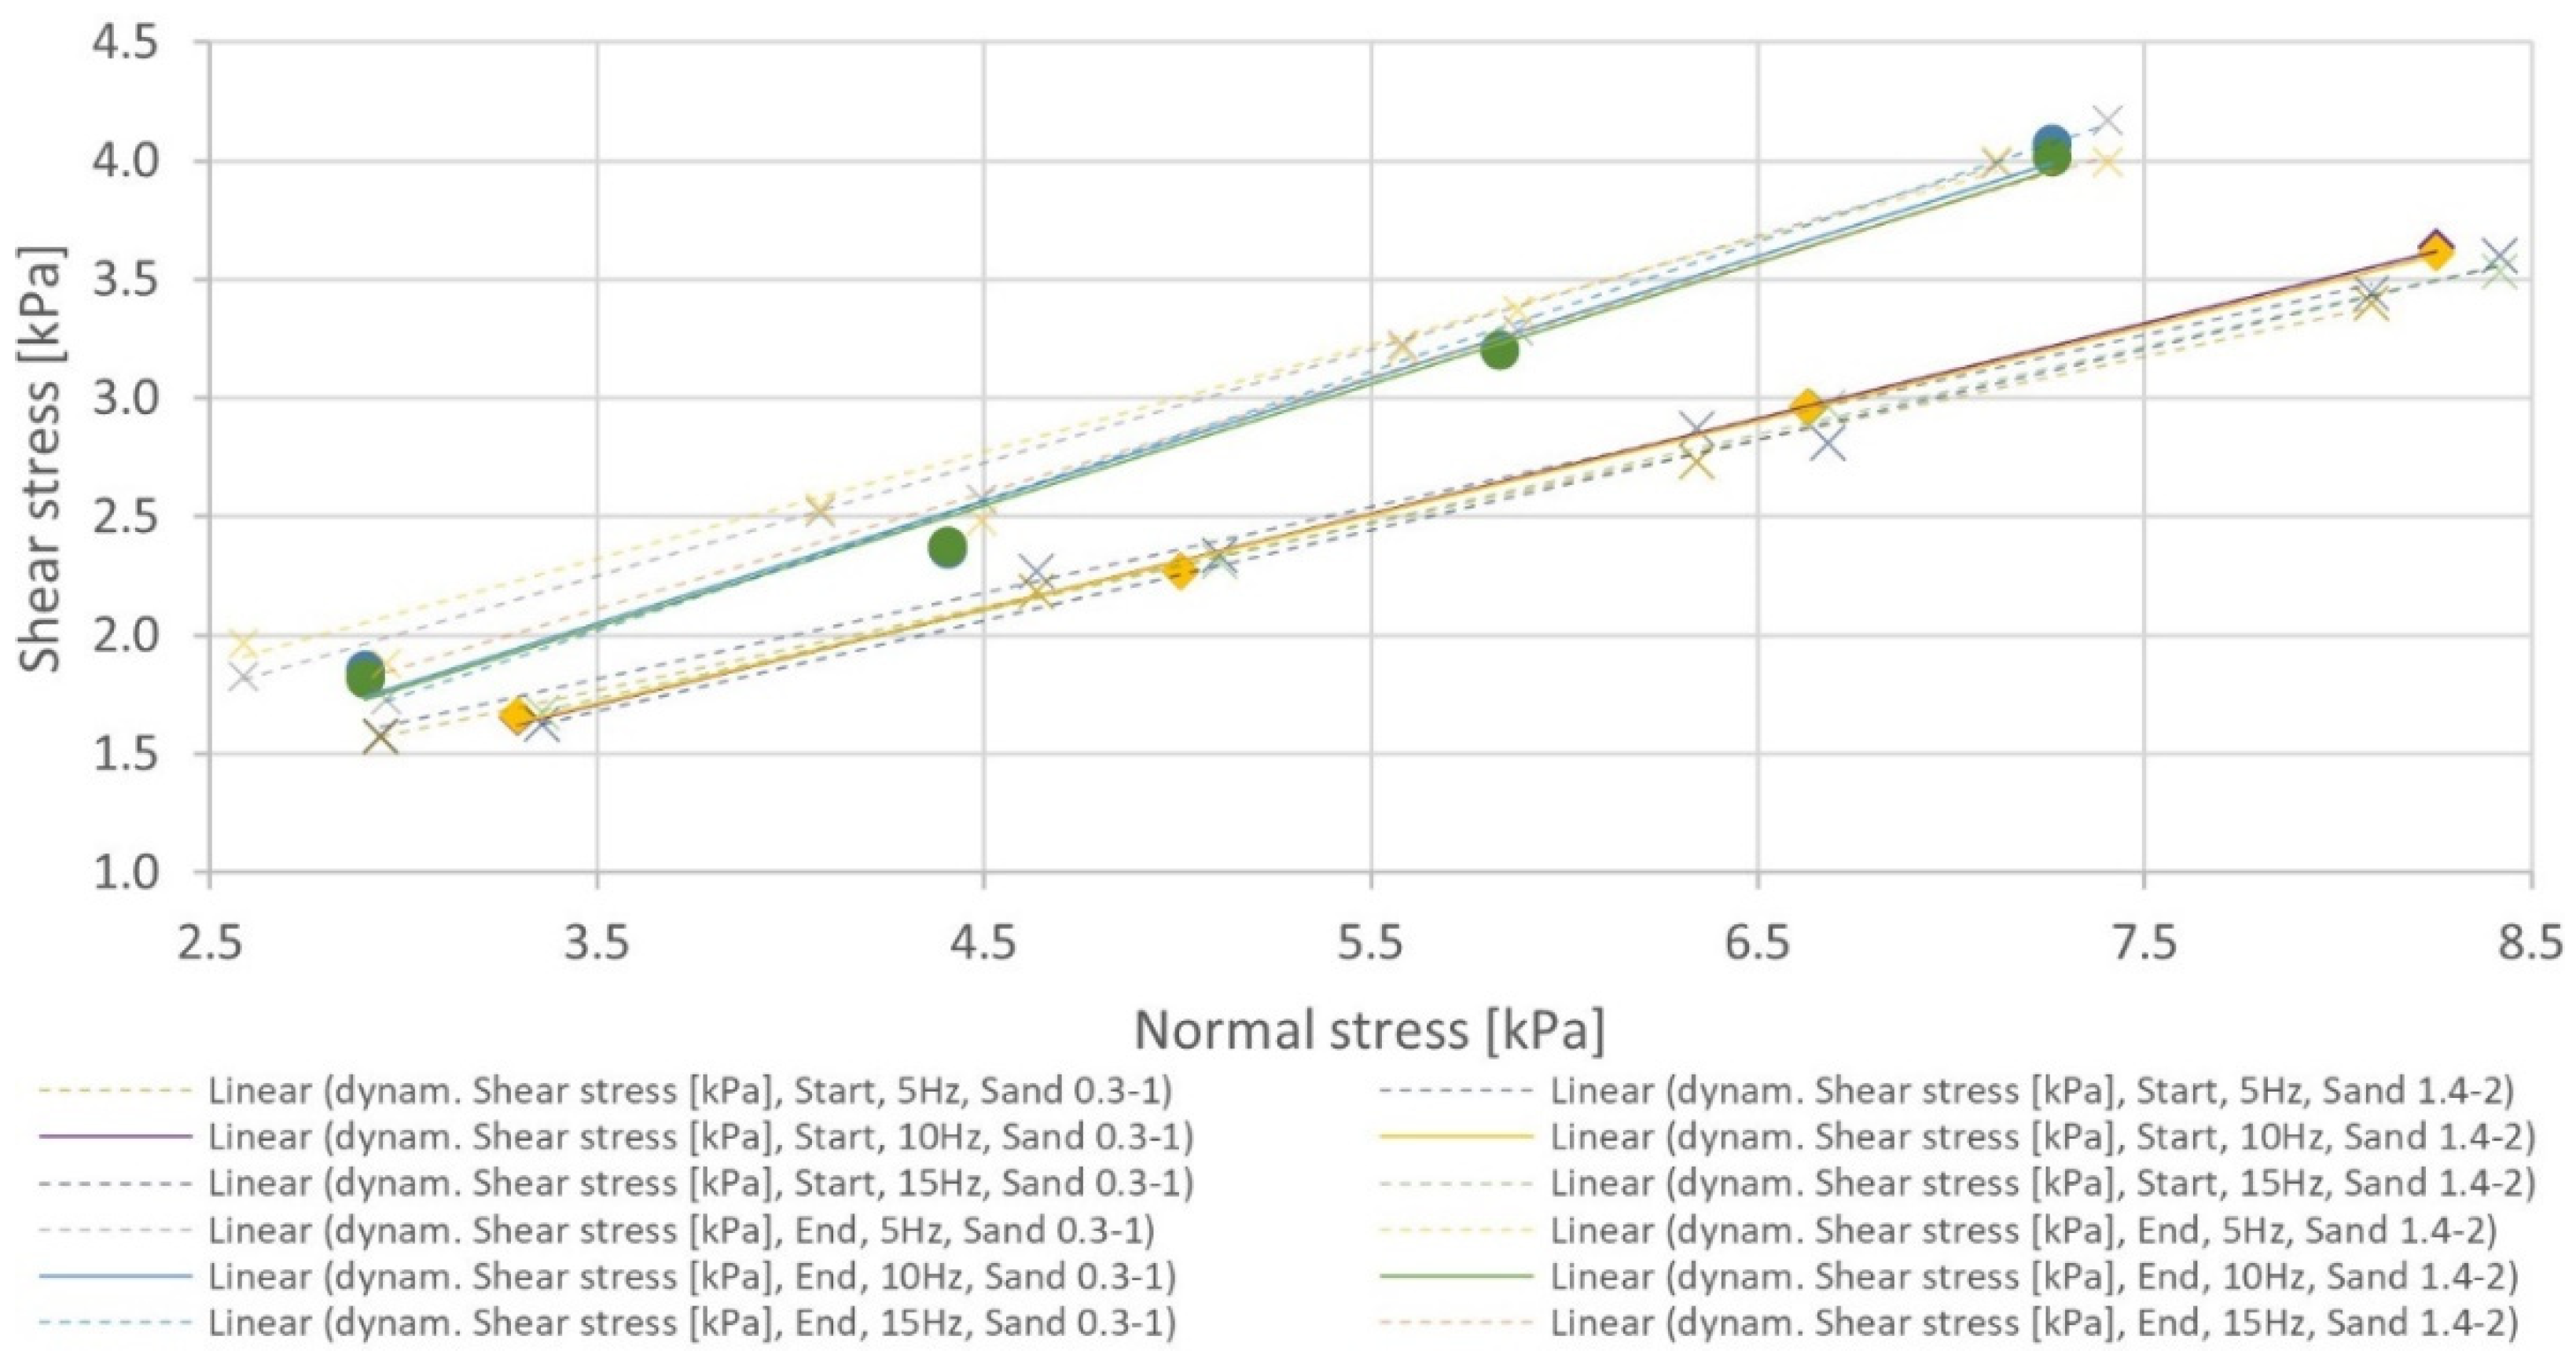
The second experiment (b) was performed as follows: The tool was placed on the soil, and the strain gauge was set to zero. The run-up of the device was carried out without weights, and these were added after traveling the run-up distance, which is 0.1 m (AB, Figure 3). Subsequently, the required number of weights was added, and the tool moved along the entire measuring path, which has a length of 0.8 m (BC, Figure 3). Measurements were taken for each speed (5 Hz, 10 Hz, 15 Hz) and the required number of weights 1–4 (Figure 10).
The points were interspersed with linear regression. The angle of external friction is defined as the angle given by a linear line with the x-axis Table 4.
The measurement error variances were as follows: MAD was in the range of 0.67 N to 1.28 N; RMSE increased with the length of the offending path, at the beginning 0.59° to 1.01°, at the start 2.46° to 2.75°, and at the end 6.5 to 6.68°; and R-squared was in the range of 0.990 to 0.999.

3.6. Comparison and Evaluation of Measured Data and Experiments

After determining these parameters, it was predicted that the dynamic motion would affect the normal load. For this reason, a device was constructed to measure the dynamic effects (Figure 5). Both the dynamic effects measurement device and the validation system used (Figure 2) contain a diaphragm force transducer. Its accurate calibration was therefore crucial to the study. The calibration was carried out through successive loading of 1–4 weights. Then, these measured parameters were compared with those weighed on a calibrated Mettler Toledo PG5002-SDR balance. A comparison of the individual values can then be seen in Figure 6, where it can be seen that the measurement inaccuracy increases as weights are added gradually, up to a maximum of 2.35% of the calibrated measurement.
After calibration of the membrane force transducer on the validation and dynamic effects measuring device, it was possible to determine the dynamic effects of moving materials in motion. The speed of the moving linear line was determined according to the frequency applied in the frequency converter (5 Hz/0.017 m·s−1, 10 Hz/0.034 m·s−1, 15 Hz/0.051 m·s−1). The values of different measured normal loads are shown in Figure 7 for comparison. Here, it can be seen that the dynamic motion for the frequency of 10 Hz is closest to the weighted values, with a maximum deviation of 1.31% from the values measured on the calibrated balance.
To determine the initial shear stress, the first seconds of tool movement over the soil were evaluated at a given normal load (1–4 weights) and at three transport speeds. Figure 10 shows the linear interleaving of the points and a comparison of the different sets of measurements for 1–4 weights, the three transport speeds, and the two materials tested. The angle formed by the trend line and the x-axis then gives the given friction angle. The friction angle read at speed 2 with a frequency of 10 Hz agrees with the calibration measurement using the Jenike shear machine with the smallest deviation for both samples tested, with differences of 7.5% for sample 1 and 5.9% for sample 2.
The subsequent set was based on the addition of weights during the measurement and the shear stress response as the tool moved over the soil from location A to location B (Figure 3). To ensure repeatability and the same operating conditions in the experiment, the unloaded tool with the rail was placed on the soil. After resetting the strain gauge, the rail was put into a straight-line motion where it moved from point A to point B (Figure 3). In this way, identical initial measurement conditions were achieved. After passing through the AB path, the required number of weights (1–4 weights) was added. The tool traveled along the path BC (Figure 3), where the response of the tool movement over the soil was measured at a given normal load.
Table 4 evaluates the angles of external friction for the beginning shear stress, and the start and end of the measurement under dynamic normal loading. If we consider past measurements, the result was that the most effective tool movement speed was at 10 Hz. Therefore, the percentage difference from the initial stress at the beginning of the experiment was higher by 8.5% and 11.8% for sample 1 and sample 2, respectively. For the final phase of the experiment, the measured percentage deviation from the initial tension was 31.1% higher for sample 1 and 34.7% higher for sample 2.
Such a rapid increase in shear friction was caused by a negative phenomenon that occurred when the tool was sheared over the soil. As the tool moved, it gradually sank/was immersed into the soil. The tool pulled the soil in front of it, and thus more forces were exerted on the tool against the movement. This phenomenon resulted in larger shear cross-sections of the tool.

4. Discussion

This research has shown that by using appropriate input parameters, the initial shear stress/external friction can be determined and then this theory can be applied and used to determine the possible increase in shear stress when the tool is immersed in the soil. Based on this finding, further experiments will be carried out to allow a wider application of this measurement method and the subsequent development of a measurement system to determine the mechanical and physical properties of soils as a function of external conditions. This can make the transportation, treatment, and processing of soils more efficient in many industries. By measuring these parameters on site, sampling is avoided and degradation during transport to the laboratory is prevented.
Shear stress measurements have been found to be extremely dependent on the shear area. Therefore, a follow-up study is proposed to evaluate the relationship between frictional surface area and particle grain size and the effect on frictional parameters. In this way, we will be able to better understand the frictional properties of the frictional surface on the soil and derive frictional parameters more accurately. Evaluation of tool penetration into the bulk material or prediction of tool resistance/wear during movement in soil will also be part of future research.

5. Conclusions

This study was designed to validate the theory for the design of a device measuring basic friction parameters for subsequent possible alternative uses and applications. The theory is based on the Jenike shear test, which is most commonly performed under laboratory conditions. However, sometimes it is preferable/desirable to measure the material directly at the place of occurrence/sampling. For this reason, the dynamic motion of the tool on the soil (coarse sand soil) was tested and then compared with the measurement on the calibrated device.
The basic parameters such as the basic geometric dimensions of the trough (Figure 3), the tool, or rake plate (Figure 4) help to prepare the measurement, as well as the average angular velocity and the average linear conduction velocity at the inverter frequencies of 5 Hz, 10 Hz, and 15 Hz (Table 2). The required weights of the individual moving parts were determined. These parts were weighed both individually and as a whole on a calibrated balance. It was important to weigh these parts once already placed in the line. By comparing individual values for different loads, it was found that the lines in which the moving parts are placed absorb approximately 8% to 15% of the applied normal load (Table 3).
The motion of the device was dynamic. Therefore, it was checked whether dynamic shocks would not be generated when the skid moved. For this experiment, a device was created to determine the dynamic effects (Figure 5). The device sensed dynamic shocks for a defined normal load (1–4 weights) and for a defined transport speed (at frequencies of 5 Hz, 10 Hz, and 15 Hz). It was found that as the velocity of motion increased, the normal load stabilized and the absorption of the normal force exerted by the line was canceled out. After analysis, it was found that the smallest deviation in the normal load during dynamic motion (max. 1.3%) and the load weighted on the calibrated balance is at a frequency of 10 Hz. After calibration of the dynamic normal load, the device was ready.
After experiments where the tool was sliding over the soil, it was found that when comparing the initial shear stress of the validation device, the smallest percentage deviation of the measurement from the calibrated Jenike method at a frequency of 10 Hz was found to be 7.5% for sample 1 and 5.9% for sample 2. This was the second confirmation that the smallest deviations from calibrated measurements occur only at the frequency of 10 Hz.
Furthermore, the shear stresses generated when the tool was immersed in the soil were observed to determine possible negative effects. It was found that after traveling the BC distance where the measurements were made, the shear stress increased by up to 1/3 when the tool was immersed.

Author Contributions

L.J. and D.G. discovered the mechanisms. M.Z. wrote the main manuscript text. L.J. and M.Z. corrected the text. M.Z. and D.G. designed the experiments. M.Z. and F.V. performed the experiments. M.Z. and R.P. analyzed the data. All authors have read and agreed to the published version of the manuscript.

Funding

This research was funded by the project SP2023/094 Specific Research in Selected Areas of Energy Processes and REFRESH—Research Excellence For Region Sustainability and High-tech Industries, CZ.10.03.01/00/22_003/0000048.

Data Availability Statement

Data are contained within the article.

Conflicts of Interest

The authors declare no conflict of interest.

Nomenclature

Symbols
vttheoretical velocity (m·s−1)
nmmeasured revolutions of the lead screw(s−1)
ppitch of the lead screw(m)
Xexpparameters measured in the experiment(-)
Xkalparameters measured on the calibrated devices(-)
xsstatistical evaluation method (-)
xparticle size distribution (mm)
Q3_10particle size in 10% of the cumulative curve(%)
Q3_50particle size in 50% of the cumulative curve(%)
Q3_90particle size in 90% of the cumulative curve(%)
ρvvolume weight (kg·m−3)
ρsbulk density(kg·m−3)
φeangle of external friction (°)
Ψs angle of repose (°)
Sdecrease (%)
S1area of contact between the tool and the bulk material when starting the tool(m2)
S2area of the tool after the run-up distance(m2)
Sxarea of the tool at the end of the path(m2)
hxdrop of the tool after the run-up distance(m)
Abbreviations
PLApolylactide fibres
FFFfused filament fabrication
BSCBulk Solid Center
VŠB TU-OstravaVSB—Technical University of Ostrava

References

  1. Deng, T.; Garg, V.; Pereira Diaz, L.; Markl, D.; Brown, C.; Florence, A.; Bradley, M.S.A. Comparative studies of powder flow predictions using milligrams of powder for identifying powder flow issues. Int. J. Pharm. 2022, 628, 122309. [Google Scholar] [CrossRef]
  2. Kumar, P.; Subbarao, P.M.V.; Kala, L.; Vijay, V.K. Influence of physical. mechanical. and thermal properties of biomass pellets from agriculture residue: Pearl millet cob and mix. Bioresour. Technol. Rep. 2022, 20, 101278. [Google Scholar] [CrossRef]
  3. Anda, R.; Chai, J.; Negami, T. Effect of chemical additives on the consolidation behaviours of mini PVD unit cells from macro to micro. Geotext Geomembr. 2023, 51, 199–208. [Google Scholar] [CrossRef]
  4. Yu, T.; Zhao, Z.; Li, J. Effect of sintering temperature and sintering additives on the properties of alumina ceramics fabricated by binder jetting. Ceram. Int. 2023, 49, 9948–9955. [Google Scholar] [CrossRef]
  5. Castellano, J.M.; Gómez, M.; Fernández, M.; Esteban, L.S.; Carrasco, J.E. Study on the effects of raw materials composition and pelletization conditions on the quality and properties of pellets obtained from different woody and non woody biomasses. Fuel 2015, 139, 629–636. [Google Scholar] [CrossRef]
  6. Yu, H.; Dong, X.R.; Kang, S.M.; Yu, W.; Wang, Z.F.; Mu, J.Y.; Cui, X.W.; Li, J.H.; Yin, F.X.; Shin, K.S. Effect of the pre-homogenization on the precipitation behaviors. mechanical and corrosion properties of as-extruded MgY binary alloys. Mater. Charact. 2021, 178, 111307. [Google Scholar] [CrossRef]
  7. Merkus, H.G. Particle Size Measurements: Fundamentals, Practice, Quality; Springer: New York, NY, USA, 2009; pp. 73–117. ISBN 978-1-4020-9015-8. [Google Scholar]
  8. Sahoo, R. Degradation characteristics of steel making materials during handling. Powder Technol. 2007, 176, 77–87. [Google Scholar] [CrossRef]
  9. Kang, X.; Sun, H.M.; Luo, H.; Dai, T.; Chen, R.P. A Portable Bender Element-Double Cone Penetration Testing Equipment for Measuring Stiffness and Shear Strength of In-Situ Soft Soil Deposits. KSCE J. Civ. Eng. 2020, 24, 3546–3560. [Google Scholar] [CrossRef]
  10. Roy, A.K.; Camping, J.D. Development of a portable shear test fixture for low modulus porous (foam) materials. Exp. Mech. 2003, 43, 39–44. [Google Scholar] [CrossRef]
  11. Aikins, K.A.; Ucgul, M.; Barr, J.B.; Jensen, T.A.; Antille, D.L.; Desbiolles, J.M.A. Determination of discrete element model parameters for a cohesive soil and validation through narrow point opener performance analysis. Soil Tillage Res. 2021, 213, 105123. [Google Scholar] [CrossRef]
  12. Garciano, L.O.; Upadhyaya, S.K.; Jones, R.A. Measurement of soil parameters useful in predicting tractive ability of off-road vehicles using an instrumented portable device. J. Terramechanics 2010, 47, 295–305. [Google Scholar] [CrossRef]
  13. Wang, Y.; Fan, Z.; Zhou, X.; Zeng, C.; Xu, P.; Xie, X.; Wang, X.; Zhang, M.; Su, Z.; Huang, Q. Friction properties of bulk isotropic pyrocarbon materials based on different composite microstructures. J. Mater. Res. Technol. 2022, 21, 4079–4092. [Google Scholar] [CrossRef]
  14. Li, R.; Chen, O.; Ji, L.; Peng, X.; Huang, G. Based on internal friction theory: Investigating of Fe-based bulk amorphous alloys on mechanical properties with different Si content. J. Non-Cryst. Solids 2021, 563, 120813. [Google Scholar] [CrossRef]
  15. Zegzulka, J. The angle of internal friction as a measure of work loss in granular material flow. Powder Technol. 2013, 233, 347–353. [Google Scholar] [CrossRef]
  16. Zegzulka, J.; Gelnar, D.; Jezerska, L.; Ramirez-Gomez, A.; Necas, J.; Rozbroj, J. Internal Friction Angle of Metal Powders. Metals 2018, 8, 255. [Google Scholar] [CrossRef]
  17. Kyburz, M.L.; Sovilla, B.; Gaume, J.; Ancey, C. Decoupling the Role of Inertia. Friction. and Cohesion in Dense Granular Avalanche Pressure Build-up on Obstacles. J. Geophys. Res.-Earth 2020, 125, e2019JF005192. [Google Scholar] [CrossRef]
  18. Yoneyama, T.; Kitade, M.; Osada, K. Investigation on the ski-snow interaction in a carved turn based on the actual measurement. Procedia Eng. 2010, 2, 2901–2906. [Google Scholar] [CrossRef]
  19. Federolf, P.; Roos, M.; Lüthi, A.; Dual, J. Finite element simulation of the ski–snow interaction of an alpine ski in a carved turn. Sport Eng. 2010, 12, 123–133. [Google Scholar] [CrossRef]
  20. CSN EN ISO 14688-1; Geotechnical investigation and Testing-Identification and Classification of Soil-Part 1: Identification and Description. The Czech Office for Standards, Metrology and Testing: Prague, Czech Republic, 2018.
  21. Torresani, E.; Carrillo, M.; Haines, C.; Martin, D.; Olevsky, E. Fabrication of powder components with internal channels by spark plasma sintering and additive manufacturing. J. Eur. Ceram. Soc. 2023, 43, 1117–1126. [Google Scholar] [CrossRef]
  22. Lifton, J.J.; Tan, Z.J.; Goh, G.A.; Mutiargo, M. On the uncertainty of porosity measurements of additively manufactured metal parts. Measurement 2022, 188, 110616. [Google Scholar] [CrossRef]
  23. Kalman, H.A.; Portnikov, D. Analyzing bulk density and void fraction: A. the effect of archimedes number. Powder Technol. 2021, 381, 477–487. [Google Scholar] [CrossRef]
  24. Zegzulka, J.; Gelnar, D.; Jezerska, L.; Prokes, R.; Rozbroj, J. Characterization and flowability methods for metal powders. Sci. Rep. 2020, 10, 21004. [Google Scholar] [CrossRef] [PubMed]
  25. Zidek, M.; Rozbroj, J.; Zegzulka, J.; Necas, J.; Marschalko, M.A. Validation System of Traction and Pressing Tools. Czech Republic. Patent 306578. Granted 01.02.2017. Registered 29.09.2016. 2017. Available online: https://isdv.upv.gov.cz/doc/FullFiles/Patents/FullDocuments/306/306578.pdf (accessed on 21 April 2023).
  26. Yang, J.; Buettner, K.E.; Dinenna, V.L.; Curtis, J.S. Computational and experimental study of the combined effects of particle aspect ratio and effective diameter on flow behavior. Chem. Eng. Sci. 2022, 255, 117621. [Google Scholar] [CrossRef]
  27. Salehi, G.; Barletta, D.; Poletto, M.A. Comparison between powder flow property testers. Particuology 2017, 32, 10–20. [Google Scholar] [CrossRef]
  28. Anton Paar GmbH. Brochure Ultrapyc Series, I15IP006EN-B. 2020. Available online: https://www.labo.de/upload_weka/nwo/003/623/I15IP006EN_B_Brochure_UltrapycSeries__2__3623086.pdf (accessed on 18 July 2003).
  29. Iqbal, T.; Fitzpatrick, J.J. Effect of storage conditions on the wall friction characteristics of three food powders. J. Food Eng. 2006, 72, 273–280. [Google Scholar] [CrossRef]
  30. Chen, P.; Yuan, Z.; Shen, X.A.; Zhang, Y. Flow properties of three fuel powders. Particuology 2012, 10, 438–443. [Google Scholar] [CrossRef]
  31. Teunou, E.; Fitzpatrick, J.; Synnott, E. Characterisation of food powder flowability. J. Food Eng. 1999, 39, 31–37. [Google Scholar] [CrossRef]
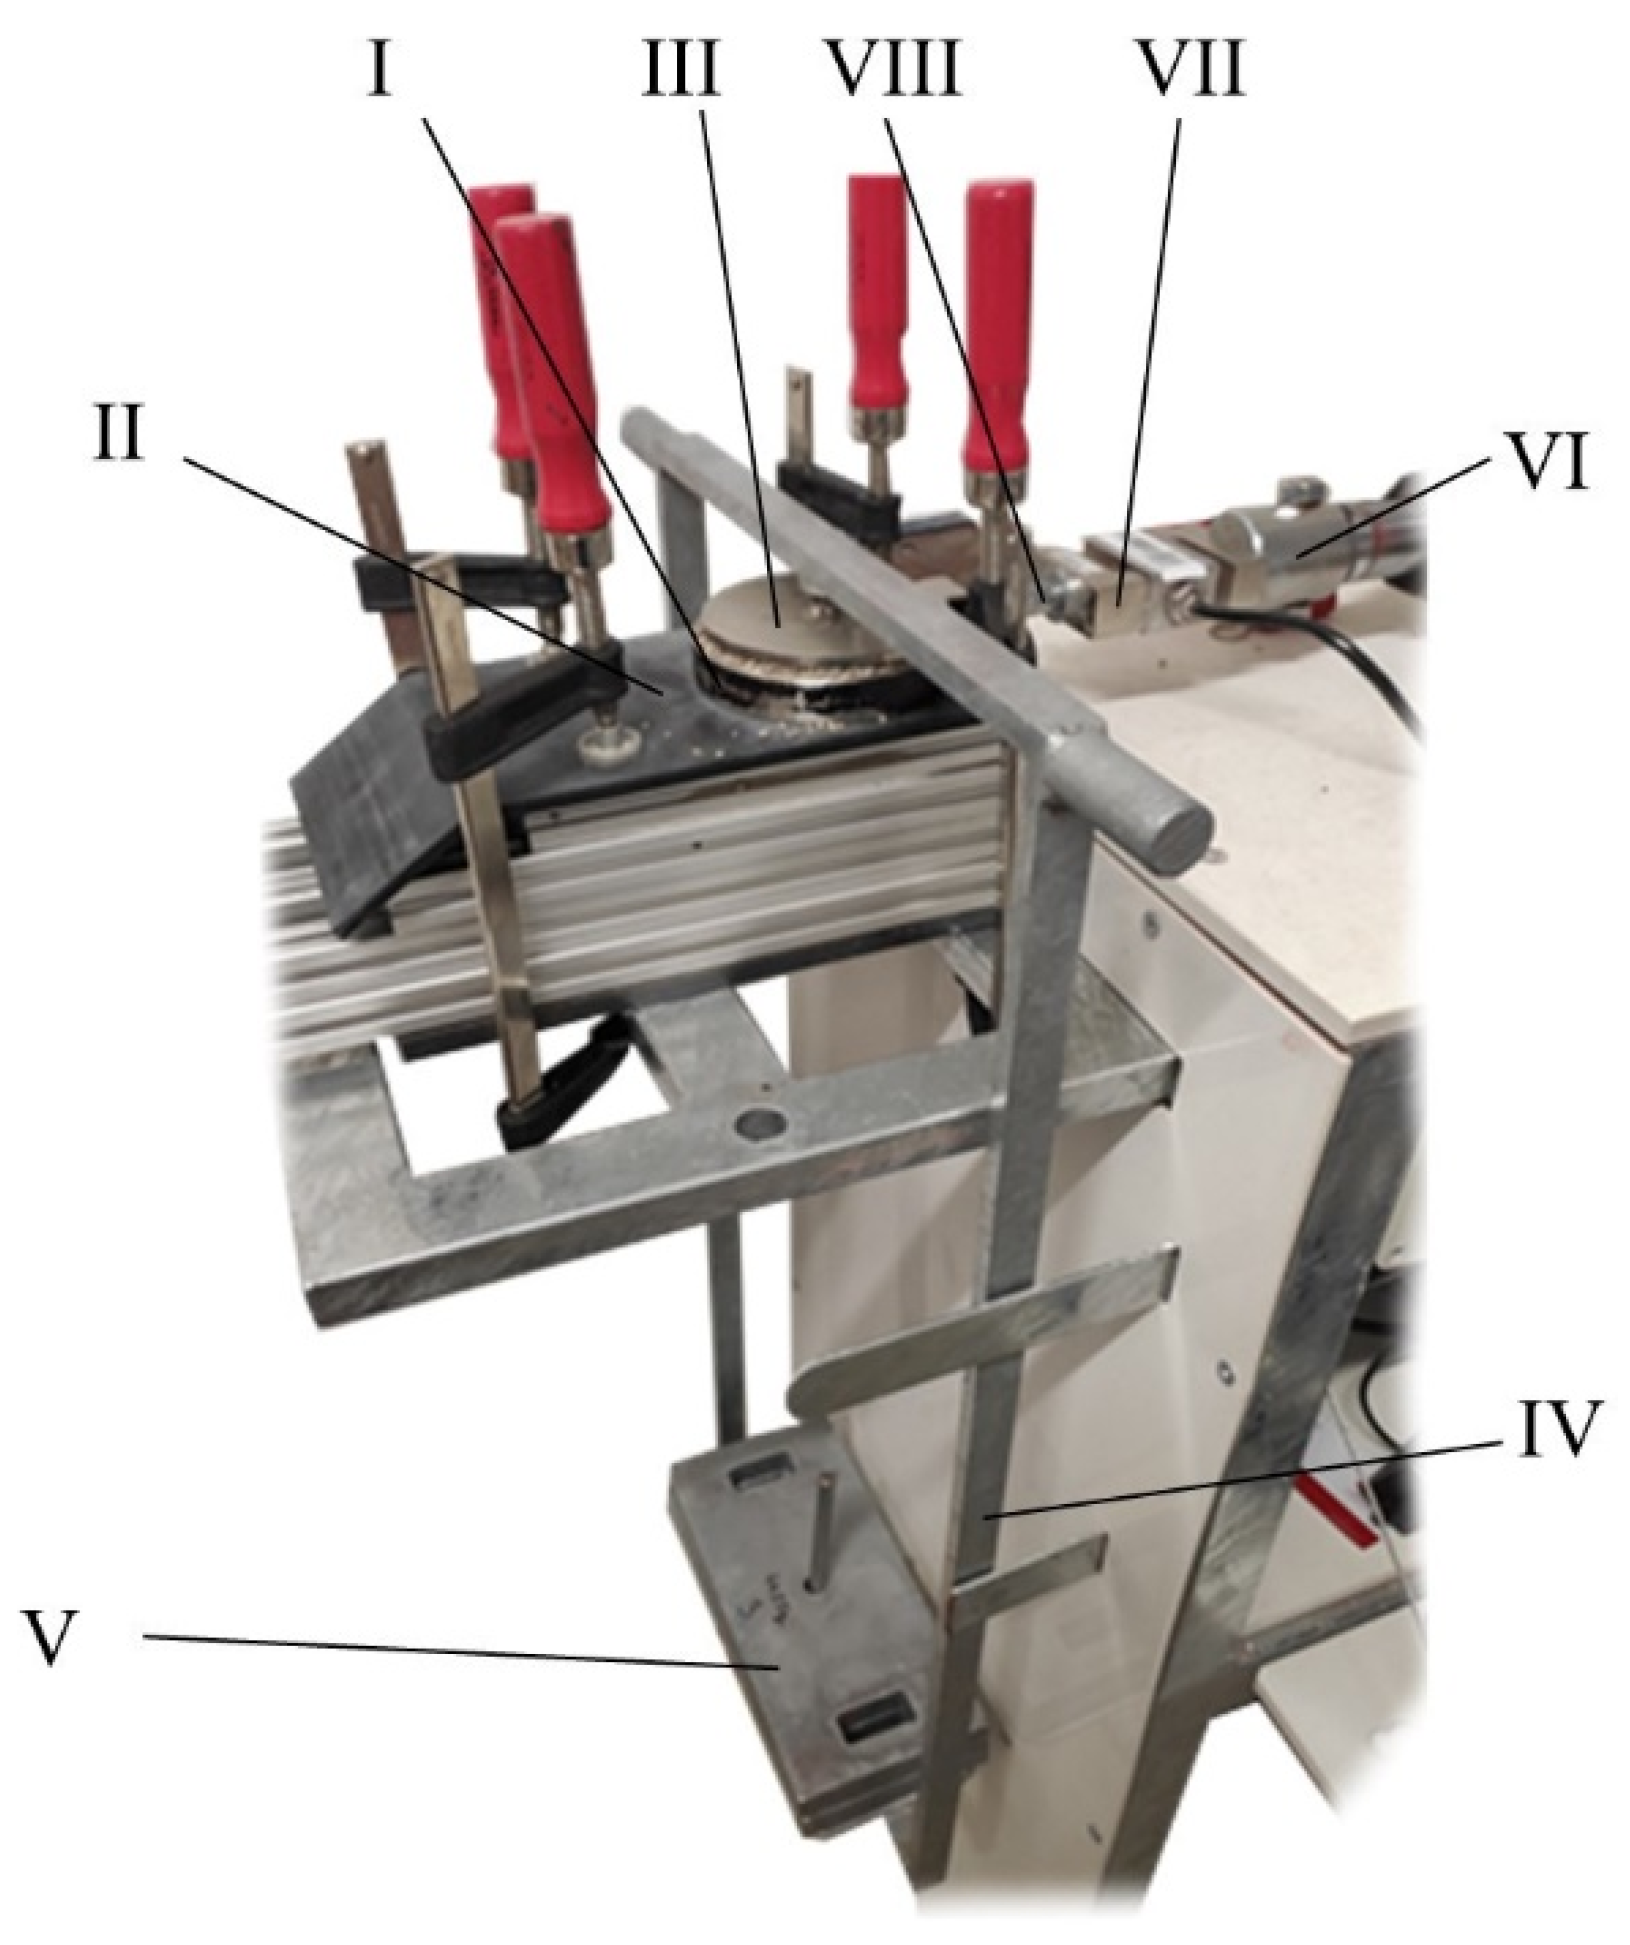
Figure 1. Jenike shear tester.
Processes 11 03348 g001
Figure 2. Validation system, (a) axonometric view, and (b) details of the device for alternative measurement of friction parameters.
Processes 11 03348 g002
Figure 3. Basic geometric parameters for experimental measurements, trough width, wall height, height of material in the trough, direction, and length of movement (mm).
Processes 11 03348 g003
Figure 4. (a) Tool geometry, (b) rake plate geometry (mm).
Processes 11 03348 g004
Figure 5. Equipment for measuring dynamic effects.
Processes 11 03348 g005
Figure 6. Calibration graph of diaphragm force transducer (MEG30, 500 N).
Processes 11 03348 g006
Figure 7. Comparison of weighted (I), static (II), and dynamic (III) normal loads.
Processes 11 03348 g007
Figure 8. Shear stress versus time for 1 weight at 10 Hz.
Processes 11 03348 g008
Figure 9. Evaluation of the initial shear stress for 2 tested materials and 3 transport speeds.
Processes 11 03348 g009
Figure 10. Evaluation of dynamic shear stresses for 2 tested materials and 3 transport speeds (start and end).
Processes 11 03348 g010
Table 1. Average values of the determined basic parameters.
ParameterValue
Sample 1Sample 2
Particle size
distribution x (mm)
Q3_10 (%)Q3_50 (%)Q3_90 (%)Q3_10 (%)Q3_50 (%)Q3_90 (%)
0.450.661.131.472.012.45
Volume weight
ρv (kg·m−3)
2.642.64
Bulk density
ρs (kg·m−3)
1.491.51
Angle of external
friction φe (°)
26.7425.4
Angle of repose
Ψs (°)
36.9138.8
Table 2. Average measured line speed vv.
ParametrFrequency on the Inverter
5 Hz10 Hz15 Hz
Average angular speed141.49288.62436.64
on threaded rod (rpm)
Average linear line0.0170.0340.051
speed (m·s−1)
Table 3. Comparison of weights: individually weighted and weight in the guideway.
ParameterNumber of Weights
1234
Individually weighted (kg)8.9513.3717.822.22
Weight in the guideway (kg)7.5811.8516.1920.47
Decrease S (%)15.3211.389.077.88
Table 4. Evaluation of the angle of external friction (°) for 2 tested materials and 3 transport speeds.
Transport SpeedBeginningStartEnd
Sample 1Sample 2Sample 1Sample 2Sample 1Sample 2
5 Hz23.8922.5323.6824.2630.2930.45
10 Hz22.2821.5724.1824.1129.2229.05
15 Hz23.6722.4123.5023.6529.4629.18
Disclaimer/Publisher’s Note: The statements, opinions and data contained in all publications are solely those of the individual author(s) and contributor(s) and not of MDPI and/or the editor(s). MDPI and/or the editor(s) disclaim responsibility for any injury to people or property resulting from any ideas, methods, instructions or products referred to in the content.