Article

Bed Separation Formation Mechanism and Water Inrush Evaluation in Coal Seam Mining under a Karst Cave Landform

1
College of GeoSciences and Surveying Engineering, China University of Mining and Technology (Beijing), Beijing 100083, China
2
School of Mining Engineering, Guizhou University of Engineering Science, Bijie 551700, China
*
Author to whom correspondence should be addressed.
Processes 2023, 11(12), 3413; https://doi.org/10.3390/pr11123413
Submission received: 8 November 2023 / Revised: 28 November 2023 / Accepted: 8 December 2023 / Published: 13 December 2023
(This article belongs to the Section Energy Systems)

Abstract

:
Understanding the formation mechanism of bed separation in coal seam mining under a karst landform is needed for the prevention and control of roof-separated water damage in such areas. This research used a mine in the northern Guizhou coalfield, China, as a case study, and applied theoretical analysis, numerical simulation, and on-site measurement to develop a circular cave structure model in a key stratum. The dynamic evolution of a separation bed was analyzed from several aspects, including the formation mechanism, development location, the mechanical condition of local karst caves, fracture evolution, and fractal rules. Verification using in situ measurements is presented for the case study mine, and a quantitative evaluation method for water inrush from bed separation and improved fusion weighting is proposed based on a cloud model. The research results indicate the following: (1) Tensile cracks are prone to occur above and below a karst cave, which produce an impact of connectivity on the separated space. (2) When the working face advances to 270 m in coal mining, longitudinal tensile cracks below the karst cave gradually increase and the width of the bed separation crack shrinks to 68.2 m, with a maximum separation layer height of 3.01 m. (3) Based on the cloud model and the improved weighted fusion method, the risk of water inrush in bed separation is judged as “high”. The En of the cloud digital features is 0.0622 and the He is 0.0307, achieving a quantitative evaluation of water inrush in the separation layer that is consistent with on-site practice, and is highly stable and reliable. This study improves the understanding of the development pattern of bed separation and water inrush risk assessment in coal seam mining under a karst cave landform.

1. Introduction

Guizhou Province is rich in coal resources, enjoys the reputation of being the “Golden Triangle” and the “Southwest Coal Sea”, and is the largest coal production base in South China’s coalfields [1]. This area is distributed within the world’s largest contiguous exposed carbonate rock formation, with multiple karst landforms including karst caves, sinkholes, and eroded depressions [2]. It also exhibits extensive p2c and T1y limestone strata above the roof of a Permian coal seam, with an uneven distribution of water abundance.
In such karst areas, groundwater seepage is complicated, and karst caves are developed in the karst area. Favara R [3] believes that the karst system is an area that is strongly controlled by structure, and the fault has formed favorable drainage holes; the researcher discusses the relationship between geochemical monitoring of the Santa Ninfa karst aquifer and earthquake seismic generating processes. Ivanik O [4] found that groundwater is guided by the bottom of the syncline, and made hydrological simulations of upwellings using a mathematical rainfall runoff model to obtain the law of water balance. Coal mining is also faced with the threat of roof karst water and rock structure collapse in mine production [5,6]. The main characteristics of coal field roof water damage in the northern Guizhou region are large instantaneous water inflows with strong destructive power. These often have unclear warning signs of water inrush, are of short duration, are difficult to detect, and have the typical characteristics of bed separation water damage [7]. There have been several studies of the formation mechanism and evolution pattern of bed separation in relation to coal seam mining [8,9,10,11]. For example, Qiao [12,13,14] suggested that there are three basic conditions for the formation of bed separation water: space that can accumulate water; the existence of recharge water sources around the strata; and the duration of the space within the strata being long enough to accumulate water. Xu [15] established a hydro-geological model for water accumulation and accurately predicted the location of water inrush during a bed separation. Cao [16] divided water inrush into different types, described the patterns of different types of water inrush, and used advanced drilling to release water inrush. Fan [17] summarized and analyzed the formation mechanism of water inrush from bed separation and proposed prediction methods relevant to the geological conditions of the Shilawusu mine, central China. Some scholars [18,19,20] have also identified the mechanism and location of bed separation during repeated mining of multiple coal seams, and proposed effective prevention and control measures such as the injection of grouting into separation spaces in a mine roof [21].
The above research has mainly focused on coal mines in the central and western regions of China. However, there is a significant difference in geological conditions between the p2c limestone formation of the northern Guizhou coalfield and the J2z sandstone formation in the western mining area. Furthermore, the development of limestone under a karst landform can be more complex. Therefore, further research is needed on the mechanism of detachment and the evolution pattern of fractures under a karst landform.
In relation to the safety evaluation of potential mine roof water damage, Wu [22] proposed the “three graphs and double prediction method” to analyze roof water accumulation and improve the accuracy of prediction results. In recent years, other scholars [23,24] have proposed different improvements to this method for various geological conditions, and have searched for suitable roof water inrush risk assessment methods. For example, Li [25] established an indicator system and evaluated the risk of water inrush based on GIS and a network analytic hierarchy process for the karst aquifer in the southwest mining region. However, methods such as the analytic hierarchy process, fuzzy mathematics, and expert scoring [26,27,28] heavily rely on subjective assumptions of experts when determining the weights of various indicators, which introduces a degree of uncertainty. These evaluation processes also fail to solve the problem of data information fusion, and can only be qualitative or semi-quantitative. Objective analysis methods such as quantitative weighting and critical objective weighting [29,30] are also susceptible to actual measurement errors.
In summary, indicators and evaluation methods for water inrush in karst areas still need to be improved. Cloud models [31,32,33,34,35] have been widely used in similar uncertainty problems. In view of this, this research uses theoretical analysis and numerical simulation methods to study the development pattern and fractal dimension characteristics of overlying rock bed separation fractures under circular karst cave mining conditions. A quantitative evaluation method is proposed for water inrush in karst areas based on a cloud model and improved fusion weighting. The study aims to provide improved methods for the management of water damage in separation layers in South China’s coalfields under karst landforms.

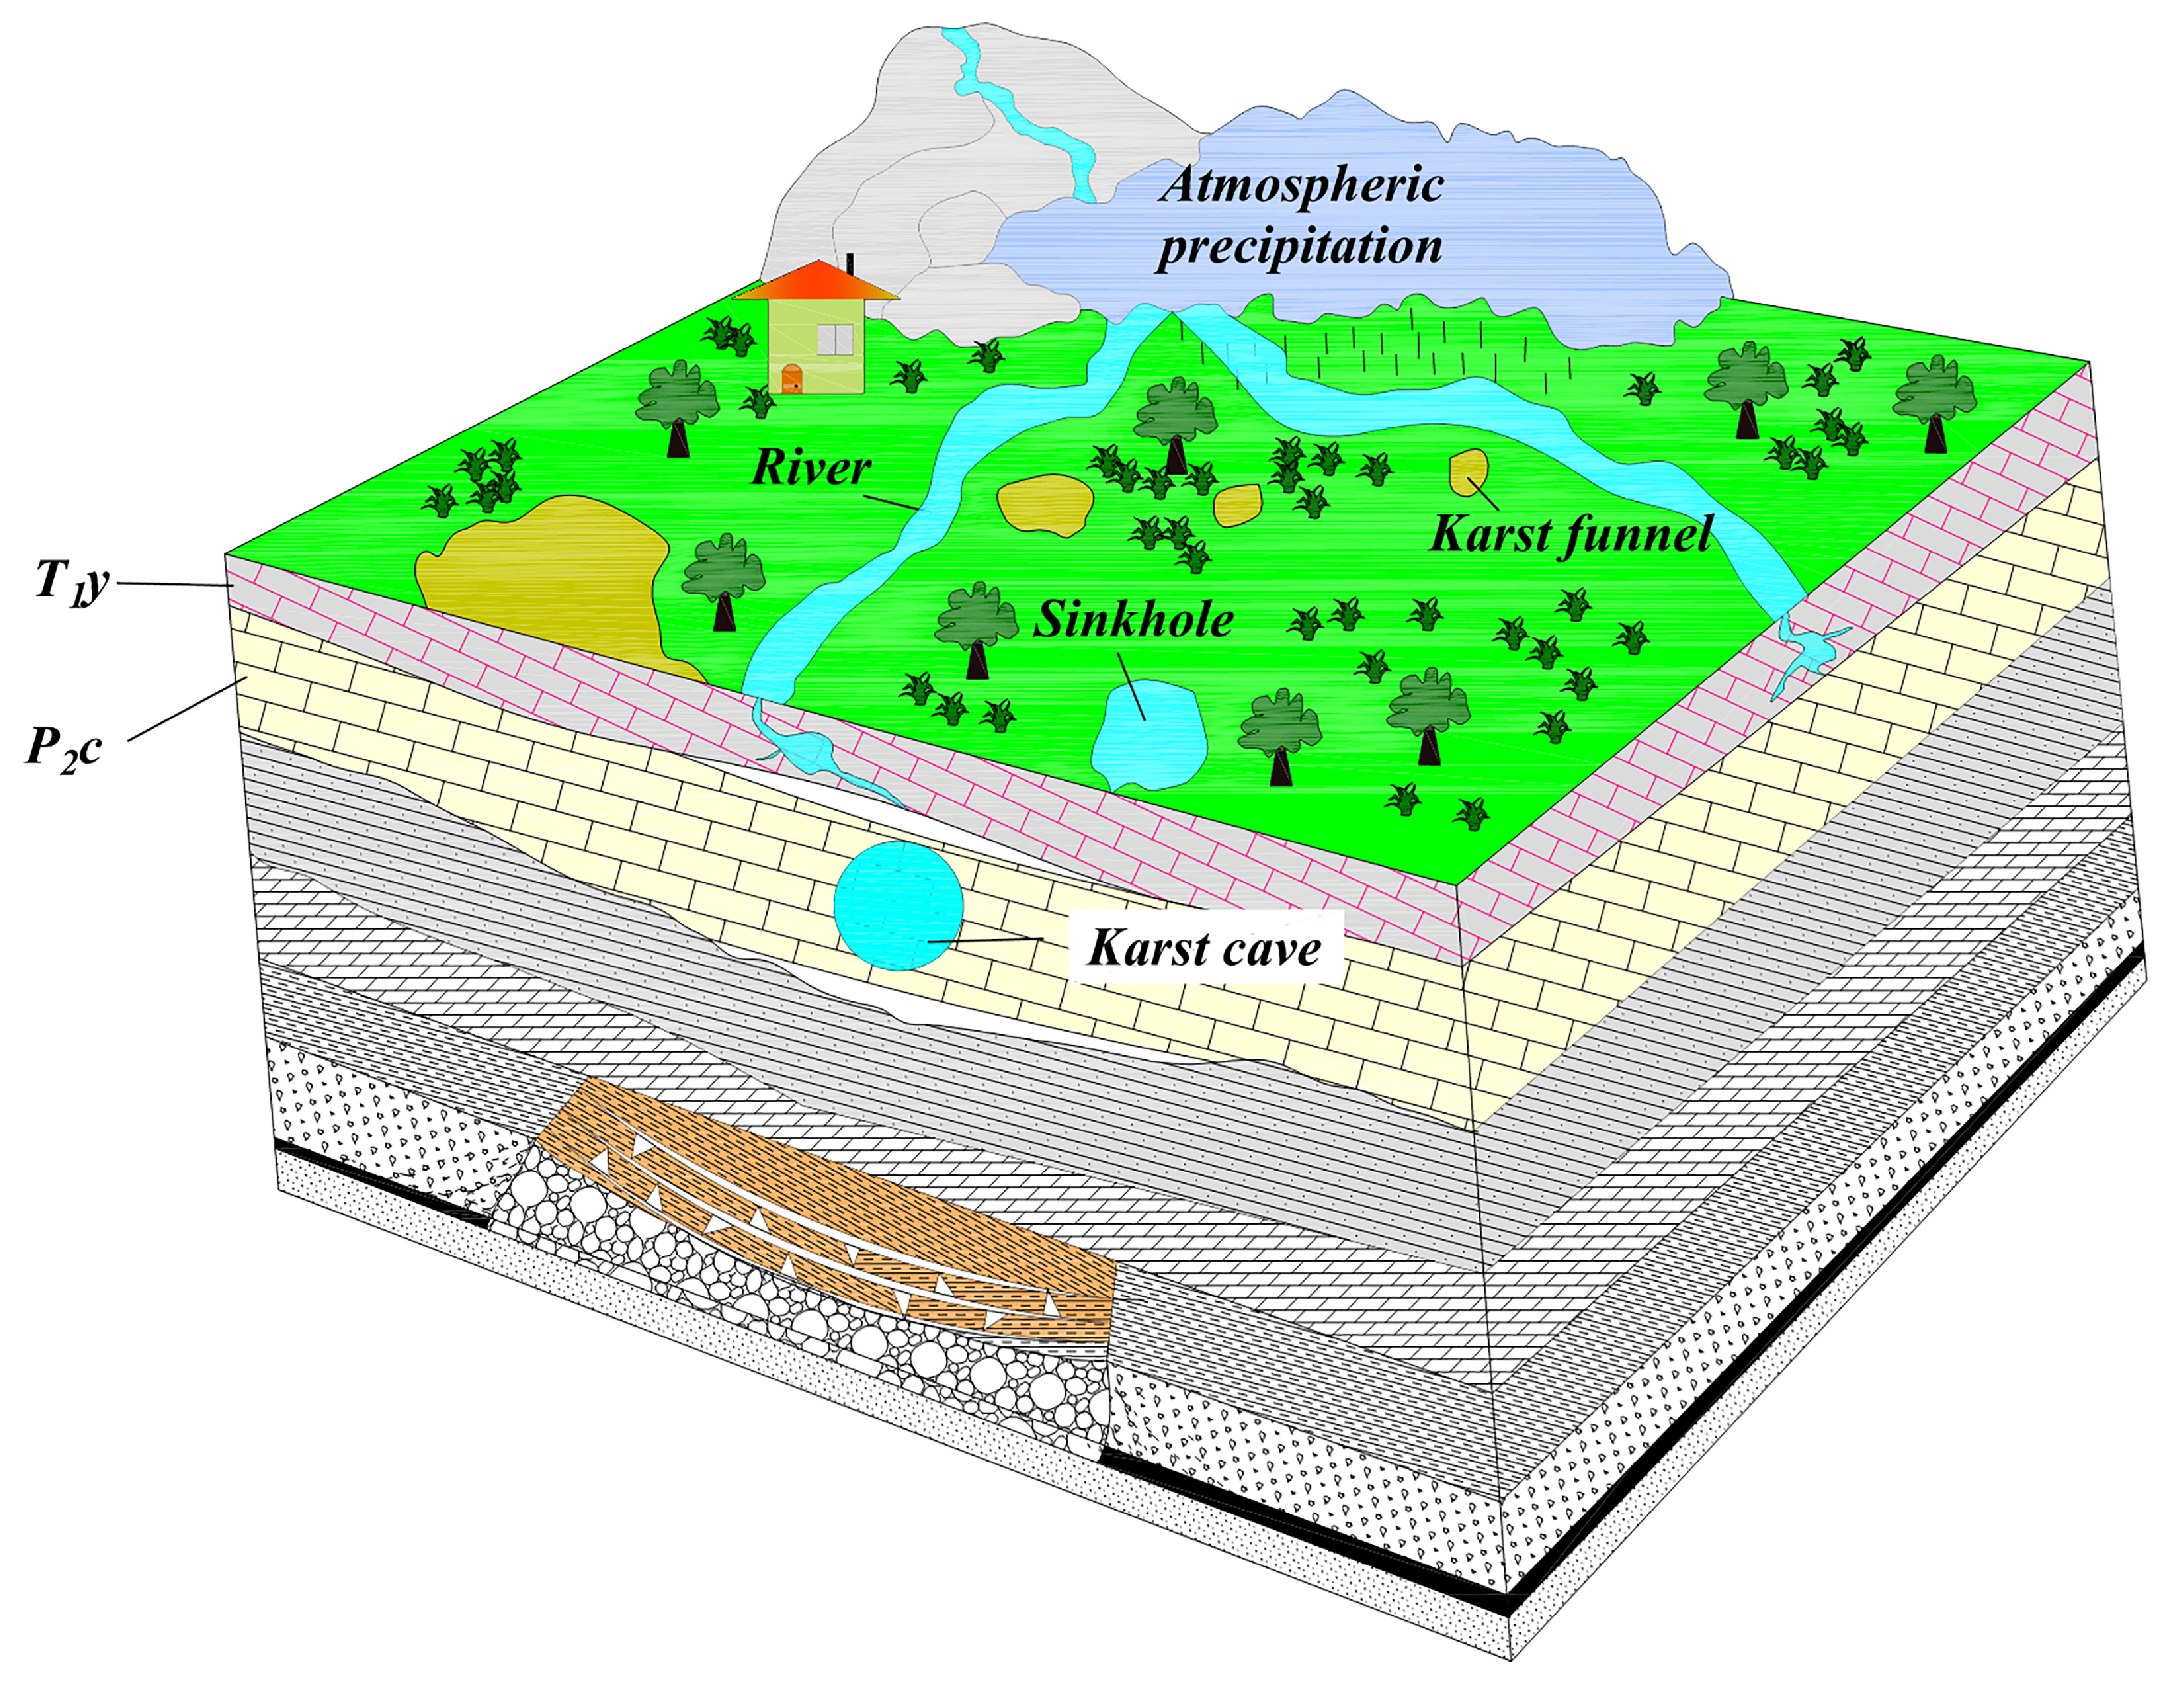
2. Engineering Background

The case study mine is located in Jinsha County, northwest Guizhou Province, China (Figure 1). Currently, the coal mine is exploiting the No. 9 coal seam, with an average thickness of 2.5 m and a depth of 331.03 m. The rock above the roof of the coal seam is composed of gray thick bedded limestone of Upper Permian p2c formation and limestone of Lower Triassic T1y formation, which are the main locations for forming karst. The structure of this coal seam is simple, and the mining process is mainly affected by a p2c limestone formation aquifer in the roof of the seam that is a direct water source to the mining area. The general geomorphology of the area is a mountainous landform of high denudation, erosion, and dissolution in the northwest, while these are low in the southeast. The upper part of the T1y formation is exposed at the surface, dissolution crevices are very developed, and there are local sinkholes. The lower strata are often connected with p2c limestone through numerous karst caves (Figure 2).

3. The Dynamic Evolution of Bed Separation in a Karst Cave Landform

3.1. Separation Zone Formation Mechanism

Current understanding of the development pattern of bed separation is mainly based on beam theory, key layer theory, and pressure arch theory. Key factors for the development of bed separation are that there is a large lithological difference between the upper and lower layers of the bed and that after mining of the seam, the roof is suspended and the span exceeds a limit value. Deformation between the upper and lower layers is not synchronized, and the deflection of the lower layer is generally greater than the upper layer. This is a bed separation zone [36]. The allowable tensile strength of the associated structural plane is very small.
In the process of coal seam mining, the upper and lower layers are subjected to tensile action, especially the separation space between hard rock and soft rock, which often develops below the key stratum, as indicated by the following:
τ c + σ tan φ
where τ is the formation shear stress, c is the cohesion force, σ is the formation normal stress, and φ is the friction angle.

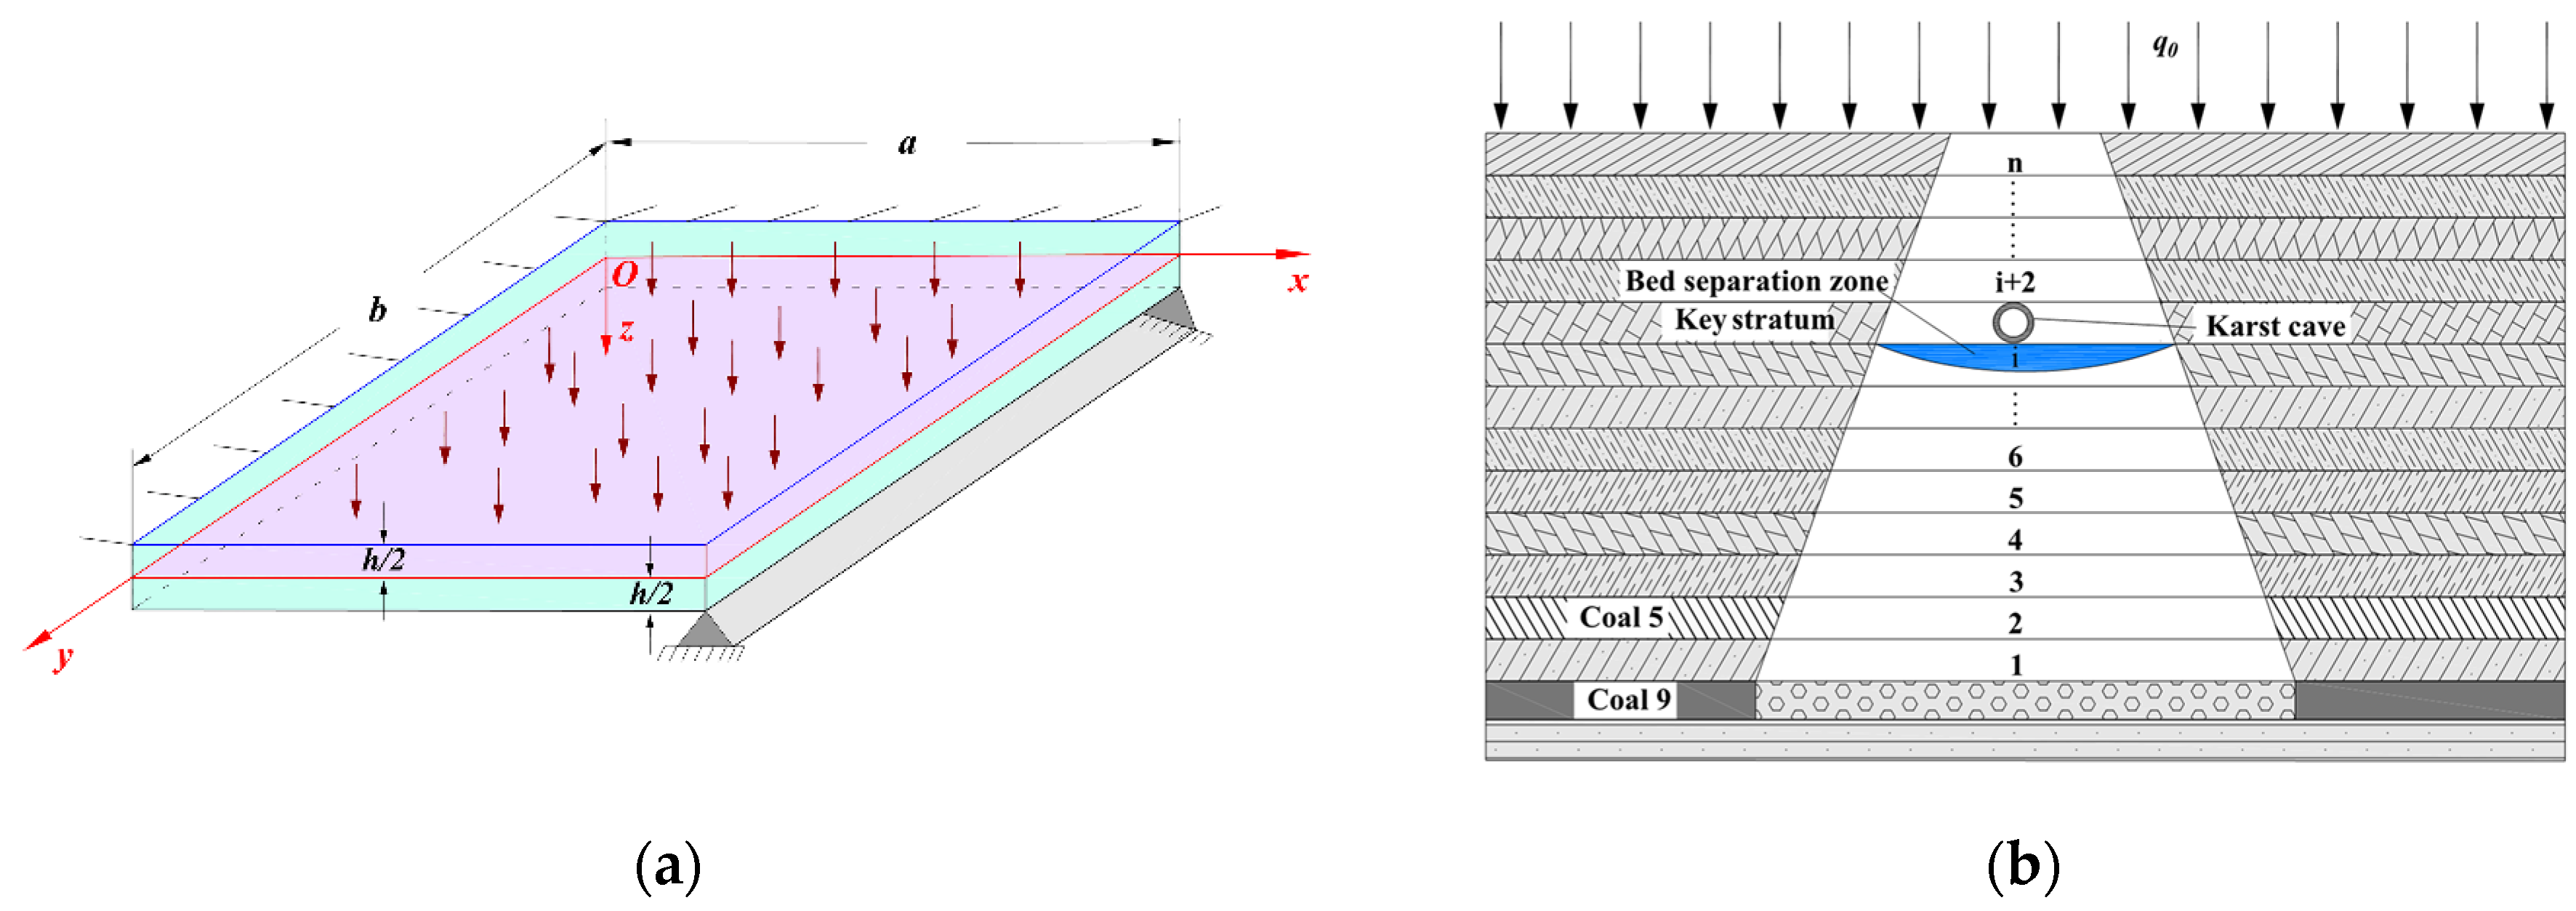
3.2. Mechanical Model of Bed Separation Space Development

(1).
Mechanical model of periodic separation development under uniform distribution load
Currently, most studies use a simplified beam model or an elastic foundation model to solve the space size and development position of the separated layer, but the rock layer is usually three-dimensional. This research is based on a thin plate in elasticity (1/100~1/80 ≤ h/a ≤ 1/8~1/5) to solve the related problems (Figure 3a), and uses this model to calculate the bending deflection of the rock layer ω.
When a working face advances, a separation space will periodically develop and close, and the direction that is adjacent to the goaf can be regarded as a simplified supported boundary. Therefore, a rectangular thin plate is calculated by establishing three sides with solid supports and one side with supports. The work done by the cohesion force is ignored in the process of solving the mechanical model, and the karst cavity is assumed to be in the p2c limestone formation (i.e., the key stratum). Referring to Figure 3b, we define a circular karst cave with radius r in the i + 1 rock layer, assuming that the thickness of thin plate is h, and the lengths of rectangular thin plate in the x and y directions are represented by a and 2b, respectively. Without considering the pressure and buoyancy of the water in the cave, it can be regarded as an infinite plate stress concentration problem with two-way forces. The solution for the karst cave can be obtained using the Ziersi solution in the plane problem. The vertical load of the overlying rock mass on the top of the separation space can also be regarded as uniform load q0 [37].
A mechanical model of the thin plate developed by periodic bed separation of a circular karst cave under a uniform load distribution is shown in Figure 4a. The load is given by q0 = γh, where γ is the bulk density of the rock layer and h is the thickness of the rock layer. The boundary conditions of a rectangular thin plate are as follows:
ω x = 0 = 0 , 2 ω x 2 x = 0 = 0
ω x = a = 0 , ω x x = a = 0
ω y = ± b = 0 , ω y y = ± b = 0
The expression for the deformation potential energy of a rectangular thin plate is as follows:
U = E 2 1 v 2 0 a b b 0 h z 2 2 ω 2 2 1 v 2 ω x 2 2 ω y 2 ω 2 x y d x d y d z
where E is the elastic modulus and v is Poisson’s ratio. Since the deformation potential energy does not change in the z direction, the flexure stiffness is given by D = E h 12 1 v 2 . This is substituted into Equation (5), and z is integrated to result in the following:
U = D 2 0 a b b 2 ω 2 d x d y 1 v D 0 a b b 2 ω x 2 2 ω y 2 2 ω x y 2 d x d y
Using Green’s theorem and simplifying it, the deflection can be calculated in the form of series [38], as follows:
ω = 3 a 4 γ H x π 2 D 24 12 a + 8 a 2 π 2 + 3 a 2 1 cos 2 π x a 1 cos 2 π y b
The maximum height of the separation space is the difference of the maximum deflection of the upper and lower strata hb, h b = ω i ω i + 1 . When this is substituted into Equation (7) and the equation is reorganized, we obtain the following:
h b = γ a 4 b 4 H i H i + 1 4 π 4 D 3 a 4 + 3 b 4 + 2 a 2 b 2 1 cos 2 m π x a 1 cos 2 n π y b
(2).
Mechanical analysis of a circular cave
Around the circular cave model, it is assumed that the bedrock is homogeneous and an isotropic elastomer; the surroundings of the plate do not change along the vertical direction, and the x-direction and y-direction of the midplane of the plate are not displaced. Only the stress around the cave is considered, as shown in Figure 4b, where the radius of the cave is r, while R is the distance from the center of the cave, σr is the radial stress, σθ is the tangential stress, and τ is the shear stress, q1 is the horizontal stress on the cave, and q0 is the vertical stress, which can be expressed using [39]:
σ r = q 1 + q 0 2 1 r 2 R 2 + q 1 q 0 2 1 r 2 R 2 1 3 r 2 R 2 cos 2 θ σ θ = q 1 + q 0 2 1 + r 2 R 2 q 1 q 0 2 1 + 3 r 2 R 4 cos 2 θ τ r θ = q 1 q 0 2 1 r 2 R 2 1 3 r 2 R 2 sin 2 θ
At this time, the stress around the cave can be described by the deflection of the plate ω, where q1 and q0 are the following:
q 1 = E z 1 μ 2 2 ω x 2 + μ 2 ω y 2 q 0 = E z 1 μ 2 2 ω y 2 + μ 2 ω x 2

3.3. Bed Separation Location

The key stratum theory is used to identify the location of the development of the bed separation [40], which is obtained in three steps.
a. 
The hard rock formations are identified from the bottom up, as follows:
q 1 x n = E 1 h 1 3 i = 1 n h i γ i / i n E i h i 3
where q1(x)|n is the load of the first layer under the n layer, hi is the thickness of stratum i, γi is the bulk density of stratum i, and Ei is the elastic modulus of stratum i.
b. 
The load of the n + 1 layer on the first layer is calculated. A bed separation is formed when the following relationship is satisfied:
E n + 1 h n + 1 2 i = 1 n h i γ i > γ n + 1 i = 1 n E i h i 3
c. 
The deflections of the different rock strata are calculated using Equation (15), when the following relationship is satisfied:
1 n ω d o w n > 1 n ω u p
where ωdown is the deflection of the lower rock layer and ωup is the deflection of the upper rock layer.
For example, the load of layer 2 on layer 1 is given by the following:
q 2 1 = E 1 h 1 3 γ 1 h 1 + γ 2 h 2 E 1 h 1 3 + E 2 h 2 3 0.4   k P a
The second layer load is: q 2 = 193.8 kpa. According to the above method, we calculate the load of layer 3 to layer 2 and the load of layer 4 to layer 2, q 3 2 = 233.1 kpa and q 4 2 = 93.1 kpa, respectively.
Since q 4 2 < q 3 2 , layer 4 does not apply a load to layer 2, and layer 4 is C9 coal, that is, layer 4 is the key stratum (basic top). According to The Code for Coal Pillar Maintenance and Coal Pressure Mining in Buildings, water Bodies, Railways and Main Shafts and Lanes, the thickness of a coal seam is 2.5 m, the lithology strength is hard, and the development height of the caving zone is 9.26 m to 14.27 m. The development height of a water-conducting fracture zone is 41.10 m to 58.90 m. Therefore, layers 4 and 6 develop into caving zones and water-conducting fracture zones, and it cannot form a separation zone. A water-conducting fracture zone can develop within the lower part of the p2c limestone and there is mudstone below it, within which it is easy to form a separation space.

4. Evolution and Fractal Characteristics of Overburden Fracture under a Circular Cave

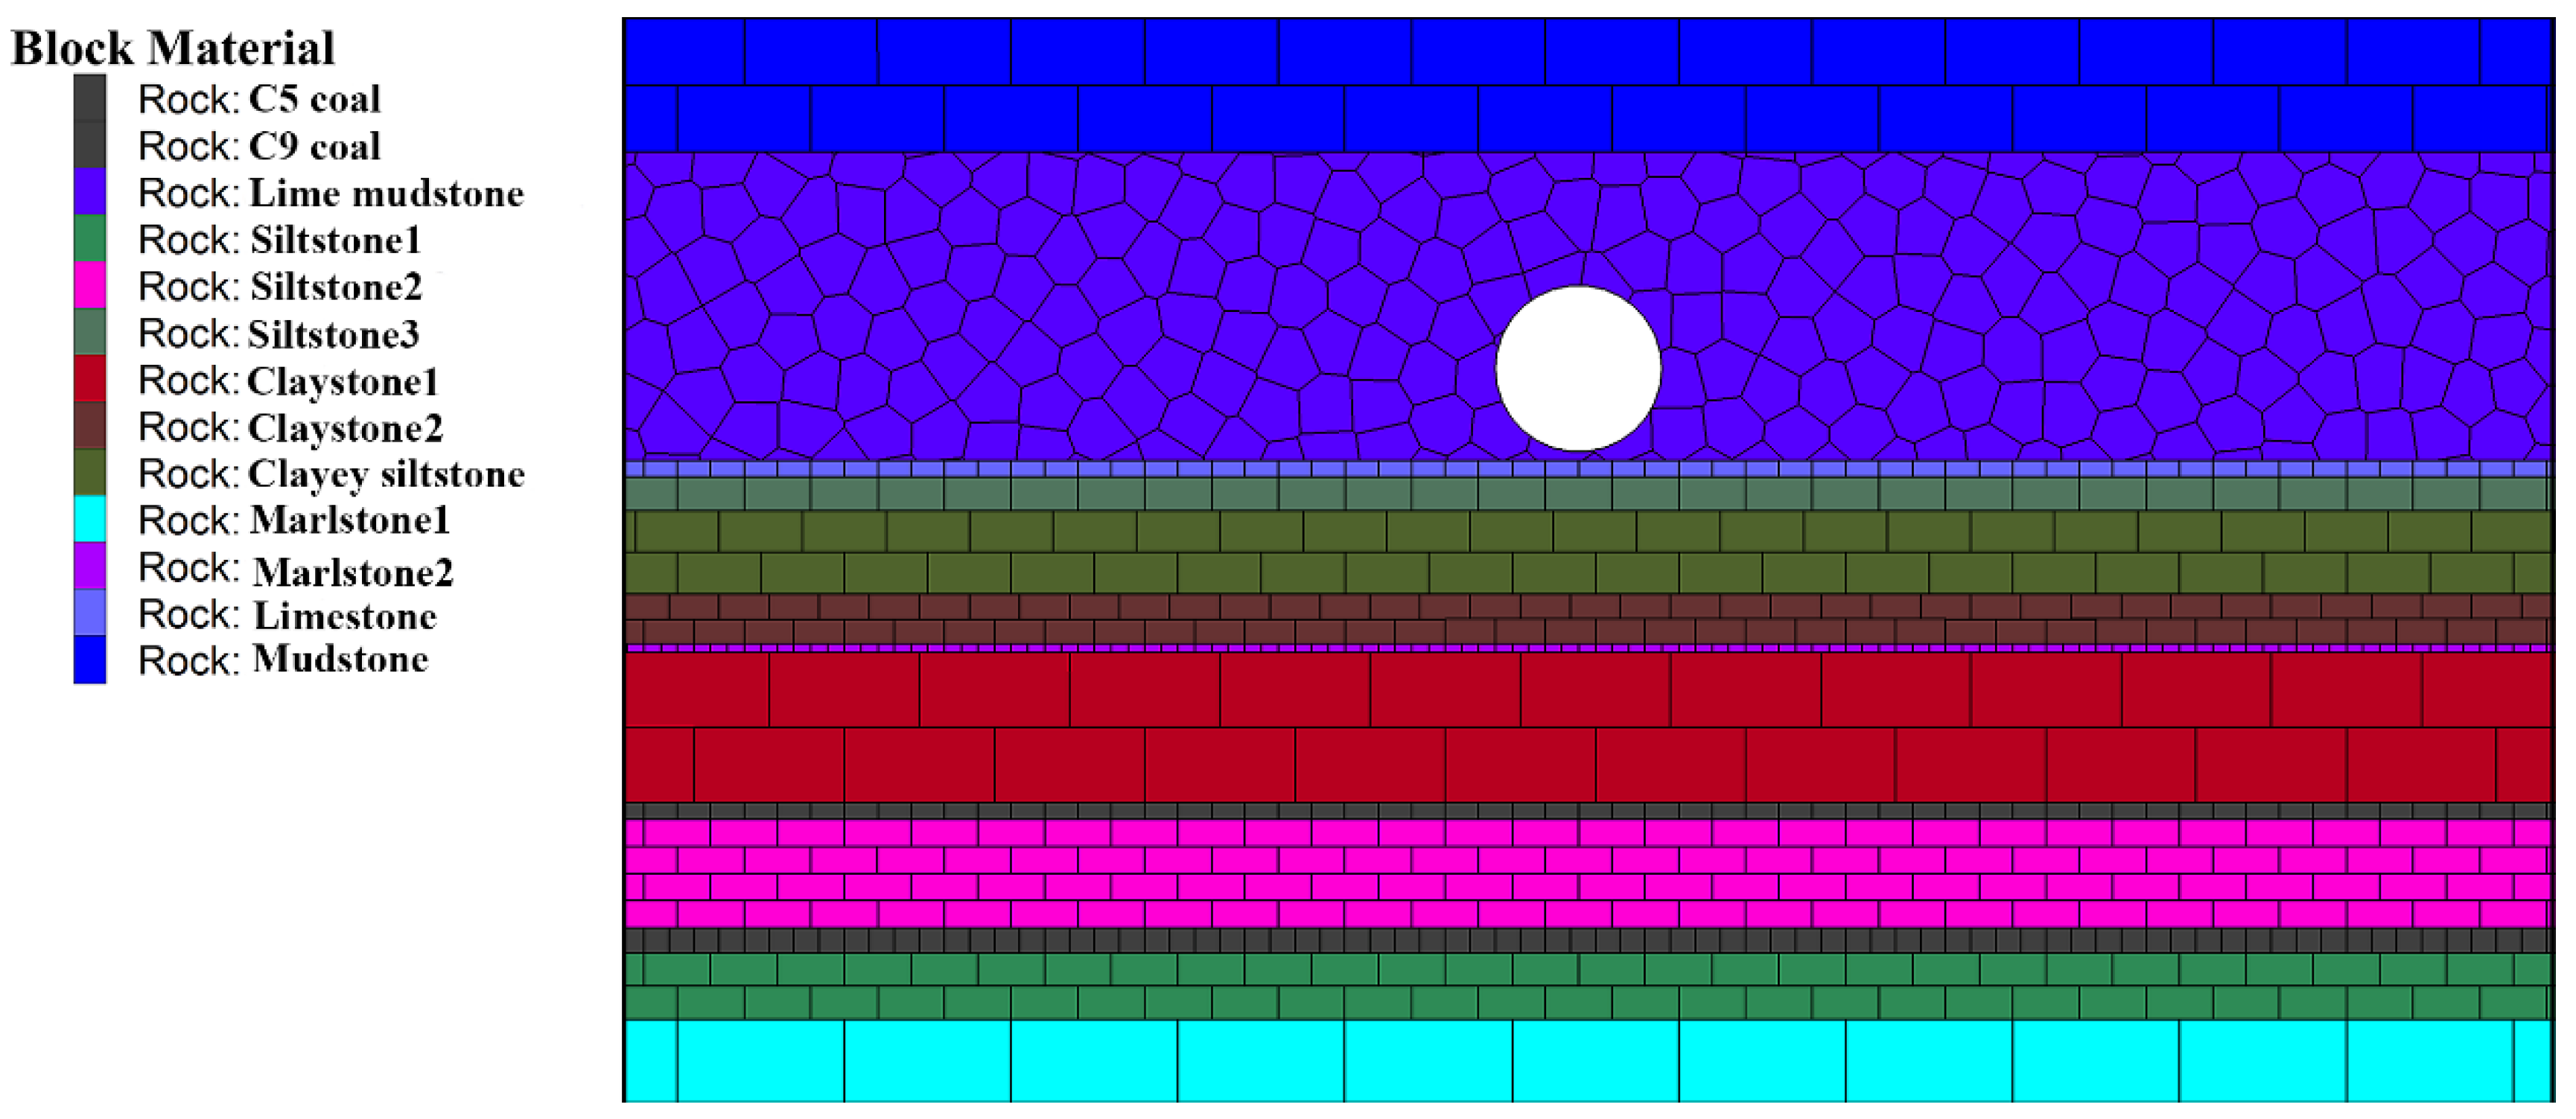
4.1. Numerical Model

Taking the geological conditions of the 10903# working face of the case study coal mine as the engineering background, a Universal Distinct Element Code numerical model under the geological conditions of the cave was established. The strike length of the 10903# working face is designed to be 500 m, and the height is 120 m. The load of the overburden surface and of the T1y limestone rock strata is simplified to 6.5 Mpa in the model, and the mining height of the coal seam is 2.5 m. The top is a free boundary, the bottom is a fixed boundary, and in order to reduce the boundary effect, a protective coal pillar of 100 m was set at each end of the model. The excavation step was set to 30 m, and a total of 10 steps were completed, from left to right (Figure 5). The constitutive model is a Monte-Carlo model, the joint surface assumes a contact Coulomb slip criterion, and the monitoring curve was set at the bottom of the p2c limestone. The physical and mechanical parameters describing the coal rock strata are presented in Table 1.

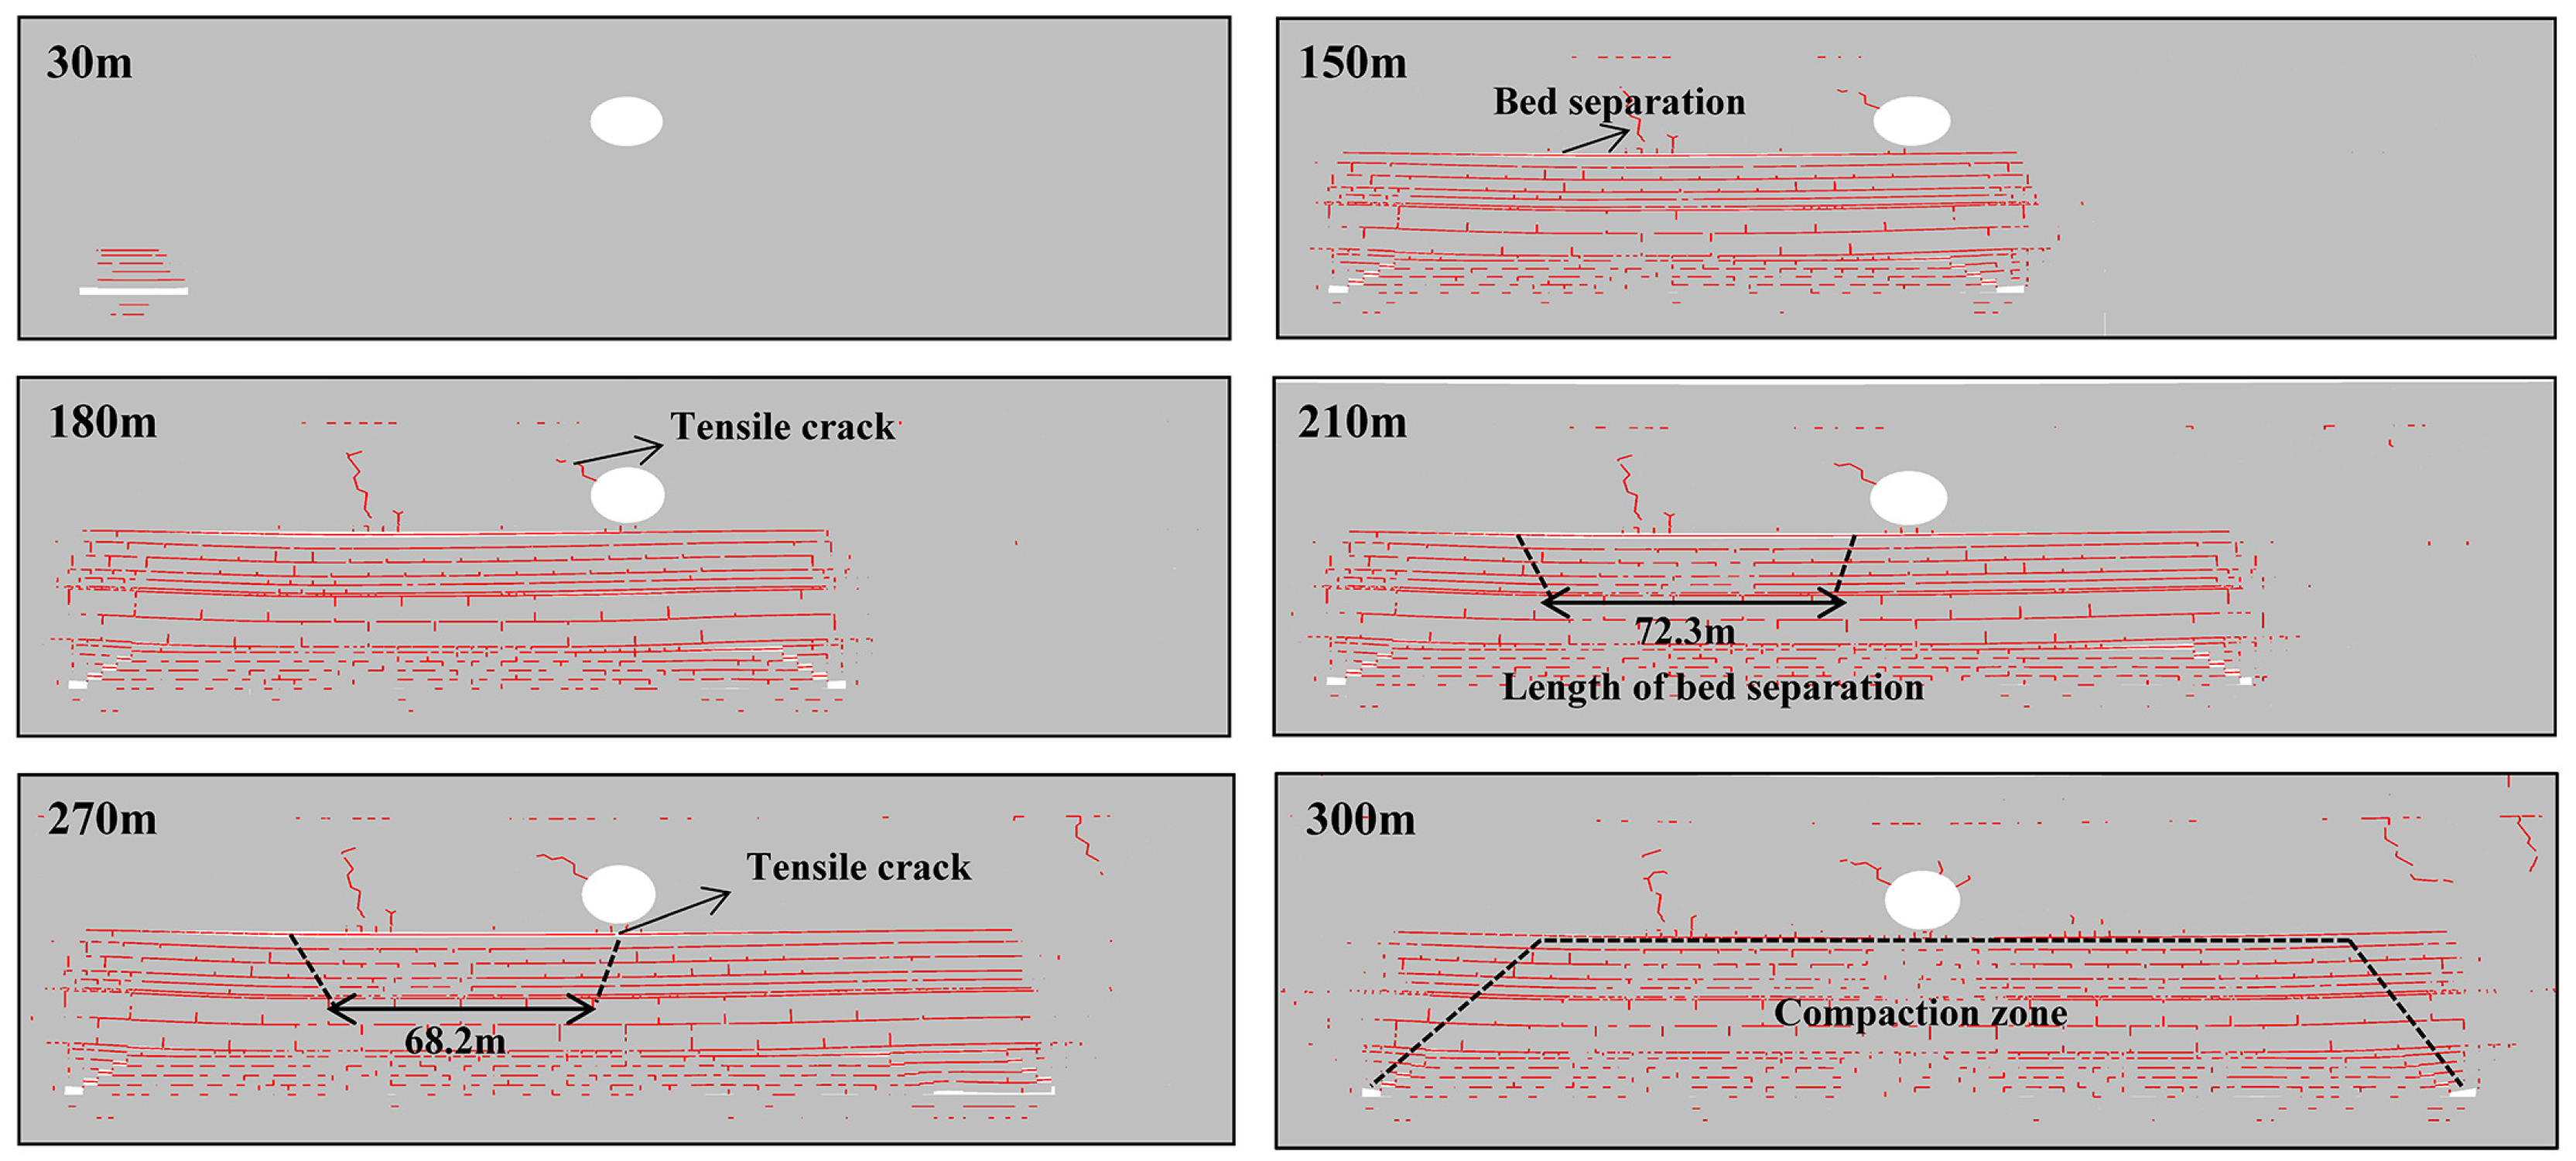
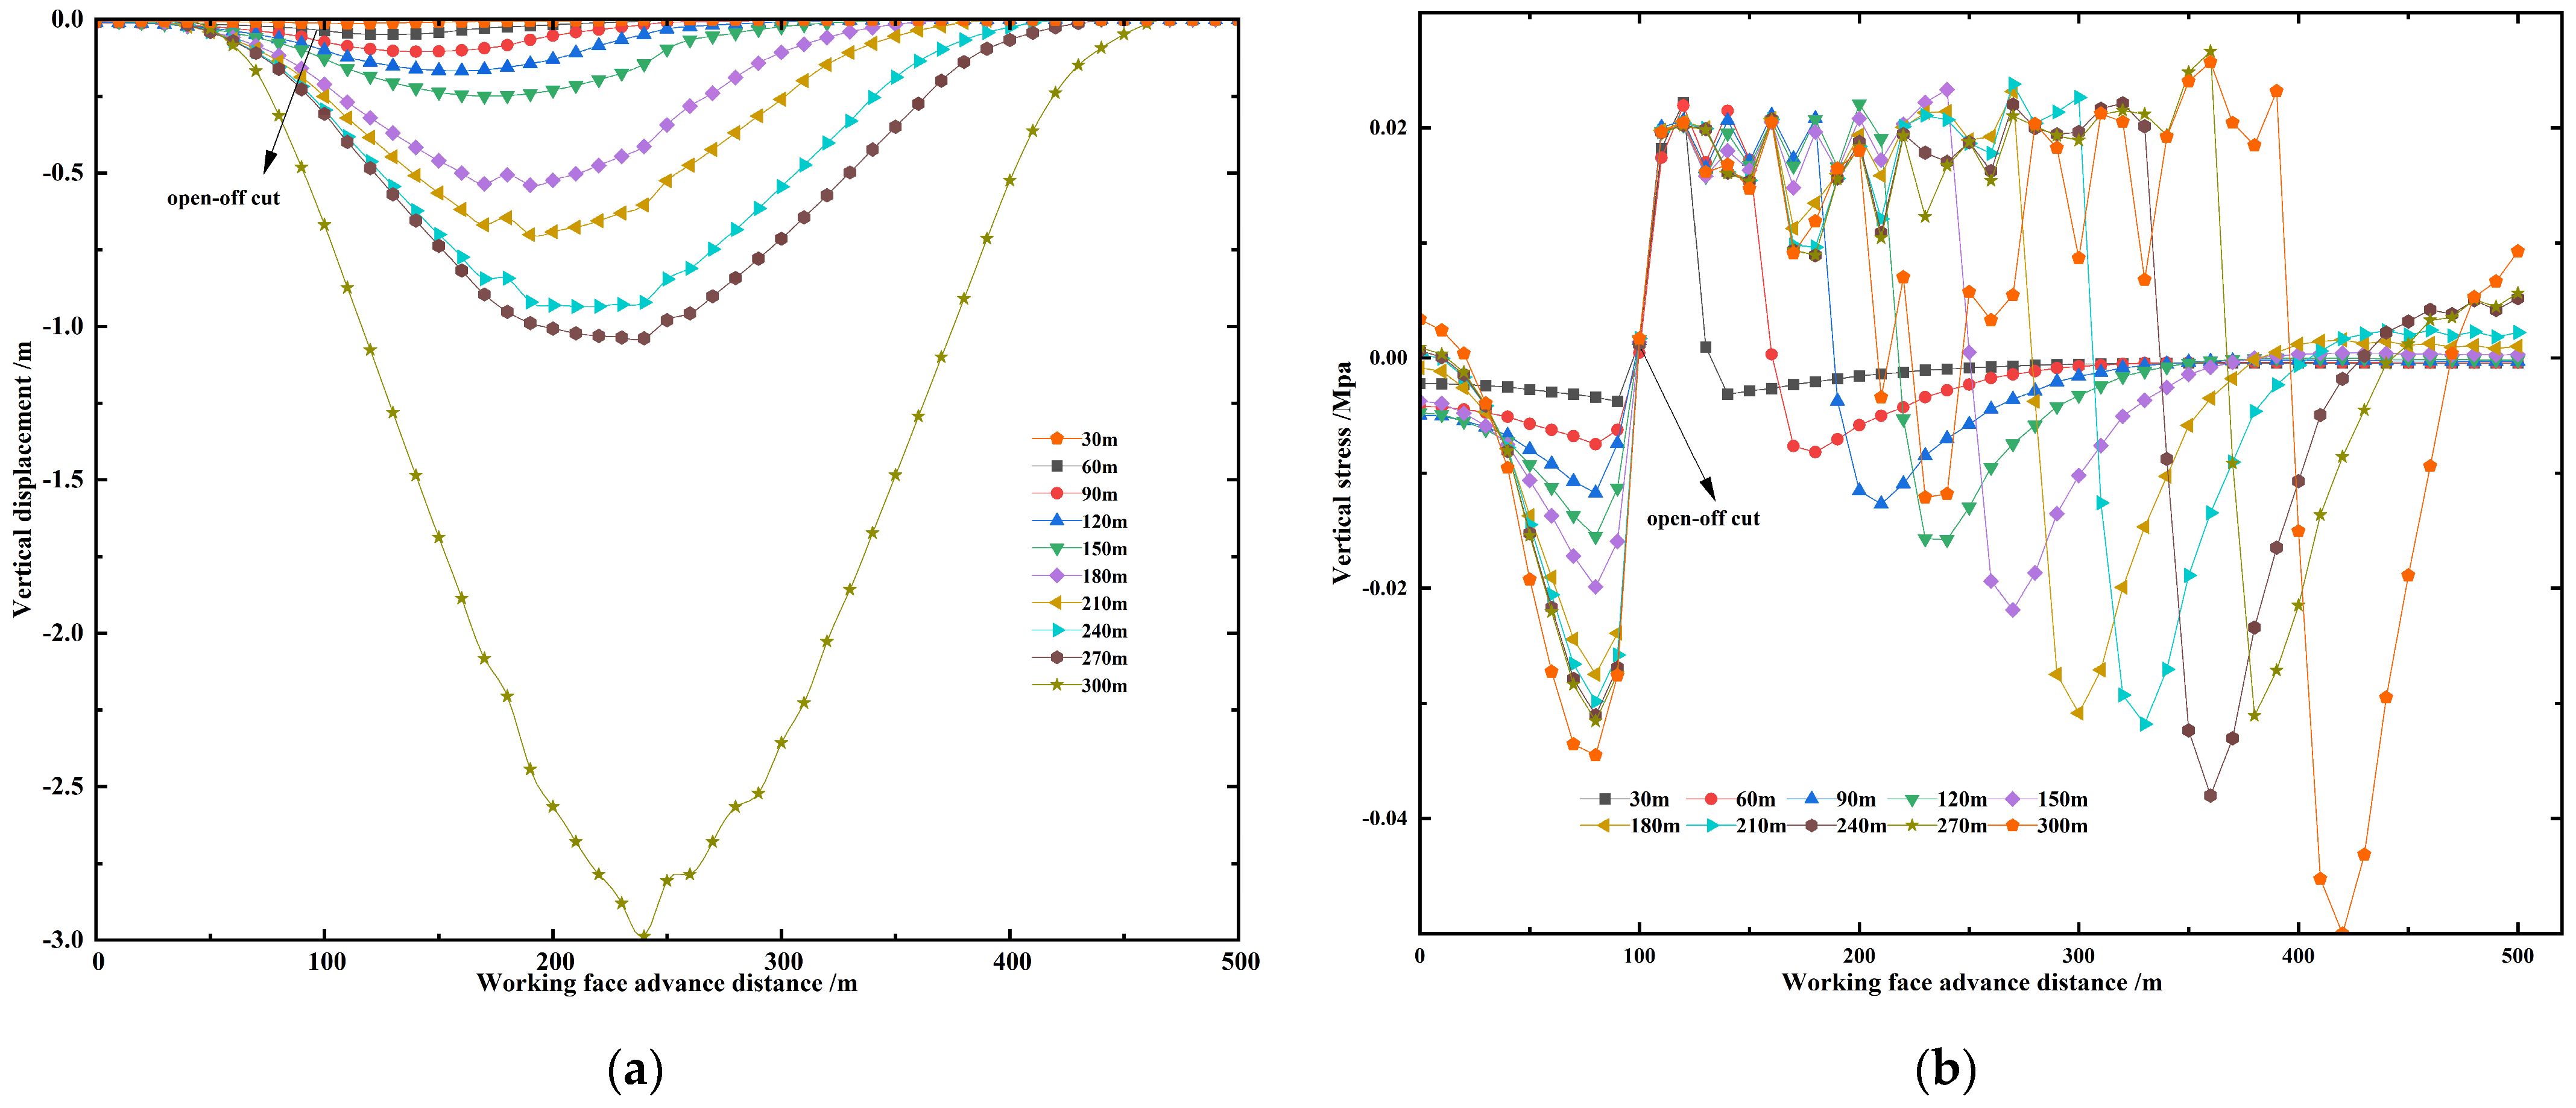
4.2. Dynamic Laws and Fractal Characteristics of Overlying Strata

The development pattern of stratified fractures in coal seam mining under karst cave geological conditions is relatively complex. Therefore, fractal dimensions were used in this study to quantitatively characterize the fractal characteristics of stratified fractures in overlying rock, revealing the influence of fractal dimensions at the micro scale level.
(1).
Evolution pattern of the stratification and the movement of overburden
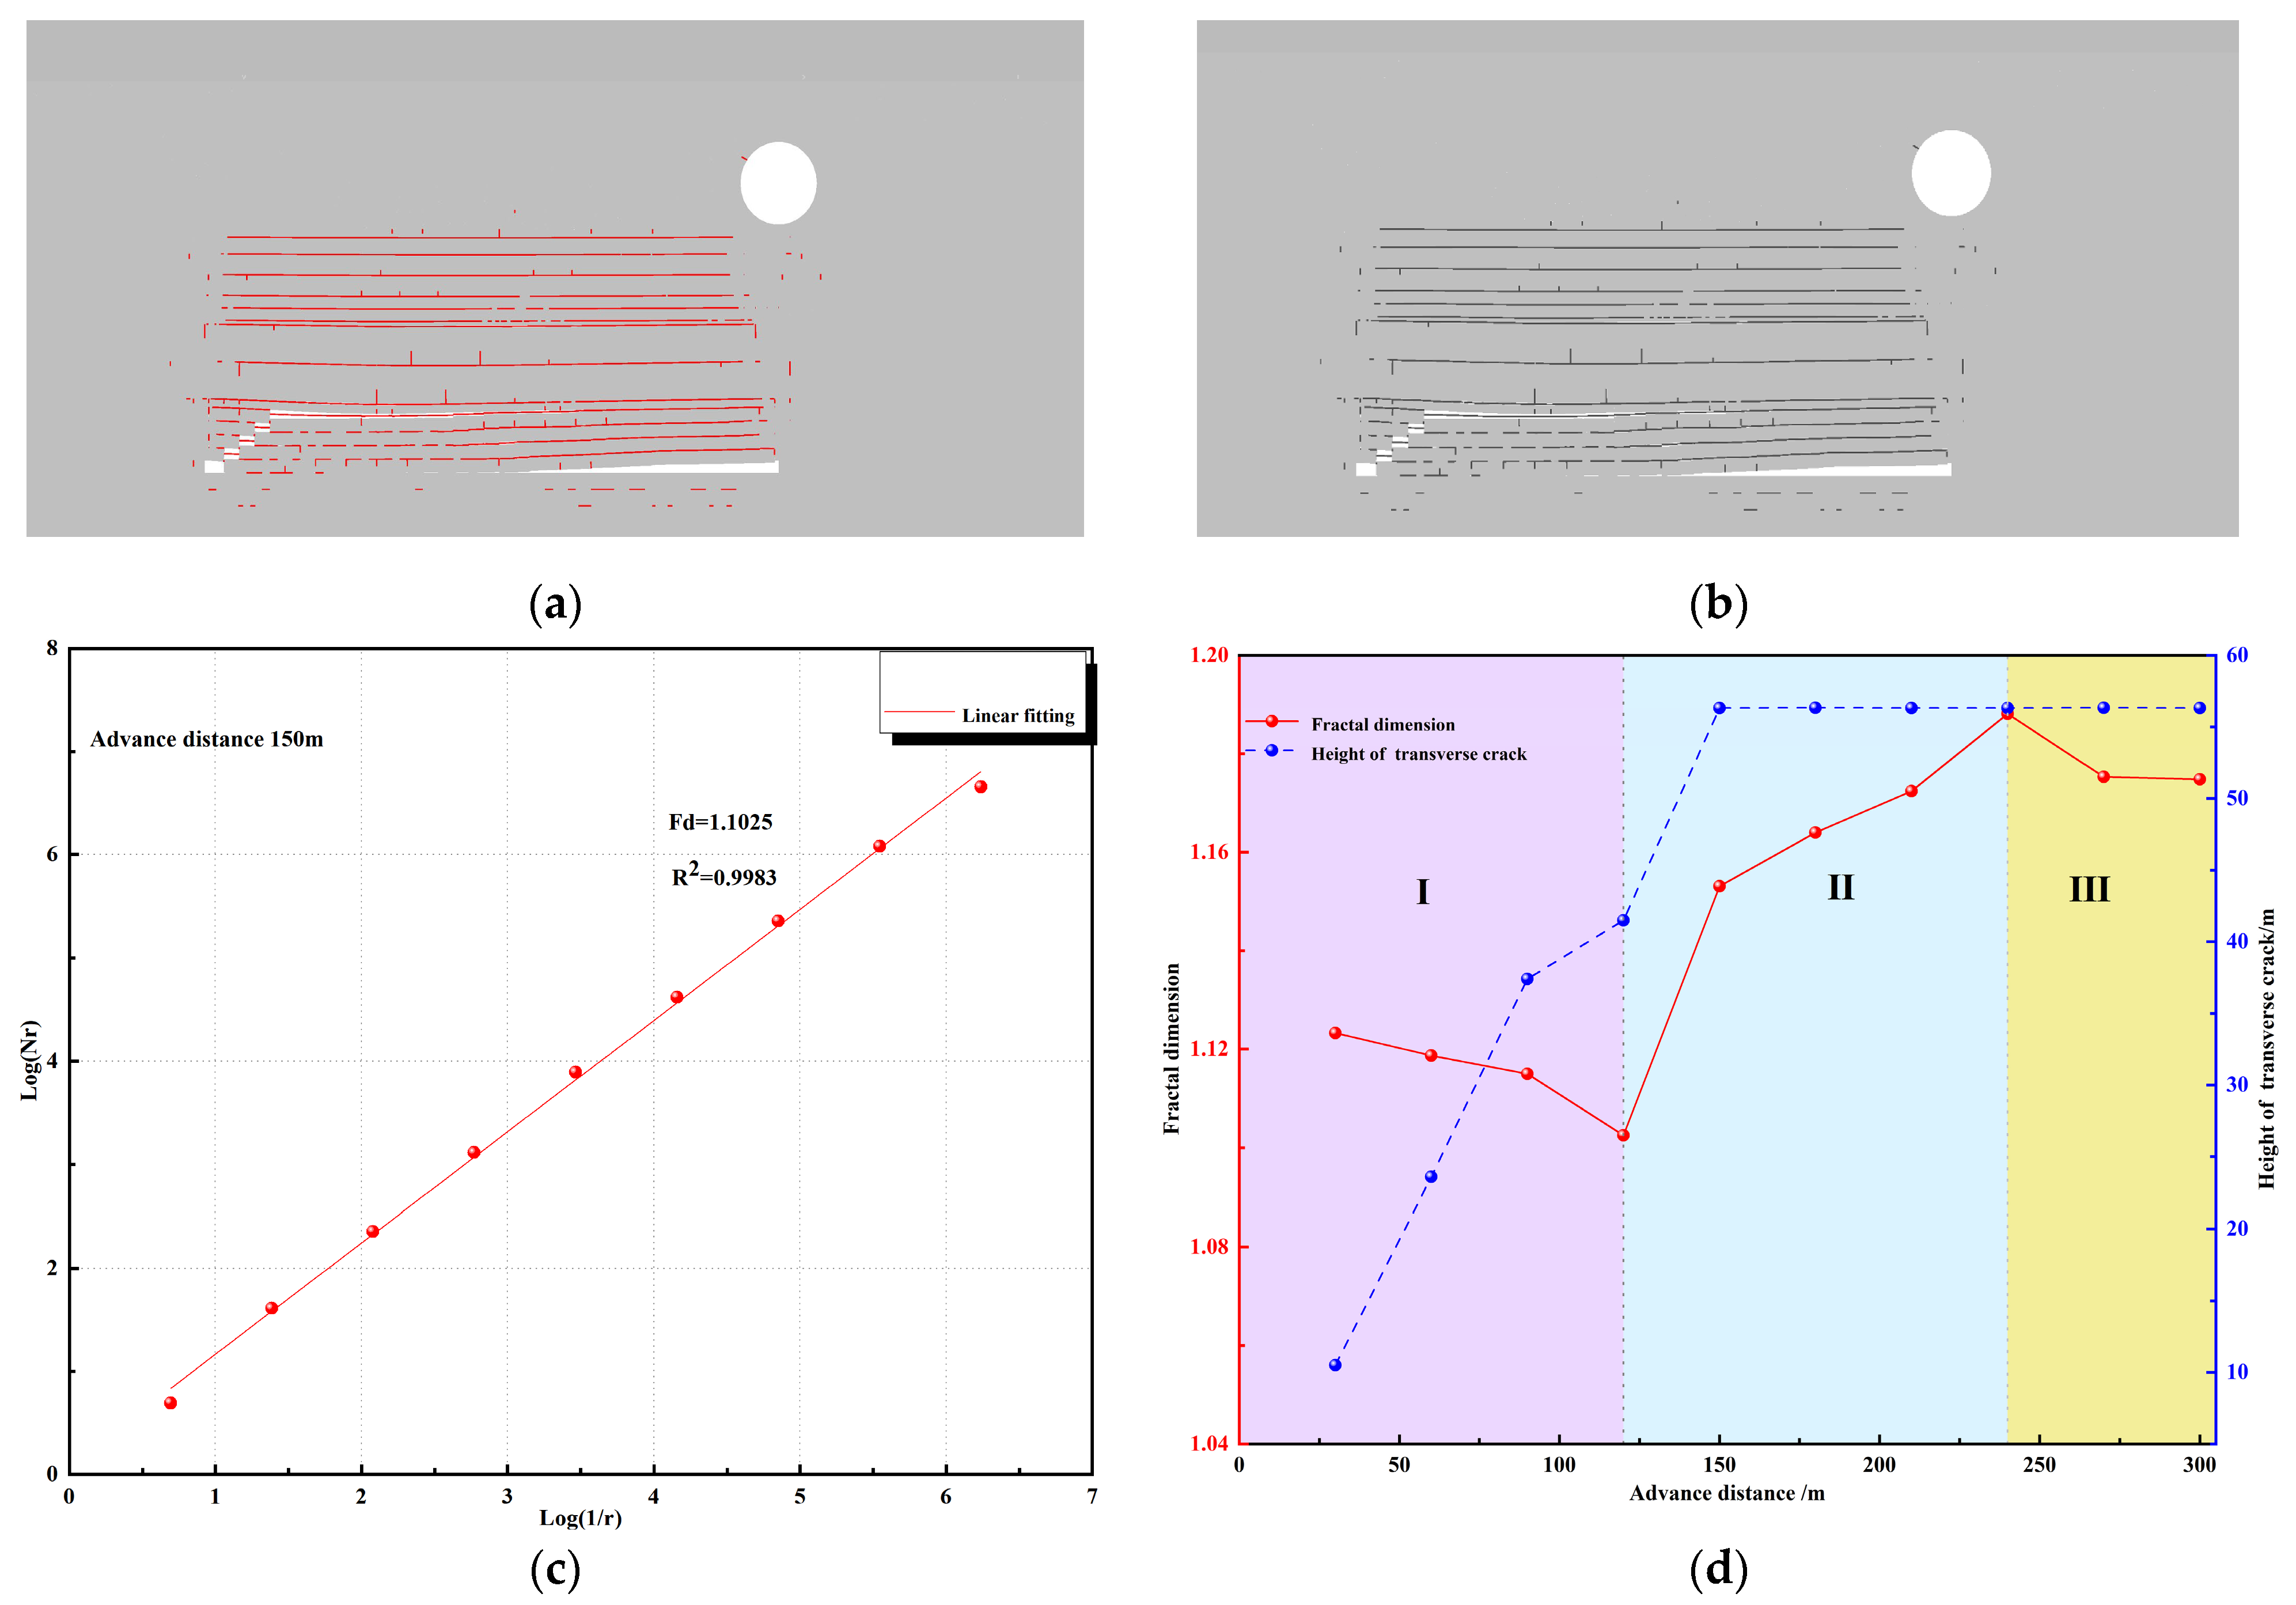
UDEC numerical simulations provided the evolution and stress displacement related to the karst cave and strata fracture at different advancing distances. As can be seen from Figure 6 and Figure 7a, the overlying rock fracture was generally “saddle-shaped”, and with the continuous advancement of the working surface, overlying rock fracture continued to develop and expand in the upper strata.
When the working face reached 30 m, the overlying rock on the working face did not collapse. The effect on the cave was small, and there was no change around the cave. When the working face reached 150 m, the old roof broke down and sank with a displacement subsidence of 0.62 m. The roof was violently depressed, and there was a bed separation with a maximum width of 10.3 m, and the left side of the cave was affected by mining. When the working face continued to advance to 210 m, a tensile fissure at the bottom of the cave gradually developed, and the width of the bed separation reached a maximum of 72.3 m with a height of 0.92 m. At this time, the water storage capacity of the bed separation reached a maximum, although its height did not develop upward and it ended in the key stratum of the p2c limestone.
When the working face advanced to 270 m, longitudinal tensile cracks under the cave gradually increased, leading to a separation space; however, the goaf behind the working face was gradually filled and compacted by the upper caving rock, and the width of the separation fracture in the overlying rock shrunk to 68.2 m, although its height reached the maximum value of 3.01 m. When advanced to 300 m (final mining), the bed separation was gradually compacted and closed, the width and height were greatly reduced, the fracture distribution was relatively dense, but the cave still had a certain bearing stability.
As can be seen from the stress changes in Figure 7b, the advance of the working face increased synchronously with the peak stress, and the maximum vertical stress kept moving to the stop-mining line. The maximum stress value near the cutting hole was −0.038 Mpa, and the mining distance between the working face and the cutting hole was 220 m to 280 m, which was just below the cave at this time. Here, the vertical stress rose sharply. The peak stress reached 0.026 Mpa. When the open-off cut distance was 310 m to 400 m, the peak stress of the vertical pressure began to decrease; the activity of the overlying strata gradually attenuated; the overall stability of the key stratum where the cave was located decreased; the penetration degree of the fissure on the right side of the cave increased; the leading vertical stress reached a second peak; and the vertical stress near the area directly below the cave also partially rose.
(2).
Fractal dimension calculation method and dimension features
UDEC numerical simulations of the development process of an overburden fracture were analyzed using MATLAB2018 software to investigate the fractal dimension of a two-dimensional image of the overburden fracture under mining disturbance. First, a fracture evolution map was derived using the UDEC6.0 software. Then a MATLAB program was used to extract a binary graph. Finally, the fractal dimension D of the fracture mesh was calculated using Equation (15). A lattice with side length r was used to cover the overlying rock fracture evolution diagram at different advancing distances, and the lattice number of each fracture was counted. When the value of r was changed, the number of non-blank sub-spaces was counted, and the double logarithm of 1/r and N(r) was taken; the slope of a linear fit to the data yielded the following fractal dimension [6,41]:
D = lim r 0 lg N r lg ( 1 / r )
Using the method described above, Figure 8 shows the fractal calculation of mining-induced overlying rock fractures, and quantitatively describes their evolution pattern. To avoid the impact of pores, image processing software was necessary to fill the cave area. Figure 8a is the original image of the fracture development at a depth of 150 m. After being binarized using a self-designed MATLAB program, the gray scale image seen in Figure 8b of the cave geological conditions was extracted, and the fractal dimensions and correlation coefficients were calculated for different mining distances. Figure 8c shows the linear fit curve when the working face advanced to 120 m, with a fitting degree of 0.9982 and a high degree of self-similarity. According to the changes in the fractal dimension and the development height of separation fractures under different mining distances, Figure 8d suggests that the coal seam overlying rock fractures were divided into three stages:
Stage I: The development of a new fracture indicates that when the working face advances from 30 m to 120 m, the overlying rock keeps collapsing, the vertical fracture is compacting, the fractal dimension gradually decreases from 1.1233 to 1.1025, and the height of the separation fracture keeps increasing. However, due to the collapse of the overlying rock, the development of the new fracture gradually decreases, and the fracture mainly develops in the collapse zone.
Stage II: During the fracture of the sub-critical layer, the working face advances from 120 m to 240 m, and vertical cracks and separation cracks in the overlying roof of the C9 coal seam gradually develop. The shape dimension increases from 1.1640 to 1.1881, and the development of the separation space reaches a maximum. When the working face advances to 150 m, the maximum development height of the bed separation basically remains unchanged. At this time, the vertical distance between the bed separation and the coal seam is 59.31 m, and it ends at the bottom of the p2c limestone.
Stage III: Here, the overall development is stable and the working face advances from 270 m to 300 m. At this time, the fractal dimension changes from 1.1753 to 1.1741, with a small range of change, indicating that the overlying rock mass of the C9 coal seam is caved and compacted, the fracture tends to be stable, and the separation space is gradually compacted.

5. Rock Mechanics Test and the Overlying Strata Measurement

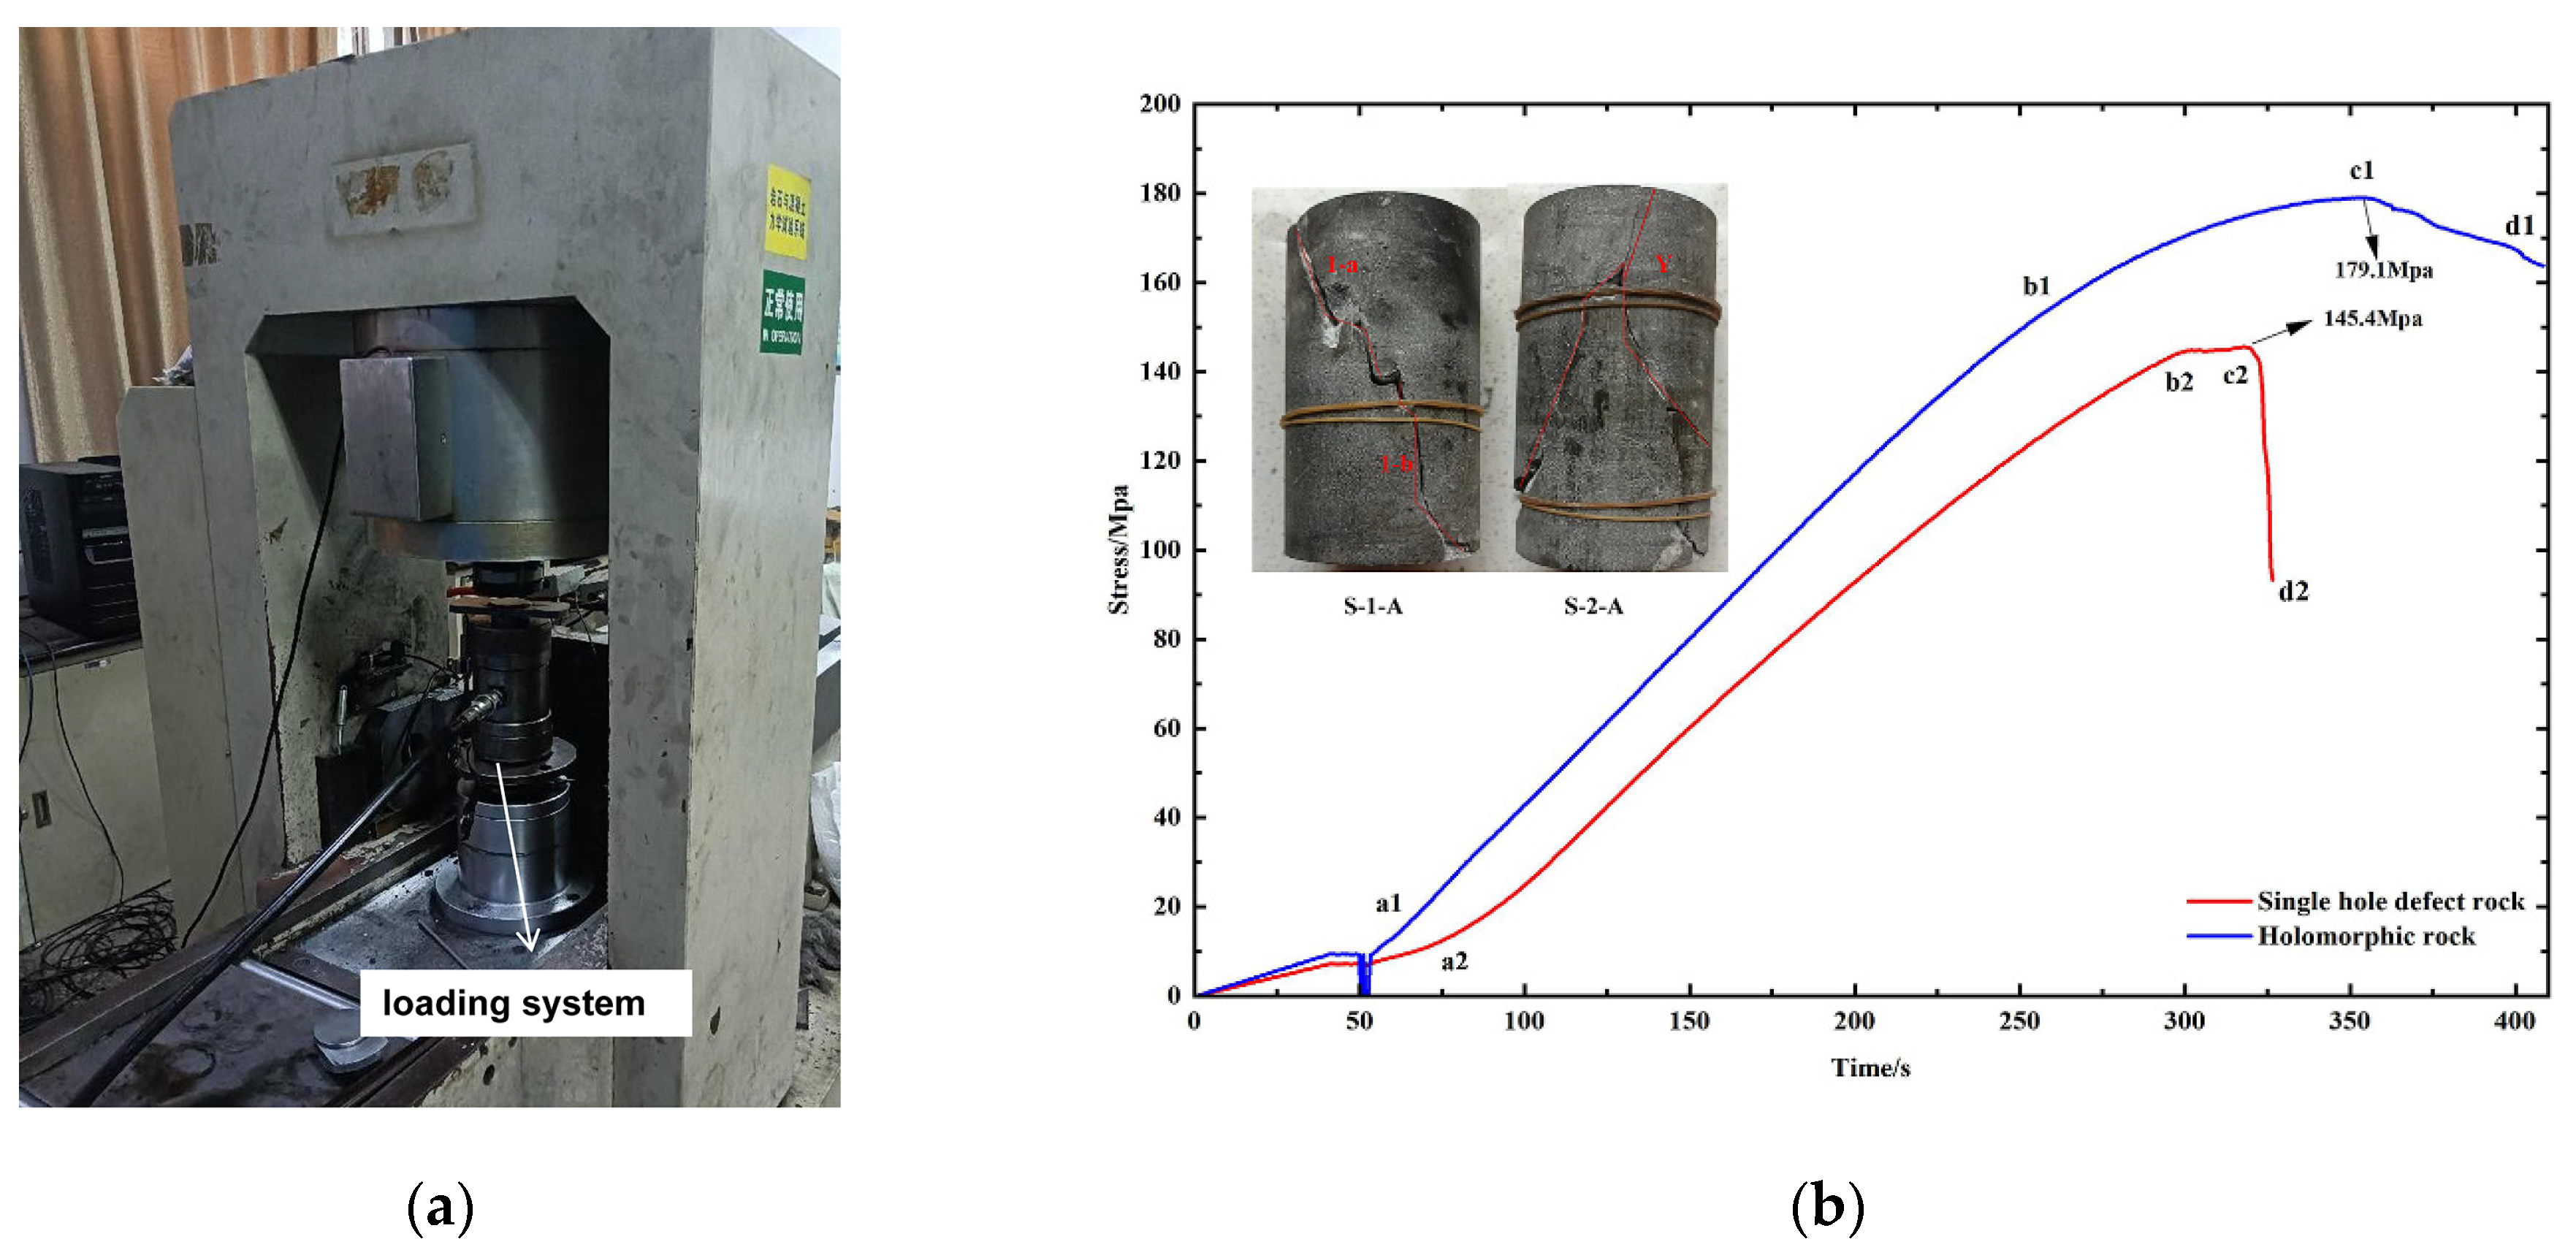
5.1. Rock Mechanics Test

(1).
Preparation of rock samples
To study the failure characteristics of porous rocks, the sample size was polished into a standard cylinder of 50 × 100 mm. The pre-fabricated hole sample was processed using a high-pressure water jet cutting machine [42,43,44], and the size was 10 mm. The size of the limestone sample is shown in Figure 9, and the mechanical parameters are shown in Table 2.
(2).
Test process and results analysis
The rock core for this test was taken from the limestone of the p2c formation drilled near the 10903# working face in the case study mine. A sample was polished to a standard 50 mm × 100 mm cylinder and an RMT150b electro-hydraulic servo testing machine was used for triaxial testing with a confining pressure of 10 Mpa. The grouting material for the rock test hole was cement. The experimental process adopted displacement loading control, with a loading rate of 0.1 mm/min. Before loading, vaseline was applied to both ends of the rock sample to reduce the end friction effect. Figure 10a shows the experimental stress loading system. Figure 10b presents the test results of intact rocks and rocks with pore defects. It can be seen that the peak stress value of rocks with pore defects was 145.4 Mpa, which is significantly lower than the peak strength of intact rocks which was 179.1 Mpa, a decrease of 18.8%. The plastic stages (b1–c1) in rocks with hole defects were significantly shortened and, at the same time, two cracks emerged at the left and right ends around the pores, including an upward crack in 1-a and a downward crack 1-b. The cracks connected with each other, ultimately leading to the failure of the rock sample. The complete rock was mainly subjected to Y-shaped shear failure, and the lower part had poor connectivity. Compared to intact rocks, rocks with pore defects demonstrated greater brittleness and almost no yield effect. In summary, pore defects played a certain weakening role in the mechanical properties of the rock, and upper and lower splitting tensile cracks easily formed around the pores.

5.2. Double-Ended Water Plugging Test

According to the lithological analysis of the drilling near the 10903# working face, we arranged a drilling field in the return-air lane, 15 m in front of the stop-mining line of the working face. Three detection drillings were designed, located at the intersection of the roof and the wall of the roadway. A double-ended water blocking device manufactured by ourselves was used for field observation. The water pressure was kept below 3.5 Mpa during the detection. A flow value was recorded once every 1 m of drill pipe advance. The layout of the field drilling test is shown in Figure 11a,b.
Figure 12 presents a waterfall diagram that summarizes the measured water leakage at both ends of the drilling hole. Taking hole No.3 with the largest hole depth as an example, it can be seen from the figure that the drilling leakage increased sharply in the test section of the hole, which had a vertical depth of 10 m to 14 m. The water leakage ranged from 25.39 L/min to 32.50 L/min, with an average value of 28.37 L/min. The rock formation was seriously damaged. A fracture obviously developed, and this became a caving zone. In 40 m to 56 m, the average value of leakage was 17.84 L/min, and this represented a water-conducting fracture zone.

5.3. Drilling Peeking Method

In order to obtain a more intuitive and accurate position of the “three zones” of the overlying strata during coal seam mining, the drilling peeping method was selected for actual measurement, with mutual verification in the above-mentioned drill hole number. The drilling viewer model used this time was CXK12 (B); Figure 13 shows the TV result of drilling 1#. It can be seen from this image that when the drilling depth was 10 m, the rock was relatively broken, and a large number of through-cracks appeared. From 40 m to 52 m, rock cracks increased, longitudinal cracks appeared and the rock pore walls were rough, mainly mud and debris, indicating that it entered the water conducting fracture zone. The phenomenon of bed separation was observed at 59 m, which is consistent with the numerical simulation results.

6. Evaluation Method of Water Inrush in the Bed Separation Based on the Cloud Model and Improved Fusion Weighting

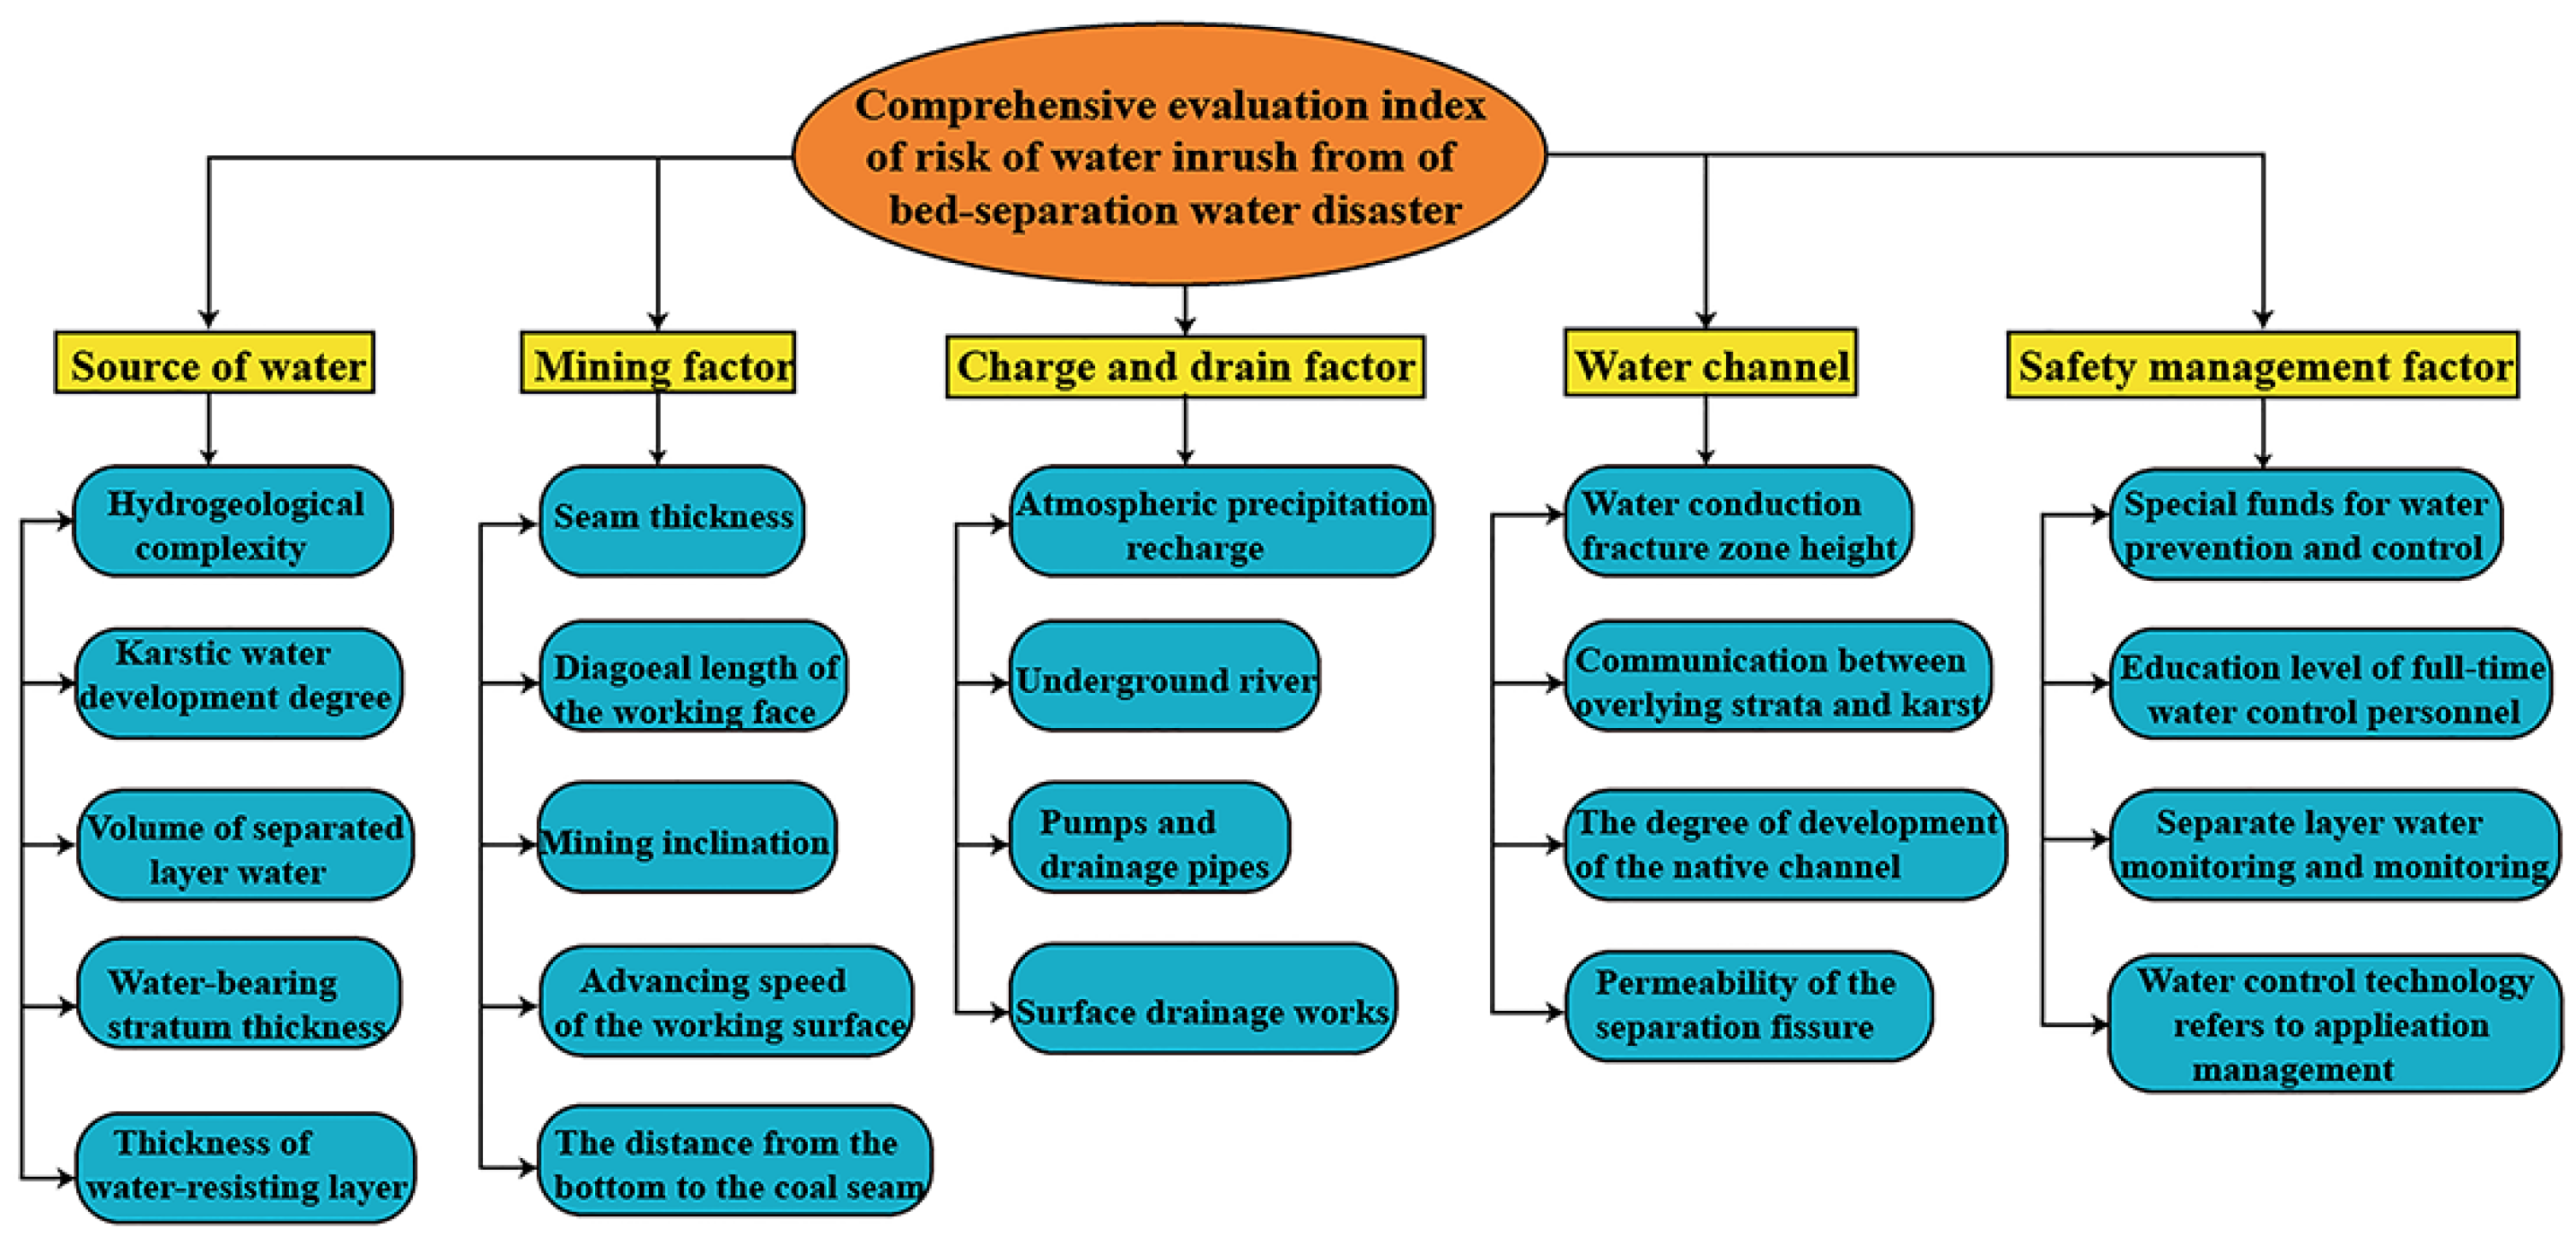
6.1. Construction of a Comprehensive Indicator System for the Risk of Water Inrush from Separated Layers

The occurrence of water inrush from separated layers in karst mining areas is a relatively complex process, and it is difficult to use only one indicator or fixed function to judge the hazard level of danger in the risk assessment for water inrush. In the mining area, the water source is the first type of hazard source, which is determines the mine water inrush energy. The channel is the second type of hazard source, which determines whether water inrush occurs. Five first-level evaluation indicators were selected: the water source; the mining factor; the charging and draining factor; the water channel; and the safety management factor. Based on the geological data of the mining area and the actual work of water prevention and control [25], 22 secondary indicators were identified. A risk assessment system of water inrush due to bed separation was then constructed, as shown in Figure 14.

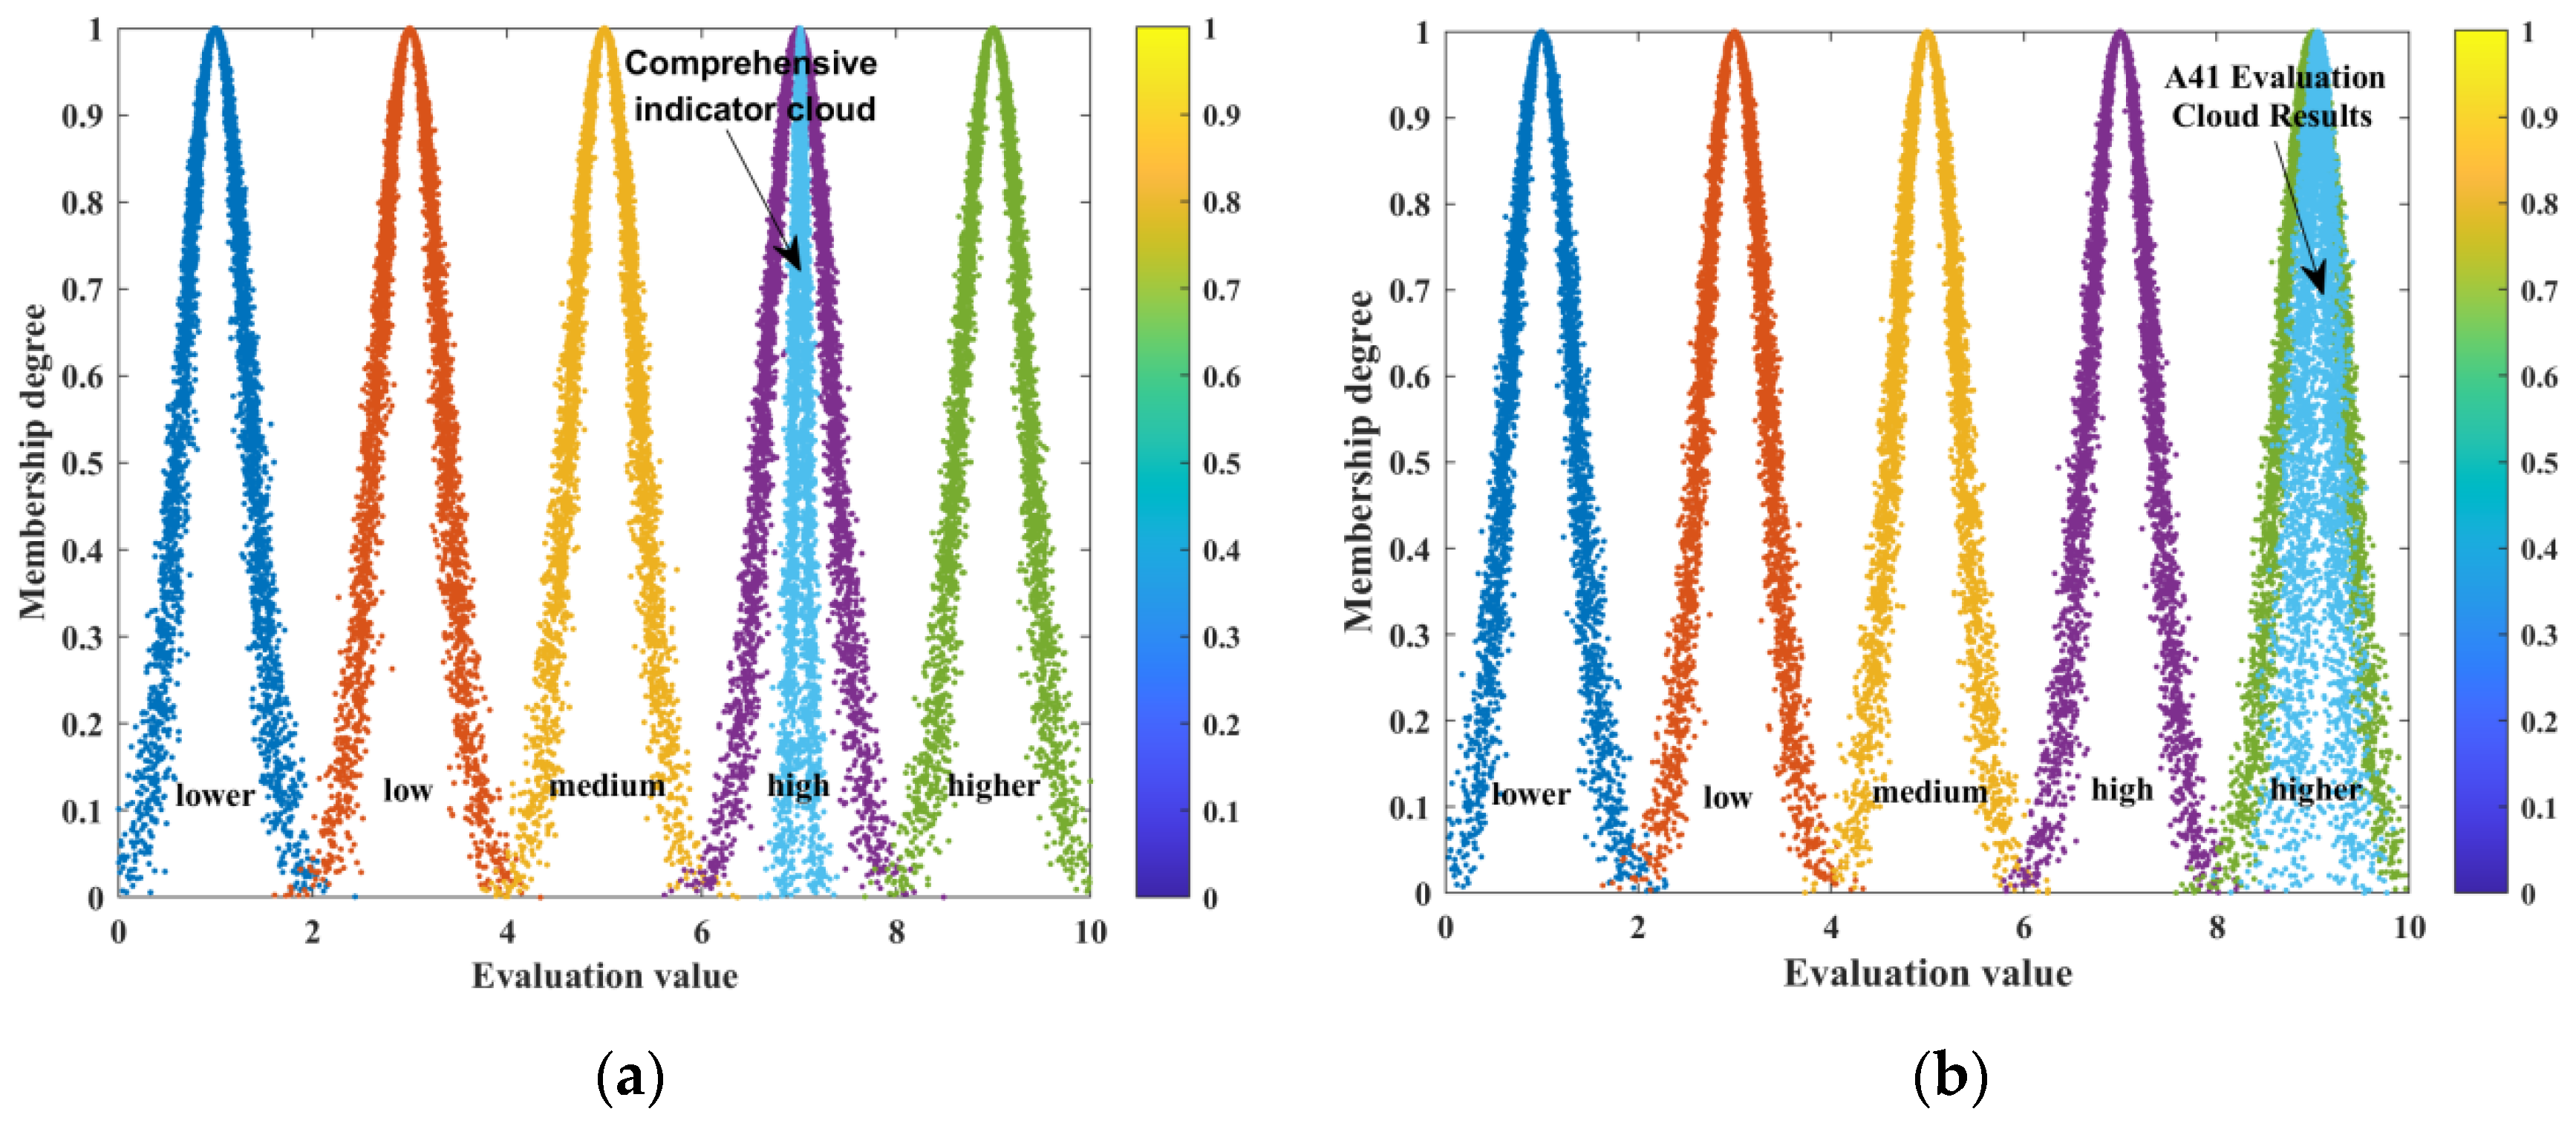
6.2. Risk Assessment of Water Inrush in the Bed Separation Based on Cloud Model

The cloud model [45] is a quantitative evaluation model that describes the correlation between fuzziness and randomness of evaluation objects. The overall characteristics of water inrush in the bed separation can be qualitatively represented by cloud digital features, where X represents the number of cloud droplets, Ex represents the peak expectation that reflects the position of the cloud’s center of gravity, En represents entropy that reflects the degree of dispersion of cloud droplets, and He represents an uncertainty measure of entropy. This model can be used to quantitatively evaluate the risk of water inrush from separated layers in this mining area.
(1).
The risk assessment set for water inrush in the cloud model
The risk assessment set for water inrush in the bed separation is represented as V = {lower, low, medium, high, higher}. The standard evaluation level classification and characteristic parameters can be calculated based on Formulas (16)–(18), as shown in Table 3.
E x = 1 n i = 1 n X i
E n = π 2 1 n i = 1 n | X i E x |
H e = S 2 E n 2
(2).
Improving the determination of indicator weights in the weighted fusion method
Choosing appropriate methods to determine the weights of various indicators for water inrush in the separated layers is an important way to improve the accuracy of evaluation results The analytic hierarchy process (AHP) and entropy weighting are common methods for determining subjective and objective weights [23,24]. In order to make the calculation of each indicator more reasonable and accurate, and to compensate for the shortcomings of a single weighting method, an improved weighted fusion method is proposed. The specific calculation steps are as follows:
  • a.
    Improving the Analytic Hierarchy Process to determine subjective weights
Ten experts from the China University of Mining and Technology (Beijing), Chongqing University, Henan Polytechnic University, Chongqing Coal Research Institute, Shandong University of Science and Technology, Southwest Mining Co., Ltd., and other industrial mining companies were invited to score the indicators, in order to achieve a comprehensive evaluation for the risk of water inrush from bed separation and use a normal distribution to correct the weights of the experts’ scores with significant differences [46]. The final subjective weight W1 (j) was obtained, where j is the weight of each indicator.
  • b.
    Improving the entropy weight method to determine objective weights
The size of an entropy value can reflect the degree of dispersion of the evaluation indicators. The larger the entropy value, the smaller the degree of dispersion and weight of evaluation indicators. By introducing the revised weights to address the issue of excessive amplification of indicator weights [47], the objective weight W2 (j) was obtained through objective coefficient correction of the evaluation indicators for the separated water in northern Guizhou.
  • c.
    To make the results more accurate, the weights W1 (j) and W2 (j) obtained by the analytic hierarchy process (AHP) and the entropy weight method should be as close as possible. Using Equation (19), Lagrangian multiplication for optimization, the weight W (j) is recalculated to obtain the weights of each secondary indicator and cloud feature parameter, as shown in Table 4.
    W j = W 1 j W 2 j 0.5 j = 1 n W 1 j W 2 j 0.5
It can be seen that the maximum En value in the secondary indicator is 0.2156 and the maximum He value is 0.1482, both of which are low values. Therefore, the evaluation results are stable and reliable. By calculating the weights of the above secondary indicators and using Formula (20) to calculate the comprehensive cloud digital characteristics (Ex, En, He) of water inrush in the separation layer, the results are (7.0151,0.0622,0.0307), and the final quantitative evaluation is carried out. The evaluation results are shown in the comprehensive indicators and some secondary indicator cloud maps in Figure 15. In Figure 15a, the final danger level is determined to be “high”. In the secondary indicators of Figure 15b, the evaluation level of the development height of the water conducting fracture zone is “higher”, which corresponds to the actual situation of water inrush in the northern Guizhou coalfield.
E x = W 1 E x , 1 + W 2 E x , 2 + + W i E x , i E n = W 1 2 E n , 1 2 + W 2 2 E n , 2 2 + + W i 2 E n , i 2 H e = W 1 2 H e , 1 2 + W 2 2 H e , 2 2 + + W i 2 H n , i 2

7. Conclusions

In order to study the development mechanism of formation and the evaluation of bed separation water inrush under a karst cave landform, theoretical analysis, numerical simulation, and on-site engineering tests were performed. The following conclusions are drawn:
(1) An expression and discrimination method for bed separation during coal seam mining under a karst cave landform were derived, and the development location of the bed separation was predicted. In the case study mine, the bed separation developed below the key stratum of the p2c limestone formation.
(2) Based on fractal theory, numerical simulation, and fractal dimension theory, three stages of overlying rock fracture development were identified, namely a new crack development stage, a roof collapse stage, and an overall stable crack compaction stage. The maximum height of the bed separation was 3.01 m, and it underwent processes such as development, expansion, and compaction. The peak stress below the cave increased significantly, and tensile cracks appeared.
(3) Through on-site and laboratory tests, it was found that upward and downward cracks appeared around the defective limestone pores in the p2c formation. The pores and cracks were interconnected and destroyed, which provided a favorable channel for later separation and conduction. Defective porous rocks demonstrated a weakening effect on their mechanical properties. The heights of the caving zone and the water-conducting fracture zone during the on-site testing of double-ended water blocking and drilling imaging were 10–14 m and 40–56 m, respectively. The phenomenon of bed separation was observed at 59 m, and the on-site results were consistent with theoretical and numerical simulation results.
(4) Based on a cloud model and an improved weighted fusion method, 5 primary indicators (source of water, mining factors, filling and drainage factors, water diversion channels, and safety management factors) as well as 22 secondary indicators were constructed to evaluate the risk of water inrush in the karst cave landform of the northern Guizhou coalfield. This improved the calculation accuracy of indicator weights and effectiveness of the evaluation results, and achieved quantitative evaluation of water inrush in the bed separation.
Due to the complexity and diversity of the rock structure in karst areas, the position and movement pattern of the separation layer development varied among different structures of the strata. However, after mining, the overall overlying rock is controlled by the “key stratum” geological structure, and the position of the separation layer development is dynamic and develops between the hard and soft rock layers below the key stratum. The tensile cracks around the karst cave have a certain conduction effect on the space of the separation layer. The evaluation of bed separation water inrush is also the result of multiple common factors, and the indicator system in karst areas based on the cloud model and improved weighting method has certain stability and feasibility. Therefore, the next research focus is on the formation mechanism of bed separation under different forms of karst caves and the reasonable construction of indicator systems for different coal mines.

Author Contributions

Writing—original draft preparation, Z.G.; project administration, G.X.; resources, H.L.; data curation, D.S.; methodology, Y.L. All authors have read and agreed to the published version of the manuscript.

Funding

This research was funded by the Youth Science and Technology Talent Growth Project of the Education Department of Guizhou Province (Grant No. 2022QJHKYZ124), the Natural Scientific Research Project of Guizhou Provincial Department of Education (Q,J,H.KYZ [2015]340), and the Bijie City Science and Technology Research Project (Grant No. 2023BKH56).

Data Availability Statement

Data are contained within the article.

Acknowledgments

The authors would like to gratefully acknowledge the support of the Youth Science and Technology Talent Growth Project of Education Department of Guizhou Province (Grant No. 2022QJHKYZ124), the Natural Scientific Research Project of Guizhou Provincial Department of Education (Q,J,H.KYZ [2015]340), and the Bijie City Science and Technology Research Project (Grant No. 2023BKH56).

Conflicts of Interest

The authors declare no conflict of interest.

References

  1. Wu, Q.; Zhao, S.Q.; Sun, W.J. Classification of the hydrogeological type of coal mine and analysis of its characteristics in China. J. China Coal Soc. 2013, 38, 902–905. [Google Scholar]
  2. Cao, X.F.; Li, H.L. Typical Zone Division of Karst Development in China. Adv. Geosci. 2018, 8, 845–851. [Google Scholar] [CrossRef]
  3. Favara, R.; Cangemi, M.; Grassa, F. Chemical and isotopic signature of groundwater in the Santa Ninfa karst system and possible inferences on neotectonics. Ann. Geophys. 2020, 62, 1–13. [Google Scholar] [CrossRef]
  4. Ivanik, O.; Shevchuk, V.; Kravchenko, D. Geological and Geomorphological Factors of Natural Hazards in Ukrainian Carpathians. J. Ecol. Eng. 2019, 20, 177–186. [Google Scholar] [CrossRef] [PubMed]
  5. Batugin, A.; Batugin, A.S. Reactivation of major faults during strong rock bursts as realization of tectonic process. In Proceedings of the 14th ISRM Congress, Foz do Iguaçu, Brazil, 13–18 September 2019. Paper Presented at the Rock Mechanics for Natural Resources and Infrastructure. [Google Scholar]
  6. Gou, R.; Jiang, C.; Liu, Y.; Wang, C.; Li, Y. Study on Fractal Characteristics of Evolution of Mining-Induced Fissures in Karst Landform. Energies 2022, 15, 5372. [Google Scholar] [CrossRef]
  7. Luo, X.Y. Study on Mechanism and Application of Water Damage Caused by Roof Separation in Longfeng District, Guizhou Province. Master’s Thesis, Guizhou University, Guiyang, China, 2023; pp. 1–85. [Google Scholar]
  8. Palarski, J. The experimental and practical results of applying backfill. In Innovations in Mining Backfill Technology, Proceedings of the 4th International Symposium on Mining with Backfill Montreal, 2–5 October 1989, Montreal, QC, USA; CRC Press: Boca Raton, FL, USA, 1989. [Google Scholar]
  9. Lv, Q.; Li, X.; Li, W. Risk Evaluation of Bed-Separation Water Inrush: A Case Study in the Yangliu Coal Mine, China. Mine Water Environ. 2018, 37, 288–299. [Google Scholar]
  10. Lv, Y.G.; Qiao, W. Discussion on overburden zoning model after mining and its engineering significance. Coal Geol. Explor. 2021, 49, 147–155. [Google Scholar]
  11. Fei, G.; Yun, S.; Mine, L.C. Water inrush from overburden strata separation reservoir and the countermeasures in lijialou coal mine. J. North China Inst. Sci. Technol. 2017, 14, 12–16. [Google Scholar]
  12. Qiao, W.; Li, W.P.; Wang, Z.W. Formation mechanism, disaster-causing mechanism and prevention technology of roof bed separation water disaster in coal mines. J. China Coal Soc. 2021, 46, 507–522. [Google Scholar]
  13. Cheng, X.G.; Qiao, W.; Li, G.F. Risk assessment of roof water disaster due to multi-seam mining at Wulunshan Coal Mine in China. Arab. J. Geosci. 2021, 14, 1116. [Google Scholar] [CrossRef]
  14. Qiao, W.; Liu, M.N.; Li, L.G. Disaster mechanism induced by structure evolution of “water-inrushing separation zone” of mining rock mass and prediction method of water inrush from separation layer. J. China Coal Soc. 2023, 48, 818–832. [Google Scholar]
  15. Xu, J.P.; Zhou, Y.; Pu, Z.H. Calculation method of separated water accumulation in the process of separated water inrush and its forecast: Taking the water inrush at 1304 working face of Zhaoxian Coal Mine in Shaanxi Province as an example. J. China Coal Soc. 2022, 47, 3084–3090. [Google Scholar]
  16. Cao, H.D. Study on Disaster Mechanism and Prevention and Control Technology of Overlying Strata Separation Water Body in Coal Seam Mining. Ph.D. Thesis, Graduate School of Coal Science Research Institute, Beijing, China, 2018. [Google Scholar]
  17. Fan, K.; Li, W.; Wang, Q. Formation mechanism and prediction method of water inrush from separated layers within coal seam mining: A case study in the Shilawusu mining area, China. Eng. Fail. Anal. 2019, 10, 158–172. [Google Scholar] [CrossRef]
  18. Xu, J.; Zhu, W.; Xu, J. High-intensity longwall mining-induced ground subsidence in Shendong coalfield, China. Int. J. Rock Mech. Min. Sci. 2021, 14, 104730. [Google Scholar] [CrossRef]
  19. Xu, G.S.; Luo, X.K.; Su, D.G.; Li, H.G. Research on Mechanism of Water Inrush from Separated Layers under Thick Limestone in Northern Guizhou Coalfield. Coal Technol. 2021, 40, 80–83. [Google Scholar]
  20. Gui, H.R.; Lin, M.; Song, X. Identification and application of roof bed separation (water) in coal mines. Mine Water Environ. 2018, 37, 376–384. [Google Scholar] [CrossRef]
  21. Zhao, X.Y.; Li, X.Y.; Yang, K.; Wei, Z. The spatiotemporal characteristics of coupling effect between roof and backfill body in dense backfill mining. Geofluids 2021, 2021, 6684237. [Google Scholar] [CrossRef]
  22. Wu, Q.; Xu, K.; Zhang, W. Further research on “three maps-two predictions” method for prediction on coal seam roof water-bursting risk. J. China Coal Soc. 2016, 41, 1341–1347. [Google Scholar]
  23. Xiao, L.L.; Li, F.; Niu, C.; Dai, G.L.; Qiao, Q.; Lin, C.S. Evaluation of Water Inrush Hazard in Coal Seam Roof Based on the AHP-CRITIC Composite Weighted Method. Energies 2022, 14, 114. [Google Scholar] [CrossRef]
  24. Liu, W.T.; Zheng, Q.S.; Pang, L.F.; Dou, W.M.; Meng, X.X. Study of roof water inrush forecasting based on EM-FAHP two-factor model. Math. Biosci. Eng. 2021, 18, 4987–5005. [Google Scholar] [CrossRef]
  25. Li, B.; Wei, T.; Liu, Z.J. Construction of evaluation index system for water abundance of karst aquifers and risk assessment of water inrush on coal seam roof in Southwest of China. J. China Coal Soc. 2022, 47, 152–159. [Google Scholar]
  26. Li, J.G. Evaluation of water-richness in weathering bedrock aquifer of roof. Coal Technol. 2019, 38, 105–107. [Google Scholar]
  27. Li, M.; Wang, H.T.; Wang, D. Risk assessment of gas explosion in coal mines based on fuzzy AHP and bayesian network. Process Saf. Environ. Prot. 2020, 135, 207–218. [Google Scholar] [CrossRef]
  28. Liu, J.; Yang, B.; Yuan, S.; Li, L.; Duan, L. A Fuzzy Analytic Hierarchy Process Model to Assess the Risk of Disaster Reduction Due to Grouting in Coal Mining. J. Math. 2020, 13, 227. [Google Scholar] [CrossRef]
  29. Wang, X.X. Risk assessment of long-span tunnel based on AHP and expert scoring method. Mod. Tunn. Technol. 2020, 57 (Suppl. S1), 233–240. [Google Scholar]
  30. Zhang, K. Study on the Risk Assessment of Water and Sand Inrush in Thick Unconsolidated Strata Based on Combined Objective Weighting Method. Master’s Thesis, Shandong University of Science and Technology, Qingdao, China, 2018; pp. 1–128. [Google Scholar]
  31. Ruo, X.H. The evaluation of groundwater environmental quality in bozhou based on fuzzy mathematics comprehensive evaluation. Ground Water 2018, 40, 27–30. [Google Scholar]
  32. Zhang, Y.Q.; He, N.; Li, Y.J. Risk Assessment of Water Environment Treatment PPP Projects Based on a Cloud Model. Discret. Dyn. Nat. Soc. 2021, 2021, 1–15. [Google Scholar] [CrossRef]
  33. Xie, X.; Zhang, J.Y.; Lian, Y.P. Cloud model combined with multiple weighting methods to evaluate hydrological alteration and its contributing factors. J. Hydrol. 2022, 610, 127794. [Google Scholar] [CrossRef]
  34. Zhao, Z.M.; Ma, D.; Wang, P.Y. Study on Safety Risk Assessment of Hazardous Materials Transportation Enterprises Based on Combined Weighting and Cloud Model. Saf. Secur. 2023, 44, 23–29. [Google Scholar]
  35. Hu, B.; Li, X.J.; Dai, F.R. Dangerous rock mass risk assessment based on combination weighting and cloud model. Yangtze River. 2023, 54, 145–150. [Google Scholar]
  36. Wang, X.; Wu, W.; Wu, B. Grouting of bed separation spaces to control sliding of the high-located main key stratum during longwall mining. Q. J. Eng. Geol. Hydro-Geol. 2020, 53, 569–578. [Google Scholar] [CrossRef]
  37. Ma, H.W. Spatiotemporal Evolution of Bed Separation due to Mining and the Dynamic Hazards Identification for Groundwater Inrush. China Univ. Min. Technol. 2020, 3, 1–165. [Google Scholar]
  38. Ji, J.S.; Li, Z.H.; Yang, K.; Zhou, G.H.; Ma, G.J. Research on Formation Mechanism and Evolution Pattern of Bed Separation Zone during Repeated Mining in Multiple Coal Seams. Geofluids 2022, 2022, 4290063. [Google Scholar] [CrossRef]
  39. Zhou, Z. Study on the development law of mining fracture and karst surface collapse when mining in karst area. Hunan Univ. Sci. Technol. 2017, 7, 1–141. [Google Scholar]
  40. Xu, J.L.; Qian, M.G.; Jin, H.W. Study and application of bed separation distribution and development in the process of strata movement. Chin. J. Geotech. Eng. 2004, 2004, 632–636. [Google Scholar]
  41. Chen, Y.G.; Qian, M.G. Control of Surrounding Rocks in Coal Mines in China. China Univ. Min. Technol. Press 1994, 5, 23–54. [Google Scholar]
  42. Zhao, Y.; Wang, C.; Ning, L.; Zhao, H.; Bi, J. Pore and fracture development in coal under stress conditions based on nuclear magnetic resonance and fractal theory. Fuel J. Fuel Sci. 2022, 309, 58–73. [Google Scholar] [CrossRef]
  43. Sun, F.; Pan, R.; Zhu, X.Y.; Chen, T.L. Meso-mechanical simulation of fracture grouting under fluid-solid coupling environment and engineering applications. Appl. Mech. Mater. 2014, 477–478, 485–491. [Google Scholar] [CrossRef]
  44. Wang, C.; Zhou, B.; Li, C.; Cao, C.; Sui, Q.; Zhao, G. Experimental investigation on the spatio-temporal-energy evolution pattern of limestone fracture using acoustic emission monitoring. J. Appl. Geophys. 2022, 206, 28–34. [Google Scholar] [CrossRef]
  45. Li, D.Y.; Du, Y. Artificial Intelligence with Uncertainty. J. Softw. 2004, 15, 1583–1594. [Google Scholar]
  46. Huang, S.; Chen, Y.; Feng, X.; Qiao, T.; Yu, D.; Yang, Y. Research on dynamic assessment method of earthquake scene rescue performance based on AHP and cloud model. Mathematics 2022, 10, 207. [Google Scholar] [CrossRef]
  47. He, Q.Y.; He, Z.Y.; Zhang, W.Y. Evaluation strategy for the operation quality of smart meters based on improved fuzzy analytic hierarchy process. Electr. Meas. Instrum. 2022, 52, 1–11. [Google Scholar]
Figure 1. Location of mining area.
Processes 11 03413 g001
Figure 2. Karst cave landform.
Processes 11 03413 g002
Figure 3. Spatial model of bed separation based on a circular karst cave. (a) Thin plate model; (b) model of bed separation.
Processes 11 03413 g003
Figure 4. Mechanical model of the thin plate developed by periodic bed separation of a circular karst cave under a uniformly distributed load. (a) Deflection of bed separation; (b) stress situation of a circular cave.
Processes 11 03413 g004
Figure 5. Schematic diagram of the UDEC numerical model of the 10903# working face of the case study coal mine.
Processes 11 03413 g005
Figure 6. Evolution pattern of the bed separation and cave at different advance distances.
Processes 11 03413 g006
Figure 7. Vertical stress and displacement change curves at different advance distances. (a) Vertical displacement change curve; (b) vertical stress change curve.
Processes 11 03413 g007
Figure 8. Fractal calculation of mining overburden fracture. (a) Original fissure diagram; (b) binarized processing diagram; (c) diagram of fractal dimension fitting when advancing to 150 m; (d) height of transverse crack and fractal dimension characteristics.
Processes 11 03413 g008
Figure 9. Rock sample size. (a) Holomorphic rock; (b) single-hole defect rock.
Processes 11 03413 g009
Figure 10. Holomorphic and hole defect type p2c limestone formation stress test. (a) Rock loading system; (b) stress test and rock failure results.
Processes 11 03413 g010
Figure 11. Layout of field drilling test. (a) Drilling layout; (b) field measurement of double-ended water plugging.
Processes 11 03413 g011
Figure 12. Waterfall diagram of measured water leakage at both ends of drilling.
Processes 11 03413 g012
Figure 13. 1# drilling inspection results.
Processes 11 03413 g013
Figure 14. Comprehensive evaluation indicators for the risk of water inrush from bed separation in the northern Guizhou coalfield.
Processes 11 03413 g014
Figure 15. Cloud chart of comprehensive indicators and some secondary indicators. (a) Standard cloud and comprehensive cloud; (b) A41 water-conducting fracture zone height evaluation cloud.
Processes 11 03413 g015
Table 1. Physical and mechanical parameters used in the UDEC numerical model describing the coal strata in the case study coal mine.
No.LithologyTotal Thickness
(m)
Thickness
(m)
Bulk Density
(KN/m3)
Elastic Modulus
(Gpa)
Tensile Strength
(Mpa)
Remarks
13Mudstone120.9716.0921131.5
12Limestone104.8836.9327203.2KS3
11Marlstone67.952.3624.6172.4
10Siltstone65.593.525.5224
9Clayey siltstone62.0910.224.5203.4
8Claystone51.896.4824.1182.6
7Marlstone45.411.1424.6172.4
6Claystone44.2718.3124.1182.6KS2
5C5 coal25.961.8718101
4Siltstone24.0913.0925.5224KS1
3C9 coal112.518101
2Siltstone8.647.625.5224
1Lime mudstone1.041.0424151.8
Table 2. Size and mechanical parameters of p2c limestone sample.
Sample NumberH/mmD/mmσ1/Mpaσ3/MpaNotes
S-1-A99.6949.90179.110.01Holomorphic rock
S-1-B100.1650.04172.310.01
S-1-C100.7749.71158.510.00
S-2-A100.3150.10145.410.00Single-hole defect rock
S-2-B99.7849.96141.210.00
S-2-C100.1750.08126.410.00
Table 3. Evaluation level classification and characteristic parameters.
Risk Assessment CriteriaLowerLowIntermediateHighHigher
Rank division[0,2)[2,4)[4,6)[6,8)[8,10)
Ex1.03.05.07.09.0
En0.3330.3330.3330.3330.333
He0.050.050.050.050.05
Table 4. Evaluation weights and cloud feature parameters.
Evaluation IndexSubjective Weight W1Objective Weight W2Combined Weight WIndex Cloud Parameter (Ex, En, He)
A11 Hydrogeological complexity0.13100.23820.1921(6.83, 0.1629, 0.0446)
A12 Karst water development degree0.08010.22930.1474(5.60, 0.1504, 0.0792)
A13 Volume of separated water layer0.44220.15750.2870(8.96, 0.1454, 0.0773)
A14 Water-bearing stratum thickness0.05690.16540.1055(5.02, 0.2156, 0.1482)
A15 Thickness of water-resisting layer0.28980.20970.2681(7.91, 0.1354, 0.0518)
A21 Seam thickness0.29650.24070.2881(6.10, 0.1504, 0.0199)
A22 Diagonal length of the working face0.08020.22360.1444(5.00, 0.0752, 0.0739)
A23 Mining inclination0.05200.17590.1031(2.10, 0.1253, 0.0487)
A24 Advancing speed of the working surface0.14840.20440.1878(5.98, 0.0852, 0.0583)
A25 The distance from bottom to coal seam0.42290.15550.2765(8.17, 0.1880, 0.0796)
A31 Atmospheric precipitation recharge0.07510.24040.1407(4.17, 0.0953, 0.0085)
A32 Underground river0.44720.23560.3399(7.01, 0.0953, 0.0725)
A33 Pumps and drainage pipes0.31980.28350.3153(7.07, 0.1053, 0.0118)
A34 Surface drainage works0.15790.24040.2040(5.11, 0.1930, 0.0264)
A41 Water conduction fracture zone height0.51810.19110.3379(9.05, 0.1504, 0.0826)
A42 Communication between overlying strata and karst0.24150.29370.2860(6.02, 0.0652, 0.0444)
A43 The degree of development of the native channel0.08600.23490.1526(4.95, 0.0752, 0.0256)
A44 Permeability of the separation fissure0.15440.28020.2234(7.97, 0.0602, 0.0306)
A51 Special funds for water prevention and control0.44860.23900.3404(8.00, 0.0251, 0.0399)
A52 Education level of full-time water control personnel0.08990.24330.1538(4.99, 0.0953, 0.0985)
A53 Separated layer water monitoring and monitoring0.28110.26780.2852(6.06, 0.1203, 0.0390)
A54 Water control technology refers to application0.18030.24980.2206(6.09, 0.1579, 0.0414)
Disclaimer/Publisher’s Note: The statements, opinions and data contained in all publications are solely those of the individual author(s) and contributor(s) and not of MDPI and/or the editor(s). MDPI and/or the editor(s) disclaim responsibility for any injury to people or property resulting from any ideas, methods, instructions or products referred to in the content.

