Abstract
The thermal recovery method of steam flooding is one of the most common development methods for heavy oil reservoirs. However, after multiple rounds of steam injection development, the composition of crude oil and reservoir rock properties have changed greatly, which is unfavorable for the subsequent enhanced oil recovery. It is necessary to study the distribution of the remaining oil after the thermal recovery of heavy oil reservoirs, and clarify the change characteristics of the components of the crude oil under different steam injection conditions. At the same time, the change of porosity and the permeability of the rocks after steam flooding, and its influence on oil recovery, are investigated. In this paper, the composition changes of heavy oil before and after steam flooding are studied through experiments and numerical simulation methods. A numerical model is established to study the retention characteristics of heavy components in heavy oil reservoirs by the CMG software. The effects of different steam injection conditions, and heavy oil with different components on the residual retention of heavy components, are compared and studied. The changes of rock physical properties in heavy oil reservoirs after steam flooding is clarified. The results show that after steam flooding, the heavy components (resin and asphaltenes) of the recovered oil decrease, and the heavy components in the formation increase in varying degrees. With the increase of heavy components in the crude oil, the remaining oil in the formation increases after steam flooding, and the retention of heavy components increases; after steam flooding, the stronger the rock cementation strength, the higher the degree of reserve recovery, and it is difficult to form breakthrough channels; the greater the steam injection intensity, the earlier to see steam breakthrough in the production well, and the lower the degree of reserve recovery. The research reveals the changes of heavy oil components and rock properties after steam flooding, providing support for the subsequent enhanced oil recovery.
1. Introduction
The thermal oil recovery method is widely used in many heavy oil fields in the world. It is generally believed that the role of steam in the process of thermal oil recovery is to reduce the viscosity of heated heavy oil [1,2,3,4]. In the process of steam injection, heavy oil will not only undergo physical changes under the combined action of water and heat, but also may be accompanied by chemical reactions, such as hydrothermal pyrolysis. However, after long-term thermal injection development, the properties of unconsolidated sandstone heavy oil reservoirs, such as porosity and permeability, have changed greatly. Due to the increase of porosity and permeability, it is easy to form a high-permeability zone and an ultra-high-permeability zone, which is called the breakthrough channel. When the steam flows through the breakthrough channel in the formation, which makes the thermal efficiency of steam low, the heat spreads to a small range. The steam forms an inefficient or ineffective circulation along the breakthrough channel, which seriously affects the oil displacement efficiency of the steam and makes the distribution of the remaining oil in the reservoir vary significantly.
In response to the physicochemical changes during the thermal recovery of heavy oil, Hyne et al. [5] called all chemical changes that occur when oil sands are heated in the presence of water, as an aquathermolysis reaction. The aquathermolysis reaction of heavy oil [6] was first reported in Canada, which was mainly used to describe the lightening of asphaltenes. Cao et al. [7] experimentally studied the composition changes of Liaohe super-heavy oil before and after the aquathermolysis reaction (280 °C, 24 h). After the aquathermolysis reaction, the content of aromatics (the sum of light aromatic, medium aromatic and heavy aromatic), saturates and asphaltenes in super-heavy oil increased, while the content of resins decreased, and the resins had the tendency to transform into aromatics and asphaltenes. Wang [8] found that the composition changes of crude oil during thermal recovery mainly showed an increase of heavy hydrocarbons and a decrease of light hydrocarbons, and paraffin and asphaltene precipitated in large quantities, causing serious blockage of oil wells. Khormali et al. [9,10] studied the influencing factors of asphaltene precipitation and its effect on the permeability of carbonate core samples. The above existing studies found that the changes of crude oil properties in the formation after steam flooding in heavy oil reservoirs are still very complicated. Not only the aquathermolysis reaction should be considered, but also the influence of light components flowing underground and being recovered by steam extraction on the composition and viscosity of heavy oil.
Many researches have been conducted on rock property (mainly permeability) changes during the thermal recovery of heavy oil. As early as the 1970s, a method was proposed for predicting breakthrough flow in a five-spot pattern by using the flow characteristics of tracer. Abbaszadeh and Brigham [11] used well-to-well tracer data to interpret the heterogeneity of reservoirs, and the prediction and description of the high permeability zone between wells in oil fields have progressed toward quantitative direction. Ge [12] thought that the breakthrough of the injected fluid is caused by the high permeability zone, and the degree of breakthrough was determined by the pressure field of the fluid and the flow resistance of the fluid.
Later researchers have carried out a large number of studies on large pore sealing and blocking agent. However, it is necessary to further explore the formation mechanism, identification, description and performance characteristics of the breakthrough channel in the oil reservoir, so as to have a deeper understanding of the breakthrough channel. Chen [13] argued that due to the change of cementation capacity of the unconsolidated sandstone, the dragging effect of the viscous crude oil and the long-term scouring of the injected fluid, the problem of sand production in formation occurred and a large pore-like high permeability zone was formed. Zhao [14] discussed the tracer method to describe and identify the large pores, and qualitatively judge whether there is a high permeability zone in the formation and quantitatively calculate the relevant reservoir parameters. Zeng et al. [15,16] considered that different sedimentary characteristics, reservoir physical properties, the development process and other factors will affect the formation of breakthrough channel. A fluid-solid coupling mathematical model for the formation of large pores was established; the large pores in formation were identified and described by using conventional dynamic data and gray correlation theory; and the formation of large pores and the sand production were combined to study the changes of formation characteristics.
Researchers have carried out a lot of work to study the changes of reservoir physical properties in the process of the water flooding development of oil fields, which provides a powerful basis for the formation mechanism of breakthrough channel during heavy oil thermal recovery. Guo et al. [17] studied the swelling, dispersion and migration of clay by microscopic seepage experiments, which paved the way for the study of the formation mechanism of breakthrough channel. Few studies have been conducted on the breakthrough channel and steam breakthrough formed by the thermal recovery of heavy oil reservoirs, but it has certain similarity and reference with the formation of the breakthrough channel after water injection development.
The change of fluid and rock physical properties of the heavy oil reservoir after steam flooding, affects the ultimate recovery of heavy oil to a certain extent. Therefore, this paper studies the change characteristics of fluid and rock physical properties after the steam flooding of the heavy oil reservoir. The residual retention properties of heavy oil with different compositions in porous media are studied by physical simulation experiments. After steam flooding, the physical properties of the heavy oil reservoir will have certain changes. According to the mechanism of physical property change, the residual retention model of the heavy component and the mechanism model of changes in physical property of rock are established by the numerical simulation method. Specifically, they include: (1) prepare the heavy oil with the same viscosity and different components, and study the composition change of the heavy oil before and after steam flooding; (2) establish the residual retention model of heavy components in heavy oil thermal recovery by the CMG software, and study the residual retention characteristics of heavy components after steam flooding; (3) the effects of different steam injection parameters on the residual retention of heavy components are compared and studied; and (4) the change characteristics of rock physical properties in the heavy oil reservoir after steam flooding are investigated. The mechanism model is established by the numerical simulation method, so as to study the change of rock physical properties after steam flooding and to clarify the influence of cementation strength, crude oil viscosity and other factors on the change of rock physical properties.
2. Physical Simulation Experiment of Heavy Oil Composition Change
2.1. Experimental Materials and Methods
2.1.1. Experimental Materials
Crude oil with the same viscosity and different heavy components was prepared in the laboratory, and the composition change of crude oil before and after steam flooding was analyzed by taking component as a single factor. Three sets of sand-filled pipe (Table 1) were used for the physical simulation experiments. Two sand-filled pipes were filled with 160 mesh glass micro-sand to compare the composition changes of crude oil with different components before and after steam flooding under the same permeability; the other sand pack was mainly filled with 40 mesh glass micro-sand to make the permeability different, and the replacement efficiency of the crude oil (the same oil sample with the same composition) before and after the steam flooding was compared under different permeability conditions. The oil used for experiments is No. 1 and No. 2 compound crude oil (Table 2).

Table 1.
Basic physical property of sand-filled pipes.
Table 2.
Content of heavy components and viscosity of compound oil.
2.1.2. Experimental Methods
The following process was adopted in the experiment: (1) The gas tightness of the device was tested with high-pressure nitrogen gas, and the pressure was kept at 5 MPa for 30 min. (2) Saturate the sand-fill pipe with water at a flow rate of 1 mL/min. After saturation, calculate the volume of saturated water in the sand-fill pipe, that is, the pore volume of the sand pack; the pressure difference between the two ends of the sand-fill pipe was measured, and the water-phase permeability of the two sand-fill pipes was calculated according to Darcy’s formula. (3) Saturate the crude oil at a flow rate of 0.2 mL/min, and set the whole set of experimental equipment to the corresponding temperature. (4) Steam flooding is carried out after the sand-fill pipe is saturated with oil. The steam temperature is controlled to 300 °C and the flow rate is 2 mL/min. (5) The experiment is stopped when the sand-fill pipe is flooded to a stage when the water cut reaches 98%.
2.2. Experimental Results and Analysis
2.2.1. The Displacement Efficiency under Different Conditions
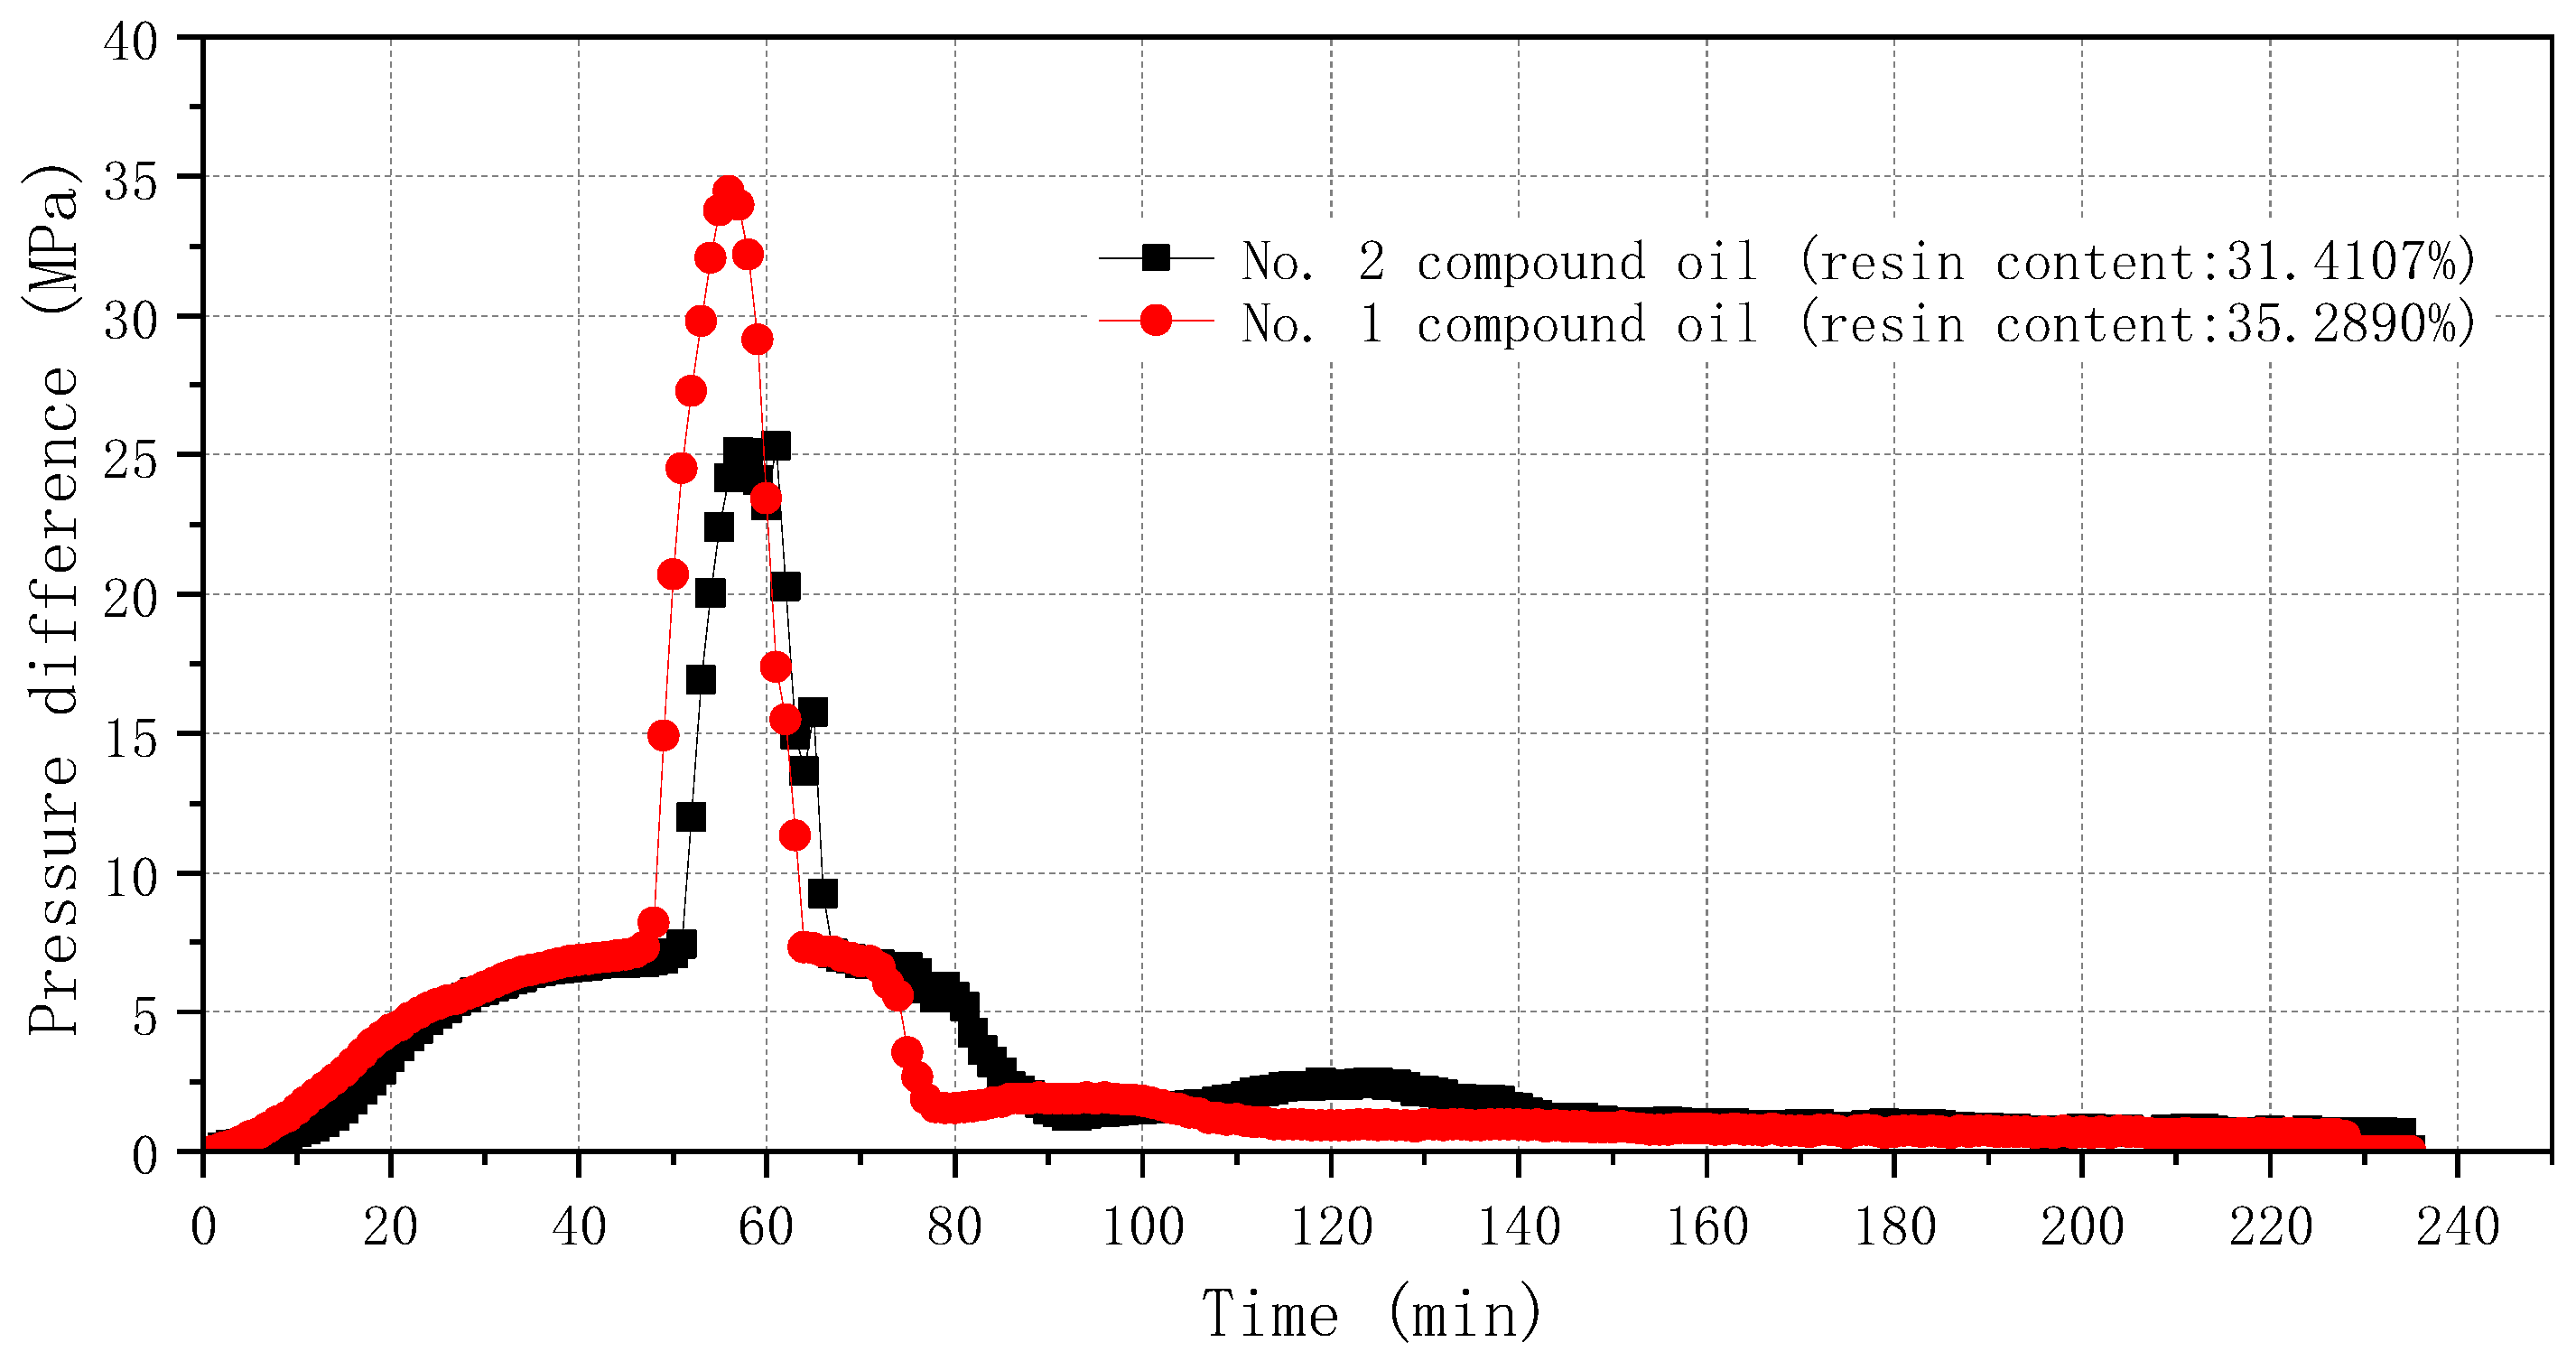
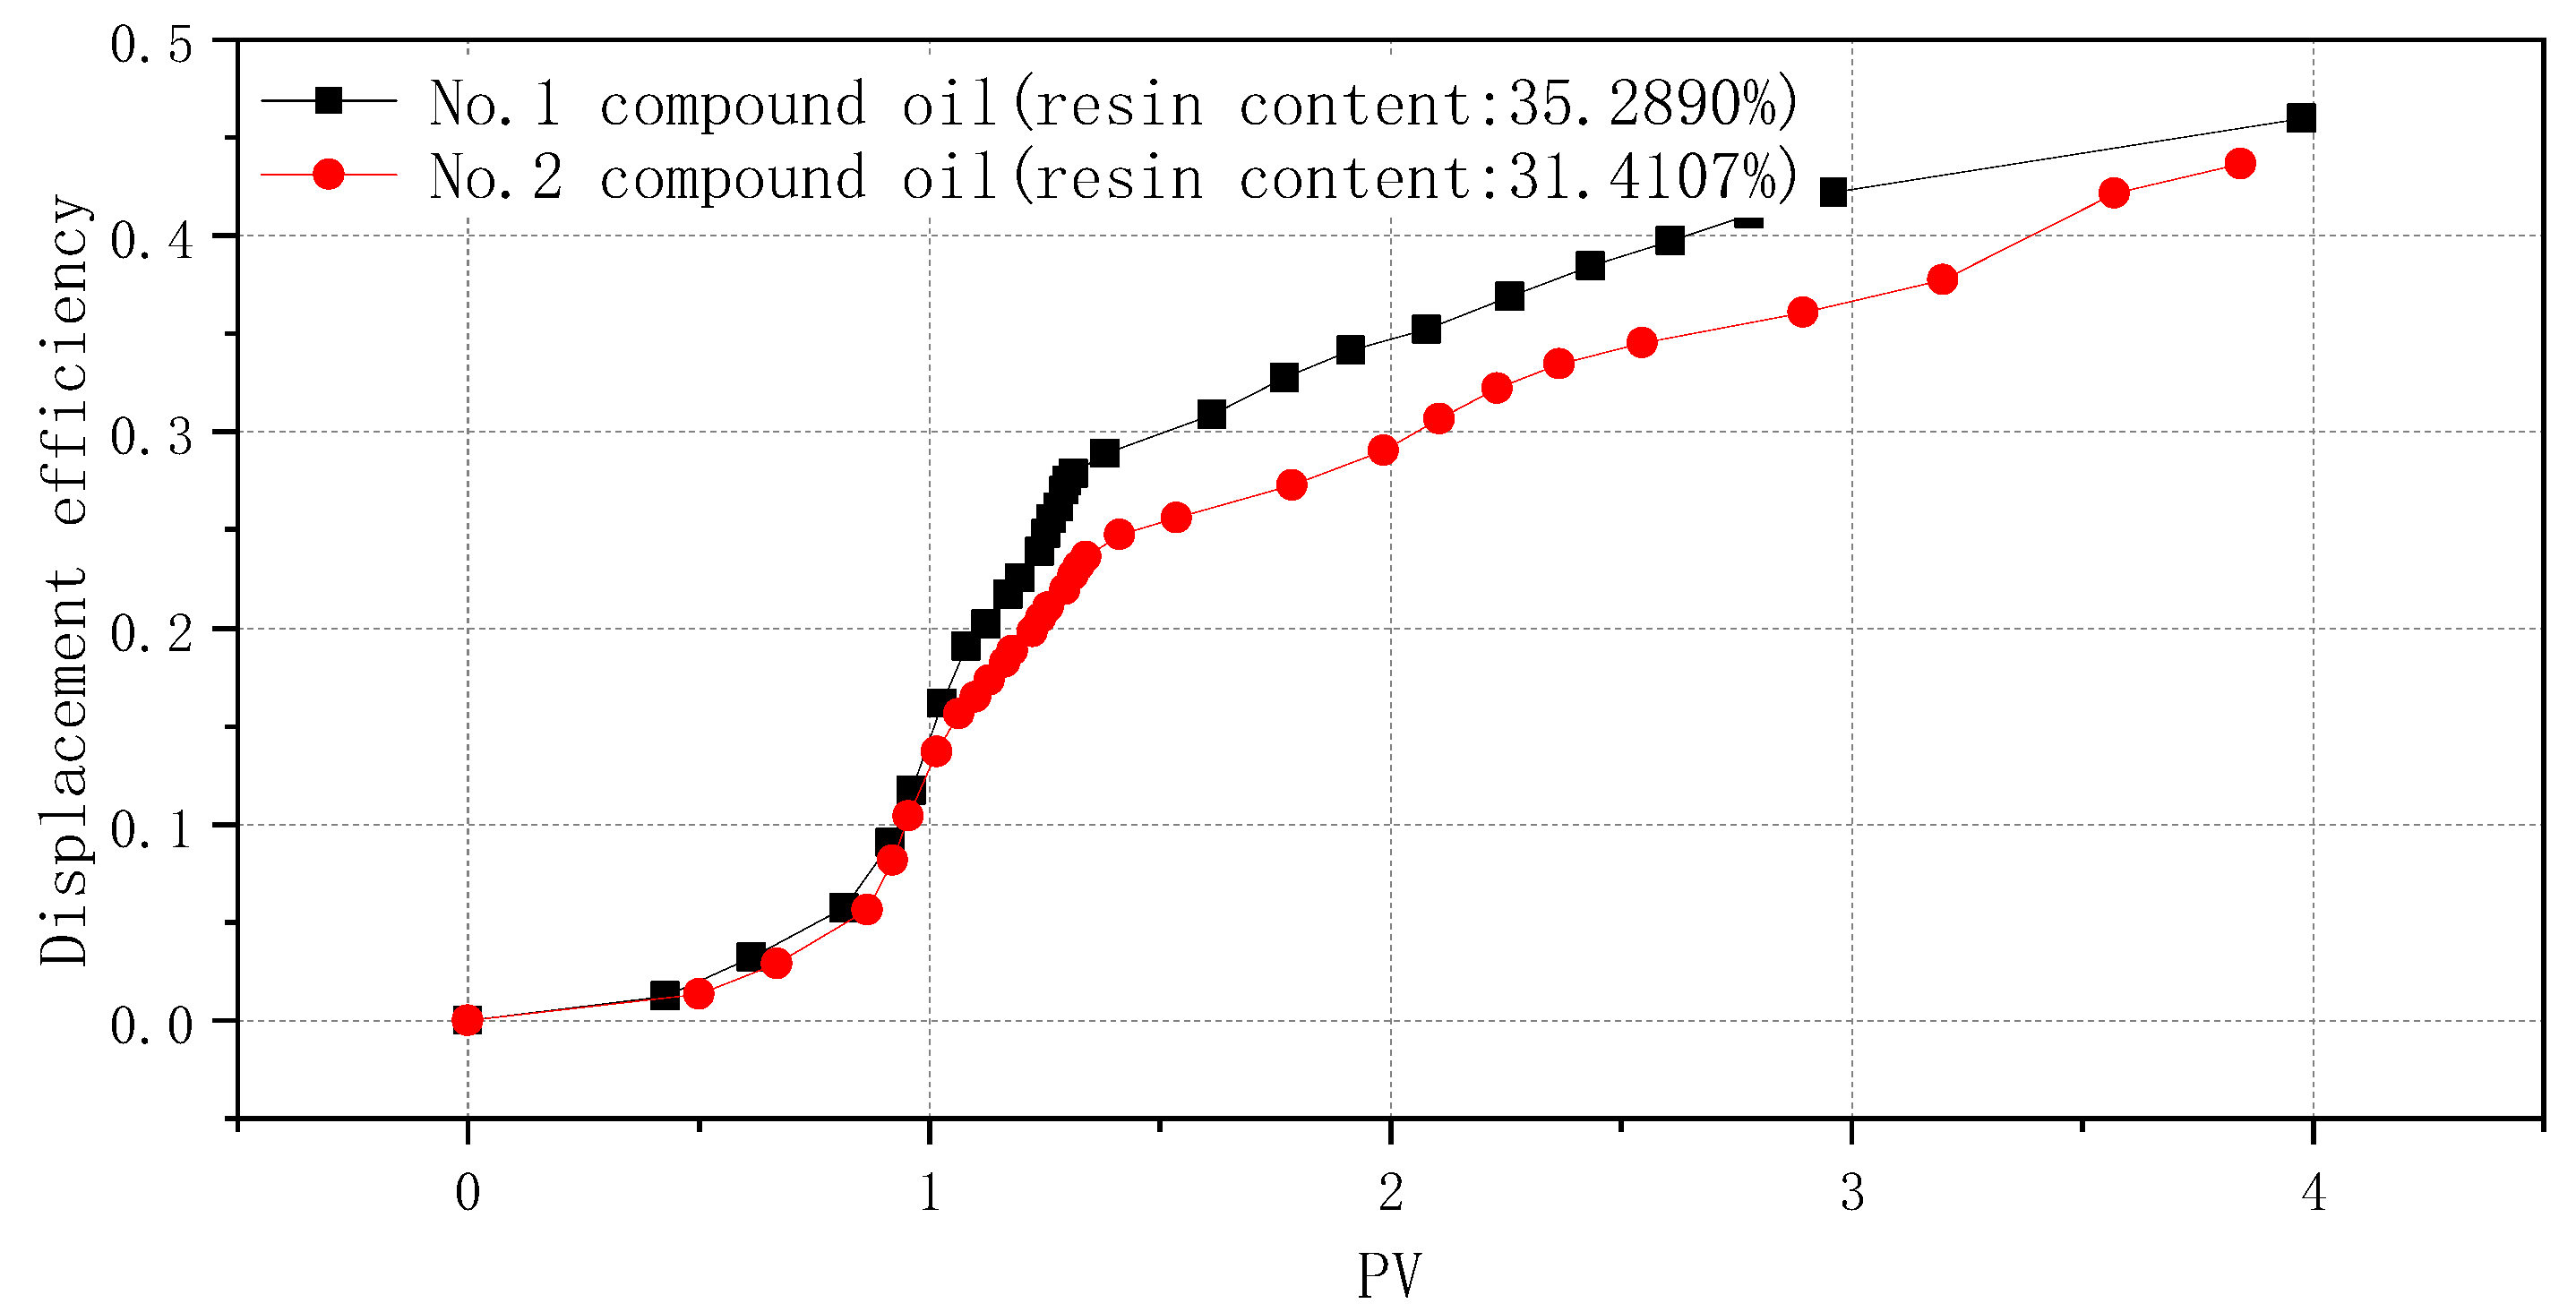
No. 1 sand-filled pipe and No. 2 sand-filled pipe are saturated with No. 1 compound oil and No. 2 compound oil, respectively, to compare the displacement pressure (Figure 1) and displacement efficiency (Figure 2) of crude oil with different components during steam flooding under the same permeability conditions.
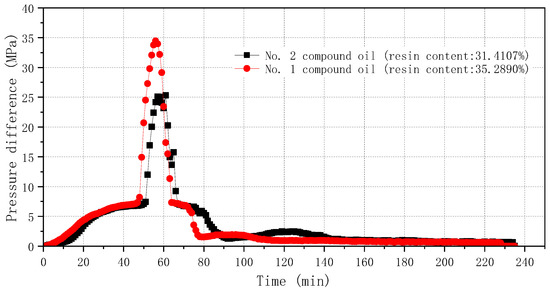
Figure 1.
Displacement pressure of two different compound oil.
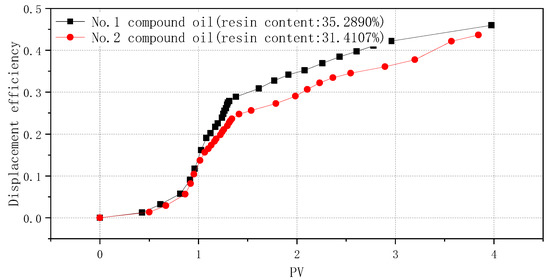
Figure 2.
Displacement efficiency of two different compound oil.
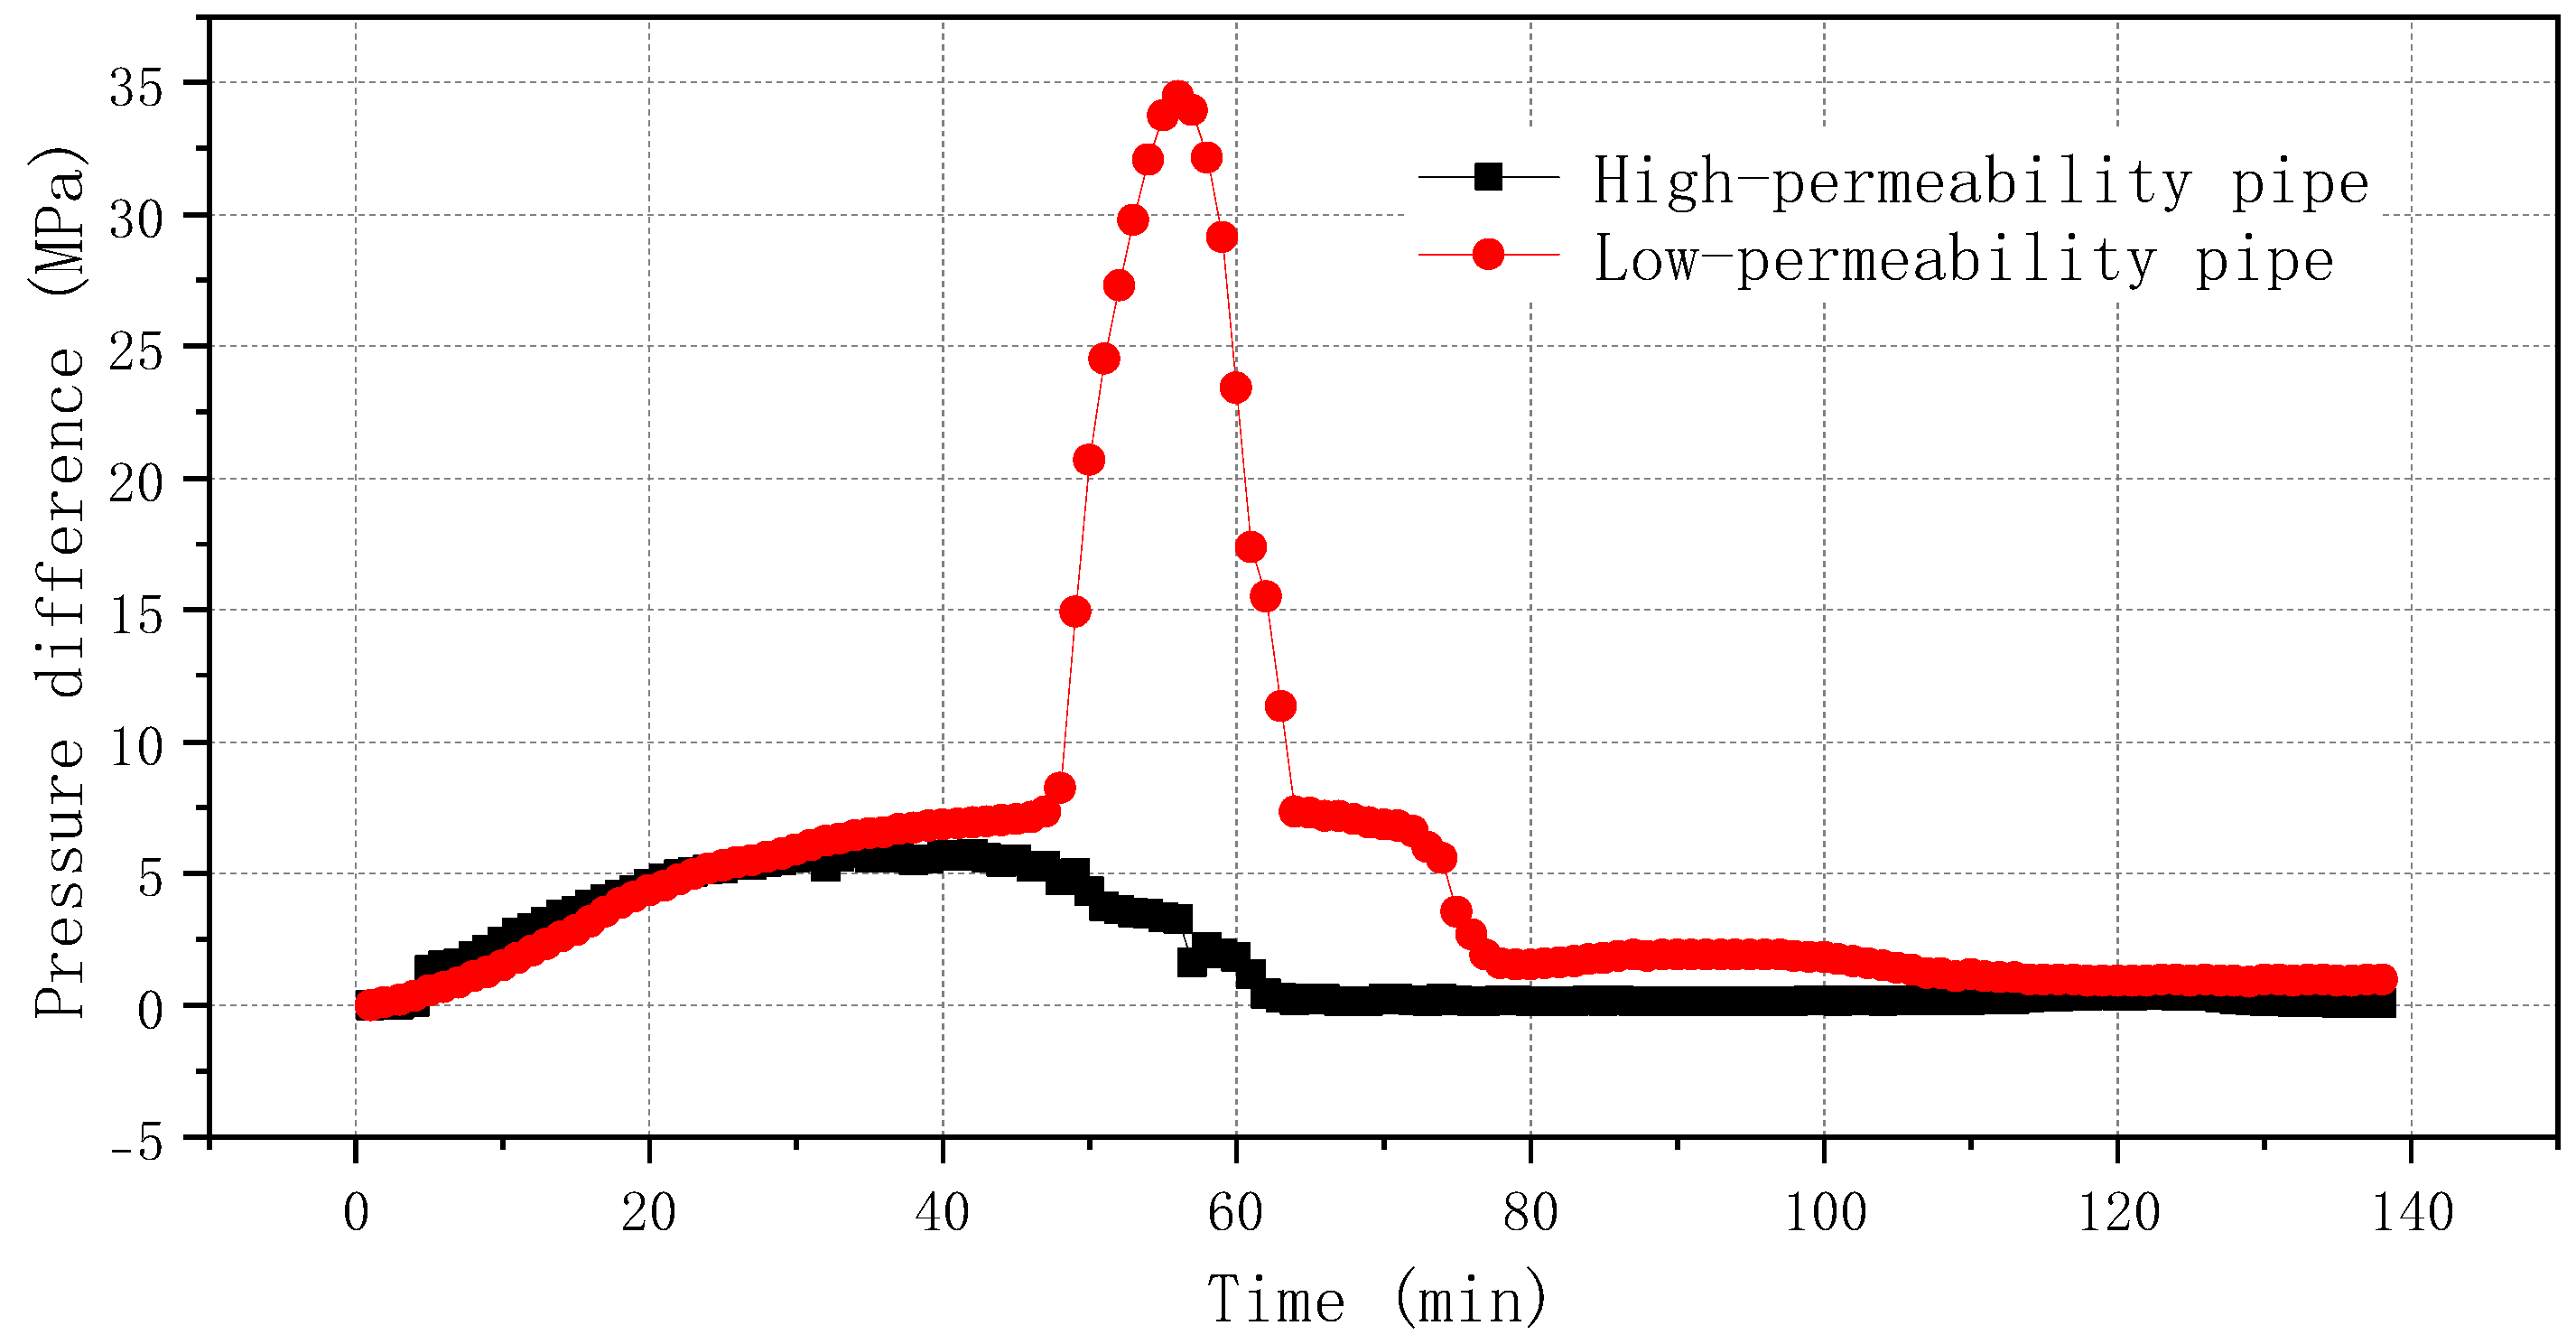
As can be seen from Figure 1, under the same permeability condition (1 μm2), the pressure difference required to displace oil samples with high resin content is larger than that required to displace oil samples with low resin content. This is because the high resin content makes it easier for the heavy components in the heavy oil to form a network spatial structure, which requires more pressure to deform the heavy oil and start to flow during displacement.
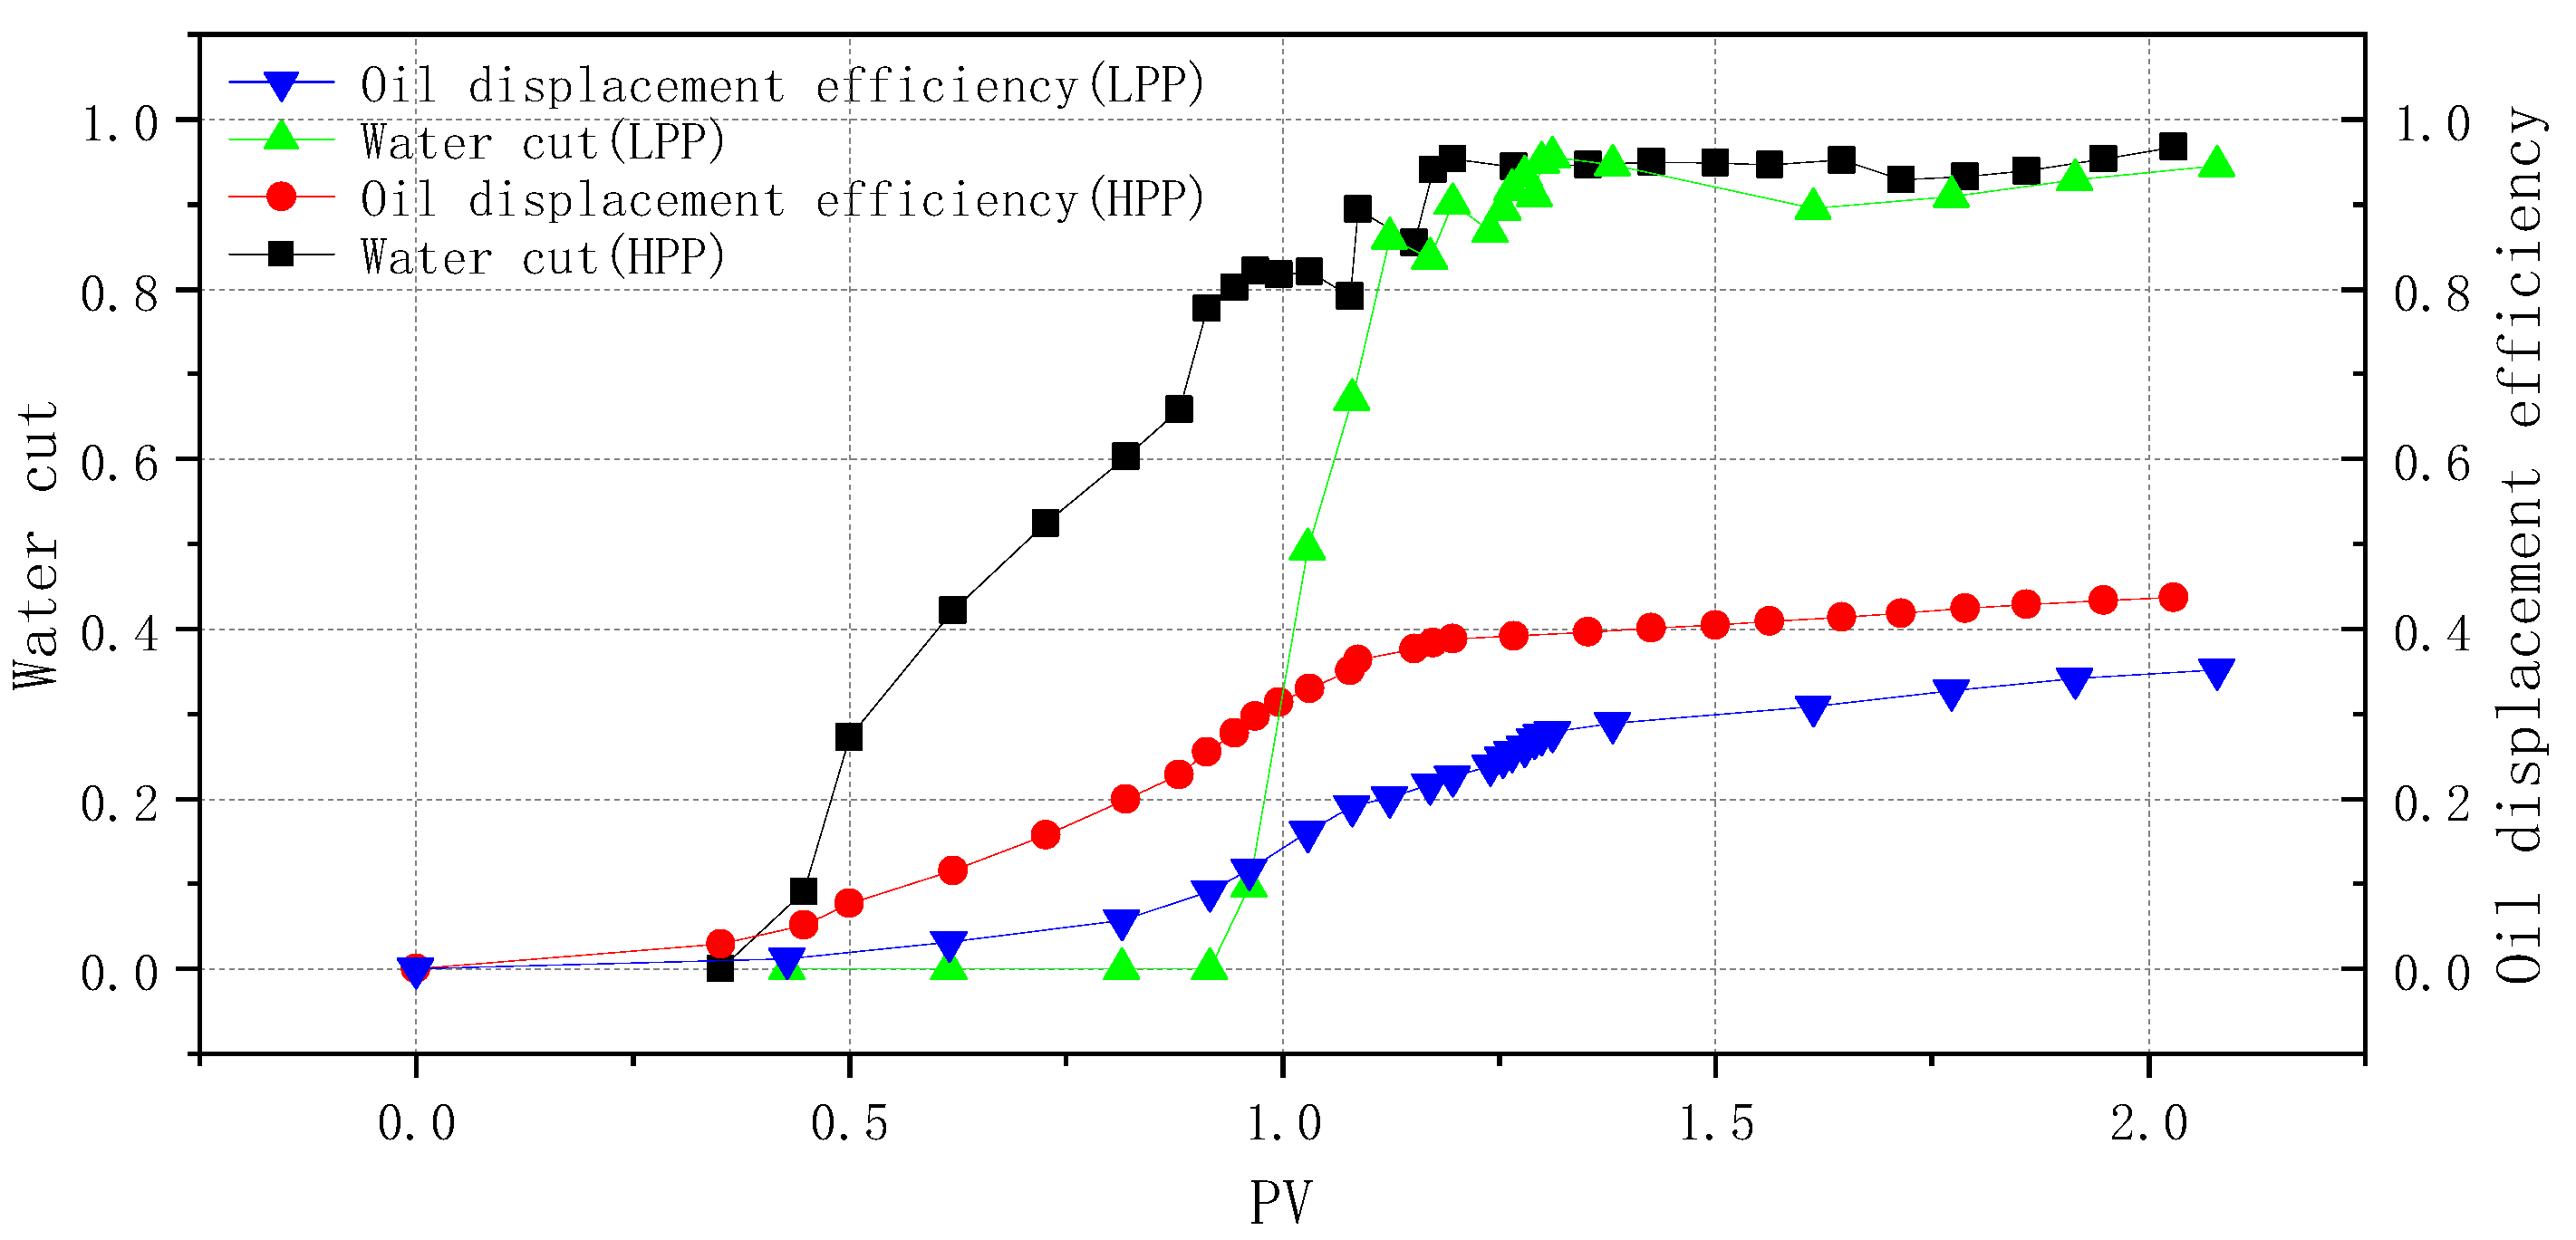
As can be seen from Figure 3, under the condition that different permeability sand-filled pipes (1 μm2 and 6 μm2) are saturated with the same oil sample, the water-free oil recovery period of the high-permeability pipe (HPP) is shorter than that of the low-permeability pipe (LPP). However, once the low-permeability pipe produces water, the water content rises especially fast, and the displacement efficiency of the high-permeability pipe is higher than that of the low-permeability pipe, but the pressure required to displace the crude oil in the high-permeability pipe is also smaller than that in the low-permeability pipe, as shown in Figure 4.
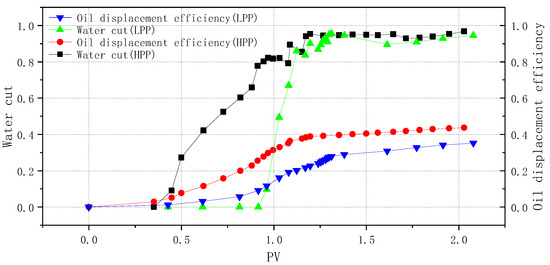
Figure 3.
Comparison curves of oil repelling efficiency and water content of high and low permeability pipes (same oil sample).
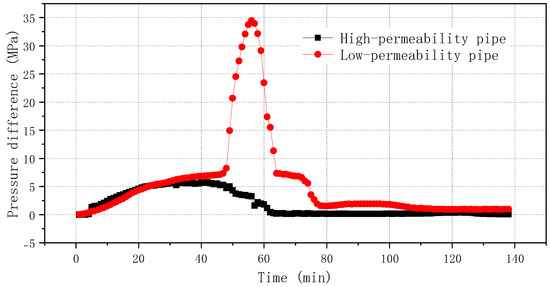
Figure 4.
Displacement pressure of two different permeability sand pack.
2.2.2. Change of Heavy Oil Composition
The composition changes of different compound oil before and after steam flooding are shown in Table 3. When the water cut of the two sand-filled pipes reaches 98% at the outlet of the sand-filled pipe by steam flooding, the resin content of the No. 1 oil sample displaced from the sand-filled pipe decreased from 34.92% to 34.01%, and the resin content of the No. 2 oil sample decreased from 31.10% to 27.99%. This indicates that the heavy component of oil produced after steam flooding is reduced, so the heavy fraction remaining in the sand-filled pipe are increased to varying degrees. This is because during the steam flooding, the high-temperature steam distills the light components of crude oil and makes it easier to be recovered. However, the heavy components have a high distillation temperature, and the resins and asphaltenes in it are easier to be adsorbed on the rock wall, which are more difficult to be recovered than the light components and thus remain in the formation [18].
Table 3.
SARA composition of two different compound oil before and after steam flooding.
3. Numerical Simulation of Heavy Oil Properties Change
The change of fluid properties after steam flooding is mainly reflected in the change of components before and after steam flooding. According to the results of physical simulation experiments, the light components in crude oil are easier to be recovered after steam flooding because they are heated and volatilized, so the heavy components of the remaining oil in the formation will increase [19,20,21,22].
3.1. Numerical Simulation Model
The average geological parameters of the steam flooding pilot test well group in the Qi40 block of the Liaohe oilfield are selected to establish a homogeneous geologic model. The buried depth in the middle of the reservoir is 900 m, the well spacing is 140 m, the porosity is 27% and the permeability is 1500 × 10−3 μm2. In the model, the crude oil was divided into light and heavy components, and the viscosity-temperature relationships of the two components are shown in Table 4. In the geological model, the mass fraction ratio of the light component and the heavy component is 1:1.
Table 4.
Viscosity-temperature relationship.
The STARS module of the CMG software was applied to establish a model with a grid number of 20 × 13 × 5. The grid step is 7 m in X and Y directions and 4 m in Z direction, and the well spacing is 140 m. In the steam flooding stage, there is a steam injection well and a production well. The steam injection temperature is 300 °C, the dryness of steam is 0.6, the steam injection intensity of 1.6 m3/d/m/ha, and the production-injection ratio is 1.2.
3.2. Changes in Fluid Properties after Steam Flooding
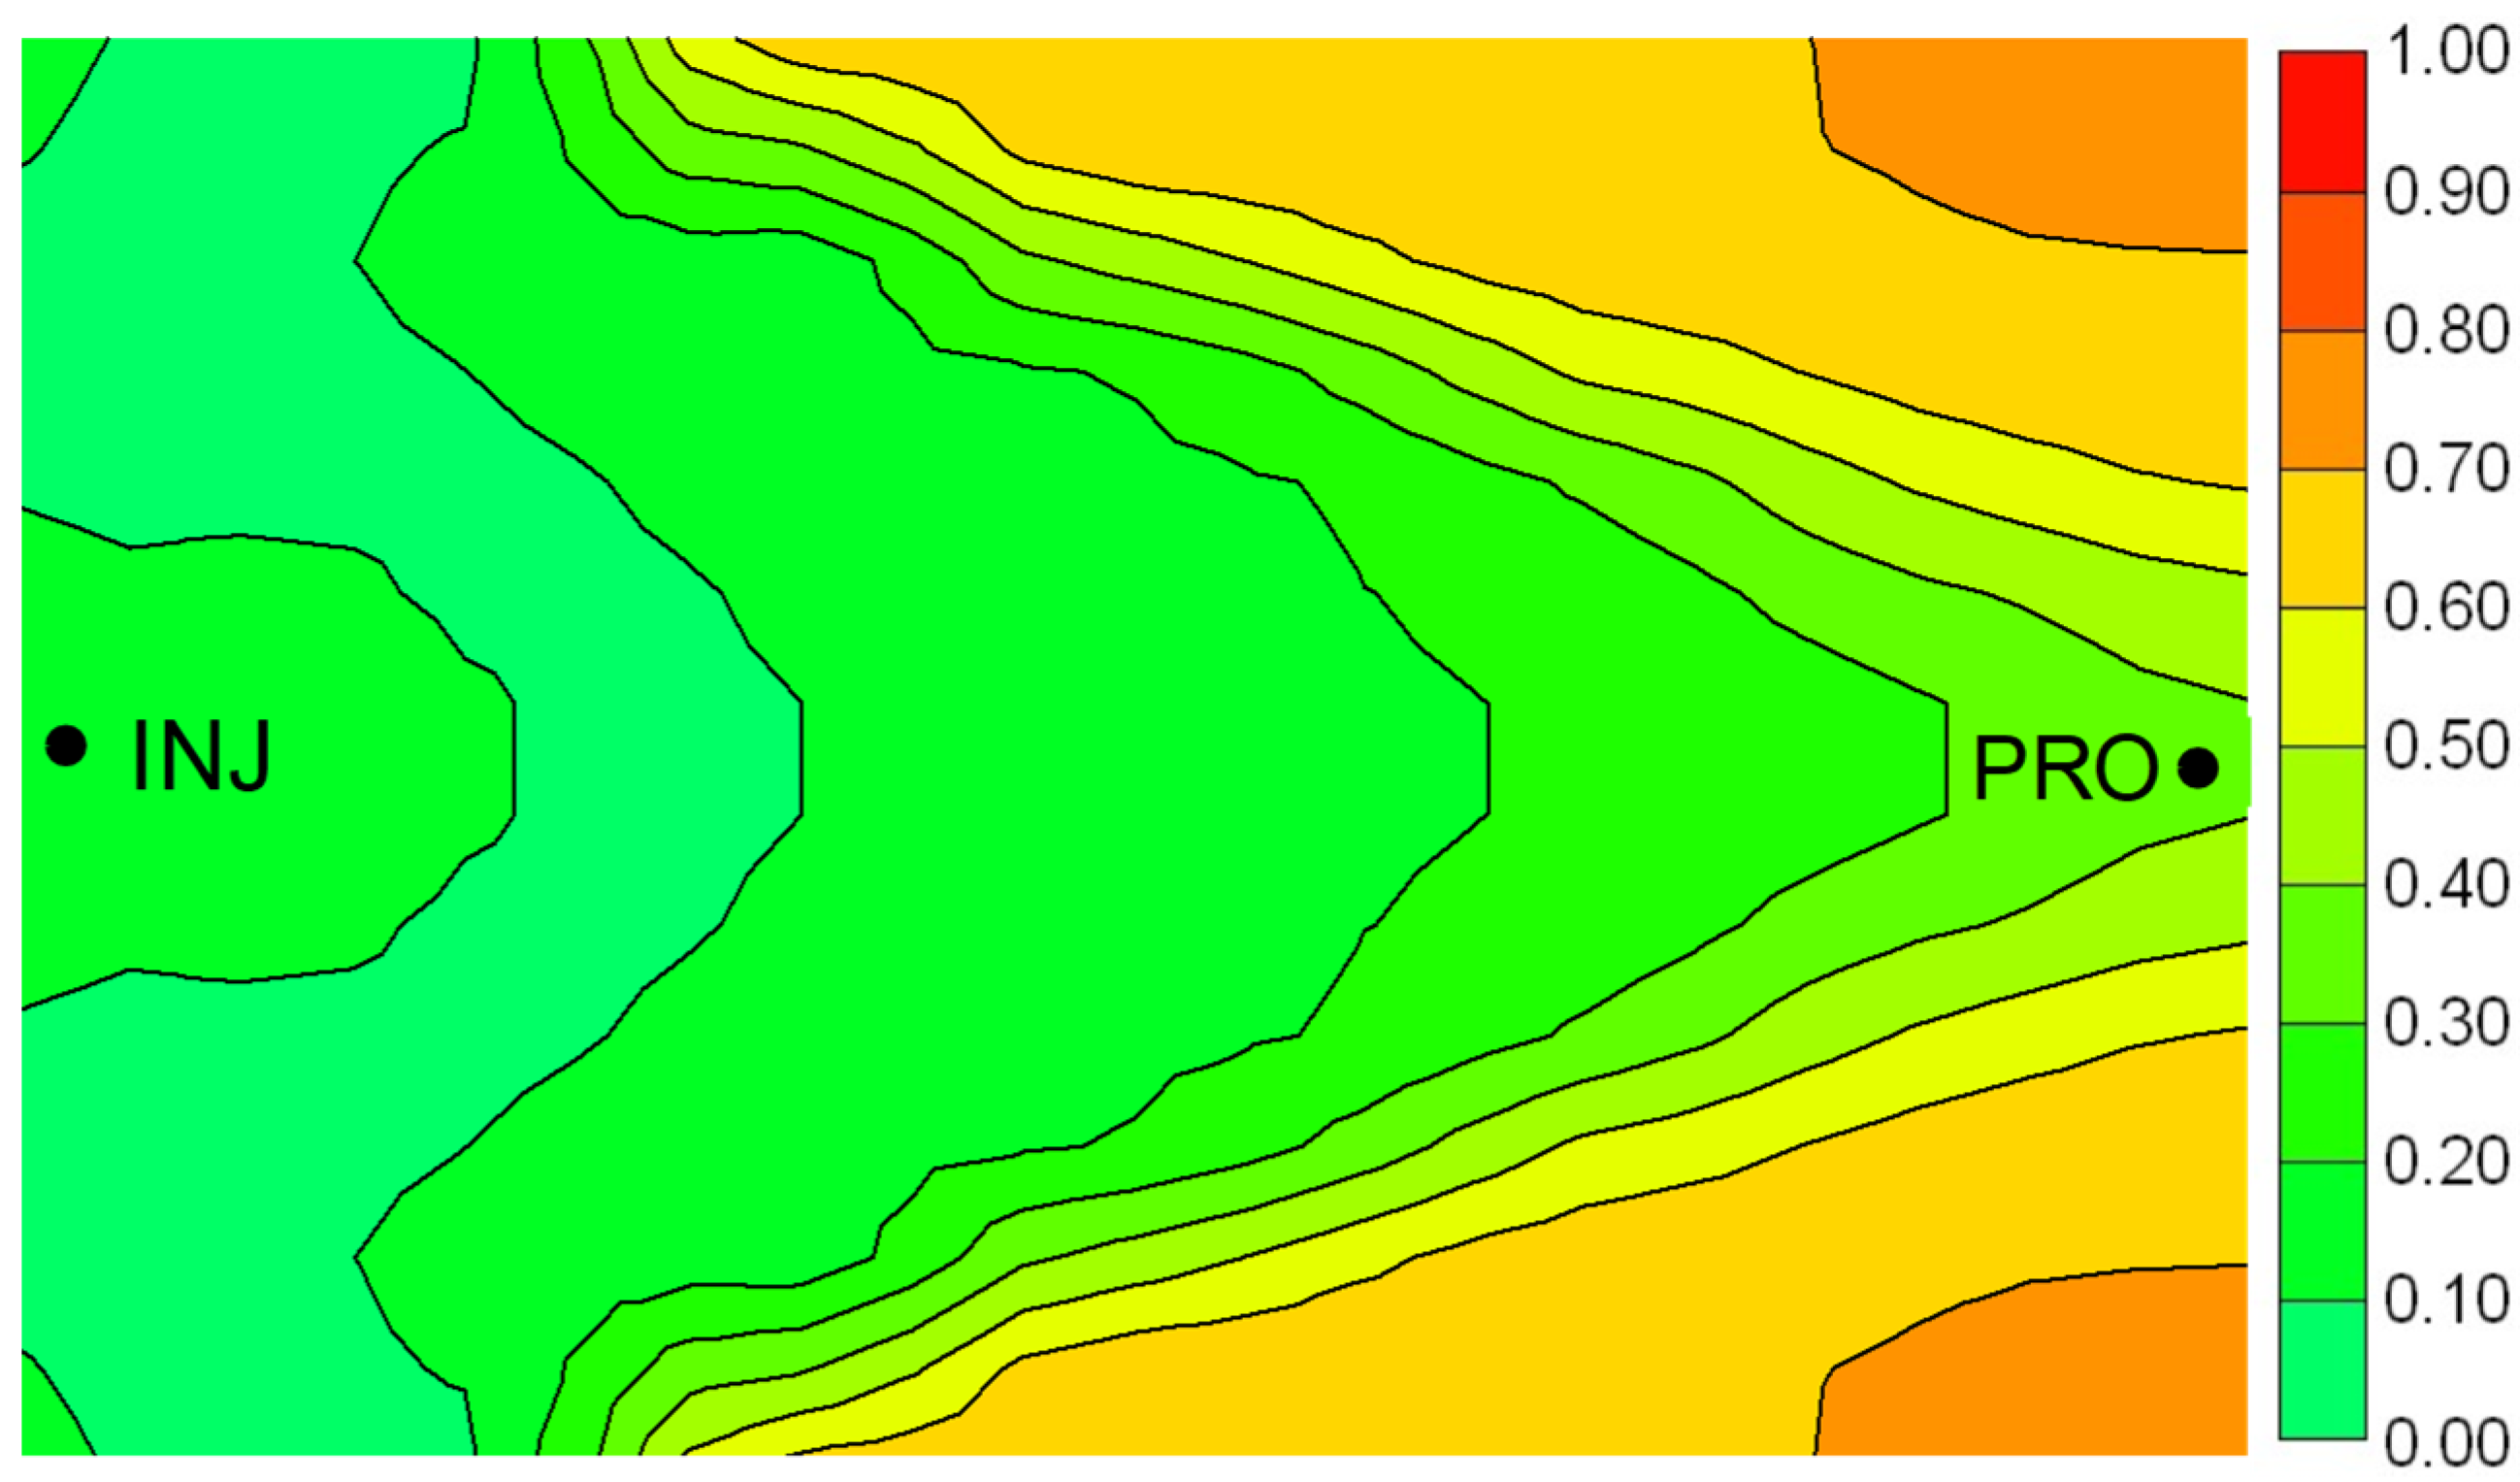
As can be seen from Figure 5, there is less remaining oil in the formation between the injection and production wells. This is because the rocks between the injection and production wells have experienced long-term steam flooding and the sand-carrying effect of heavy oil, resulting in a high permeability zone. Therefore, the steam will displace to the production well along the high permeability zone with low resistance, which makes the oil washing efficiency in the high permeability zone high, resulting in less oil remaining in the high permeability zone and more oil remaining in the formation outside the high permeability zone.
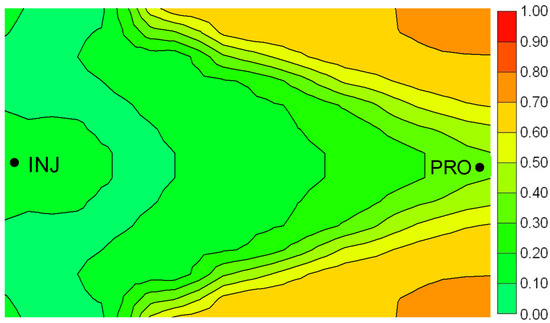
Figure 5.
Oil saturation distribution of reservoir after steam flooding.
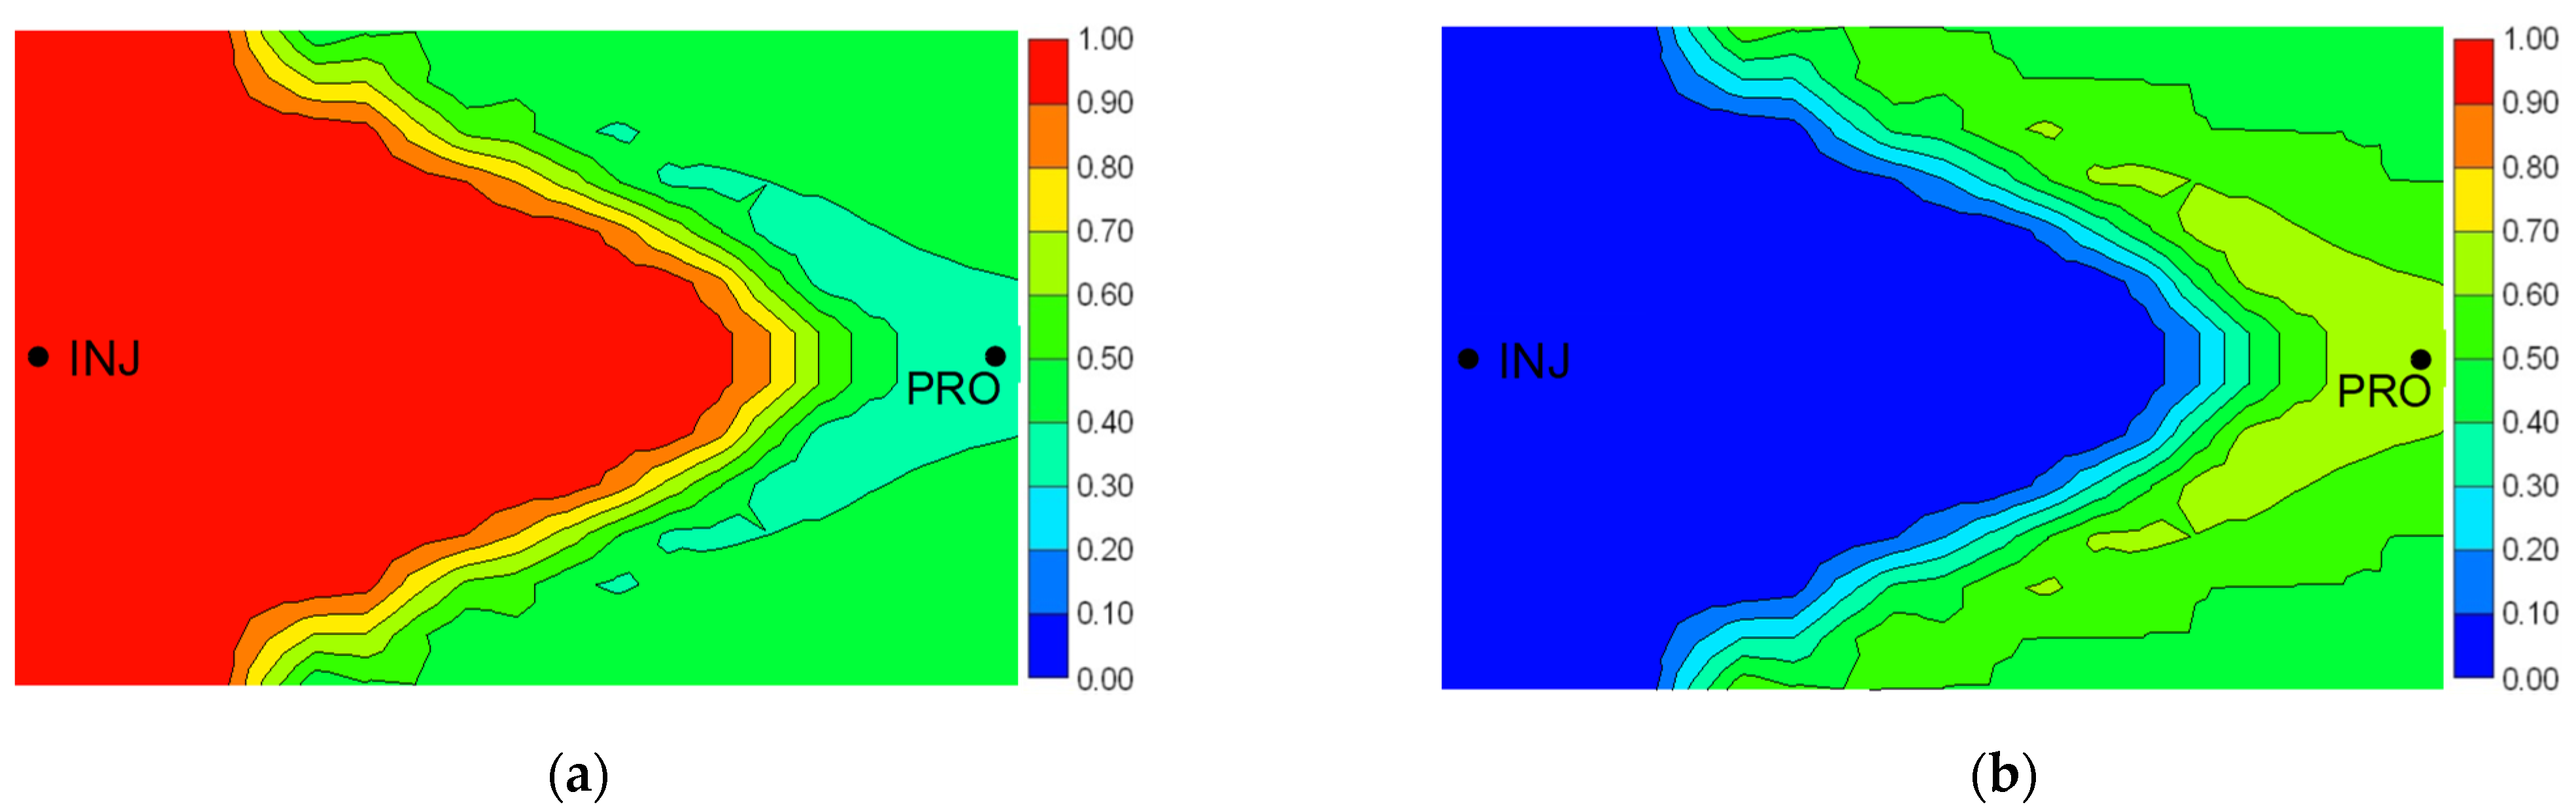
It can be found from Figure 6 that in the high permeability zone with low oil saturation, the mass fraction of heavy components in the remaining oil is 100% and the mass fraction of light components is 0%. This indicates that the light components in the heavy oil is easier to be volatilized and recovered than the heavy components after long-term steam flooding, while the heavy components remain in the formation.
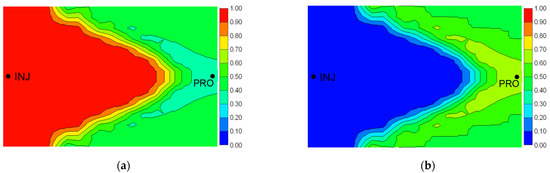
Figure 6.
Mass fraction distribution of components of oil after steam flooding. (a) Mass fraction distribution of heavy components. (b) Mass fraction distribution of light components.
3.3. Results and Analysis
3.3.1. Different Ratios of Light and Heavy Components
In the geological model, the light and heavy components were proportioned with different mass fractions to make the heavy components accounted for 0%, 25%, 50%, 75% and 100% of the crude oil mass fraction. Then, the effects of different ratios on the quantity of remaining oil and the retention of different components after steam flooding were analyzed.
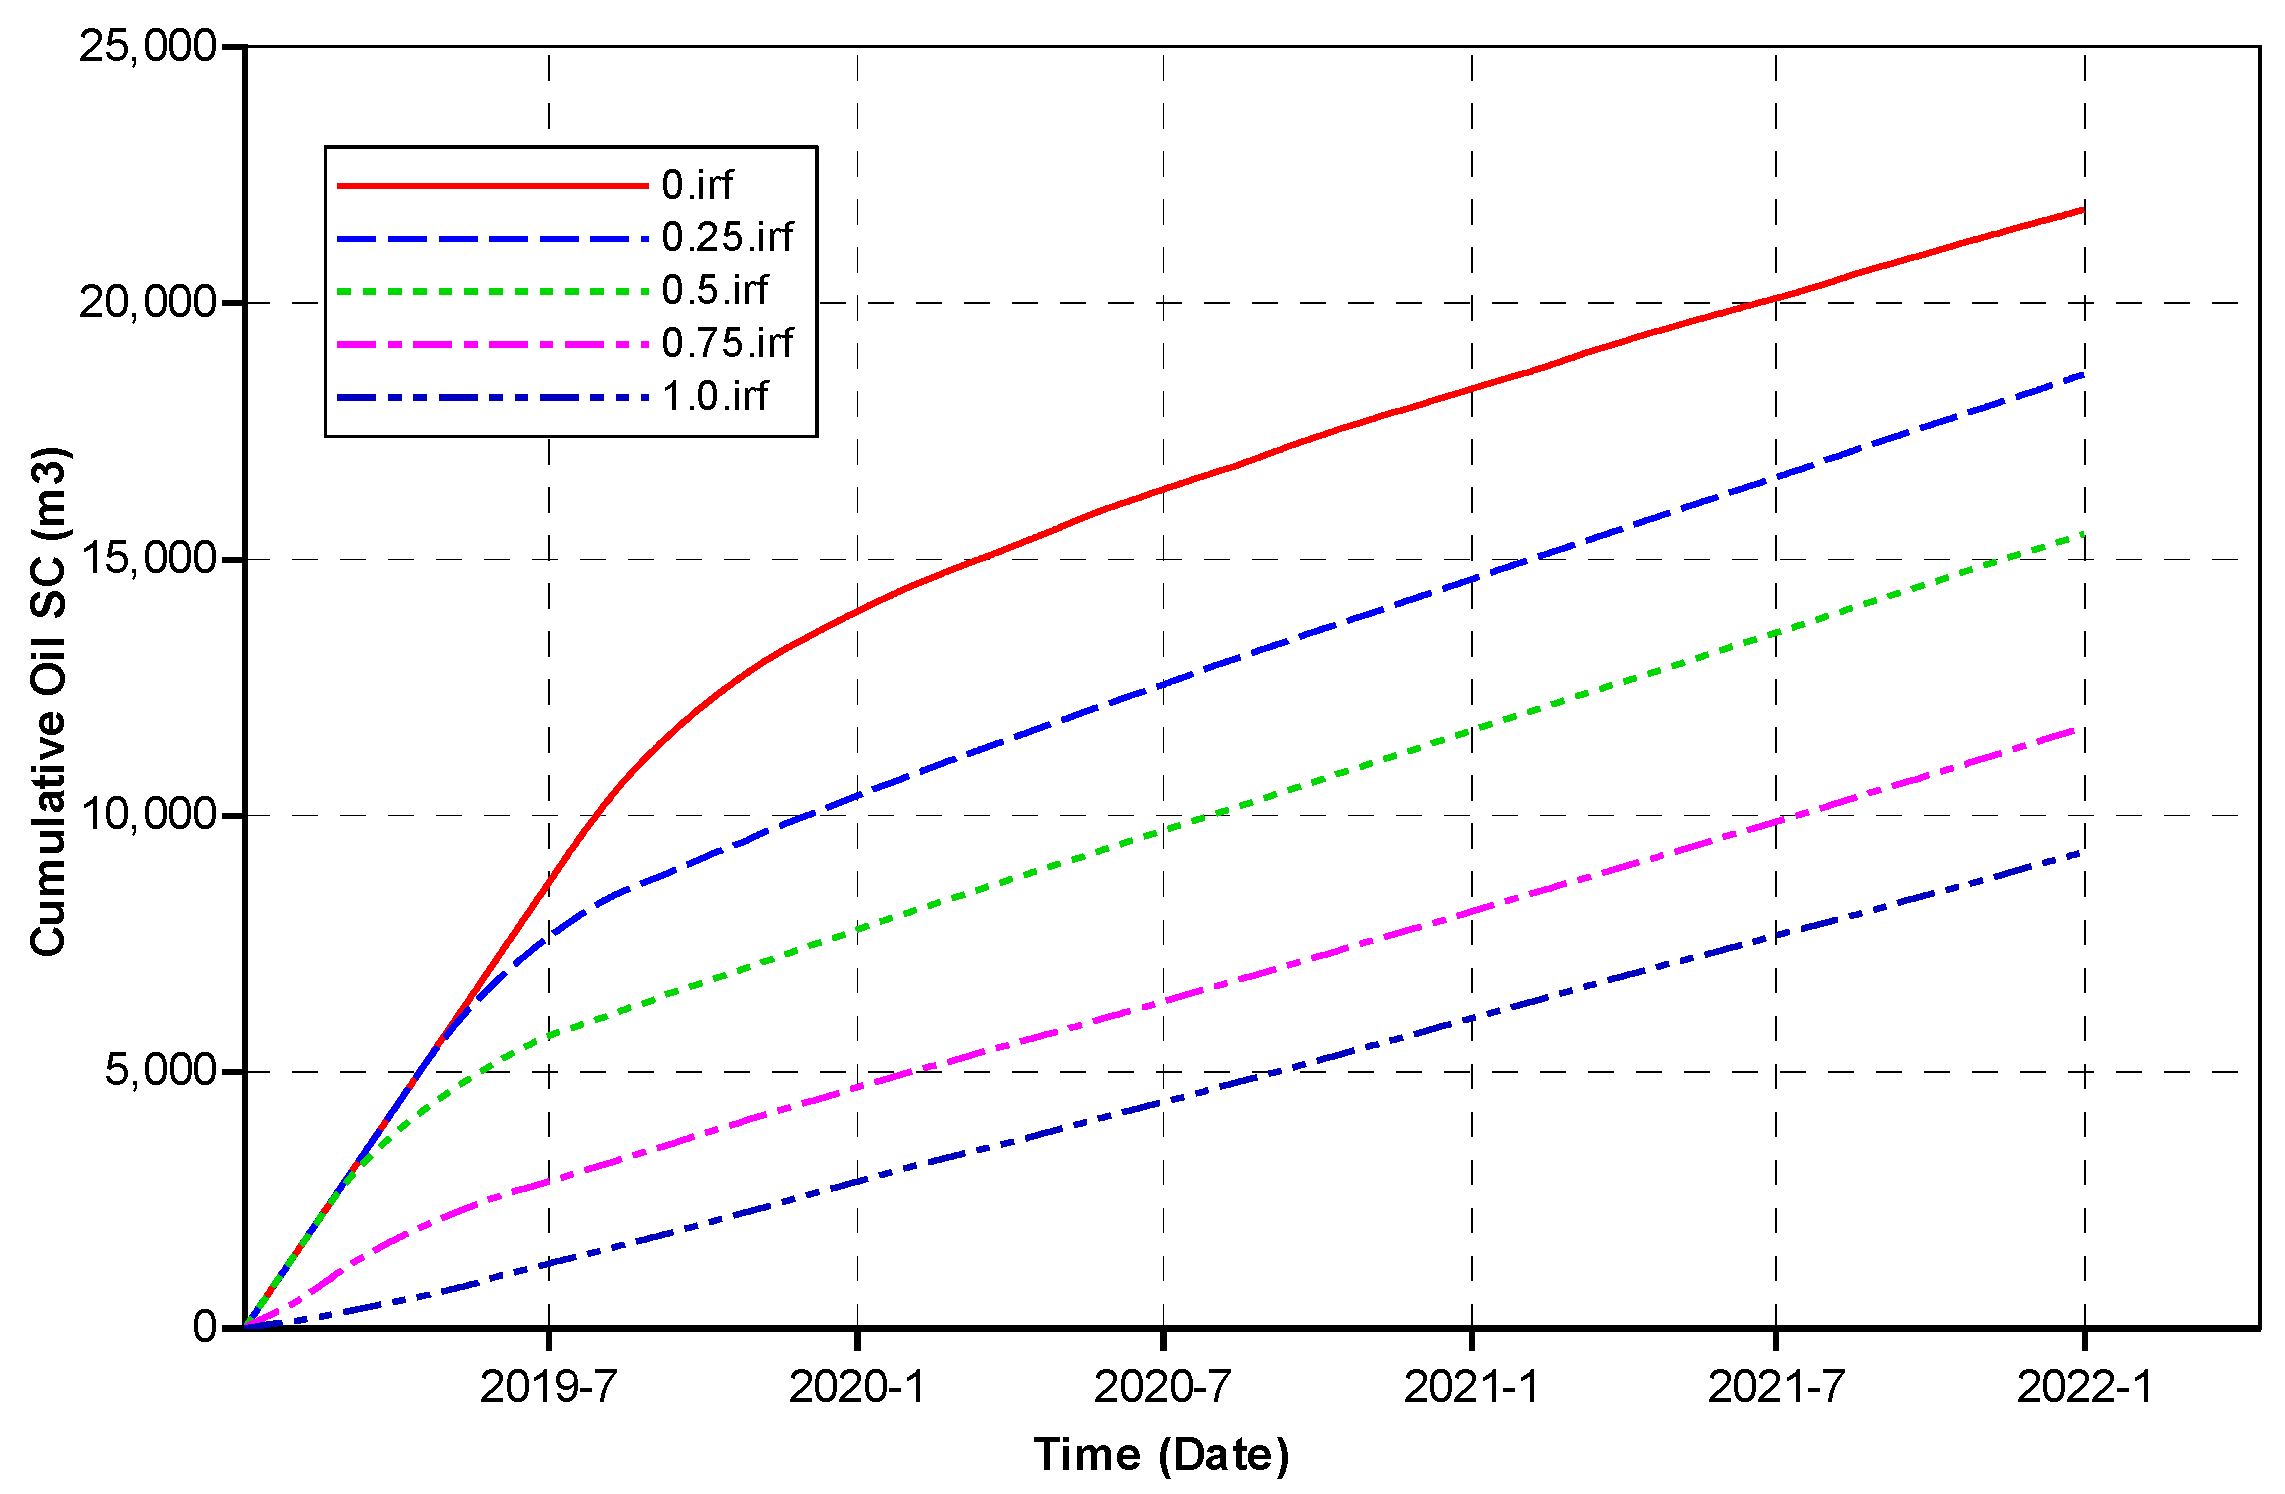
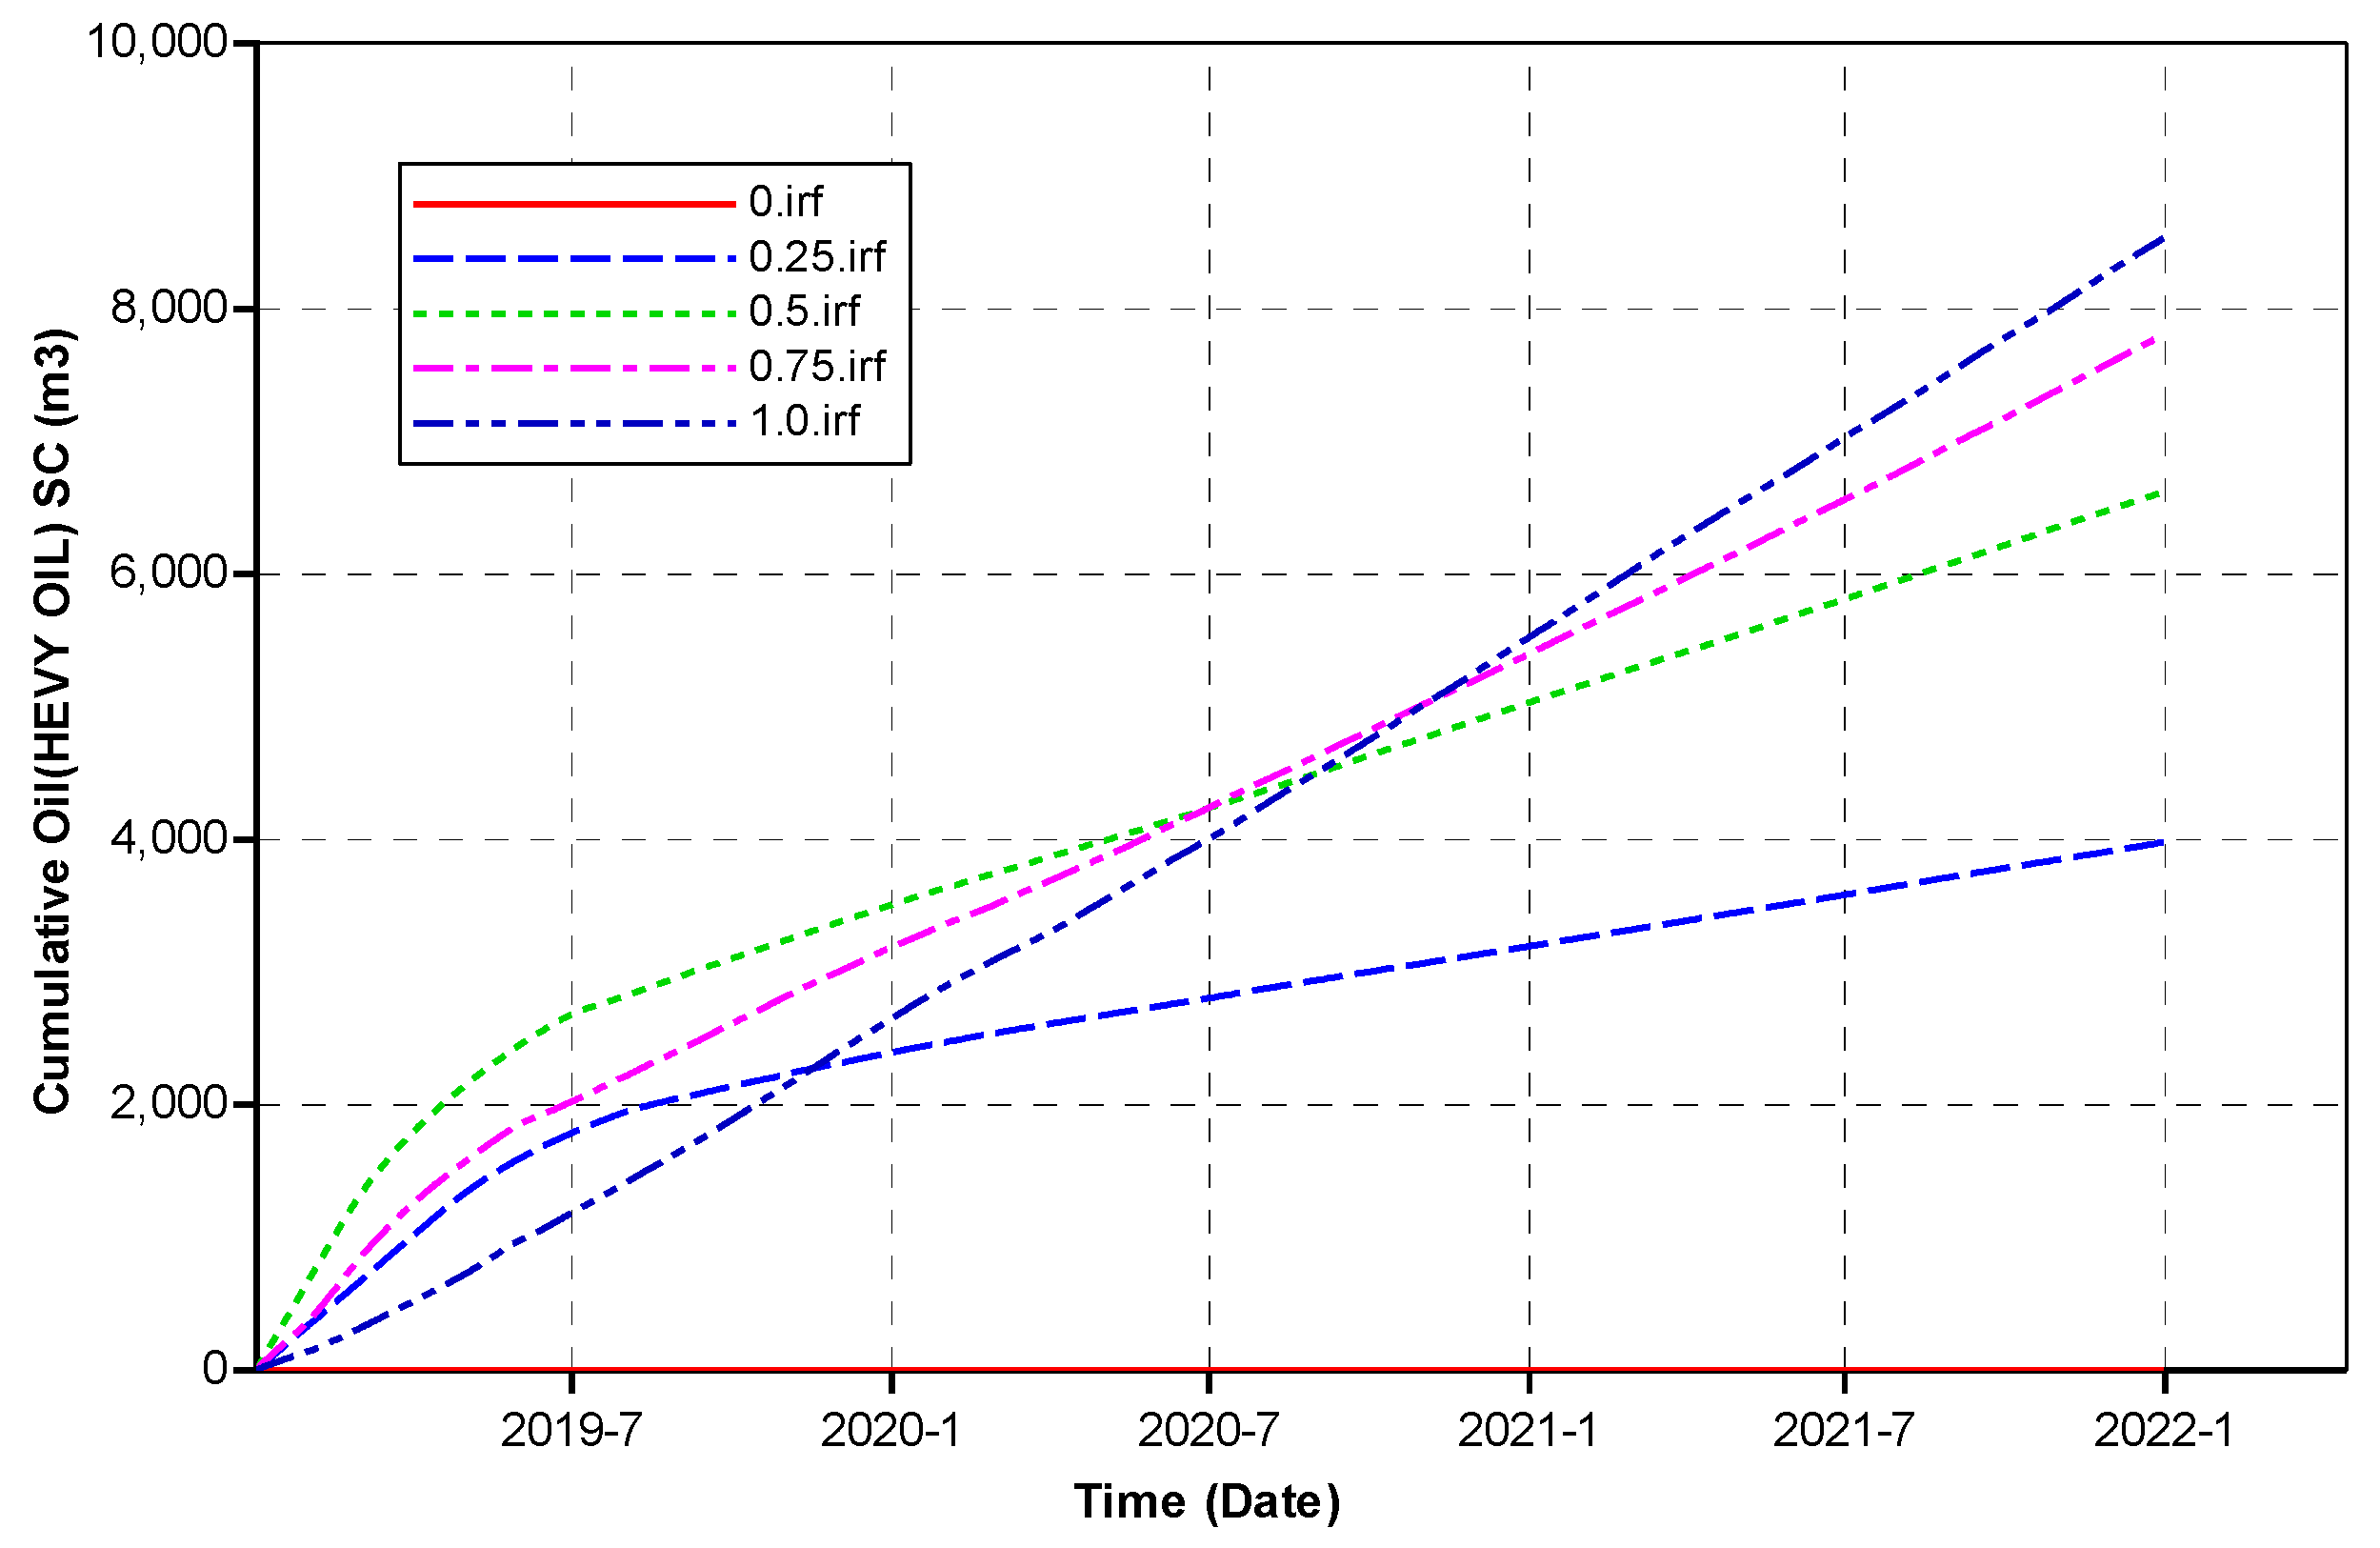
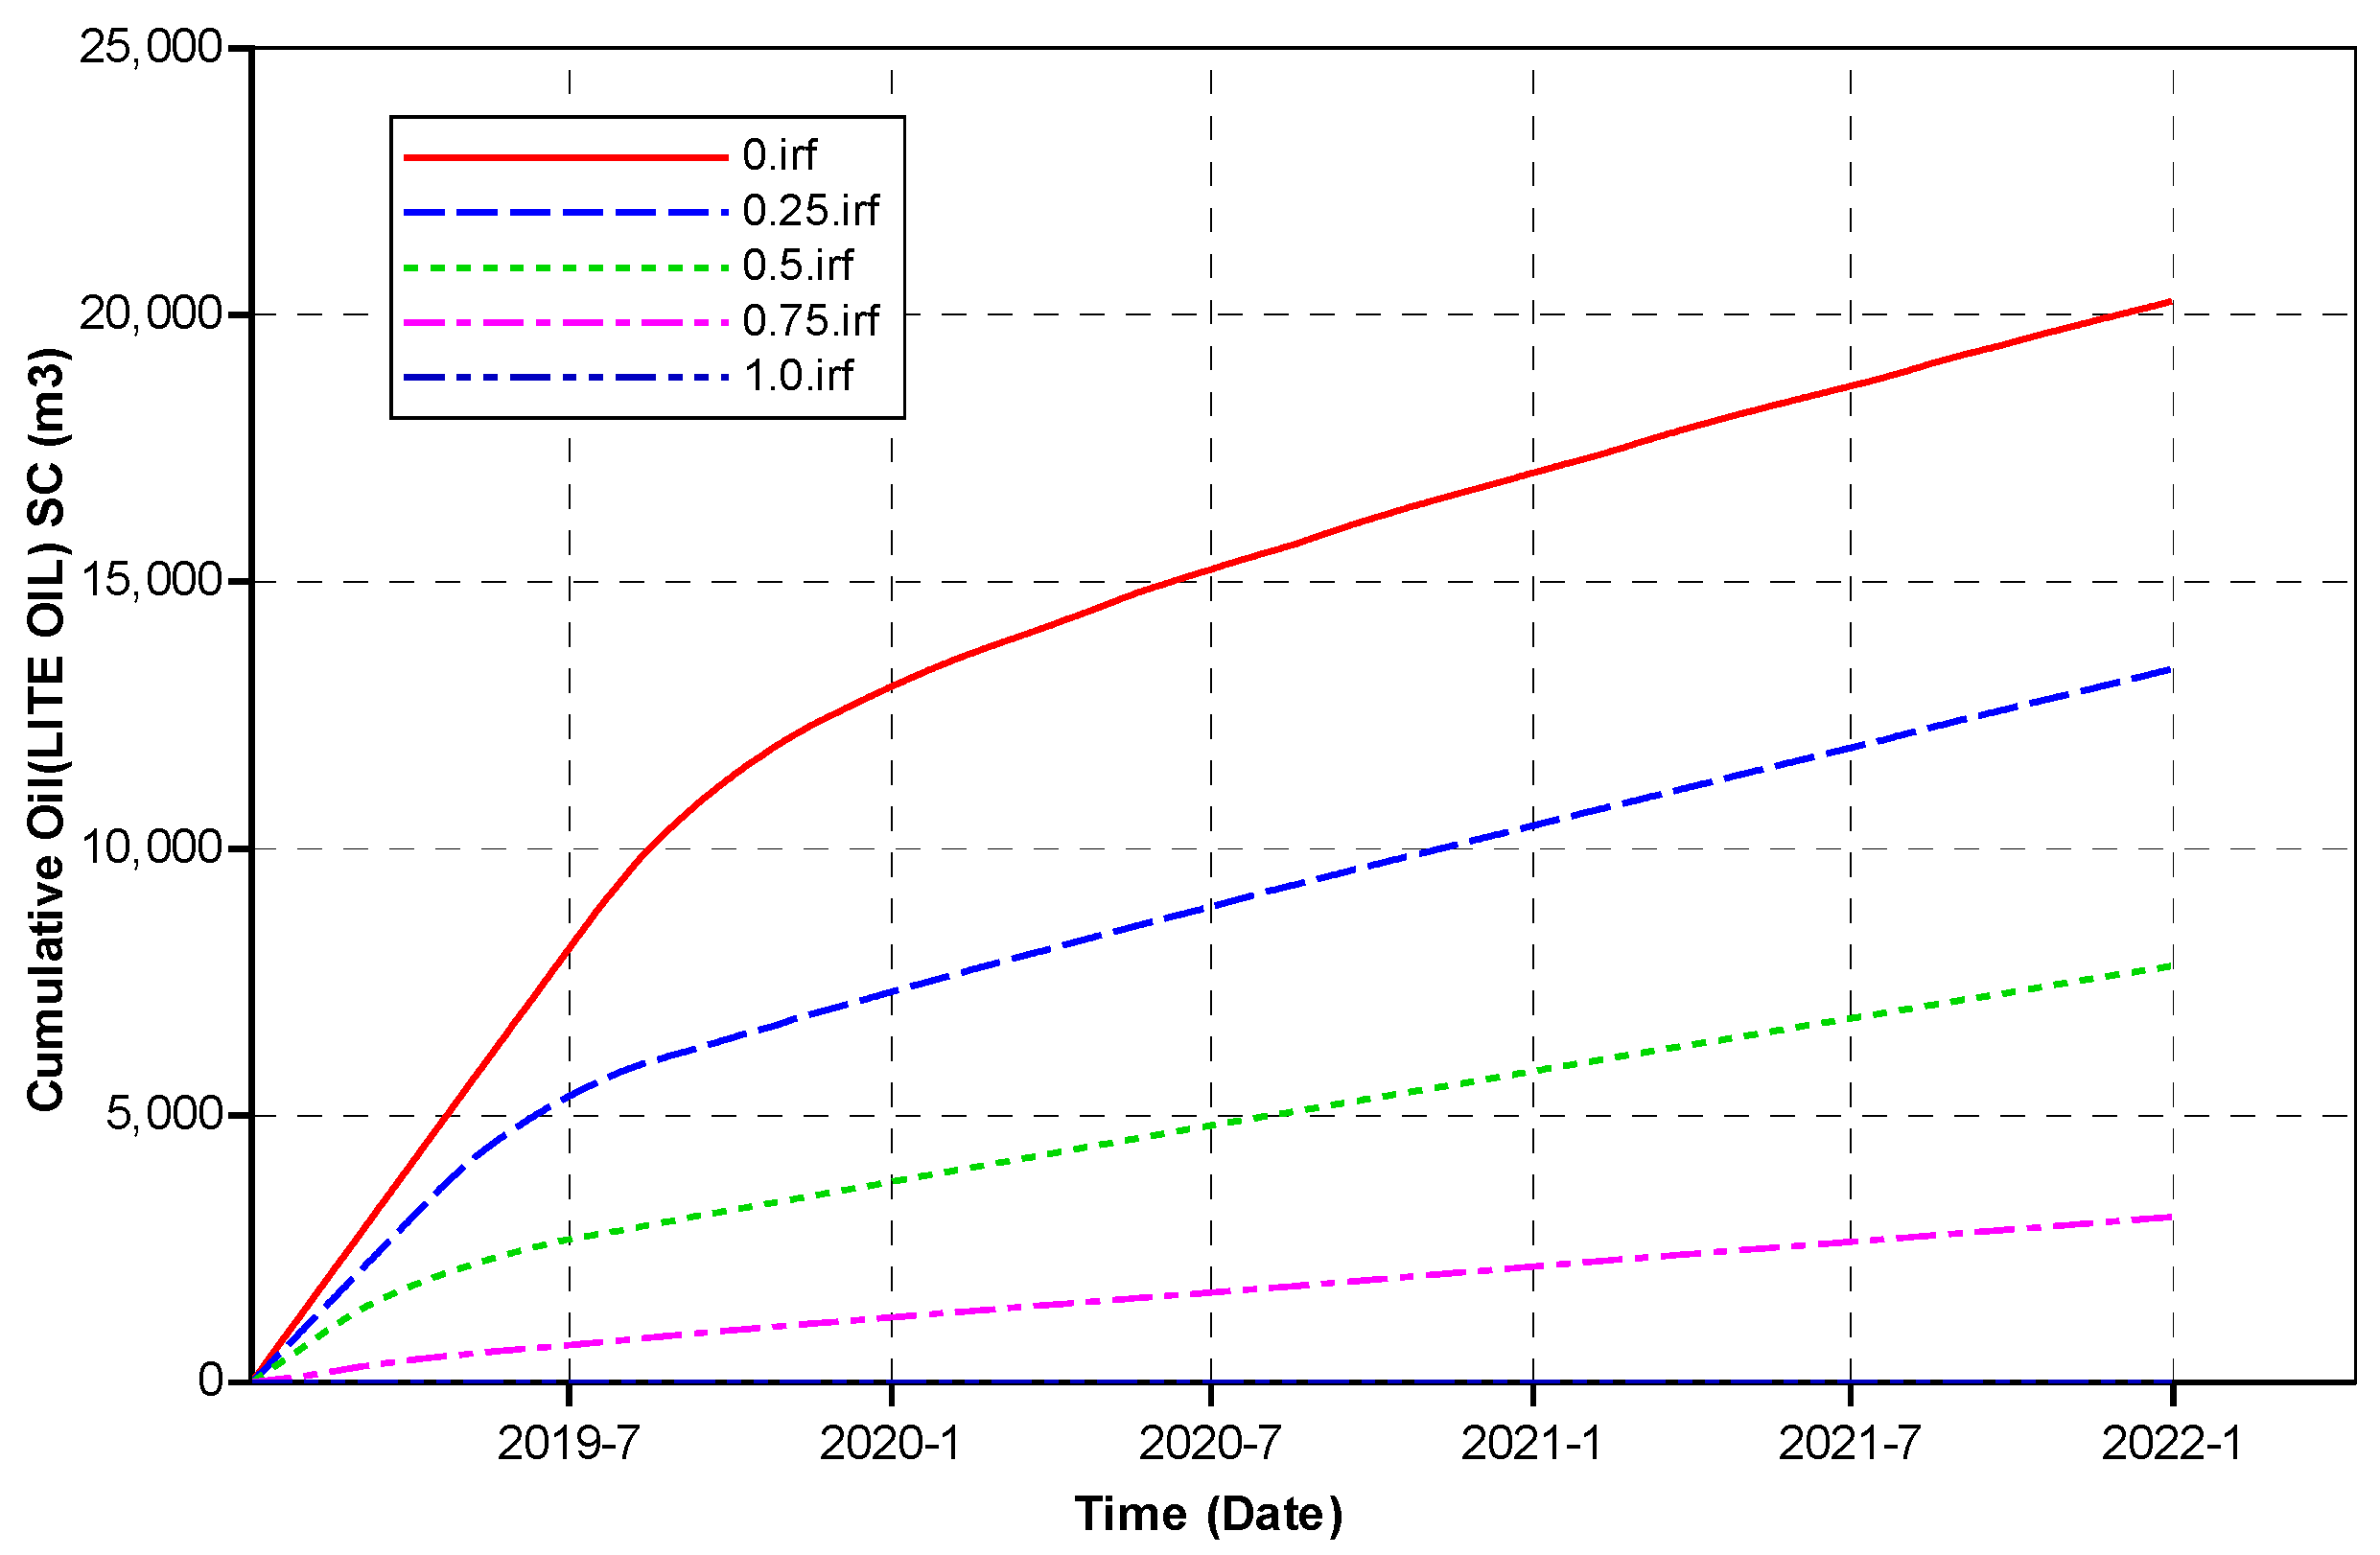
As shown in Figure 7, the total cumulative oil production decreases, which indicates that the heavier the crude oil, the lower the degree of recovery. We can see from the curves in Figure 8 and Figure 9, that the cumulative production of light components gradually decreases as the mass fraction of heavy components increases, the production of heavy components increases and the rising trend gradually slows down. The decrease of recovered heavy components indicates that the more heavy components are retained in the formation.

Figure 7.
Cumulative oil production after steam flooding at different proportion of components.
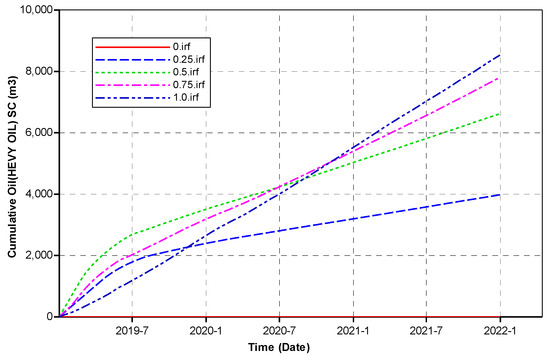
Figure 8.
Cumulative production of heavy component after steam flooding at different proportion of components.
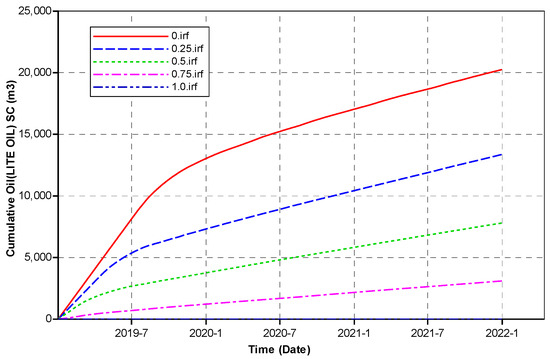
Figure 9.
Cumulative production of light component after steam flooding at different proportion of components.
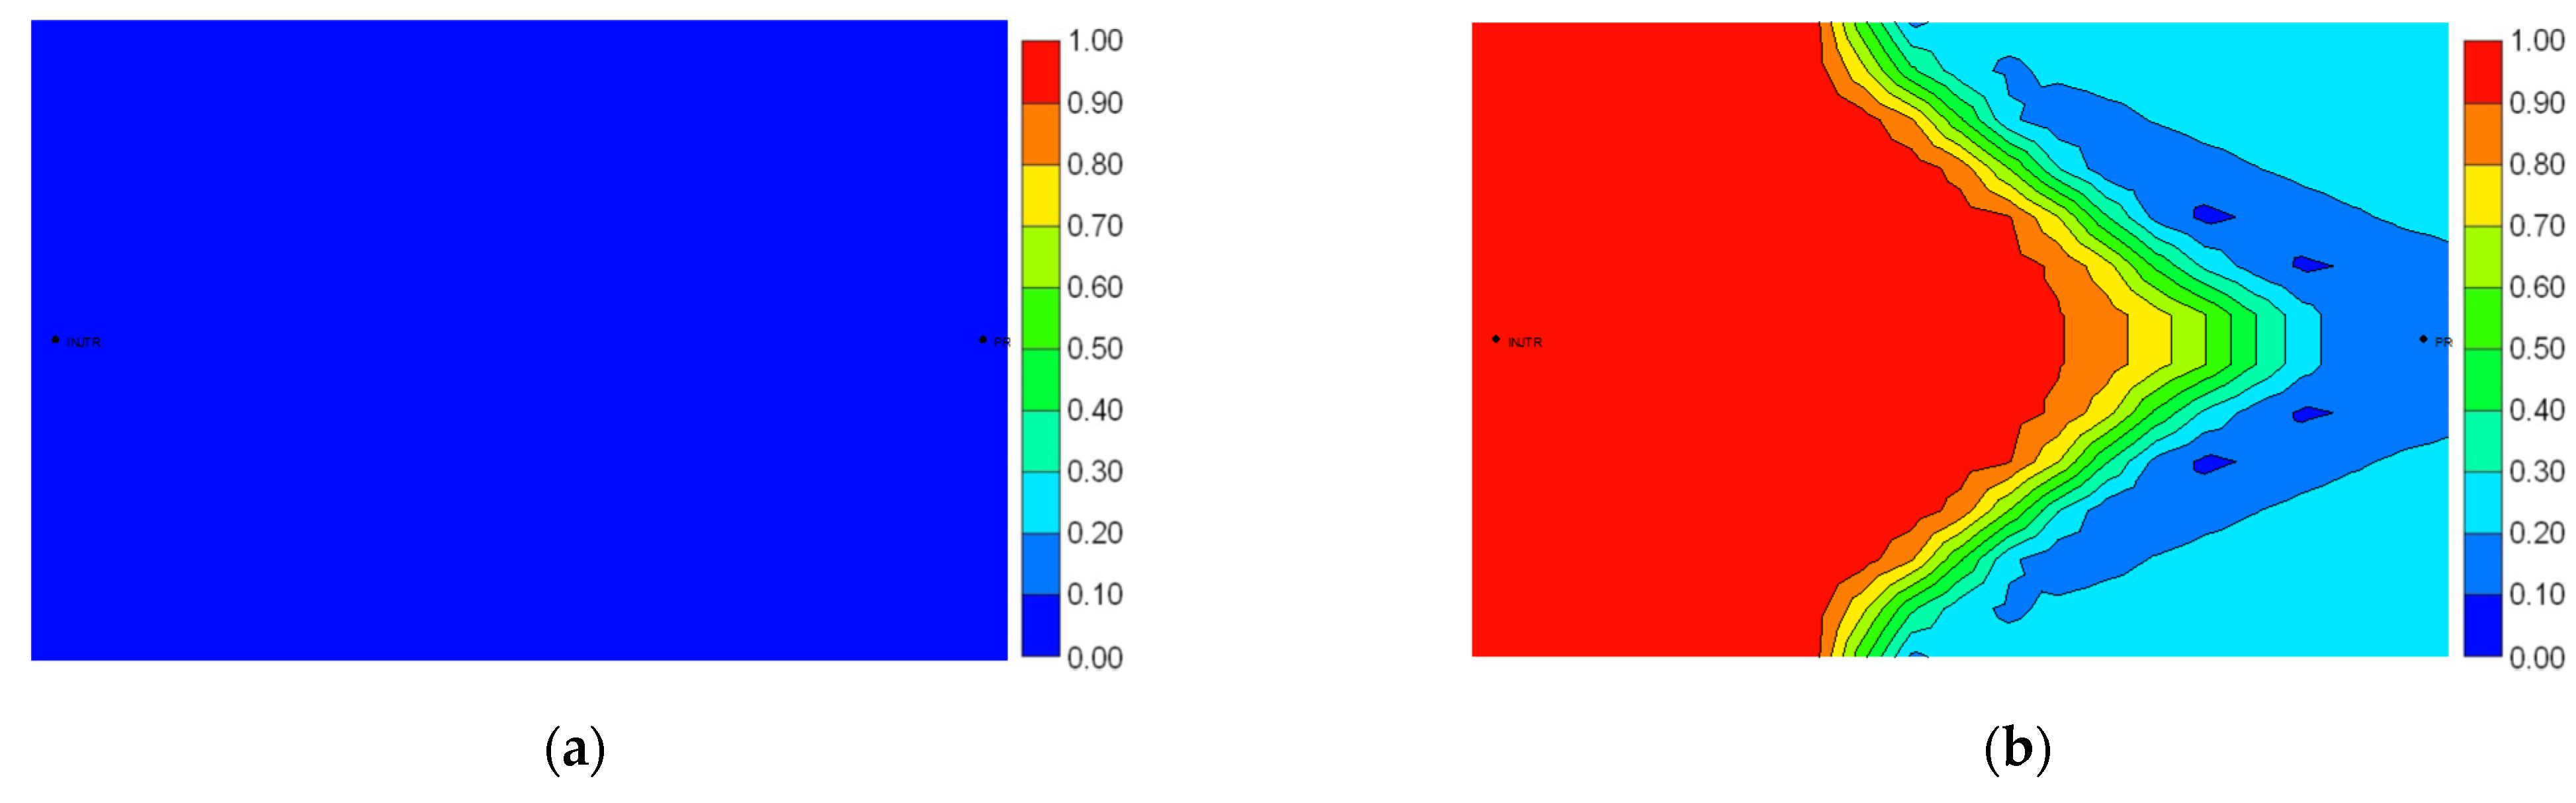
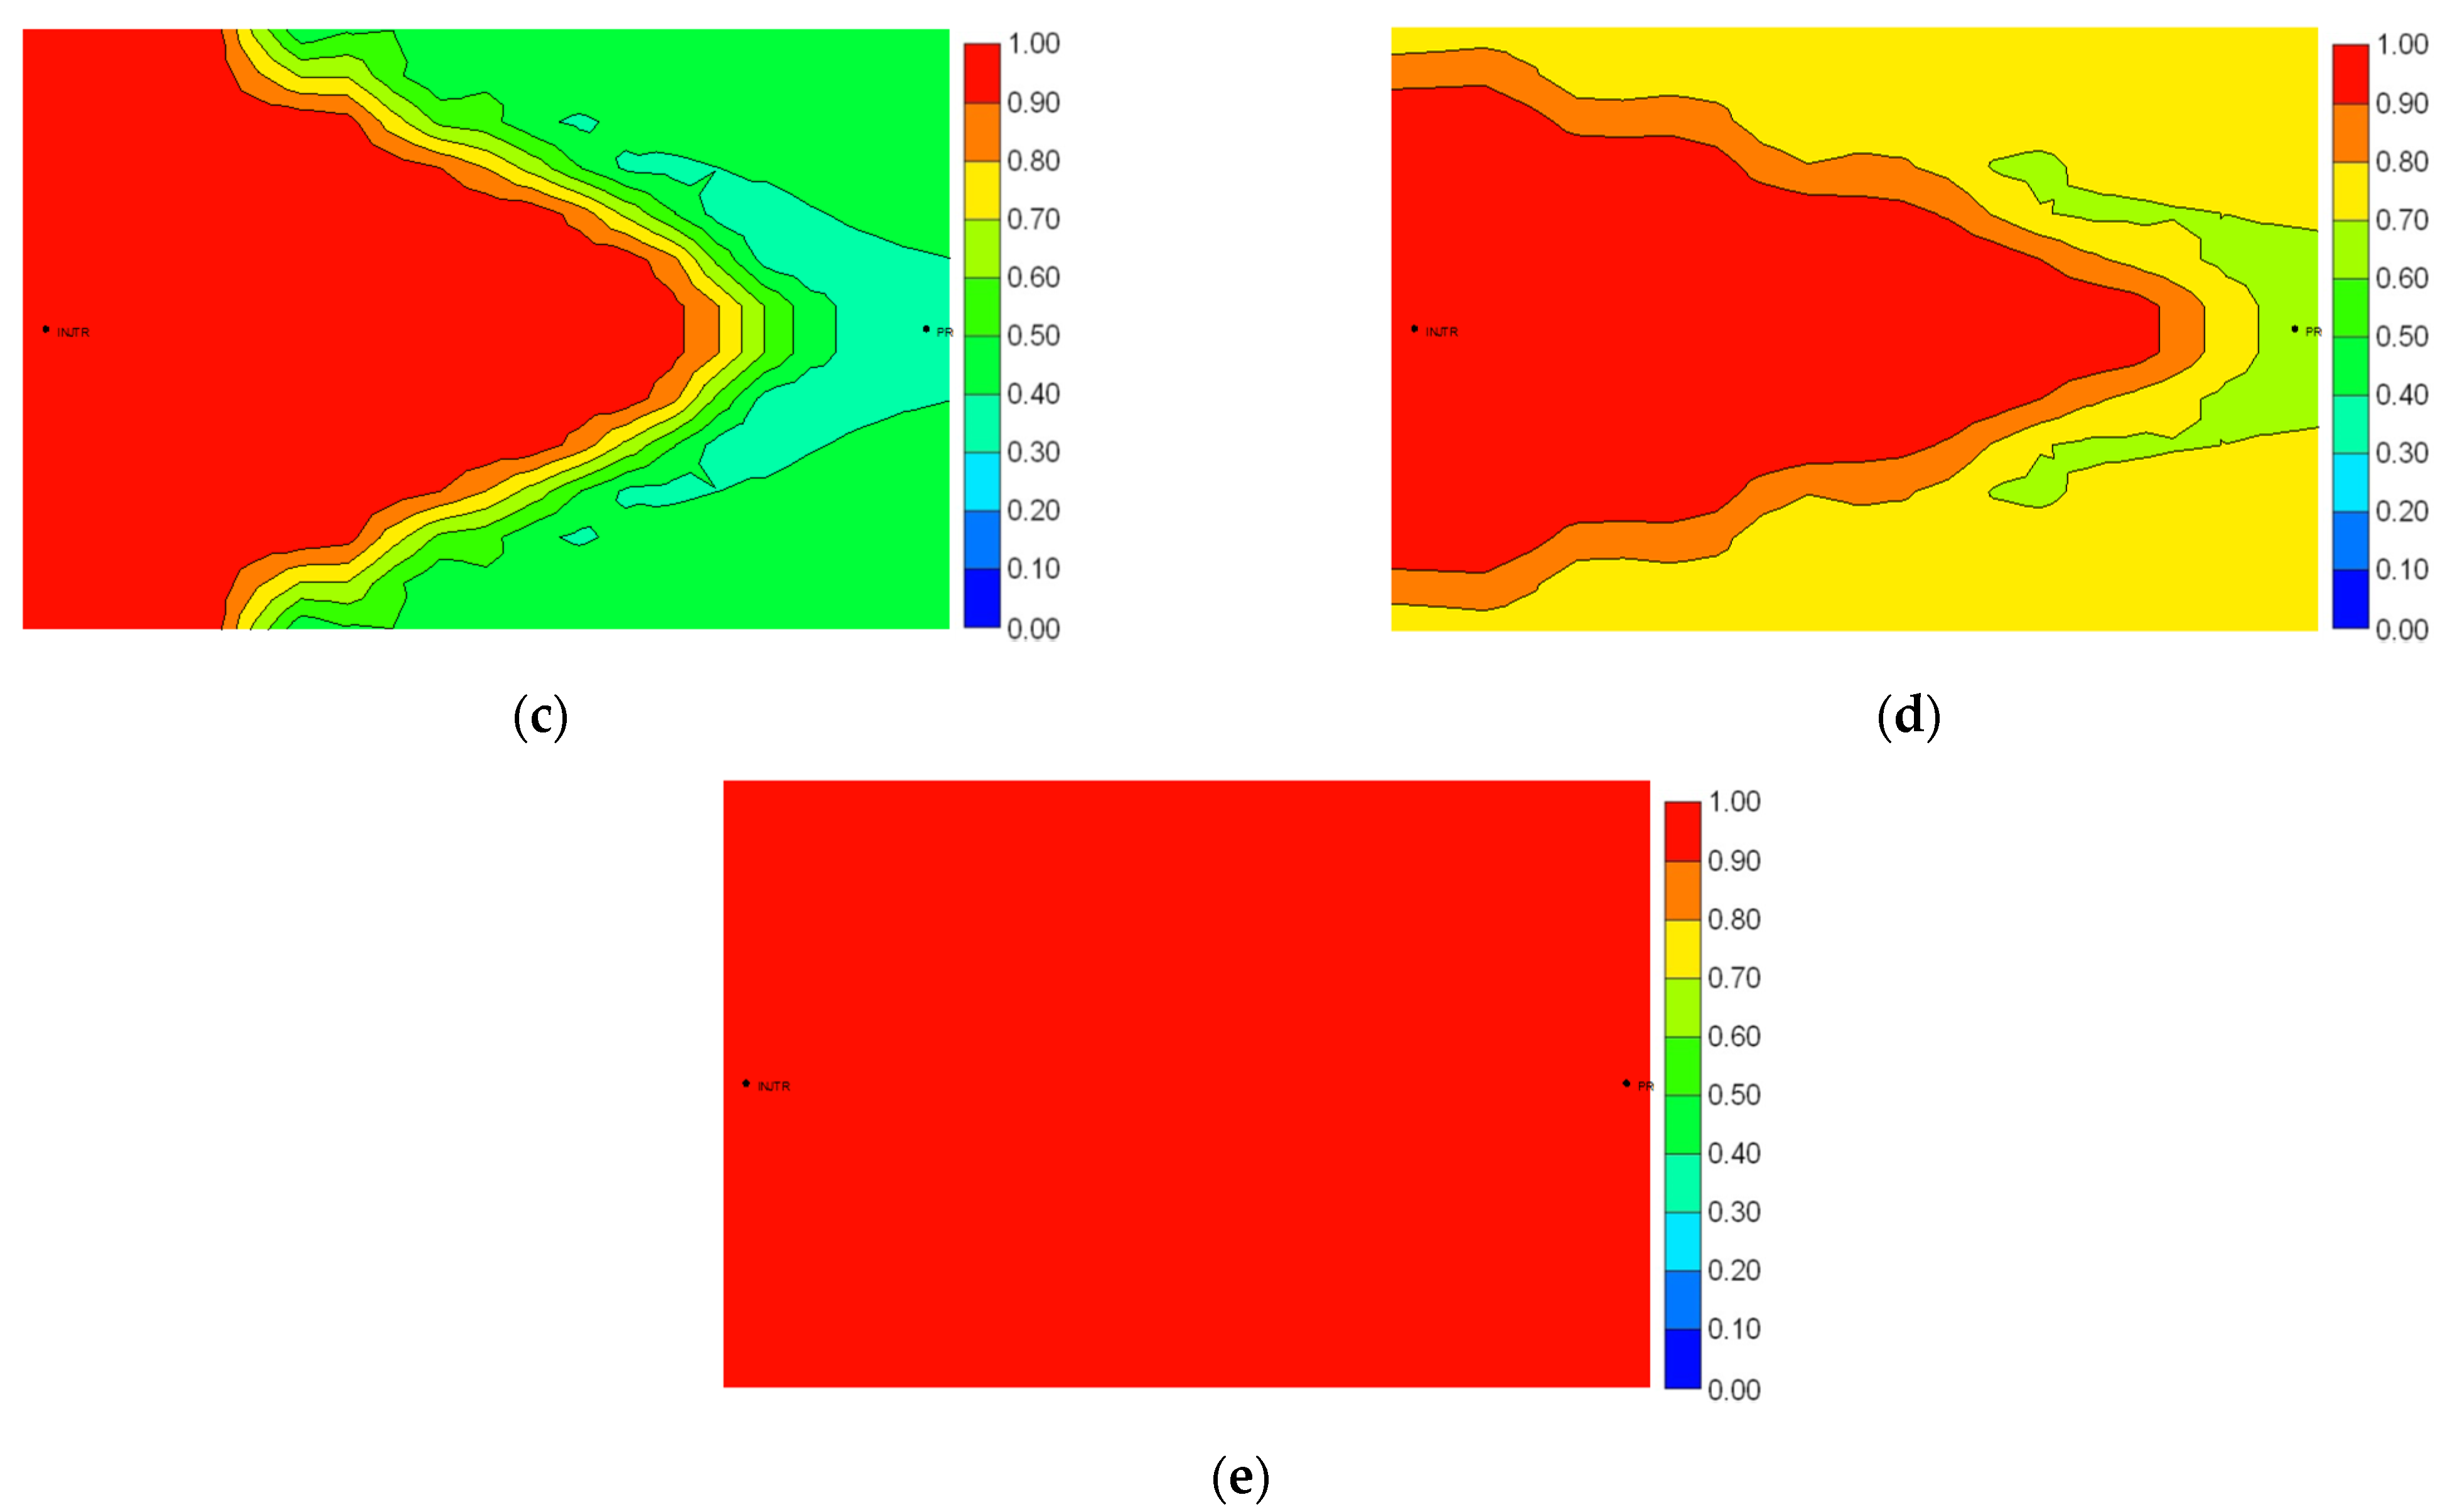
Figure 10 and Figure 11 show the distribution of oil saturation and the mass fraction of heavy component after steam flooding under different ratios of light component and heavy component, respectively. It can be seen from Figure 10 that with the increase of heavy component, the amount of remaining oil in the formation after steam flooding increases. This is because when the mass fraction of the light component in the crude oil is larger, the oil-water viscosity ratio is smaller, thus making the steam flooding have a large planar sweep area in the formation and therefore less oil remaining in the plane.
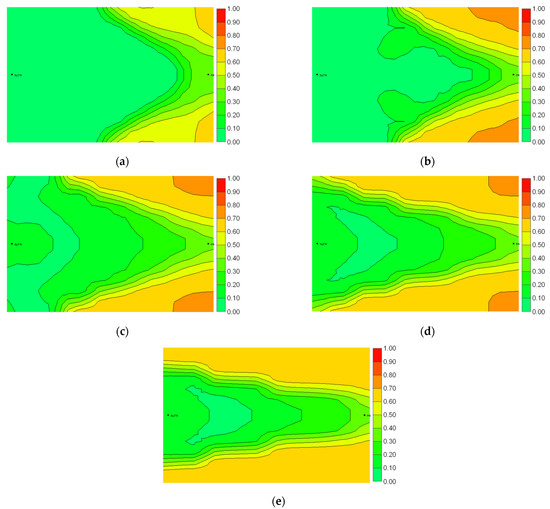
Figure 10.
Oil saturation distribution after steam flooding. (a) mass fraction of heavy components: 0. (b) mass fraction of heavy components: 0.25. (c) mass fraction of heavy components: 0.5. (d) mass fraction of heavy components: 0.75. (e) mass fraction of heavy components: 1.0.
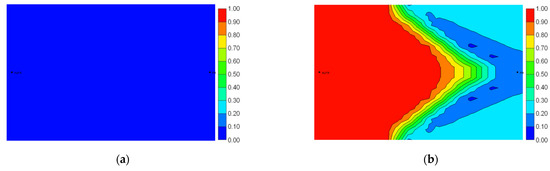

Figure 11.
Mass fraction distribution of heavy component after steam flooding. (a) mass fraction of heavy components: 0. (b) mass fraction of heavy components: 0.25. (c) mass fraction of heavy components: 0.5. (d) mass fraction of heavy components: 0.75. (e) mass fraction of heavy components: 1.0.
It can be seen from Figure 11 that as the initial mass fraction of heavy component in crude oil increases, the greater the mass fraction of heavy component in the formation after steam flooding, that is, the more the heavy component is retained. Moreover, in formations with less oil saturation, the remaining oil contains more heavy components; in formations with high oil saturation, the more heavy components remain after steam flooding, as the initial mass fraction of heavy components in crude oil increases.
3.3.2. Steam Injection Intensity
Steam was injected at steam injection intensities of 1.2, 1.4, 1.6 and 1.8 (m3/(d·m·ha) under the condition that the mass fraction of heavy components was 50% and the production-injection ratio is unchanged.
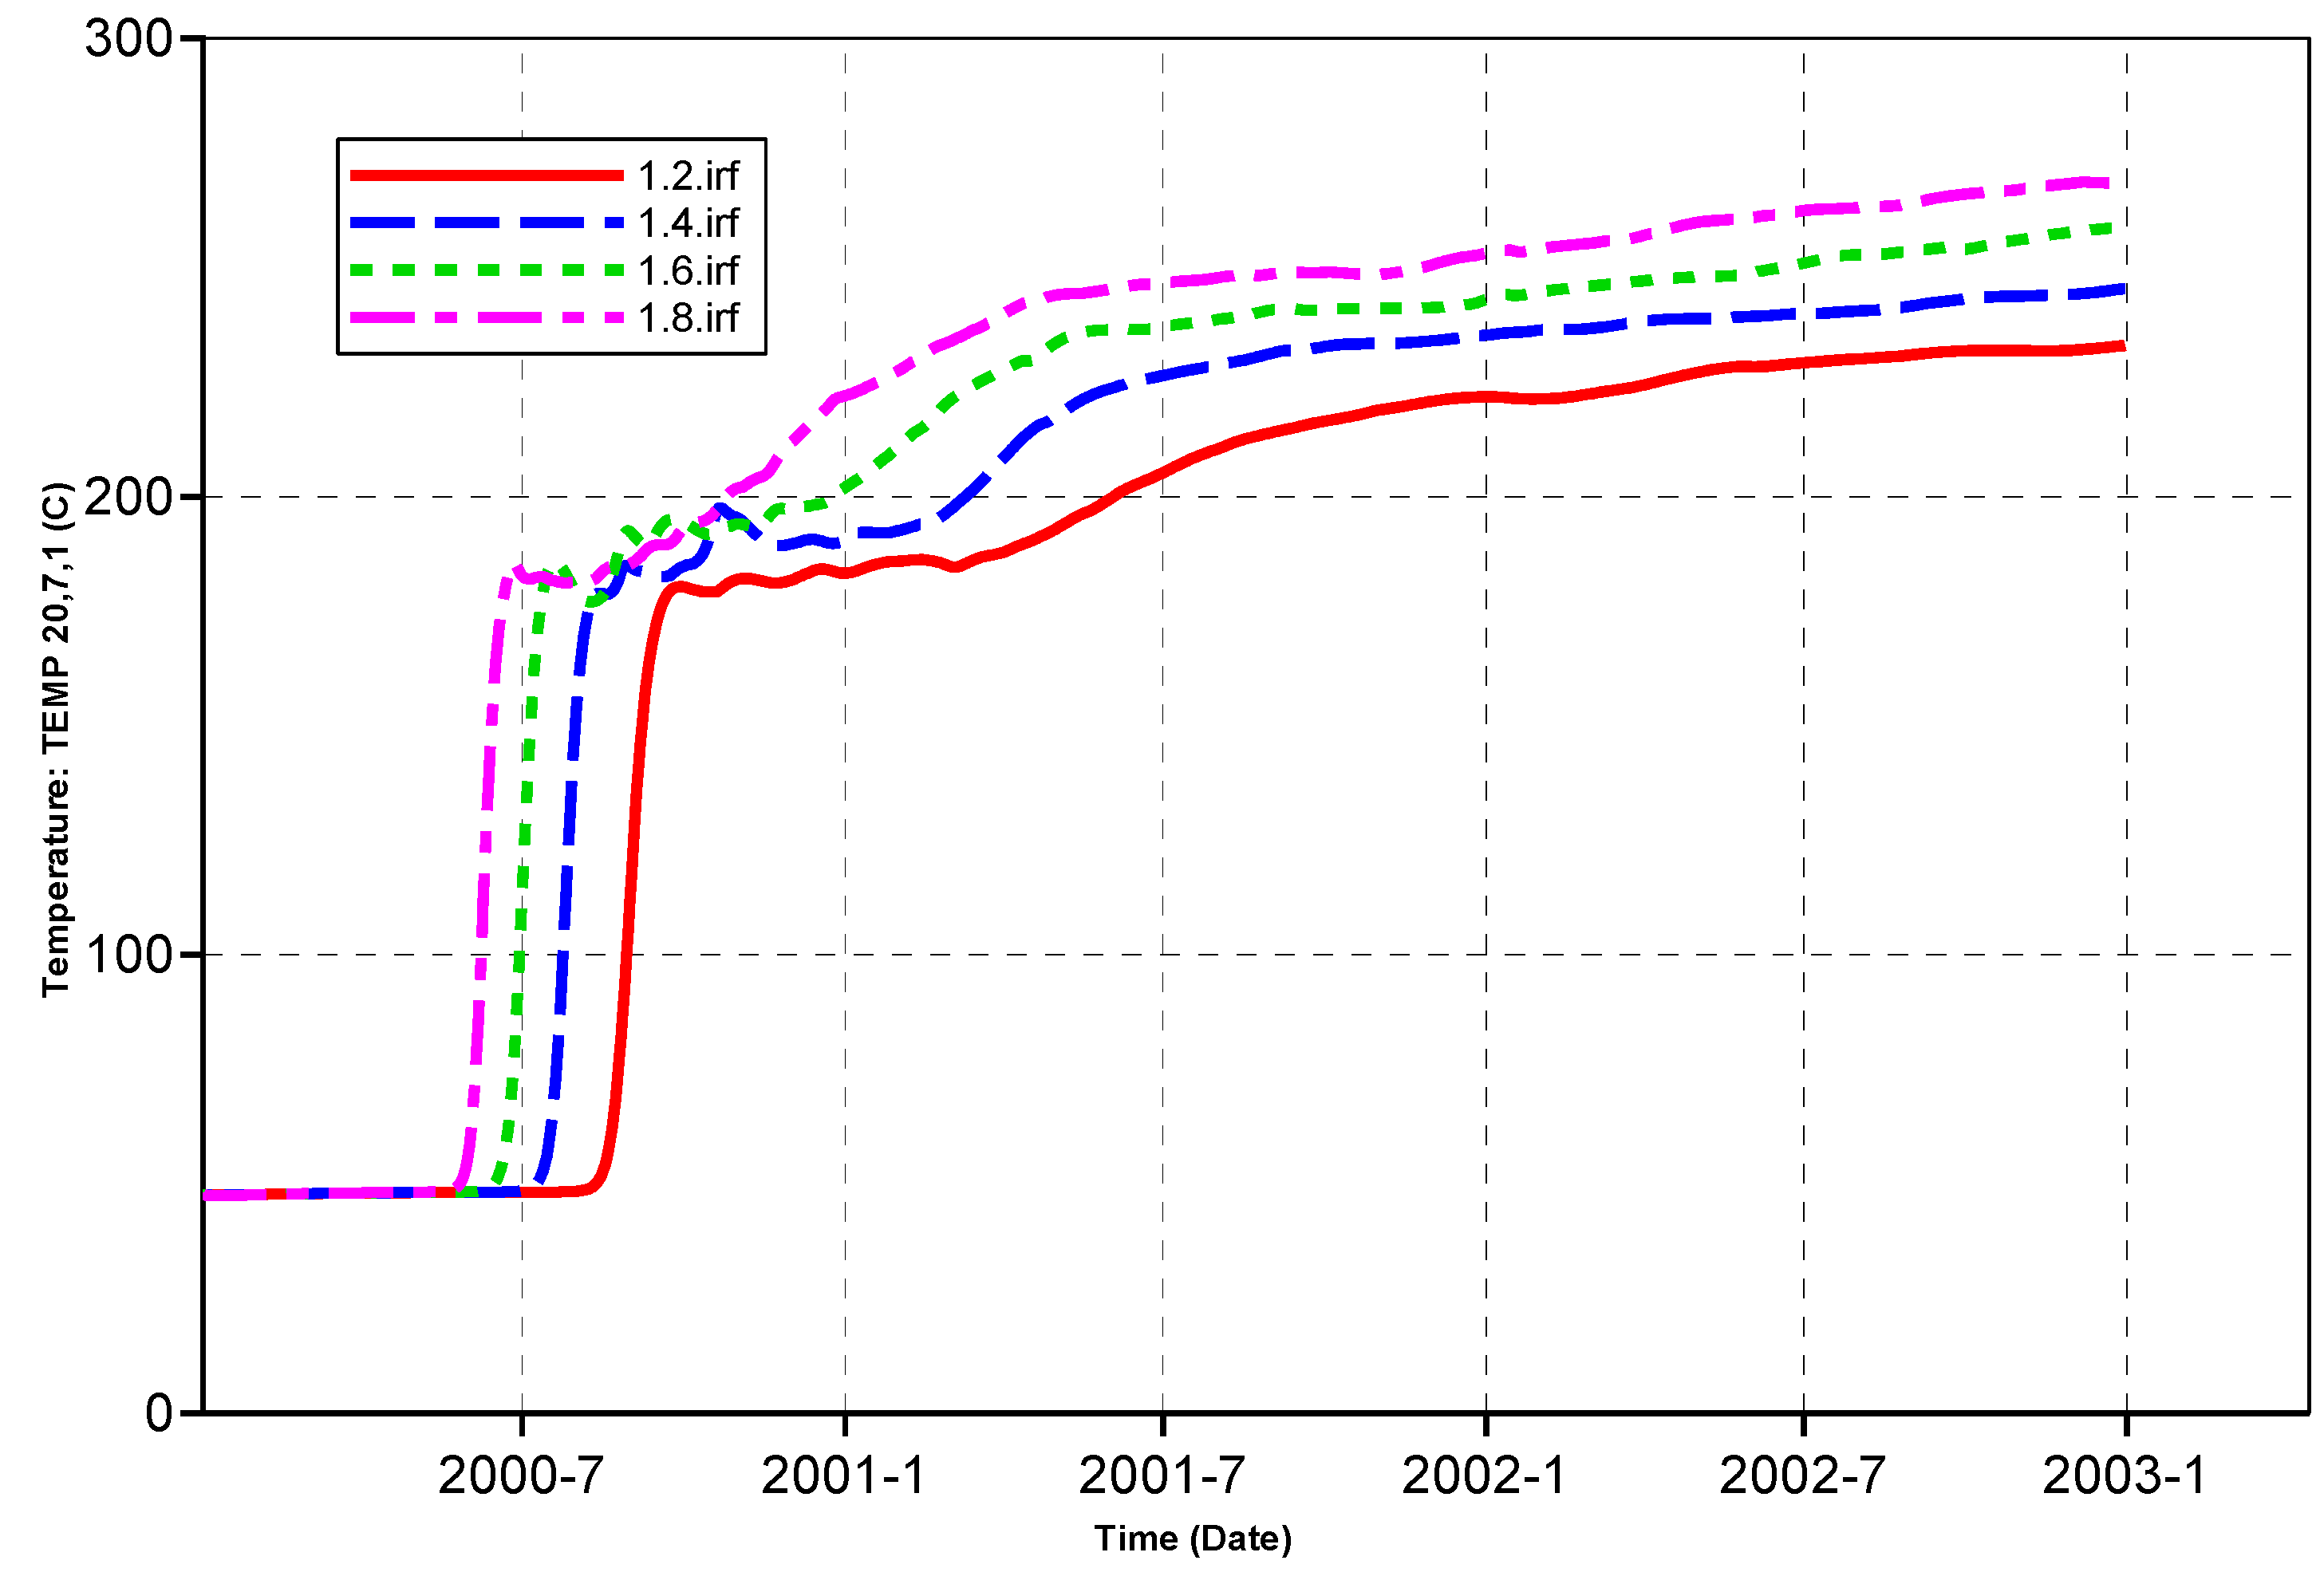
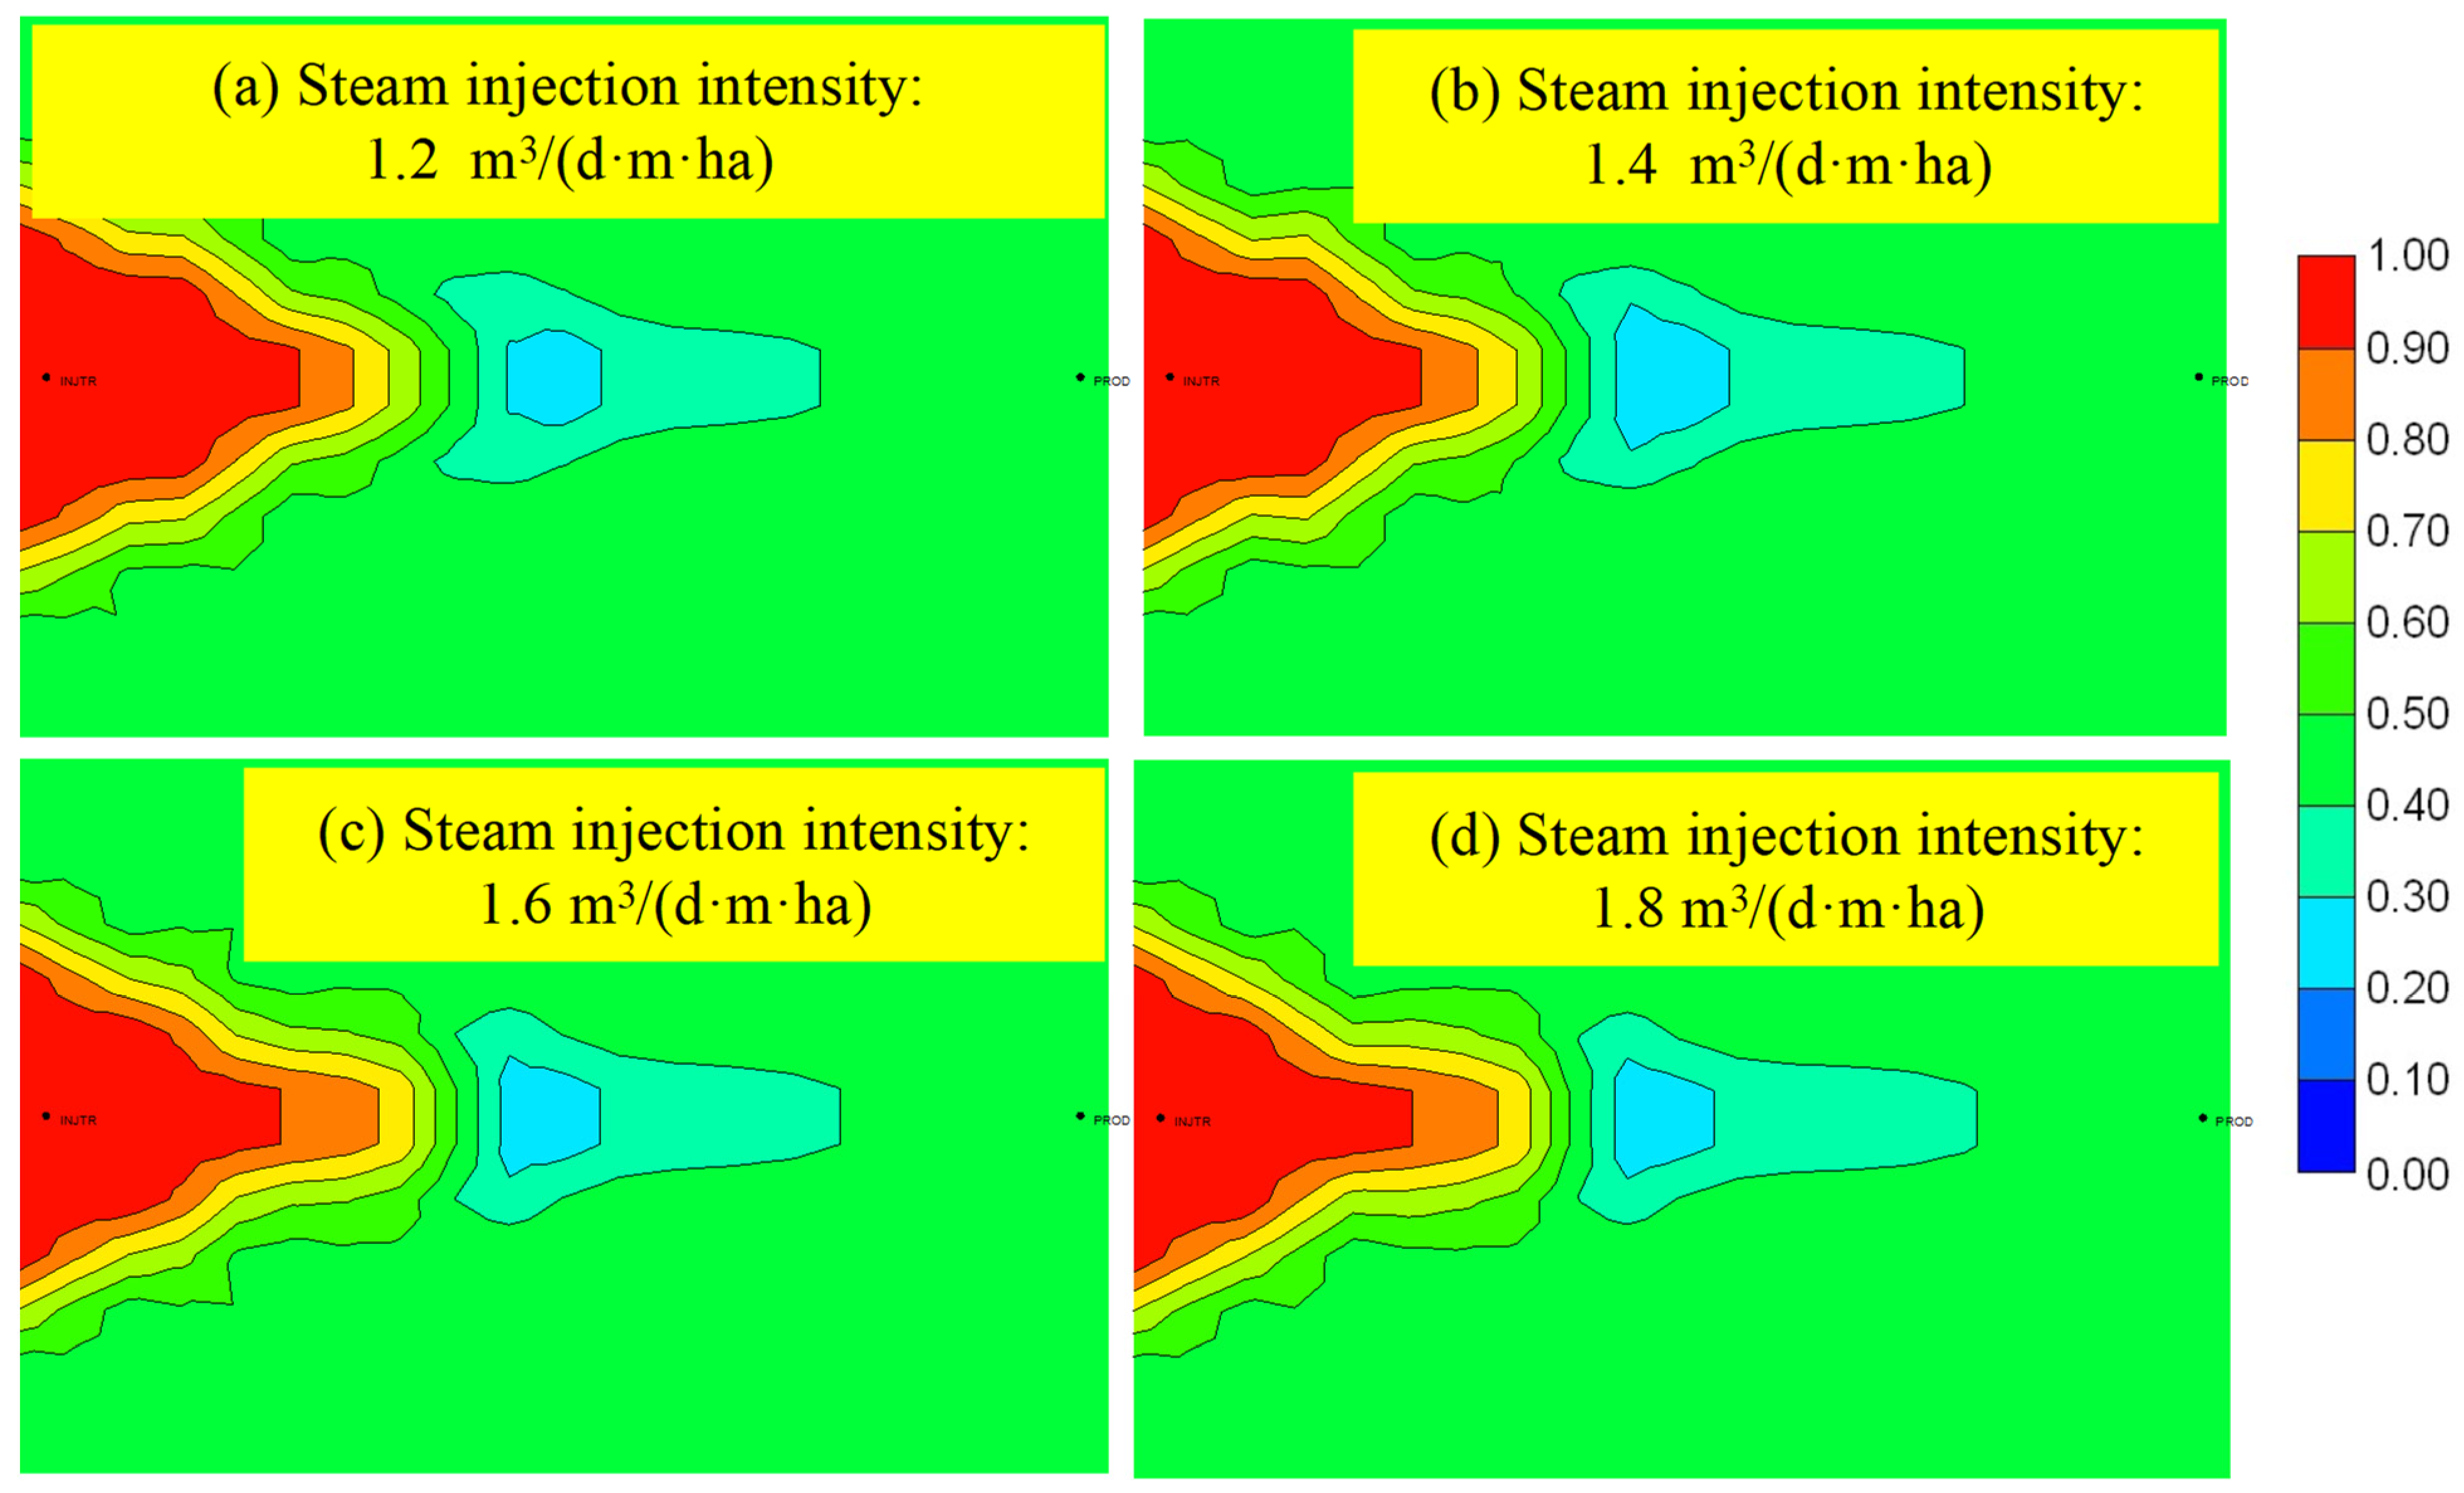
It can be seen from Figure 12 that the greater the steam injection intensity, the shorter the time to see steam breakthrough in the production well. Figure 13 shows the cumulative oil production of the wells at the time of steam breakthrough under the four steam injection intensities. We can find that the cumulative oil production of the wells increases with the increase of the steam injection intensity, but decreases after the steam injection intensity reaches 1.6 m3/(d·m·ha). Therefore, the cumulative oil production is the highest at the time of steam breakthrough with a steam injection intensity of 1.6 m3/(d·m·ha).
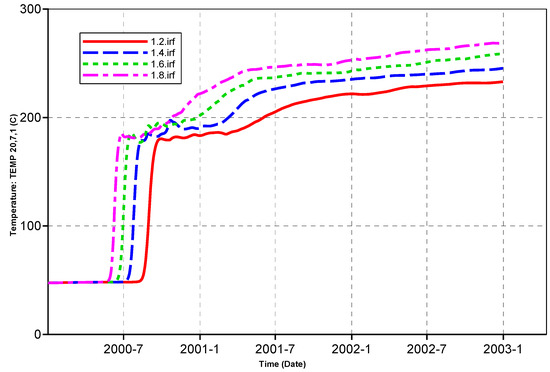
Figure 12.
The change of temperature of the well head of production well.
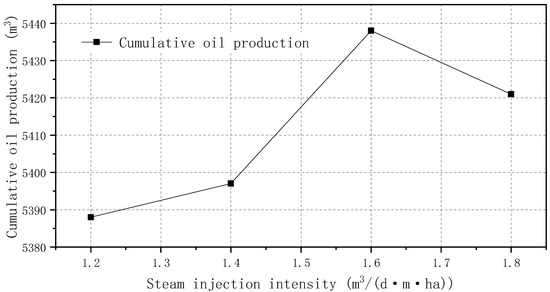
Figure 13.
Cumulative oil production at different steam injection intensity.
It can be seen from Figure 14 that the mass fraction distribution of heavy components retained in the formation did not change much with increasing steam injection intensity with steam breakthrough in the production well, that is, different steam injection intensities have little effect on the retention of heavy components.
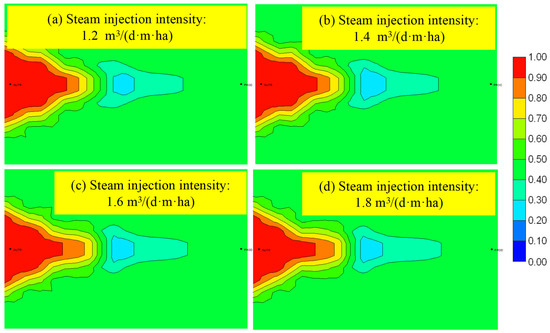
Figure 14.
Mass fraction distribution of heavy component.
4. Numerical Simulation of Reservoir rock Physical Properties Change
After long-term thermal injection development, it is easy to form breakthrough channel in the formation, due to the increase in the pore radius and permeability of the formation [23,24,25]. When the steam flows along the breakthrough channel in the formation, the thermal efficiency of the steam is low and the thermal sweep range is small. The inefficient or ineffective circulation of steam along the breakthrough channel seriously affects the oil displacement efficiency of the steam flooding. Therefore, it is necessary to study the physical property changes of reservoir rocks after steam flooding, mainly focusing on the changes of rock porosity and permeability, and the factors leading to the changes of rock physical properties after steam flooding [26,27,28,29].
4.1. Numerical Simulation Model
The average geological parameters of the steam flooding pilot test well group in the Qi40 block of the Liaohe oilfield are selected to establish a homogeneous geologic mode. The buried depth in the middle of the reservoir is 900 m, the well spacing is 140 m, the porosity is 27% and the permeability is 1500 × 10−3 μm2. In the model, the following crude oil viscosity-temperature curve was used to analyze the influence of crude oil viscosity on the thermal recovery effect.
The STARS module of the CMG software was applied to establish a model with a grid number of 20 × 13 × 5. The grid step is 7 m in X and Y directions and 4 m in Z direction, and the well spacing is 140 m. The geological model was established to simulate steam huff and puff and then steam flooding. The distribution characteristics and influencing factors of rock physical property changes after steam flooding were studied. In the steam flooding stage, there is a steam injection well and a production well, the steam temperature is 300 °C, the steam dryness is 0.6, the steam injection intensity is 1.6 m3/ha/m/d, and the production-injection ratio is 1.2; the viscosity-temperature relationship of the heavy oil is shown in Table 5.
Table 5.
Viscosity-temperature relationship [30].
4.2. Changes in Reservoir Physical Properties after Steam Flooding
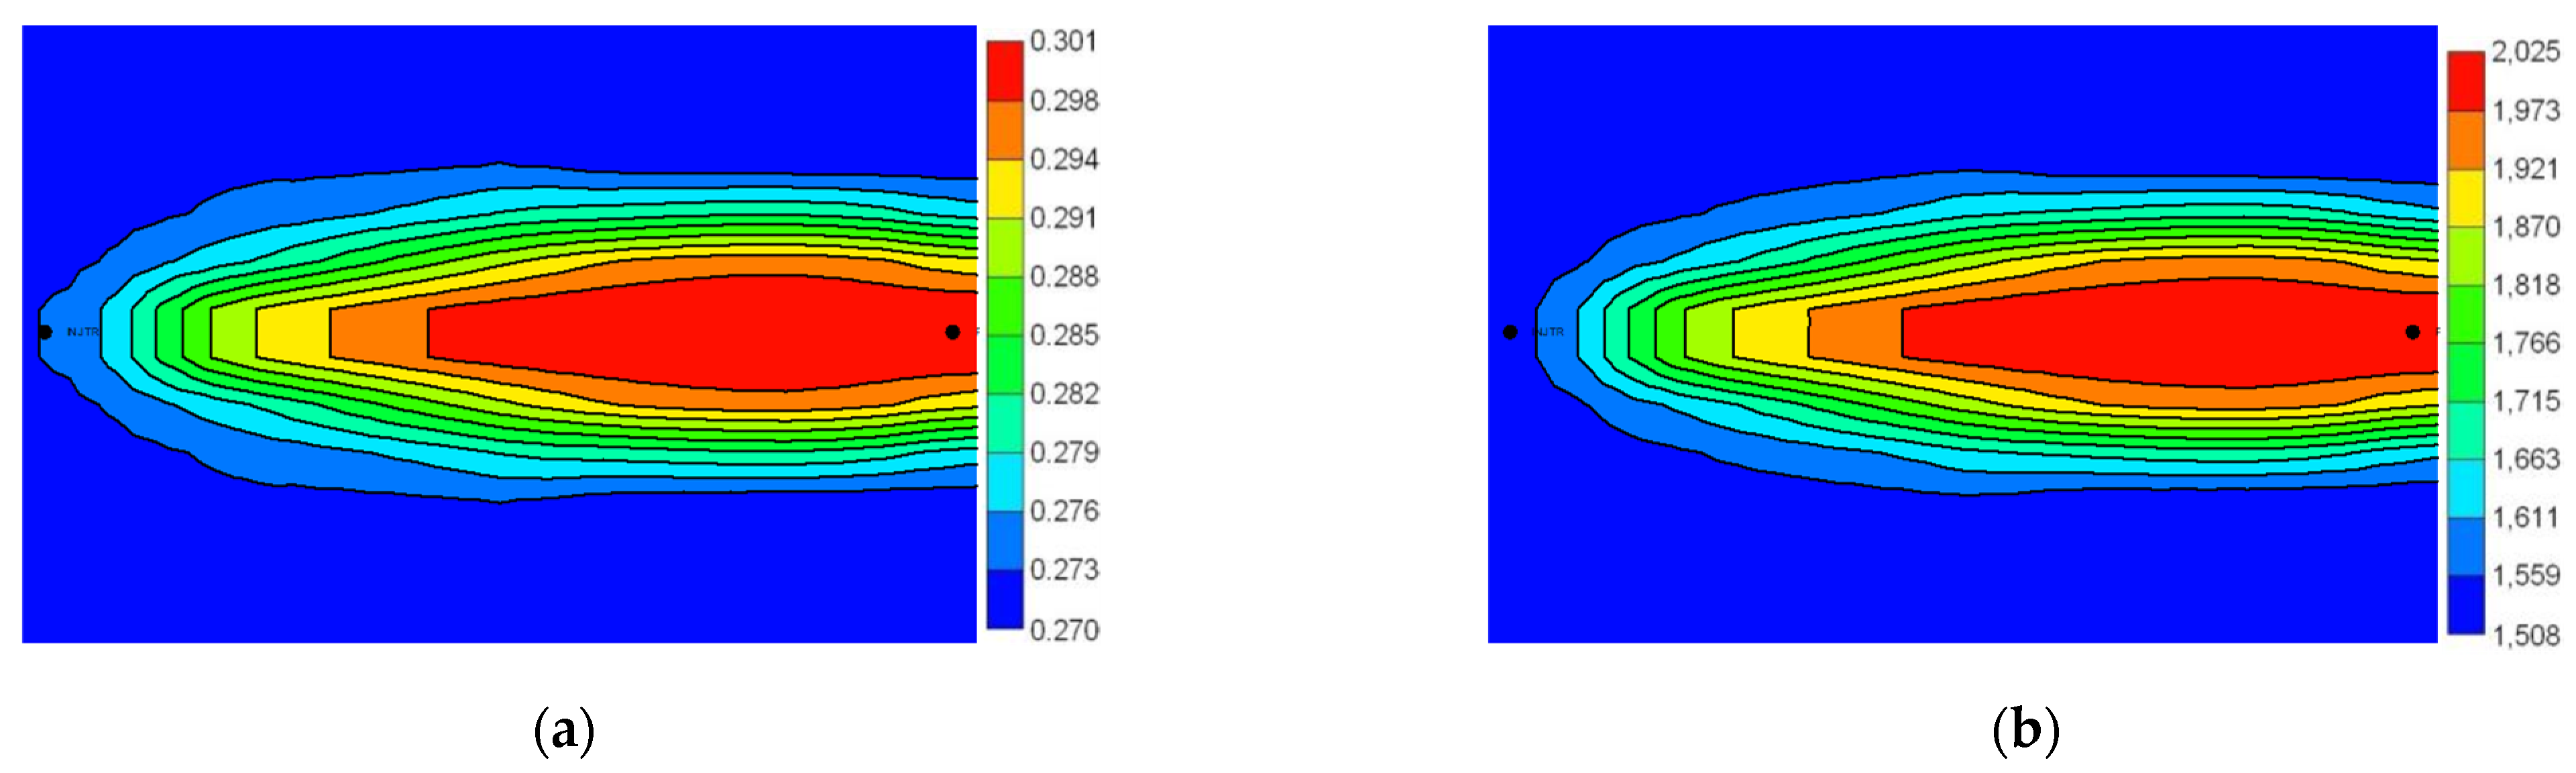
The porosity and permeability changes of a steam injection well and a production well in homogeneous heavy oil reservoir were studied to summarize and analyze the changes of reservoir physical properties during the steam flooding stage. Figure 15 shows the distribution of porosity and permeability between the two wells after steam flooding. It can be seen that a high permeability zone was formed between the two wells due to factors such as sand production.
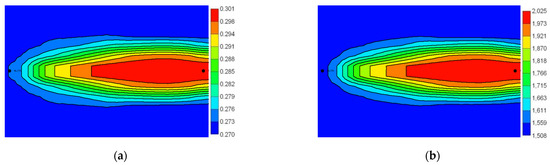
Figure 15.
Physical property distribution between two wells after steam flooding. (a) Porosity distribution; (b) permeability distribution.
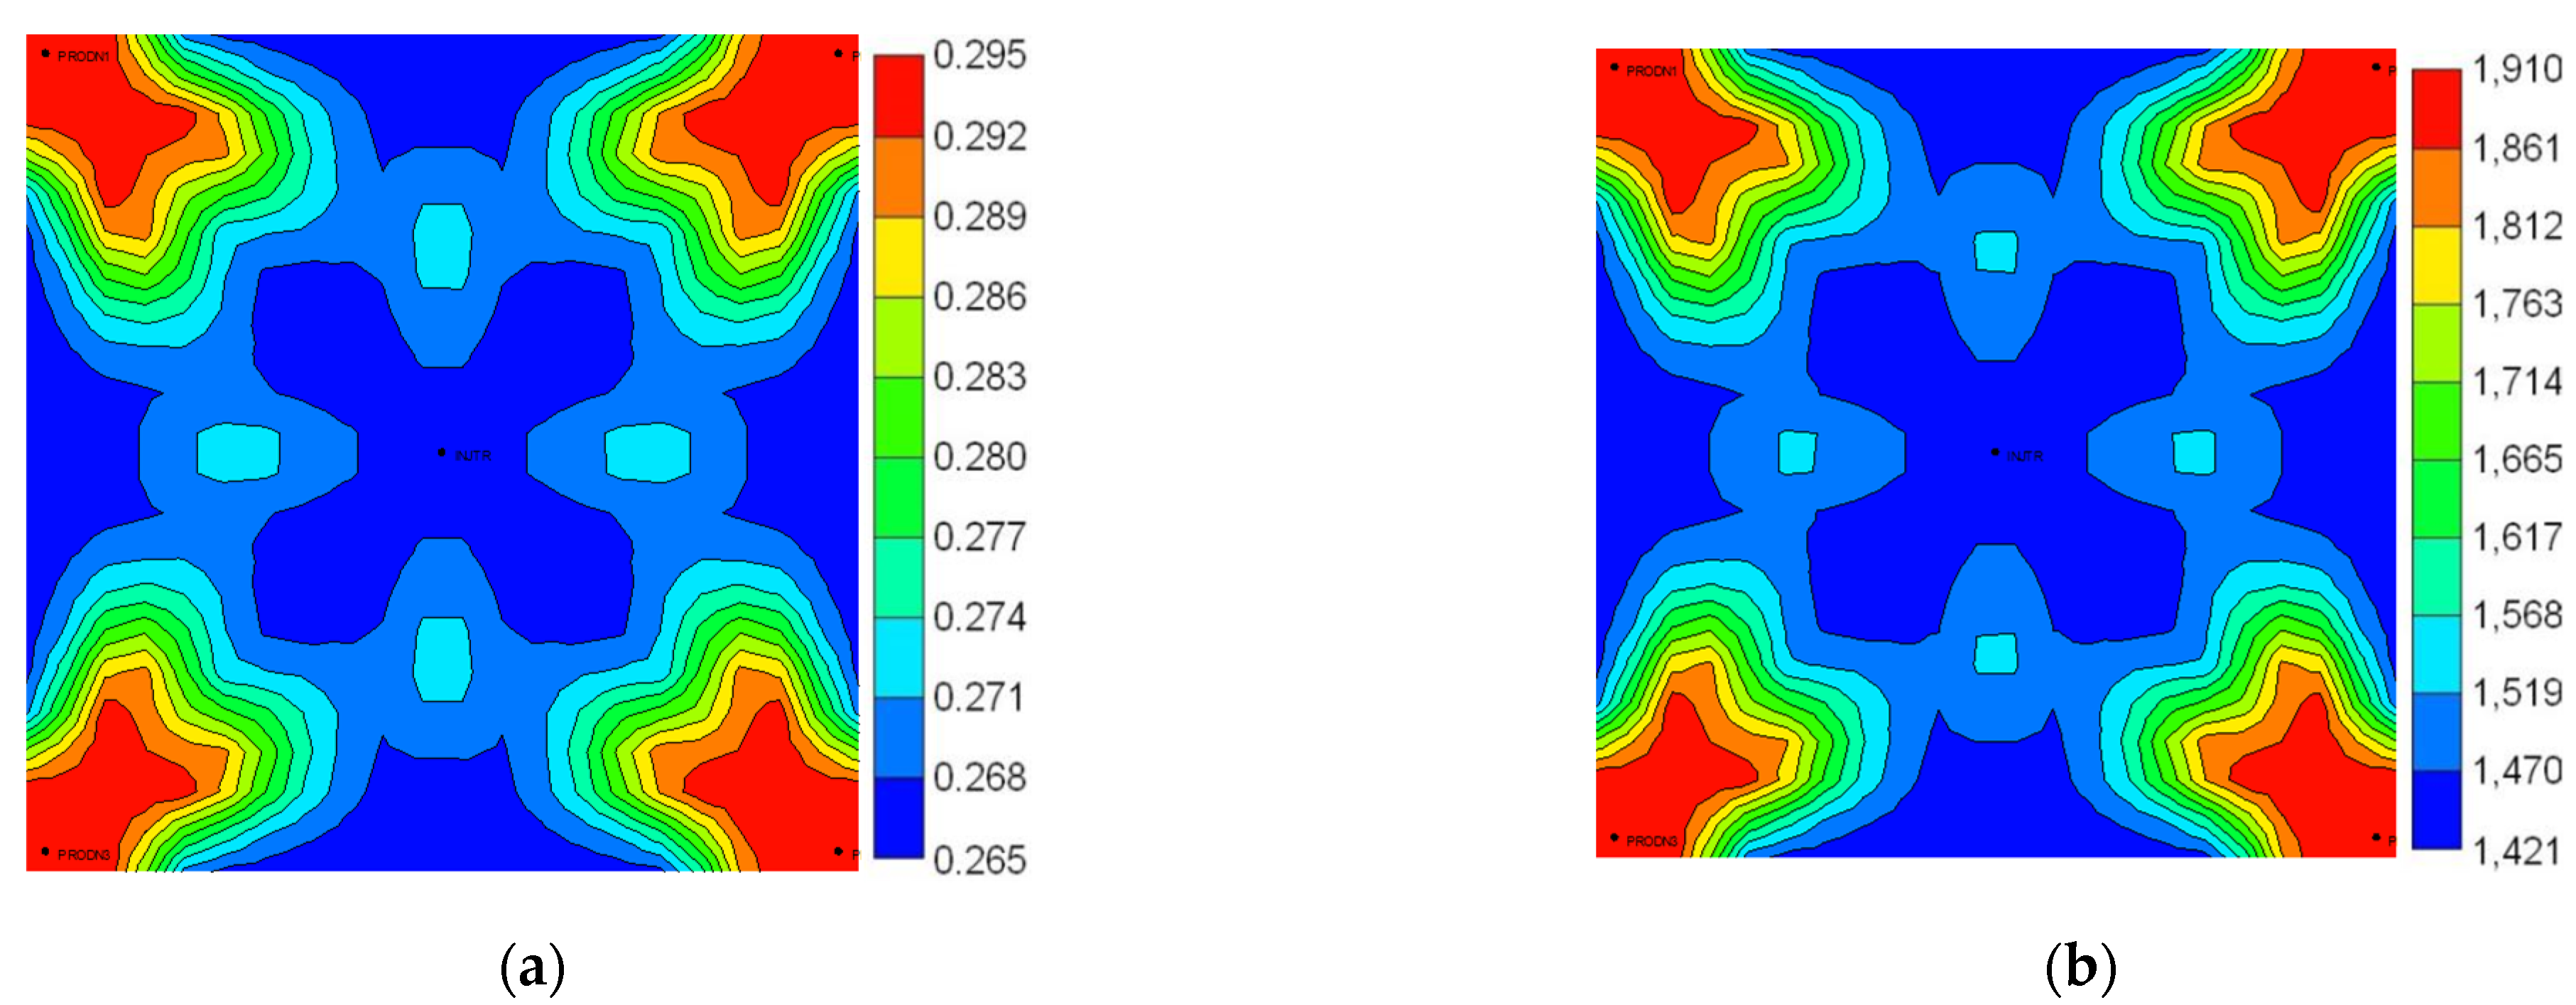
Meanwhile, we established a numerical model to study the changes of porosity and permeability in the injection-production system of five-spot well pattern, as shown in Figure 16. The center well is a steam injection well and the corner wells are oil production wells. After steam flooding, the porosity and permeability between the injection and production wells become larger, which makes it easy to form cross-flow between the wells.

Figure 16.
Physical property distribution in 5-spot well pattern after steam flooding. (a) Porosity distribution; (b) permeability distribution.
4.3. Results and Analysis
In the absence of inter-well high permeability zones or natural fractures, it is difficult to form steam breakthrough during the steam huff and puff stage. However, in the steam flooding stage, due to the continuous steam injection, the thermal front is continuously advancing from the injection well to the production well, which improves the plane sweep volume of the steam flooding. At the same time, due to the heterogeneity of formation, steam breakthrough occurs when the thermal front reaches the production well along the formation with less resistance.
4.3.1. Effect of Cementation Degree
The degree of cementation is determined by the change rate of porosity and the relationship between porosity and permeability. The larger the value of the cementation degree, the faster the change rate of porosity and the greater the change of permeability, and the weaker the degree of cementation.
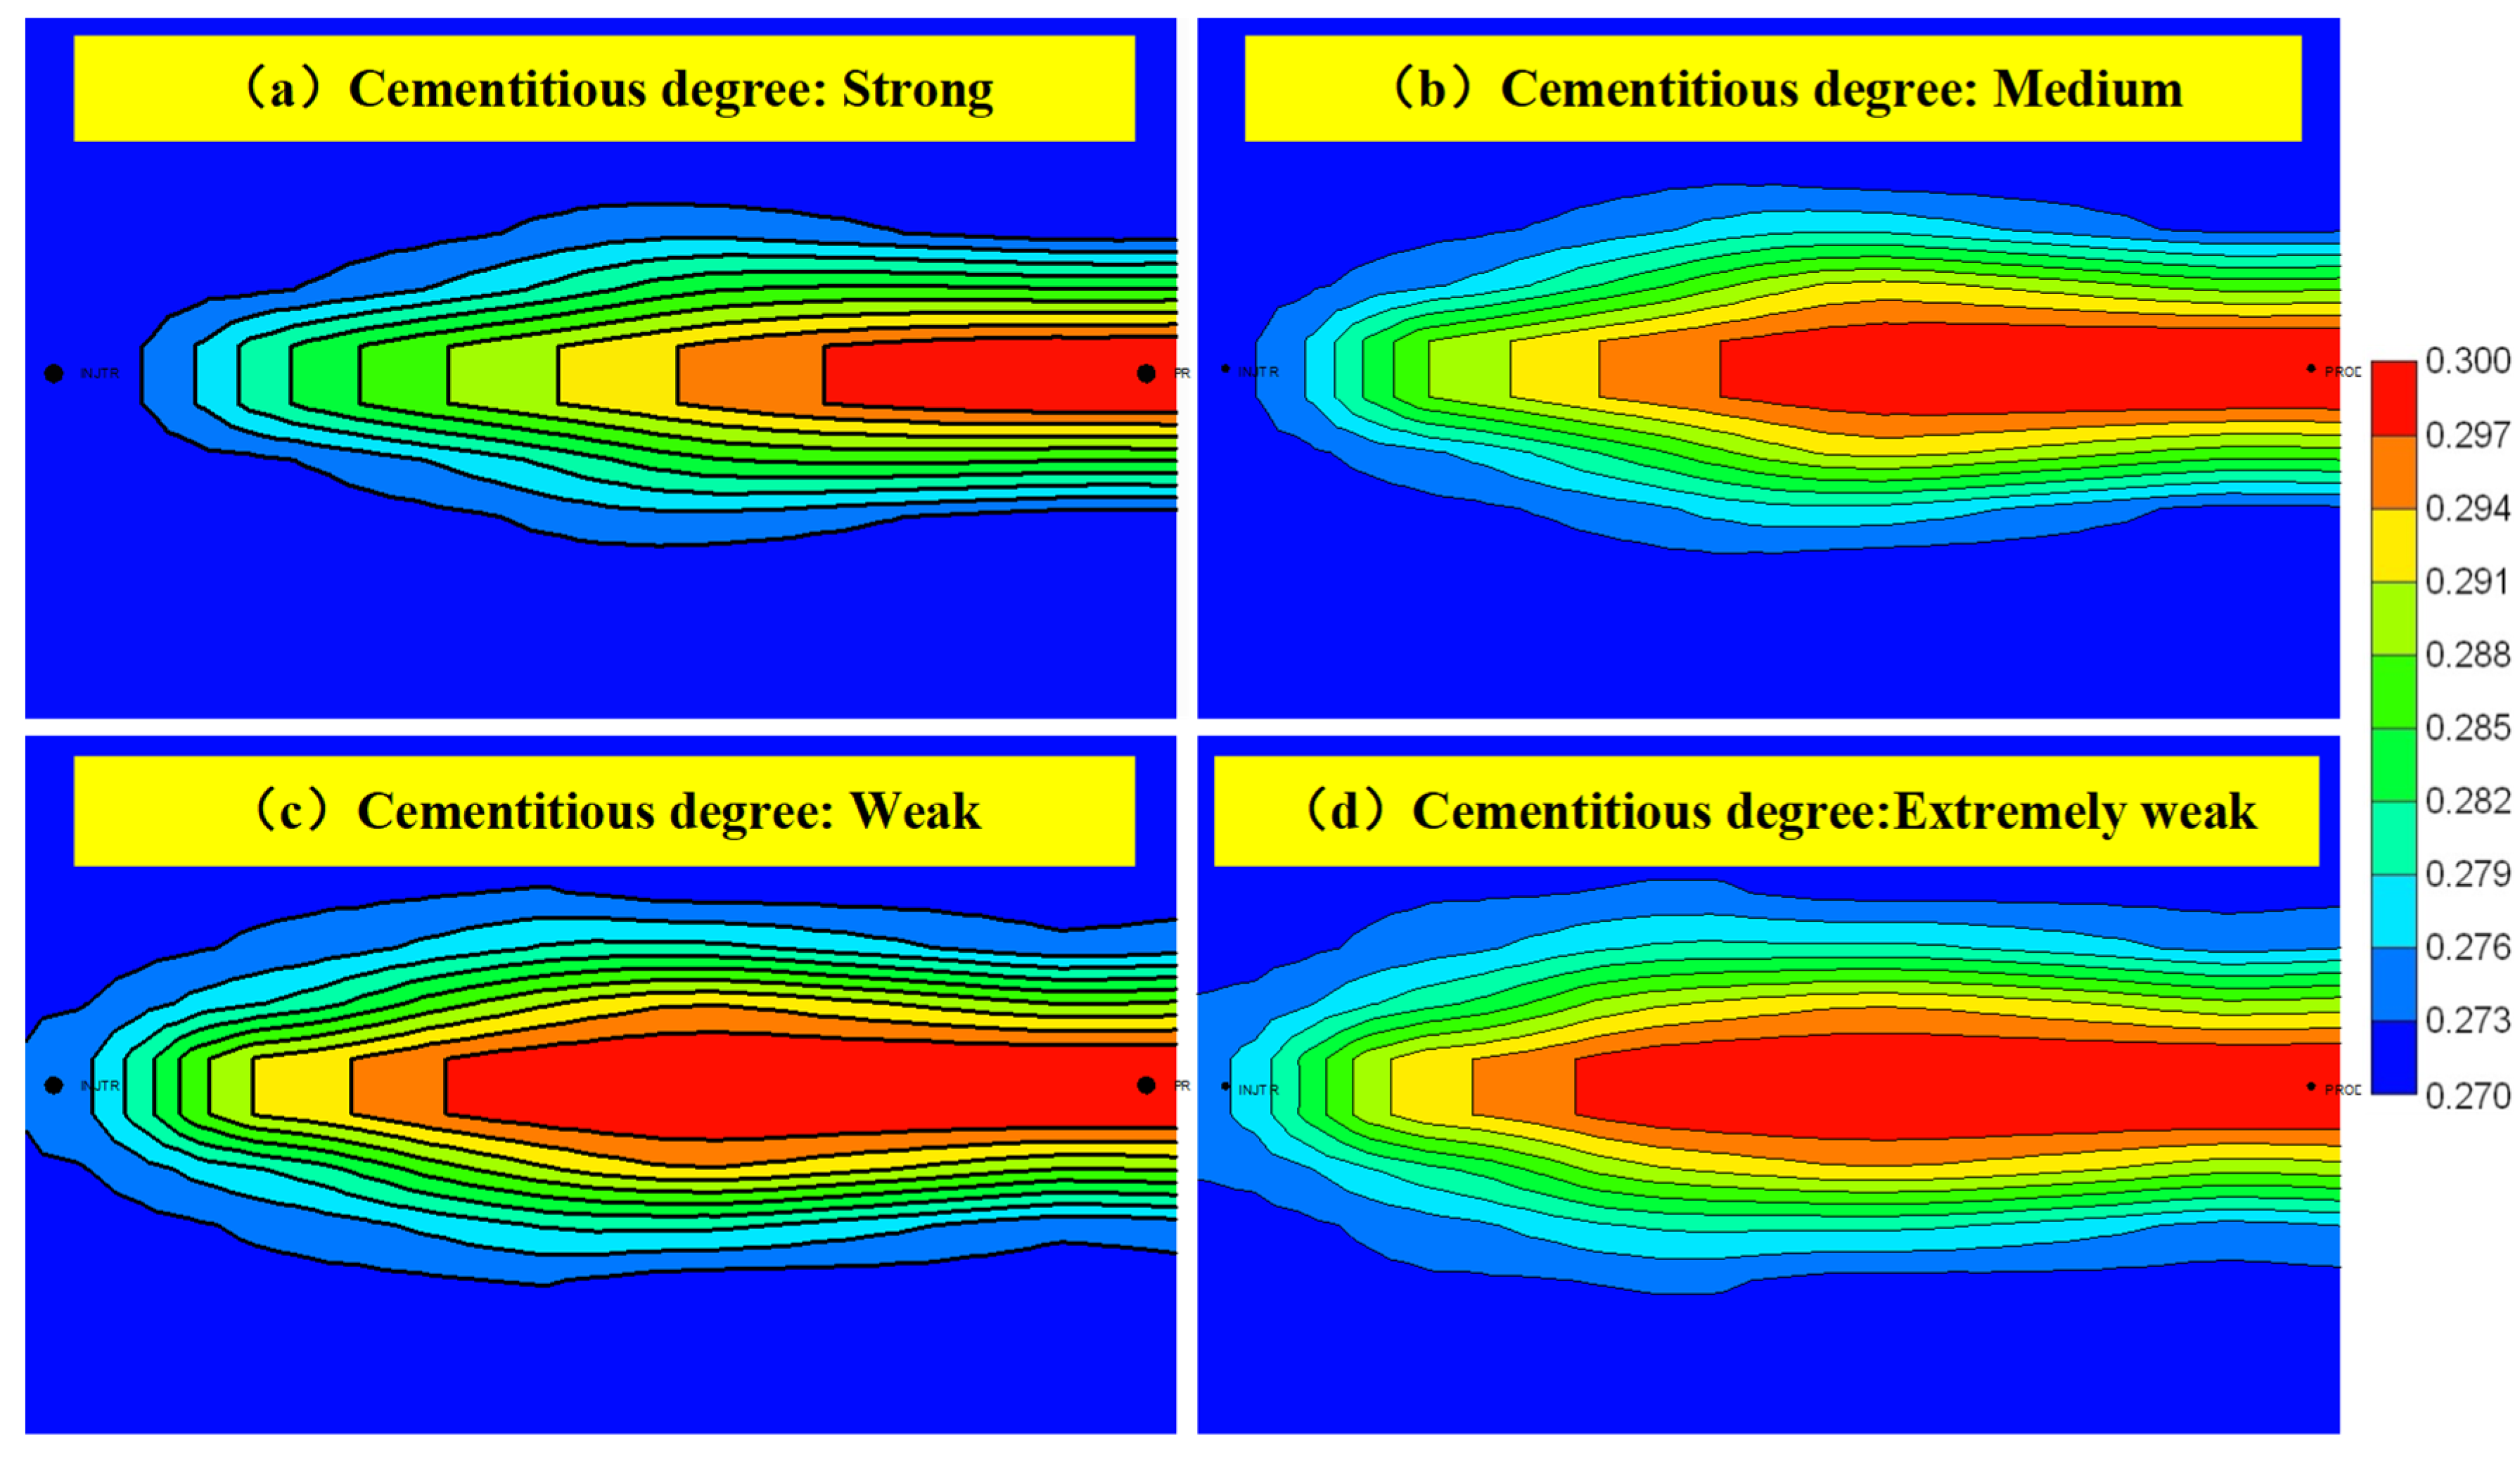
The porosity changes of formations with different degrees of cementation after steam flooding are shown in Figure 17. It can be seen that the stronger the degree of cementation, the less sand production, and the porosity changes in a small range; however, formations with a weak degree of cementation has serious sand production, and the range of porosity changes is large. The porosity of formation affected by steam between the two wells becomes larger in different degrees, and the porosity of formation around the production well changes to a greater extent than that around the steam injection well.
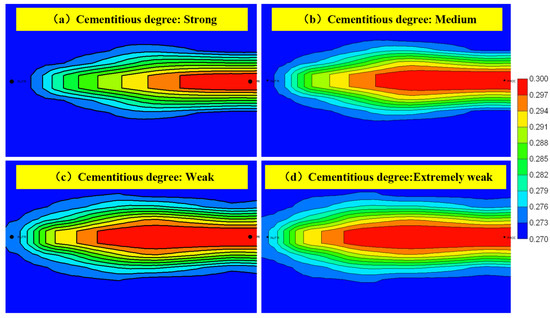
Figure 17.
Porosity distribution after steam flooding at different cementation degrees.
Heavy oil formations often show the characteristics of high permeability, high porosity and weak cementation. The clay minerals, siliceous minerals, aluminum and boron minerals and other cementation minerals in heavy oil formations will change under high temperature or alkali liquor. The structure, distribution and occurrence of clay minerals will be damaged. Silica, aluminum and boron minerals will be dissolved. The aquathermolysis reaction will cause the non-expansive clay to transform into expansive clay, which will provide a basis for the increase of porosity to a certain extent [31,32,33]. Therefore, both high-temperature steam and alkalinity will affect porosity, while loosely cemented formation is more susceptible to temperature and alkalinity in terms of mineral type and contact area.
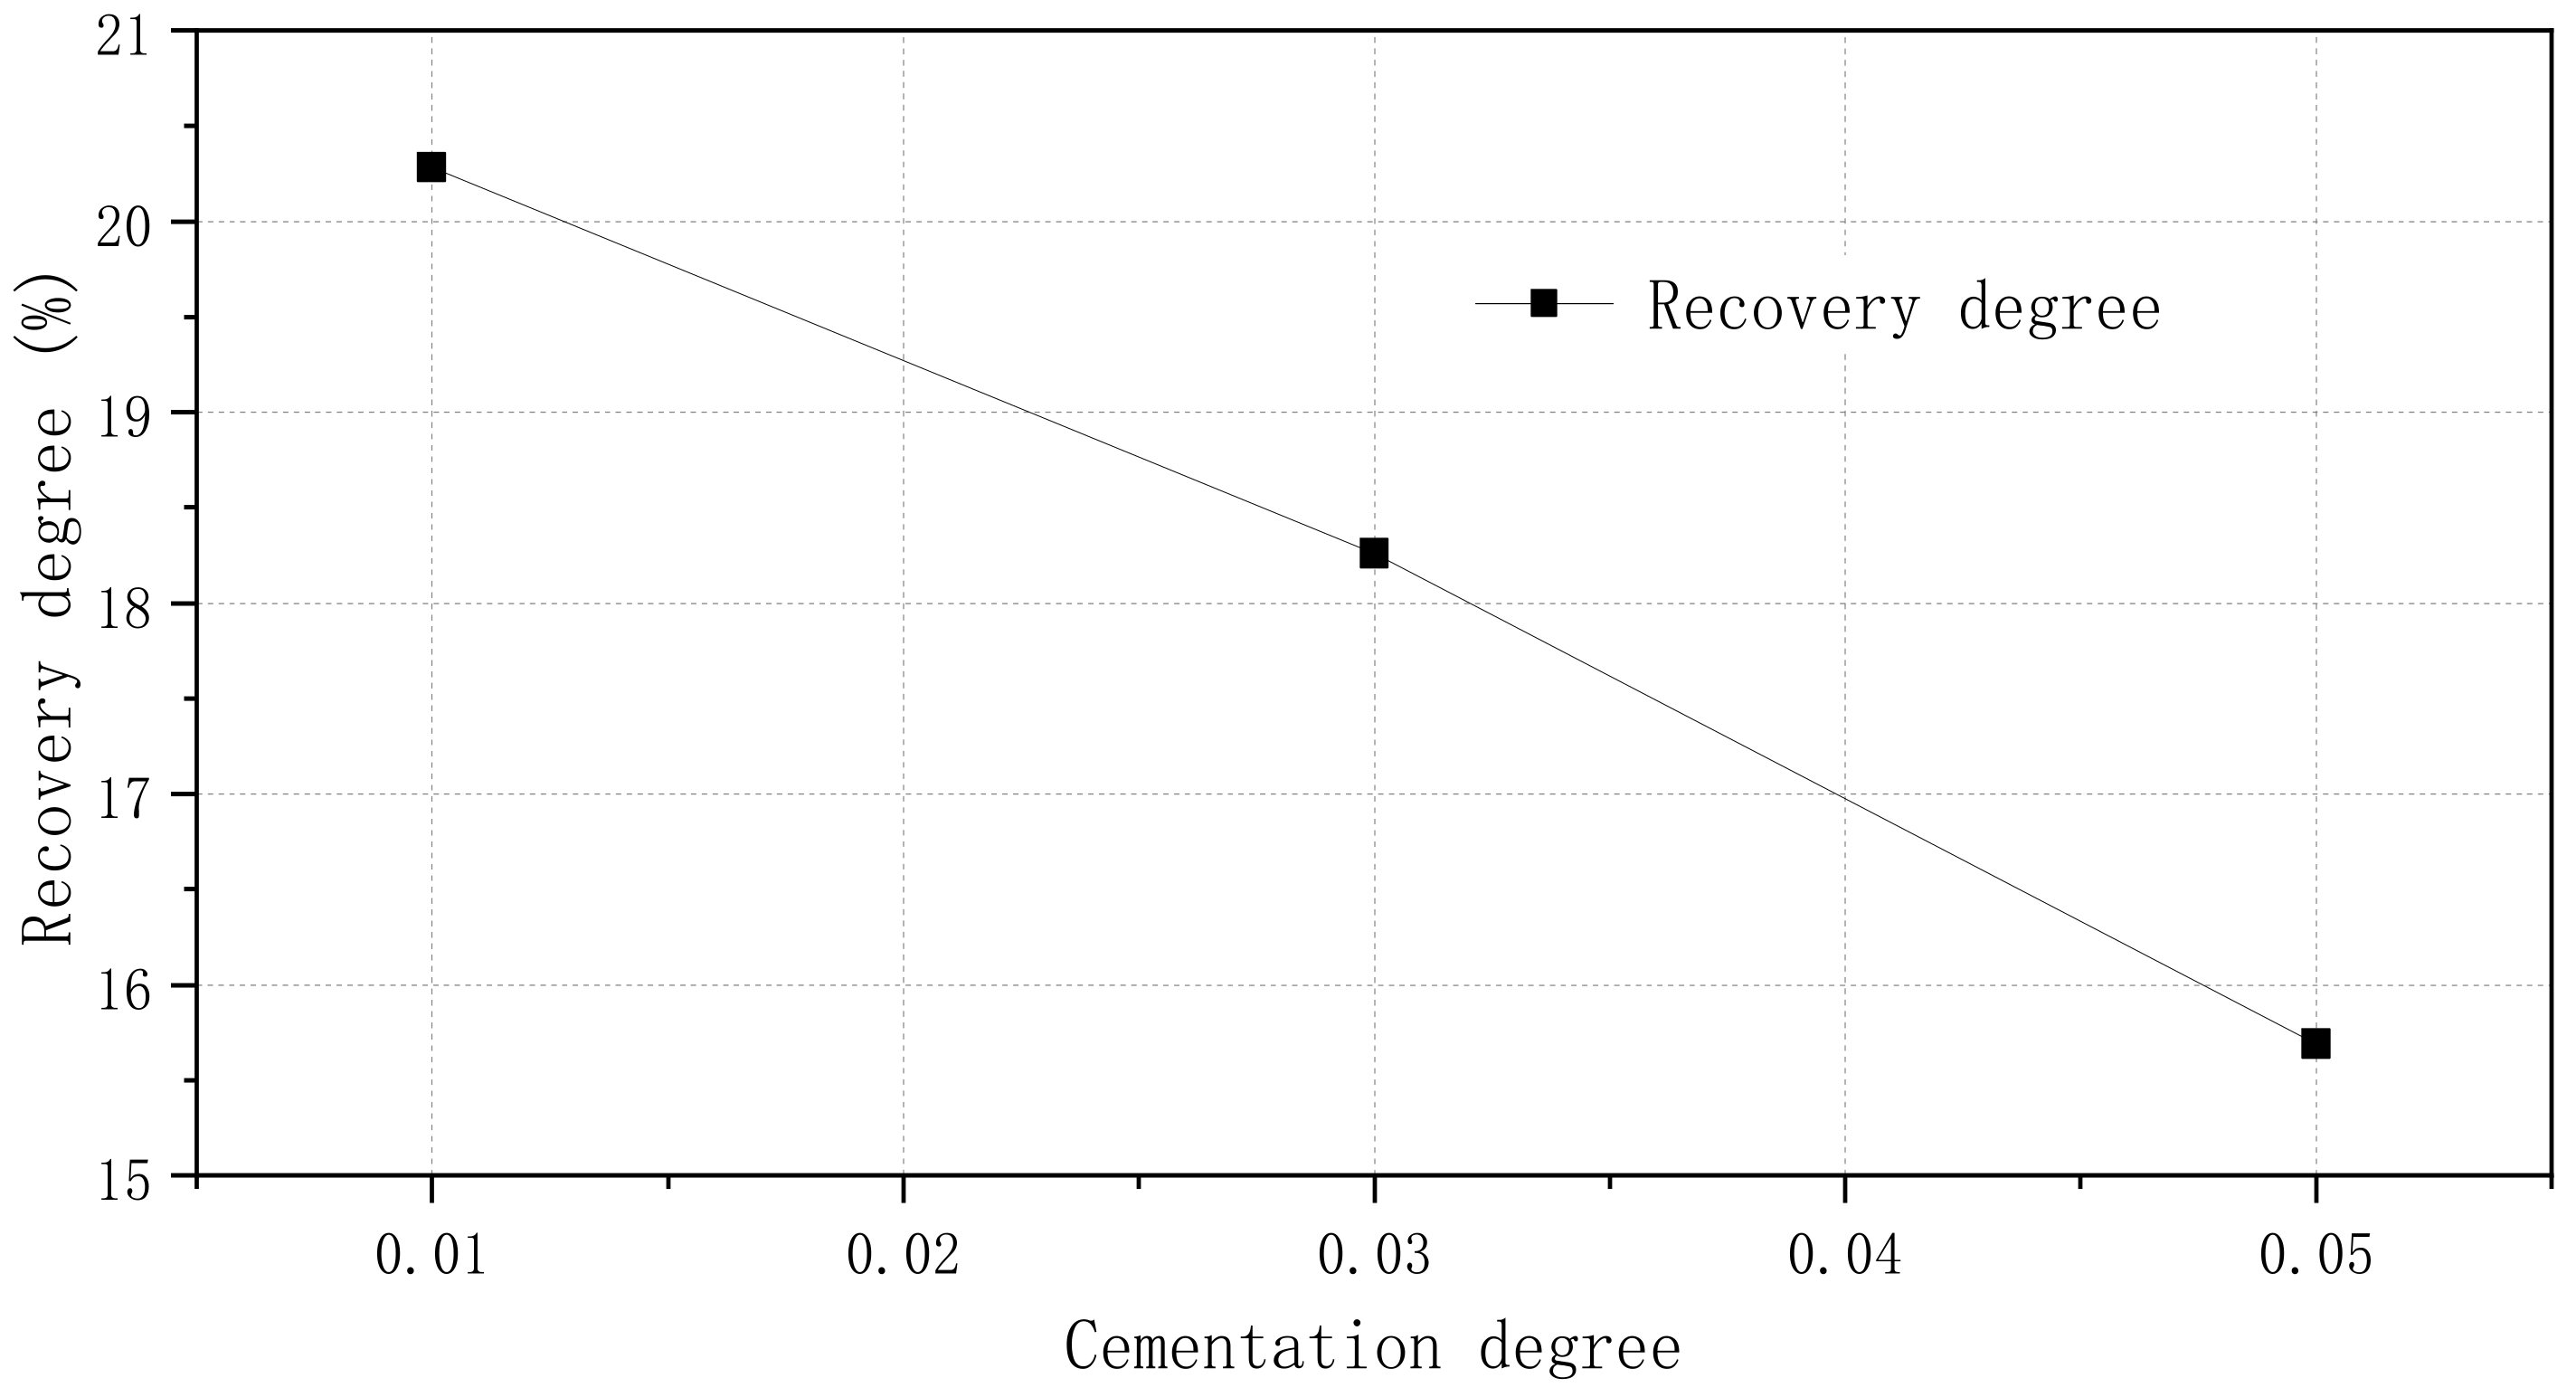
It can be seen from Table 6, Figure 18 and Figure 19 that the stronger the degree of cementation, the less likely it is to form breakthrough channels, the longer the steam breakthrough time, and the higher the recovery degree. The weaker the degree of cementation, the easier the breakthrough flow will occur, the shorter the steam breakthrough time, and the lower the recovery degree.
Table 6.
Steam breakthrough time and recovery degree for different cementation degree.
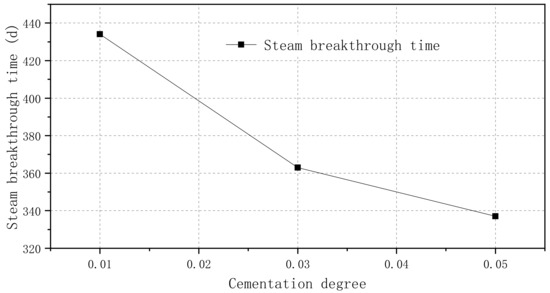
Figure 18.
Steam breakthrough time for different cementation degree.

Figure 19.
Recovery degree for different cementation degree.
4.3.2. Effect of Steam Injection Strength
In the model, the production-injection ratio is 1.2, and the steam injection intensity is the daily injection volume per unit area and per unit formation thickness, the unit of steam injection intensity is t/(d·m·ha). The effect of steam injection intensity on the change of rock properties (porosity and permeability) after steam flooding can be obtained by changing the steam injection intensity of the numerical model.
As shown in Figure 20, as the steam injection intensity increases, the production pressure difference between injection and production wells gradually increases, and the flow rate increases. The greater the change of formation porosity around the production well, the faster the steam reaches the production well, and the steam breakthrough occurs in production well in a shorter time.
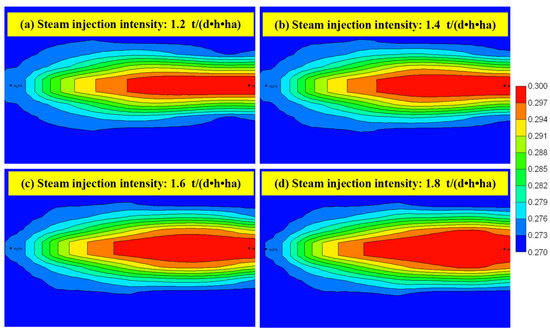
Figure 20.
Porosity distribution after steam flooding under different steam injection intensity.
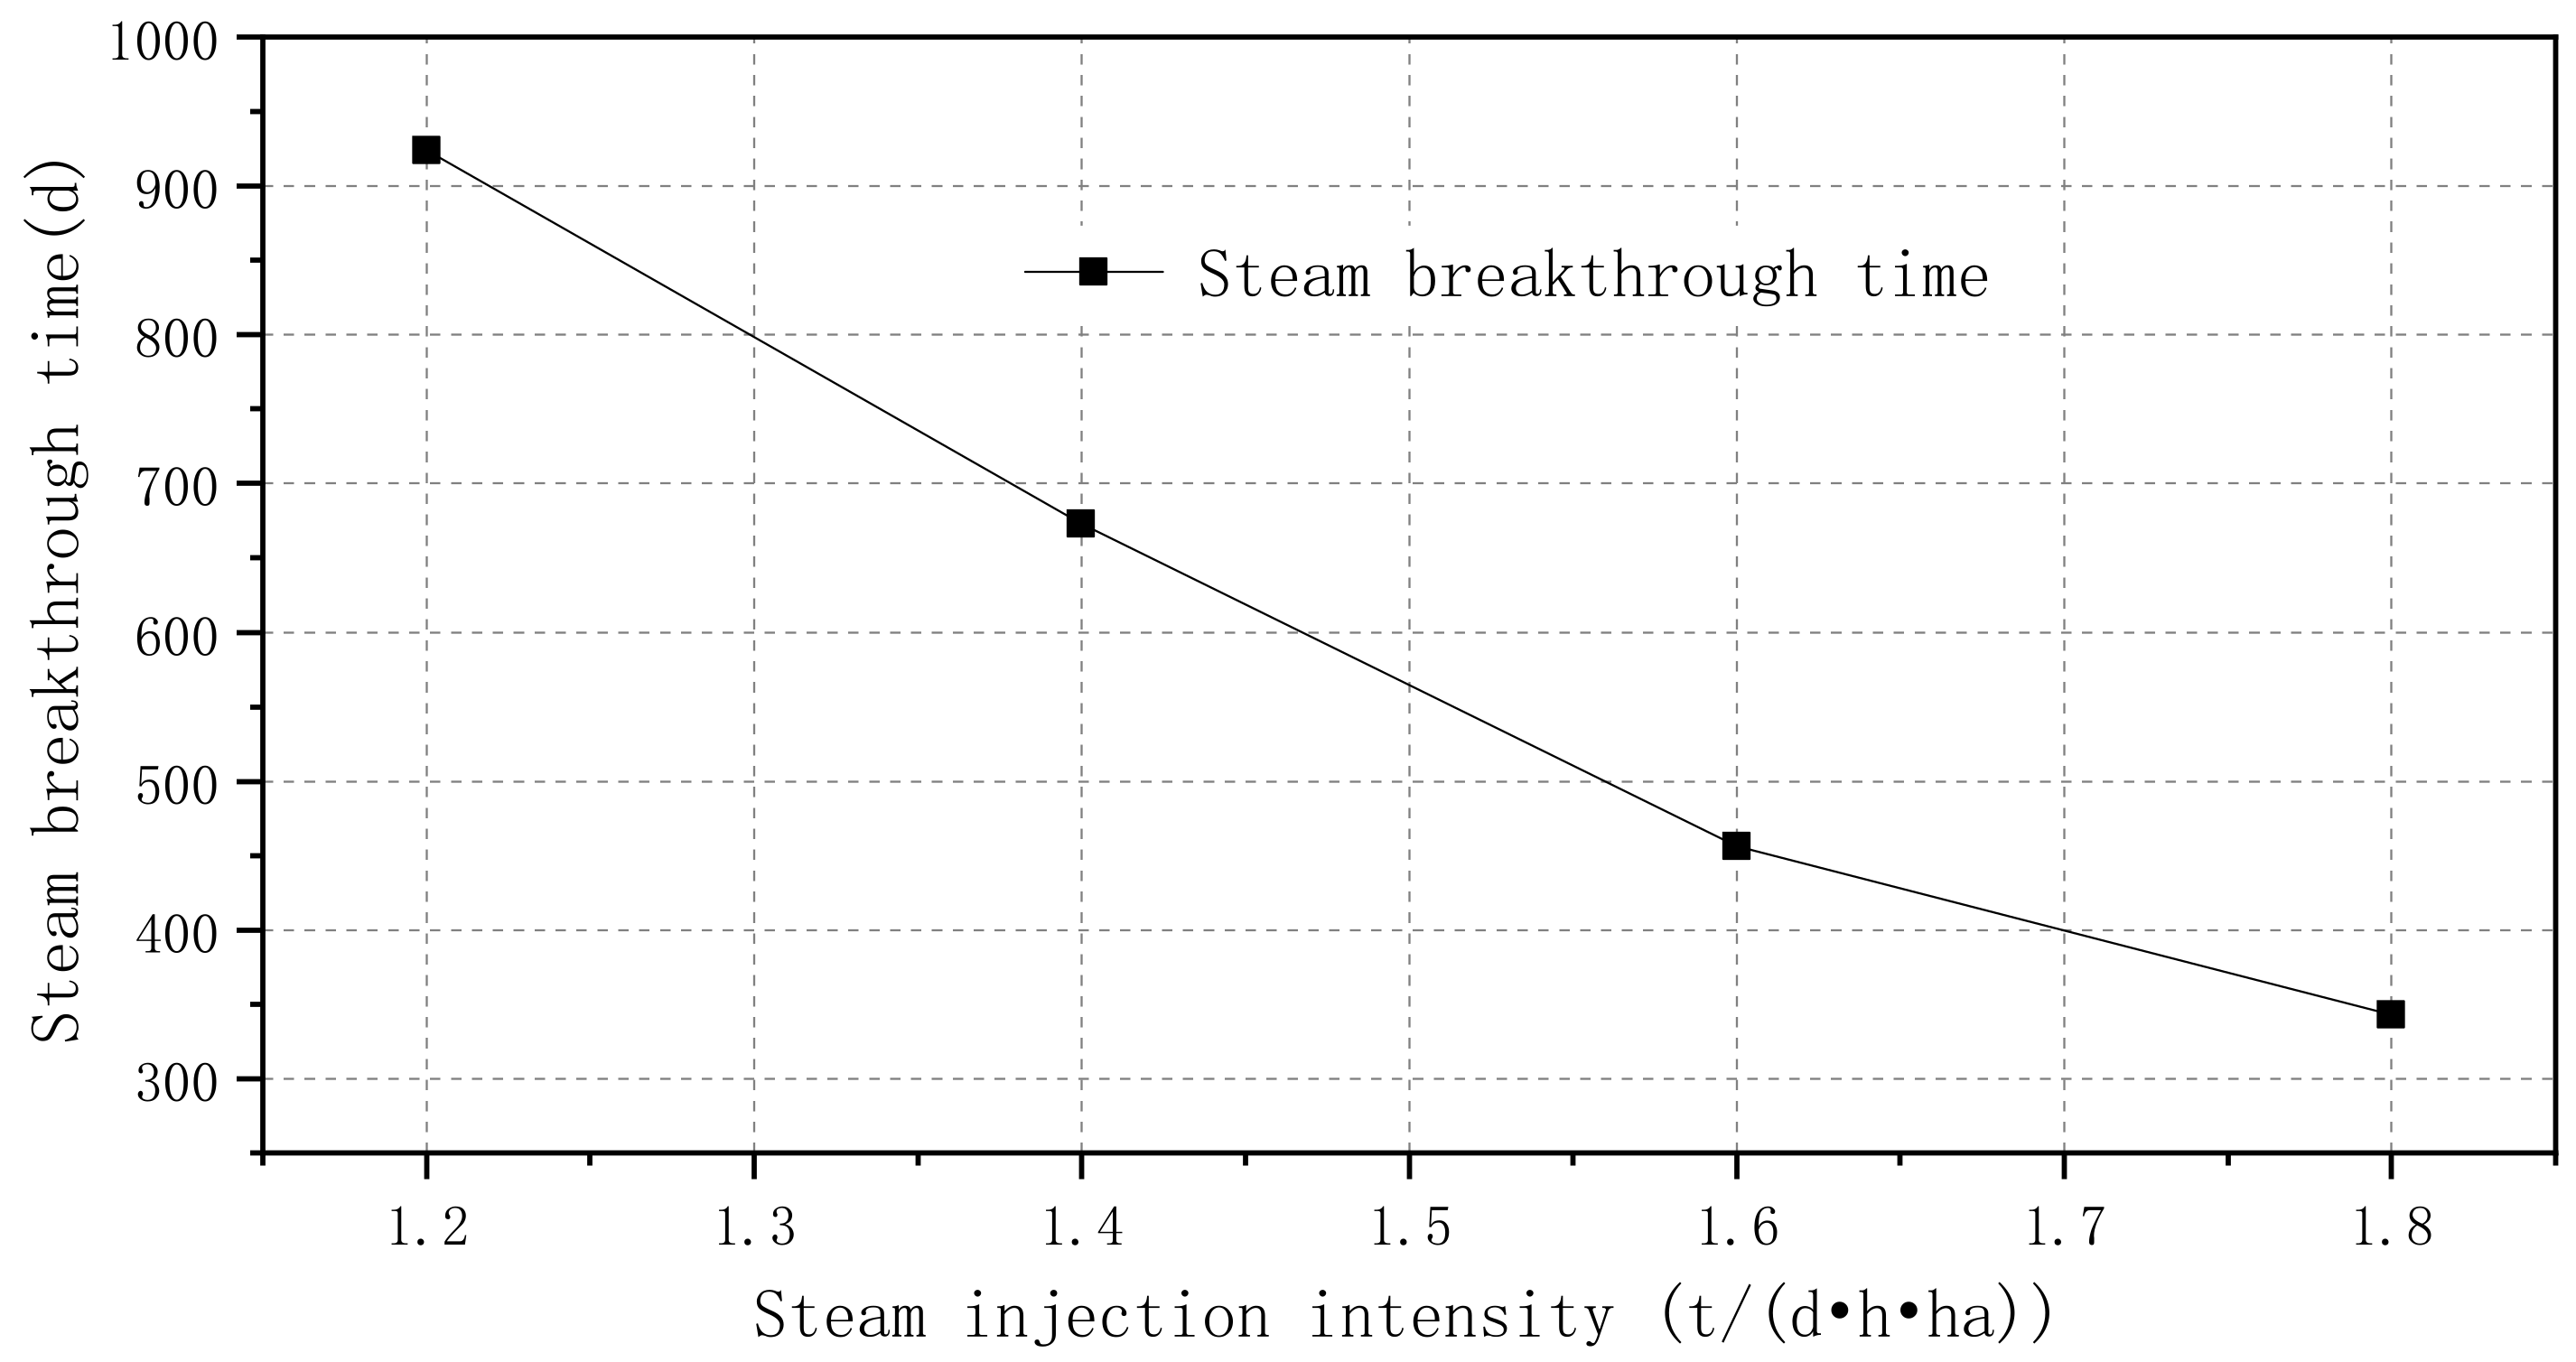
As can be seen from Table 7, Figure 21 and Figure 22, the greater the steam injection intensity, the earlier the breakthrough channel is formed, the easier it is to form breakthrough flow, the shorter the steam breakthrough time, and the lower the recovery degree.
Table 7.
Steam breakthrough time and recovery degree for different steam injection intensity.

Figure 21.
Steam breakthrough time for different steam injection intensity.
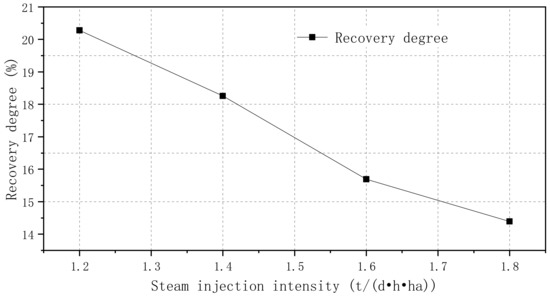
Figure 22.
Recovery degree for different steam injection intensity.
5. Conclusions
This paper studied the residual retention properties of heavy oil with different compositions in porous media by physical simulation experiments, and established the residual retention model of heavy component and the mechanism model of changes in the physical property of rock by the numerical simulation method. The following conclusions can be drawn:
- (1)
- Heavy oil samples with the same viscosity and different components were prepared for steam flooding experiments. Results showed that the pressure difference required to displace oil samples with high resin content is larger than that required to displace oil samples with low resin content. By comparing the SARA composition of compound oil before and after steam flooding, we can find that the resin content of the recovered oil after steam flooding decreased.
- (2)
- The CMG software was used to establish the residual retention mechanism model of heavy components, and the effects of different ratios of heavy components and light components, steam injection parameters and other factors on the residual retention of heavy components, were studied. The simulation shows that the residual oil after steam flooding is mainly composed of heavy components. In the formation with less residual oil saturation after steam flooding, the heavy components are retained more. With the increase of remaining oil saturation, the mass fraction of heavy components in crude oil decreases. Under the condition of gas injection intensity of 1.6 m3/(d·m·ha), oil production is the largest.
- (3)
- The mechanism model of rock properties (porosity and permeability) change after steam flooding is established by using the CMG software. After long-term thermal injection development, the porosity and permeability of the reservoir become larger, forming a breakthrough channel. The weaker the cementation degree is, the easier it is to form a breakthrough channel, shorten the steam breakthrough time and reduce the recovery degree. The increase of steam injection intensity will cause the breakthrough channel to appear earlier, and the steam breakthrough time and recovery factor will also decrease.
Author Contributions
Methodology, X.G.; software, T.H.; investigation, K.P.; writing, W.S.; editing, C.H. All authors have read and agreed to the published version of the manuscript.
Funding
This research was funded by Open Fund (PLN2020-02) of State Key Laboratory of Oil and Gas Reservoir Geology and Exploitation (Southwest Petroleum University). The authors would like to acknowledge the financial support of National Natural Science Foundation of China (Grant Nos. 51704032).
Data Availability Statement
All data included in this study are available upon request by contacting with the corresponding author.
Acknowledgments
The authors would like to thank Hubei Cooperative Innovation Center of Unconventional Oil and Gas for supporting our work.
Conflicts of Interest
The authors declare no conflict of interest.
References
- Fan, H.F.; Liu, Y.J.; Zhao, X.F. Study on composition changes of heavy oils under steam treatment. J. Fuel Chem. Technol. 2001, 29, 269–272. [Google Scholar]
- Hongfu, F.; Yongjian, L.; Liying, Z.; Xiaofei, Z. The study on composition changes of heavy oils during steam stimulation processes. Fuel 2002, 81, 1733–1738. [Google Scholar] [CrossRef]
- Zhao, X.F. Development of Catalyst and Its Support for Super Heavy Oil Hydrothermal Cracking Reaction. Ph.D. Thesis, Daqing Petroleum Institute, Daqing, China, 2006. [Google Scholar]
- Fan, H.F.; Liu, Y.J.; Zhong, L.G. The composition and viscosity changes of heavy oils after aquathermal cracking at the presence of reservoir minerals. Oilfield Chem. 2001, 18, 299–301. [Google Scholar]
- Liu, W.Z.; Tang, Y.W. Selected Papers of the International Conference on Heavy Crude Oil Exploitation; Petroleum Industry Press: Beijing, China, 1988; Volume II. [Google Scholar]
- Hepler, L.G.; Aostr, H. Heavy Oil Technical Manual; Petroleum Industry Press: Beijing, China, 1992. [Google Scholar]
- Cao, D.D.; Yi, Y.F.; Ding, F.C. The Influence of Hydrothermal Reaction to Heavy Oil Component and the Character in Liaohe. Oil-Gas Field Surf. Eng. 2009, 28, 13–14. [Google Scholar]
- Wang, H.T. Variations of Physical Properties and Control Measures of Formation Damages during Steam Injection in Heavy Oil Reservoirs. Ph.D. Thesis, China University of Geosciences, Beijing, China, 2009. [Google Scholar]
- Khormali, A.; Sharifov, A.R.; Torba, D.I. Experimental and modeling analysis of asphaltene precipitation in the near wellbore region of oil wells. Pet. Sci. Technol. 2018, 36, 1030–1036. [Google Scholar] [CrossRef]
- Khormali, A.; Sharifov, A.R.; Torba, D.I. The control of asphaltene precipitation in oil wells. Pet. Sci. Technol. 2018, 36, 443–449. [Google Scholar] [CrossRef]
- Abbaszadeh-Dehghani, M.; Brigham, W.E. Analysis of well-to-well tracer flow to determine reservoir layering. J. Pet. Technol. 1984, 36, 1753–1762. [Google Scholar] [CrossRef]
- Ge, J.L. Seepage Flow in Porous Media; Petroleum Industry Press: Beijing, China, 1982. [Google Scholar]
- Chen, Y.S. Reservoir Seepage Field; Petroleum Industry Press: Beijing, China, 1998. [Google Scholar]
- Zhao, G. The application of interwell tracer method in oilfield production. Pet. Explor. Dev. 1999, 26, 92–95. [Google Scholar]
- Zeng, L.F. Study on Formation Mechanism and Seepage Law of Large Pore in Unconsolidated Sandstone Reservoir; Petroleum Industry Press: Beijing, China, 2002. [Google Scholar]
- Zeng, L.F.; Zhao, G.; Zhang, Z. The macroscopic throats forming mechanism of unsolidated sand-reservior and their identyfying method. J. Basic Sci. Eng. 2002, 3, 266–268. [Google Scholar]
- Guo, S.P.; Huang, Y.Z.; Zhou, J.; Hu, Y.R.; Zhou, Y.R.; Yu, D.S. Microscopic Mechanism of Physical-Chemical Percolation; Science Press: Beijing, China, 1990. [Google Scholar]
- Gray, M.R. Upgrading Oilsands Bitumen and Heavy Oil; University of Alberta Press: Edmonton, AB, Canada, 2015. [Google Scholar]
- Alshaikh, M.A.I. Impact of Ionic and Polar Interaction between Heavy Crude Oil and Surfactants during Surfactant-Steam Flooding Processes. Ph.D. Thesis, Texas A&M University, College Station, TX, USA, 2020. [Google Scholar]
- Crivelaro, K.C.O.; Damacena, Y.T.; Andrade, T.H.F.; Lima, A.G.B.; Farias Neto, S.R. Numerical simulation of heavy oil flows in pipes using the core-annular flow technique. WIT Trans. Eng. Sci. 2009, 63, 193–203. [Google Scholar]
- Ado, M.R.; Greaves, M.; Rigby, S.P. Numerical simulation of the impact of geological heterogeneity on performance and safety of THAI heavy oil production process. J. Pet. Sci. Eng. 2019, 173, 1130–1148. [Google Scholar] [CrossRef]
- Jing, J.; Zhang, S.; Qin, M.; Luo, J.; Shan, Y.; Cheng, Y.; Tan, J. Numerical simulation study of offshore heavy oil desanding by hydrocyclones. Sep. Purif. Technol. 2021, 258, 118051. [Google Scholar] [CrossRef]
- Rabiu Ado, M. Numerical Simulation of Heavy Oil and Bitumen Recovery and Upgrading Techniques. Ph.D. Thesis, University of Nottingham, Nottingham, UK, 2017. [Google Scholar]
- Yuan, Z.; Liu, P.; Zhang, S.; Li, X.; Shi, L.; Jin, R. Experimental study and numerical simulation of nitrogen-assisted SAGD in developing heavy oil reservoirs. J. Pet. Sci. Eng. 2018, 162, 325–332. [Google Scholar] [CrossRef]
- Arhuoma, M.; Yang, D.; Dong, M.; Li, H.; Idem, R. Numerical simulation of displacement mechanisms for enhancing heavy oil recovery during alkaline flooding. Energy Fuels 2009, 23, 5995–6002. [Google Scholar] [CrossRef]
- Shafiei, A.; Dusseault, M.B. Geomechanics of thermal viscous oil production in sandstones. J. Pet. Sci. Eng. 2013, 103, 121–139. [Google Scholar] [CrossRef]
- Dong, X.; Liu, H.; Chen, Z.; Wu, K.; Lu, N.; Zhang, Q. Enhanced oil recovery techniques for heavy oil and oilsands reservoirs after steam injection. Appl. Energy 2019, 239, 1190–1211. [Google Scholar] [CrossRef]
- Gurgel, A.; Moura, M.C.P.D.A.; Dantas, T.N.D.C.; Barros Neto, E.L.; Dantas Neto, A. A Review on Chemical Flooding Methods Applied in Enhanced Oil Recovery. Braz. J. Pet. Gas 2008, 2, 29–41. [Google Scholar]
- Theune, U. Seismic Monitoring of Heavy Oil Reservoirs: Rock Physics and Finite Element Modelling. Ph.D. Thesis, University of Alberta, Edmonton, AB, Canada, 2004. [Google Scholar]
- Feng, X. The Formation Mechanism of Channeling after Heavy Oil Thermal Recovery. Ph.D. Thesis, China University of Petroleum, Beijing, China, 2010. [Google Scholar]
- Su, X.; Lian, Z.; Li, Z.; Xiong, H.; Lv, Z.; Min, L. Temperature-sensitive damage theory of thermal recovery of super-heavy oil reservoir. Fault-Block Oil Gas Field 2018, 15, 227–231. [Google Scholar]
- Dong, X.; Liu, H.; Chen, Z. Hybrid Enhanced Oil Recovery Processes for Heavy Oil Reservoirs; Elsevier: Cambridge, MA, USA, 2021. [Google Scholar]
- Zhow, T.; Li, C.; Guo, S.S. Experiment of Aquathermolysis reaction between heavy oil and over-heated steam. J. Southwest Pet. Univ. Sci. Technol. Ed. 2009, 31, 89–92. [Google Scholar]


Disclaimer/Publisher’s Note: The statements, opinions and data contained in all publications are solely those of the individual author(s) and contributor(s) and not of MDPI and/or the editor(s). MDPI and/or the editor(s) disclaim responsibility for any injury to people or property resulting from any ideas, methods, instructions or products referred to in the content. |
© 2023 by the authors. Licensee MDPI, Basel, Switzerland. This article is an open access article distributed under the terms and conditions of the Creative Commons Attribution (CC BY) license (https://creativecommons.org/licenses/by/4.0/).