1. Introduction
Since the 21st century, a variety of advanced manufacturing models have emerged, such as agile manufacturing [
1], service-oriented manufacturing [
2], concurrent engineering [
3], networked manufacturing [
4], and cloud manufacturing (CMfg) [
5]. CMfg as a new networked manufacturing mode based on service-oriented thinking and integrates existing networked manufacturing and service technologies with emerging technologies such as cloud computing [
6], big data [
7], and the Internet of Things [
8], to provide users with various high-quality and fast on-demand manufacturing services with the goal of agility and service-orientation. This new manufacturing mode can help enterprises reduce production costs, shorten the batch production cycles of new products, and make more rational and efficient use of social manufacturing resources at the macro level. However, it is very important to scientifically and effectively select the service composition with the best quality of service (QoS) and meet the needs of users in the massive CMfg service composition.
At the same time, with the development of the economy and technology, greenhouse gas has seriously exceeded the standard, resulting in the continuous increase in the greenhouse effect, which has a negative impact on the global climate. As the most important part of greenhouse gas, reducing carbon dioxide emissions is regarded as the most essential way to solve the climate problem [
9]. As the second largest economy in the world, China has actively undertaken the responsibility of a significant country in addressing the climate change problem and promoted the construction of my country’s ecological civilization and high-quality development. At present, it has entered a critical period and a window period. China aims to have CO
2 emissions peak before 2030 and achieve carbon neutrality before 2060 [
10]. According to the data, the manufacturing industry has the largest carbon emissions, which accounts for 50% of the total global carbon emissions. Controlling the carbon emissions generated in the production process has become an important method for manufacturing enterprises to respond to low-carbon policies and improve their own economic benefits, as well as social and environmental benefits, in recent years [
11].
SCOS is the core function of the CMfg platform. It meets the user’s complex manufacturing task requirements through service composition, and adopts a scientific optimization selection method to select high-quality cloud services from the candidate service set. The topic of SCOS has been extensively studied over the past decade. Bouzary et al. [
12] have successfully retrieved service candidate sets using three classification algorithms and through extracting TF-IDF vectors from the manufacturing capability data. Then, the optimal service composition problem was solved for each scenario, using two well-known metaheuristic algorithms. Jiang et al. [
13] built a cloud-based bi-objective disassembly scheduling model to provide customers with multiple solutions to choose from the Pareto optimal solutions that discuss the two objectives of minimizing the makespan and the cost of disassembly services. Seghir et al. [
14] addressed the QoS-aware cloud service composition problem, and proposed a Hybrid Genetic Algorithm (HGA) to solve it. The parameter settings of HGA were tuned and calibrated using the taguchi method of design of experiment, and he suggested the optimal values of these parameters. Jatoth et al. [
15] presented an Optimal Fitness Aware Cloud Service Composition (OFASC) using an Adaptive Genotype Evolution based Genetic Algorithm (AGEGA) dealing with multiple QoS parameters and providing the solutions that satisfy the balancing of QoS parameters and the connectivity constraints of service composition. Que et al. [
16] proposed a new CMfg service provider-to-user (M2U) model, constructed a comprehensive mathematical evaluation model with key service quality perception indicators (time, reliability, cost, and capability), and solved the SCOS problem of manufacturing services based on an information entropy immune Genetic Algorithm. Chen Youling et al. [
17] proposed an evaluation index system based on six indicators, namely time, cost, quality, quality similarity, composability, and cooperation and communication, to solve the problem of unreasonable task allocation caused by the production capacity constraints of manufacturing resources in the CMfg environment. After analyzing the characteristics of the model, an improved multi-objective evolutionary algorithm based on the decomposition-Particle Swarm Optimization Algorithm was proposed to obtain the optimal composition. Guérout et al. [
18] proposed a heuristic decomposition method to optimize intermediate objectives using Mixed Integer Linear Programming (MILP), which provided a solution to the multi-objective cloud virtual machine allocation problem. Zhang et al. [
19] established a mathematical model considering the four service attributes of cost, time, availability, and reliability by introducing an elite substitution strategy, and extended the Flower Pollination Algorithm with adaptive switching probability, effectively solving the problem of manufacturing service composition. Yang et al. [
20] introduced the energy consumption of the manufacturing process and the energy consumption of the logistics process into the CMfg service model, proposed an energy-aware service composition optimization selection (EA-SCOS) method, and used the improved Gray Wolf Optimization Algorithm to solve the problem model. Liu et al. [
21] proposed a Cluster-based Collaborative Filtering (CCF) algorithm to quantify customer preference attributes and improved the Personalization-oriented third generation Non-dominated Sorting Genetic Algorithm (PoNSGA-III).
Table 1 summarizes the related literature of the SCOS problem.
However, there are two major gaps in current research. First, most of the research studies on the service composition and optimal selection (SCOS) problem have failed to account for carbon emissions and transportation, the related constraints, and their effects on QoS evaluation indicators. Secondly, most studies only consider the subjective or objective single factor when filtering the Pareto optimal solution set, and fail to comprehensively consider the service composition scheme from multiple perspectives, so the filtering results are biased. Therefore, this paper proposes a novel composition optimization model that takes into account the effects of carbon emissions and transportation. In addition, an algorithm result optimization strategy combining subjective and objective is proposed to filter the Pareto optimal solution set from multiple perspectives to obtain the relative optimal solution. The contributions of this paper are summarized as:
Based on the consideration of time, cost, and quality, as well as the influence of carbon emissions and transportation on QoS evaluation indicators, the composition optimization model of CMfg in a low-carbon environment is established.
Based on the Non-dominated Sorting Genetic Algorithm (NSGA-II), which combines local search strategies of neighborhood search and the Simulated Annealing algorithm (SA), a hybrid multi-objective evolutionary algorithm, named NSGA-II-SA, is proposed to solve the model and obtain the Pareto optimal solution set.
In order to meet the subjective and objective requirements of the service demander at the same time, an algorithm result optimization strategy based on the combination of triangular fuzzy number analytic hierarchy process (TFNAHP) and entropy weight method (EWM) is proposed to filter the Pareto optimal solution set, so as to make the final decisions to better meet individual needs.
The rest of this paper is organized as follows. In the next section, an overview of the SCOS problem is presented. The novel composition optimization model is provided in
Section 3, and
Section 4 introduces the designed solution algorithm and its main steps. In
Section 5, an algorithm result optimization strategy is proposed.
Section 6 compares the performance of the proposed algorithm with that of other algorithms through an example, and makes the final decision using the above optimization strategy. Finally,
Section 7 concludes this study and suggests directions for future researches.
2. Problem Description
Different from traditional networked manufacturing, in the CMfg environment, there are three types of users in the outsourcing cloud service platform, including service demanders, service providers, and cloud platform operators [
22]. Service providers publish their idle resources on the cloud platform, which encapsulates them in the cloud service resource library and delivers them to the cloud operator for management [
23]. When the outsourcing service demander submits the outsourcing processing requirements, the CMfg service platform decomposes the tasks according to the complexity of the outsourcing manufacturing tasks, and then searches and matches the services in the cloud resource library according to the requirements of a single sub-task to obtain the candidate outsourcing service resource set. It then selects the corresponding outsourcing cloud service from each candidate outsourcing service set, according to a certain logical order, to form an outsourcing service composition sequence (
OSCS), so as to generate the candidate outsourcing service composition set corresponding to the entire complex manufacturing task. Finally, the best group of outsourcing service composition is selected from the candidate outsourcing service composition set to perform the complex manufacturing tasks collaboratively.
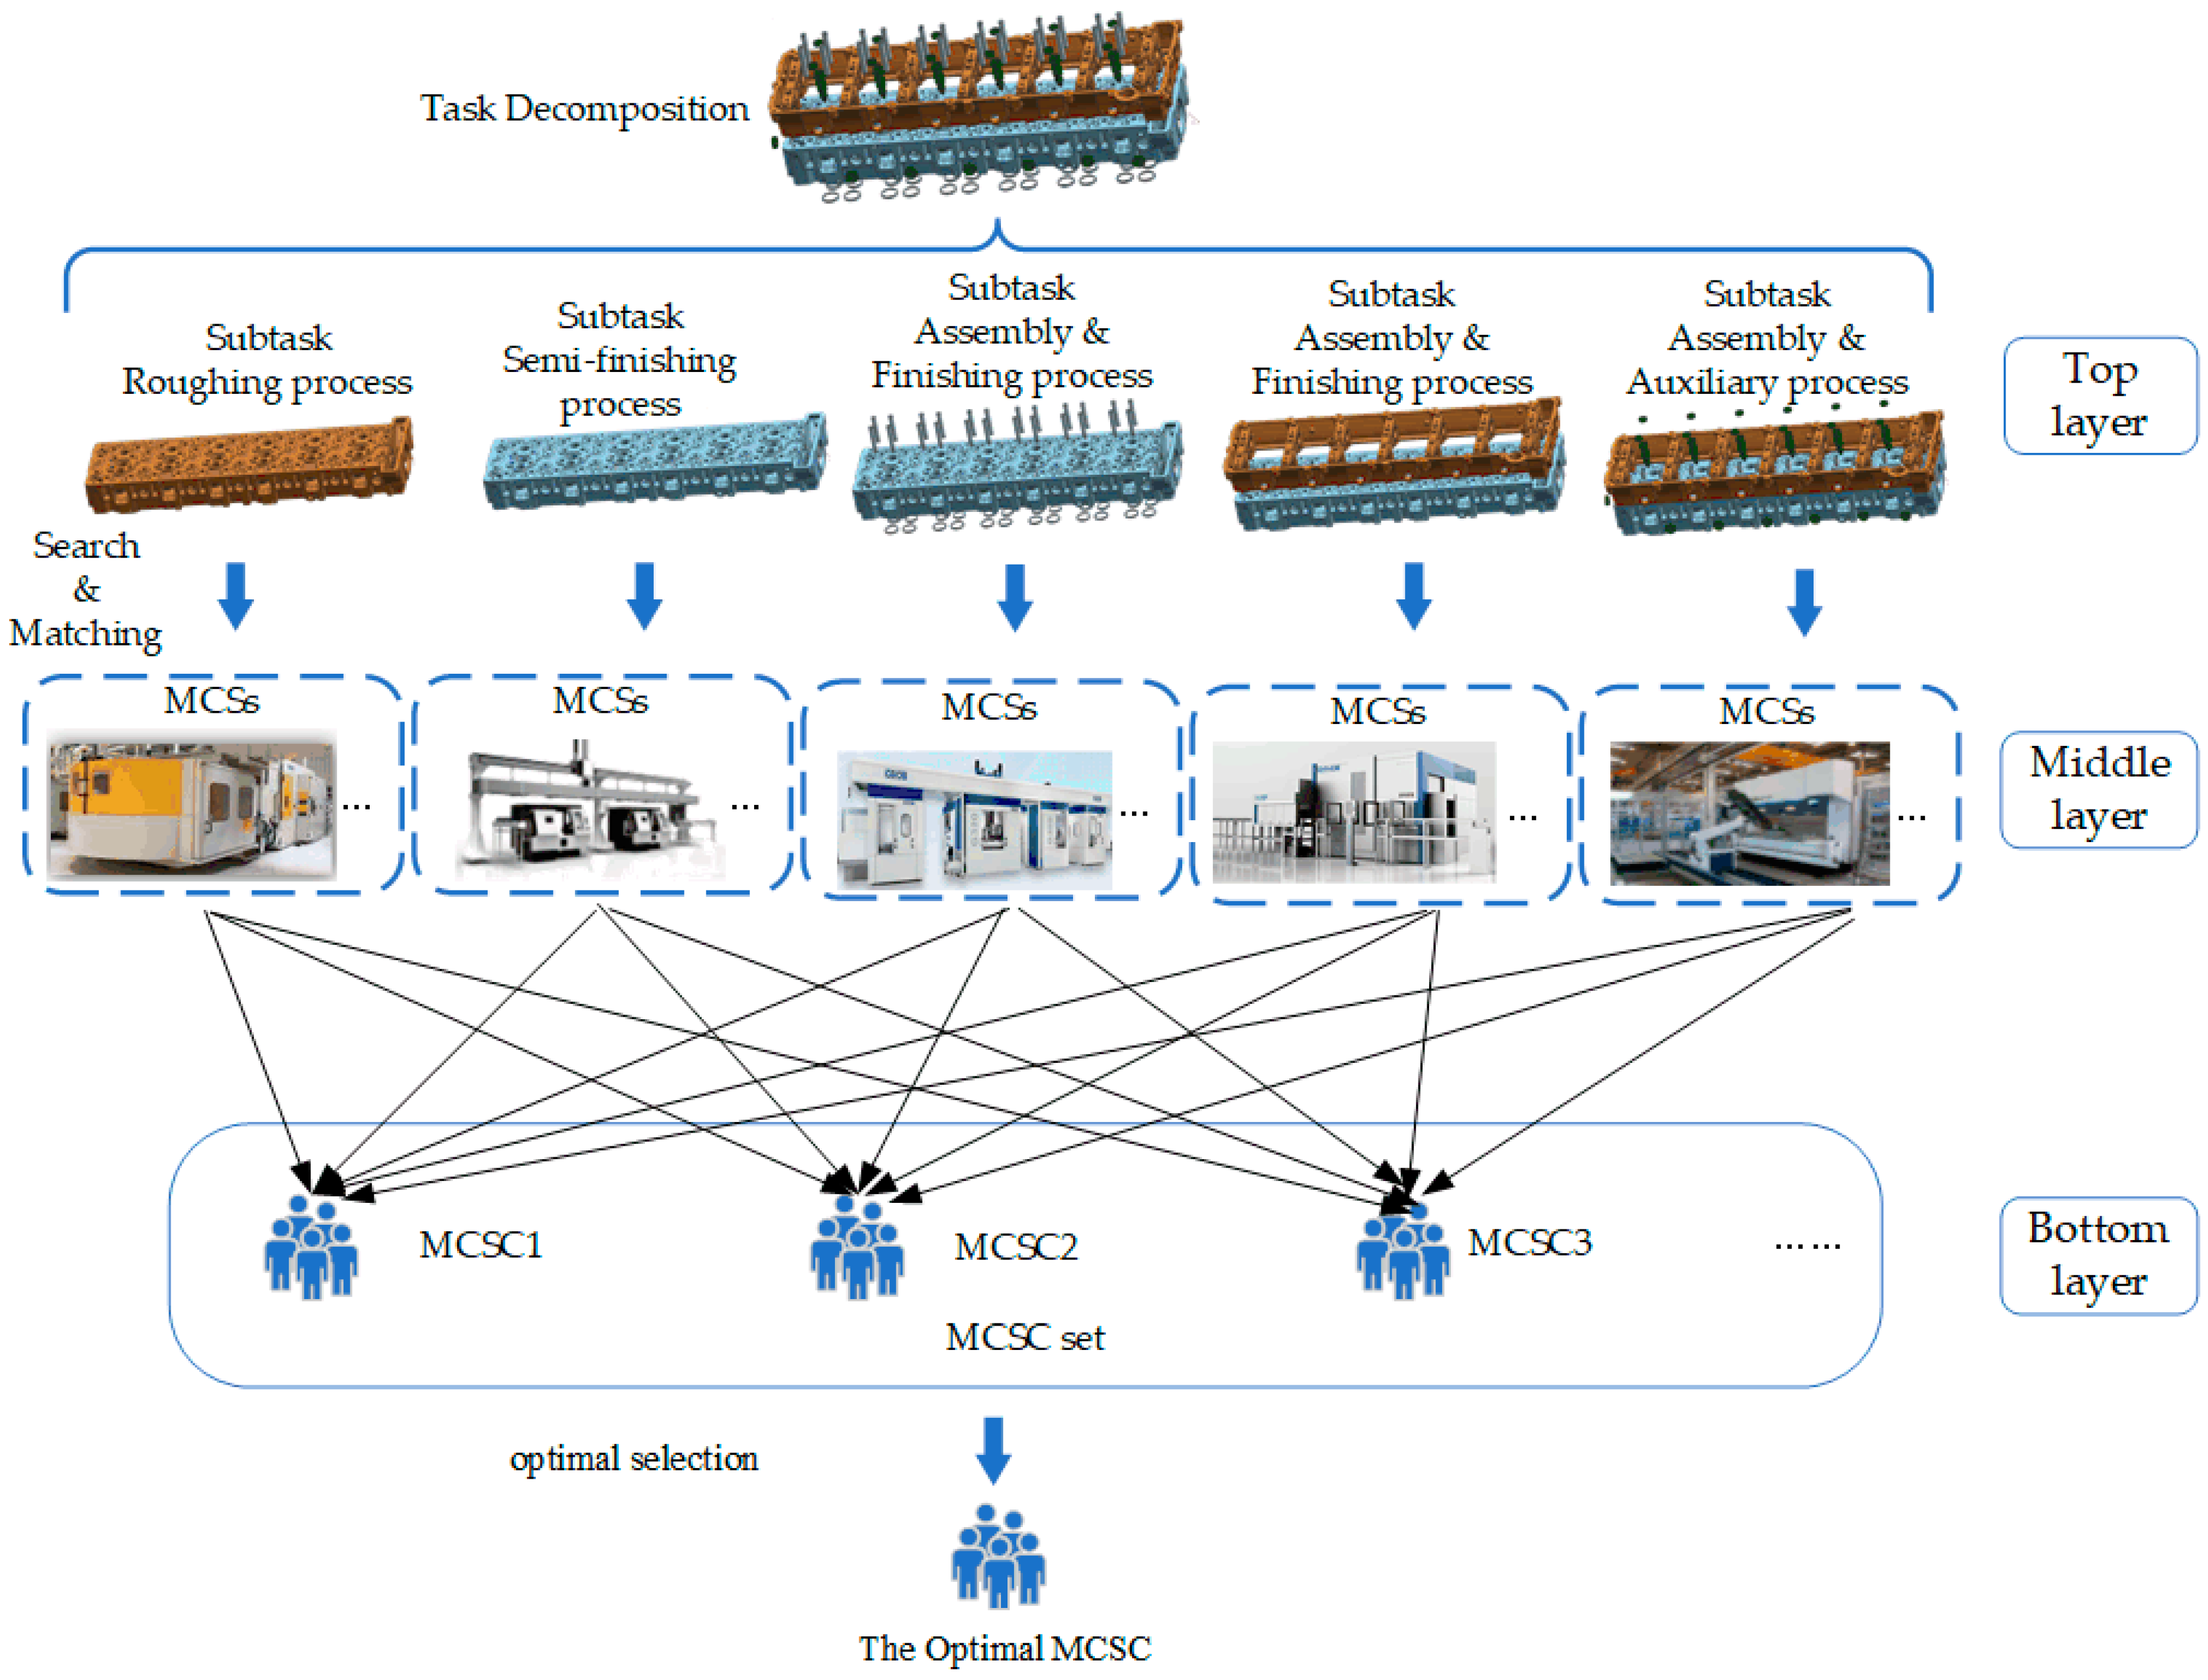
Next, take the CMfg composition optimization mode of a certain type of natural gas cylinder head as an example to explain. The structure of the natural gas cylinder head is complex, and the processing contents can be divided into the roughing process, semi-finishing process, finishing process, combined processing process, and auxiliary process. The processing equipment includes various precision machining centers, special machines for cam hole seat ring conduits, and various auxiliary machines for cleaning, press fitting, and leak testing. According to the process sequence and equipment type, the natural gas cylinder head processing process can be decomposed into multiple independent manufacturing sub-tasks, and the SCOS can be carried out, and finally provide high-quality manufacturing services to the demander in the form of cloud services. In this paper, the above process is divided into three layers (
Figure 1), and the whole service composition process is described in mathematical language.
The top layer is used to decompose tasks and store sub-task sets. The overall outsourcing manufacturing Task is input to the top layer as the input terminal, and it is divided into N sub tasks of outsourcing manufacturing according to its complexity, that is , in which Tj represents the jth subtask of the Task, j = 1, 2,…, N.
The middle layer is the CMfg outsourcing service resource library, which is used to store massive outsourcing manufacturing service resources. Search and match the subtask sets transmitted from the top layer to obtain each candidate outsourcing service set, and input it into the bottom layer. Each candidate outsourcing service set is expressed as: , in which represents the candidate outsourcing services set corresponding to the jth subtask Tj.
The bottom layer is the optimization process of outsourcing cloud service composition (OCSC). A candidate outsourcing service is selected from each candidate outsourcing service set to form an
OSCS to execute the above-mentioned overall outsourcing manufacturing
Task. Therefore, the
OSCS can be expressed as:
where
is the
ith candidate outsourcing service in the
jth candidate outsourcing service set, and
i = 1, 2,…,
M,
M is the number of candidate outsourcing services in the candidate outsourcing service set
.
It can be seen from the above three-layer structure that the overall outsourcing manufacturing Task has possible execution paths of the OCSC, in which Mj is the number of candidate outsourcing services in the jth candidate outsourcing service set , and the optimization process of the OCSC is to select the best one from the above execution paths to execute the overall Task of outsourcing manufacturing.
3. The Mathematical Model
In response to the strategic goal of energy conservation and emission reduction [
24], this research incorporates carbon emissions into the QoS evaluation indicators for the first time, and takes into account the geographical distribution of outsourcing services. It adopts four indicators, namely service time, service cost, service carbon emissions, and service reliability, as the quality evaluation criteria for CMfg outsourcing service optimization.
For the convenience of discussion, the symbol meanings required in the process of describing the problem and establishing the model are shown in
Table 2.
- (1)
Service time ST
Service time refers to the time elapsed from the time when the service demander submits the outsourcing cloud service requirement on the outsourcing cloud platform to the completion of the execution of the outsourcing cloud service task. As outsourcing cloud services need to consider both online and offline, the service time is mainly composed of three aspects: service request response time, outsourcing processing time, and logistics transportation time, which is:
where
To is the service request response time;
Tm is the outsourcing processing time;
Tt is the logistics transportation time, including the logistics transportation time
Td from the service demander to the outsourcing service provider, and the logistics transportation time
Tp between the outsourcing service providers.
- (2)
Service cost SC
Service cost refers to the cost paid by the service demander after obtaining the required outsourcing cloud service on the outsourcing cloud platform. The service cost is mainly composed of the online cost of the cloud platform (such as the cost of online quotation and inquiry, the service fee charged by the cloud platform, etc.), the cost of outsourcing processing, and the cost of logistics and transportation, namely:
where
Co is the online cost of the cloud platform;
Cm is the outsourcing processing cost;
Ct is the logistics transportation cost, including the logistics transportation cost
Cd from the service demander to the outsourcing service provider, and the logistics transportation cost
Cp between the outsourcing service providers.
- (3)
Service Carbon Emissions SCE
CMfg service providers usually provide an automatic processing line or a part of the whole line, including multiple machining centers and auxiliary equipment. As shown in
Figure 2, the carbon emissions in the production process include raw material input, removal of metal allowances, and energy consumption during processing, as well as the consumption of cutting tools, cutting fluids, and lubricating oil [
25]. However, in the case of SCOS, the two factors of raw material input and metal material removal are the same for each manufacturer, which can be ignored. This helps to simplify the service carbon emissions model to improve the efficiency of composition optimization.
The carbon emissions generated by energy consumption mainly come from the electrical energy consumed during processing, which consists of equipment energy consumption and other auxiliary energy consumption. The equipment will rarely be stopped in the actual production process, so this paper only considers the carbon emissions generated in the two states of equipment processing and standby. Auxiliary energy consumption includes fixed energy consumption of the workshop such as raceway motors, cutting fluid centralized treatment systems, and constant temperature and humidity systems.
In general, the carbon emissions generated by tool wear are mainly calculated by apportioning the carbon emissions generated in the preparation process to each process. Since more than one tool may be used in each process, the average tool wear
of that process needs to be calculated based on that process’s process. Therefore, the carbon emission of tool wear can be expressed as:
The carbon emission caused by cutting fluid consumption is the apportionment of carbon emission generated during the preparation process in the processing stage. Due to the long replacement cycle of cutting fluid, it is often calculated by converting the processing time within the replacement cycle. The cutting fluid consumed by equipment
k per unit time can be expressed as:
Carbon emissions resulting from cutting fluid consumption can be expressed as follows:
The calculation method of carbon emission caused by lubricating oil consumption is consistent with that caused by cutting fluid consumption, which is calculated by converting the processing time within the replacement cycle. The lubricating oil consumed by equipment
k per unit time can be expressed as follows:
Carbon emissions generated by lubricating oil consumption can be expressed as follows:
- (4)
Service reliability SR
Service reliability refers to the reliability degree of outsourced cloud services provided by outsourcing service providers, which is specifically manifested as production capacity and product quality. Generally speaking, the quality of the product can be expressed by the quality inspection qualification rate
Qr, which is defined as the ratio of the qualified quantity
Nq obtained by the service demander from the quality inspection of the received workpieces to the total quantity
Ns received by the service demander after the outsourced cloud service is completed, which is denoted as
Qr =
Nq/
Ns. On the other hand, the on-schedule delivery rate
Dr can measure the production capacity of an enterprise and its ability to accept orders from customers. It is the ratio of the number of times
Sf that an outsourcing service provider delivers workpieces on the delivery date to the total number of times
S that outsourcing service providers undertake services on the cloud platform, which is denoted as
Dr =
Sf/
S. In summary, service reliability
SR can be denoted as:
where
α1 and
α2 are the weight coefficients of the influencing factors
Qr and
Dr. Since different service demanders focus on different indicators, the weight coefficients can be adjusted according to user preferences, and
α1 +
α2 = 1.
According to the above section, for the outsourced cloud service composition process, the service execution paths of each OCSC generated by the outsourcing manufacturing subtasks obtained by task decomposition are complex during the process of service composition again, which can be roughly divided into four basic composite structures: sequence, parallel, selective, and circular [
26]. Besides the series structure, the other three structures can be transformed into series structure. Let the simplified outsourced cloud service composition consist of N outsourced cloud services in series, and the outsourced manufacturing total
Task has
possible outsourced cloud service composition execution paths. Then, the QoS calculation model of
OSCS formed by a complete execution path of outsourced cloud service composition is shown as follows:
where
,
,
and
respectively represent the service time, service cost, service carbon emission and service reliability of the
ith candidate outsourced service in the
jth candidate outsourced service set;
To(ij),
Tm(ij), and
Tt(ij), respectively, represent the service request response time, outsourced processing time, and logistics transportation time of the
ith candidate outsourcing service in the
jth candidate outsourcing service set.
Co(ij),
Cm(ij), and
Ct(ij), respectively, represent the cloud platform online cost, outsourced processing cost, and logistics transportation cost of the
ith candidate outsourced service in the
jth candidate outsourcing service set.
CEE(ij),
CET(ij),
CEC(ij), and
CEO(ij), respectively, represent the energy consumption carbon emissions, tool consumption carbon emissions, cutting fluid consumption carbon emissions, and lubricating oil consumption carbon emissions of the
ith candidate outsourcing service in the
jth candidate outsourcing service set.
Qr(ij) and
Dr(ij) represent the quality inspection qualification rate and on-schedule delivery rate of the
ith candidate outsourced service in the
jth candidate outsourcing service set, respectively.
α1 and
α2 are the weight coefficients of
Qr(ij) and
Dr(ij), and
α1 +
α2 = 1.
The ultimate purpose of outsourced service composition optimization for CMfg is to select the most appropriate outsourcing cloud service, so as to determine the outsourcing service provider to complete the outsourced task requirements proposed by the service demander. Therefore, the optimal outsourced cloud service composition should aim at the shortest service time, the lowest service cost, the least service carbon emission, and the highest service reliability, combined with the QoS calculation method of
OSCS, and meet certain constraints, and the mathematical model
F is constructed as follows:
where
f1 is the total service time of outsourced cloud service composition;
f2 is the total service cost of outsourced cloud service composition;
f3 is the total service carbon emission of outsourced cloud service composition;
f4 is the total service reliability of outsourced cloud service composition;
ij represents the
ith candidate outsourcing service in the
jth candidate outsourcing service set.
Tmax is the longest delivery time required by the outsourced demander;
Cmax is the highest cost accepted by the outsourced demander;
CEmax is the highest carbon emission accepted by the outsourced demander;
Rmin is the minimum reliability required by the outsourced demander.
4. The Proposed Algorithm
The traditional NSGA-II is one of the best multi-objective genetic algorithms for current NP-Hard problems. The NSGA-II algorithm adopts a fast, non-dominated sorting approach, which greatly reduces the computational complexity. The crowding distance and crowded-comparison operator are used to maintain the diversity of the population. The elitist strategy is introduced to expand the sampling space, prevent the loss of the best individual, and improve the operation speed and robustness of the algorithm. Therefore, with the properties of a fast, non-dominated sorting procedure, an elitist strategy, a parameterless approach, and a simple yet efficient constraint-handling method, NSGA-II is more suitable to deal with the current problem [
27]. However, NSGA-II pays more attention to the quality of the solution and lacks good local search ability, so it is easy to fall into local optimum in the optimization process [
28]. Aiming at the deficiency of the NSGA-II algorithm, this paper proposes a hybrid multi-objective evolutionary algorithm (NSGA-II-SA) to solve the above model. Based on NSGA-II, this algorithm combines the local search strategy of neighborhood search and the (SA) to generate invasive populations, increase the diversity of populations, and improve the ability of the algorithm to jump out of the optimal local solution.
Figure 3 shows the process of the algorithm.
The steps are described as follows:
Step 1: Initialize the population, randomly generate the population Pt with the size of Ng, and calculate the objective function value of each dimension according to the number of objective functions.
Step 2: The population Pt is non-dominated sorted and the crowding distance of each individual in the population is calculated.
Step 3: The excellent individuals in population Pt are selected by binary tournament mode, and the offspring population Ps is obtained by performing uniform two-point crossover and basic bit mutation on them.
Step 4: Merge the parent population Pt and offspring population Ps, calculate the non-dominated level and crowding distance of the mixed population, respectively, eliminate undesirable individuals, and obtain a new population Px with the size of Ng.
Step 5: Select some excellent individuals of the new population for local search, and use the local search strategy combining neighborhood search and SA to add the non-dominated solution obtained into the invasive alien population.
Step 6: Merge the invasive alien population with the new population Px, eliminate the undesirable individuals, and obtain the next generation population Pn.
Step 7: Judge the current iteration number G and the maximum iteration number Gmax. If G < Gmax, go to step 2; otherwise, jump out of the loop and output the Pareto optimal solution set.
4.1. Encoding Method
In this paper, natural numbers were used for coding, that is, after task decomposition, the candidate outsourcing services (that is, the candidate outsourcing service providers) corresponding to each subtask are numbered, and the candidate outsourcing service provider code is used as gene loci on chromosomes (
Figure 4).
The encoding sequence represented by the
OSCS is selected in
Figure 4 is [3,2,4,1,4], and then its specific meaning is that the first subtask is assigned to the third outsourcing service provider of the first candidate service set. The second subtask is assigned to the second outsourcing service provider of the second candidate service set. The third subtask is assigned to the fourth outsourcing service provider of the third candidate service set. The fourth subtask is assigned to the first outsourcing service provider of the fourth candidate service set. The fifth subtask is assigned to the fourth outsourcing service provider of the fifth candidate service set.
4.2. Local Search Strategy
On the basis of the combination of parent and offspring populations to select the next generation of excellent individuals, this paper adopts the neighborhood search method [
29], combined with SA [
30], and proposes a local search strategy that integrates the above two to generate an invasive alien population. At the same time, it incorporates the excellent individual set obtained previously, so as to improve the population diversity and prevent the algorithm from falling into the local optimum.
- (1)
Neighborhood search
For candidate outsourcing service provider composition, this paper proposes the corresponding neighborhood structure, and searches the candidate outsourcing service provider composition by randomly selecting point-exchange, two-exchange and three-exchange neighborhood search methods according to the number position of the outsourcing service provider, so as to generate a new candidate outsourcing service provider composition. Among them, point-exchange refers to arbitrarily selecting two number positions in the candidate outsourcing service provider composition and exchanging them. Two-exchange means that two number positions are selected randomly in the candidate outsourcing service provider composition, and then all the number between the two positions are arranged in reverse order. Three-exchange means choosing any three number positions in the candidate outsourcing service provider composition, and then swapping all numbers between the first and second positions with all numbers between the second and third positions.
Figure 5 shows the neighborhood search methods of point-exchange, two-exchange, and three-exchange.
- (2)
SA algorithm
A large number of studies have shown that SA algorithm can probabilistically jump out of local optimal solutions and eventually converge to the global optimum when solving combinatorial optimization problems. Therefore, SA algorithm is introduced in this paper. However, since SA algorithm can only optimize a single target, and the optimization problem of OCSC is a multi-objective problem, this paper randomly selects one of the objective functions of the problem as the search direction to search for new individuals, and by comparing the objective function value of the old and new solutions, implements the Metropolis criterion [
31] to put the obtained excellent individuals into the alien invasion population.
According to the process of local search in
Figure 3, we assume that the original individual before the neighborhood search is
a, and its individual fitness (that is, the objective function value) is
f(
a), and the new individual after the neighborhood search is
a′, and its individual fitness is
f(
a′). The Metropolis criterion is described as follows:
In the formula: Tc represents the annealing temperature in the current iteration process, and c represents the number of iterations.
5. Optimization Strategy
In this paper, the above NSGA-II-SA algorithm is used to solve the proposed composition optimization model, and the Pareto optimal solution set is obtained. It is also necessary to adopt an appropriate optimization strategy to filter the Pareto optimal solution set further, so as to obtain a group of OCSC schemes that best meet users’ needs. Therefore, this paper proposes an algorithm result optimization strategy based on the combination of TFNAHP and EWM. This strategy not only considers users’ subjective and personalized preferences, but also has strong objectivity and scientificity, which improves the reliability and flexibility of service composition selection to a certain extent.
As the dimensions of each evaluation indicator of outsourcing service providers are different, they are not comparable and cannot be directly calculated. Therefore, this paper adopts the normalization method in literature to normalize all indicators [
32]. Among them, service time, service cost, and service carbon emission are cost-oriented indicators, and the smaller the value, the more favorable it is. Service reliability is a benefit-oriented indicator, and the larger the value, the more favorable it is. The specific formulas is as follows:
where
fjmax and
fjmin are the maximum and minimum values of the candidate OCSC on the
jth indicator respectively.
fij is the value of the
ith candidate OCSC on the
jth indicator,
I = 1, 2,…,
m;
j = 1, 2,…,
n;
m is the number of candidate OCSC in Pareto optimal solution set;
n is the number of evaluation indicators for candidate OCSC.
Therefore, in the Pareto optimal solution set obtained in this paper, the comprehensive evaluation value
EVi of the
ith candidate OCSC is:
where
,
,
and
are the normalized attribute values of service time, service cost, service carbon emissions, and service reliability, respectively;
STmax,
SCmax,
SCEmax,
SRmax,
STmin,
SCmin,
SCEmin, and
SRmin are the maximum and minimum values of the candidate outsourcing service composition in terms of service time, service cost, service carbon emission, and service reliability, respectively.
ST(i),
SC(i),
SCE(i), and
SR(i) are the attribute values of the
ith candidate outsourcing service composition in terms of service time, service cost, service carbon emissions, and service reliability, respectively.
ω1,
ω2,
ω3, and
ω4 are the weight coefficients of the relevant attribute values, respectively, and meet
ω1 +
ω2 +
ω3 +
ω4 = 1.
According to the above Equation (18), it is necessary to assign weights to each evaluation indicator to obtain the comprehensive evaluation value
EVi of the candidate OCSC. The corresponding weights of each evaluation indicator can reflect the relative importance of each evaluation indicator in the overall evaluation, as well as the subjective importance that users attach to it, which can greatly influence the selection of the final service composition scheme. Therefore, the selection of the weight allocation method should not only have a certain objective basis, but also reflect users’ subjective preferences. In the existing research, weight allocation methods are mainly divided into subjective weighting and objective weighting. Subjective weighting mainly includes the analytic hierarchy process (AHP) [
33], expert scoring method [
34], etc. Such methods are highly subjective and highly dependent on expert experience. Objective weighting mainly includes Gini coefficient method [
35], range method, grey correlation analysis [
36], etc. Such methods attach importance to objective data, but ignore expert opinions and user preferences.
In this paper, a comprehensive weight calculation method based on TFNAHP [
37] and EWM [
38] is proposed by combining the above two weighting methods. The specific steps are shown as follows:
- (1)
TFNAHP weight calculation
Step 1: Construct the hierarchical analysis structure model of SCOS (
Figure 6).
Step 2: Adopt the 1–9 scale method, as shown in
Table 3. The evaluation experts compare and score each indicator of the criterion layer in pairs, and construct the triangular fuzzy judgment matrix
B, as shown below. Where
n is the number of evaluation indicators,
p,
q = 1, 2,…,
n,
refers to the importance of indicator
p given by the participating experts in relation to another indicator
q, which is a triangular fuzzy number.
,
,
, respectively represent the lower, median, and upper bounds of the fuzzy interval
. If multiple experts participate in the scoring, the mean value is taken according to the triangular fuzzy number algorithm [
39].
Step 3: Calculate the triangular fuzzy number weight of evaluation indicators of each layer according to matrix
B. The triangular fuzzy number weight
Dp of the
pth evaluation indicator of the candidate OCSC is shown below. Similarly, the triangular fuzzy number weight
Dq of the
qth evaluation indicator can be obtained.
Step 4: De-fuzzify the triangular fuzzy number weight
Dp and
Dq obtained in the previous step, and calculate the possibility degree
of
and the transformed real number weight
dp:
Step 5: Obtain the standardized weight of each indicator, then the weight coefficient corresponding to the
pth indicator of the candidate OCSC is defined as:
- (2)
EWM weight calculation
Suppose the number of candidate OCSC schemes in the Pareto optimal solution set is m, and the number of evaluation indicators for each candidate OCSC scheme is n.
Step 1: Establish the indicator evaluation matrix of candidate OCSC scheme, (i = 1, 2,…, m; j = 1, 2,…, n), in which cij represents the value of the ith candidate OCSC on the jth indicator.
Step 2: Normalize the indicator evaluation matrix C according to Equations (16) and (17), and obtain matrix , in which rij represents the standard value obtained by the normalization of cij.
Step 3: Calculate the proportion of each evaluation indicator
hij and its information entropy value
ej respectively:
Step 4: Calculate the weight coefficient of each evaluation indicator, and then the weight coefficient corresponding to the
jth indicator of the candidate OCSC is defined as:
- (3)
Determine the comprehensive weight
After obtaining the subjective and objective weight vectors, this paper adopts the product sum normalization method to determine the comprehensive weight. Therefore, the comprehensive weight coefficient corresponding to the
jth indicator of the candidate OCSC is defined as follows:
Based on the above analysis and combined with the application environment of this paper, the candidate OCSC in this paper has four evaluation indicators, so the comprehensive weight coefficient vector W = [ω1, ω2, ω3, ω4].
6. Example Verification
Since this paper aims to optimize the outsourcing service composition in a low-carbon environment, even a wrong decision may affect the interests of enterprises and the ecological environment. Based on the case data of a natural gas cylinder head, according to the production and manufacturing process rules of the natural gas cylinder head, the manufacturing tasks are decomposed. In
Figure 7, there are five processing items, including rough processing, semi-finishing processing, combination processing of seat ring and pipe, combination processing of diagram shaft cover, and pressure fitting and leakage testing, which are undertaken by different cloud manufacturers and are series structures. After searching and matching through outsourcing cloud platform services, the relevant parameters of the candidate outsourcing service resource set corresponding to each subtask are shown in
Table 4, and the logistics time and logistics cost between the candidate outsourcing service providers are shown in
Table 5.
In order to verify the effectiveness of the proposed algorithm in solving the optimization problem of outsourcing service composition under a low-carbon environment, the proposed NSGA-II-SA algorithm, the existing NSGA-II, Pareto Envelope-based Selection Algorithm-II (PESA-II) [
40] and Multi-Objective Particle Swarm Optimization (MOPSO) [
41] were used to solve the example, respectively. The parameters were set as the initial population
Ng = 50, the crossover probability
Pc = 0.9, the mutation probability
Pm = 0.04, and the maximum number of iterations
Gmax = 100. The proportion of Pareto solutions obtained by each algorithm is plotted as a curve according to the changes presented by different iterations. The proportion of non-dominated solutions of the four algorithms is shown in
Figure 8. The number of iterations of the four algorithms to achieve convergence are 23, 26, 19, and 30, respectively, which locates on the same order of magnitude.
Figure 9a–d shows the iterative curves of time, cost, carbon emissions, and reliability.
Since NSGA-II-SA is based on NSGA-II algorithm and integrates the local search strategy to solve the same instance under the same parameter settings, it can be seen from
Figure 8 that NSGA-II-SA obtains more non-dominated solutions than NSGA-II and other algorithms. It shows that NSGA-II-SA algorithm more easily to jumps out of the local optimal solution, and eventually converges to the global optimal solution, which demonstrates the effectiveness of the local search strategy.
Figure 9a–d shows that the algorithm has superior local optimization and global search capabilities, and the average fitness of the NSGA-II-SA algorithm is also optimal in four dimensions, which has better comprehensive performance in the optimization task of service composition in a low-carbon environment.
The Pareto optimal solution set obtained by the NSGA-II-SA algorithm was used as the candidate outsourcing service composition scheme set. There were 257 service composition schemes in total. According to the preferences of the evaluation experts for service time, service cost, service carbon emissions, and service reliability based on company demand, the triangular fuzzy judgment matrix
B was constructed, namely:
First of all, TFNAHP weight was calculated according to the above triangular fuzzy judgment matrix
B, and the subjective weight vector = [0.165018, 0.408612, 0.25476, 0.171609] was obtained. Secondly, EWM was used for objective weight calculation, and the objective weight vector = [0.143995, 0.179822, 0.075319, 0.600865] was obtained, and then the comprehensive weight was calculated according to Equation (27), and the comprehensive weight coefficient vector W = [0.108234, 0.334687, 0.087401, 0.469679] was obtained. Finally, according to Equation (18), the comprehensive evaluation value
EVi of each candidate outsourcing service composition was calculated, sorted, and displayed in
Table 6.
According to the ranking results of the comprehensive evaluation values in
Table 6, the 8th group of
OSCS [2,4,4,2,3] was selected as the final service optimization scheme.
Figure 10 shows the transportation route of the CMfg solution. The outsourcing suppliers were selected from the central and eastern coastal areas. The algorithm fully took into account carbon emissions, transportation, and other factors.
7. Conclusions
CMfg has received strong support from academia and industry in recent years. The cloud service platform can not only meet the complex and unique requirements of users, but also integrate a large number of idle manufacturing resources. The rational utilization of resources greatly improves the resource utilization of SMEs. In order to respond to the national “dual carbon” goals and protect the earth’s environment, this paper integrates the concept of low-carbon environmental protection into the CMfg system. It innovatively incorporates carbon emissions into the QoS evaluation indicators. At the same time, it also considers the influence of geographical location factors on the QoS indicators, and establishes the composition optimization model of CMfg in a low-carbon environment.
In this paper, we proposed a hybrid multi-objective evolutionary algorithm (NSGA-II-SA) for the model. The local search capability of the NSGA-II algorithm is improved by integrating the local search strategy of neighborhood search and the SA algorithm. Meanwhile, more Pareto optimal solutions can be obtained by combining the excellent global search capability of NSGA-II to solve the model. Through solving an example of natural gas cylinder head production, the comparison results between NSGA-II-SA, NSGA-II, PESA-II, and MOPSO show that the Pareto solution obtained by the NSGA-II-SA algorithm occupies the largest proportion. Meanwhile, the average fitness of the four optimization objectives of service time, service cost, service carbon emissions, and service reliability is also optimal, which verifies that it has better comprehensive performance in the optimization task of service composition in the low-carbon environment.
In order to reflect the subjective preference and certain objective basis of users at the same time, we proposed an algorithm result optimization strategy based on the combination of TFNAHP and EWM to filter the Pareto optimal solution set obtained by the algorithm, so as to obtain the relative optimal solution, which can be more in line with users’ individual needs.
In an actual production situation, customers’ demands are constantly changing, and production-related data are also changing dynamically. Future research can concentrate on the dynamic changes of production data and customer demand, which should be considered while solving the SCOS. At the same time, the mining of the value of historical service data, combined with artificial intelligence learning and big data analysis technology, further improves the scientificity of service optimization, which is also worth exploring. In addition, according to the characteristics of the NSGA-II-SA algorithm proposed in this paper, its applications in function optimization, advanced planning and scheduling (APS), and the traveling salesman problem (TSP) can also be explored in the future.

 ,
, 


