Article

Mechanical Properties and Water Resistance of Magnesium Oxychloride Cement–Solidified Residual Sludge

College of Civil Engineering, Liaoning Petrochemical University, Fushun 113001, China
*
Author to whom correspondence should be addressed.
Processes 2023, 11(2), 413; https://doi.org/10.3390/pr11020413
Submission received: 22 December 2022 / Revised: 22 January 2023 / Accepted: 27 January 2023 / Published: 30 January 2023

Abstract

:
As a solid waste, the amount of residual sludge produced by the municipal wastewater treatment process is escalating. How to dispose it properly is attracting much attention in society. Herein, solidifying residual sludge using magnesium oxychloride cement (MOC) is promising for converting it into building materials. Various factors of mass ratio (RW/S) of liquid to solid, molar ratio (Rn) of MgO to MgCl2 in MOC, mass ratio (Rm) of residual sludge to MOC, the mass concentration of Na2SiO3 (DNa2SiO3), and dosage of fly ash (DF) influenced the unconfined compression strength (RC) of the as–obtained MOC–solidified residual sludge, and it was characterized using SEM and XRD analysis. The results show that the value of RC for MOC–residual sludge solidified blocks increased initially and then decreased as Rn and Rm increased, respectively, for 60–day curing. At 10–day curing, equilibrium RC was reached at all RW/S values except 1.38, and at 60–day curing, RC decreased with RW/S increasing. The maximum RC of 60 days of 20.90 MPa was obtained at RW/S = 0.90, Rn = 5.0, and Rm = 1.00. Furthermore, adding Na2SiO3 or fly ash in the solidifying process could improve RC. The water resistance test showed that SM13 and NF5 samples exhibited good alkaline resistance after immersion for 7 and 14 days in an aqueous solution with pH = 7.0–11.0. The water resistance of MOC–residual sludge solidified blocks decreased with increase in immersion duration in aqueous solutions. The fly ash could also help improve water resistance of MOC–solidified residual sludge in neutral and basic aqueous solutions. This work provides an important theoretical basis and possibility for the efficient disposal and comprehensive utilization of residual sludge through solidification/stabilization technology using MOC from the perspective of mechanics and water resistance.

1. Introduction

With the social development and progress of human civilization, more emphasis is placed on environmental health, and safe and beneficial disposal of wastewater. As a byproduct, the residual sludge is a dilute suspension of solids generated commonly in screening, coagulation–flocculation, sedimentation, and granular filtration procedures of the municipal wastewater treatment process [1,2,3,4]. The amount of residual sludge is increasing worldwide at an alarming rate because of the increased amount of municipal sewage and rapid development of population, urbanization, industrialization, sewage drainage systems, and wastewater treatment facilities [1,5,6,7,8,9,10,11,12]. The heavy metals, organic and inorganic compounds, and microorganisms contained in residual sludge are harmful to soil, vegetation, animals, and humans [6,7,8,9,12,13,14,15,16,17,18,19,20,21,22,23]. Some sludge was transported for treatment as a hazardous waste before discharging into the environment [24]. Due to the potential toxicity and ecotoxicological risks of untreated sludge to the environment, conventional methods such as discarding in landfills and water bodies and composting are being eliminated [6,8,9,12,21]. This has given rise to three types methods, namely, thermal treatment, biological treatment, and chemical treatment [7,9,12,18,21,22,23,25,26,27,28,29,30,31,32]. These methods are, however, not widely applied in China, and only a small proportion of residual sludge has been used for composting and material recovery [6,7,29]. Thus, the proper recycling of residual sludge is needed to alleviate a number of environmental problems and reduce operating costs of water treatment plants.
Recycling residual sludge as the traditional raw ingredients in the construction industry is a promising approach, which is used mainly in forms of dewatered sludge, dry sludge, or incinerated sludge ash in different construction applications such as cement-based materials production, ceramic products, lightweight construction materials, soil stabilization, and other civil engineering applications (such as landfill lining) [33,34,35,36,37,38,39,40,41,42,43,44,45,46,47,48,49,50,51,52,53,54,55,56,57], while in the literatures, using residual sludge in a form of semiliquid state (with high content of water) as a construction material is rarely reported.
Solidification/stabilization (S/S) methods can prevent harmful chemicals from being released into the environment though chemical or mechanical binding using curing agents [6,58,59,60]. Magnesium oxychloride cement (MOC), known as Sorel cement, comprises MgO and MgCl2; it is typically used as a curing agent for S/S of solid waste, because of its good engineering and mechanical properties, fast curing, air hardening, good resistance to abrasion and fire, and so on [61,62,63,64,65,66,67]. MgO and MgCl2 react with water to form MgO–MgCl2–H2O systems such as Mg(OH)2·MgCl2·8H2O (phase 3) and 5 Mg(OH)2·MgCl2·8H2O (phase 5), which are the main substances to form strength of MOC–solid waste in the solidifying process [64,67,68,69,70,71,72,73,74,75]. Using MOC to solidify the residual sludge in a form of semiliquid state could replace a part of water; the containing contaminants would be bound in MOC–sludge solidified blocks to alleviate some environmental problems from residual sludge.
In this study, residual sludge from sewage treatment plants was solidified using MOC as a building material. Fly ash and sodium silicate (Na2SiO3) were added during the solidification process for improving unconfined compressive strength (RC) and moisture absorption. RC tests were used to investigate the influences of major factors, namely, mass ratio (RW/S) of liquid to solid, molar ratio (Rn) of MgO to MgCl2 in MOC, mass ratio (Rm) of residual sludge to MOC, the mass concentration of Na2SiO3 (DNa2SiO3), and dosage of fly ash (DF). The microtopography of MOC–solidified residual sludge was observed using scanning electron microscopy (SEM), and crystal composition of crystal was analyzed using X-ray diffraction (XRD) analysis to reveal intrinsic mechanisms. To investigate the water resistance properties of MOC–sludge solidified block, and effects of Na2SiO3 and fly ash on the water resistance properties, SM13, NG7, and NF5 samples were used as representatives to measure the unconfined compression strength (RAC) after immersion in aqueous solutions with varying pH values for 7 or 14 days. The coefficient of corrosion resistance (KF) was used to evaluate the water resistance in acidic, neutral, and basic aqueous solutions. We hope the MOC–solidified residual sludge could satisfy the mechanical and water resistance requirements as a building material though this study, providing a theoretical basis for utilization of residual sludge as a resource.

2. Experiments

2.1. Raw Materials

The residual sludge (aqueous, dark brown) used in this study was taken from a wastewater treatment plant in Liaoning Province. MgO and MgCl2 were analytical grade and purchased from Bidepharm Medical Technology Co., Ltd. (Shanghai, China). Analytical–grade sodium silicate (Na2SiO3; modulus = 2.43, apparent density = 0.76 g·cm−3) was purchased from Shanghai Rhawn Chemical Technology Co., Ltd. (Shanghai, China). Industrial-grade fly ash was purchased from Henan Gongyi Longze Water Purification Material Co., Ltd. (Gongyi, China). The main contents of the fly ash were SiO2, Al2O3, Fe2O3, CaO and so on [6]. All chemicals were used as received. Deionized water was obtained from a Hitech–Kflow water purification system (Hitech Co., Ltd., Beijing, China).

2.2. Solidification Experiment of Residual Sludge

The residual sludge was mixed with specific amounts of MgO, MgCl2, Na2SiO3, or fly ash using a slightly modified form of the method reported in our previous study [6]. Then, deionized water was added to the solid at a liquid to solid ratio, RW/S, of 0.9–1.38, and then mixed using a YD90S–8/4 cement mortar mixer (Wuxi Construction Engineering Test Equipment Co., Ltd., Wuxi, China). RW/S was calculated using Formula (1). The value of Rn of MgO to MgCl2 varied in the range of 2.0–8.0, and the value of Rm of residual sludge to MOC varied in the range of 0.50–1.50. The dosage of residual sludge (DS) in the mixed mortar varied in the range of 19.83 wt%–53.33 wt%. DNa2SiO3 and DF were calculated using Formulas (2) and (3), respectively. The process of solidification of residual sludge using MOC is shown in Table 1. In Table 1, M1–M12 samples were designed as comparison for investigating the effects of Rn and RW/S on RC, respectively; SM1–SM7, SM8–SM12, and SM13–SM16 were designed to investigate the effects of Rn, Rm, and RW/S on RC of MOC–residual sludge solidified blocks, respectively; NG1–NG7 and NF5–NF20 were designed to investigate the effects of DNa2SiO3 and DF on RC of MOC–residual sludge solidified blocks, respectively. The MOC–residual sludge mixing mud was shaken in a shaking table for 20 min to remove air bubbles, and then it was injected into a cubic Plexiglass mold (dimensions = 40 mm × 40 mm). The MOC–residual sludge mixing mud in cubic Plexiglass mold was treated in the curing box at 20 ± 1 °C with relative humidity of ≥95% for 24 h, forming solidified blocks. These solidified blocks were then demolded and sealed with plastic cling film, and placed under natural maintenance conditions to be cured for 3–60 days [10]. The values of RC (calculated using Formula (4)) of 3–60 days were measured using a YAW–1000A Electro–hydraulic servo pressure testing machine controlled by microcomputer (Jinan Dong Fang Test Instrument Co., Ltd., Jinan, China). The testing machine loads a specimen at a speed of 2400 ± 200 N/s until it is destroyed, and the maximum load is FC.
R W / S = m S × 87.75 % + m w m S × 12.25 % + m M g O + m M g C l 2 + m Na 2 S iO 3 + m F
D F = m F m F + m M O C × 100 %
D N a 2 S i O 3 = m Na 2 S iO 3 m S × 87.75 % + m w + m Na 2 S iO 3 × 100 %
RC = FC/A
where mS, mw, mF, mMgO, mMgCl2, and mNa2SiO3 are the masses (gram) of surplus sludge, added water, fly ash, MgO, MgCl2, and Na2SiO3, respectively; mMOC is the total mass of MgO and MgCl2. FC is the maximum load (newton) at failure. A is the pressure area (mm2).

2.3. Water Resistance Test of Solidified Blocks

After 28–day curing, the solidified block samples of SM13, NG7, and NF5 were immersed into aqueous solutions with different pH values (3.0–11.0), respectively, for 7 or 14 days. The pH of the aqueous solution was monitored using the electrode method every 24 h and adjusted using sulfuric acid or sodium hydroxide to keep the pH constant. The unconfined compression strength of solidified blocks after immersion in aqueous solutions with different pH values was denoted as RAC. The unconfined compression strength of the solidified block samples without immersion in aqueous solution was denoted as RC. The coefficient of corrosion resistance (KF) was given as the ratio of RAC to RC, and it was calculated using Formula (5).
K F = R A C R C × 100 %
All tests described above were conducted in triplicate, and the final RC or RAC values were an average of the three measurements.

2.4. Characterization

The composition and pH value of residual sludge were determined using a mass-loss technique and the electrode method according to a standard of determination method for municipal sludge in wastewater treatment plants (CJ/T 221–2005) reported in our previous work [6,30]. The MOC–solidified residual sludge prepared was crushed using a compression–testing machine (Jinan Dong Fang Test Instrument Co., Ltd., Jinan, China), and the collected specimen was ground to powder. The powdered sample was passed through a 100–mesh sieve; the filtered fine powder was characterized using SEM (JSM–7610FPlus, Jeol Japan) and XRD to observe the morphology of solidified sludge samples, and the crystal structures were analyzed using a D/max–rA model diffractometer (Bruker Co., Karlsruhe, Germany) with Cu Kα radiation (λ = 1.54184 Å) operating at 40 kV and 40 mA.

3. Results and Discussion

3.1. Characterization of Solidified Blocks

The residual sludge used in this work comprised 87.75 wt% water, 7.74 wt% residues, and 4.54 wt% organic material. In dry surplus sludge, organic material content was 37.06 wt%, and the pH was 7.2.

3.1.1. SEM Images of Cemented Blocks

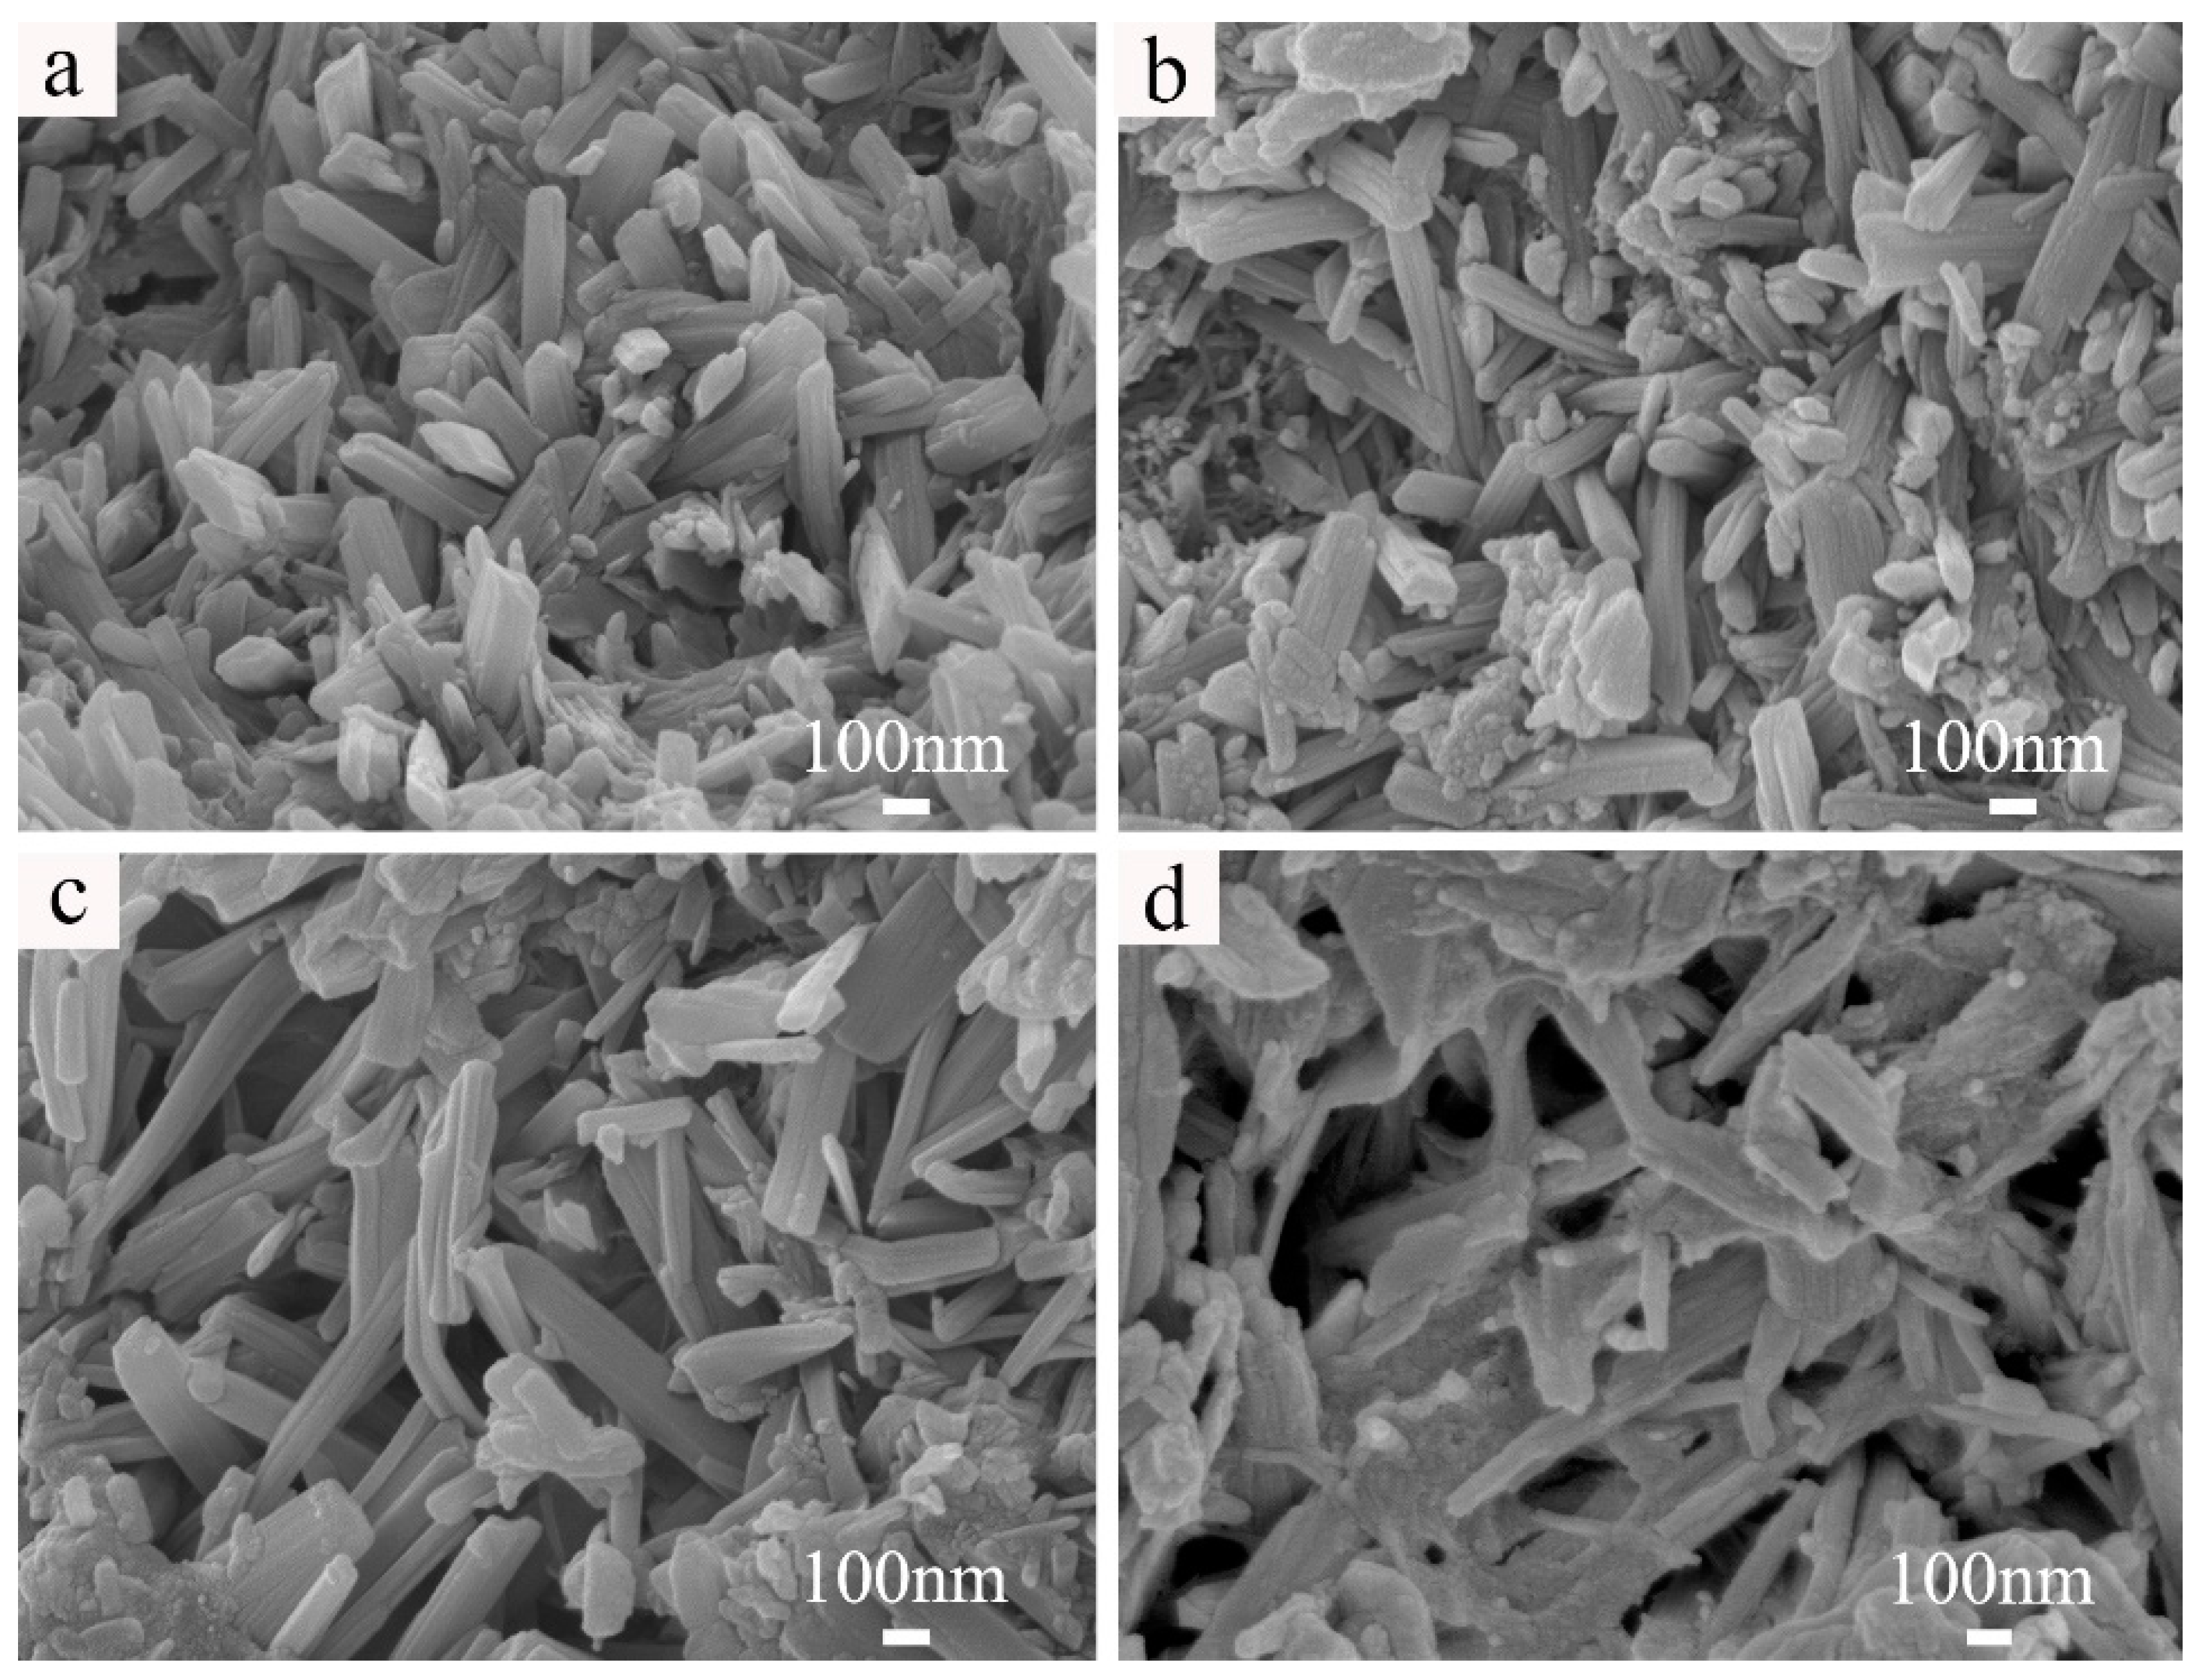
Figure 1 and Figure 2 show the SEM images of MOC–solidified blocks at different Rn of MOC and RW/S. Figure 1 shows that the needle–like and rod–like structures were formed in the MOC–solidified blocks. Sample M1 had thick rod–like structures (Figure 1a), which may be phase 5 or phase 3 [31,32]. With increase in Rn, there were more fine rod– or needle–like structures in samples M4 and M6. As shown in Figure 2, the MOC–solidified blocks contained the long rod–like structures, which were mainly formed when RW/S was 0.72 or 0.85.
SEM images of MOC–sludge solidified blocks with different Rn are shown in Figure 3. As reported in our previous work, the surplus sludge had a clumped granular structure [6]. Figure 3a–c illustrate the influence of Rn on microstructure of the MOC–residual sludge solidified blocks, showing rod–like structures encasing the granular sludge and the morphologies of rod–like structures has hardly changed with Rn increasing from 2.0 to 5.0, which indicated successful solidification of the residual sludge by MOC, and Rn only slightly influenced the structural morphology of MOC–sludge solidified block. While, the rod–like structures in Figure 3b is more compact. Figure 3b,d,e show the SEM images of MOC–surplus sludge solidified samples SM2, SM9, and sample SM12 with Rm values of 1.00, 0.67, and 1.50, respectively at Rn = 3.0 and RW/S = 1.38. Structural morphologies of these samples did not change significantly with increasing Rm. Rod–like structures encased the granular sludge. Figure 3f shows the structural morphology of sample SM13. Compared with sample SM4, the rod–like structure encasing the granular sludge formed a net–like structure when RW/S decreased to 0.90. When RW/S was 1.50, an amorphous gel structure appeared in sample SM16 (Figure 4).
Figure 5 shows the SEM images of MOC–residual sludge solidified blocks with Na2SiO3 or fly ash. Compared with sample SM13 (Figure 3f), Figure 5a,b show that samples NG1 and NG7 mainly comprised short and thick rod–like structures with relatively compact structures. Figure 5c,d show that samples NF5 and NF20 had a rod–like and thin rod–like and flaky structures, respectively.

3.1.2. XRD Analysis of Cemented Blocks

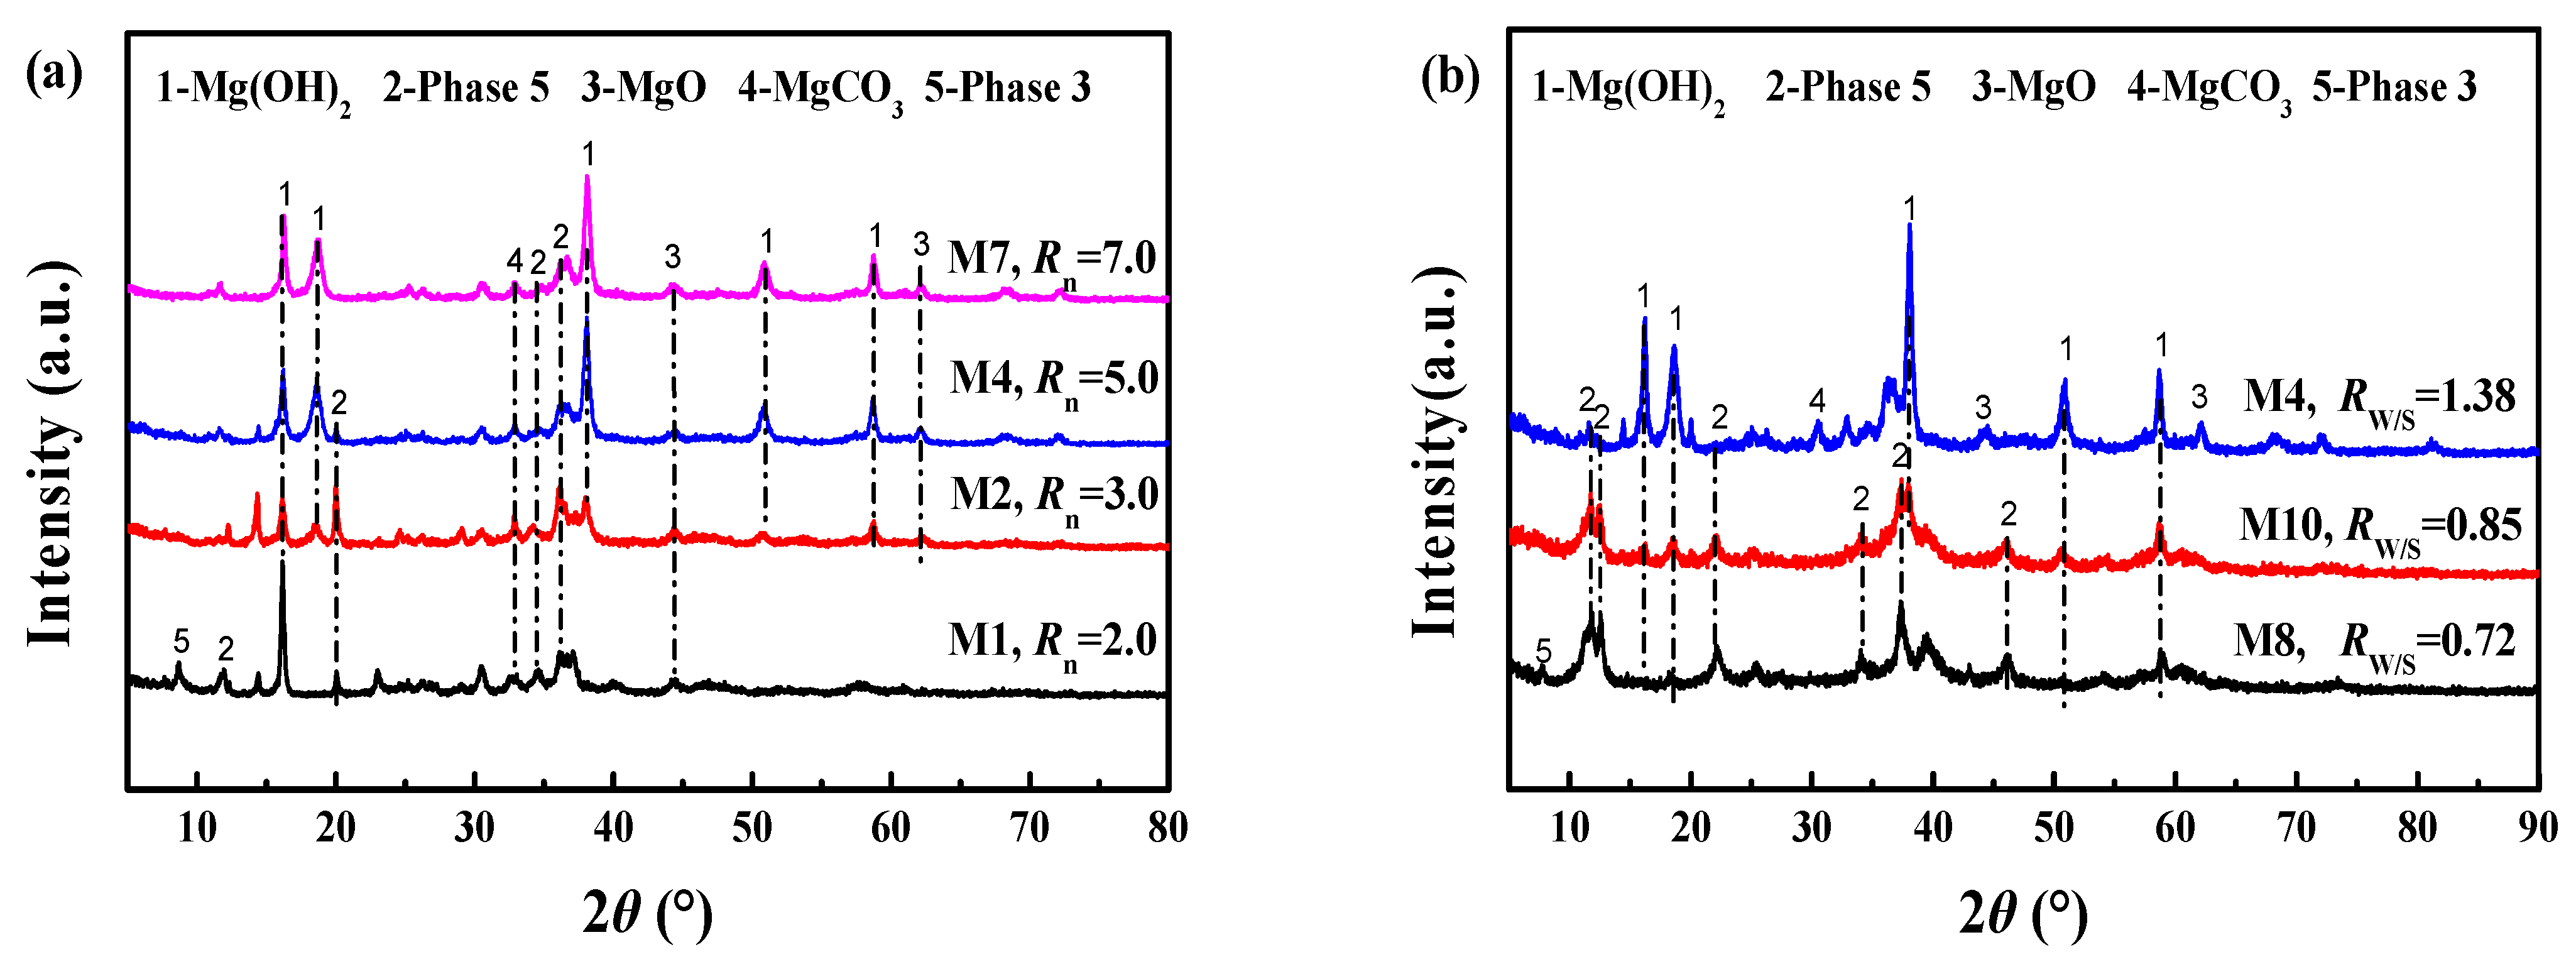
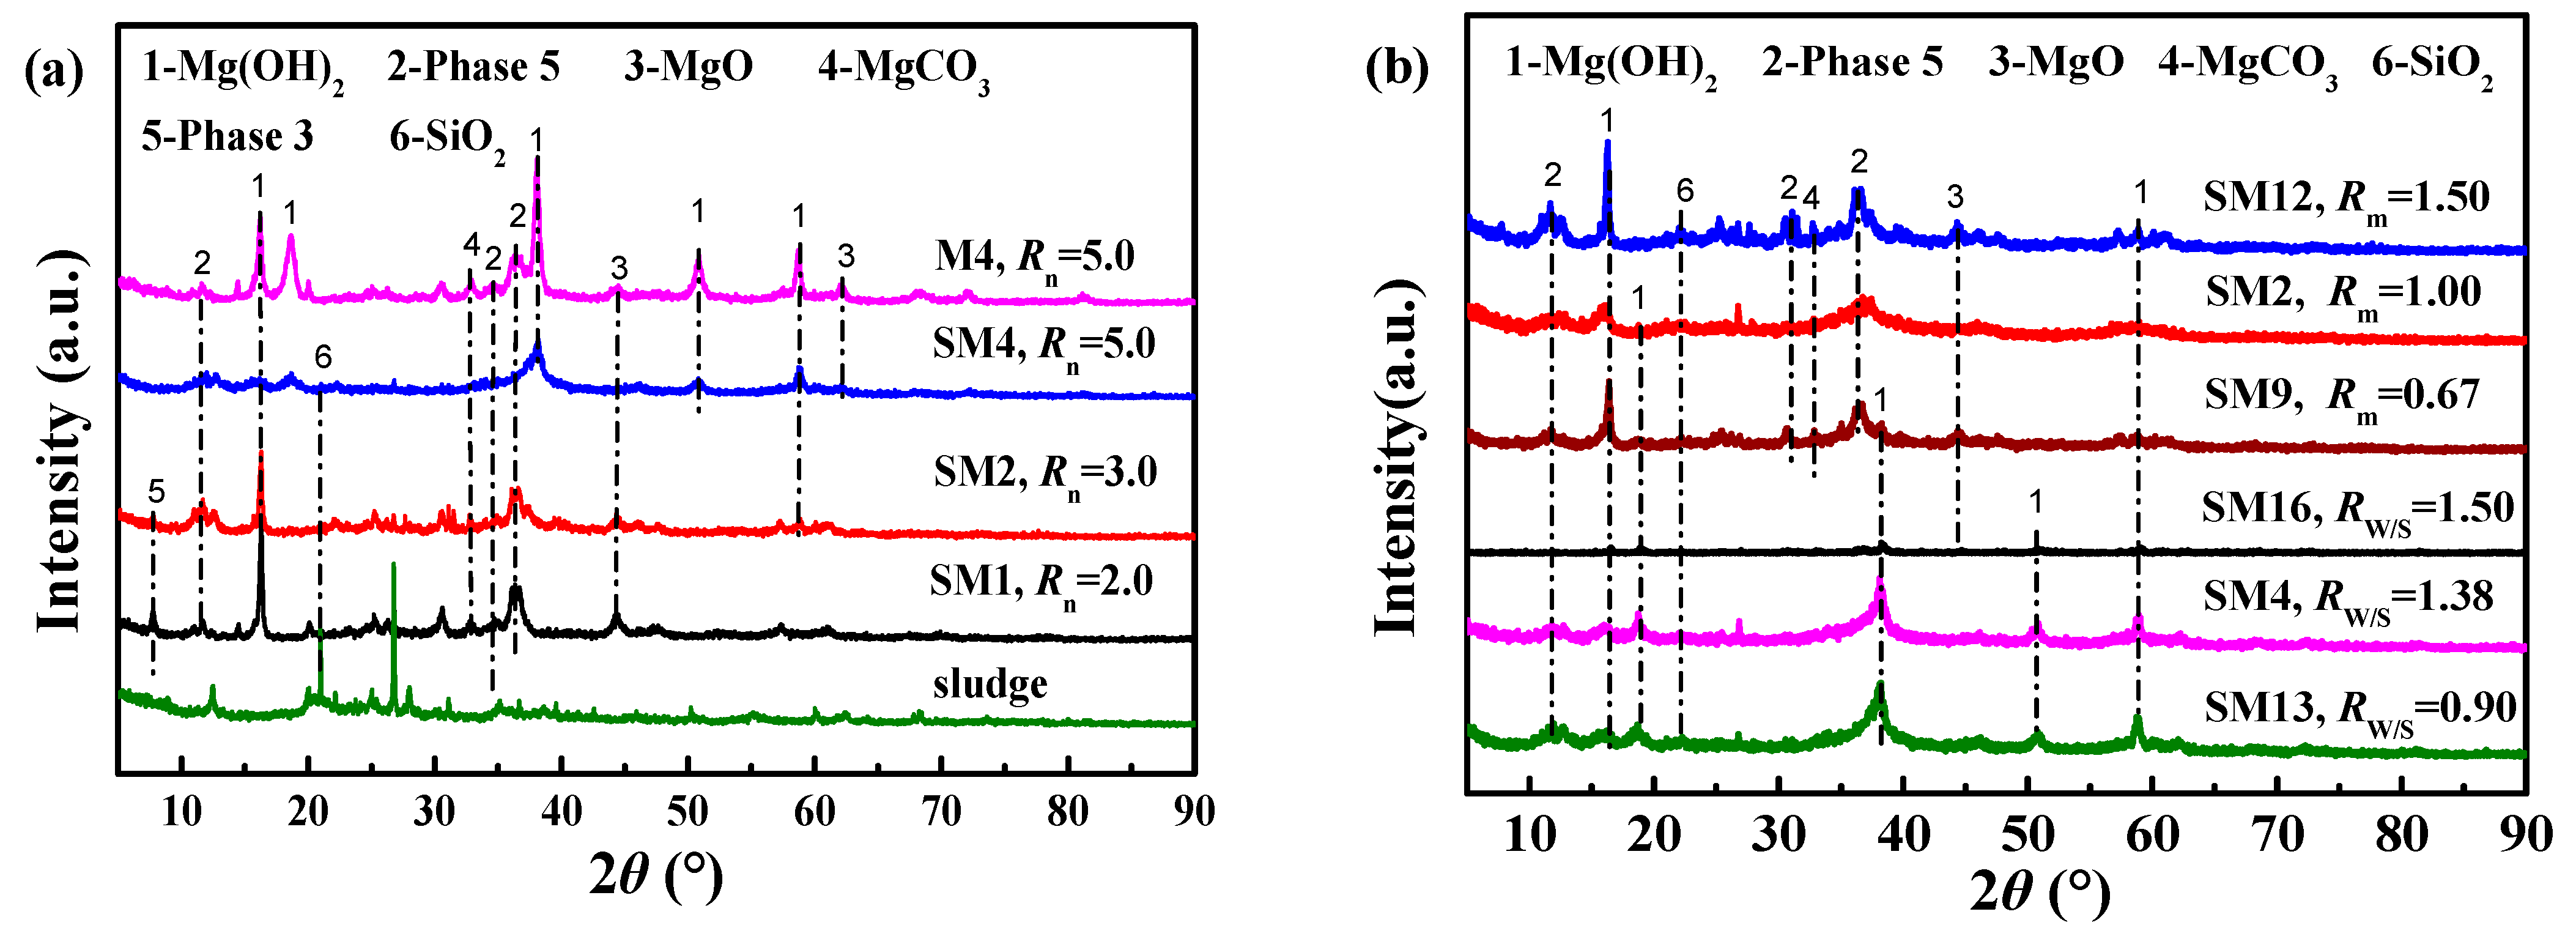
The XRD spectra of MOC–solidified blocks are shown in Figure 6. The phase composition of MOC–cemented blocks mainly comprised phase 5, unreacted MgO, and Mg(OH)2. A small amount of phase 3 was observed only in sample M1 (Rn = 2.0) and M8 (RW/S = 0.72). In the XRD spectra, phase 3, phase 5, and Mg(OH)2 were the typical hydration products [64]. Figure 7 shows XRD spectra of a blank MOC–solidified sample, sludge, and MOC–surplus sludge solidified blocks. Figure 7a shows that the sludge and MOC–sludge solidified samples contained SiO2 which was from sludge, indicating that the surplus sludge was solidified by MOC. As Rn increased, the peak intensity of phase 5 weakened. Phase 5 could be observed in SM1 and SM2, as shown in Figure 7a. The peak of Mg(OH)2 at 2θ = 17.5° was weakened at Rm = 1.00, RW/S = 1.38, and Rn = 3.0 (Figure 7b). When RW/S increased to 1.50, the peaks of Mg(OH)2, SiO2, phase 5, and MgO weakened significantly and even disappeared (Figure 7b).

3.2. Effects of Rn and Mass Ratio of RW/S on RC of MOC–Cemented Blocks

Figure 8 shows the images of prepared MOC–solidified blocks for Rn varying from 2.0 to 8.0 at RW/S = 1.38, and Figure 9 shows the photos of the MOC–solidified blocks with different values of RW/S at Rn = 5.0. All MOC–solidified blocks were white. Water droplets appeared on the surfaces of the MOC–solidified block when Rn was 7.0 at RW/S = 1.38 (Figure S1 in Supporting Information). Cracking was observed on the surface of the MOC–solidified blocks when Rn was 8.0 at RW/S = 1.38. At lower RW/S (<1.0), the MOC–solidified block was crunchy and easy to crack.
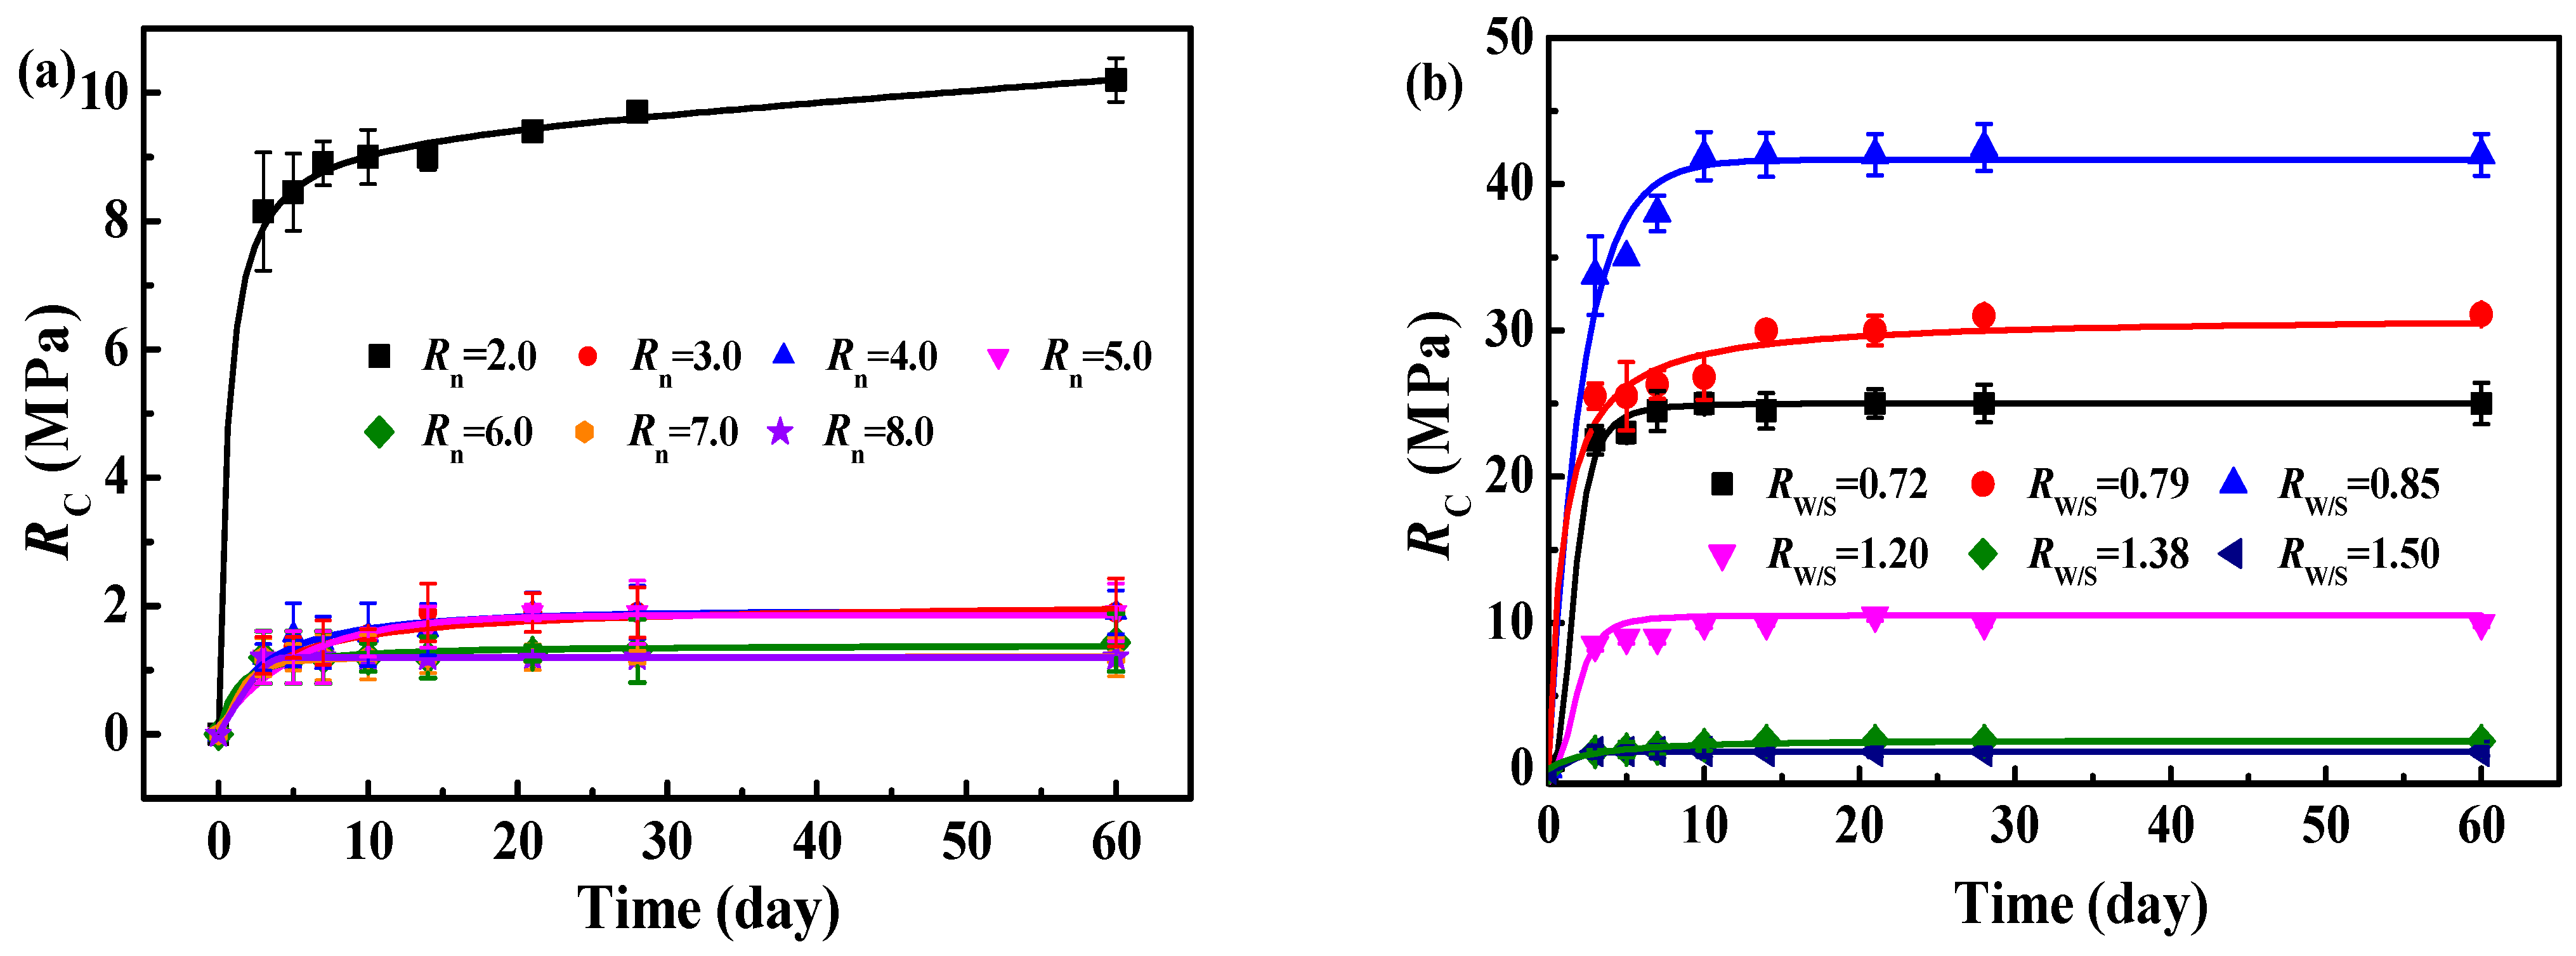
The effects of Rn of MOC and RW/S on RC of the MOC–residual sludge solidified blocks were investigated first as blank experiments. Figure 10a shows the effect of Rn of MgO to MgCl2 on RC of MOC–solidified blocks when RW/S was 1.38. The RC of MOC–solidified blocks reached the equilibrium strength after 14–day curing when Rn was >2.0. The maximum RC of 10.20 MPa was reached after 60–day curing when Rn was 2.0. With Rn increasing, the RC of MOC–solidified blocks decreased generally. That may be because some of phase 3 and phase 5 were formed in M1 (Rn = 2.0); the number of lumpy Mg(OH)2 peaks increased and the number of phase 5 peaks decreased when Rn increased (Figure 6a). Needle– or long–rod–like crystals were observed for phase 3 and phase 5, and the lumpy Mg(OH)2, respectively (Figure 1). The maximum formation of phase 5 crystals provides the most mechanical strength to the samples [75]. Therefore, the formation of phases 3 and 5 helped increase strength.
Figure 10b shows the influence of RW/S on RC of MOC–solidified blocks at Rn = 5.0. The value of RC of MOC first increased when RW/S increased from 0.72 to 0.85, and then it decreased when RW/S increased from 0.85 to 1.50. The maximum RC reached the equilibrium value of 42.50 MPa at approximately 10 days when RW/S was 0.85. The number of phase 5 peaks decreased when RW/S increased from 0.85 (M10) to 1.38 (M4), resulting in RC decreasing, as demonstrated in Figure 6b, due to that phase 5 was the main strength phase for MOC–solidified blocks. M8 (RW/S = 0.72) contained phase 3 and 5, and the number of Mg(OH)2 peaks was lower than that in M4 and sample M10. SEM images show needle– or long–rod–like phase 3 and 5 in M8 and M10 (Figure 2). This led to the highest RC when RW/S was 0.85 (sample M10).

3.3. MOC–Solidified Residual Sludge

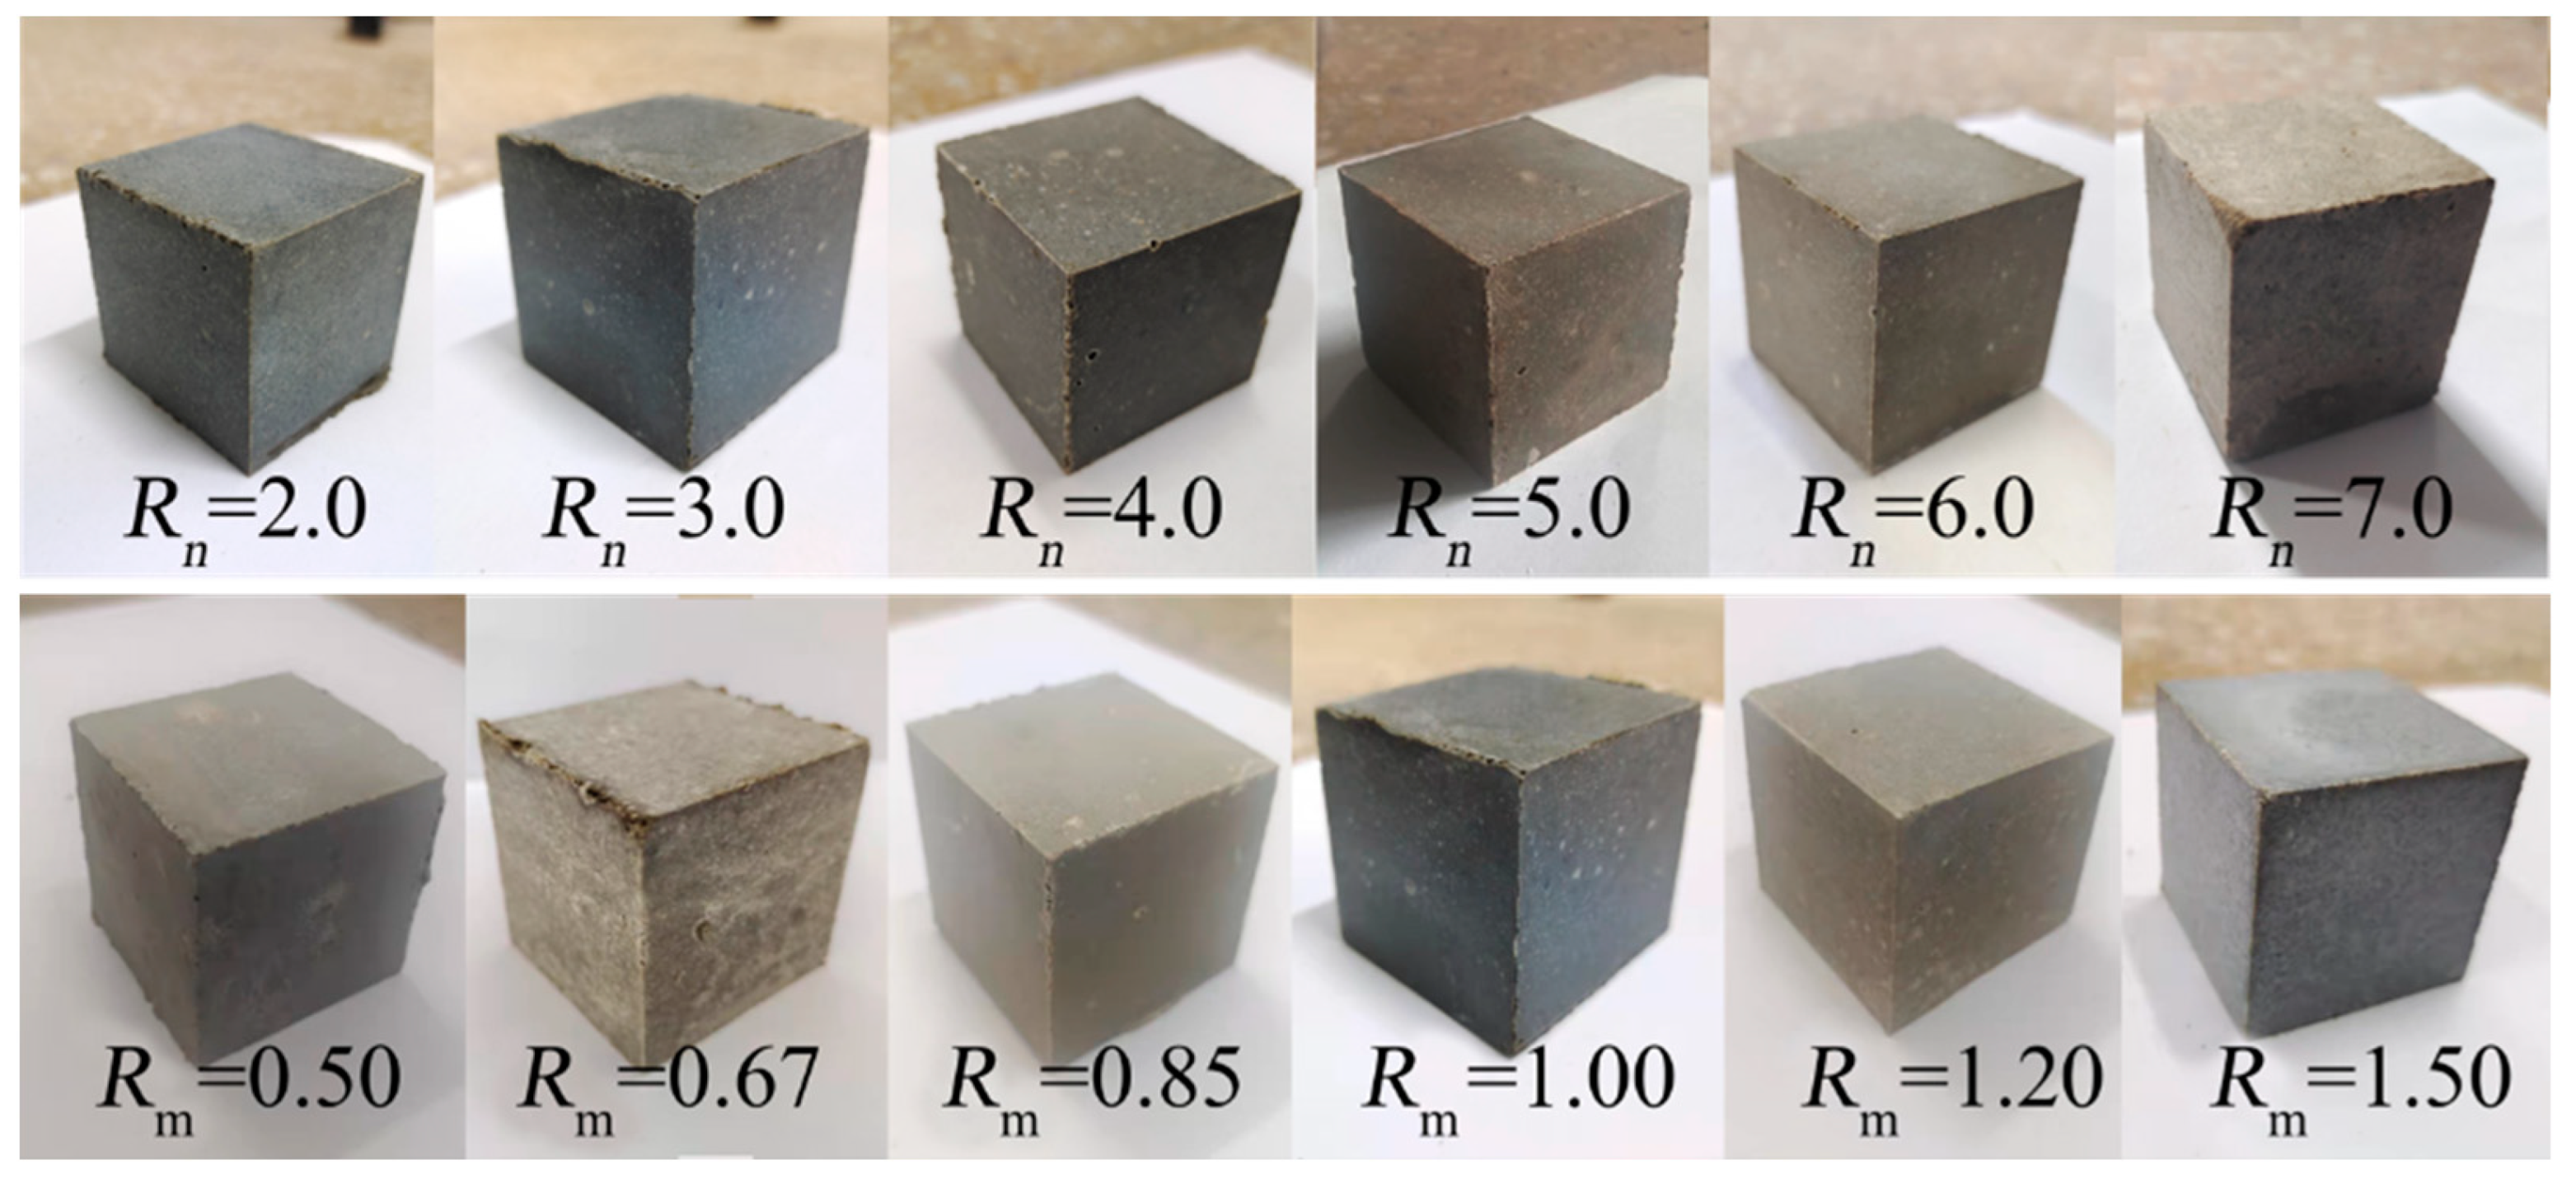
Figure 11 shows images of MOC–residual sludge solidified blocks with different values of Rn (RW/S = 1.38, Rm = 1.00) and Rm (RW/S = 1.38, Rn = 3.0) after 60–day curing. Compared with MOC–solidified blocks, the color of MOC–residual sludge solidified blocks changed to light black from dark black with Rn increasing when RW/S was 1.38 and Rm was 1.00. This was because the weight percentage of white MgO (powder) increased from 17.20 wt% to 28.03 wt% with Rn increasing from 2.0 to 7.0. Furthermore, no water droplets appeared on the surfaces of the MOC–sludge solidified specimens. The hygroscopic solidified surplus sludge could imbibe the superfluous water droplets during solidification, which limited the migration of aqueous solution to the surface [76]. No frosting phenomenon was observed on the specimens’ surfaces when Rn and Rm increased within the experimental range. Figure 12 shows images of the MOC–residual sludge solidified blocks with different values of RW/S when Rm was 1.00 and Rn was 5.0 after 60–day curing. No frosting phenomenon appeared on the specimens’ surfaces with Rn, Rm, and RW/S increasing within the experimental range. The volumes of the solidified blocks were not influenced by Rn, Rm, and RW/S.

3.3.1. Influence of Rn on RC of MOC–Solidified Residual Sludge

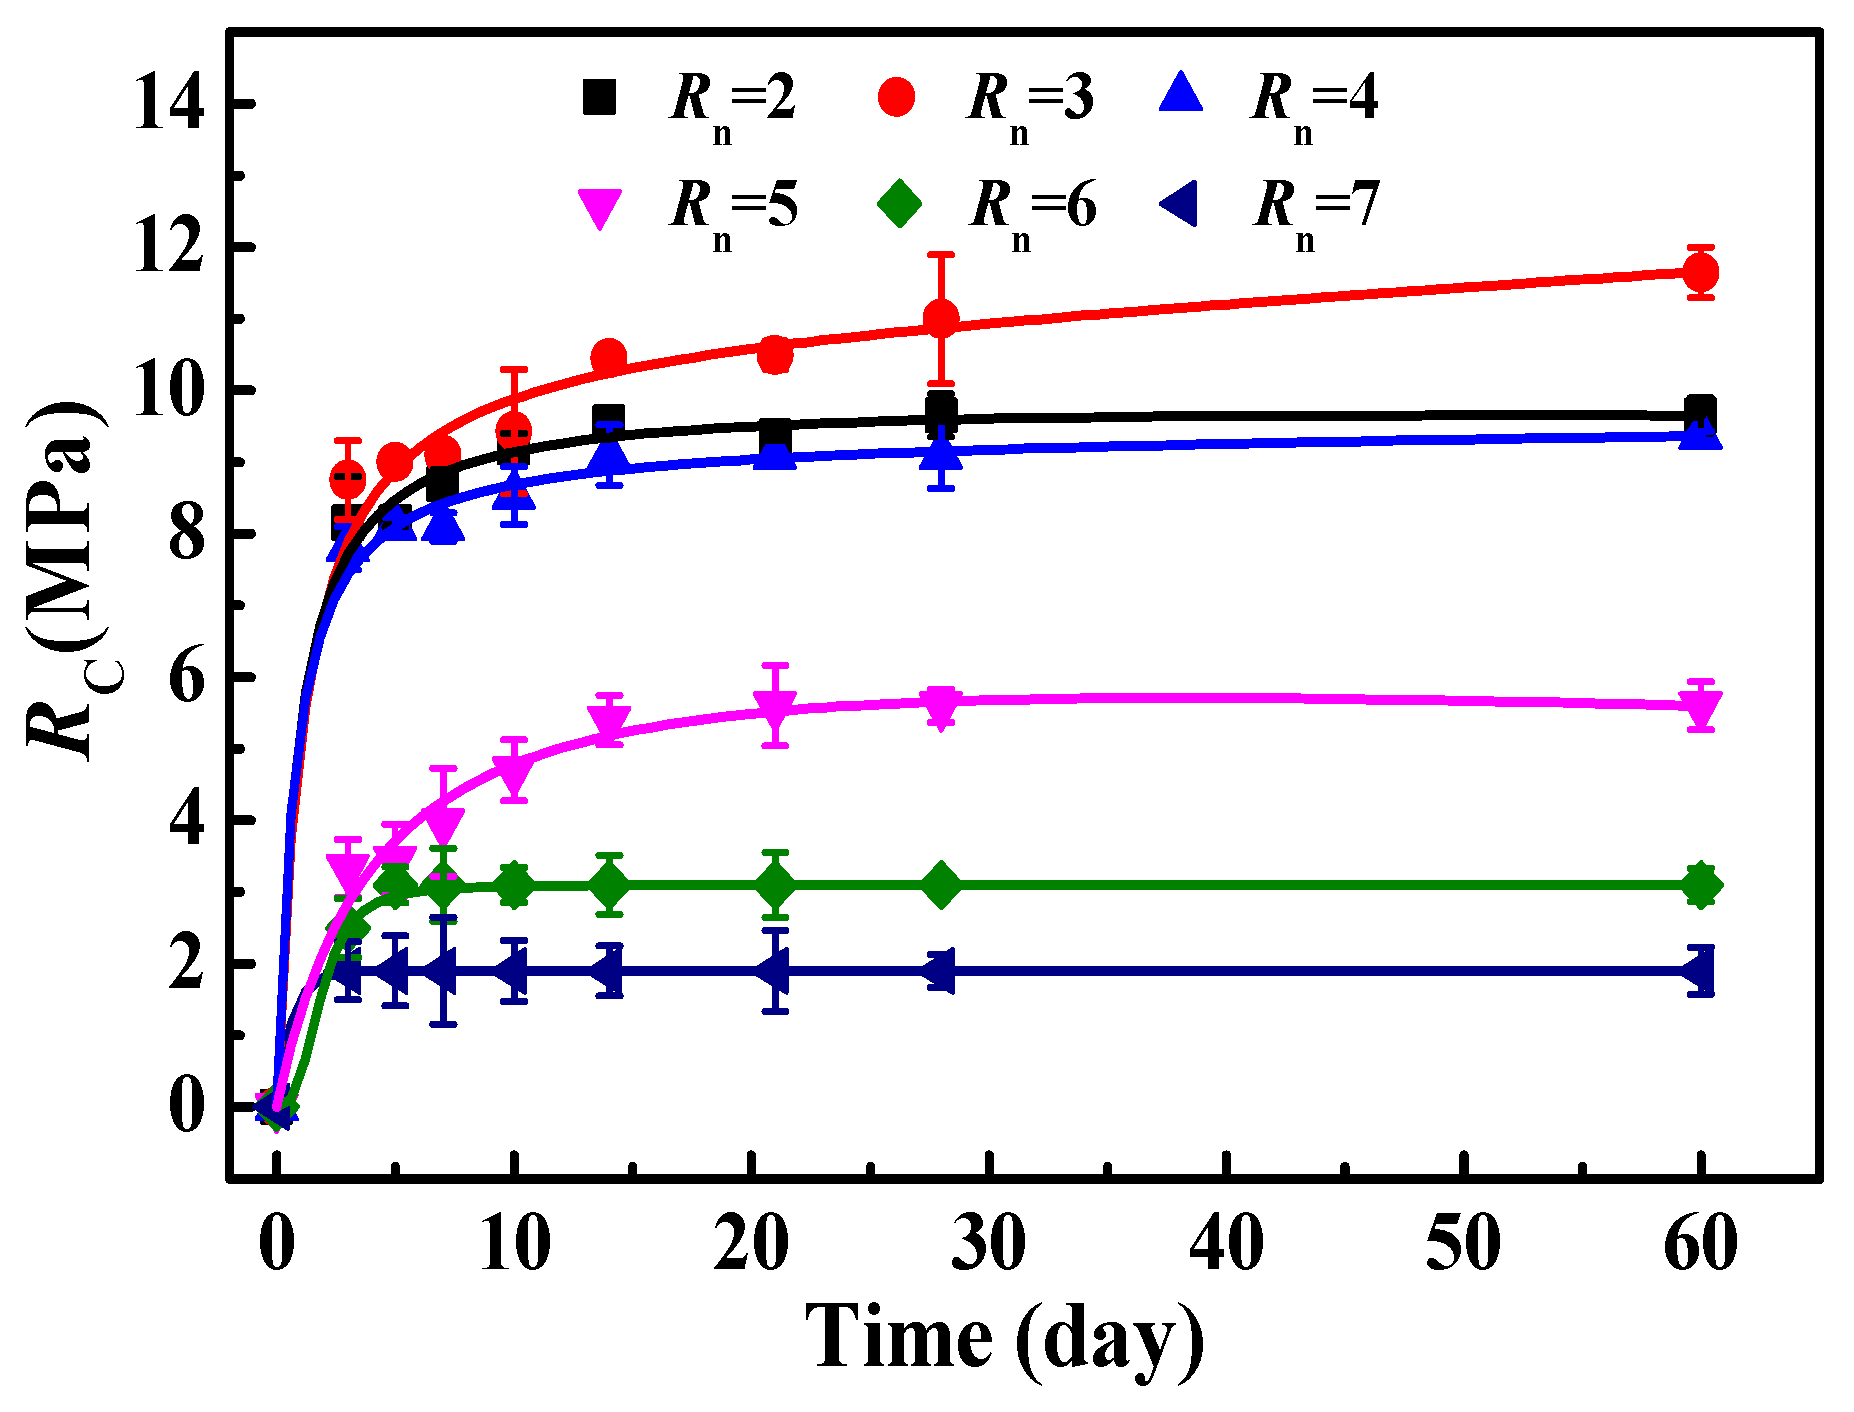
Figure 13 illustrates the influence of Rn on the RC of the MOC–residual sludge solidified blocks when RW/S was 1.38 and Rm of residual sludge to MOC was 1.00. The RC of MOC–solidified residual sludge first increased and then decreased as Rn increased. The maximum RC of 11.65 MPa was obtained at 60–day curing at Rn = 3.0. This was because the main phases of phase 3 and 5 at room temperature (~25 °C) were formed in the hydration process of MOC–residual sludge mixed mortar [77], and were the main sources of strength, as observed in SEM images in Figure 3 and demonstrated in XRD spectra shown in Figure 7a. Due to the morphology of rod–like structures was affected by Rn, the more compact rod–like structure maybe cause the maximum RC of 60 days obtained at Rn = 3.0 (Figure 3a–c). Compared with the blank MOC–solidified sample M2 (Rn = 3.0, RW/S = 1.38), RC of the MOC–residual sludge solidified sample SM2 (Rn = 3.0, RW/S = 1.38) was higher; however, the reason for this remains to be explored.

3.3.2. Influence of Rm on RC of MOC–Residual Sludge Solidified Blocks

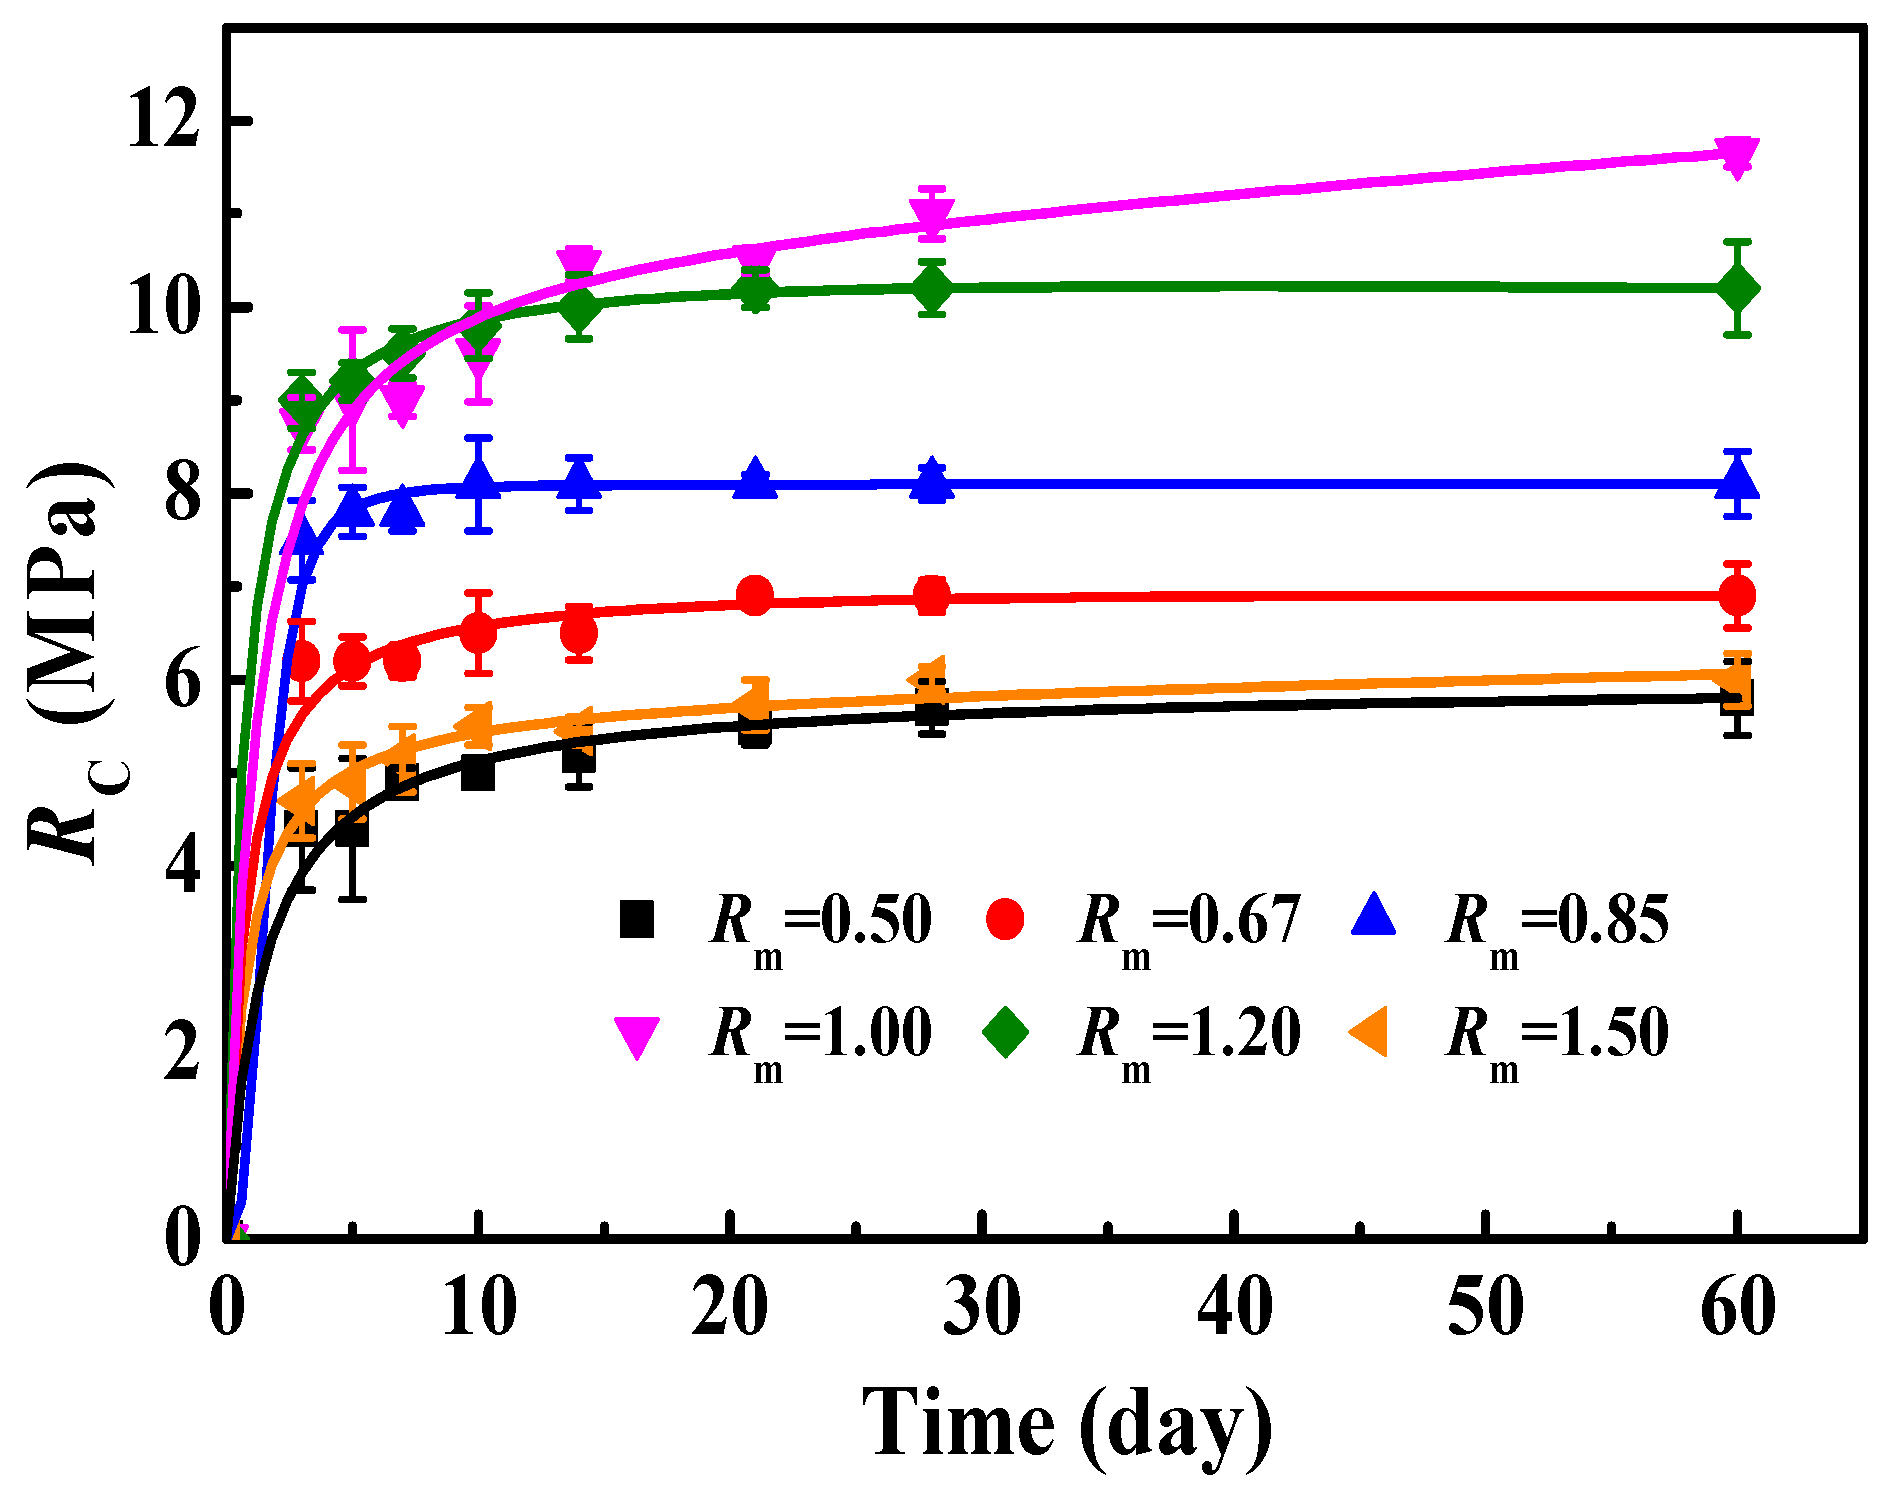
Figure 14 shows the influence of Rm on the RC of MOC–residual sludge solidified blocks when RW/S was 1.38 and Rn was 3.0. Thus, the RC of 60–day curing first increased and then decreased as Rm increased. The maximum RC of 11.65 MPa was obtained at Rm = 1.00, which was approximately six times than that (~2.0 MPa) of MOC sample M2. As shown in Figure 3b,d,e, the structural morphologies of these samples did not change significantly with Rm increasing; the rod–like structures in sample SM2 (Rm = 1.00, Figure 3b) were more compact compared with those in SM9 (Rm = 0.67) and SM12 (Rm = 1.50). Formation of compact rod–like structures may be the reason for higher RC at Rm = 1.00.

3.3.3. Influence of RW/S on RC of MOC–Residual Sludge Solidified Blocks

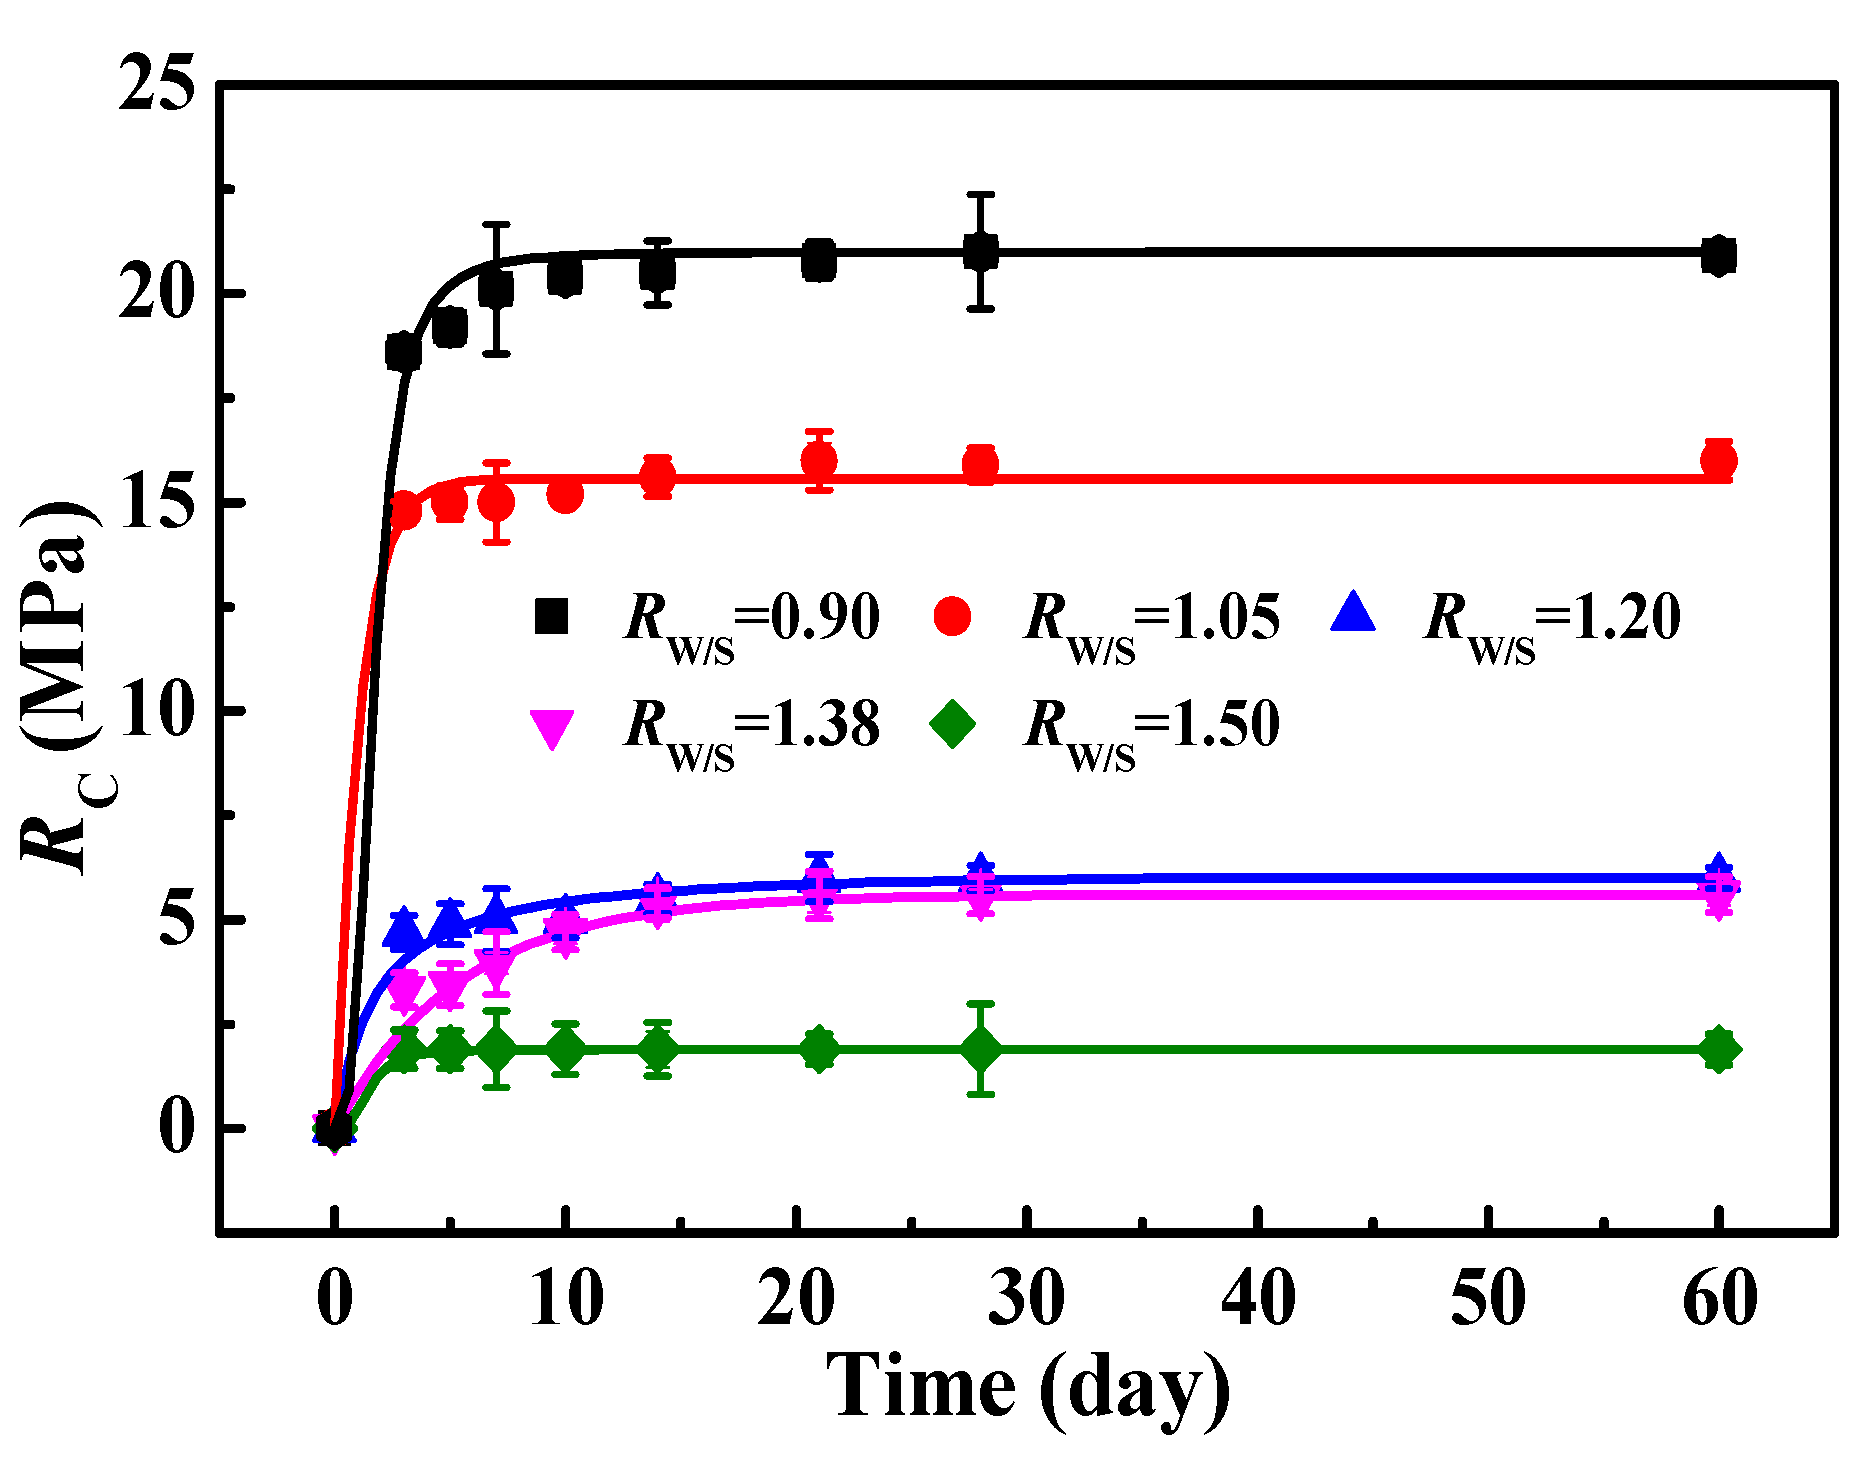
Figure 15 shows the influence of RW/S on the RC of MOC–residual sludge solidified blocks when Rn was 5.0 and Rm was 1.00. Equilibrium RC was reached at approximately 10–day curing except at RW/S = 1.38. RC of 60 days decreased when RW/S increased from 0.90 to 1.50 because of the exceeding demand for water dosage. The maximum RC of 20.90 MPa was obtained at RW/S = 0.90. When RW/S was 1.50, water dosage exceeded 91.88% of the demand for phase 5 formation. Therefore, some unstable phase 5 may have been converted to Mg(OH)2 and soluble ions when water dosage was more than the demand, resulting in strength reduction. This is demonstrated by SEM micrographs and XRD spectra in Figure 4 and Figure 7b. An amorphous gel structure Mg(OH)2 appeared in sample SM16 (Figure 4). The XRD spectra of MOC–residual sludge solidified blocks with different RW/S values show that SM13 (RW/S = 0.90) and SM4 (RW/S = 1.38) mainly contained phase 5 and Mg(OH)2. The intensity of peaks for strength phases (phases 3 and 5) weakened in SM16 (RW/S = 1.50), as shown in Figure 7b.

3.4. Influence of Na2SiO3 and Fly Ash on RC of MOC–Solidified Residual Sludge

Figure 16 shows images of MOC–residual sludge solidified blocks with different DNa2SiO3 and DF when RW/S was 0.90, at Rn = 5.0 and Rm = 1.00 after curing for 28 days. No water droplets and frosting phenomenon appeared on the surface of the MOC–sludge solidified specimens. The volumes of the solidified blocks were not influenced by DNa2SiO3 and DF.
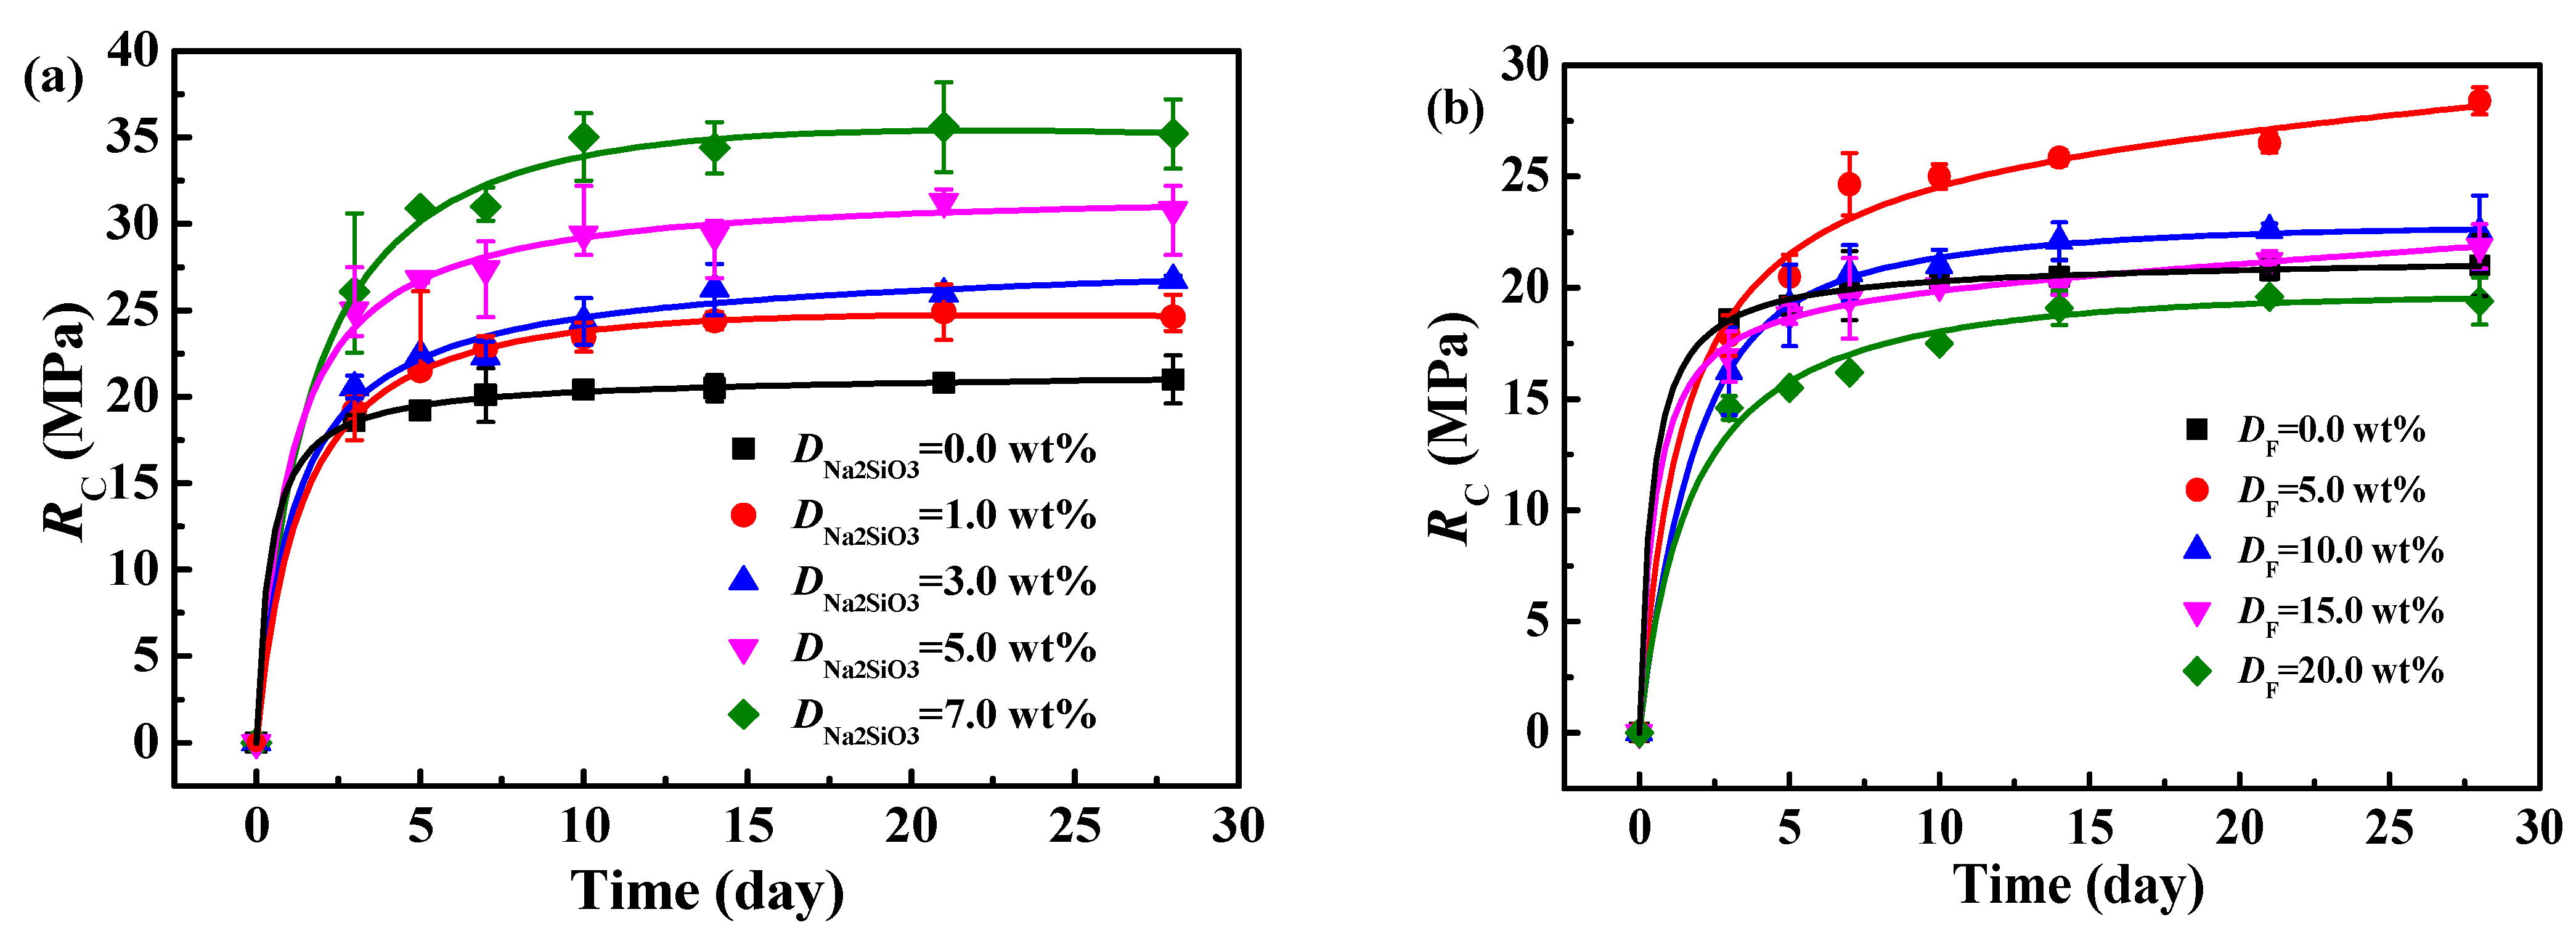
Figure 17a shows the influence of DNa2SiO3 on the RC of MOC–residual sludge solidified blocks at RW/S = 0.90, Rn = 5.0, and Rm = 1.00. RC increased as DNa2SiO3 increased and the maximum RC of 35.60 MPa was obtained when DNa2SiO3 was 7.0 wt%. The RC was higher when Na2SiO3 was added than when there was no Na2SiO3, indicating that adding Na2SiO3 improved RC, which was reported in our previous studies [6,78,79]. That may be because the Na2SiO3 addition accelerated the reaction rate and improved the yield of short and thick rod–like phase 5 (Figure 5a,b). The short and thick rod-like structure also improved the compressive strength [72].
Figure 17b shows the influence of DF on the RC of MOC–residual sludge solidified blocks at RW/S = 0.90, Rn = 5.0, and Rm = 1.00. At curing for 28 days, RC increased initially and then decreased as DF increased. The maximum RC of 28.40 MPa was obtained at DF = 5.0 wt%. As reported in previous studies [67,80], the SiO2 and Al2O3 in fly ash could react with Mg(OH)2 to generate a silica–aluminum gel system or magnesium aluminum silicate hydrate during hydration; also, fly ash filled into the MOC hydration products in the form of particles or gel, which decreased the pore space and improved structure density, resulting in strength improvement [81]. The addition of fly ash delayed the curing time compared with that in MOC–sludge solidified blocks without fly ash overview, which is consistent with the literature [82]. When DF increased to 20.0 wt%, the RC of 28 days decreased to 19.40 MPa, which was lower than that of MOC–residual sludge solidified blocks without fly ash. The reason may be that the dosage of MOC decreased with increasing DF.

3.5. Water Resistance Test of Solidified Blocks in Different Aqueous Solutions

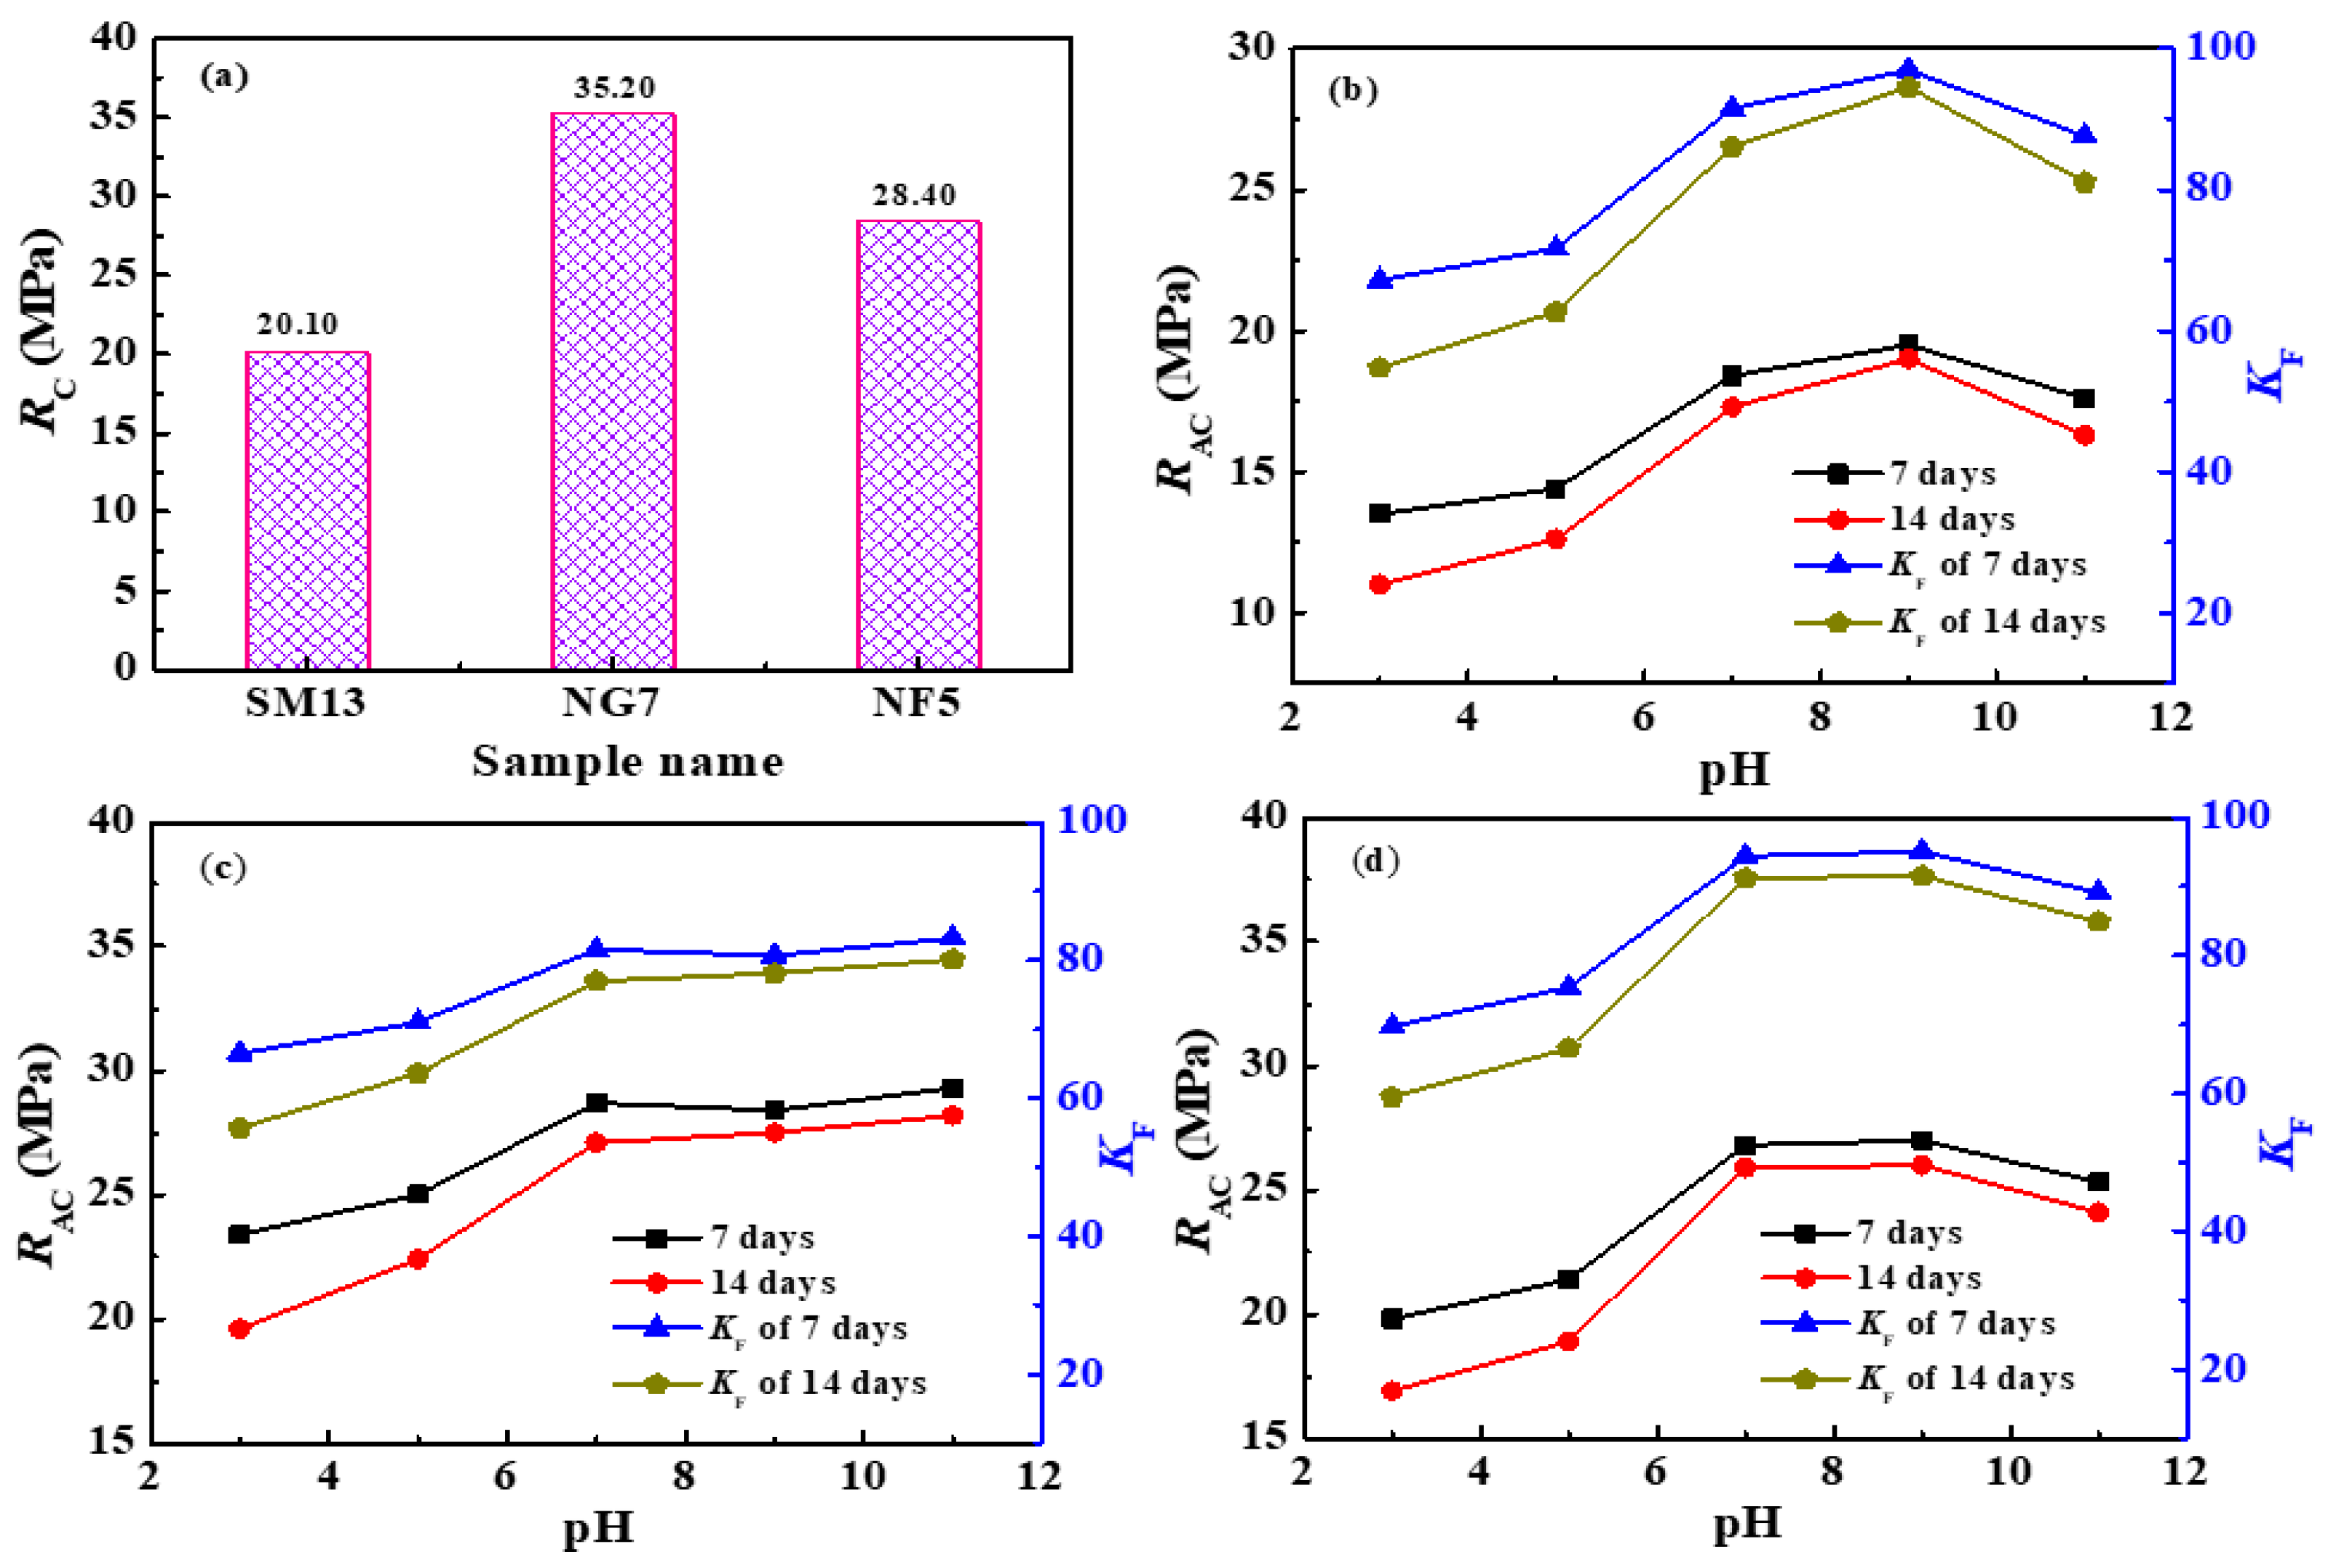
Figure 18 shows the strength curves of MOC–residual sludge solidified blocks after immersion in aqueous solutions with different pH values. NF5 and SM13 exhibited the best water resistance in aqueous solutions with pH = 3.0–7.0 and pH = 9.0. The corrosion resistance coefficient (KF) for SM13 and NF5 were above 80.0% after immersion for 7 and 14 days in aqueous solutions with pH = 7.0–11.0, indicating their good alkaline resistance. For the three SM13, NG7, and NF5 samples, KF was higher in neutral or alkaline aqueous solutions than in acidic aqueous solutions. Compared with Figure 18a, the value of RAC for samples SM13, NG7, and NF5 decreased after immersion in an aqueous solution for 7 and 14 days. KF was approximately 97.01% and 94.53% when SM13 was immersed in an aqueous solution with pH = 9.0 for 7 and 14 days (Figure 18b). For NG7 (Figure 18c), the KF was about 83.24% and 80.11% after immersion in an aqueous solution with pH = 11.0 for 7 and 14 days. For NF5 (Figure 18d), the KF was above 90.0% after immersion in an aqueous solution of pH = 7.0–9.0 for 7 and 14 days. Furthermore, the KF of 7–day immersion was higher than that for 14–day immersion, indicating that the acid–base resistance property of MOC–residual sludge solidified blocks decreased with increasing immersion time.

4. Conclusions

To investigate the potential application of residual sludge as construction materials, low-carbon and environmentally friendly MOC was used to solidify residual sludge. The effects of RW/S, Rn, Rm, curing time, DNa2SiO3, and DF on the RC of MOC–residual sludge solidified blocks were investigated. As determined by SEM micrographs and XRD spectra, the solidified blocks mainly comprised rod–like structure phase 5, unreacted MgO, and Mg(OH)2. The SEM images show that the cemented blocks did not shrink or dilate much, and no frosting phenomenon appeared on the specimen surface. The maximum values of RC of 10.20 MPa and 42.50 MPa for MOC–solidified blocks were obtained when Rn and RW/S were 2.0 and 1.38 and 5.0 and 0.85, respectively. The RC of MOC–residual sludge solidified blocks increased initially and then decreased as Rn and Rm increased. The maximum RC of 11.65 MPa was reached when Rn was 3.0, RW/S was 1.38, and Rm was 1.00. The value of RC decreased with RW/S increasing from 0.90 to 1.50. Adding Na2SiO3 or fly ash could improve the RC of MOC–residual sludge solidified blocks. With DNa2SiO3 increasing, the RC was higher than that of MOC–residual sludge solidified blocks without Na2SiO3. With DF increasing, RC increased initially and then decreased. The maximum RC of 35.60 MPa and 28.40 MPa were reached at DNa2SiO3 = 7.0 wt% and DF = 5.0 wt%. Water–resistance tests of solidified blocks showed that NF5 exhibited the best water resistance in the aqueous solution with pH = 7.0–9.0. For SM13, NG7, and NF5, water resistance was better in neutral or alkaline aqueous solutions than in acidic aqueous solutions. The water-resistance properties of MOC–residual sludge solidified blocks decreased with increased immersion time. The study found that fly ash could help improve water resistance of MOC–solidified residual sludge in neutral and basic aqueous solutions; Na2SiO3 was unfavorable for improving the water resistance. This work provides a new perspective for the efficient disposal and comprehensive utilization of residual sludge. Although the mechanical properties satisfied the application as a building material, the stability of the contaminants, such as metal ions, in sludge still needs to be investigated further to make sure that environmental safety and the acid resistance are improved before practical application.

Supplementary Materials

The following supporting information can be downloaded at: https://www.mdpi.com/article/10.3390/pr11020413/s1, Figure S1: photos of the MOC solidified blocks when the Rn was 7.0 at RW/S was 1.38.

Author Contributions

Conceptualization and data curation, J.L.; methodology and visualization, H.H. and L.W.; software, T.H.; validation, H.M.; formal analysis, W.W.; investigation, Z.X.; writing—original draft preparation and writing—review and editing, J.L.; resources, J.H.; funding acquisition, J.L. All authors have read and agreed to the published version of the manuscript.

Funding

This research was supported by China College Students Innovation and Entrepreneurship Fund (No. 202110148018) and Talent Scientific Research Fund of Liaoning Petrochemical University (No. 2016xJJ-031).

Conflicts of Interest

The authors declare they have no known conflict of interest or personal relationships influencing the work reported in this paper.

References

  1. Gomes, S.D.C.; Zhou, J.; Li, W.; Qu, F. Recycling of raw water treatment sludge in cementitious composites: Effects on heat evolution, compressive strength and microstructure. Resour. Conserv. Recycl. 2020, 161, 104970. [Google Scholar] [CrossRef]
  2. Bonton, A.; Bouchard, C.; Barbeau, B.; Jedrzejak, S. Comparative life cycle assessment of water treatment plants. Desalination 2012, 284, 42–54. [Google Scholar] [CrossRef]
  3. Barrera-Díaz, C.; Martínez-Barrera, G.; Gencel, O.; Bernal-Martínez, L.A.; Brostow, W. Processed wastewater sludge for improvement of mechanical properties of concretes. J. Hazard. Mater. 2011, 192, 108–115. [Google Scholar] [CrossRef] [PubMed]
  4. Skousen, J.; Clinger, C. Sewage sludge land application program in West Virginia. J. Soil Water Conserv. 1996, 48, 145–151. [Google Scholar]
  5. Chang, Z.; Long, G.; Zhou, J.L.; Ma, C. Valorization of sewage sludge in the fabrication of construction and building materials: A review. Resour. Conserv. Recycl. 2020, 154, 104606. [Google Scholar] [CrossRef]
  6. Liang, J.; He, H.; Wei, J.; Han, T.; Wang, W.; Wang, L.; Han, J.; Zhang, L.; Zhang, Y.; Ma, H. Study of solidifying surplus sludge as building material using ordinary portland cement. Processes 2022, 10, 2234. [Google Scholar] [CrossRef]
  7. Liew, C.S.; Kiatkittipong, W.; Lim, J.W.; Lam, M.K.; Ho, Y.C.; Ho, C.D.; Ntwampe, S.K.O.; Mohamad, M.; Usman, A. Stabilization of heavy metals loaded sewage sludge: Reviewing conventional to state-of-the-art thermal treatments in achieving energy sustainability. Chemosphere 2021, 277, 130310. [Google Scholar] [CrossRef]
  8. Wei, L.; Zhu, F.; Li, Q.; Xue, C.; Xia, X.; Yu, H.; Zhao, Q.; Jiang, J.; Bai, S. Development, current state and future trends of sludge management in China: Based on exploratory data and CO2-equivaient emissions analysis. Environ. Int. 2020, 144, 106093. [Google Scholar] [CrossRef]
  9. Liu, X.; Zhai, Y.; Li, S.; Wang, B.; Wang, T.; Liu, Y.; Qiu, Z.; Li, C. Hydrothermal carbonization of sewage sludge: Effect of feed-water pH on hydrochar’s physicochemical properties, organic component and thermal behavior. J. Hazard. Mater. 2020, 388, 122084. [Google Scholar] [CrossRef]
  10. Sun, Y.; Chen, Z.; Wu, G.; Wu, Q.; Zhang, F.; Niu, Z.; Hu, H.Y. Characteristics of water quality of municipal wastewater treatment plants in China: Implications for resources utilization and management. J. Clean. Prod. 2016, 131, 1–9. [Google Scholar] [CrossRef] [Green Version]
  11. Wang, T.; Shi, F.; Zhang, Q.; Qian, X.; Hashimoto, S. Exploring material stock efficiency of municipal water and sewage infrastructures in China. J. Clean. Prod. 2018, 181, 498–507. [Google Scholar] [CrossRef]
  12. Liew, C.S.; Yunus, N.M.; Chidi, B.S.; Lam, M.K.; Goh, P.S.; Mohamad, M.; Sin, J.C.; Lam, S.M.; Lim, J.W.; Lam, S.S. A review on recent disposal of hazardous sewage sludge via anaerobic digestion and novel composting. J. Hazard. Mater. 2022, 423, 126995. [Google Scholar] [CrossRef] [PubMed]
  13. Breulmann, M.; van Afferden, M.; Müller, R.A.; Schulz, E.; Fühner, C. Process conditions of pyrolysis and hydrothermal carbonization affect the potential of sewage sludge for soil carbon sequestration and amelioration. J. Anal. Appl. Pyrolysis 2017, 124, 256–265. [Google Scholar] [CrossRef]
  14. Al-Gheethi, A.A.; Efaq, A.N.; Bala, J.D.; Norli, I.; Abdel-Monem, M.O.; Ab. Kadir, M.O. Removal of pathogenic bacteria from sewage-treated effluent and biosolids for agricultural purposes. Appl. Water Sci. 2018, 8, 74. [Google Scholar] [CrossRef] [Green Version]
  15. Yang, G.; Zhang, G.; Wang, H. Current state of sludge production, management, treatment and disposal in China. Water Res. 2015, 78, 60–73. [Google Scholar] [CrossRef] [PubMed]
  16. Anders, A.; Weigand, H.; Cakir, H.; Kornhaas, U.; Platen, H. Phosphorus recycling from activated sludge of full-scale wastewater treatment plants by fast inversion of the biological phosphorus elimination mechanism. J. Environ. Chem. Eng. 2021, 9, 106403. [Google Scholar] [CrossRef]
  17. Shehu, M.S.; Abdul Manan, Z.; Alwi, S.R. Optimization of thermo-alkaline disintegration of sewage sludge for enhanced biogas yield. Bioresour. Technol. 2012, 114, 69–74. [Google Scholar] [CrossRef] [PubMed]
  18. Zhang, G.; Yang, J.; Liu, H.; Zhang, J. Sludge ozonation: Disintegration, supernatant changes and mechanisms. Bioresour. Technol. 2009, 100, 1505–1509. [Google Scholar] [CrossRef]
  19. Fijalkowski, K.; Rorat, A.; Grobelak, A.; Kacprzak, M.J. The presence of contaminations in sewage sludge-the current situation. J. Environ. Manag. 2017, 203, 1126–1136. [Google Scholar] [CrossRef]
  20. Peng, C.; Zhai, Y.; Zhu, Y.; Xu, B.; Wang, T.; Li, C.; Zeng, G. Production of char from sewage sludge employing hydrothermal carbonization: Char properties, combustion behavior and thermal characteristics. Fuel 2016, 176, 110–118. [Google Scholar] [CrossRef]
  21. Suarez-Iglesias, O.; Urrea, J.L.; Oulego, P.; Collado, S.; Diaz, M. Valuable compounds from sewage sludge by thermal hydrolysis and wet oxidation-A review. Sci. Total. Environ. 2017, 584–585, 921–934. [Google Scholar] [CrossRef] [PubMed]
  22. Wang, T.; Zhai, Y.; Zhu, Y.; Li, C.; Zeng, G. A review of the hydrothermal carbonization of biomass waste for hydrochar formation: Process conditions, fundamentals, and physicochemical properties. Renew. Sustain. Energ. Rev. 2018, 90, 223–247. [Google Scholar] [CrossRef]
  23. Wei, L.; Li, J.; Xue, M.; Wang, S.; Li, Q.; Qin, K.; Jiang, J.; Ding, J.; Zhao, Q. Adsorption behaviors of Cu2+, Zn2+ and Cd2+ onto proteins, humic acid, and polysaccharides extracted from sludge EPS: Sorption properties and mechanisms. Bioresour. Technol. 2019, 291, 121868. [Google Scholar] [CrossRef]
  24. Minh Trang, N.T.; Ho, N.A.D.; Babel, S. Reuse of waste sludge from water treatment plants and fly ash for manufacturing of adobe bricks. Chemosphere 2021, 284, 131367. [Google Scholar] [CrossRef]
  25. Hii, K.; Baroutian, S.; Parthasarathy, R.; Gapes, D.J.; Eshtiaghi, N. A review of wet air oxidation and thermal hydrolysis technologies in sludge treatment. Bioresour. Technol. 2014, 155, 289–299. [Google Scholar] [CrossRef] [PubMed]
  26. Manara, P.; Zabaniotou, A. Towards sewage sludge based biofuels via thermochemical conversion-A review. Renew. Sustain. Energ. Rev. 2012, 16, 2566–2582. [Google Scholar] [CrossRef]
  27. Werle, S.; Wilk, R.K. A review of methods for the thermal utilization of sewage sludge: The polish perspective. Renew. Energ. 2010, 35, 1914–1919. [Google Scholar] [CrossRef]
  28. Wang, Y.; Zhou, Y.T.; Feng, D.; Wu, C.L.; Wang, X.; Min, F.L. Effect of chemical conditioners on deep dewatering of urban dewatered sewage sludge in the temporary sludge lagoon. J. Environ. Eng. 2019, 145, 04019063. [Google Scholar] [CrossRef]
  29. Zhang, Q.H.; Yang, W.N.; Ngo, H.H.; Guo, W.S.; Jin, P.K.; Dzakpasu, M.; Yang, S.J.; Wang, Q.; Wang, X.C.; Ao, D. Current status of urban wastewater treatment plants in China. Environ. Int. 2016, 92–93, 11–22. [Google Scholar] [CrossRef]
  30. Ministry of Construction of the People’s Republic of China. Determination Method for Municipal Sludge in Wastewater Treatment Plant; Ministry of Construction of the People’s Republic of China: Beijing, China, 2005. (In Chinese)
  31. Ye, Q.; Han, Y.; Zhang, S.; Gao, Q.; Zhang, W.; Chen, H.; Gong, S.; Shi, S.Q.; Xia, C.; Li, J. Bioinspired and biomineralized magnesium oxychloride cement with enhanced compressive strength and water resistance. J. Hazard. Mater. 2020, 383, 121099. [Google Scholar] [CrossRef]
  32. Deng, D.; Zhang, C. The formation mechanism of the hydrate phases in magnesium oxychloride cement. Cem. Concr. Res. 1999, 29, 1365–1371. [Google Scholar]
  33. Hamood, A.; Khatib, J.M.; Williams, C. The effectiveness of using raw sewage sludge (RSS) as a water replacement in cement mortar mixes containing Unprocessed Fly Ash (u-FA). Constr. Build. Mater. 2017, 147, 27–34. [Google Scholar] [CrossRef]
  34. Monzó, J.; Payá, J.; Borrachero, M.V.; Peris-Mora, E. Mechanical behavior of mortars containing sewage sludge ash (SSA) and Portland cements with different tricalcium aluminate content. Cem. Concr. Res. 1999, 29, 87–94. [Google Scholar] [CrossRef]
  35. Cyr, M.; Coutand, M.; Clastres, P. Technological and environmental behavior of sewage sludge ash (SSA) in cement-based materials. Cem. Concr. Res. 2007, 37, 1278–1289. [Google Scholar] [CrossRef]
  36. Garcés, P.; Pérez Carrión, M.; García-Alcocel, E.; Payá, J.; Monzó, J.; Borrachero, M.V. Mechanical and physical properties of cement blended with sewage sludge ash. Waste Manag. 2008, 28, 2495–2502. [Google Scholar] [CrossRef]
  37. Valls, S.; Vàzquez, E. Leaching properties of stabilised/solidified cement-admixtures-sewage sludges systems. Waste Manag. 2002, 22, 37–45. [Google Scholar] [CrossRef]
  38. Cheilas, A.; Katsioti, M.; Georgiades, A.; Malliou, O.; Teas, C.; Haniotakis, E. Impact of hardening conditions on to stabilized/solidified products of cement–sewage sludge–jarosite/alunite. Cem. Concr. Compos. 2007, 29, 263–269. [Google Scholar] [CrossRef]
  39. Yague, A.; Valls, S.; Vázquez, E.; Albareda, F. Durability of concrete with addition of dry sludge from waste water treatment plants. Cem. Concr. Res. 2005, 35, 1064–1073. [Google Scholar] [CrossRef]
  40. Jordán, M.M.; Almendro-Candel, M.B.; Romero, M.; Rincó, J.M. Application of sewage sludge in the manufacturing of ceramic tile bodies. Appl. Clay Sci. 2005, 30, 219–224. [Google Scholar] [CrossRef] [Green Version]
  41. Favoni, C.; Minichelli, D.; Tubaro, F.; Brückner, S.; Bachiorrini, A.; Maschio, S. Ceramic processing of municipal sewage sludge (MSS) and steelworks slags (SS). Ceram. Int. 2005, 31, 697–702. [Google Scholar] [CrossRef]
  42. Montero, M.A.; Jordán, M.M.; Hernández-Crespo, M.S.; Sanfeliu, T. The use of sewage sludge and marble residues in the manufacture of ceramic tile bodies. Appl. Clay Sci. 2009, 46, 404–408. [Google Scholar] [CrossRef]
  43. Zhao, Y.; Yue, Q.; Li, R.; Yue, M.; Han, S.; Gao, B.; Li, Q.; Yu, H. Research on sludge-fly ash ceramic particles (SFCP) for synthetic and municipal wastewater treatment in biological aerated filter (BAF). Bioresour. Technol. 2009, 100, 4955–4962. [Google Scholar] [CrossRef] [PubMed]
  44. Cusidó, J.A.; Soriano, C. Valorization of pellets from municipal WWTP sludge in lightweight clay ceramics. Waste Manag. 2011, 31, 1372–1380. [Google Scholar] [CrossRef] [PubMed]
  45. Park, Y.J.; Moon, S.O.; Heo, J. Crystalline phase control of glass ceramics obtained from sewage sludge fly ash. Ceram. Int. 2003, 29, 223–227. [Google Scholar] [CrossRef]
  46. Merino, I.; Arévalo, L.F.; Romero, F. Preparation and characterization of ceramic products by thermal treatment of sewage sludge ashes mixed with different additives. Waste Manag. 2007, 27, 1829–1844. [Google Scholar] [CrossRef]
  47. Chen, L.; Lin, D.F. Applications of sewage sludge ash and nano-SiO2 to manufacture tile as construction material. Constr. Build. Mater. 2009, 23, 3312–3320. [Google Scholar] [CrossRef]
  48. Wang, K.S.; Chiou, I.J.; Chen, C.H.; Wang, D. Lightweight properties and pore structure of foamed material made from sewage sludge ash. Constr. Build. Mater. 2005, 19, 627–633. [Google Scholar] [CrossRef]
  49. Chiou, I.J.; Wang, K.S.; Chen, C.H.; Lin, Y.T. Lightweight aggregate made from sewage sludge and incinerated ash. Waste Manag. 2006, 26, 1453–1461. [Google Scholar] [CrossRef]
  50. Wang, X.; Jin, Y.; Wang, Z.; Nie, Y.; Huang, Q.; Wang, Q. Development of lightweight aggregate from dry sewage sludge and coal ash. Waste Manag. 2009, 29, 1330–1335. [Google Scholar] [CrossRef]
  51. Mun, K.J. Development and tests of lightweight aggregate using sewage sludge for nonstructural concrete. Constr. Build. Mater. 2007, 21, 1583–1588. [Google Scholar] [CrossRef]
  52. Cheeseman, C.R.; Virdi, G.S. Properties and microstructure of lightweight aggregate produced from sintered sewage sludge ash. Resour. Conserv. Recycl. 2005, 45, 18–30. [Google Scholar] [CrossRef]
  53. Theodoratos, P.; Moirou, A.; Xenidis, A.; Paspaliaris, I. The use of municipal sewage sludge for the stabilization of soil contaminated by mining activities. J. Hazard. Mater. 2000, 77, 177–191. [Google Scholar] [CrossRef]
  54. Lin, D.F.; Lin, K.L.; Hung, M.J.; Luo, H.L. Sludge ash/hydrated lime on the geotechnical properties of soft soil. J. Hazard. Mater. 2007, 145, 58–64. [Google Scholar] [CrossRef]
  55. Chen, L.; Lin, D.F. Stabilization treatment of soft subgrade soil by sewage sludge ash and cement. J. Hazard. Mater. 2009, 162, 321–327. [Google Scholar] [CrossRef]
  56. Pan, S.C.; Lin, C.C.; Tseng, D.H. Reusing sewage sludge ash as adsorbent for copper removal from wastewater. Resour. Conserv. Recycl. 2003, 39, 79–90. [Google Scholar] [CrossRef]
  57. Okol, R.E.; Balafoutas, G. Landfill sealing potentials of bottom ashes of sludge cakes. Soil Tillage Res. 1998, 46, 307–314. [Google Scholar] [CrossRef]
  58. Xu, Z.; Ye, D.; Dai, T.; Dai, Y. Research on preparation of coal waste-based geopolymer and its stabilization/solidification of heavy metals. Integr. Ferroelectr. 2021, 217, 214–224. [Google Scholar]
  59. Shen, Z.; Jin, F.; O’Connor, D.; Hou, D. Solidification/stabilization for soil remediation: An old technology with new vitality. Environ. Sci. Technol. 2019, 53, 11615–11617. [Google Scholar] [CrossRef] [Green Version]
  60. Tuncan, A.; Tuncan, M.; Koyuncu, H. Use of petroleum-contaminated drilling wastes as sub-base material for road construction. Waste Manag. Res. 2000, 18, 489–505. [Google Scholar] [CrossRef]
  61. Guo, Y.; Zhang, Y.; Soe, K.; Pulham, M. Recent development in magnesium oxychloride cement. Struct. Concr. 2018, 19, 1290–1300. [Google Scholar] [CrossRef]
  62. Beaudoin, J.J.; Ramachandran, V.S. Strength development in magnesium oxychloride and other cements. Cem. Concr. Res. 1975, 5, 617–630. [Google Scholar] [CrossRef] [Green Version]
  63. Xu, B.; Ma, H.; Hu, C.; Li, Z. Influence of cenospheres on properties of magnesium oxychloride cement-based composites. Mater Struct. 2016, 49, 1319–1326. [Google Scholar] [CrossRef]
  64. Ma, J.L.; Zhao, Y.C.; Wang, J.; Wang, L. Effect of magnesium oxychloride cement on stabilization/solidification of sewage sludge. Constr. Build. Mater. 2010, 24, 79–83. [Google Scholar]
  65. Deng, D. The mechanism for soluble phosphates to improve the water resistance of magnesium oxychloride cement. Cem. Concr. Res. 2003, 33, 1311–1317. [Google Scholar] [CrossRef]
  66. Guan, B.; He, Z.; Wei, F.; Wang, F.; Yu, J. Effects of fly ash and hexadecyltrimethoxysilane on the compressive properties and water resistance of magnesium oxychloride cement. Polymers 2023, 15, 172. [Google Scholar] [CrossRef]
  67. Wang, D.; Di, S.; Gao, X.; Wang, R.; Chen, Z. Strength properties and associated mechanisms of magnesium oxychloride cement-solidified urban river sludge. Constr. Build. Mater. 2020, 250, 118933. [Google Scholar] [CrossRef]
  68. Li, G.; Yu, Y.; Li, J.; Wang, Y.; Liu, H. Experimental study on urban refuse/magnesium oxychloride cement compound floor tile. Cem. Concr. Res. 2003, 33, 1663–1668. [Google Scholar] [CrossRef]
  69. Matkovlć, B.; Popović, S.; Rogić, V.; Žunić, T.; Young, J.F. Reaction products in magnesium oxychloride cement pastes. System MgO-MgCl2-H2O. J. Am. Ceram. Soc. 1977, 60, 504–507. [Google Scholar] [CrossRef]
  70. Li, Z.; Chau, C.K. Influence of molar ratios on properties of magnesium oxychloride cement. Cem. Concr. Res. 2007, 37, 866–870. [Google Scholar] [CrossRef]
  71. Walling, S.A.; Provis, J.L. Magnesia-based cements: A journey of 150 years, and cements for the future? Chem. Rev. 2016, 116, 4186–4191. [Google Scholar] [CrossRef] [Green Version]
  72. Zhang, X.; Ge, S.; Wang, H.; Chen, R. Effect of 5-phase seed crystal on the mechanical properties and microstructure of magnesium oxychloride cement. Constr. Build. Mater. 2017, 150, 409–417. [Google Scholar] [CrossRef]
  73. Urwongse, L.; Sorrell, C.A. The system MgO-MgCl2-H2O at 23 °C. J. Am. Ceram. Soc. 1980, 63, 501–504. [Google Scholar] [CrossRef]
  74. Cole, W.; Demediuk, T. X-Ray, thermal, and dehydration studies on magnesium oxychlorides. Aust. J. Chem. 1955, 8, 234–251. [Google Scholar] [CrossRef]
  75. Wang, D.; Gao, X.; Liu, X.; Zeng, G. Strength, durability and microstructure of granulated blast furnace slag-modified magnesium oxychloride cement solidified waste sludge. J. Clean. Prod. 2021, 292, 126072. [Google Scholar] [CrossRef]
  76. Wang, F.; Xu, X.; Zhou, B.; Zhong, S. Preparation of straw-magnesium oxychloride cement composites. J. Build. Mater. 2019, 22, 135–141. [Google Scholar]
  77. Chen, X.; Zhang, T.; Bi, W.; Cheeseman, C.R. Effect of tartaric acid and phosphoric acid on the water resistance of magnesium oxychloride (MOC) cement. Constr. Build. Mater. 2019, 213, 528–536. [Google Scholar] [CrossRef]
  78. Lv, Q.; Yu, J.; Ji, F.; Gu, L.; Chen, Y.; Shan, X. Mechanical property and microstructure of fly ash-based geopolymer activated by sodium silicate. KSCE J. Civ. Eng. 2021, 25, 1765–1777. [Google Scholar] [CrossRef]
  79. Hou, Y.F.; Wang, D.M.; Li, Q.; Lu, H.B. Effect of water glass performance on fly ash-based geopolymers. J. Chin. Ceram. Soc. 2008, 36, 61–64. (In Chinese) [Google Scholar]
  80. De Araujo, C.C.; Zhang, L.; Eckert, H. Sol-gel preparation of AlPO4-SiO2 glasses with high surface mesoporous structure. J. Mater. Chem. 2006, 16, 1323–1331. [Google Scholar] [CrossRef]
  81. Hao, Y.; Li, Y. Study on preparation and properties of modified magnesium oxychloride cement foam concrete. Constr. Build. Mater. 2021, 282, 122708. [Google Scholar] [CrossRef]
  82. Pivak, A.; Pavlikova, M.; Zaleska, M.; Lojka, M.; Jankovsky, O.; Pavlik, Z. Magnesium oxychloride cement composites with silica filler and coal fly ash admixture. Materials 2020, 13, 2537. [Google Scholar] [CrossRef] [PubMed]
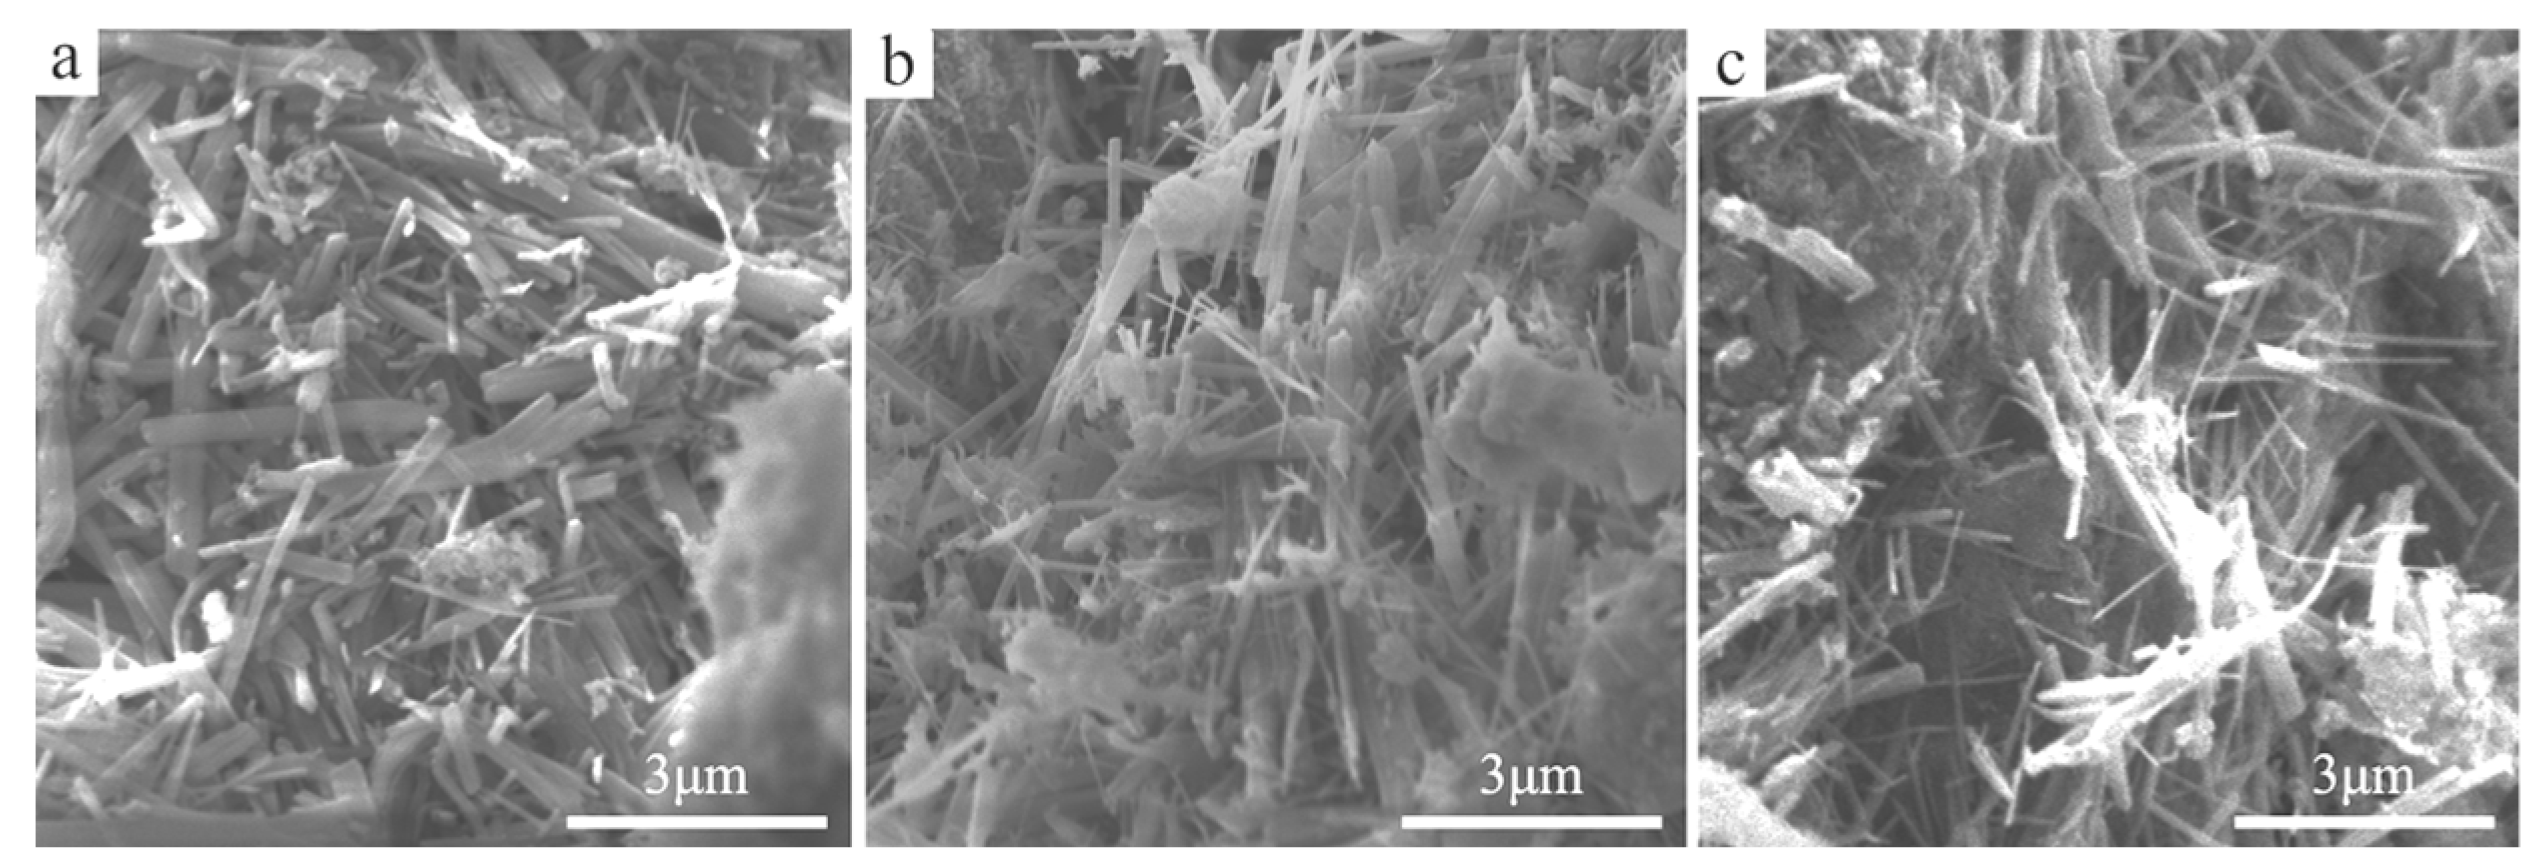
Figure 1. SEM images of MOC–solidified blocks at different Rn when RW/S was 1.38. Panel (a) is sample M1 (Rn = 2.0); (b) is sample M4 (Rn = 5.0); (c) is sample M6 (Rn = 7.0).
Processes 11 00413 g001
Figure 2. SEM images of MOC–solidified blocks with different RW/S when Rn was 5.0: (a) is M8 (RW/S = 0.72); (c) is sample M10 (RW/S = 0.85); (b) and (d) are the enlarged images of (a) and (c), respectively.
Processes 11 00413 g002
Figure 3. SEM images of MOC–residual sludge solidified samples. Panel (a) is sample SM1 (Rn = 2.0, Rm = 1.00, RW/S = 1.38); (b) is sample SM2 (Rn = 3.0, Rm = 1.00, RW/S = 1.38); (c) is sample SM4 (Rn = 5.0, Rm = 1.00, RW/S = 1.38); (d) is sample SM9 (Rn = 3.0, Rm = 0.67, RW/S = 1.38); (e) is sample SM12 (Rn = 3.0, Rm = 1.50, RW/S = 1.38); (f) is SM13 (Rn = 5.0, Rm = 1.00, RW/S = 0.90).
Processes 11 00413 g003
Figure 4. SEM images of MOC–residual sludge solidified samples of SM16 (Rn = 5.0, Rm = 1.00, RW/S = 1.50); (b,c) are the enlarged images of (a).
Processes 11 00413 g004
Figure 5. SEM images of MOC–residual sludge solidified samples with Na2SiO3 or fly ash: (a) NG1 (DNa2SiO3 = 1.0 wt%); (b) NG7 (DNa2SiO3 = 7.0 wt%); (c) NF5 (DF = 5.0 wt%); (d) NF20 (DF = 20.0 wt%).
Processes 11 00413 g005
Figure 6. XRD spectra of blank MOC–solidified blocks at different Rn (a) and RW/S (b).
Processes 11 00413 g006
Figure 7. The XRD spectra of a blank MOC–solidified block (sample M4), sludge and MOC–solidified sludge samples (a); the XRD spectra of MOC–sludge solidified blocks with different Rm or RW/S (b).
Processes 11 00413 g007
Figure 8. The photos of the MOC–solidified blocks with different Rn at RW/S = 1.38.
Processes 11 00413 g008
Figure 9. The photos of the MOC–solidified blocks with different RW/S at Rn = 5.0.
Processes 11 00413 g009
Figure 10. The effect of Rn on RC of MOC–cemented blocks when RW/S was 1.38 (a); effect of RW/S on RC of MOC–cemented blocks when Rn was 5.0 (b).
Processes 11 00413 g010
Figure 11. Images of MOC–residual sludge solidified blocks with different Rn when RW/S was 1.38 and Rm was 1.00 and different Rm when RW/S was 1.38 and Rn was 3.0.
Processes 11 00413 g011
Figure 12. Images of MOC–residual sludge solidified blocks with different RW/S when Rm was 1.00 and Rn was 5.0.
Processes 11 00413 g012
Figure 13. Influence of Rn on the RC of MOC–residual sludge solidified blocks at RW/S = 1.38 and Rm = 1.00.
Processes 11 00413 g013
Figure 14. Influence of Rm on the RC of MOC–solidified residual sludge when RW/S was 1.38 and Rn was 3.0.
Processes 11 00413 g014
Figure 15. Influence of RW/S on the RC of MOC–solidified residual sludge at Rn = 5.0 and Rm = 1.00.
Processes 11 00413 g015
Figure 16. Images of MOC–residual sludge solidified blocks with different DNa2SiO3 and DF.
Processes 11 00413 g016
Figure 17. At RW/S = 0.90, Rn = 5.0, and Rm = 1.00, (a) is the effect of DNa2SiO3 on RC of MOC–residual sludge solidified blocks; (b) is the effect of DF on RC of MOC–residual sludge solidified blocks.
Processes 11 00413 g017
Figure 18. The strength curves of MOC–residual sludge solidified blocks after immersion in an aqueous solution with different pH values. Panel (a) is the RC of 28 days as blank experiment; (bd) are the RAC and KF of SM13, NG7, and NF5.
Processes 11 00413 g018
Table 1. Experiment scheme of MOC solidifying residual sludge.
SamplesDS (wt%)DMgO (wt%)DMgCl2 (wt%)DMOC (wt%)DW
(wt%)
RW/SRnRmDNa2SiO3 (wt%)DF (wt%)
M1-19.3122.7842.0957.911.382.0---
M2-23.5518.5442.0957.911.383.0---
M3-26.4415.6542.0957.911.384.0---
M4-28.5713.5242.0957.911.385.0---
M5-30.2011.8942.0957.911.386.0---
M6-31.4610.6342.0957.911.387.0---
M7-32.489.6142.0957.911.388.0---
M8-39.4718.6758.1441.860.725.0---
M9-37.9317.9455.8744.130.795.0---
M10-36.7017.3654.0645.940.855.0---
M11-30.8614.6045.4654.541.205.0---
M12-27.1512.8540.0060.001.505.0---
SM137.5017.2020.3037.5025.001.382.01.00--
SM237.5020.9816.5237.5025.001.383.01.00--
SM337.5023.5613.9437.5025.001.384.01.00--
SM437.5025.4612.0437.5025.001.385.01.00--
SM537.5026.9010.6037.5025.001.386.01.00--
SM637.5028.039.4737.5025.001.387.01.00--
SM737.5028.938.5737.5025.001.388.01.00--
SM819.8322.1917.4739.6640.511.383.00.50--
SM925.9421.7717.1438.9135.151.383.00.67--
SM1032.4021.3316.7938.1229.481.383.00.85--
SM1144.0320.5316.1736.7019.271.383.01.20--
SM1253.3319.8915.6735.5611.111.383.01.50--
SM1346.8931.8315.0546.886.230.905.01.00--
SM1443.4629.5013.9543.4513.091.055.01.00--
SM1540.4927.4913.0040.4919.021.205.01.00--
SM1635.6324.2011.4435.6428.731.505.01.00--
NG146.8931.8315.0546.886.230.905.01.001.0-
NG346.8931.8315.0546.886.230.905.01.003.0-
NG546.8931.8315.0546.886.230.905.01.005.0-
NG746.8931.8315.0546.886.230.905.01.007.0-
NF546.8930.2414.3044.546.230.905.01.00-5.0
NF1046.8928.6513.5542.206.230.905.01.00-10.0
NF1546.8927.0612.8039.866.230.905.01.00-15.0
NF2046.8925.4712.0437.516.230.905.01.00-20.0
DS, DMgO, DMgCl2, DNa2SiO3, and DW are the weight percentage of residual sludge, MgO, MgCl2, Na2SiO3, and added water in MOC–residual sludge mixing mortar; DMOC is the total percentage of DMgO and DMgCl2.
Disclaimer/Publisher’s Note: The statements, opinions and data contained in all publications are solely those of the individual author(s) and contributor(s) and not of MDPI and/or the editor(s). MDPI and/or the editor(s) disclaim responsibility for any injury to people or property resulting from any ideas, methods, instructions or products referred to in the content.