Article

Phase Equilibria of the Ti-Nb-Mn Ternary System at 1173K, 1273K and 1373K

School of Material Science and Engineering, Central South University, Changsha 410083, China
*
Author to whom correspondence should be addressed.
Processes 2023, 11(2), 424; https://doi.org/10.3390/pr11020424
Submission received: 23 December 2022 / Revised: 23 January 2023 / Accepted: 28 January 2023 / Published: 31 January 2023
(This article belongs to the Section Materials Processes)

Abstract

:
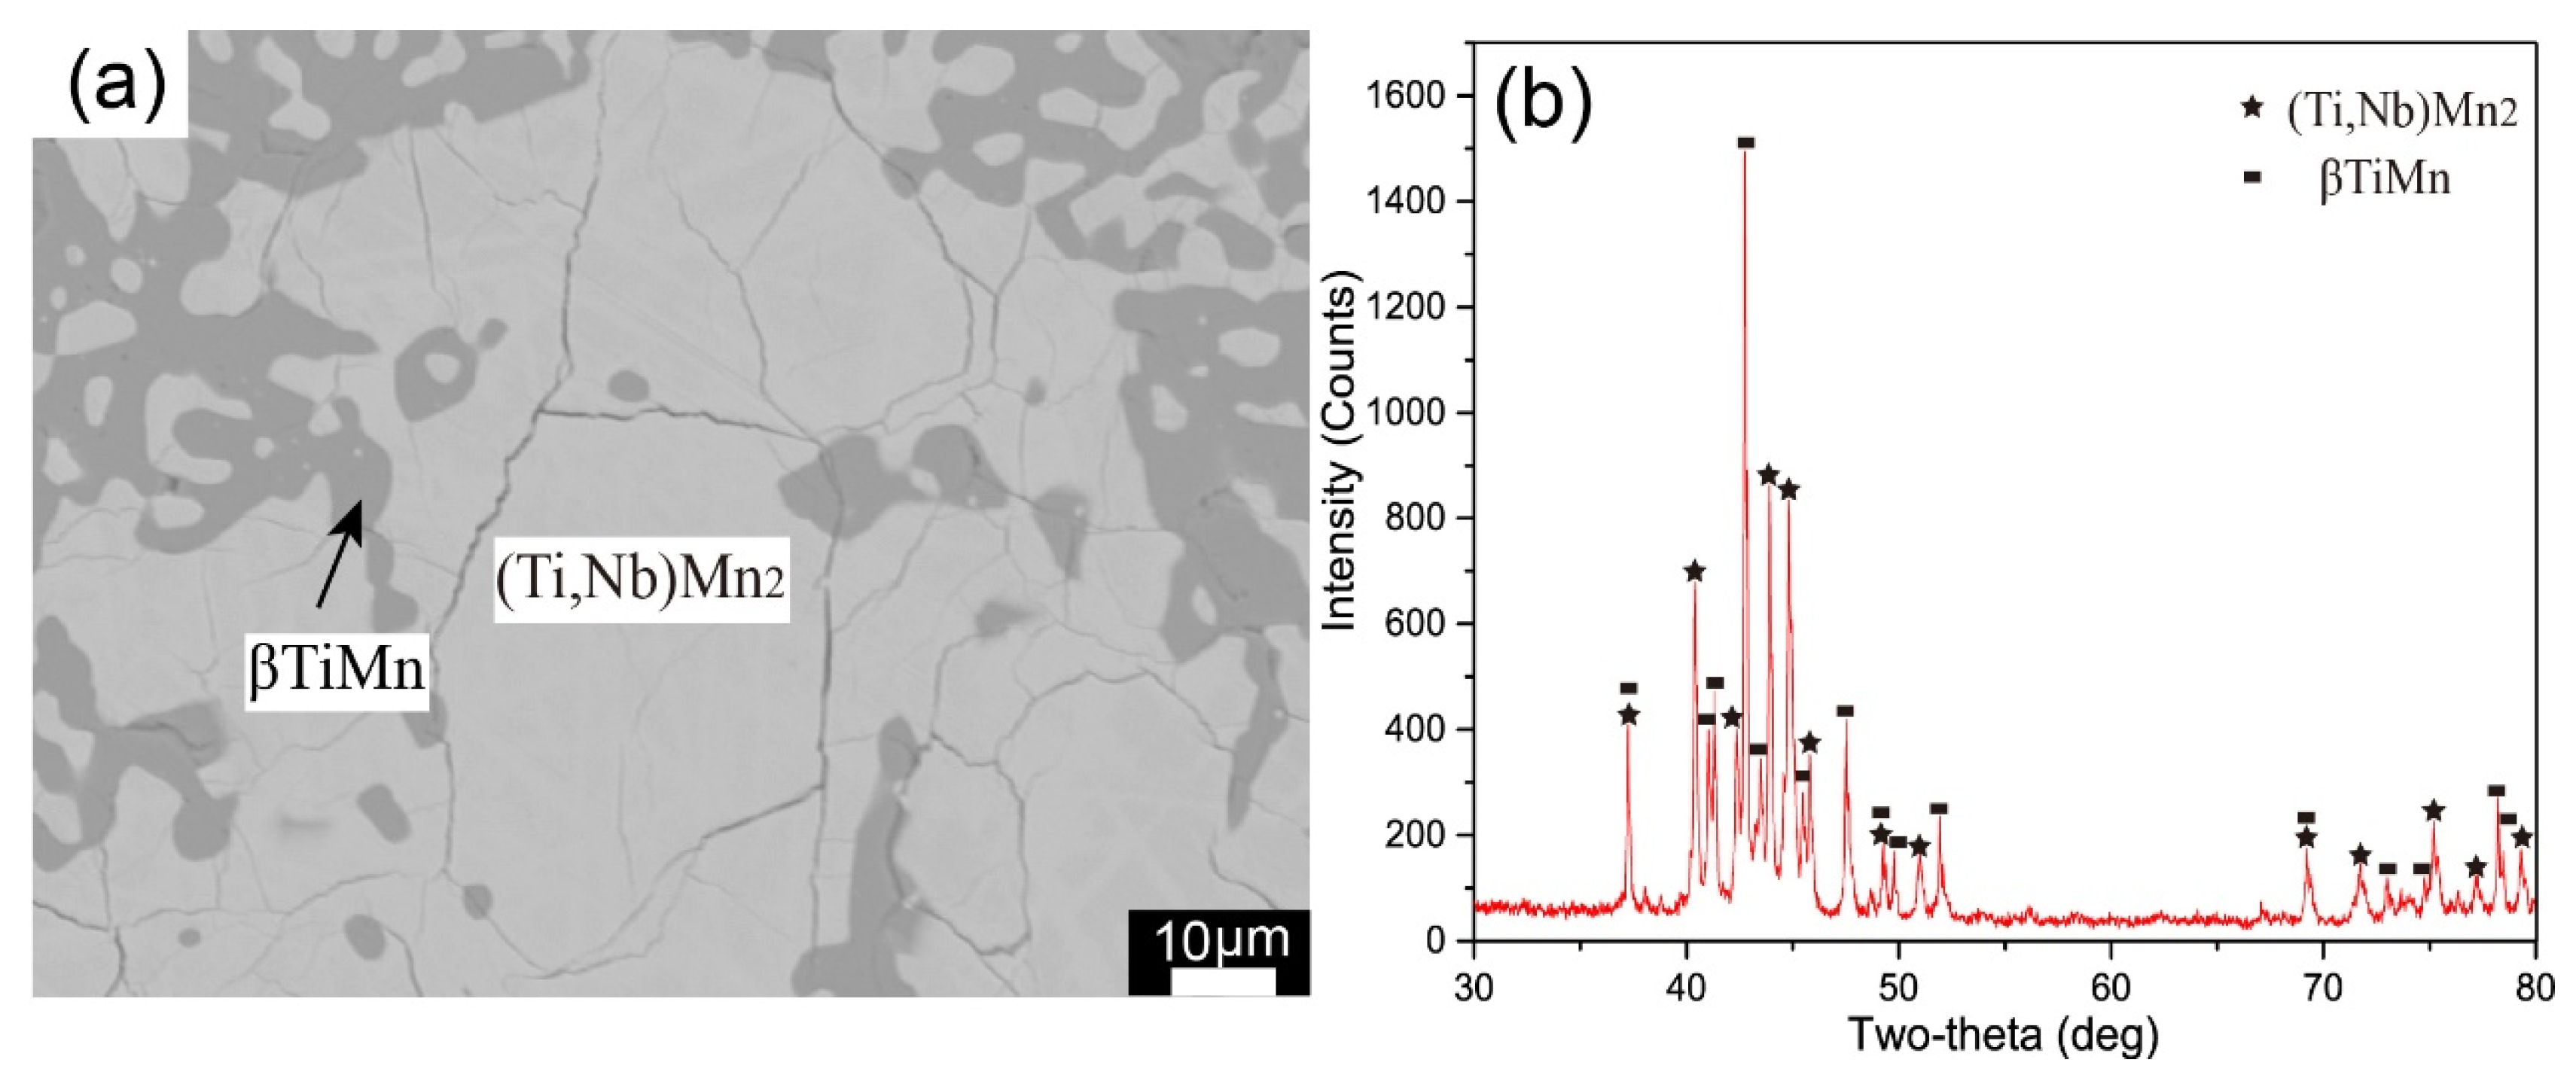
Phase equilibria in the Ti-Nb-Mn ternary system at 1173K, 1273K and 1373K were studied through the equilibrated alloy method by using scanning electron microscopy (SEM), electron probe microanalysis (EPMA) and X-ray diffraction (XRD) techniques. A new stable ternary phase K was confirmed and the composition was around Ti50Nb7Mn43. A wide-range continuous solid solution phase (Ti,Nb)Mn2 with the C14 Laves structure had been found at these temperatures due to the same phase structures of TiMn2 and NbMn2 phases. The solubility of Nb in TiMn4, αTiMn and βTiMn intermetallic compounds was determined. Based on the experimental results and reasonable extrapolations, the isothermal sections of Ti-Nb-Mn ternary system at 1173K, 1273K and 1373K were constructed.

1. Introduction

In recent years, titanium and its alloys have been extensively used for biomedical applications, due to their high strength-to-density ratio, outstanding biocompatibility, rich microstructural features, and excellent environment and corrosion resistance [1,2,3,4,5]. In general, Ti-Ni alloy is widely used as bone implant material because continuing research and developmental efforts have shown its superelasticity and shape memory effect [6]. However Ni needs to be replaced by other elements due to the problems of carcinogenic and hypersensitive effects for the human body [7,8]. Ti-Nb is expected to replace Ti-Ni as a new bone implant material because of its low biological toxicity [9,10]. However, substitution of Nb also reduces the phase transformation strain, which is adverse for the application of Ti-Nb alloy in load-bearing implants [11]. Alshammari et al. found that the addition of Mn would increase the phase transformation strain of Ti-Nb alloy, and Mn, as a β -phase stable element with low cytotoxicity, was also favorable to its application in bone implants [12].
In order to optimize the microstructure and mechanical properties of a material, it is essential to have a detailed understanding of the phase equilibria and phase transformation characteristics of the alloy system [13]. Hernán et al. [14] have measured the isothermal section of Ti-Nb-Mn system in 1423K and 1473K. In order to analyze the phase relationship of this system in a larger temperature range, the phase diagrams of the Ti-Nb-Mn system at 1173K, 1273K and 1373K were investigated in this work.
In order to speculate the phase relationships of the Ti-Nb-Mn system and judge its rationality, we calculated the relevant three binary systems used CALPHAD (CALculation of PHAse Diagram) method by Pandat software, as shown in Figure 1, Figure 2 and Figure 3. Information of binary Ti-Mn system has been extensively investigated experimentally and thermodynamic calculation [15]. As for the Ti-Mn system, Murray et al. [16] summarized a variety of experimental phase equilibria firstly, later it was optimized by Khan et al. [17] and Chen et al. [15] The assessments by Chen et al. are well consistent with the reported experiments results and thus are adopted in this work, as shown in Figure 1. There are five intermetallic compounds included-αTiMn, βTiMn, TiMn2 (C14 Laves phase), TiMn3 and TiMn4.
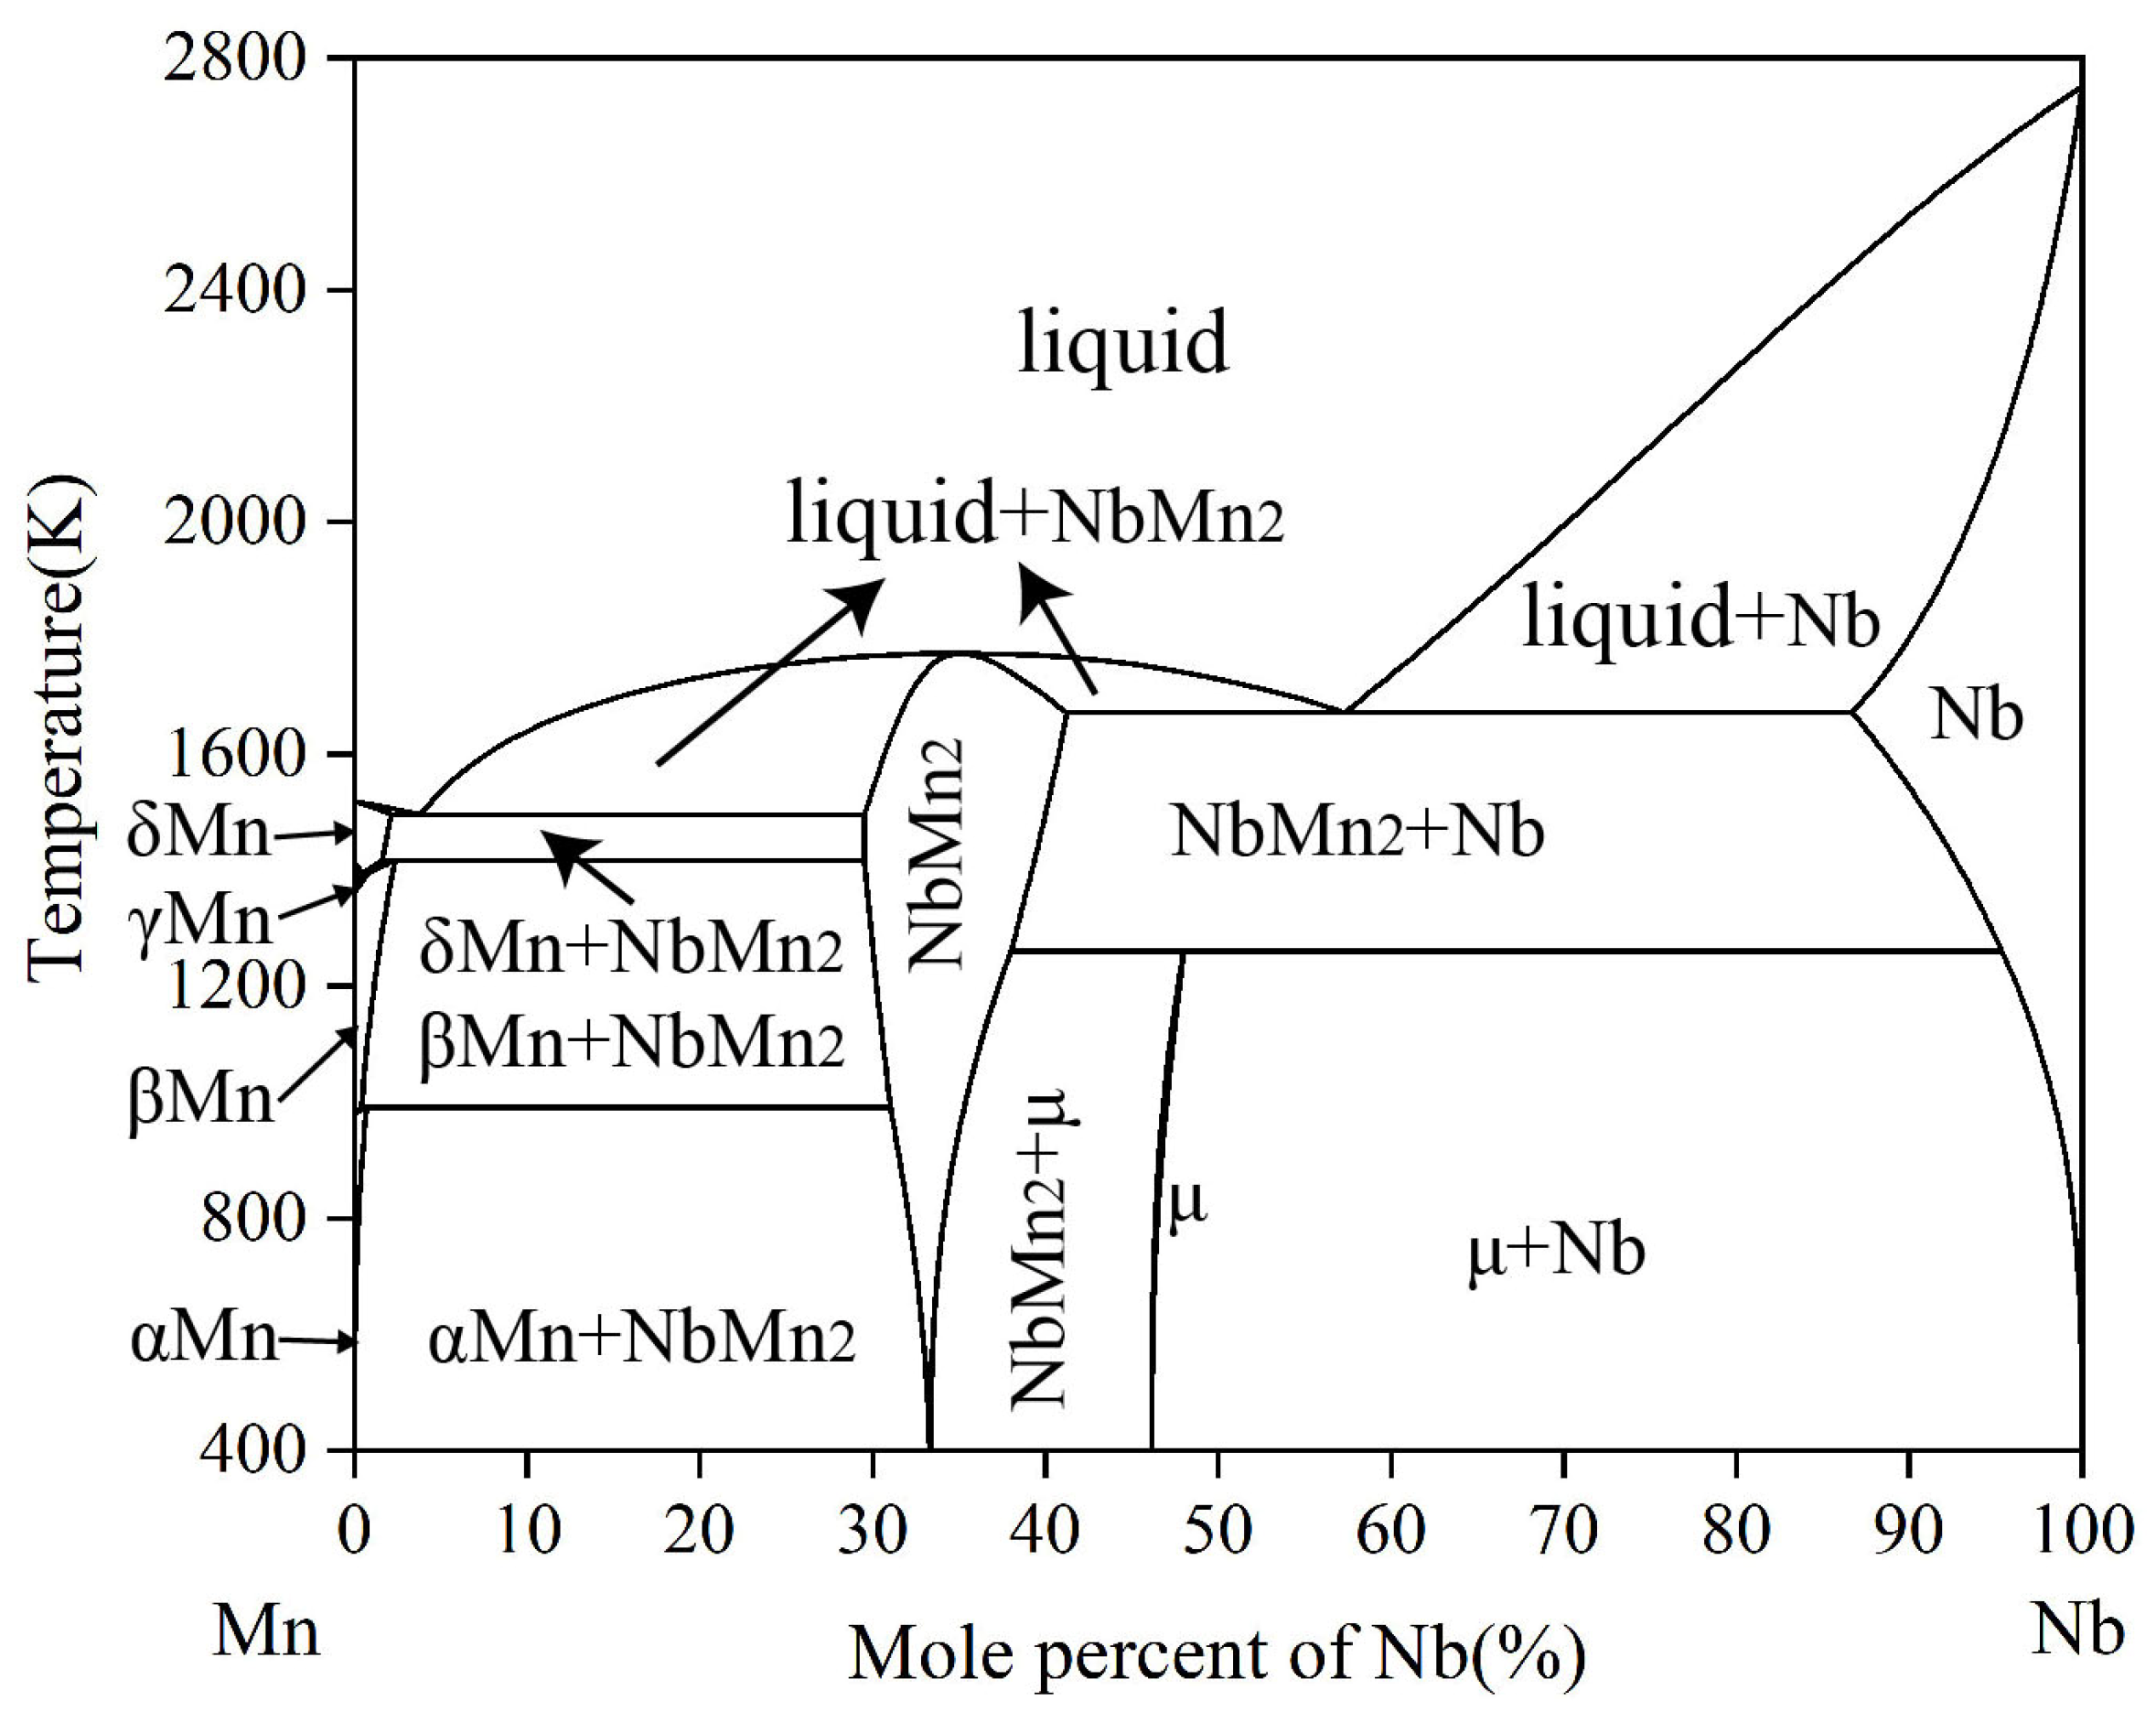
The Nb-Mn system was thermodynamically assessed by Liu et al. [18], mainly adopting the experimental data obtained by Hellawell et al. [19], Savitskii et al. [20] and Svechnikov et al. [21] NbMn2(C14 Laves phase) is the only stable intermetallic compound in Nb-Mn phase diagram. Based on the previous research work mentioned above, Liu et al. [18] reported the thermodynamic optimization of the Mn-Nb binary system, as shown in Figure 2.
Figure 2. The calculated Mn-Nb phase diagram based on the work of Liu et al. [18].
Processes 11 00424 g002
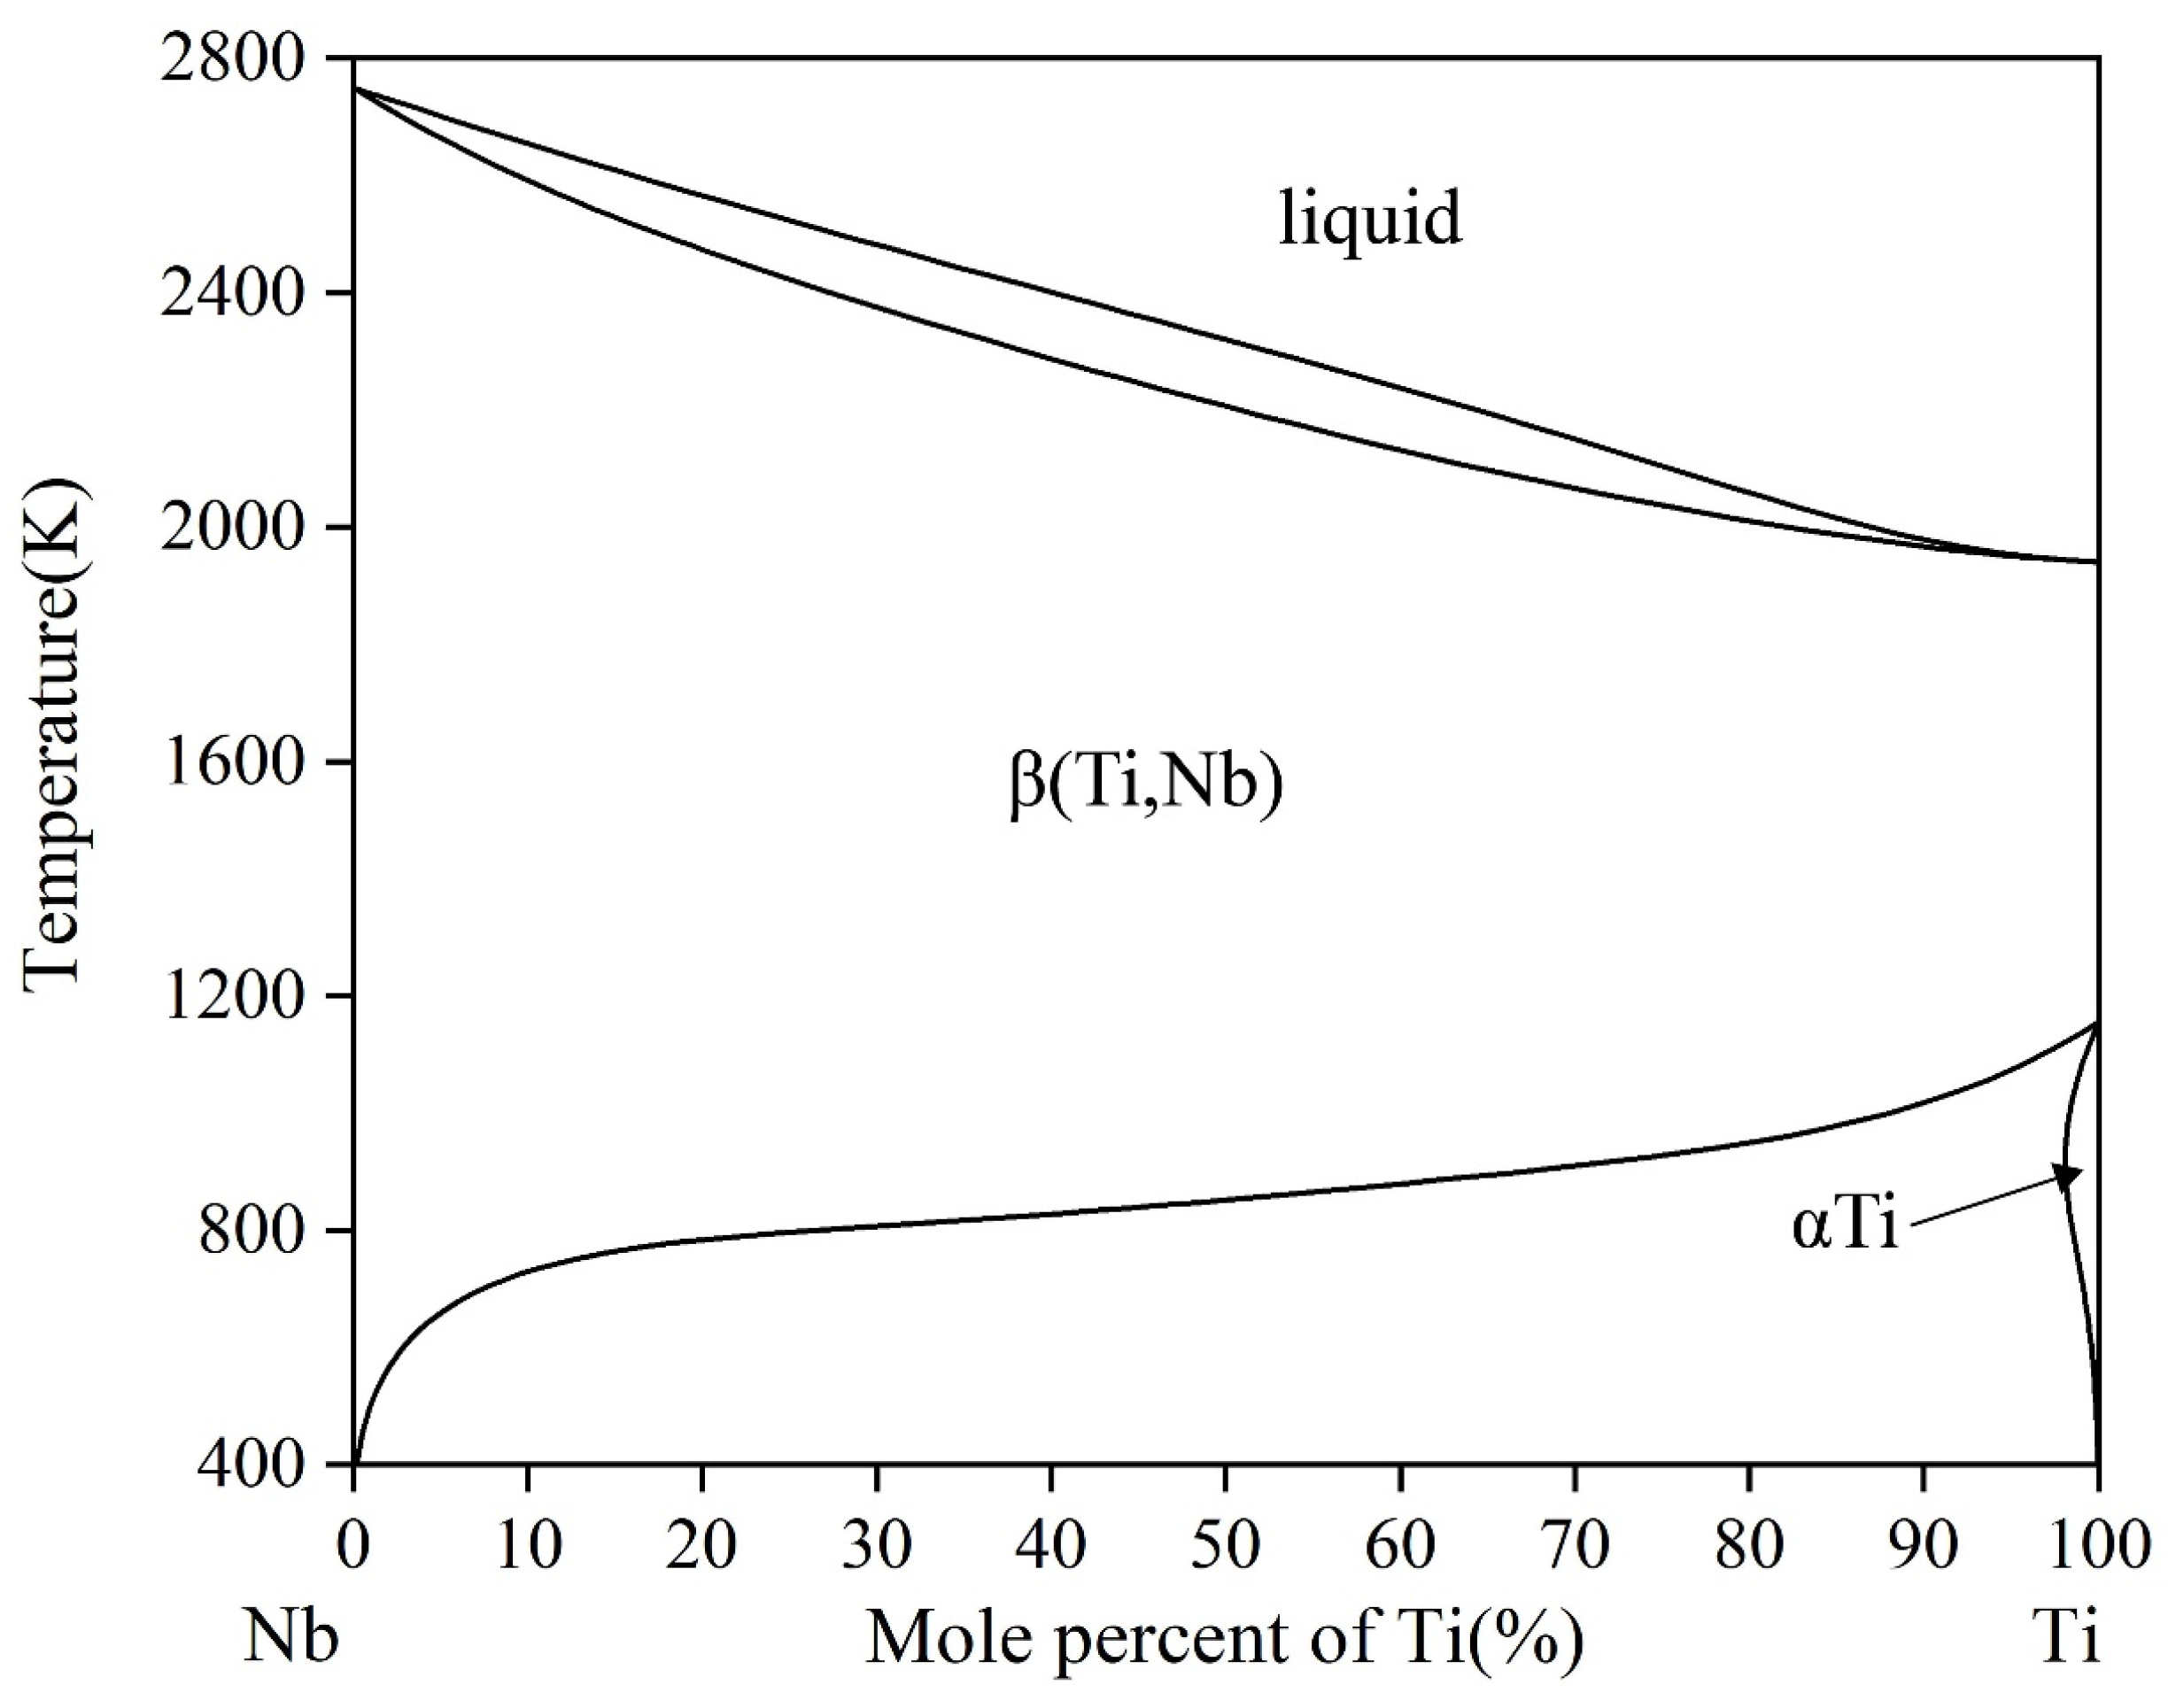
The Ti-Nb phase diagram has been investigated by several groups [22,23,24,25,26,27]. Bellen et al. [22], Zhang et al. [26] and Matsumoto et al. [27] made a critical evaluation of this binary system. It is simple and there is no intermetallic compound and no invariant reaction, as shown in Figure 3.
Figure 3. The calculated Ti-Nb phase diagram based on the work of Matsumoto et al. [27].
Processes 11 00424 g003
So far, no information about phase relations in the Ti-Nb-Mn ternary system has been reported. The present work is an experimental study of phase relations in the Ti-Nb-Mn system at 1173K, 1273K and 1373K through alloy samples approach. The crystallographic data of solid phases of Ti-Nb-Mn system are listed in Table 1.

2. Experimental Procedure

Samples have been prepared from purity materials of 99.99% Ti, 99.99% Nb and 99.99% Mn (all in wt. %). The weight of each sample was limited to about 6 g. All the alloy samples were produced by arc-melting with a water-cooled copper plate under purified argon atmosphere, at the same time, a block of pure titanium was used as getter material placed in the arc chamber. Annealing was performed at 1173K, 1273K and 1373K for 90, 30 and 20 days respectively, alloys were taken out quickly and quenched into ice water.
Electron probe microanalysis (EPMA, JAXA-8800 R, JEOL, 15 kV, 1 × 10⁻⁸ A, Tokyo, Japan) equipped with OXFORD INCA 500 wave dispersive X-ray spectrometer (WDS) was used to detect the microstructure of equilibrated alloys and composition of each phase, including solubility. X-ray diffraction (XRD, Rigaku d-max/2550 VB, Cu K, 40 kV, 250 mA, Tokyo, Japan) was employed to analyze the crystal structure of typical alloys, with the scanning range of 10°–90° and a speed of 0.133°/s. Backscattering electron (BSE) images of the alloy samples were acquired using a scanning electron microscope (SEM, TESCAN MIRA3 LMH, 15 kV, working distance of 15 mm, Brno, The Czech Republic).

3. Experimental Results

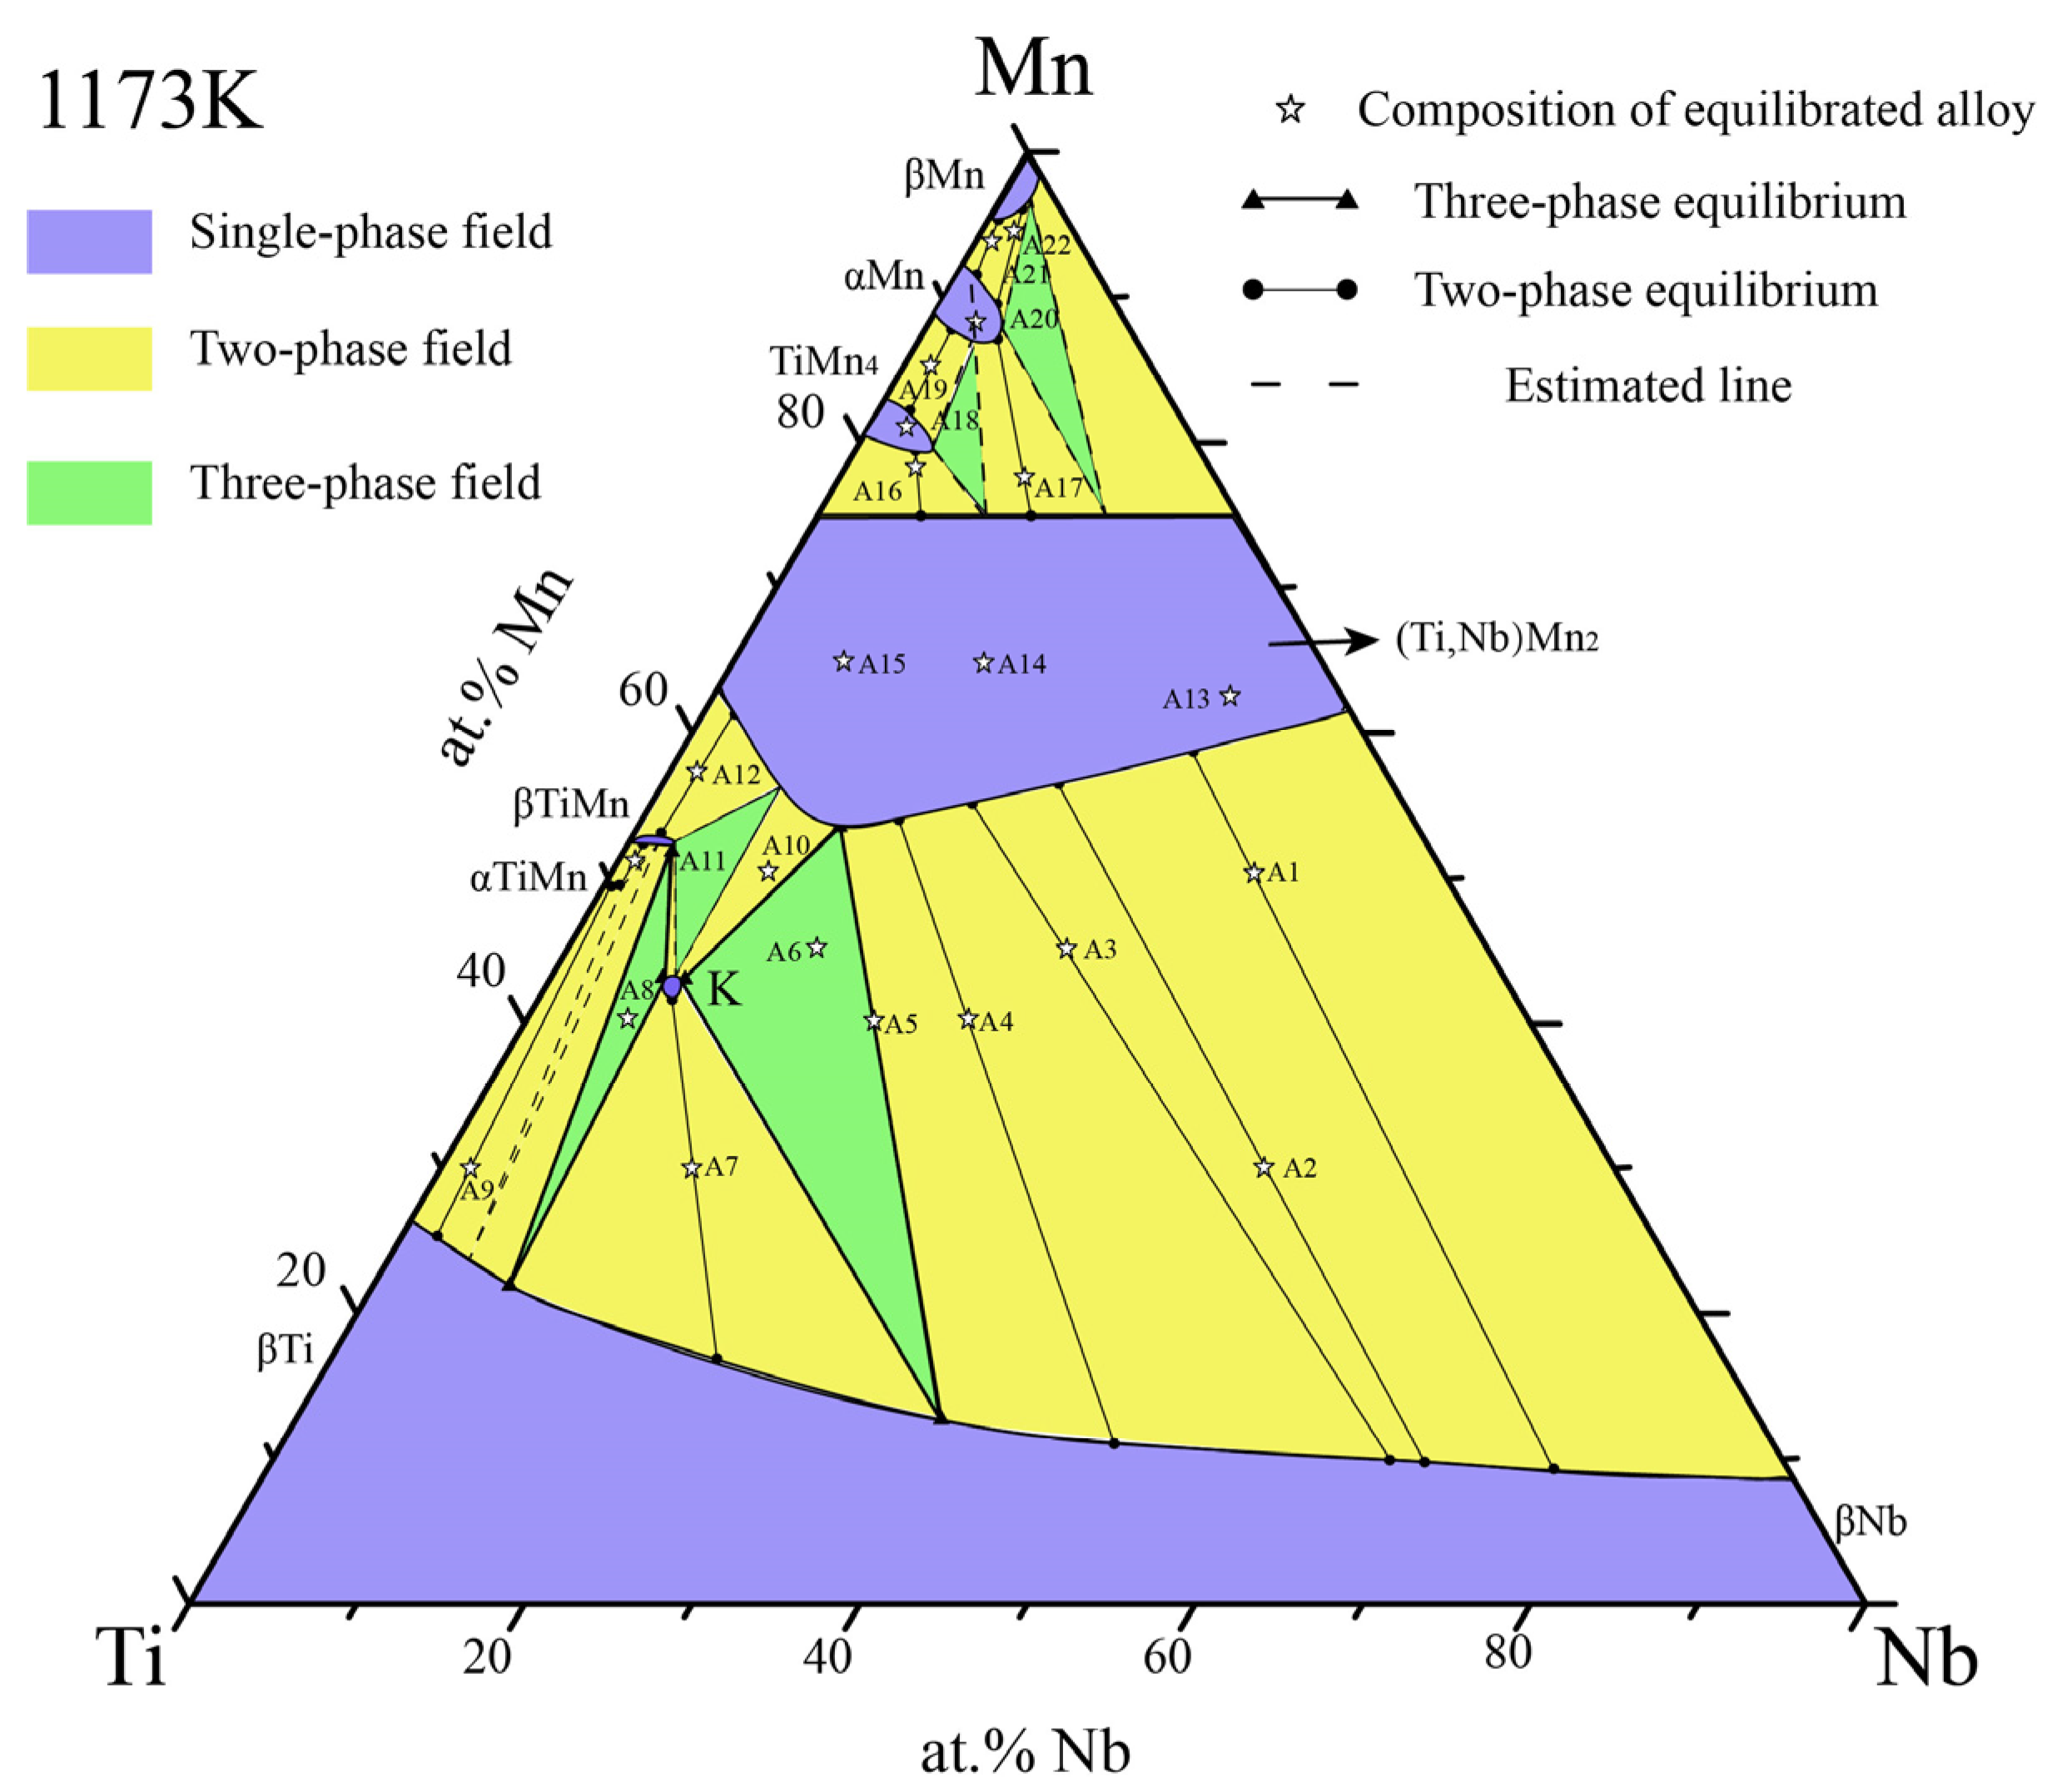
According to the results of EPMA-WDS data and the result of XRD patterns, the isothermal section of the Ti-Nb-Mn ternary system at 1173K has been established in Figure 4. As can be seen in Figure 4 that four intermediate compounds were detected in the Ti-Mn end at 1173K: αTiMn, βTiMn, TiMn2 and TiMn4. The maximum solid solubility of Nb in αTiMn and βTiMn was 1.71 at % and 3.91 at %, respectively. According to the optimization results of Ti-Mn binary system from Chen at al. [17], the composition range of αTiMn detected in this paper is very narrow, so αTiMn is treated as a linear compound in this system. At 1173K, both Ti and Nb exist in the bcc structure, so there is an area where Ti and Nb are mutually dissolved. It is worth noting that a ternary compound K-Ti50Nb7Mn43 phase, which has never been reported before, was found in the isothermal section of the Nb-Mn-Ti ternary system at 1173K. It was mainly detected in the equilibrium alloys A7 and A10 that two three-phase equilibrium fields comprise the K-Ti50Nb7Mn43 phase. The presence of the K-Ti50Nb7Mn43 phase was also detected in the surrounding two-phase fields, and the composition of this ternary phase was around Nb7Mn43Ti50. Although alloy samples of pure K-Ti50Nb7Mn43 phase were not obtained, the existence of K-Ti50Nb7Mn43 can be proved combining the EPMA-WDS data with the XRD results. There is only one intermediate compound at the Mn-Nb end: Mn2Nb, and its microstructure is the same as TiMn2 at the Ti-Mn end, both of which are C14 Laves phases. As shown in Table 1, because the crystal structures are completely consistent and lattice parameters are similar between βNb and βTi, the two elements Ti and Nb can be arbitrarily replaced with each other and shown as infinite solid solution β(Ti,Nb) within their composition range in Figure 4, Figure 5 and Figure 6 [30]. Similarly, TiMn2 and NbMn2 can form infinite solid solution (Ti,Nb)Mn2. At the Mn-rich end, the maximum solid solubility of Nb in TiMn4 was determined to be 9.31 at.%, and the composition range of TiMn4 was determined to be from 81.76 at % to 83.11 at %. Meanwhile, αMn and βMn were also detected with a certain solid solubility, but due to the strong volatility of manganese, the samples at Mn-rich end are insufficient, and its precise solid solution range cannot be obtained. Therefore, some fields are indicated by dash lines in the isothermal section.
Based on the analysis of the typical alloy samples at 1173K, the isothermal section of the Ti-Nb-Mn system at 1173K was obtained. Two three-phase equilibrium regions and ten two-phase equilibrium regions were actually detected in the isothermal section, which are: K + (Ti,Nb)Mn2 + (βTi,Nb), K + (βTi,Nb) + βTiMn, (Ti,Nb)Mn2 + (βTi,Nb), (βTi,Nb) + K, (βTi,Nb) + αTiMn, αTiMn + βTiMn, βTiMn + (Ti,Nb)Mn2, K + (Ti,Nb)Mn2, (Ti,Nb)Mn2 + TiMn4, (Ti,Nb)Mn2 + αMn, TiMn4 + αMn and αMn + βMn. Then according to the extrapolation of the three binary optimized phase diagrams and the actual determination of the phase equilibrium relationships, four undetected three-phase regions are drawn by prediction (shown by dashed lines in Figure 4), which are: βTiMn + K + (Ti,Nb)Mn2, βTiMn + αTiMn + (βTi,Nb) and αMn + TiMn4 + (Ti,Nb)Mn2 and αMn + βMn + (Ti,Nb)Mn2.
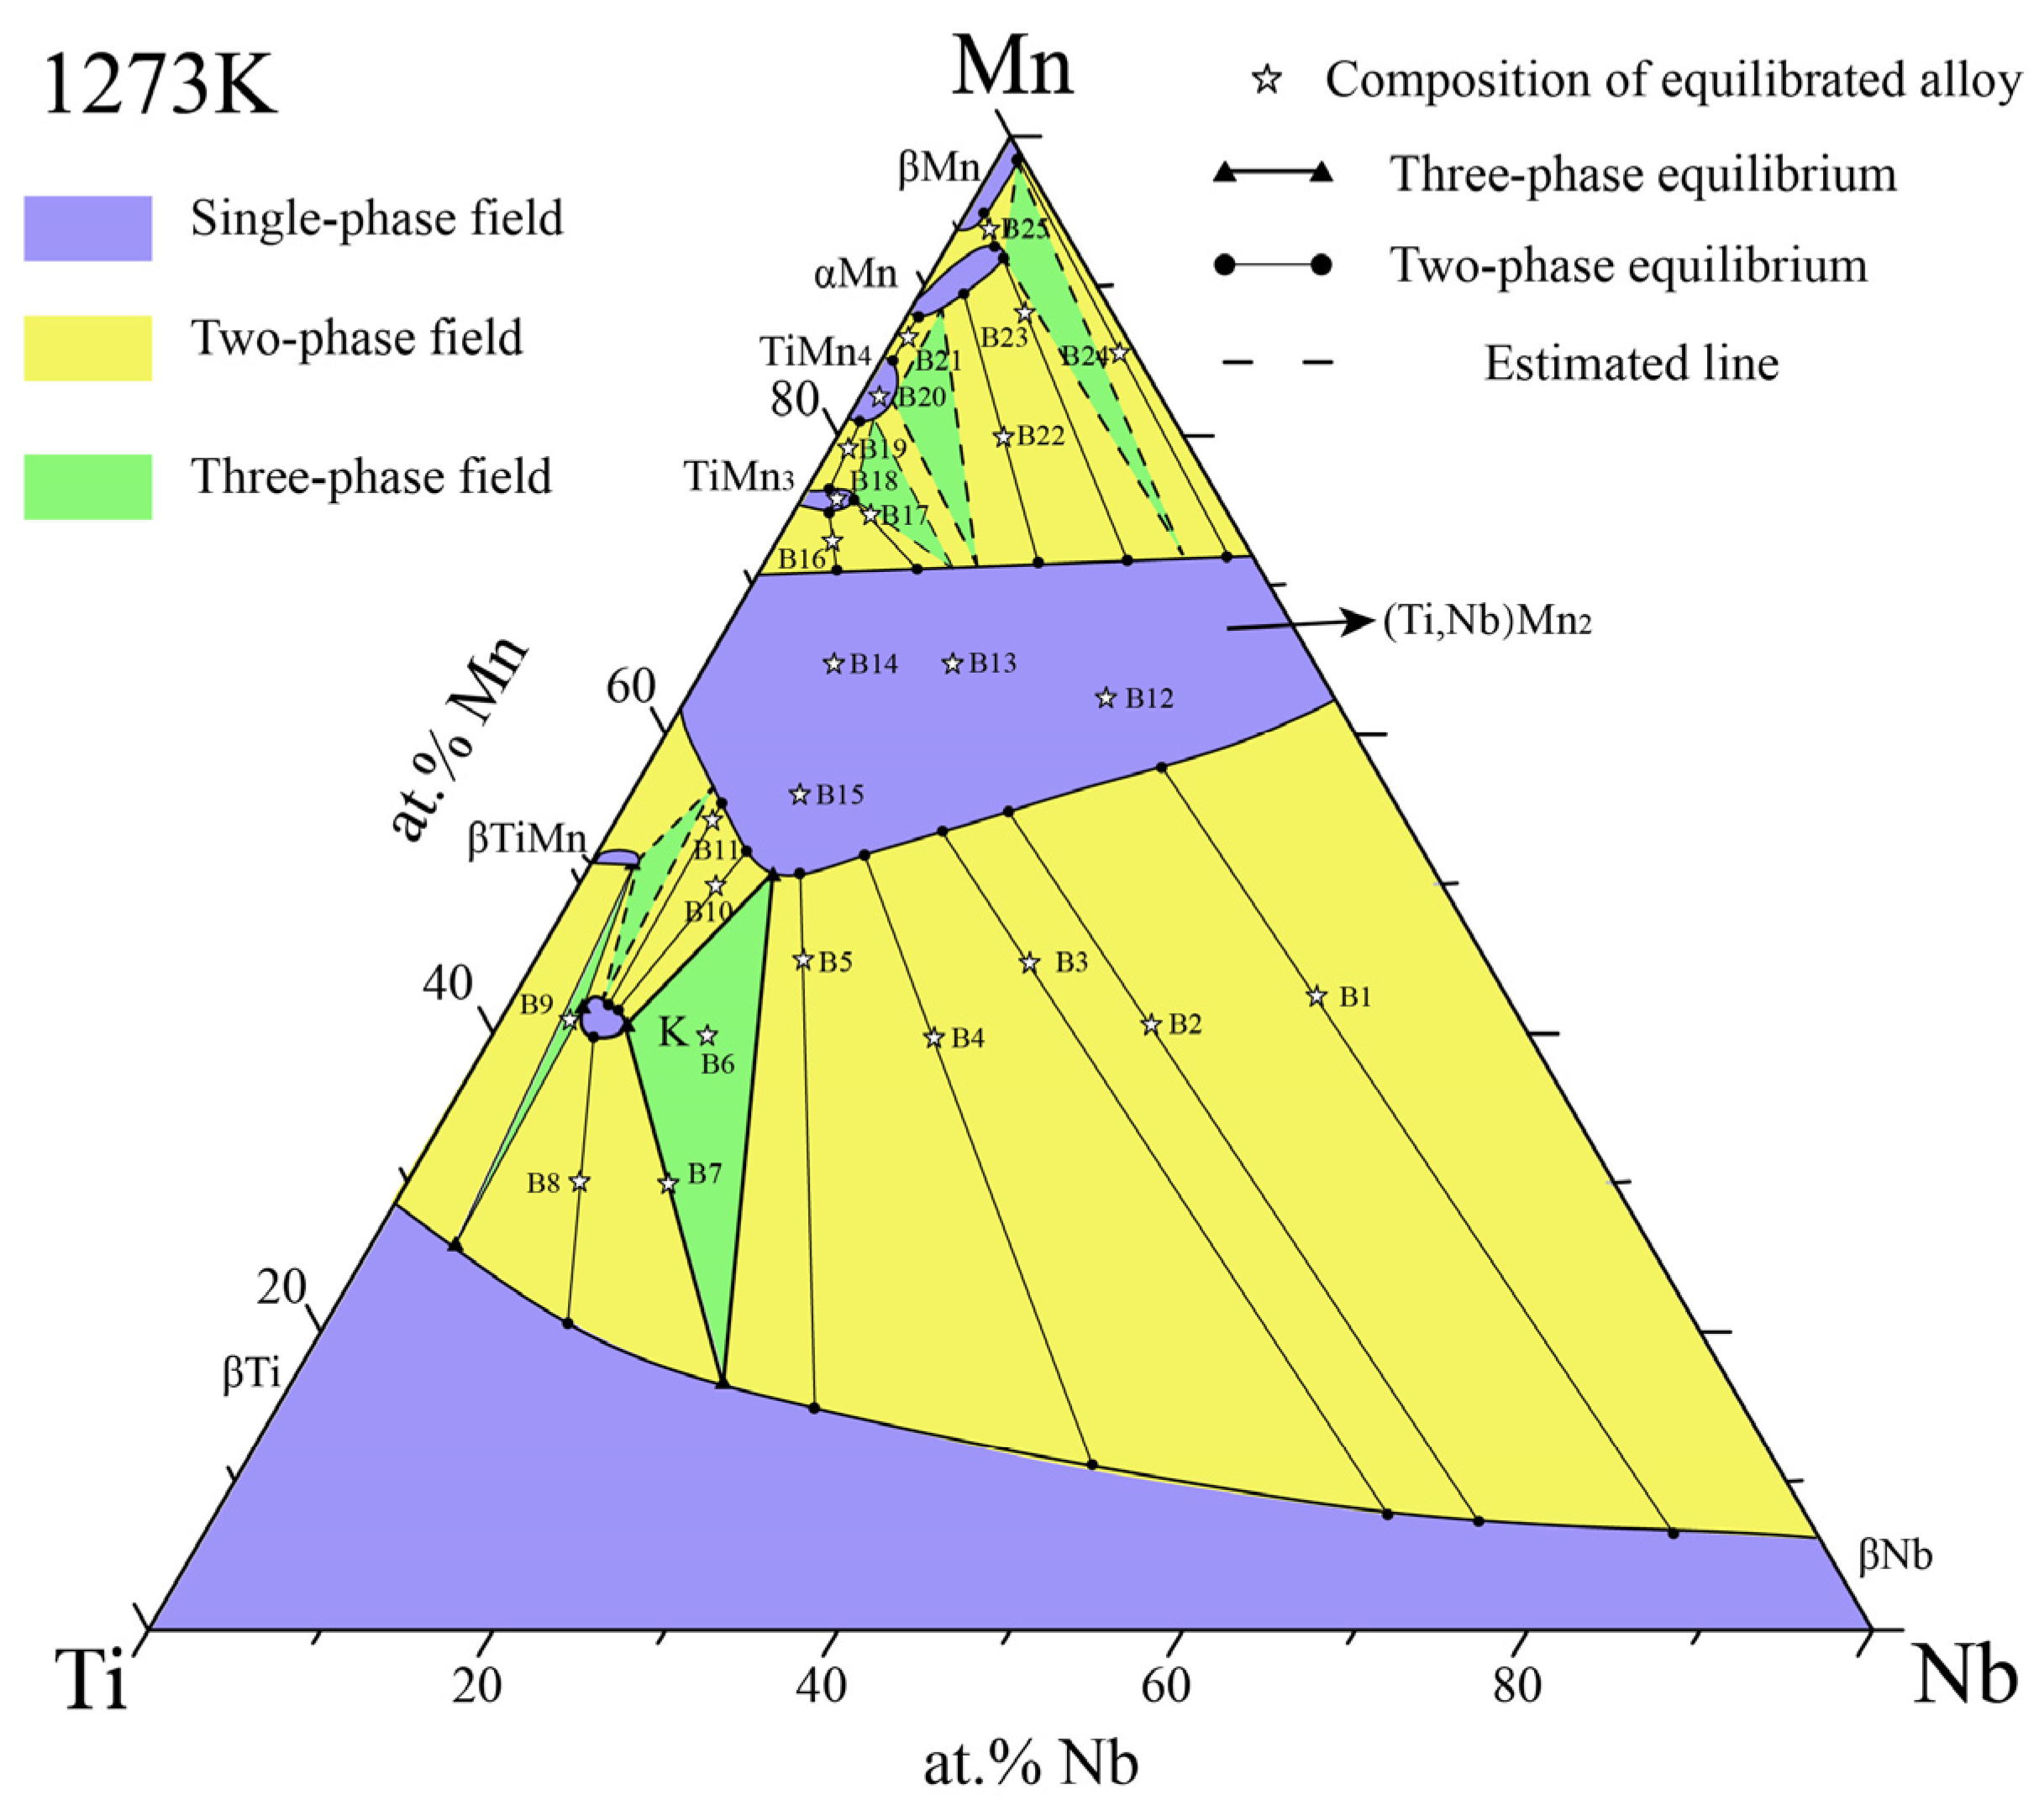
Based on the analysis of BSE images, EPMA-WDS data and XRD patterns, the isothermal section of the Ti-Nb-Mn system at 1273K is constructed, as presented in Figure 5. The maximum solid solubility of Nb in βTiMn and TiMn3 was 3.07 at.% and 4.50 at.%, respectively. In this isothermal section, two three-phase fields and eight two-phase fields were determined by 25 equilibrium alloy samples, which are: K + (Ti,Nb)Mn2 + (βTi,Nb), K + (βTi,Nb) + βTiMn, (Ti,Nb)Mn2 + (βTi, Nb), (βTi,Nb) + K, K + (Ti,Nb)Mn2, (Ti,Nb)Mn2 + TiMn3, TiMn3 + TiMn4, TiMn4 + αMn, (Ti,Nb)Mn2 + αMn, and (Ti,Nb)Mn2 + βMn. Combining the three binary optimized phase diagrams, phase rules and experimental results, two undetected three-phase fields are speculated, as shown by dashed lines in Figure 5, which are: K + (Ti,Nb)Mn2 + βTiMn, TiMn4 + αMn + (Ti,Nb)Mn2.
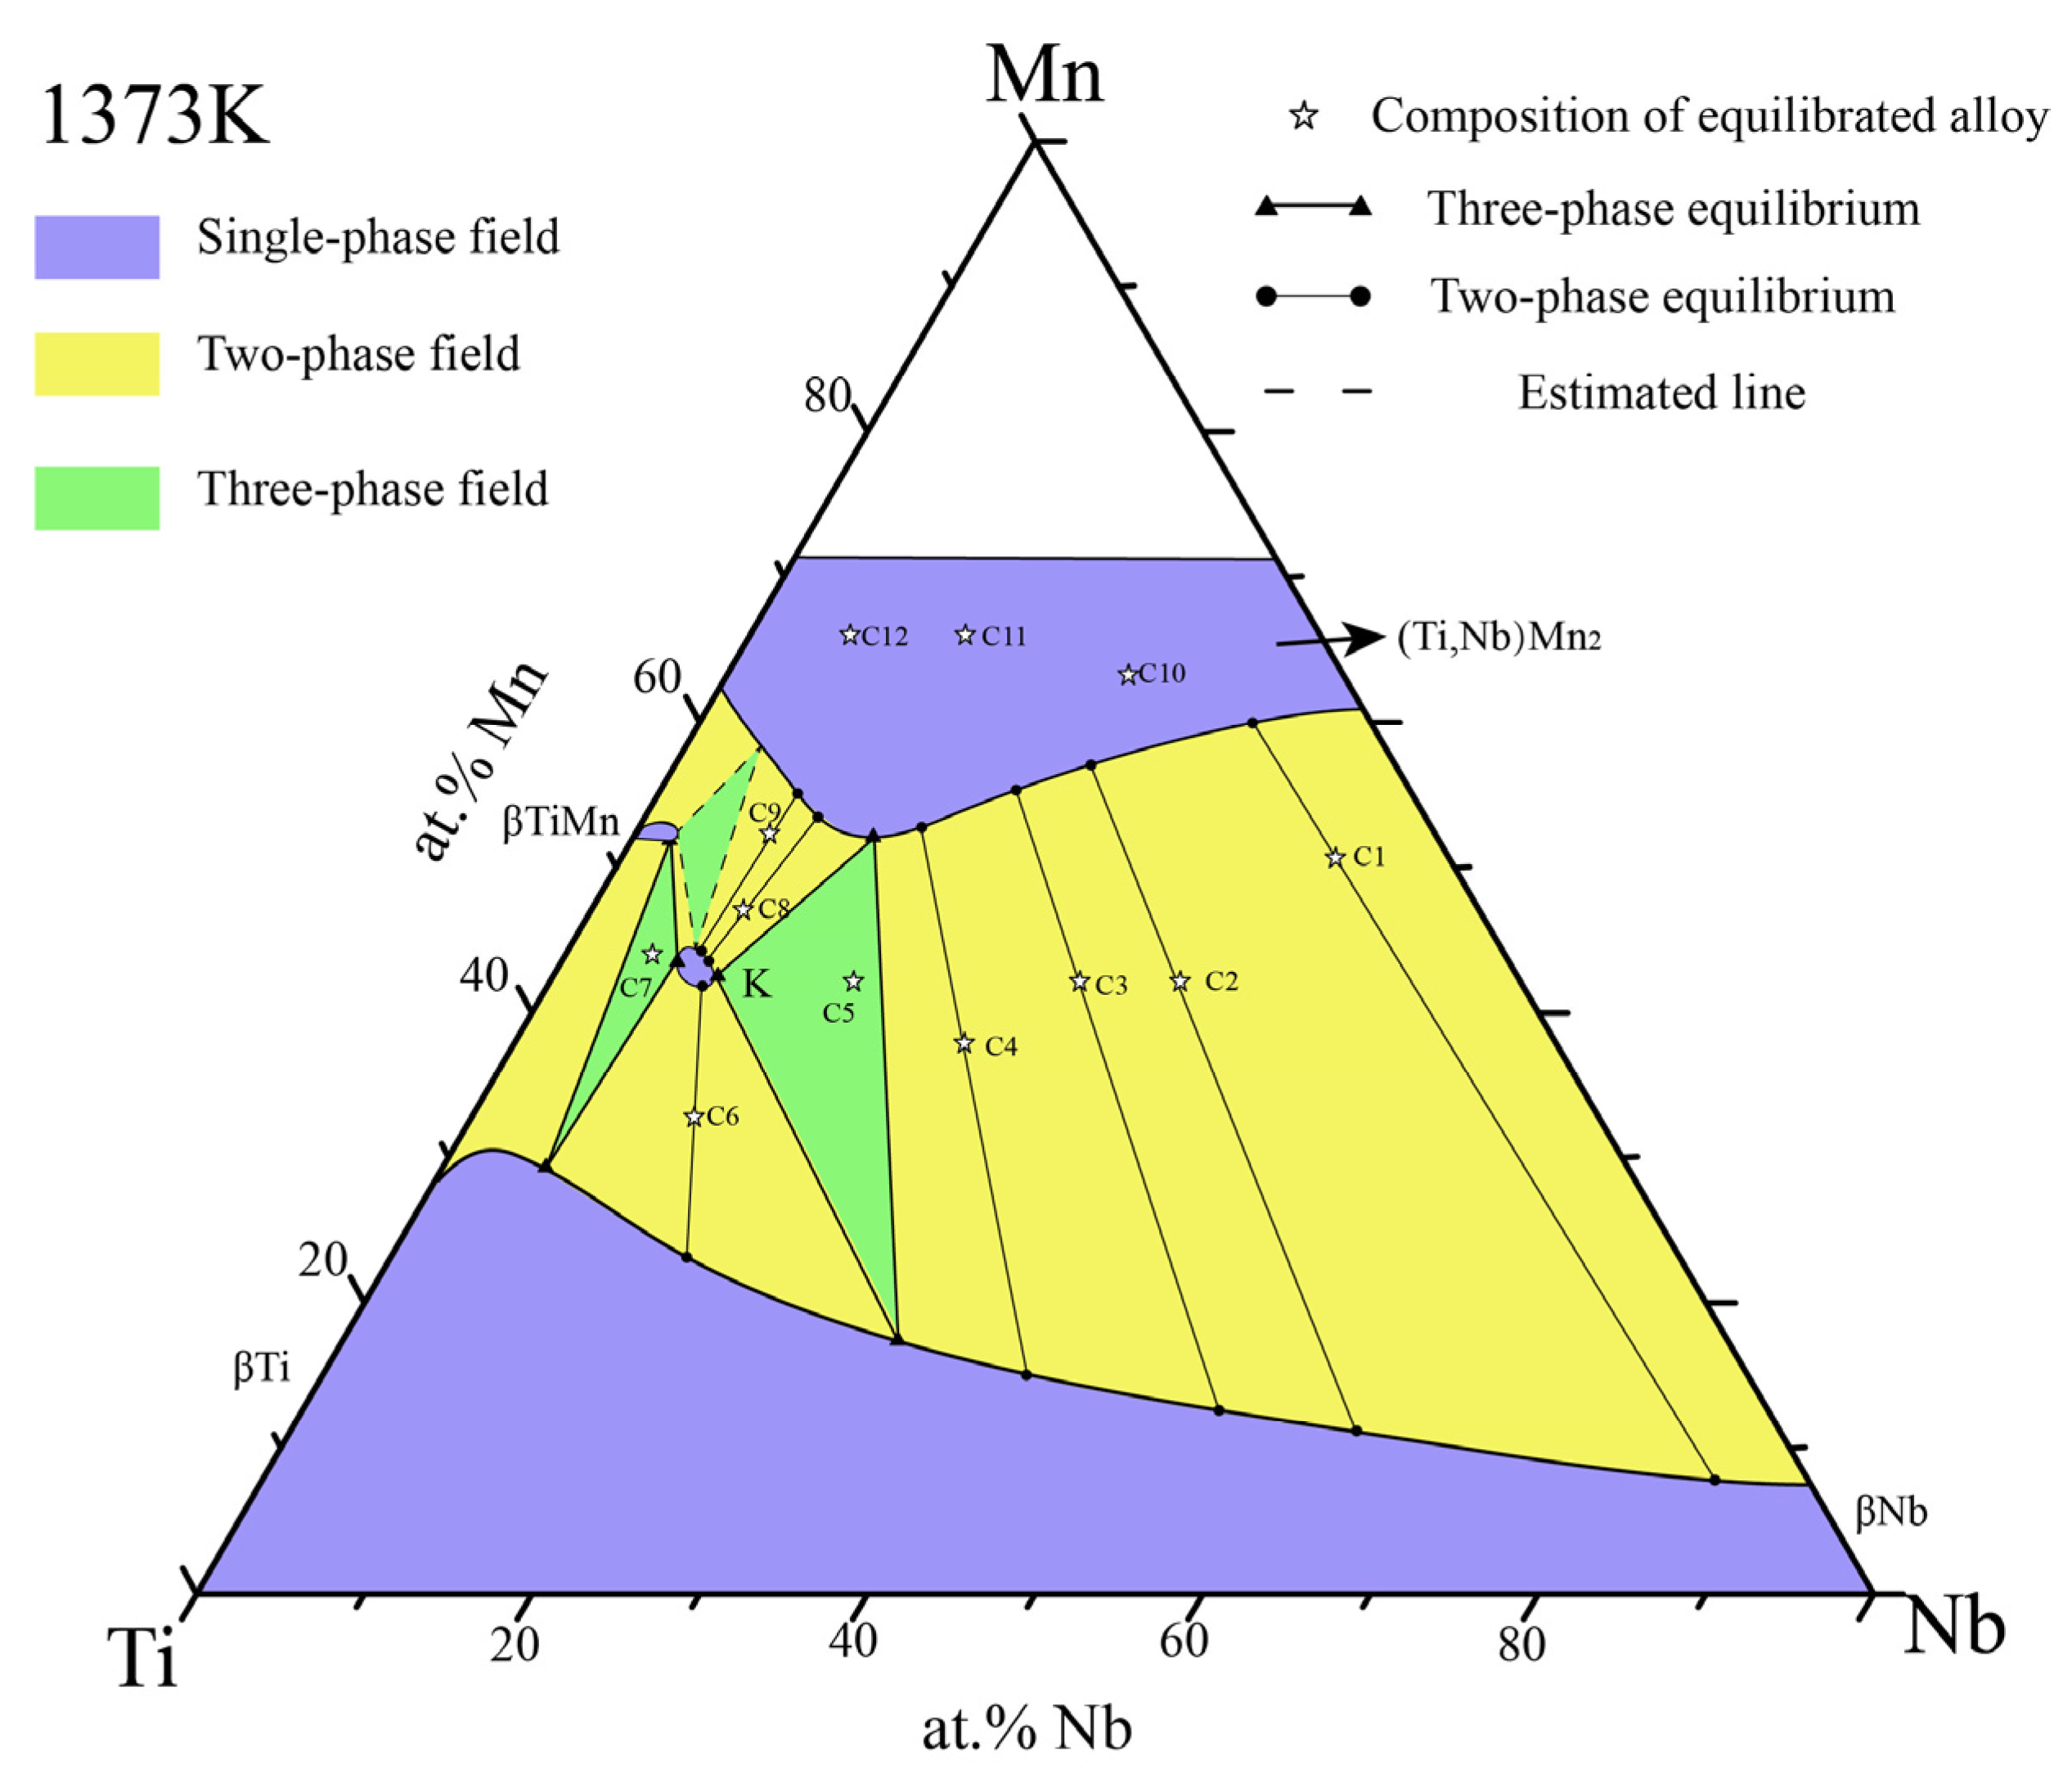
The isothermal section of Ti-Nb-Mn ternary system at 1373K is similar to the system at 1273K, as plotted in Figure 6. Since the isothermal section is measured at a high temperature of 1373K, samples at the manganese-rich end are easily burned and volatilized at this temperature for a long time, by measuring only 12 equilibrium alloy samples, two three-phase equilibrium fields and four two-phase equilibrium fields are determined,which are: K + (Ti,Nb)Mn2 + (βTi,Nb),K + (βTi,Nb) + βTiMn, (Ti,Nb)Mn2 + (βTi,Nb), (βTi,Nb) + K, K + (Ti,Nb)Mn2, (βTi,Nb) + βTiMn.

4. Discussion

To determine the phase relationships of the Ti-Nb-Mn ternary system at 1173K, 1273K and 1373K, a series of specimens were prepared. Table 2, Table 3 and Table 4 list the nominal composition of the ternary alloy samples respectively. All phases formed in the specimens, together with the chemical composition of the phases are included in Table 2, Table 3 and Table 4.

4.1. Phase Equilibria at 1173K

Twenty-two alloy samples were prepared in order to determine the isothermal section and phase relationship of the Ti-Nb-Mn ternary system at 1173K. The constituent phases of each alloy sample were listed in Table 2. In this table, nominal composition was set before synthesizing alloy and the content of each element in phase is measured by WDS.
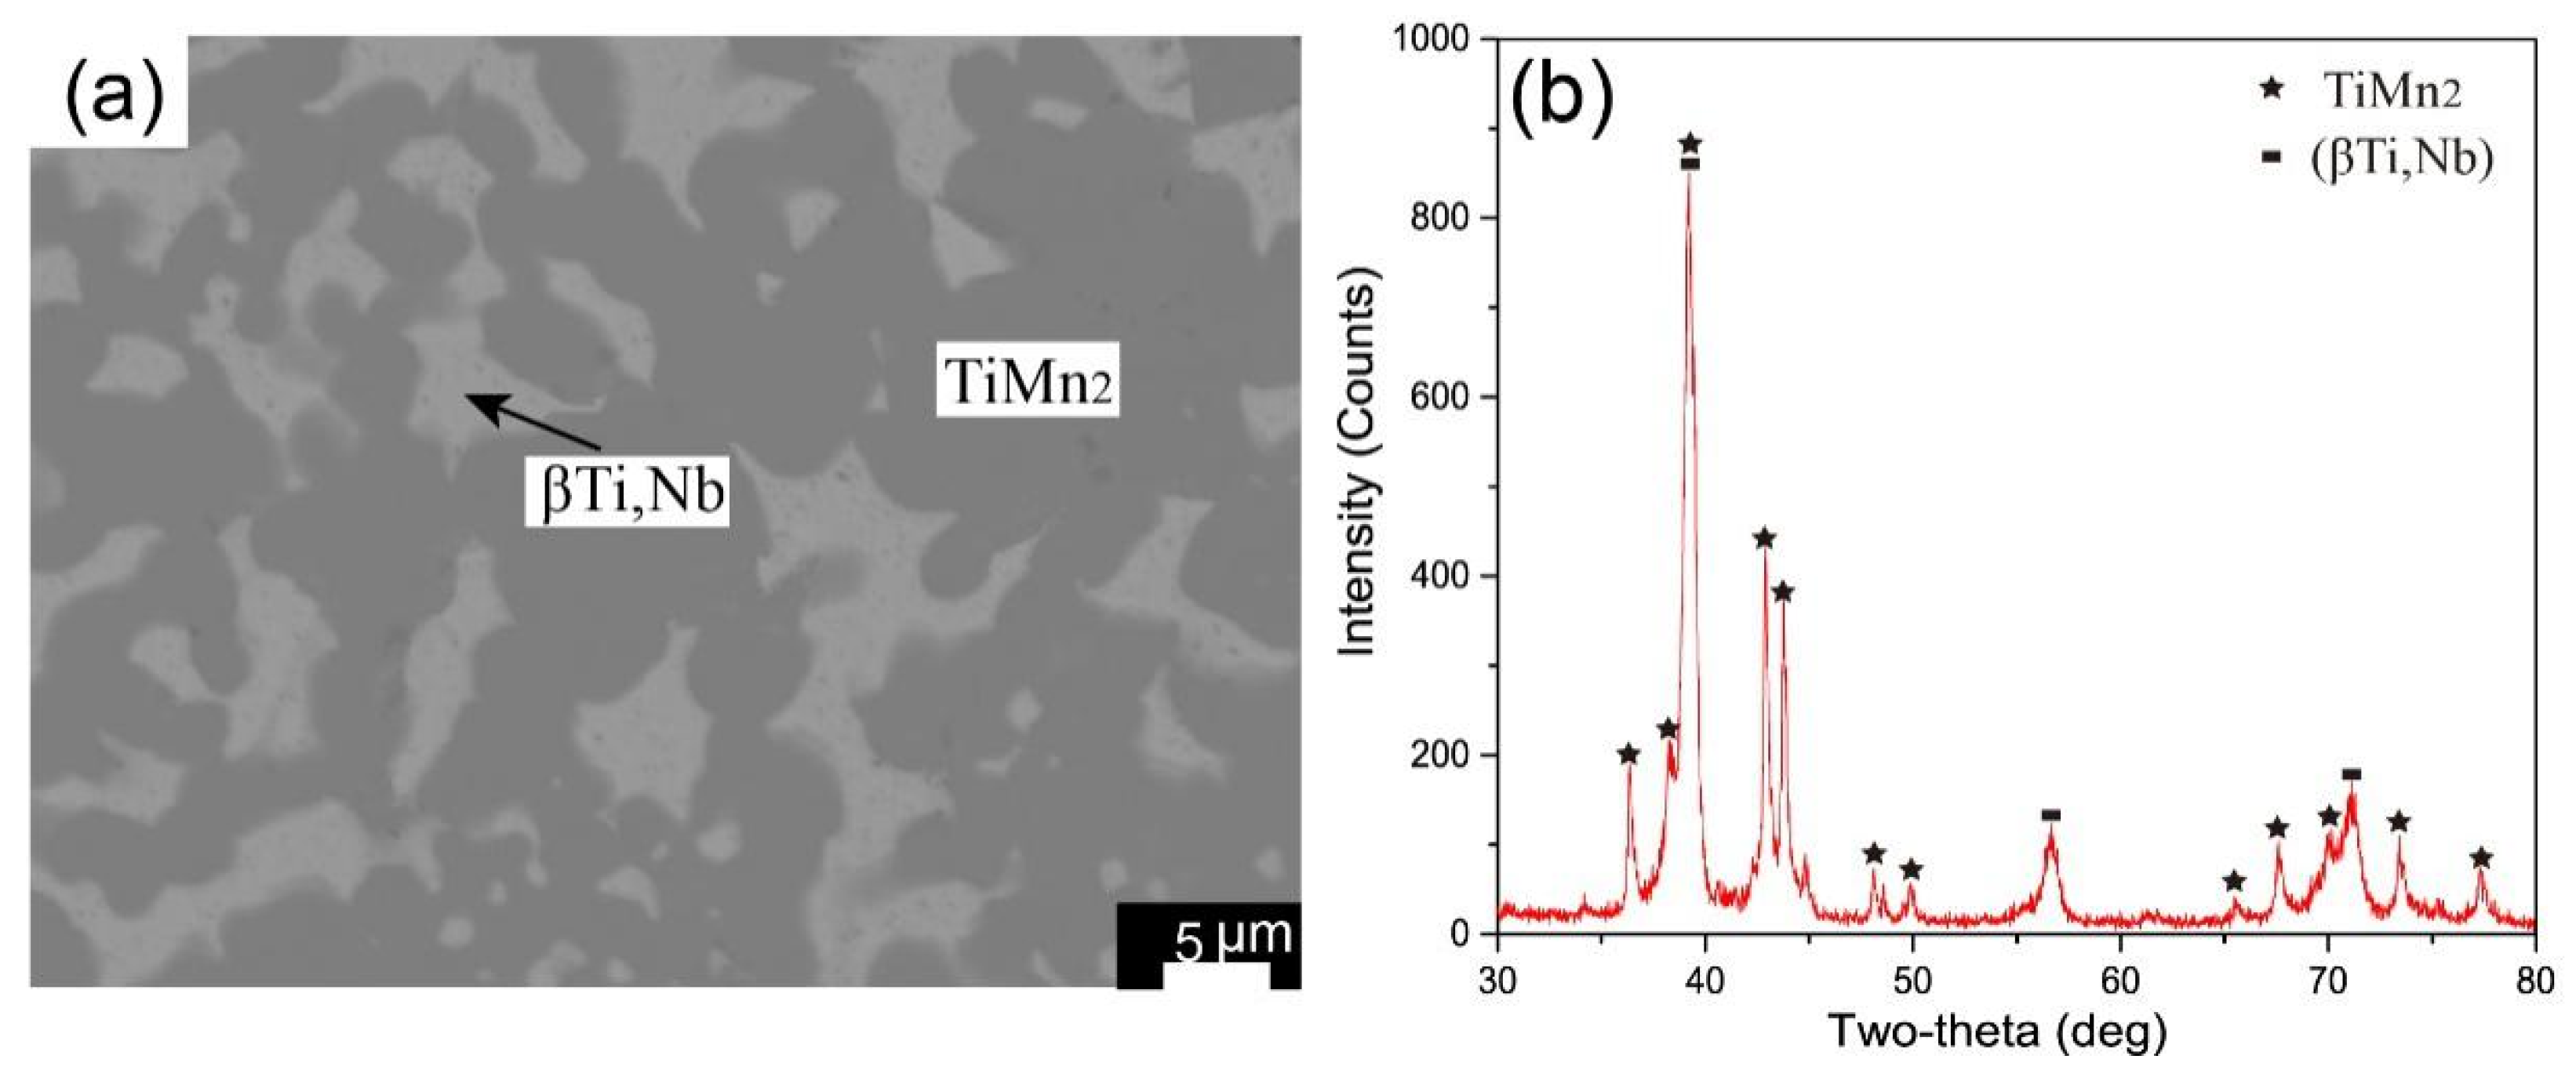
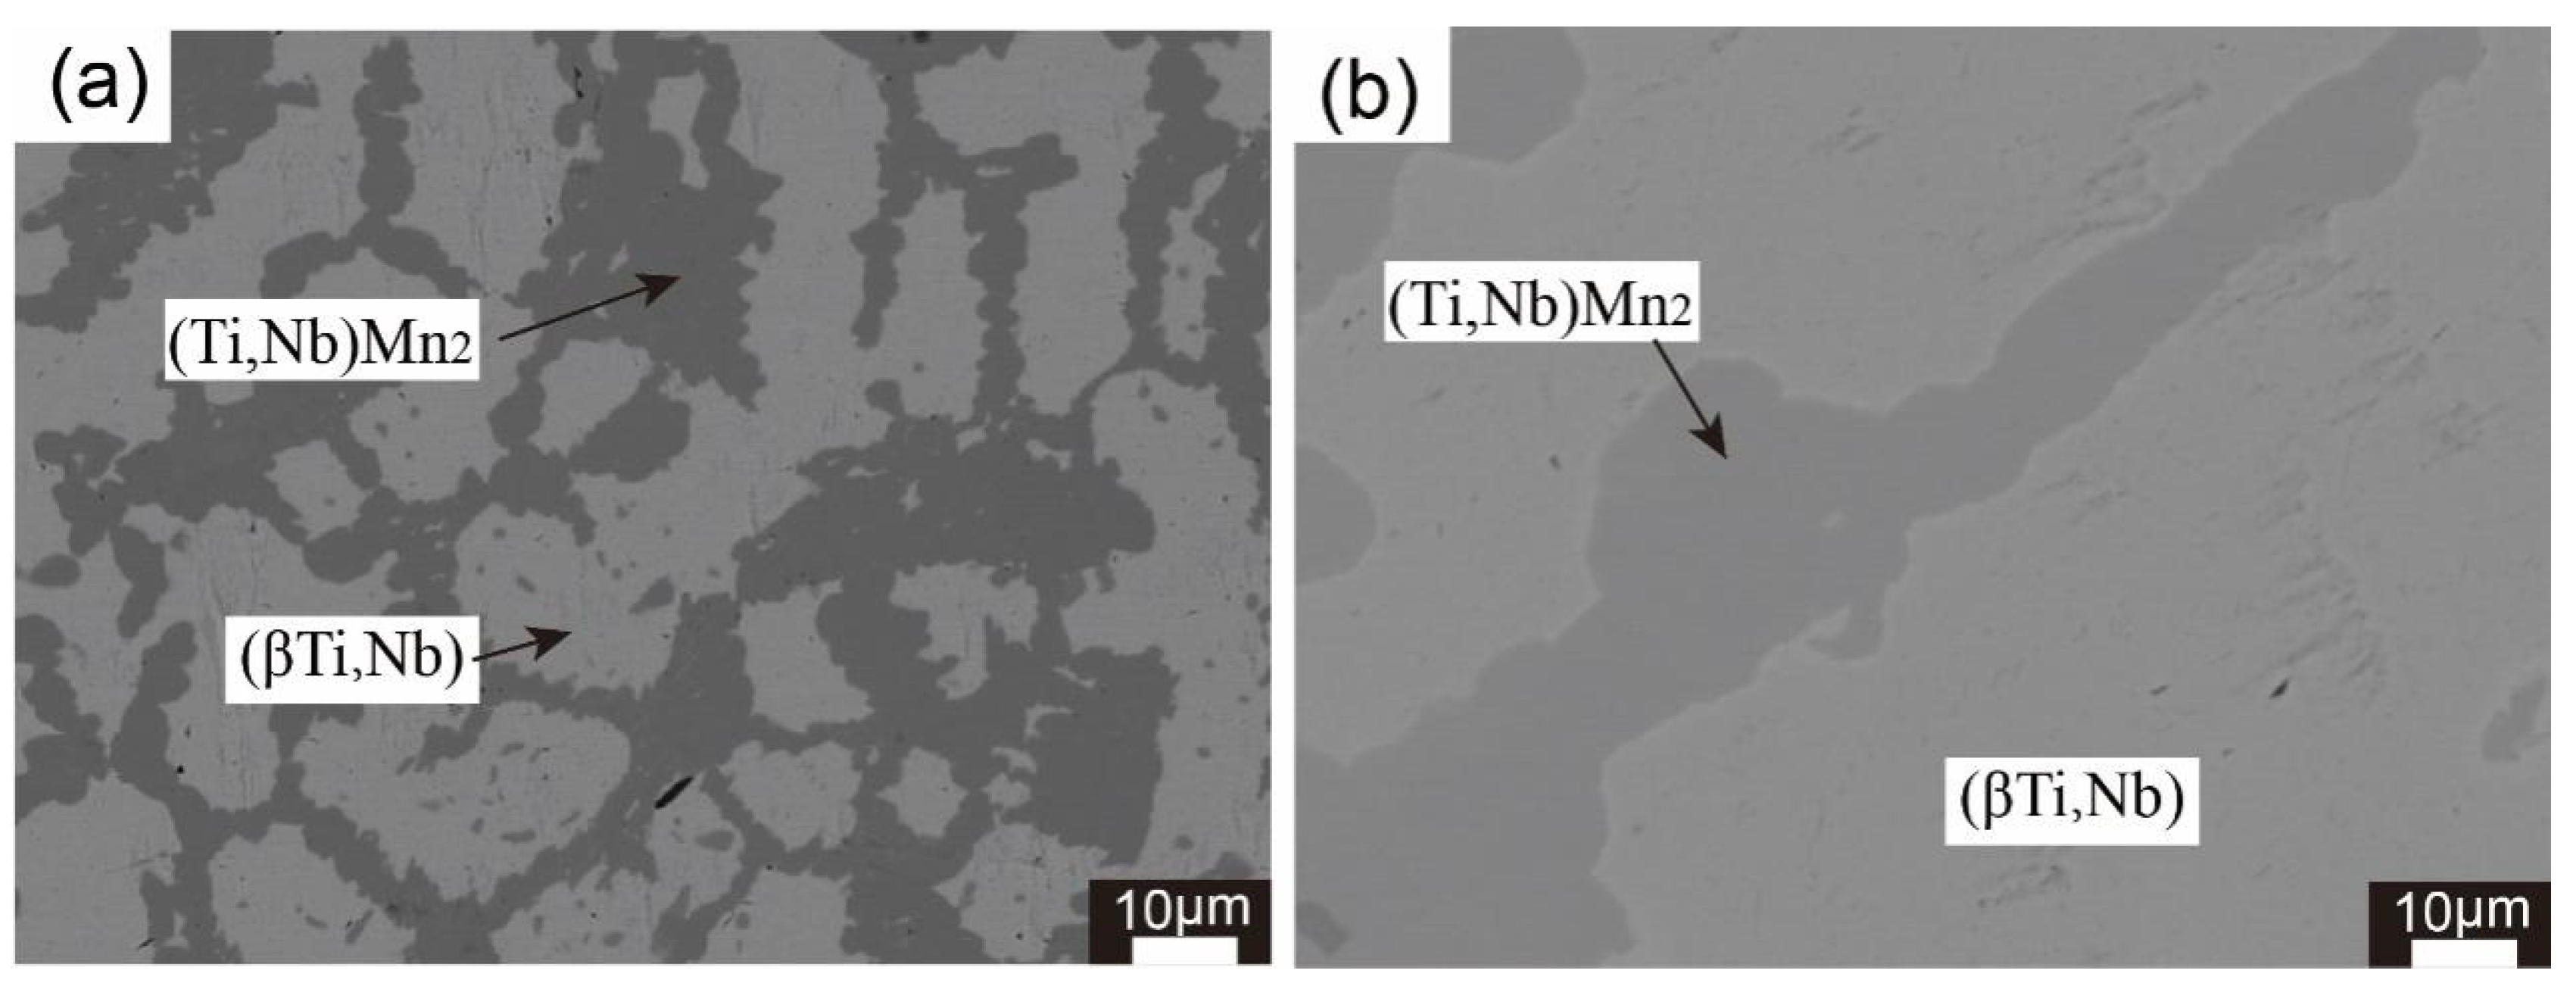
As shown in Figure 7a, EPMA analysis indicates that it contains a two-phase region. With the help of XRD method (Figure 7b), these two phases were confirmed as (βTi,Nb) (white base phase) and TiMn2 (gray phase). Considering TiMn2 and NbMn2 phases have the same C14 crystal structure, they can form a wide-range continuous solid solution phase (Ti,Nb)Mn2. A similar situation occurs in another system [18], they found that the (Zr,Ti)Mn2 phase maintained the C14 structure with the change of the composition ratio of Zr and Ti. In order to confirm it, samples of A12, A13 and A14 alloys were prepared.
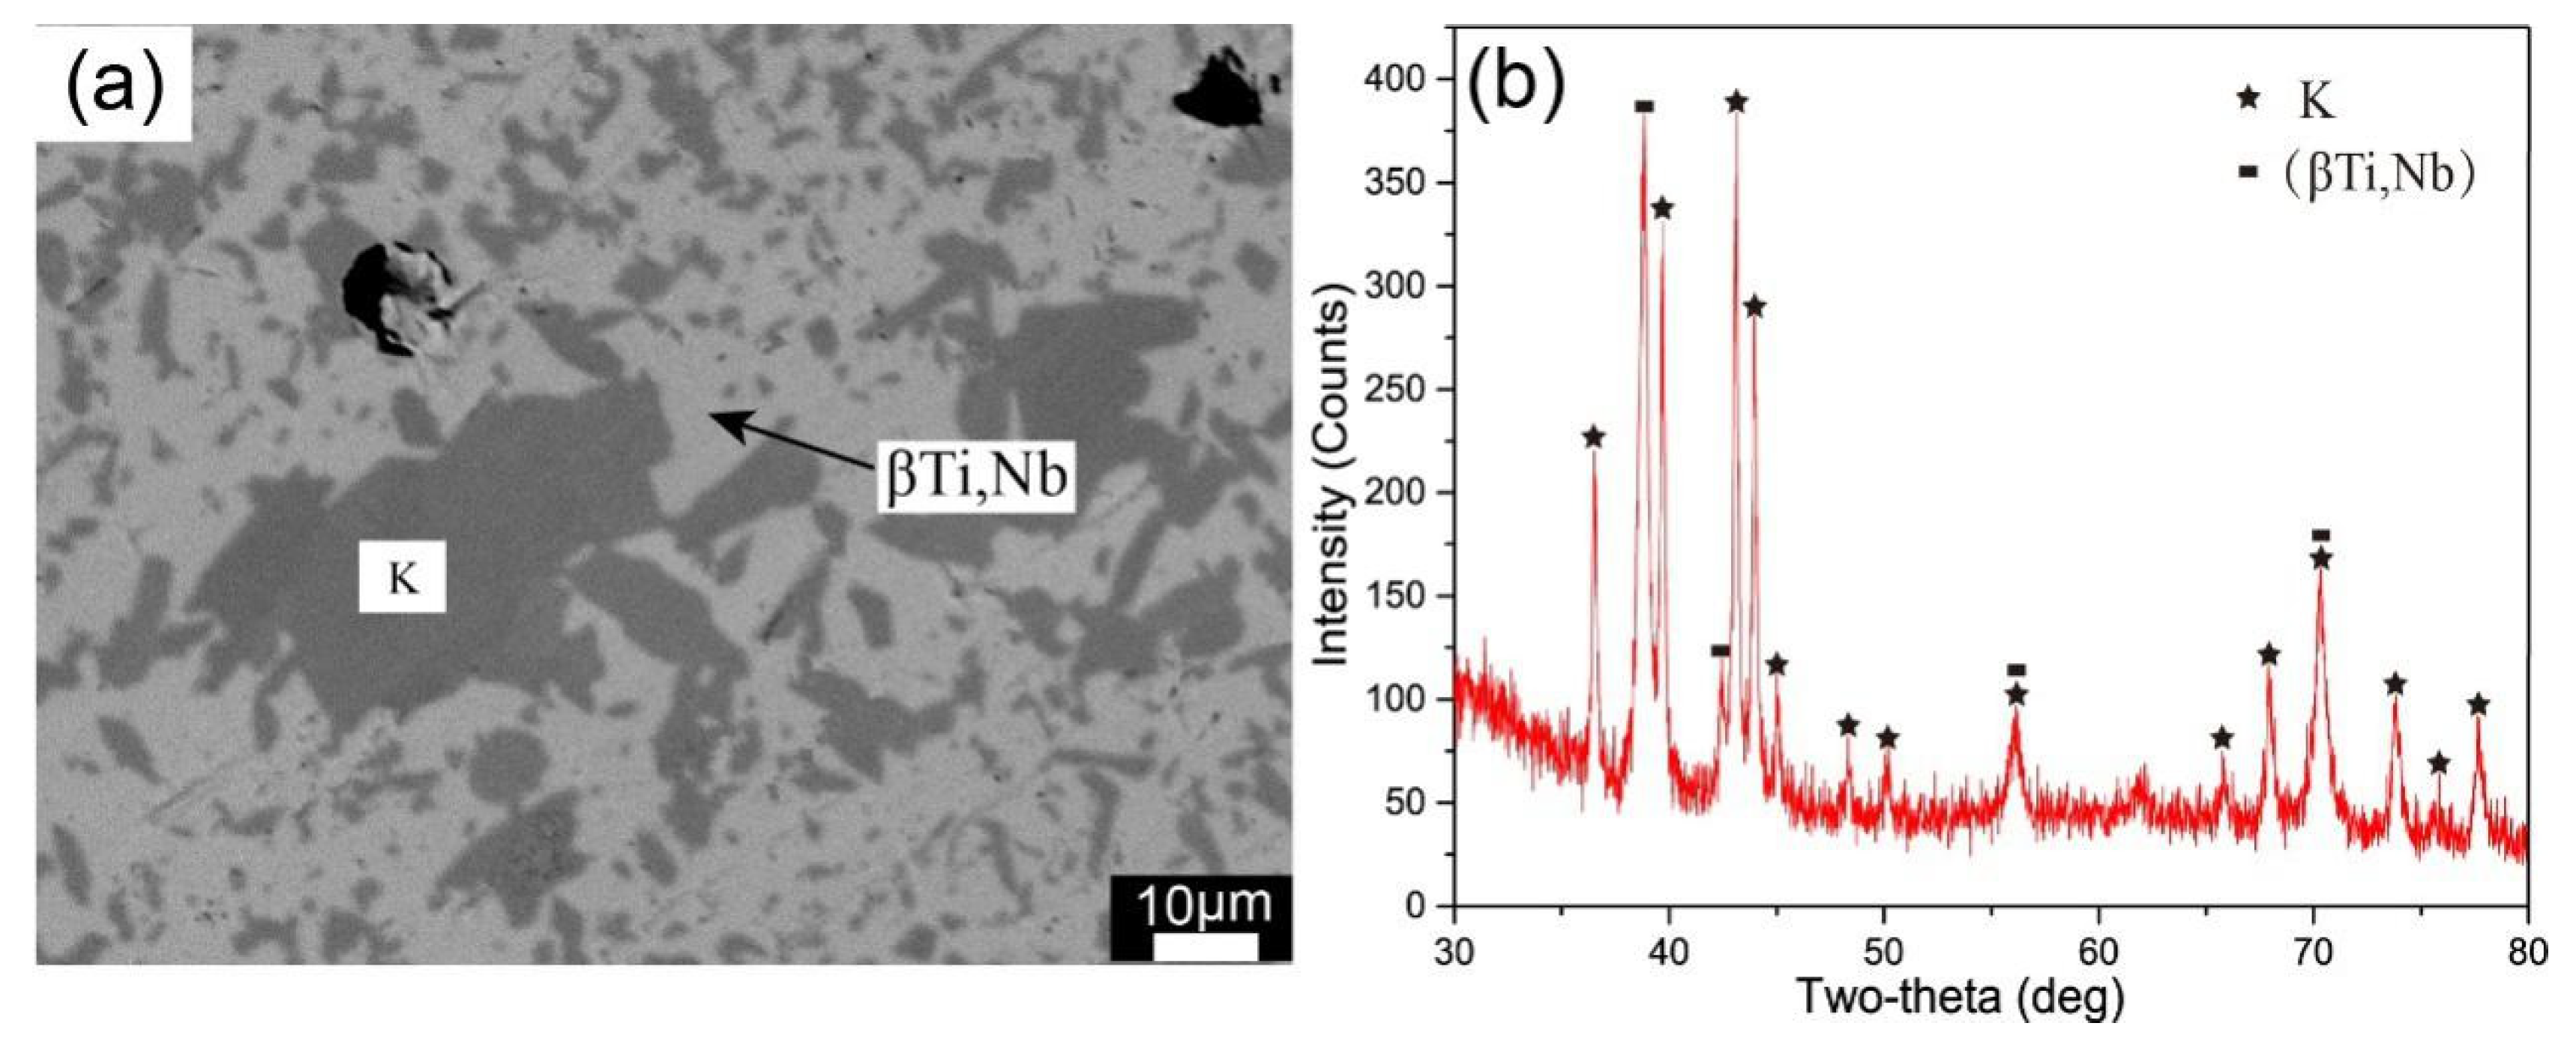
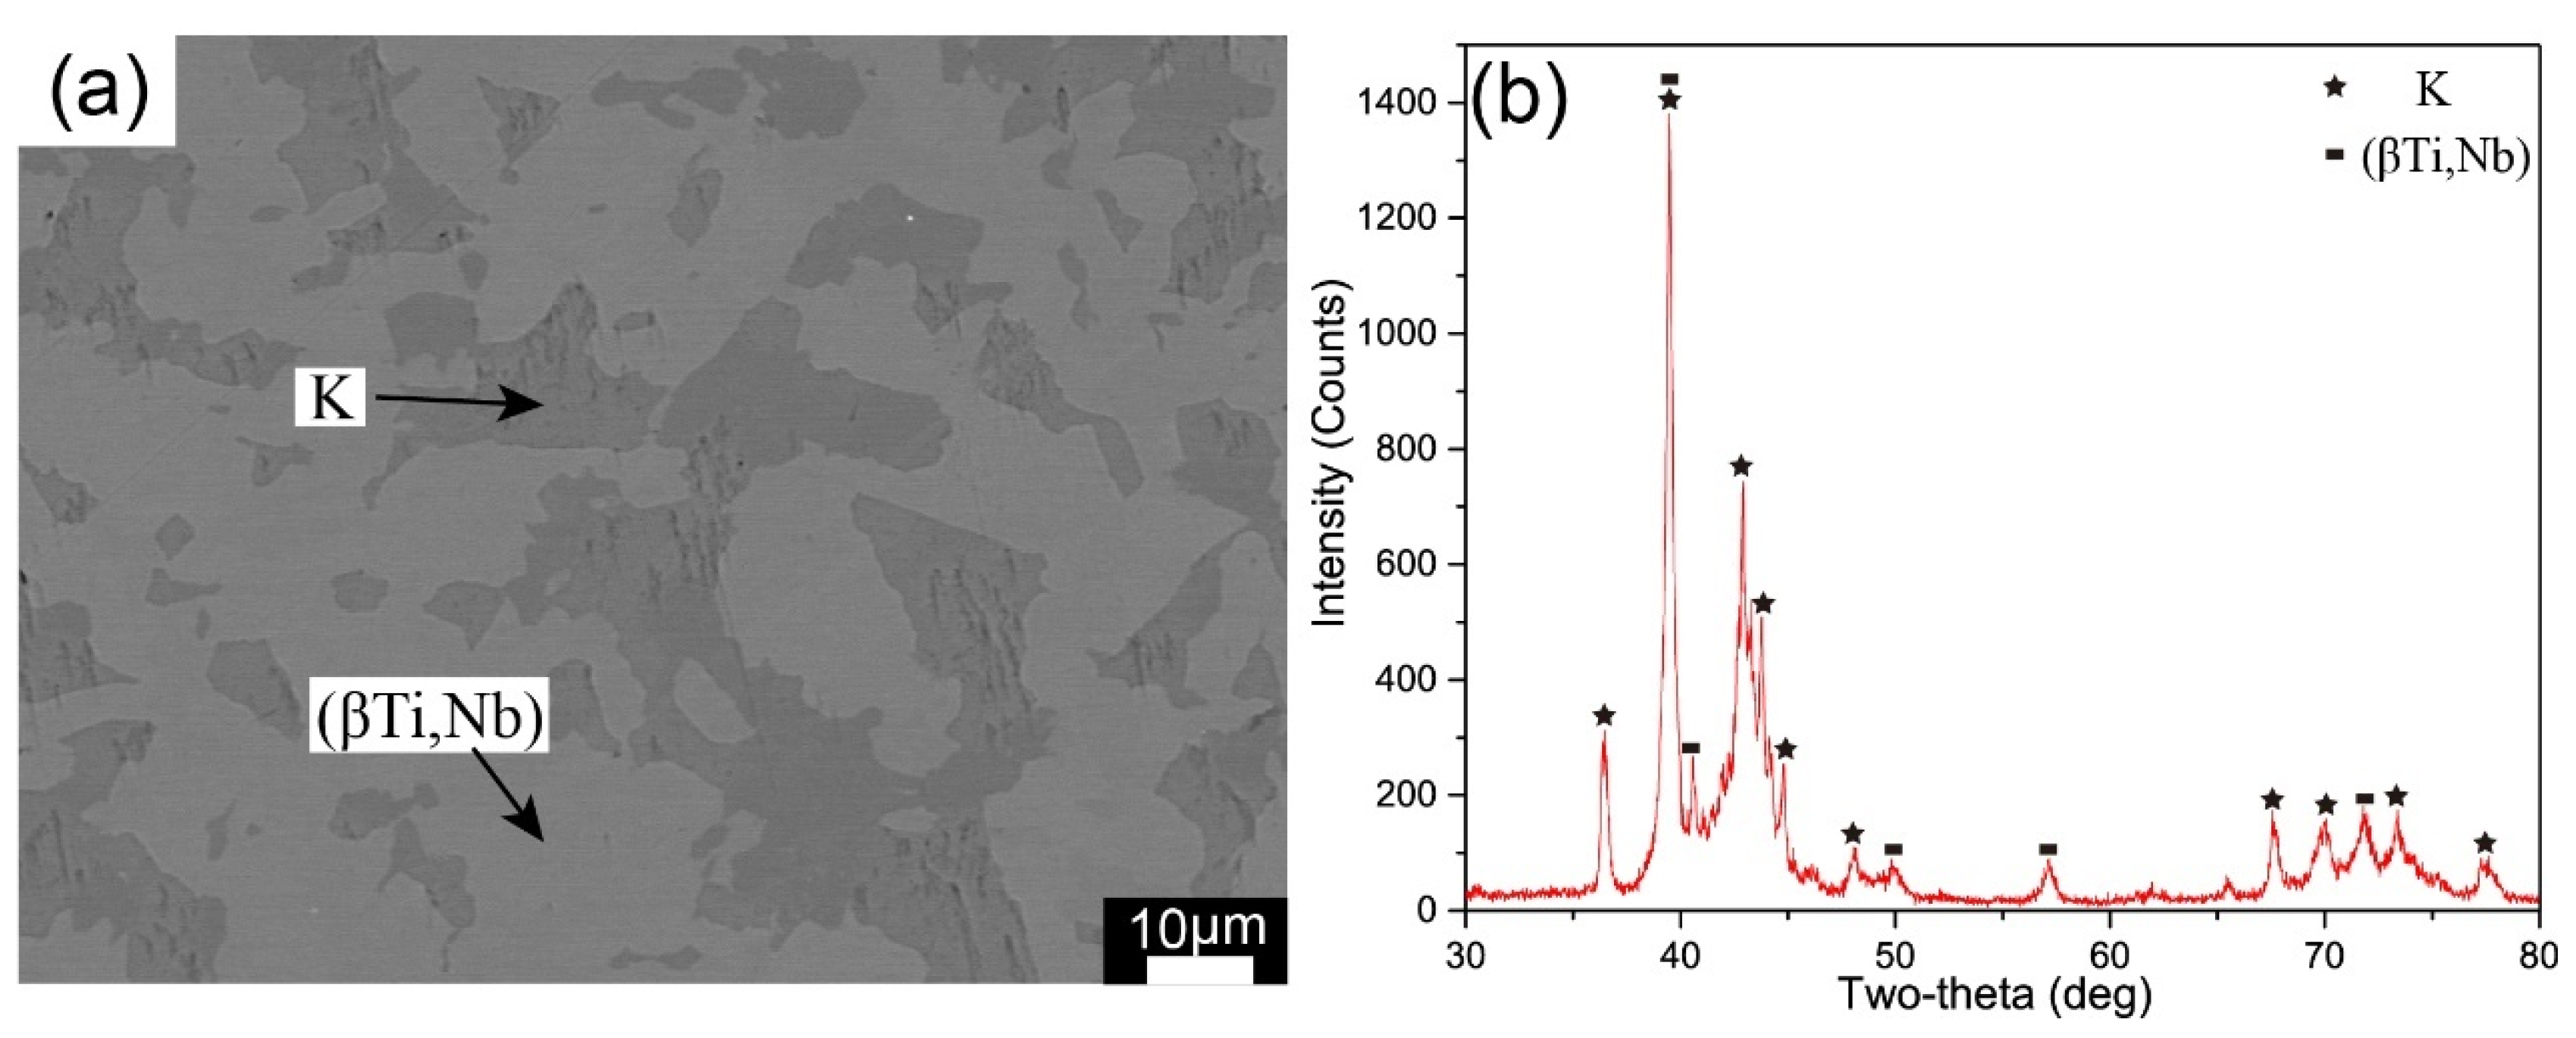
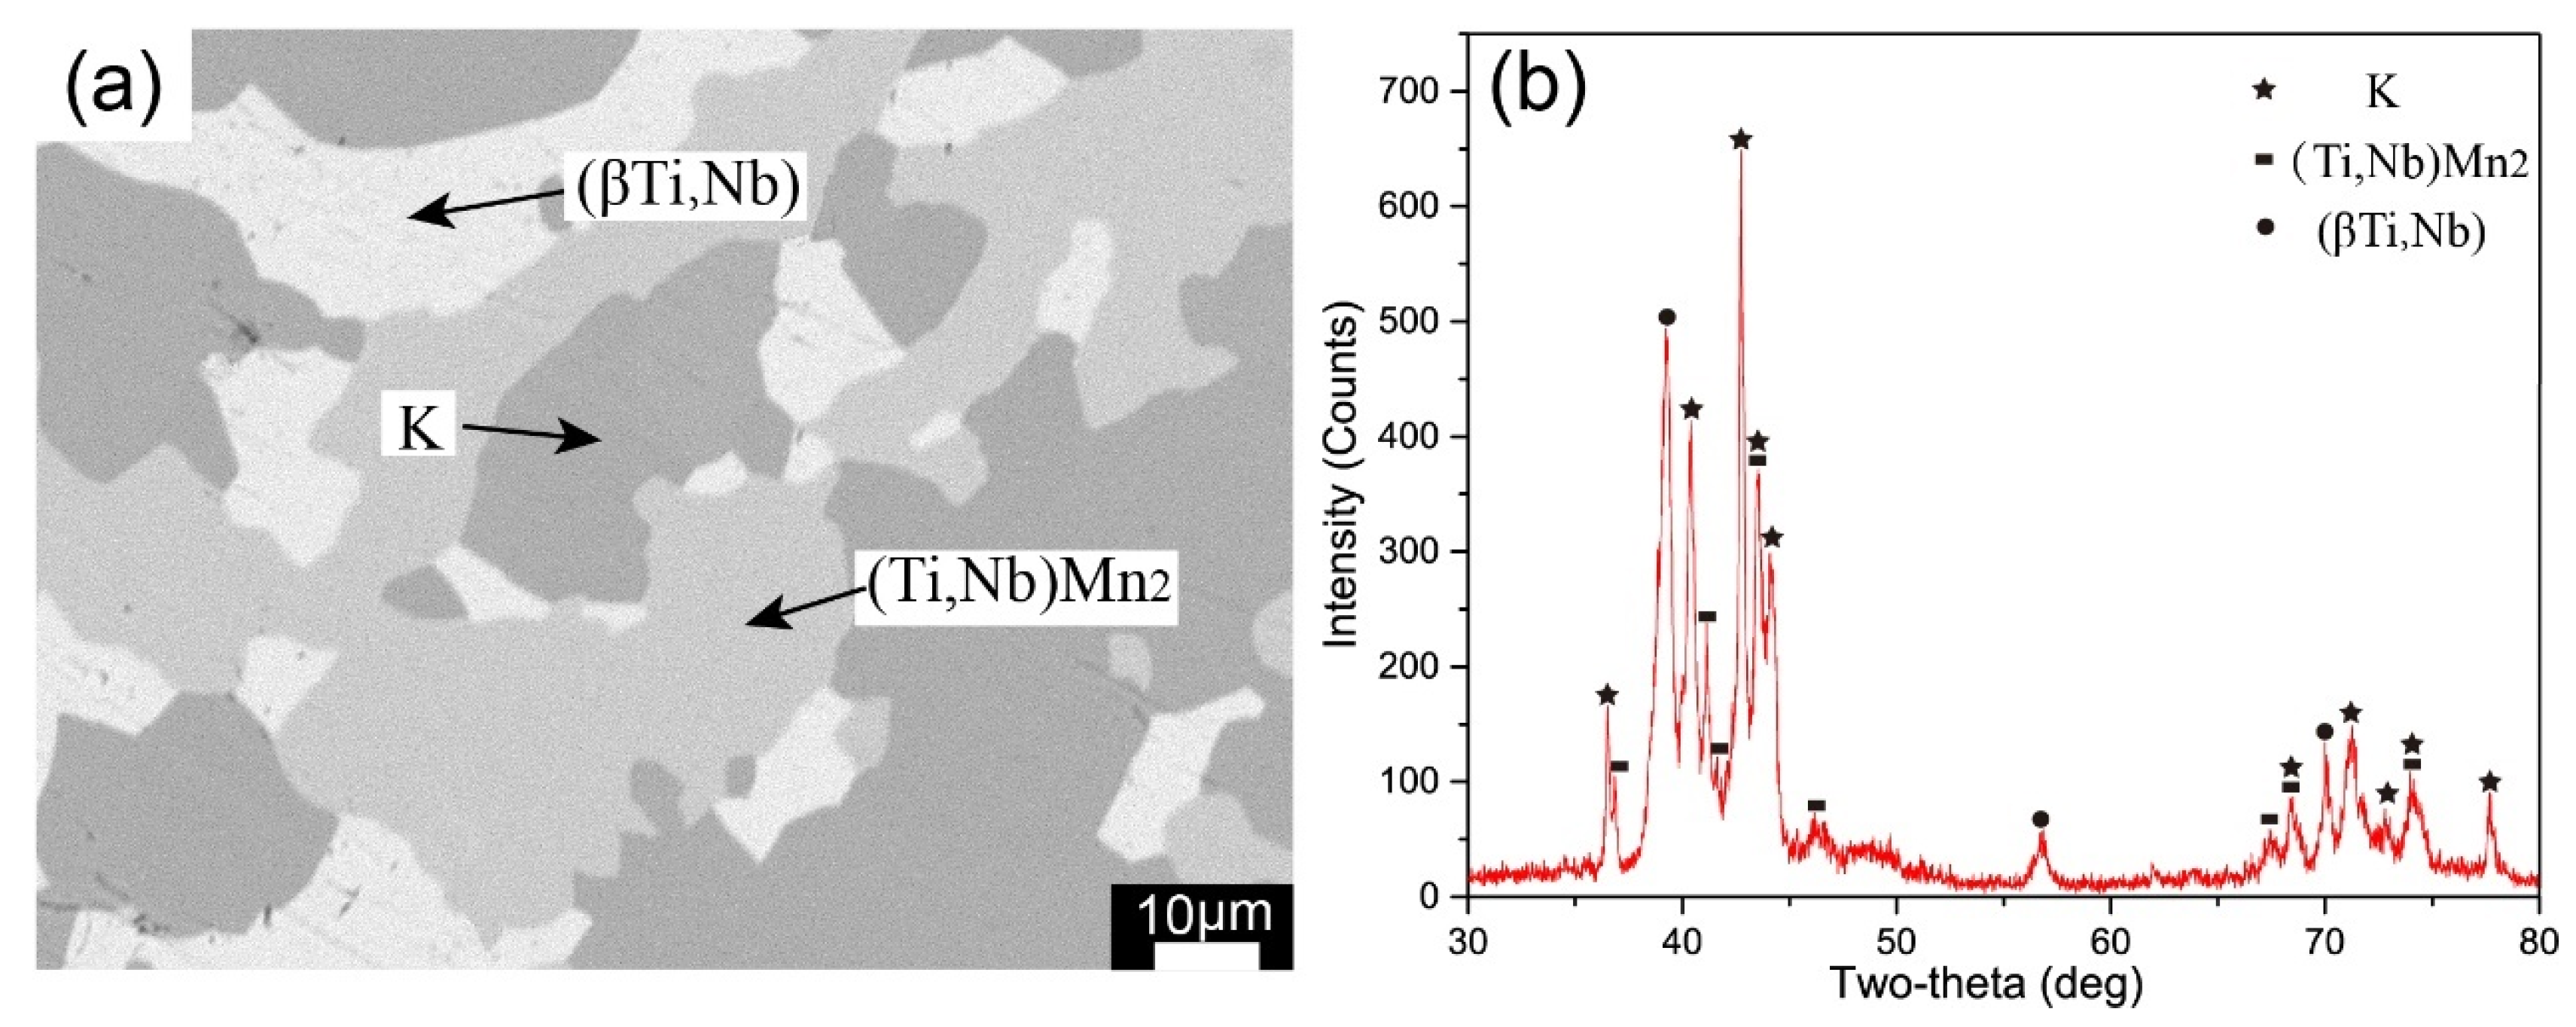
The microstructure of A7 and A10 are shown in Figure 8a and Figure 9a. Using SEM-EDS and EPMA, we found the phase composition of the A7 alloy sample is (βTi,Nb) (white base phase) and K-Ti50Nb7Mn43 phase (dark gray phase), while the A10 alloy comprises (Ti,Nb)Mn2 (light-colored base phase) and K-Ti50Nb7Mn43 phase (dark phase). According to Figure 8a and Figure 9a, the equilibrium alloys A7 and A10 are both composed by two different phases, including an unknown ternary compound whose microstructure and XRD result have never been reported. This ternary compound is referred to herein as K-Ti50Nb7Mn43 phase. Since there is no corresponding PDF card, the XRD results of the two equilibrium alloys containing the K-Ti50Nb7Mn43 phase are put together for comparative analysis, as presented in Figure 8b and Figure 9b. In Figure 8b and Figure 9b, after the characteristic peaks of the other phases were matched, the remaining diffraction peaks can be well matched with the obtained unknown ternary phase K-Ti50Nb7Mn43. Thus, the existence of K-Ti50Nb7Mn43 can be determined. The composition of this ternary phase was around Ti50Nb7Mn43 from the results of EPMA.
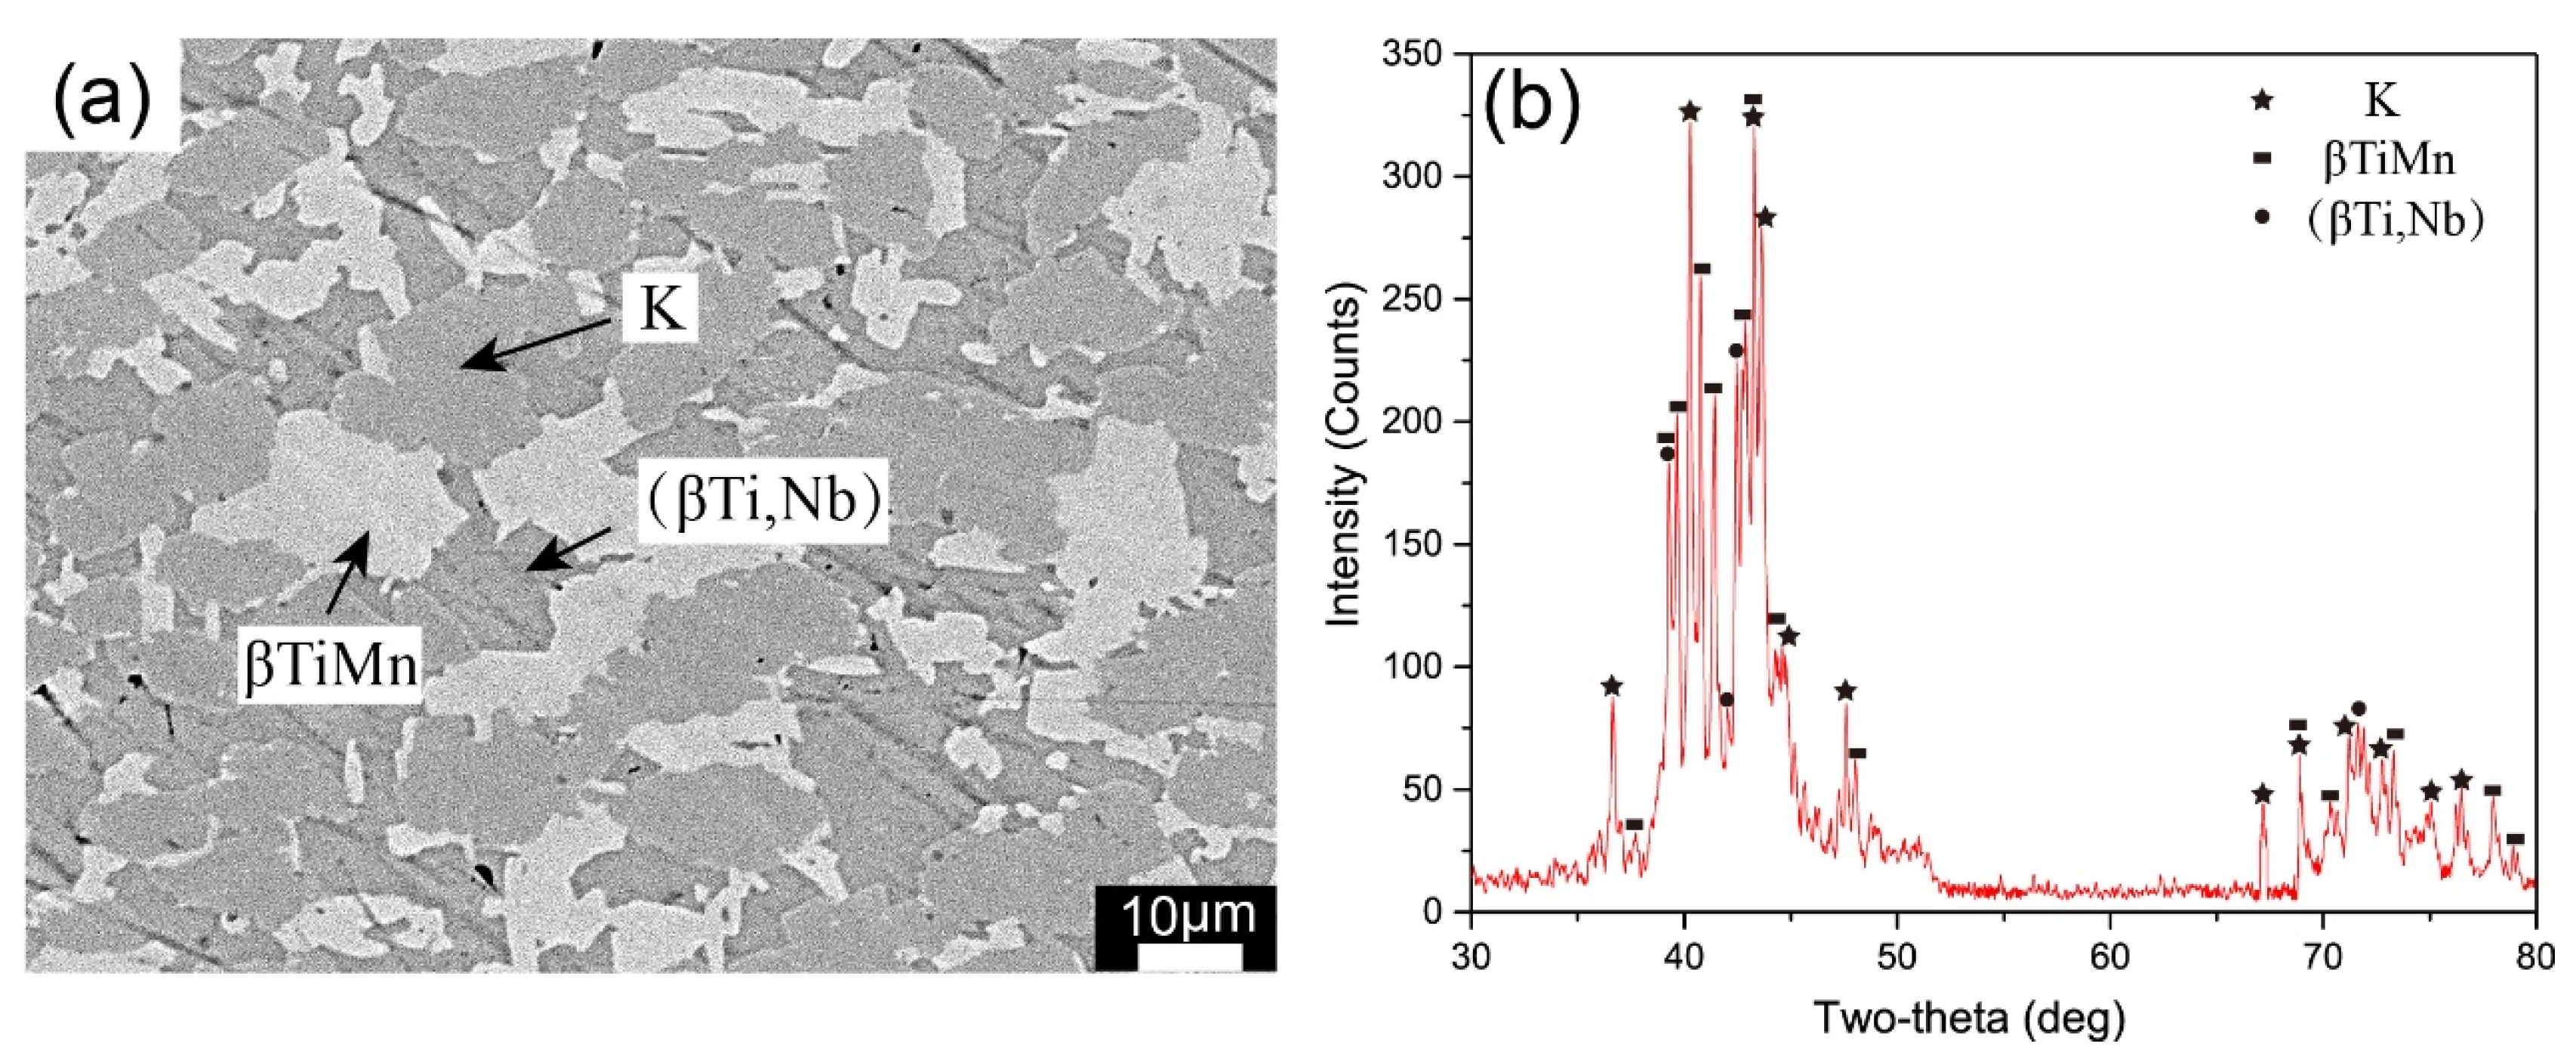
Three different phases can be observed in Figure 10a: βTiMn (white phase), K-Ti50Nb7Mn43 phase (light gray phase) and (βTi,Nb) (dark gray phase). Although the contrast between the K-Ti50Nb7Mn43 phase and (βTi,Nb) doesn’t have a significant difference, there is a boundary between these two phases and the XRD results of them are completely different. Based on this, it can be judged that the alloy A8 is located in the three-phase equilibrium field: K + βTiMn + (βTi,Nb), which is also consistent with the XRD results from Figure 10b.
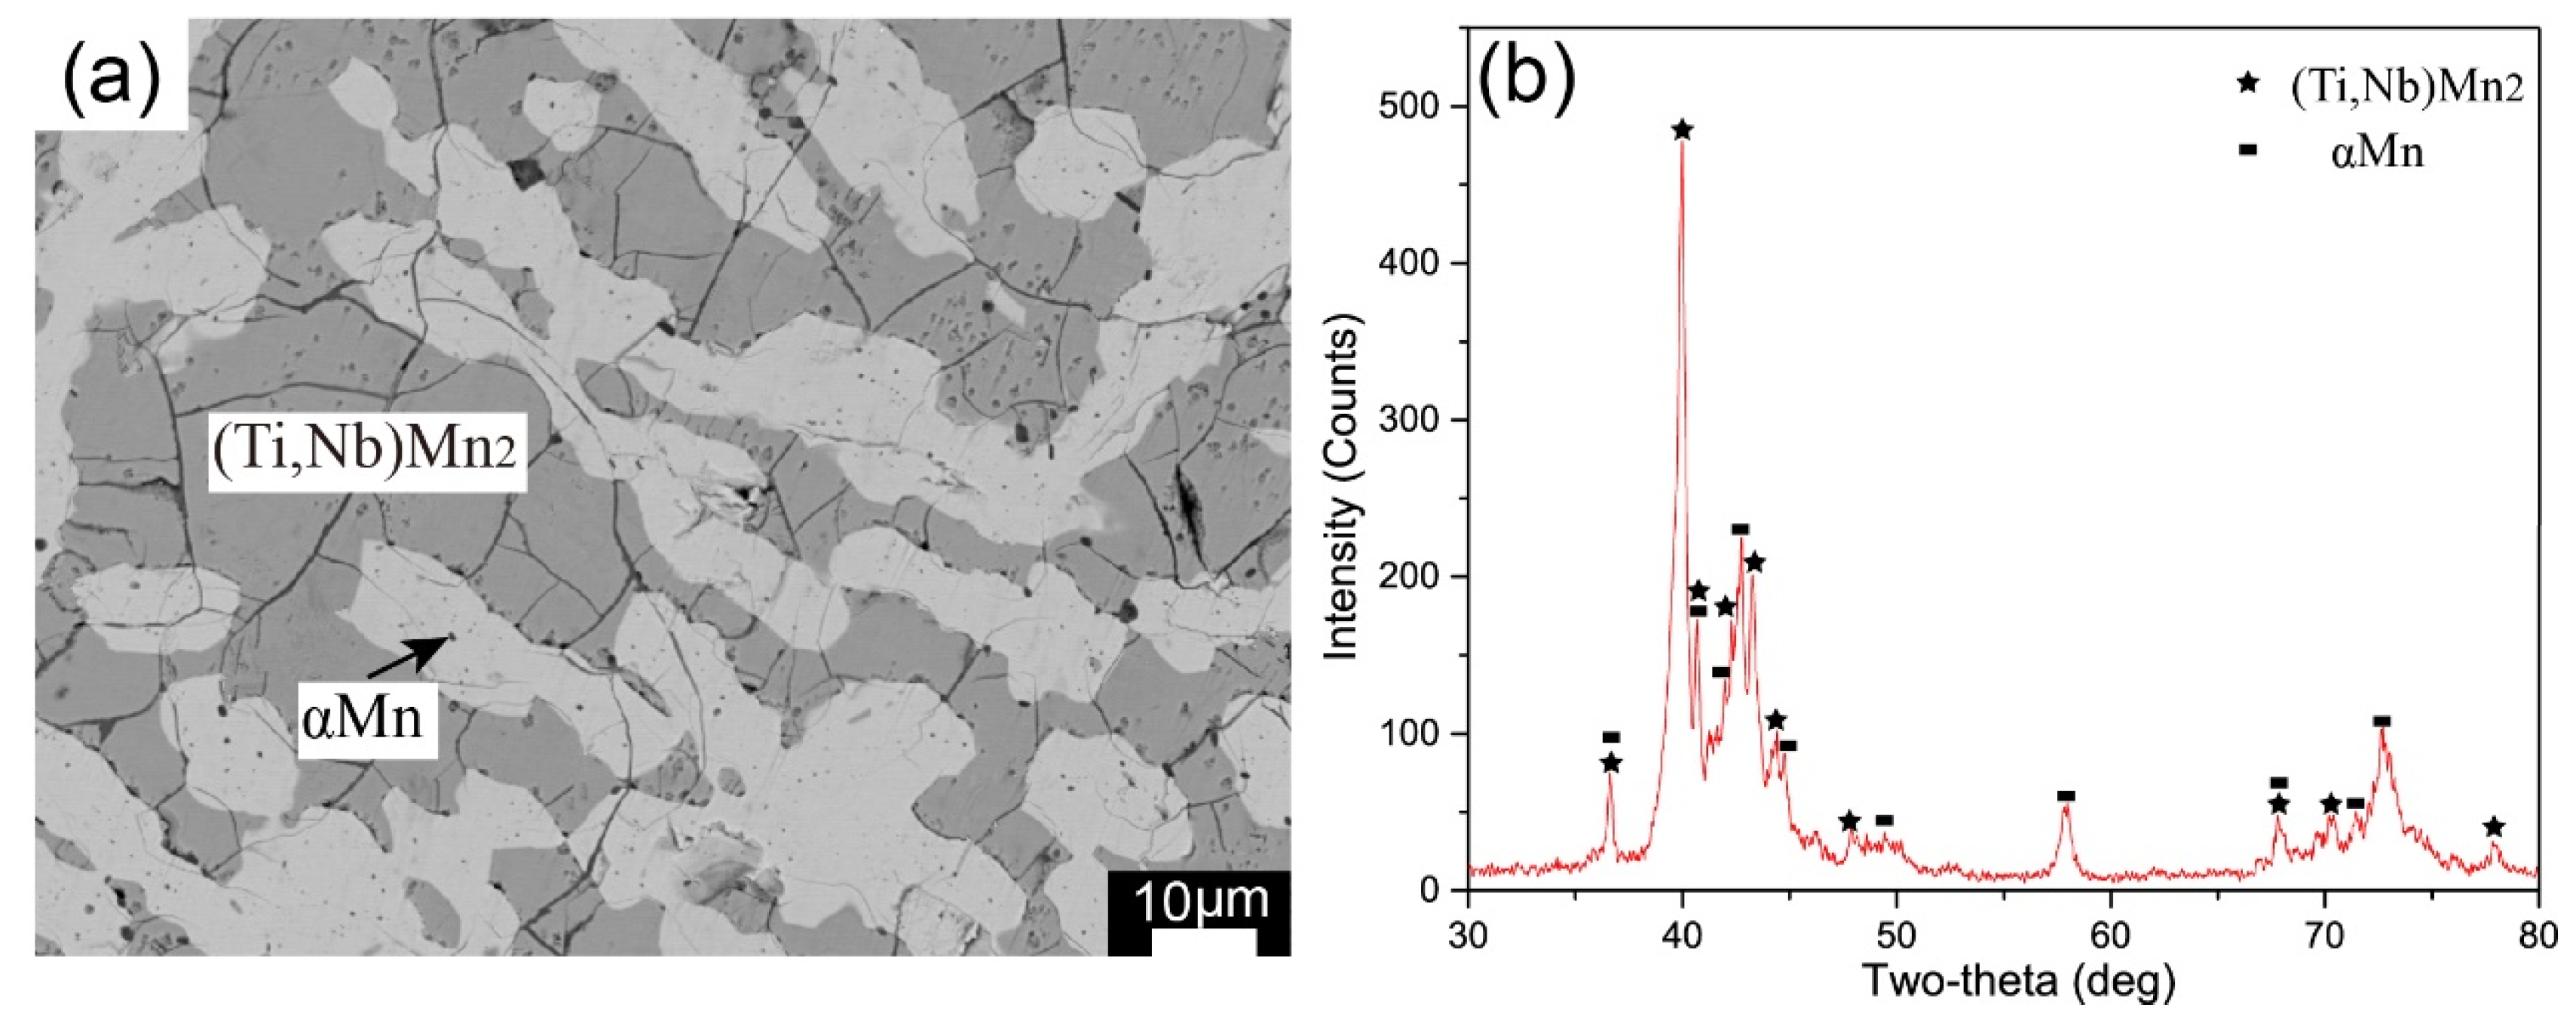
Based on the microstructure results and XRD pattern analyses of Figure 11, Figure 12 and Figure 13, it can be judged that the alloy A12, A16 and A17 are composed of two phases after reaching equilibrium at 1173K. The A12 alloy is located in the two-phase equilibrium field: βTiMn + (Ti,Nb)Mn2; The dark gray base phase in the equilibrium alloy A16 is (Ti,Nb)Mn2, and the white globular phase attached to the base phase is TiMn4; A17 contains two phases: (Ti,Nb)Mn2 (gray phase) and αMn (white dendritic phase).

4.2. Phase Equilibria at 1273K

Twenty-five alloy samples were prepared in order to determine the isothermal section and phase relationship of the Ti-Nb-Mn ternary system at 1273K for 30 days. The constituent phases of each alloy sample were listed in Table 3.
Table 3. Constituent phases and compositions in the annealed Ti-Nb-Mn alloys at 1273K for 30 days.
Alloys
No.
Nominal Composition (at %)Experimental Results (at %)Phase
Determination
TiNbMnTiNbMn
B11147428.5684.956.49(βTi,Nb)
12.629.358.1(Ti,Nb)Mn2
B222384019.273.137.67(βTi,Nb)
22.522.5754.93(Ti,Nb)Mn2
B327274623.9967.78.31(βTi,Nb)
26.7319.3153.96(Ti,Nb)Mn2
B435273840.3748.3911.24(βTi,Nb)
31.6615.6252.72(Ti,Nb)Mn2
B540154553.8629.1217.02(βTi,Nb)
36.3712.8650.77(Ti,Nb)Mn2
B647124158.1924.8316.98(βTi,Nb)
38.6911.2550.06(Ti,Nb)Mn2
51.967.440.64K
B754163058.0724.4517.48(βTi,Nb)
37.9711.4550.58(Ti,Nb)Mn2
51.887.3440.78K
B859103165.813.7820.42(βTi,Nb)
54.845.939.26K
B95644069.014.826.19(βTi,Nb)
53.134.2142.66K
46.892.2250.89βTiMn
B104285039.248.2452.52(Ti,Nb)Mn2
52.386.0141.61K
B114265239.245.3755.39(Ti,Nb)Mn2
52.375.4242.21K
B1214246251.915.4242.67(Ti,Nb)Mn2
B1320156520.0514.7865.17(Ti,Nb)Mn2
B142786526.78.1165.19(Ti,Nb)Mn2
B153485835.128.3756.51(Ti,Nb)Mn2
B162347324.284.5671.16(Ti,Nb)Mn2
22.712.5474.75TiMn3
B172057519.658.6671.69(Ti,Nb)Mn2
21.383.7474.88TiMn3
B182227622.451.6575.9TiMn3
B192017921.731.1277.15TiMn3
18.330.9580.72TiMn4
B201528317.631.2481.13TiMn4
B211218711.730.3287.95αMn
14.440.5185.05TiMn4
B221010808.012.4589.54αMn
12.5815.6271.8(Ti,Nb)Mn2
B2357884.293.9891.73αMn
7.4220.4672.12(Ti,Nb)Mn2
B24112870.241.7997.97βMn
1.2725.6773.06(Ti,Nb)Mn2
B2542944.232.9392.84αMn
3.941.5694.5βMn
According to the microstructure results in Figure 14a and Figure 15a, the alloy B6 consists of three phases: (βTi,Nb) (white base phase), (Ti,Nb)Mn2 (light gray phase) and the K phase (dark gray phase); the alloy B9 is composed of βTiMn (white phase), the K-Ti50Nb7Mn43 phase (gray striped phase) and (βTi,Nb) (black phase). In Figure 14b and Figure 15b, after the characteristic peaks of the other two phases were matched, the remaining diffraction peaks can be well matched with the previously obtained unknown ternary phase K-Ti50Nb7Mn43. Thus, the existence of K-Ti50Nb7Mn43 can be determined.
As shown in Figure 16a, there are two distinct phases in the alloy B1. Based on the XRD pattern analysis in Figure 16b, the alloy should be located in the two-phase field: (Ti,Nb)Mn2 + (βTi,Nb). Figure 17a,b are BSE images of alloys B2 and B4 also located in the two-phase field. It can be clearly observed that the phase (Ti,Nb)Mn2 continues to grow with increasing Ti content.
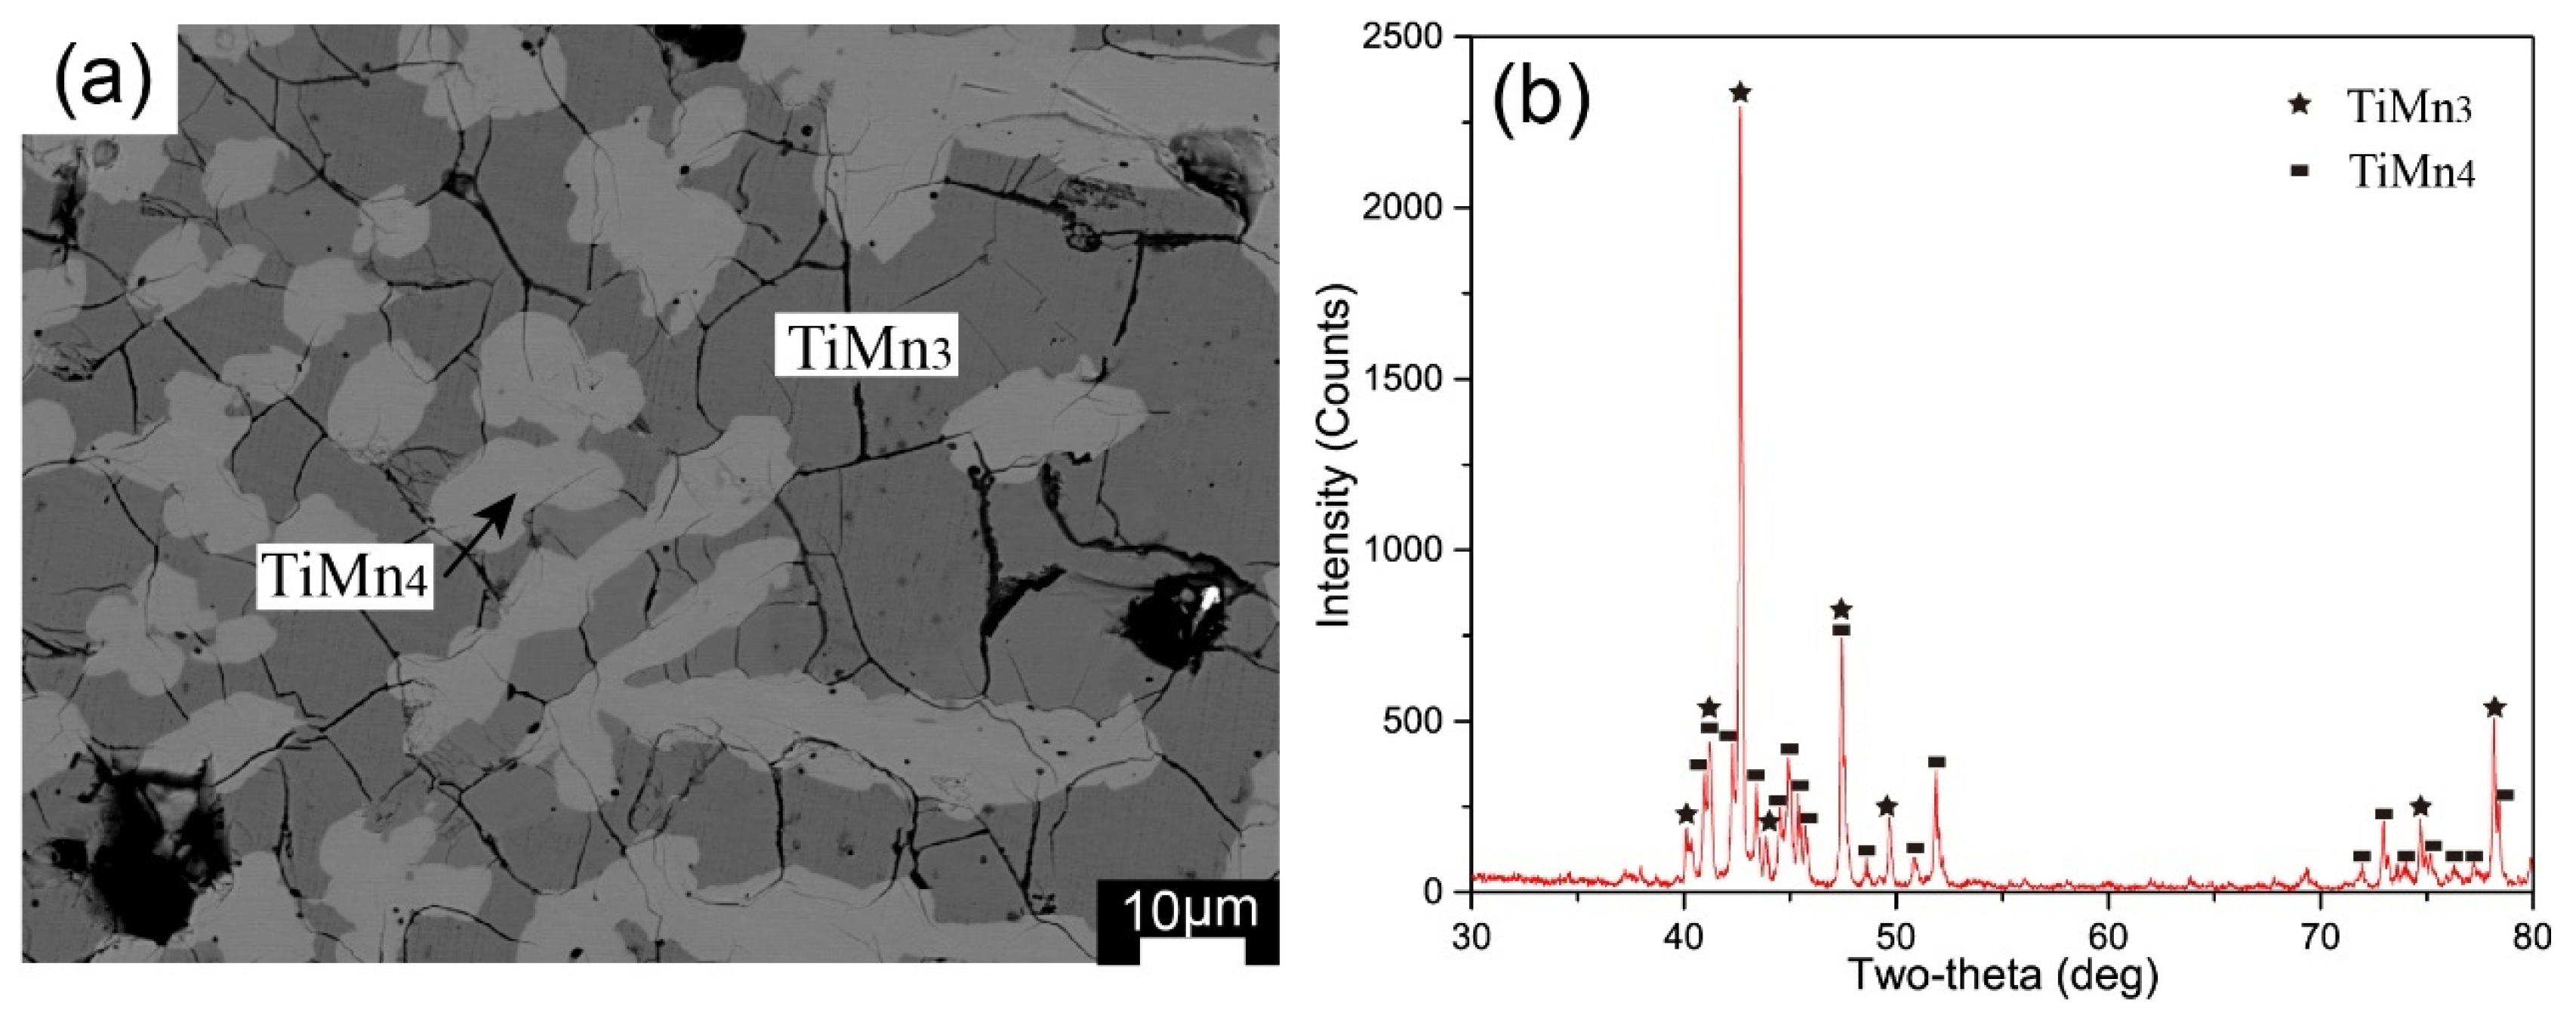
Figure 18, Figure 19, Figure 20, Figure 21 and Figure 22 respectively show the EPMA micrographs and XRD results of alloy B8, B10, B16, B19 and B25, which featured 5 two-phase equilibriums: K + (βTi,Nb), K + (Ti,Nb)Mn2, TiMn3 + TiMn2, TiMn3 + TiMn4 and αMn + βMn.
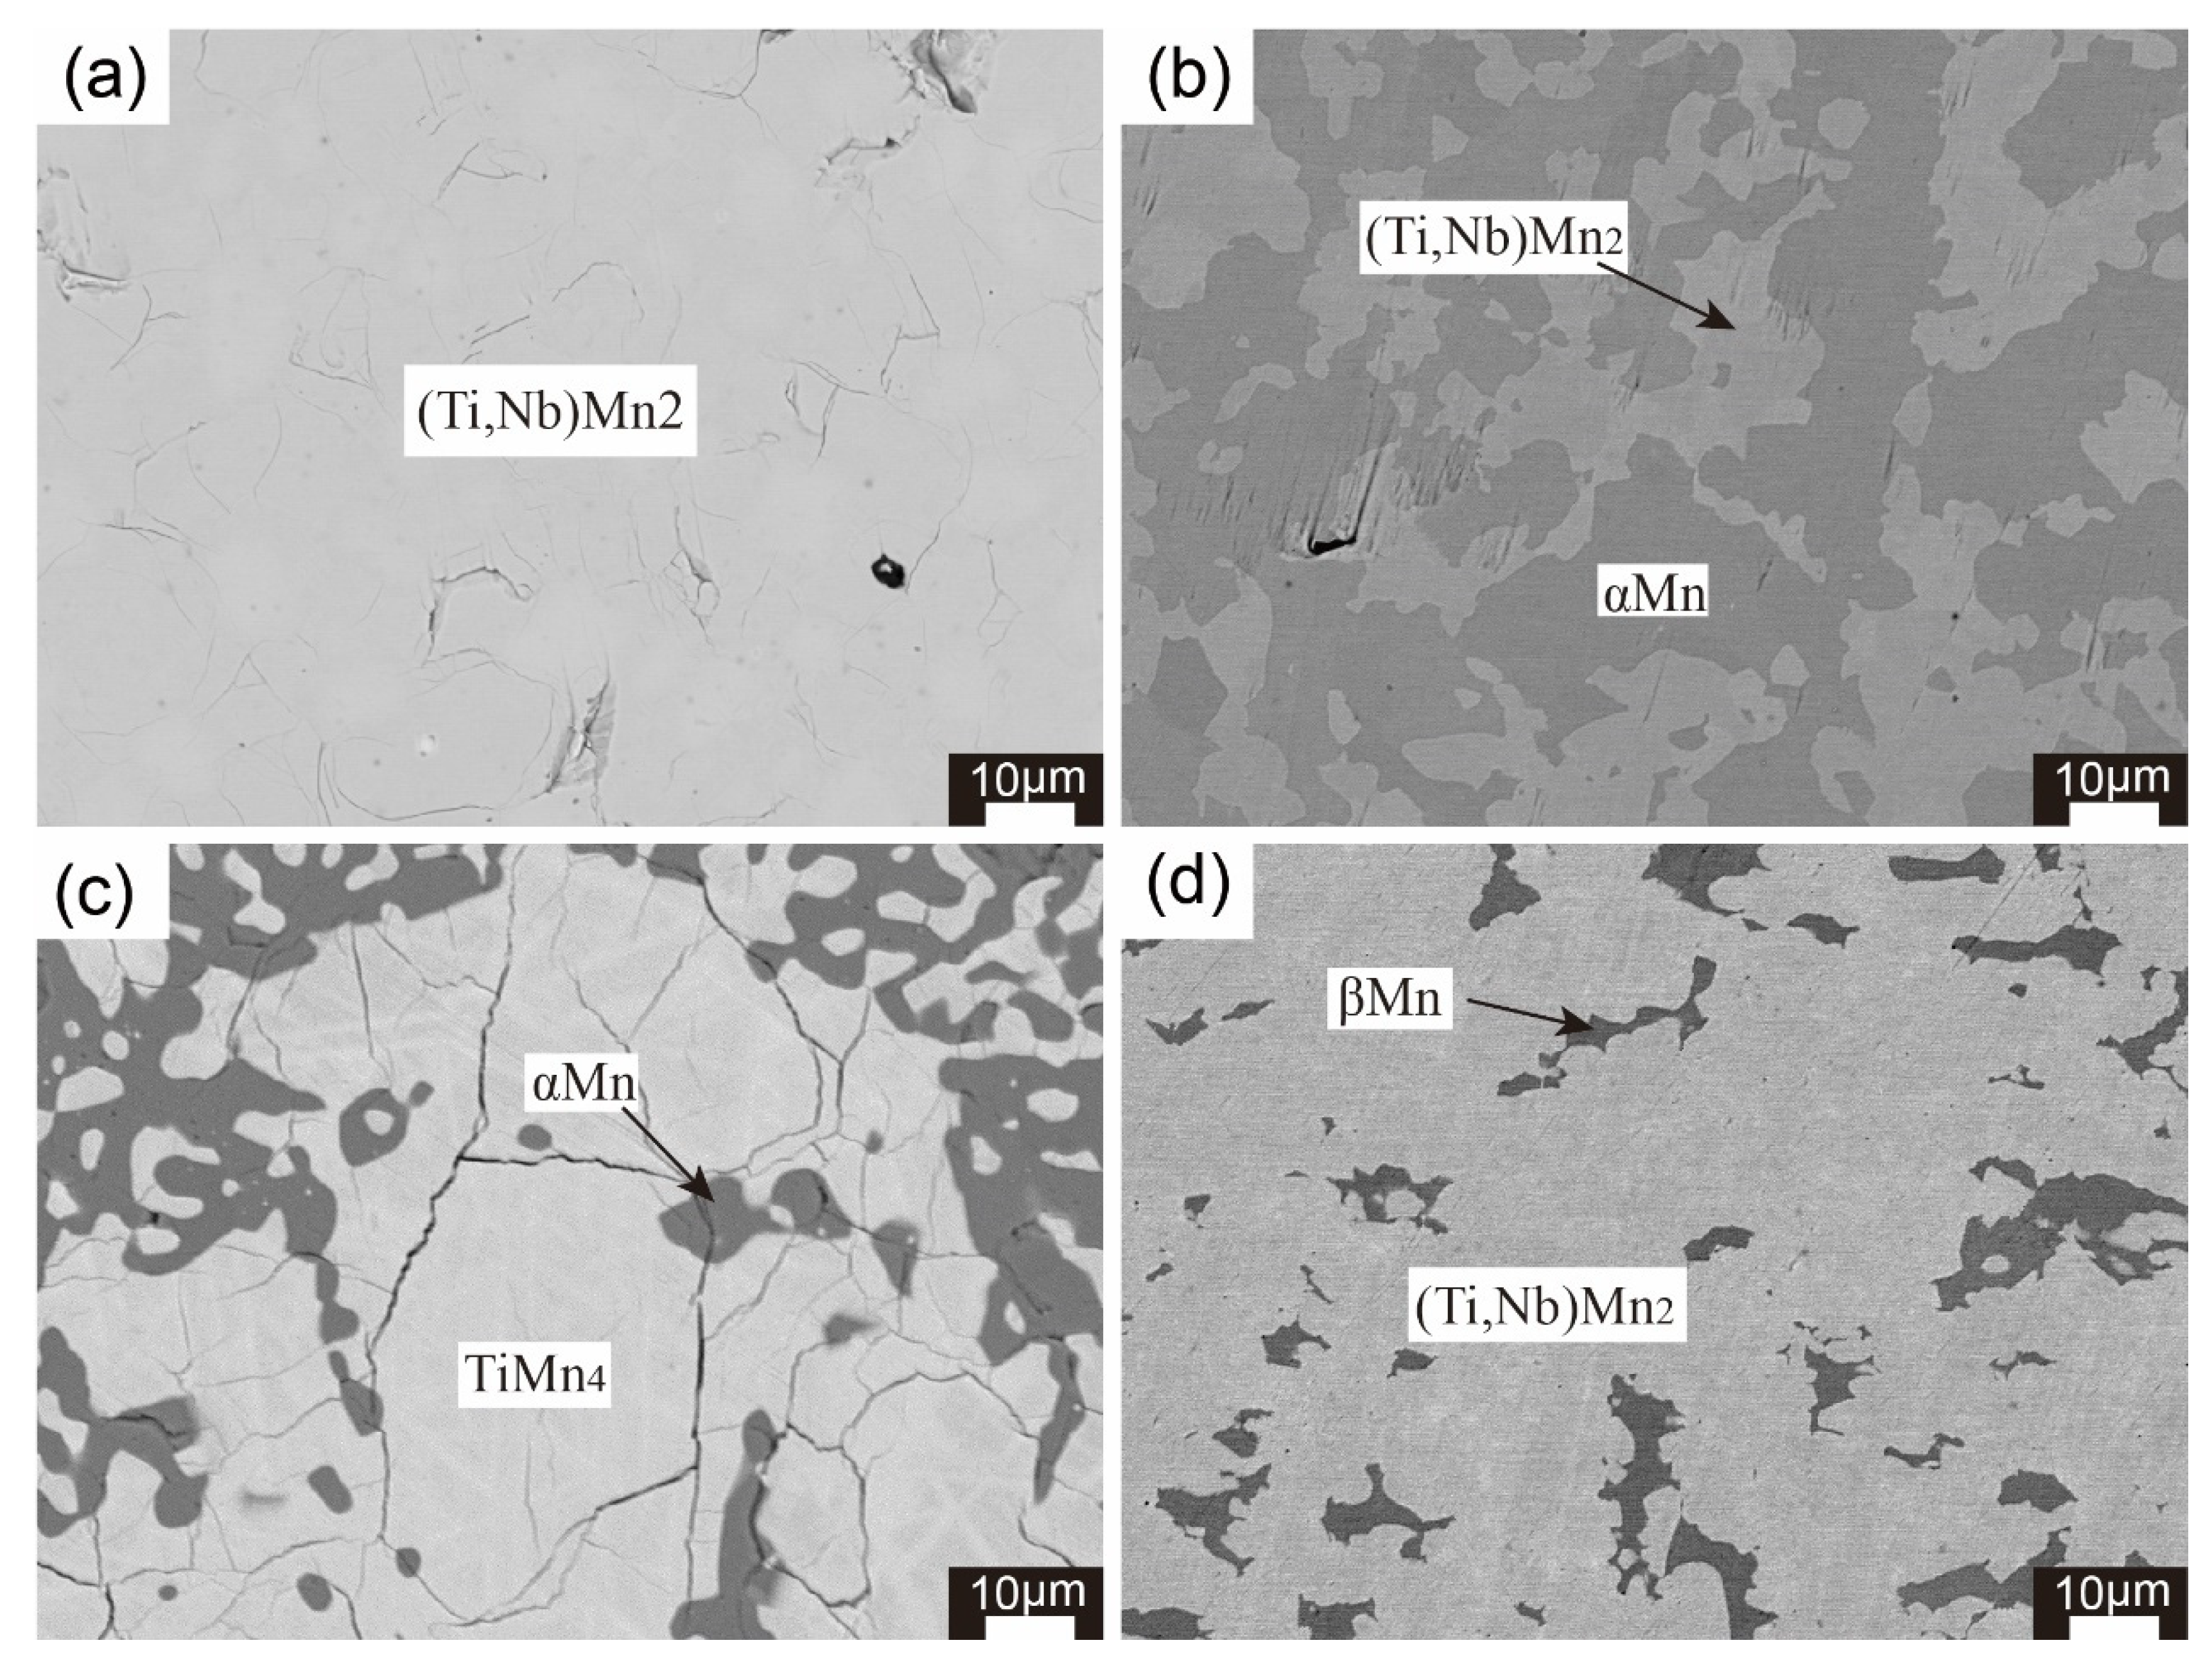
It can be observed in Figure 23 that the alloy B21, B22 and B24 are respectively in 3 two-phase equilibrium fields: TiMn4 + αMn, (Ti,Nb)Mn2 + αMn and (Ti,Nb)Mn2 + βMn; the alloy B14 is in the solid solution field: (Ti,Nb)Mn2.

4.3. Phase Equilibria at 1373K

12 alloy samples were prepared in order to determine the isothermal section and phase relationship of the Ti-Nb-Mn ternary system at 1373K for 20 days. The constituent phases of each alloy sample were listed in Table 4.
Table 4. Constituent phases and compositions in the annealed Ti-Nb-Mn alloys at 1373 K for 20 days.
Alloys
No.
Nominal Composition (at %)Experimental Results (at %)Phase
Determination
TiNbMnTiNbMn
C1643515.6386.537.84(βTi,Nb)
6.6133.1960.2(Ti,Nb)Mn2
C220384224.9863.9911.03(βTi,Nb)
18.0525.0756.88(Ti,Nb)Mn2
C327334032.7554.512.75(βTi,Nb)
23.6421.2255.14(Ti,Nb)Mn2
C436283642.9941.7315.28(βTi,Nb)
30.3117.0752.62(Ti,Nb)Mn2
C540184247.579.5442.89K
49.8433.0217.14(βTi,Nb)
32.9814.0752.95(Ti,Nb)Mn2
C654133349.789.1941.03K
58.9417.3523.71(βTi,Nb)
C75354246.142.351.56βTiMn
64.345.7629.9(βTi,Nb)
49.676.7543.58K
C84494736.228.155.68(Ti,Nb)Mn2
47.587.6444.78K
C94085236.2310.3453.43(Ti,Nb)Mn2
47.358.843.85K
C1013236413.323.3163.39(Ti,Nb)Mn2
C1122136521.1213.6465.24(Ti,Nb)Mn2
C123076328.726.9764.31(Ti,Nb)Mn2
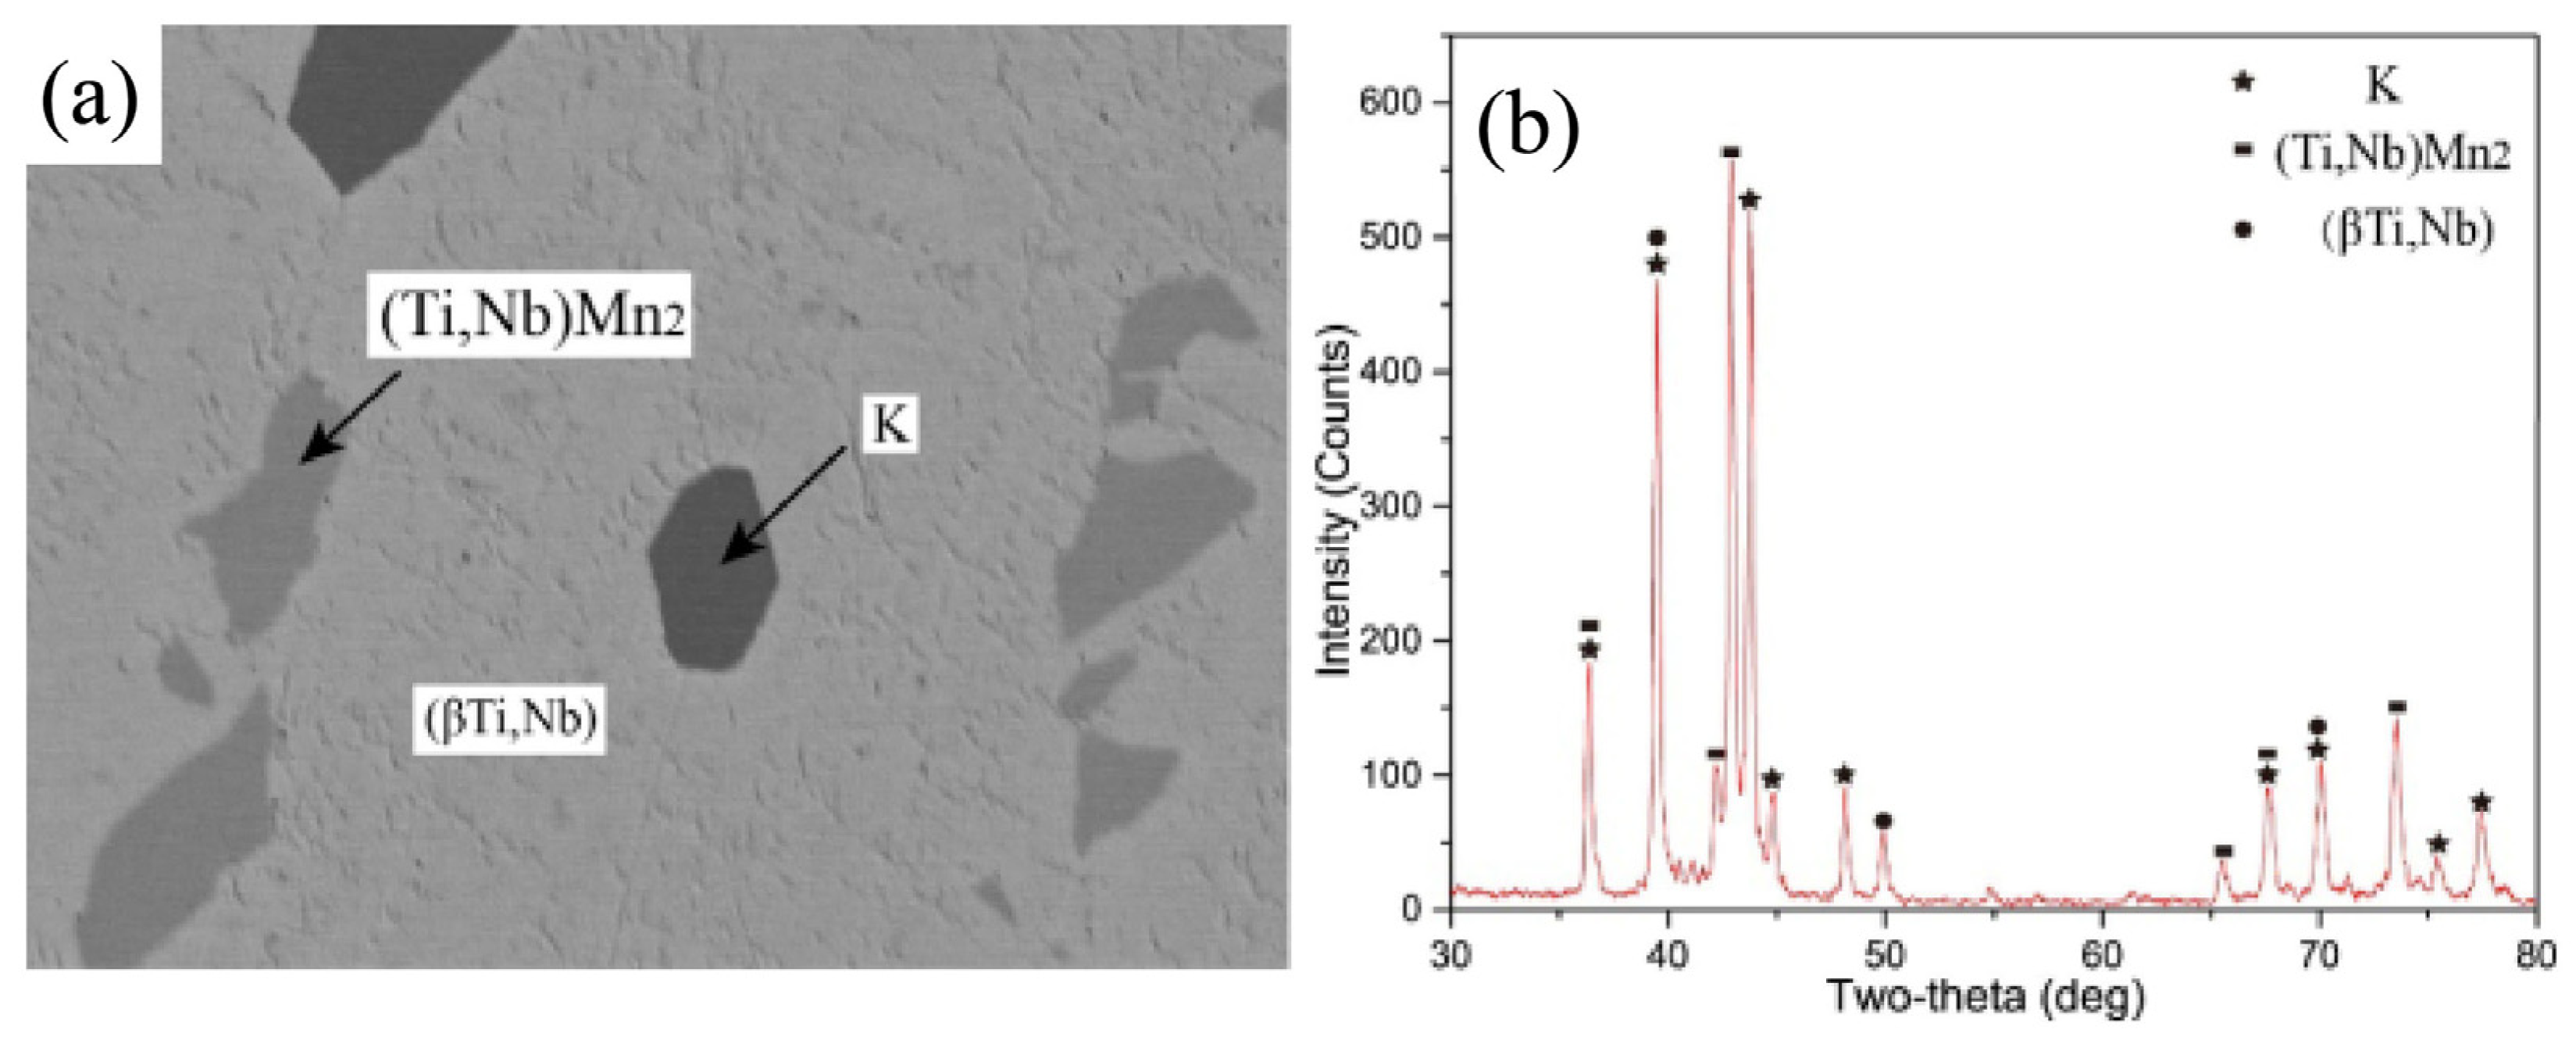
The microstructure of the equilibrium alloy C5 after annealing is shown in Figure 24a. Based on the EPMA result, (βTi,Nb) (white base phase), (Ti,Nb)Mn2 (light gray phase) and the K-Ti50Nb7Mn43 phase (dark gray phase) with the unknown crystal structure can be determined. In Figure 24b, After calibration of (βTi,Nb) and (Ti,Nb)Mn2 by the existing PDF card, the remaining characteristic peaks can correspond with the peaks of the previous K-Ti50Nb7Mn43 phase. It is determined the alloy C5 is located in the three-phase field: (βTi,Nb) + (Ti,Nb)Mn2 + K. And Figure 25a shows the three-phase microstructure of K + (βTi,Nb) + βTiMn for the equilibrium alloy C7 after anneal at 1373K.
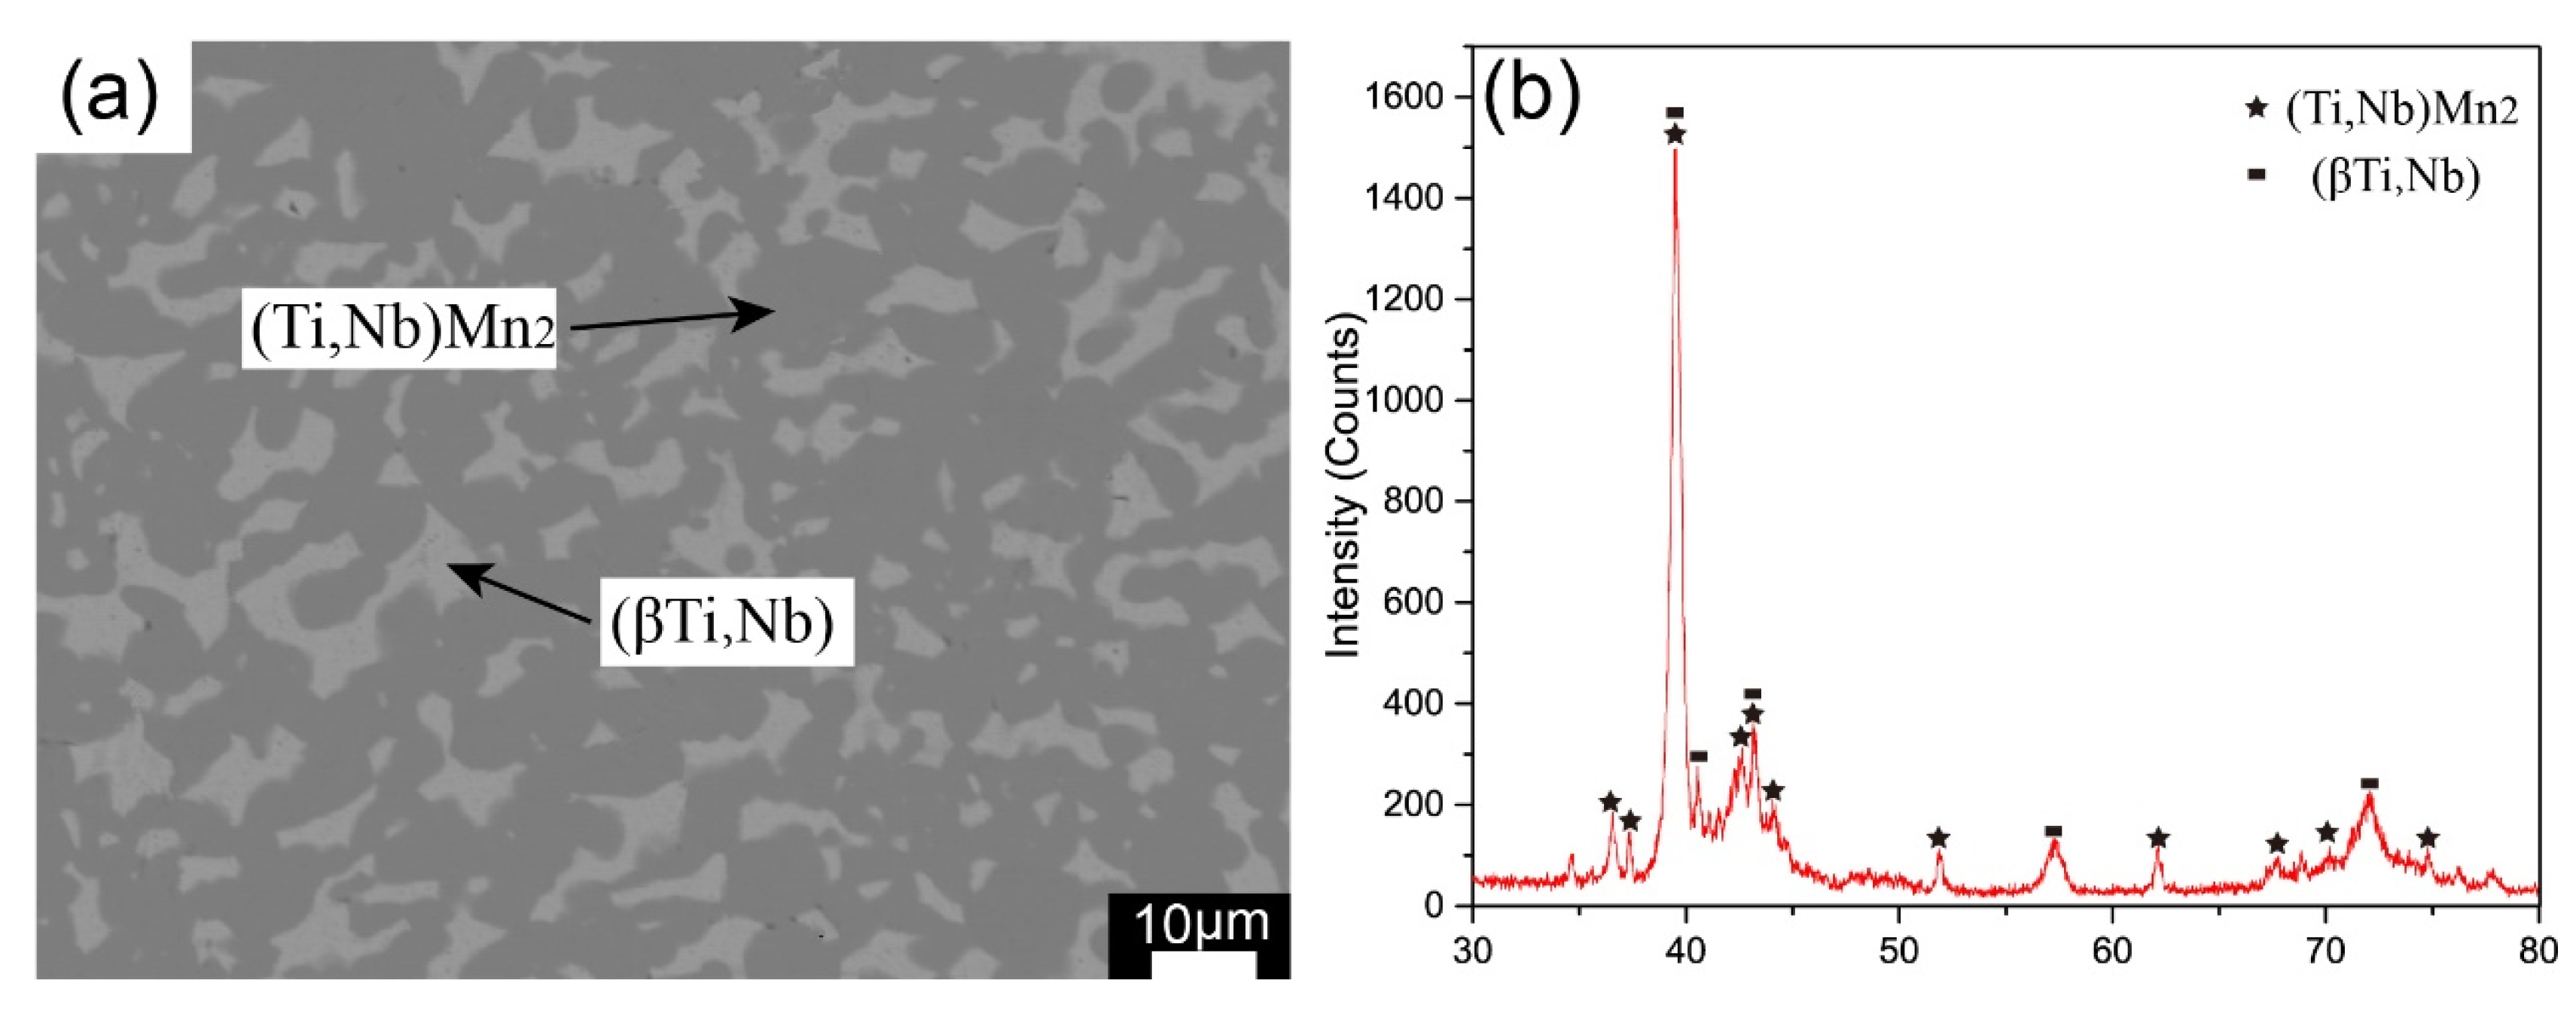
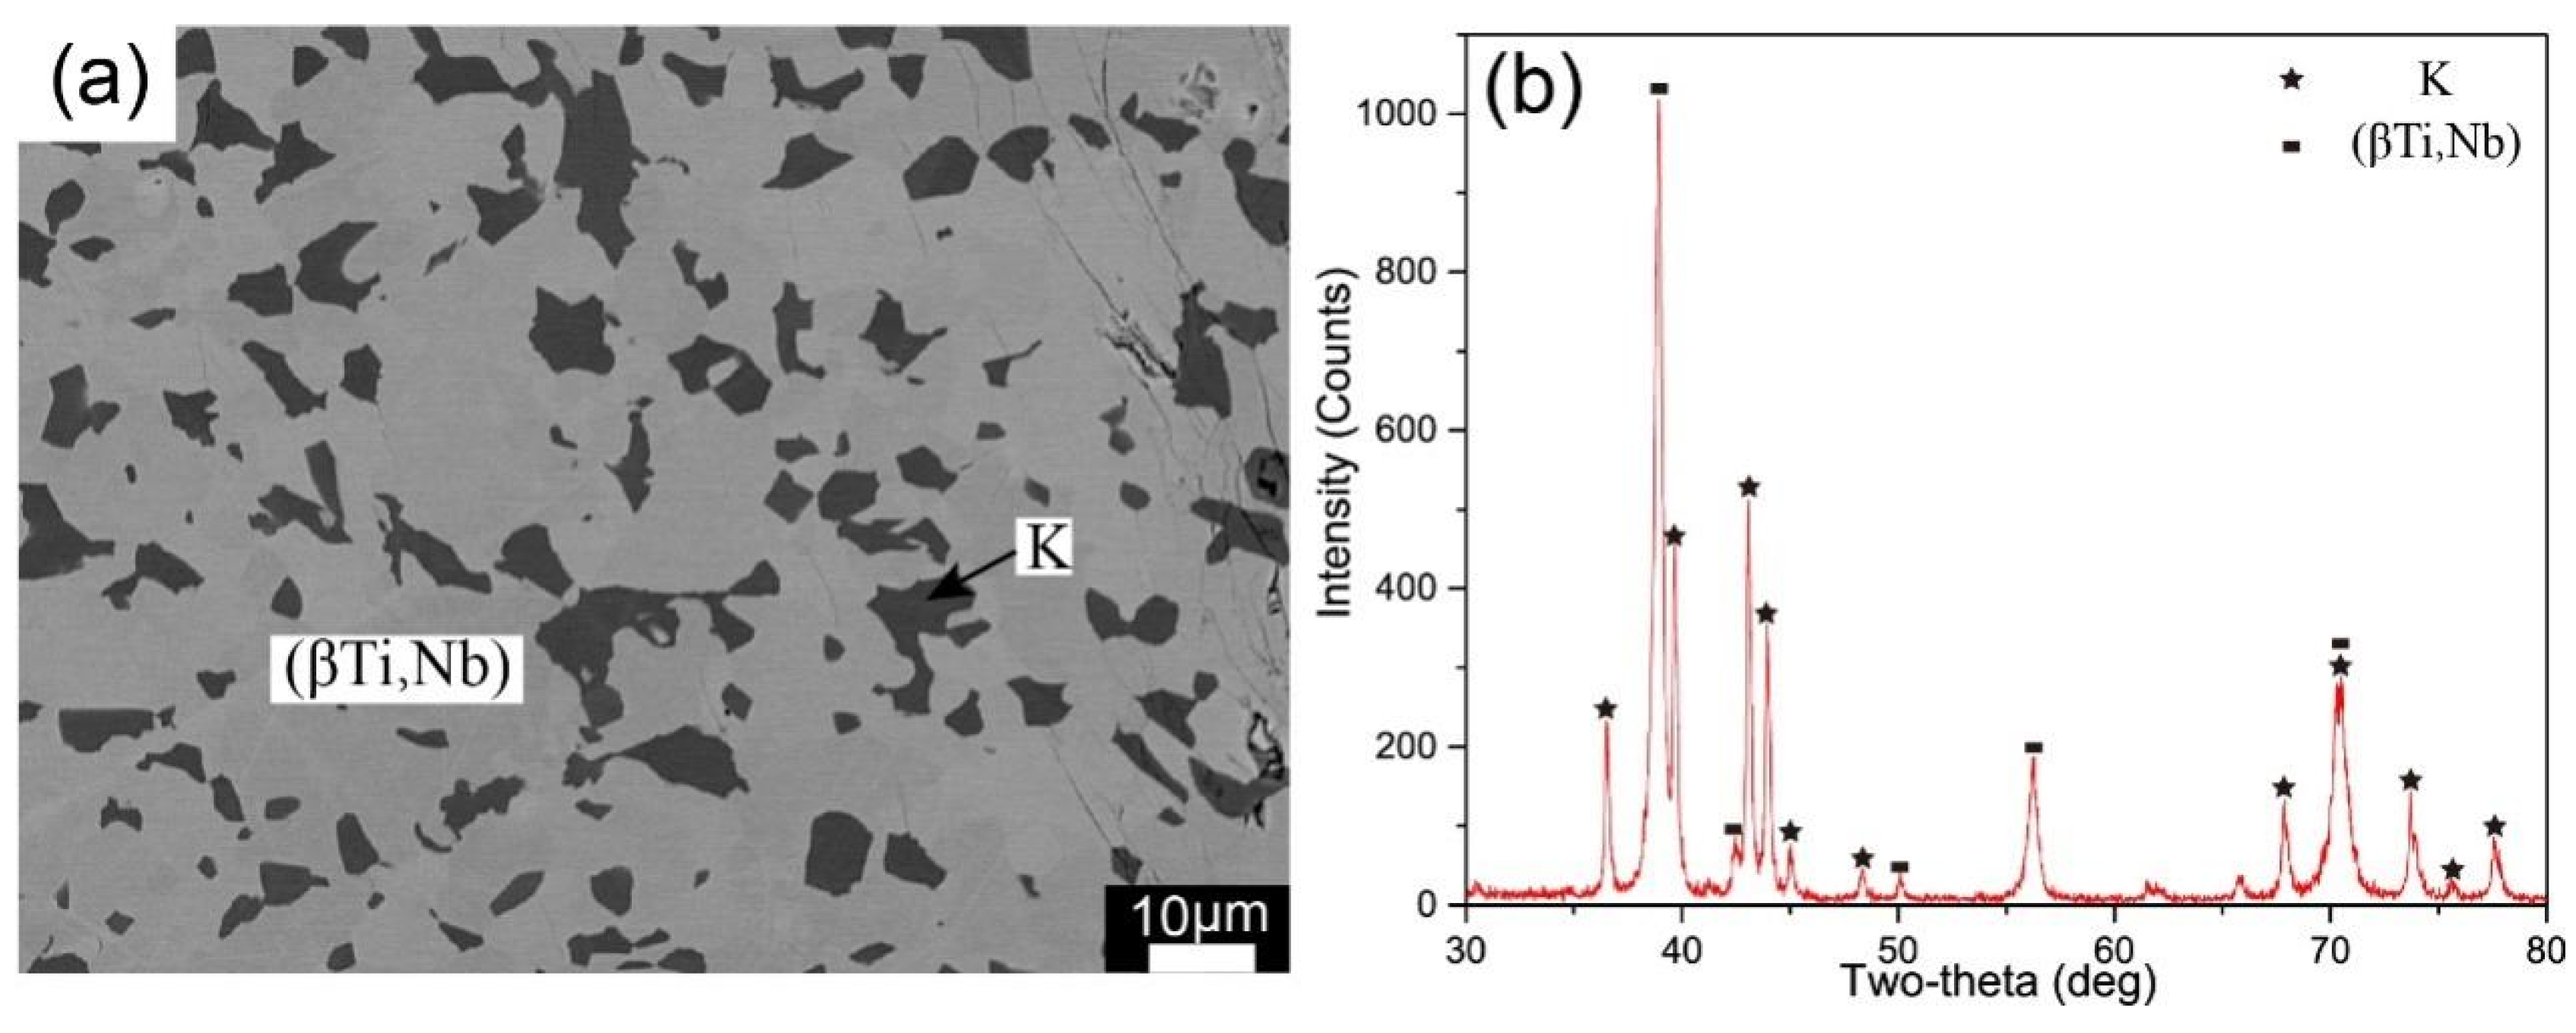
Figure 26a shows the microstructure of the equilibrium alloy C3 annealed at 1100 °C for 40 days, which contains (βTi,Nb) (white base phase) and (Ti,Nb)Mn2 (gray phase) based on the EPMA result. Figure 27a shows the two-phase K + (βTi,Nb) microstructure for the equilibrium alloy C6 that agrees with the XRD result presented in Figure 27b.

5. Conclusions

The isothermal section of Ti-Nb-Mn system at 1173K, 1273K and 1373K were determined by equilibrium alloy method combined with EPMA-WDS and XRD. The results are summarized as follows: (1) A new ternary compound K-Ti50Nb7Mn43 phase was detected at 1173K, 1273K and 1373K. And a continuous solid solution phase (Ti,Nb)Mn2 was found at these temperatures in this ternary system. (2) Three three-phase equilibrium fields and ten two-phase equilibrium fields were detected in the isothermal section at 1173K, the experimentally determined maximum solid solubility of Nb in αTiMn and βTiMn were 1.71 at % and 3.91 at %, respectively; the maximum solid solubility of Nb in TiMn4 was 9.31 at %. (3) Two three-phase equilibrium fields and eight two-phase equilibrium fields were detected in the isothermal section at 1273K. The maximum solid solubility of Nb in βTiMn was 3.07 at % and in TiMn3 was 4.50 at %; (4) For the isothermal section of 1373K, the maximum solid solubility of Nb in βTiMn was measured to be 5. 68 at %.

Author Contributions

Conceptualization, L.Z. (Ligang Zhang) and C.L.; Methodology, H.G.; Software, L.Z. (Linghong Zheng); Validation, J.Y.; Formal analysis, C.L. and L.Y.; Investigation, C.L. and H.G.; Resources, J.Y. and L.Y.; Data curation, L.Y.; Writing—original draft preparation, C.L.; Writing—review and editing, C.L.; Visualization, L.L.; Supervision, L.Z. (Ligang Zhang); Project administration, L.Z. (Ligang Zhang); Funding acquisition, L.Z. (Ligang Zhang) All authors have read and agreed to the published version of the manuscript.

Funding

The work was financially supported by National MCF Energy R&D Program of China (No. 2018YFE0306100), National Natural Science Foundation of China (No. 51871248), and Natural Science Foundation of Hunan Province, China (No. 2020JJ4739).

Data Availability Statement

Not applicable.

Conflicts of Interest

The authors declare no conflict of interest.

References

  1. Baltatu, M.S.; Spataru, M.C.; Verestiuc, L.; Balan, V.; Solcan, C.; Sandu, A.V.; Geanta, V.; Voiculescu, I.; Vizureanu, P. Design, Synthesis, and Preliminary Evaluation for Ti-Mo-Zr-Ta-Si Alloys for Potential Implant Applications. Materials 2019, 14, 6806. [Google Scholar] [CrossRef]
  2. Rossi, S.; Volgare, L.; Perrin-Pellegrino, C.; Chassigneux, C.; Dousset, E.; Eyraud, M. Dual Electrochemical Treatments to Improve Properties of Ti6Al4V Alloy. Materials 2020, 13, 2479. [Google Scholar] [CrossRef] [PubMed]
  3. Zhang, L.G.; Tang, J.L.; Wang, Z.Y.; Zhou, J.Y.; Wu, D.; Liu, L.B.; Masset, P.J. Pseudo-spinodal mechanism approach to designing a near-β high-strength titanium alloy through high-throughput technique. Rare Met. 2020, 40, 2099–2108. [Google Scholar] [CrossRef]
  4. Kim, K.M.; Kim, H.Y.; Miyazaki, S. Effect of Zr Content on Phase Stability, Deformation Behavior, and Young’s Modulus in Ti–Nb–Zr Alloys. Materials 2020, 13, 476. [Google Scholar] [CrossRef] [PubMed] [Green Version]
  5. Fernandes Santos, P.; Niinomi, M.; Liu, H.; Cho, K.; Nakai, M.; Trenggono, A.; Champagne, S.; Hermawan, H.; Narushima, T. Improvement of microstructure, mechanical and corrosion properties of biomedical Ti-Mn alloys by Mo addition. Mater. Des. 2016, 110, 414–424. [Google Scholar] [CrossRef]
  6. Arciniegas, M.; Manero, J.M.; Espinar, E.; Llamas, J.M.; Barrera, J.M.; Gil, F.J. New Ni-free superelastic alloy for orthodontic applications. Mater. Sci. Eng. C 2013, 33, 3325–3328. [Google Scholar] [CrossRef]
  7. Ibrahim, M.K.; Saud, S.N.; Hamzah, E.; Nazim, E.M. Role of Ag addition on microstructure, mechanical properties, corrosion behavior and biocompatibility of porous Ti-30 at% Ta shape memory alloys. J. Cent. South Univ. 2020, 27, 3175–3187. [Google Scholar] [CrossRef]
  8. Frutos, E.; Karlík, M.; Jiménez, J.A.; Langhansová, H.; Lieskovská, J.; Polcar, T. Development of new β/α″-Ti-Nb-Zr biocompatible coating with low Young’s modulus and high toughness for medical applications. Mater. Des. 2018, 142, 44–55. [Google Scholar] [CrossRef] [Green Version]
  9. Rachinger, W. A “super-elastic” single crystal calibration bar. Br. J. Appl. Phys. 1958, 9, 250. [Google Scholar] [CrossRef]
  10. Liu, S.; Liu, J.; Wang, L.; Ma, R.L.; Zhong, Y.; Lu, W.; Zhang, L.C. Superelastic behavior of in-situ eutectic-reaction manufactured high strength 3D porous NiTi-Nb scaffold. Scr. Mater. 2020, 181, 121–126. [Google Scholar] [CrossRef]
  11. Ramezannejad, A.; Xu, W.; Xiao, W.; Fox, K.; Liang, D.; Qian, M. New insights into nickel-free superelastic titanium alloys for biomedical applications. Curr. Opin. Solid State Mater. Sci. 2019, 23, 100783. [Google Scholar] [CrossRef]
  12. Alshammari, Y.; Yang, F.; Bolzoni, L. Mechanical properties and microstructure of Ti-Mn alloys produced via powder metallurgy for biomedical applications. J. Mech. Behav. Biomed. Mater. 2019, 91, 391–397. [Google Scholar] [CrossRef] [PubMed]
  13. Li, C.; Song, Q.; Yang, X.; Wei, Y.; Hu, Q.; Liu, L.; Zhang, L. Experimental Investigation of the Phase Relations in the Fe-Zr-Y Ternary System. Materials 2022, 15, 593. [Google Scholar] [CrossRef] [PubMed]
  14. Manzo-Garrido, H.; Häberle, P.; Henao, H. Experimental determination of phase equilibrium in Ti-Nb-Mn system at temperatures between 1150 °C and 1200 °C. DYNA 2019, 86, 304–311. [Google Scholar]
  15. Li, C.H.; Wang, K.; Dong, H.Q.; Lu, X.G.; Ding, W.Z. Thermodynamic modeling of Ti–Cr–Mn ternary system. Calphad 2009, 33, 658–663. [Google Scholar]
  16. Murray, J.L. The Mn–Ti (Manganese-Titanium) system. Bull. Alloys Phase Diagr. 1981, 2, 334–343. [Google Scholar] [CrossRef]
  17. Khan, A.U.; Brož, P.; Premović, M.; Pavlů, J.; Vřeštál, J.; Yan, X.; Rogl, P. The Ti–Mn system revisited: Experimental investigation and thermodynamic modelling. Phys. Chem. Chem. Phys. 2016, 18, 23326–23339. [Google Scholar] [CrossRef]
  18. Liu, S.; Hallstedt, B.; Music, D. Ab initio calculations and thermodynamic modeling for the Fe–Mn–Nb system. Calphad 2012, 38, 43–58. [Google Scholar] [CrossRef]
  19. Hellawell, A. The constitution of manganese base alloys with metals of the second transition series. J. Less Common Met. 1959, 1, 343–347. [Google Scholar] [CrossRef]
  20. Savitskii, E.M.; Kopetskii, C.V. Phase Diagram of the Mananese-Titanium and Manganese-Zirconium Systems. Russ. J. Inorg. Chem. 1960, 5, 1173–1179. [Google Scholar]
  21. Svechnikov, V.; Petkov, V. Formation of Laves Phases in Alloys of Mn with Transition Metals of Groups IVA and VA. Akad. Nauk Ukr. SSR Metallofiz. 1976, 64, 24–28. [Google Scholar]
  22. Bellen, P.; Kumar, K.H.; Wollants, P. Thermodynamic assessment of the Ni-Ti phase diagram. Int. J. Mater. Res. 1996, 87, 972–978. [Google Scholar] [CrossRef]
  23. Kaltenbach, K.; Gama, S.; Pinatti, D.G.; Schulze, K.; Henig, E.T. A Contribution to the Ternary System Al-Nb-Ti, Z. Metallkd 1989, 80, 535–539. [Google Scholar]
  24. Kaufman, L.; Nesor, H. Coupled phase diagrams and thermochemical data for transition metal binary systems—II. Calphad 1978, 21, 81–108. [Google Scholar] [CrossRef]
  25. Kumar, C.H.; Wollants, P.; Delaey, L. Thermodynamic calculation of Nb-Ti-V phase diagram. Calphad-Comput. Coupling Phase Diagr. Thermochem. 1994, 18, 71–79. [Google Scholar] [CrossRef]
  26. Zhang, Y.; Liu, H.; Jin, Z. Thermodynamic assessment of the Nb-Ti system. Calphad 2001, 25, 305–317. [Google Scholar] [CrossRef]
  27. Matsumoto, S.; Tokunaga, T.; Ohtani, H. Thermodynamic analysis of the phase equilibria of the Nb–Ni–Ti system. Mater. Trans. 2005, 46, 2920–2930. [Google Scholar] [CrossRef] [Green Version]
  28. Okamoto, H. Supplemental Literature Review of Binary Phase Diagrams: Ag-Sn, Al-Pd, Ba-Gd, Ba-Pr, Cu-P, Dy-Ni, Ga-Mn, Gd-Sb, Gd-Zr, Ho-Te, Lu-Sb, and Mn-Nb. J. Phase Equilibria Diffus. 2014, 35, 105–116. [Google Scholar] [CrossRef]
  29. Liu, J.; Yang, X.; Li, C. Phase relationships in the Ho–Mn–Ti ternary system at 773 K. J. Alloys Compd. 2009, 476, 238–240. [Google Scholar] [CrossRef]
  30. Okamoto, N.L.; Yuge, K.; Tanaka, K. Atomic displacement in the CrMnFeCoNi high-entropy alloy—A scaling factor to predict solid solution strengthening. AIP Adv. 2016, 6, 125008. [Google Scholar] [CrossRef]
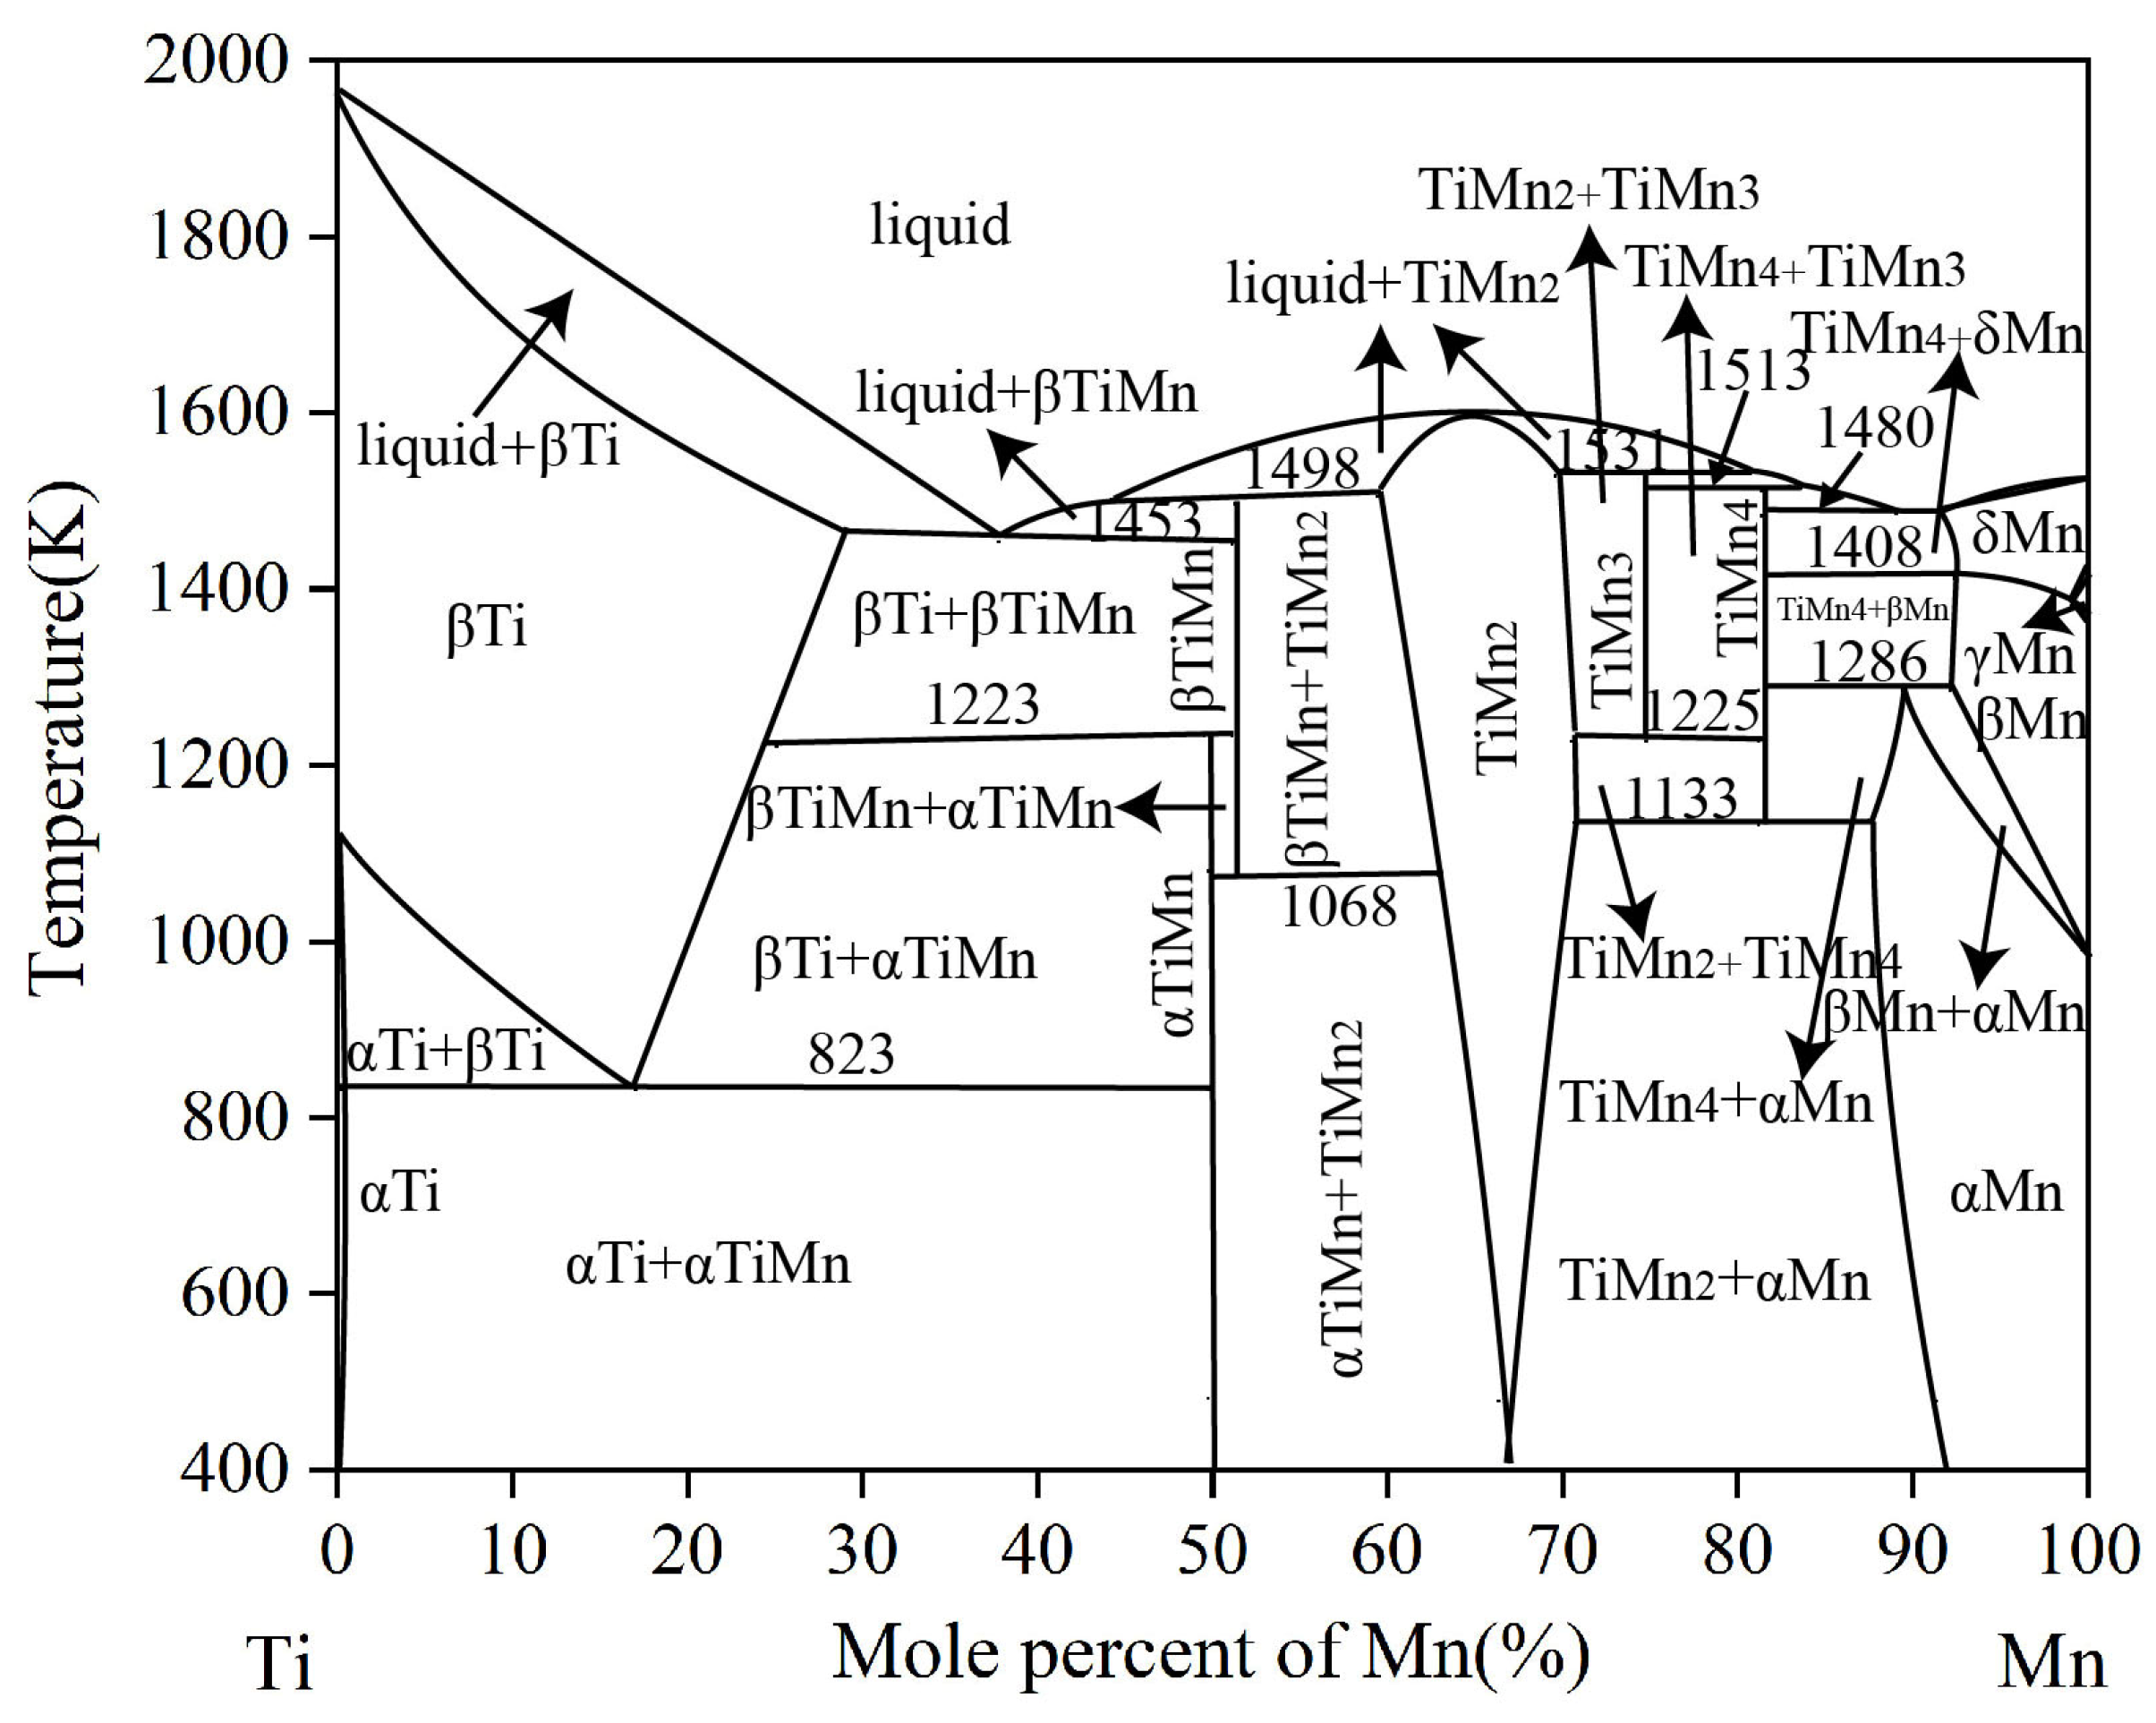
Figure 1. The calculated Ti-Mn phase diagram based on the work of Chen et al. [15].
Processes 11 00424 g001
Figure 4. Isothermal section of Ti-Nb-Mn ternary system at 1173K determined in this work.
Processes 11 00424 g004
Figure 5. Isothermal section of Ti-Nb-Mn ternary system at 1273K determined in this work.
Processes 11 00424 g005
Figure 6. Isothermal section of Ti-Nb-Mn ternary system at 1373K determined in this work.
Processes 11 00424 g006
Figure 7. Alloy A2 annealed at 1173K for 90 days: (a) back-scattered electron (BSE) images, (b) XRD patterns.
Processes 11 00424 g007
Figure 8. Alloy A7 annealed at1173K for 90 days: (a) back-scattered electron (BSE) images and (b) XRD patterns.
Processes 11 00424 g008
Figure 9. Alloy A10 annealed at1173K for 90 days: (a) back-scattered electron (BSE) images and (b) XRD patterns.
Processes 11 00424 g009
Figure 10. Alloy A8 annealed at 1173K for 90 days: (a) back-scattered electron (BSE) images, (b) XRD patterns.
Processes 11 00424 g010
Figure 11. Alloy A12 annealed at 1173K for 90 days: (a) back-scattered electron (BSE) images, (b) XRD patterns.
Processes 11 00424 g011
Figure 12. Alloy A16 annealed at 1173K for 90 days: (a) back-scattered electron (BSE) images, (b) XRD patterns.
Processes 11 00424 g012
Figure 13. Alloy A17 annealed at 1173K for 90 days: (a) back-scattered electron (BSE) images, (b) XRD patterns.
Processes 11 00424 g013
Figure 14. Alloy B6 annealed at 1273K for 60 days: (a) BSE images, (b) XRD patterns.
Processes 11 00424 g014
Figure 15. Alloy B9 annealed at 1273K for 60 days: (a) BSE images, (b) XRD patterns.
Processes 11 00424 g015
Figure 16. Alloy B1 annealed at 1273K for 60 days: (a) BSE images, (b) XRD patterns.
Processes 11 00424 g016
Figure 17. BSE images of alloys annealed at 1273K for 60 days: (a) B2, (b) B4.
Processes 11 00424 g017
Figure 18. Alloy B8 annealed at 1273K for 60 days: (a) BSE images, (b) XRD patterns.
Processes 11 00424 g018
Figure 19. Alloy B10 annealed at 1273K for 60 days: (a) BSE images, (b) XRD patterns.
Processes 11 00424 g019
Figure 20. Alloy B16 annealed at 1273K for 60 days: (a) BSE images, (b) XRD patterns.
Processes 11 00424 g020
Figure 21. Alloy B19 annealed at 1273K for 60 days: (a) BSE images, (b) XRD patterns.
Processes 11 00424 g021
Figure 22. Alloy B25 annealed at 1273K for 60 days: (a) BSE images, (b) XRD patterns.
Processes 11 00424 g022
Figure 23. BSE images of alloys annealed at 1273K for 60 days: (a) B14, (b) B22, (c) B21, (d) B24.
Processes 11 00424 g023
Figure 24. Alloy C5 annealed at 1373K for 40 days: (a) BSE images, (b) XRD patterns.
Processes 11 00424 g024
Figure 25. Alloy C7 annealed at 1373K for 40 days: (a) BSE images, (b) XRD patterns.
Processes 11 00424 g025
Figure 26. Alloy C3 annealed at 1373K for 40 days: (a) BSE images, (b) XRD patterns.
Processes 11 00424 g026
Figure 27. Alloy C6 annealed at 1373K for 40 days: (a) BSE images, (b) XRD patterns.
Processes 11 00424 g027
Table 1. Experimental and literature data on crystal structures and lattice parameters of the solid phases in Ti-Nb-Mn system.
PhasePhase
Prototype
Space GroupLattice Parameters (nm)Reference
abc
βNbcI2Im-3m0.3320--[18,28]
αTihP2P63/mmc0.2951-0.4684[17]
βTicI2Im-3m0.3307--[17]
αMncI58I-43m0.8913--[17]
βMncP20P43120.6315--[17]
γMncF4Fm-3m0.3860--[17]
αTiMntP30P42/mnm0.8731-0.4390[29]
βTiMn--0.8159-1.2767[29]
TiMn2hP12P63/mmc0.47141-0.78038[17]
TiMn3oP74Pbam0.790812.585570.47931[17]
TiMn4hR53R-30.1007-0.194411[17]
NbMn2hP12P63/mmc0.4802-0.7930[18,28]
Table 2. Constituent phases and compositions in the annealed Ti-Nb-Mn alloys at 1173K for 90 days.
Alloys
No.
Nominal Composition (at %)Experimental Results (at %)Phase
Determination
TiNbMnTiNbMn
A110504013.9176.629.47(βTi,Nb)
10.7529.8159.44(Ti,Nb)Mn2
A220503021.7868.539.69(βTi,Nb)
19.923.2156.89(Ti,Nb)Mn2
A325304523.6166.79.69(βTi,Nb)
26.4418.3855.18(Ti,Nb)Mn2
A435254040.3748.3911.24(βTi,Nb)
30.6614.9154.43(Ti,Nb)Mn2
A540204048.1838.9712.85(βTi,Nb)
34.7711.9153.32(Ti,Nb)Mn2
A640154548.6838.5712.75(βTi,Nb)
34.2711.9153.82(Ti,Nb)Mn2
49.247.9242.84K
A755153060.0722.7917.14(βTi,Nb)
50.898.3740.74K
A85554070.138.0421.83(βTi,Nb)
50.886.8942.23K
45.633.4550.92βTiMn
A96823049.390.6849.93αTiMn
72.532.2625.21(βTi,Nb)
A104294948.998.2342.78K
36.949.4153.65(Ti,Nb)Mn2
A114744945.693.0151.3βTiMn
49.987.3642.66K
A124025836.672.1861.15(Ti,Nb)Mn2
44.991.953.11(βTi,Nb)
A13730636.7930.2762.94(Ti,Nb)Mn2
A1420156519.9115.1164.98(Ti,Nb)Mn2
A153056528.426.9364.65(Ti,Nb)Mn2
A1617.5478.517.163.5779.27TiMn4
19.065.775.24(Ti,Nb)Mn2
A171010807.022.9590.03αMn
12.7815.6571.57(Ti,Nb)Mn2
A181528317.962.3979.65TiMn4
A191418514.441.5184.05TiMn4
10.731.3287.95αMn
A2091908.912.0689.03αMn
A2151947.040.7292.24αMn
3.390.9795.64βMn
A2232956.912.1690.93αMn
2.12.0395.87βMn
Disclaimer/Publisher’s Note: The statements, opinions and data contained in all publications are solely those of the individual author(s) and contributor(s) and not of MDPI and/or the editor(s). MDPI and/or the editor(s) disclaim responsibility for any injury to people or property resulting from any ideas, methods, instructions or products referred to in the content.