Article

Adhesive Thickness and Ageing Effects on the Mechanical Behaviour of Similar and Dissimilar Single Lap Joints Used in the Automotive Industry

by
Raffaele Ciardiello
1,2,*,
Carlo Boursier Niutta
1 and
Luca Goglio
1,2,*
1
Department of Mechanical and Aerospace Engineering, Politecnico di Torino (IT), 10129 Turin, Italy
2
J-TECH@POLITO, Advanced Joining Technologies, Politecnico di Torino (IT), 10129 Turin, Italy
*
Authors to whom correspondence should be addressed.
Processes 2023, 11(2), 433; https://doi.org/10.3390/pr11020433
Submission received: 30 December 2022 / Revised: 23 January 2023 / Accepted: 29 January 2023 / Published: 1 February 2023
(This article belongs to the Special Issue Design of Adhesive Bonded Joints)

Abstract

:
The effects of the adhesive thickness and overlap of a polyurethane adhesive have been studied by using different substrate configurations. Single lap joint (SLJ) specimens have been tested with homologous substrates, carbon fibre-reinforced plastics and painted metal substrates. Furthermore, a configuration with dissimilar substrates has been included in the experimental campaign. Both types of these adhesive and substrates are used in the automotive industry. The bonding procedure has been carried out without a surface treatment in order to quantify the shear strength and stiffness when surface treatments are not used on the substrates, reproducing typical mass production conditions. Three different ageing cycles have been used to evaluate the effects on SLJ specimens. A finite element model that uses cohesive modelling has been built and optimised to assess the differences between the different adopted SLJ configurations.

1. Introduction

In recent years, the use of composite materials is also spreading in mass production vehicles, especially in luxury cars where the requests for safety and comfort equipment are increasing drastically. Of course, this contributes negatively to the total weight of the vehicles, and thus, increases fuel consumption and vehicle emission. This tendency is promoting lightweight design even in the mass production of vehicles by replacing many components with reinforced plastics, such as crash absorbers, spoilers, side mouldings and roofs [1,2,3,4,5]. A drawback of the adoption of composite materials is that traditional mechanical fasteners (i.e., bolts, rivets and screws) are not easily adaptable, since holes are detrimental for the mechanical properties of composite materials and the presence of the holes in the composite should be properly designed or integrated to avoid premature failure [6]. For these reasons, adhesive bonding is preferred when composite materials have to be joined [7].
In recent years, the use of polyurethane adhesives as structural adhesives has been widely increased due to their resistance to dynamic load and their capacity to withstand larger deformations [7]. Nowadays, polyurethane adhesive is the most used adhesive, together with acrylics and epoxies, due to the increased resistance of the new proposed formulations [8].
Furthermore, polyurethane adhesives present a larger viscosity before curing that allows to assemble components or specimens with larger clearances, since the adhesive does not pour without proper tool or the application of pressure. Thus, once cured, these adhesives present sealant properties that are needed for materials that can present large clearances, such as thermoplastic composite components [9]. Although they present the aforementioned advantages, many substrate materials need to be pretreated in order to establish strong bonds with the adhesives. Pereira et al. [10] studied the effect of five different surface pretreatments (two different etching with sodium dichromate–sulphuric acid and caustic solution, Tucker’s reagent, abrasive polishing and wiping solvent) on the mechanical properties of SLJ tests. The analysed pretreatments allowed to obtain surface roughness between 18.6 and 5.6 µm. The decrease in the surface roughness led to an increase in the shear strength. The etching with sodium dichromate–sulphuric acid led to a decrease of the surface roughness of 5.6 µm and the highest ultimate shear load (~7800 N). Prolongo et al. [11] studied the effects of mechanical abrasive cleaning, alkaline cleaning and two complex sulfuric acid-based solutions on the ultimate shear strength of SLJ prepared with aluminium alloy. They showed that the etch with sulfuric acid-based solution led to the highest increase in the shear strength. Stammen et al. [12] and Ciardiello et al. [13] proposed a methodology to use plasma treatment to adhesively bond polypropylene-based materials with a polyurethane adhesive. Stammen et al. [12] showed that by using air and pyrosil as gas carriers to plasma-treat the aluminium substrates, the maximum shear strength can be increased by at least 2.5 times than the adhesive joints prepared by simply degreasing the substrate surface. Ciardiello et al. [13] showed that by using nitrogen as a gas carrier, a polyurethane adhesive can be used to adhesively bond polypropylene substrates without pretreatment. Zain et al. [14] showed that a decrease in the contact angle of aluminium substrates can be achieved by using an alkaline etching, dipping in warm water followed by treating with silane solution. The tests carried out on adhesive joints prepared with polyurethane adhesive showed that the shear strength can be increased by at least five times by using the surface treatment compared to joints bonded with untreated specimens. Although surface treatments can increase the mechanical performances of adhesive joints, these treatments cannot be easily adopted for specific applications where the assemblies are made along the production line in mass production due to the time production. In fact, many adhesive producers are studying specific formulations that can be used without pretreatments.
In this work, a polyurethane adhesive is used to prepare adhesive joints made of carbon fibre-reinforced plastic (CFRP) specimens, painted steel specimens and the relative dissimilar joints (CFRP/Steel). An extensive experimental campaign was carried out to assess the mechanical properties of SLJ specimens made with similar and dissimilar substrates considering three different thicknesses and two overlaps. Three different ageing cycles [13,15] used in the automotive industries were adopted to assess the effect of extreme environmental conditions on the adhesive joints. A finite element model (FEM) that uses cohesive zone modelling has been calibrated to find the cohesive parameters based on the obtained experimental results.

2. Materials and Methods

2.1. Materials and Experimental Methodology

Steel and CFRP substrates are both adopted in the automotive industry. A DD11 steel was used in this work as a metal substrate. The substrates were painted with a cataphoresis cycle designed by the automotive industry for this material. The composite substrates were obtained from a laminate that was fabricated with a specific stacking sequence optimised for painting the composite laminates without aesthetic defects. For this reason, the composite laminate is stacked with four layers of prepreg provided by Impregnatex Compositi (Italy) with different tow sizes. The prepregs are balanced twill fabrics that present different areal weights and fibres within a tow. They are laminated with the following sequence: GG630T (12 K, 630 gsm), GG204T (3 K, 204 gsm), DYF15 180P (15 K, 180 gsm) and finally GG204T (3 K, 204 gsm). The mechanical properties of the two substrates are reported in Table 1. The thickness of the steel and CFRP substrates are, respectively, 2.2 mm and 1.3 mm. The substrates present a length of 100 mm and a width of 20 mm. The size of the substrates guarantees no plastic deformation in the substrates during SLJ tests.
The substrates were adhesively bon”ed b’ using a bi-component polyurethane adhesive, Betaforce 2850L by Du Pont (Wilmington, DE, USA). The adhesive properties are also presented in Table 1 and have been assessed by using a Zwick Roell-Z005 (Ulm, Germany) testing machine in displacement control, 2 mm/min. On the other hand, the mechanical properties of the substrates are provided by the datasheet.
The SLJ tests were performed at a speed of 2 mm/min with an Instron (United States) 8801 testing machine. Tabs of different thicknesses were adopted to geometrically avoid the misalignment with the grips of the testing machine. Both similar and dissimilar SLJ were prepared and tested with only metal steel substrates (named here MS) and CFRP substrates (named CS) and their combinations. The SLJ tests were prepared with the following configurations CS-CS, MS-MS, and MS-CS. For each material pair configuration, three adhesive thicknesses were adopted, 1.5 mm (advised by the producer), 3 mm and 4 mm, and two different overlaps, 12 and 24 mm. The adoption of the larger thickness aims to understand the drop of the shear properties when this adhesive is used for larger clearances. At least three replications were carried out for each joint configuration.
SLJ specimens prepared by using a thickness of 1.5 mm and the two overlaps, 12 and 24 mm, for the three adopted configurations, CS-CS, MS-MS and CS-MS, have been aged with three different ageing cycles. These ageing cycles were also used by Ciardiello et al. [13,15] in previous works, and as reported in [16], they are used to study the effects of long exposure to extreme environmental conditions on the mechanical properties of adhesive joints. The following ageing cycles are carried out:
  • Cycle A: Exposure at 90 °C without control of the relative humidity (RH) for 500 h.
  • Cycle B: Exposure at 40 °C with RH set at 98% for 500 h.
  • Cycle C: Exposure at 80 °C without RH for 24 h; exposure at 40°C with RH set at 98% for 24 h; exposure at −40 °C for 24 h.
Aging cycles are carried out by using two different chambers (Votsch VT4020 and Votsch Heraeus HC0020). The aim of the ageing treatment is to assess whether cycles A, B or C can significantly affect the mechanical properties of the adhesive joints. As reported by Belingardi et al. [16], mechanical tests after ageing are always carried out in the automotive industry on adhesive joints since they can modify the mechanical behaviour of the adhesive joints in some cases. In the present work, the ageing cycles have been carried out since the surface of the substrates was not pretreated. Thus, a possible effect of the ageing on the surfaces had to be considered.

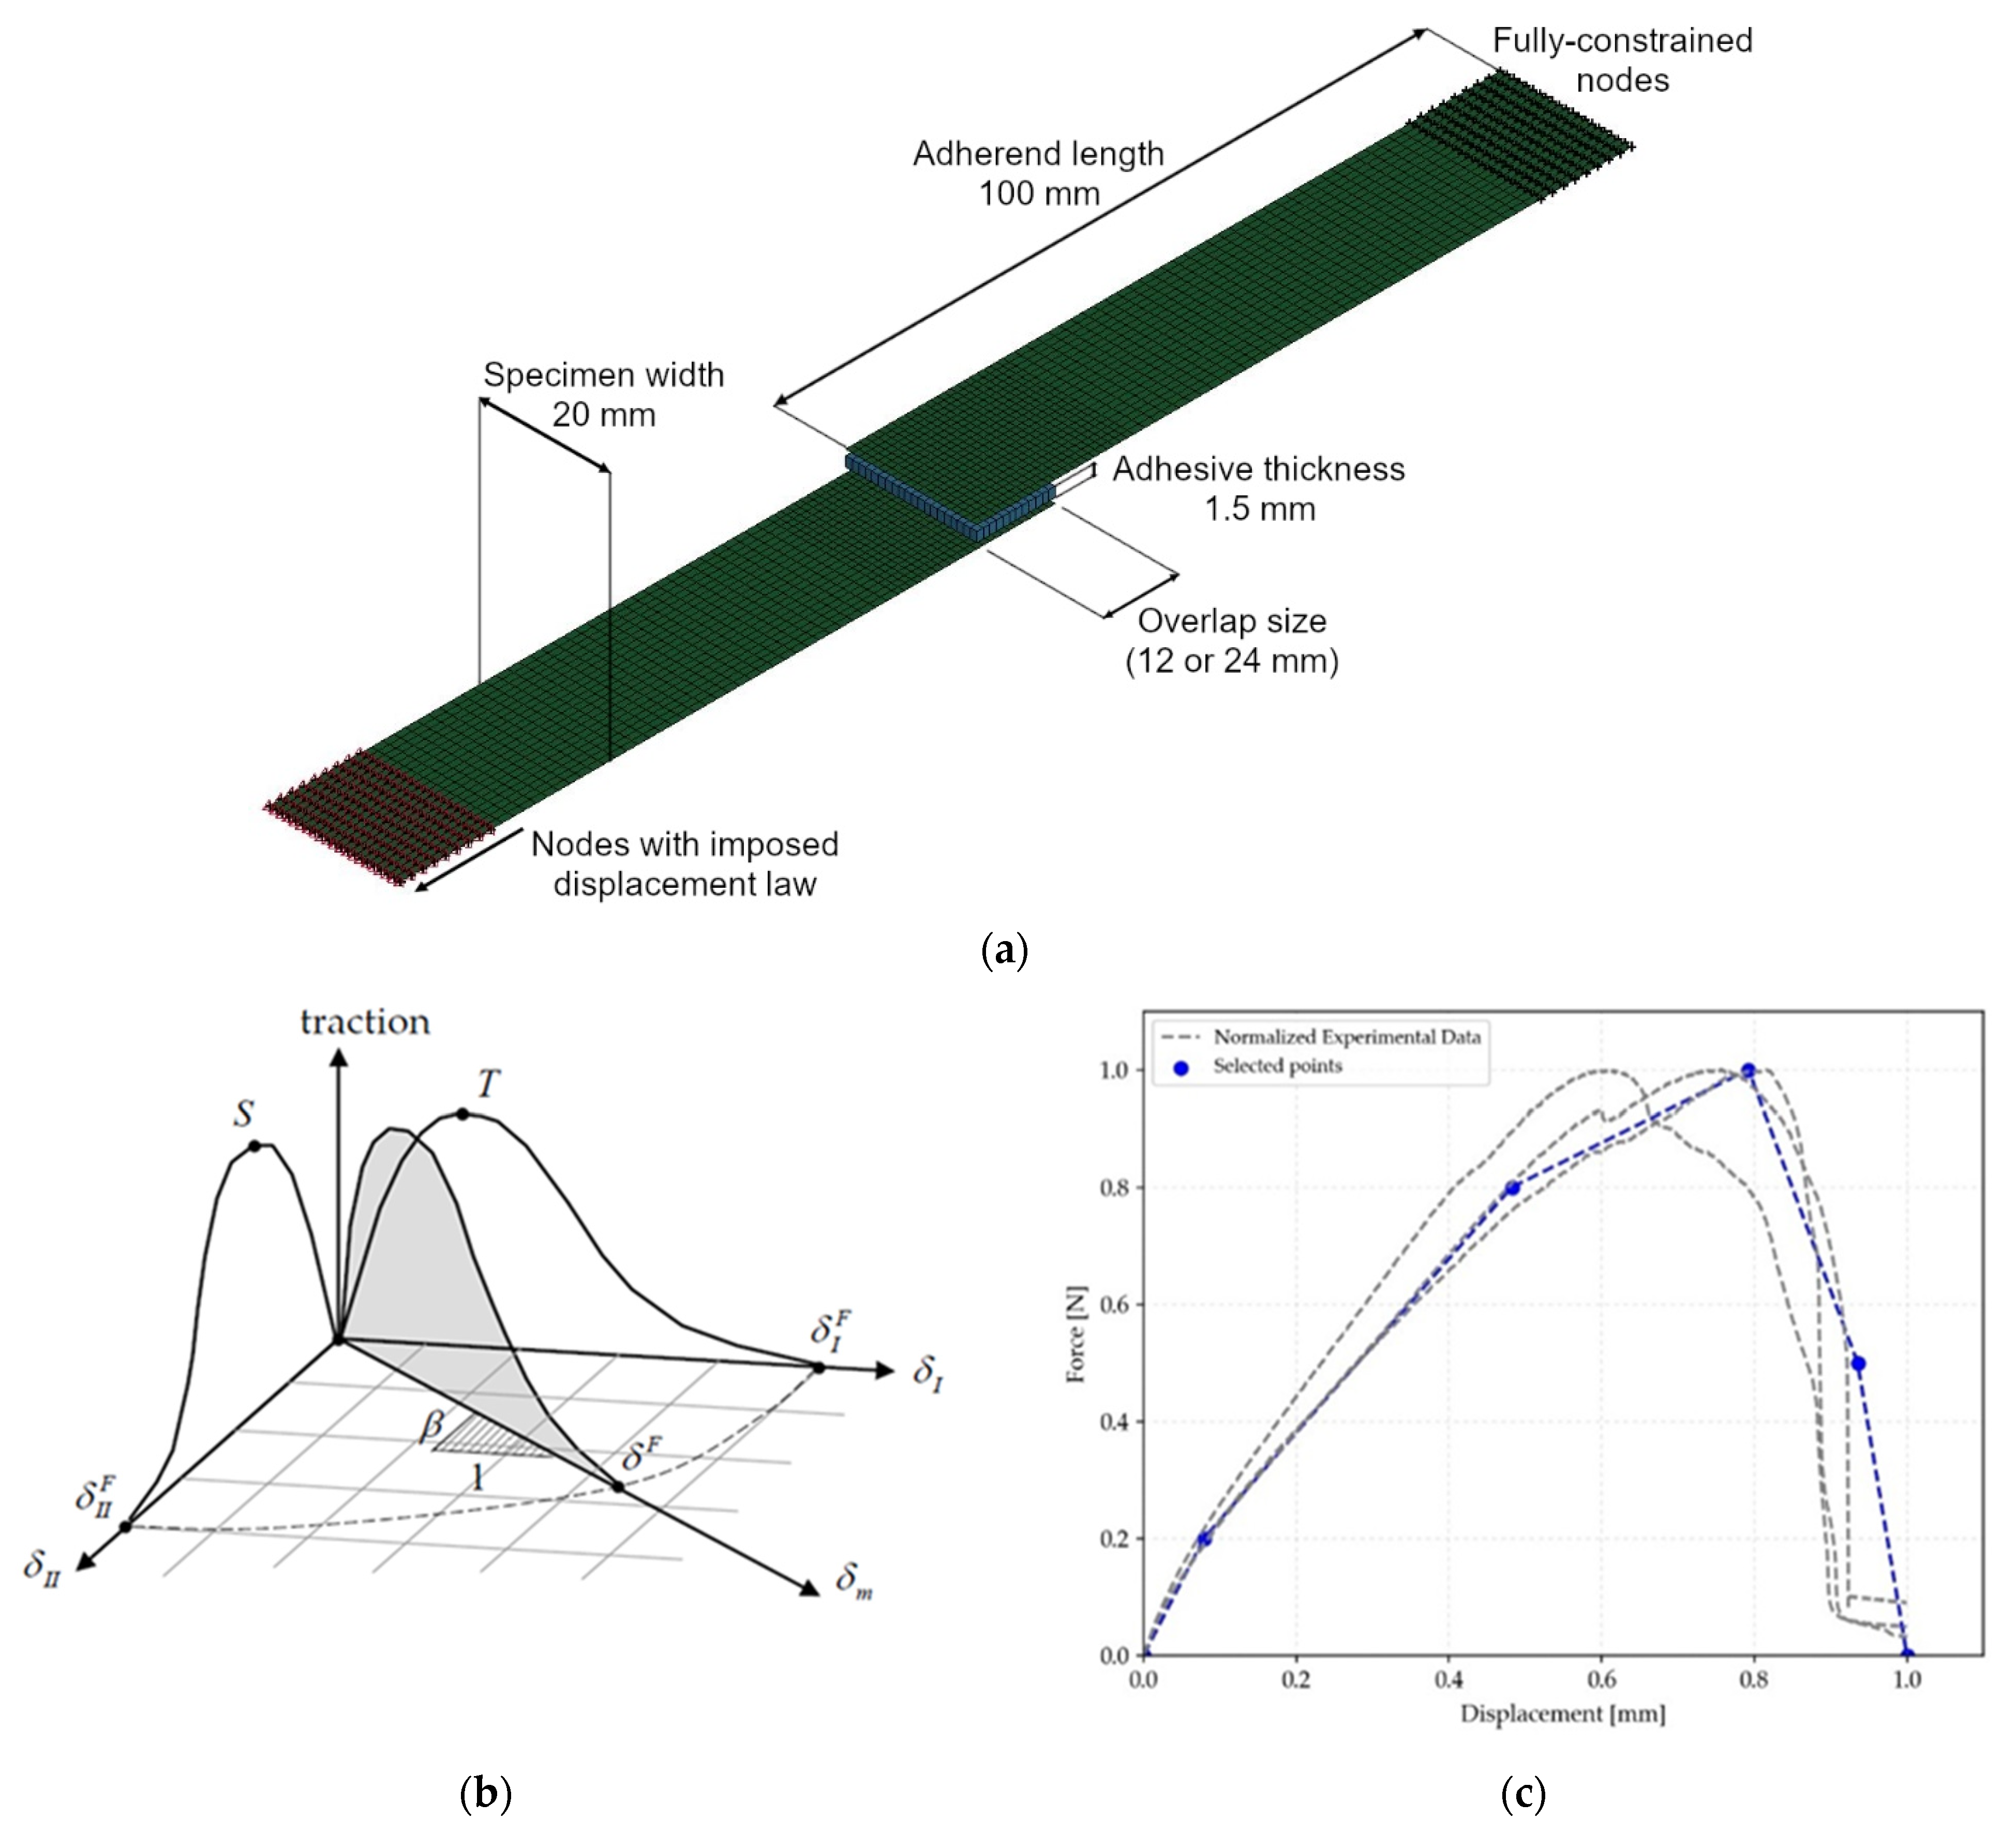
2.2. Finite Element Model

The mechanical models of SLJ with two different overlaps, 12 and 24 mm, have been simulated in the configuration with an adhesive thickness of 1.5 mm. The software used for the simulations is LS-Dyna. The numerical activity aimed to assess the mechanical properties of the SLJ and to study the drop of mechanical properties for the SLJ prepared with composite substrates which is illustrated in Section 3.1. The substrates have been modelled as four-nodes Belytshcko-Tsai shell elements. Eight-node solid elements are used to model the adhesive. The integration points of MS and CS substrates through the adhesive thickness are three and four respectively (as the number of layers of the composite laminate). The cohesive formulation of the adhesive solid element uses four integration points that are placed at the midpoint of the element surface. The substrates present a mesh of 2 mm that is refined to 1 mm approaching the overlap area of the SLJ specimens. Figure 1a displays the FEM model of the SLJ specimen. Figure 1b,c display the cohesive material model that has been adopted and the six points that have been used to normalise the force-displacement curve based on the experimental trends that have been observed. Geometrically, one extremity of the SLJ specimen was constrained and a motion law was applied to the other substrate. This motion law is set as an initial ramp followed by a constant value of the speed, as in [17]. The MS substrates are modelled as elastic, while the CS substrates are modelled with an orthotropic model, as in [1]. Due to the intrinsic nature of SLJ specimens, a mixed mode (mode I and mode II) failure is induced. For this reason, a cohesive material model that takes into account both failure modes is chosen, namely *MAT_GENERAL_COHESIVE [18,19]. The main peculiarities of this material model are shear and peel stress and their relative energy release rate that are defined with user-defined points; the shear stress and the energy release rate can be handled as design variables. Six normalised points on the normalised force-displacement experimental curve were chosen to replicate the mechanical behaviour of the adhesive joint: the origin, the load at 20%, the load at 80%, the load at 100%, the load at 50% of the drop after the maximum peak load was reached and the ultimate displacement.
Using a methodology already used by the authors [1] and the main experimental results obtained by Banea et al. [20] and Leal et al. [21] that found that the ratio between the energy release rate in mode II, GIIC, is in the order of four times the energy release rate in mode I, GIC, for these types of adhesives, the following strategy was adopted. The experimental force-displacement curves of the tests carried out on SLJ made with 12 mm overlap were adopted to impose the material behaviour. Together with the ratio between GIC and GIIC, the shear stress S (Figure 1b) and the GIIC were considered to approximate the mechanical behaviour of the adhesive layer. On the other hand, the peel stress T is assumed to be double the maximum shear stress, in agreement with the Tresca criterion.
A surrogate model optimisation has been carried out on SLJ specimens produced with 12 mm overlap. The optimisation procedure can be summarised as reported below:
    f ( x _ )    
s u c h   t h a t   g 1 = F m a x , n u m ( x _ ) F m a x ,   e x p 1 0
w h e r e         f = | E N n u m E N e x p |
x _ = [ S , G I I c ]    
Then, the same parameters were adopted to simulate the SLJ prepared with the 24 mm overlap in order to understand whether the mechanical model is able to replicate the experimental behaviour of the 24 mm overlap joints as well by using the same cohesive parameters. The optimisation model works on the experimental and numerical results related to the force (Equation (1)) and absorbed energy (Equation (2)). The optimisation aims to minimise the difference in absorbed energy of SLJ test between the experimental (ENexp) and numerical (ENnum) simulations. Furthermore, a constraint between the maximum experimental (Fmax,exp) and numerical force (Fmax,num) was adopted. Both maximum force and absorbed energy were surrogated using the approximation method of Kriging [22]. The surrogated surfaces were constructed by considering 20 samples that are stochastically disposed in the design domain in addition to the four corners samples. The optimisation is run with the algorithm COBYALA [23]. Table 2 reports the limit domains for the three different adhesive joint configurations MS-MS, CS-CS and MS-CS.

3. Results and Discussions

The results of the mechanical tests are reported in this section. Since different graphs are presented, the following nomenclature will be used in the present work: MS refers to the steel metal substrates, while CS refers to the CFRP substrates. Furthermore, the value of the overlap and thickness is reported in the nomenclature. For example, MS-MS_24_1.5 refers to the adhesive joints prepared with only steel substrate with an overlap length of 24 mm and a thickness of 1.5 mm. The letter A, B or C will be added at the end of the label for the adhesive joints exposed at the ageing cycles A, B or C, as illustrated in Section 2.

3.1. Single Lap Joint Tests

The load-displacement curves obtained by using SLJ tests are reported in Figure 2. In particular, Figure 2a reports the load-displacement curves of configuration that uses metal substrates for the two different overlap lengths and the three different adhesive thicknesses. Figure 2b,c report the curves obtained by using the same sizes of the SLJ (two overlap lengths and three thicknesses), but they are related to the configurations that use only composite substrates and metal-composite substrates respectively. Figure 2a–c show that the highest loads and displacements are obtained by testing SLJ prepared with metal substrates. On the other hand, the lowest loads and displacements are obtained by the tests of SLJ prepared with the composite substrates. Intermediate load values are obtained for the SLJ prepared with dissimilar, metal and composite, substrates for all the considered configurations. In general, Figure 2a–c illustrate that the highest loads are obtained for the configurations that use an adhesive thickness of 1.5 mm, while the SLJ prepared with 3 and 4 mm present very close maximum loads and similar displacements. However, the loads of the SLJ prepared with 3 mm are slightly higher than those prepared with 4 mm thickness.
Figure 3 reports the summary of the shear strengths and stiffnesses obtained by SLJ tests for all the configurations presented in Figure 2. The MS-MS configuration presents the highest strength as shown in Figure 2 for the three adhesive thicknesses. The CS-CS configuration presents the lowest shear strengths while the dissimilar configuration, MS-CS, presents intermediate values of shear strengths for all three adhesive thicknesses. The shear strength values shown in Figure 3a–c show that there is no significant difference between the two adopted overlaps, except for the configuration MS-CS for the SLJ specimens prepared with 3 and 4 mm adhesive thicknesses. However, the error bars show that there is no significant difference. Furthermore, Figure 3a,b reveal a drop in the shear strength by doubling the thickness of the SLJ specimens. The drop in shear strength doubling the adhesive thickness from 1.5 to 3 mm is about 46% for the SLJ prepared with 12 mm overlap. Of course, the 24 mm overlap has a similar trend since the values are quite superimposed. In contrast with this described drop, there is no significant difference between the shear strengths obtained by the SLJ tests prepared with 3 and 4 mm. Only the ultimate displacement is significantly changing between SLJ prepared with 3 and 4 mm adhesive thickness, as illustrated in Figure 1b,c. Although the two substrates present two different Young’s moduli, the drop in the shear strength is not justified by the different stiffnesses of the two specimens. The reason for the drop can be found in the mixed adhesive and cohesive failure modes, which is shown in Section 3.2 at the interface of CS substrates. Da Silva et al. [24] reported a decrease of the maximum shear strength between 17% and 26% percent by increasing the thickness of the adhesive layers for three different epoxy adhesives from 0.2 to 1 mm (five times the initial thickness). On the other hand, the values obtained in the present work for the SLJ specimens prepared with 12 mm overlap report a decrease of about 45% for both MS-MS, CS-CS and MS-CS configurations. Thus, a decrease of 45% is obtained by increasing the adhesive layer thickness from 1.5 to 4 mm (2.7 times the initial thickness). Figure 3 reports the values of the stiffness as well. The stiffness has been computed by using the tendency line in the first linear trend of the load-displacement curve. Figure 3a reports that the joint stiffnesses vary significantly with the three different adopted configurations. This is due to the different stiffnesses of the substrate configuration and adhesive thicknesses, as shown in the graphs presented in Figure 3. Figure 3a–c illustrate that a reduction of stiffness is obtained for the configuration CS-CS and MS-CS compared to the configuration MS-MS for a specific adhesive thickness. The drop in stiffness of the CS-CS and MS-CS configuration compared to the baseline, MS-MS configuration, is reported in Figure 3d. Figure 3d shows that SLJ prepared with 12 and 24 mm overlaps present similar trends for all the SLJ prepared with different adhesive thicknesses. SLJ prepared with 1.5 mm thickness presents a drop close to 50% for the configuration CS-CS and 37% for the configuration MS-CS, which means higher stiffness for the configuration prepared with the dissimilar materials. Figure 3d illustrates a drop of 38% (CS-CS) and 22% (MS-CS) compared to the configuration MS-MS for the SLJ prepared with an adhesive thickness of 3 mm. Finally, a drop of 36% (CS-CS) and 12% (MS-CS) compared to the configuration MS-MS is shown for SLJ prepared with 4 mm thickness. This means that by increasing the adhesive thickness of SLJ, the stiffness decreases significantly as reported, while the drop of stiffness for higher thickness is lower compared to SLJ prepared with an adhesive thickness of 1.5 mm. A combination table of the reported values was built to show the configuration that presents similar results. Table 3 and Table 4 present a summary of the configurations that show similar shear strength and stiffness, respectively. The values were considered similar when both shear strength and stiffness present a value that is at most ±10% from the considered value.

3.2. Fracture Surfaces

Figure 4a–c illustrate the representative failure surfaces obtained for the different configurations, a higher magnification of the CS-CS failure surface and an optical microscope image that shows the adhesive spots that have been depicted on CS specimens, respectively. Figure 4a shows that MS-MS configuration exhibits a fully cohesive failure (the SLJ samples fail through the adhesive) for both adhesive joints prepared with both 12 and 24 mm overlaps. The adhesive joints prepared with composite specimens and with dissimilar substrates macroscopically present a cohesive failure as well. However, a mixed adhesive/cohesive failure mode can be detected in Figure 4b,c by observing the small brighter spots using a microscope. In particular, Figure 4b presents some clearer areas that are zones of the visible surface of the CFRP substrate. As shown in Section 3.1, this led to a lower value of the shear strength. Figure 4c shows also that the adhesive failure spots are not always uniformly spread on the whole surface but are limited to the right part of the substrate in this specific case. However, the inspection of all the substrates involved in the experimental campaign showed that the spots can be present in different parts of the substrates. As a proof of this behaviour, CS-CS_12 mm and CS_CS_24 mm shown in Figure 4a present these spots on the left side and the top part. On the other hand, MS-CS_12 mm and MS-CS_24 mm show that these areas are on the right and top part of the specimens, respectively.

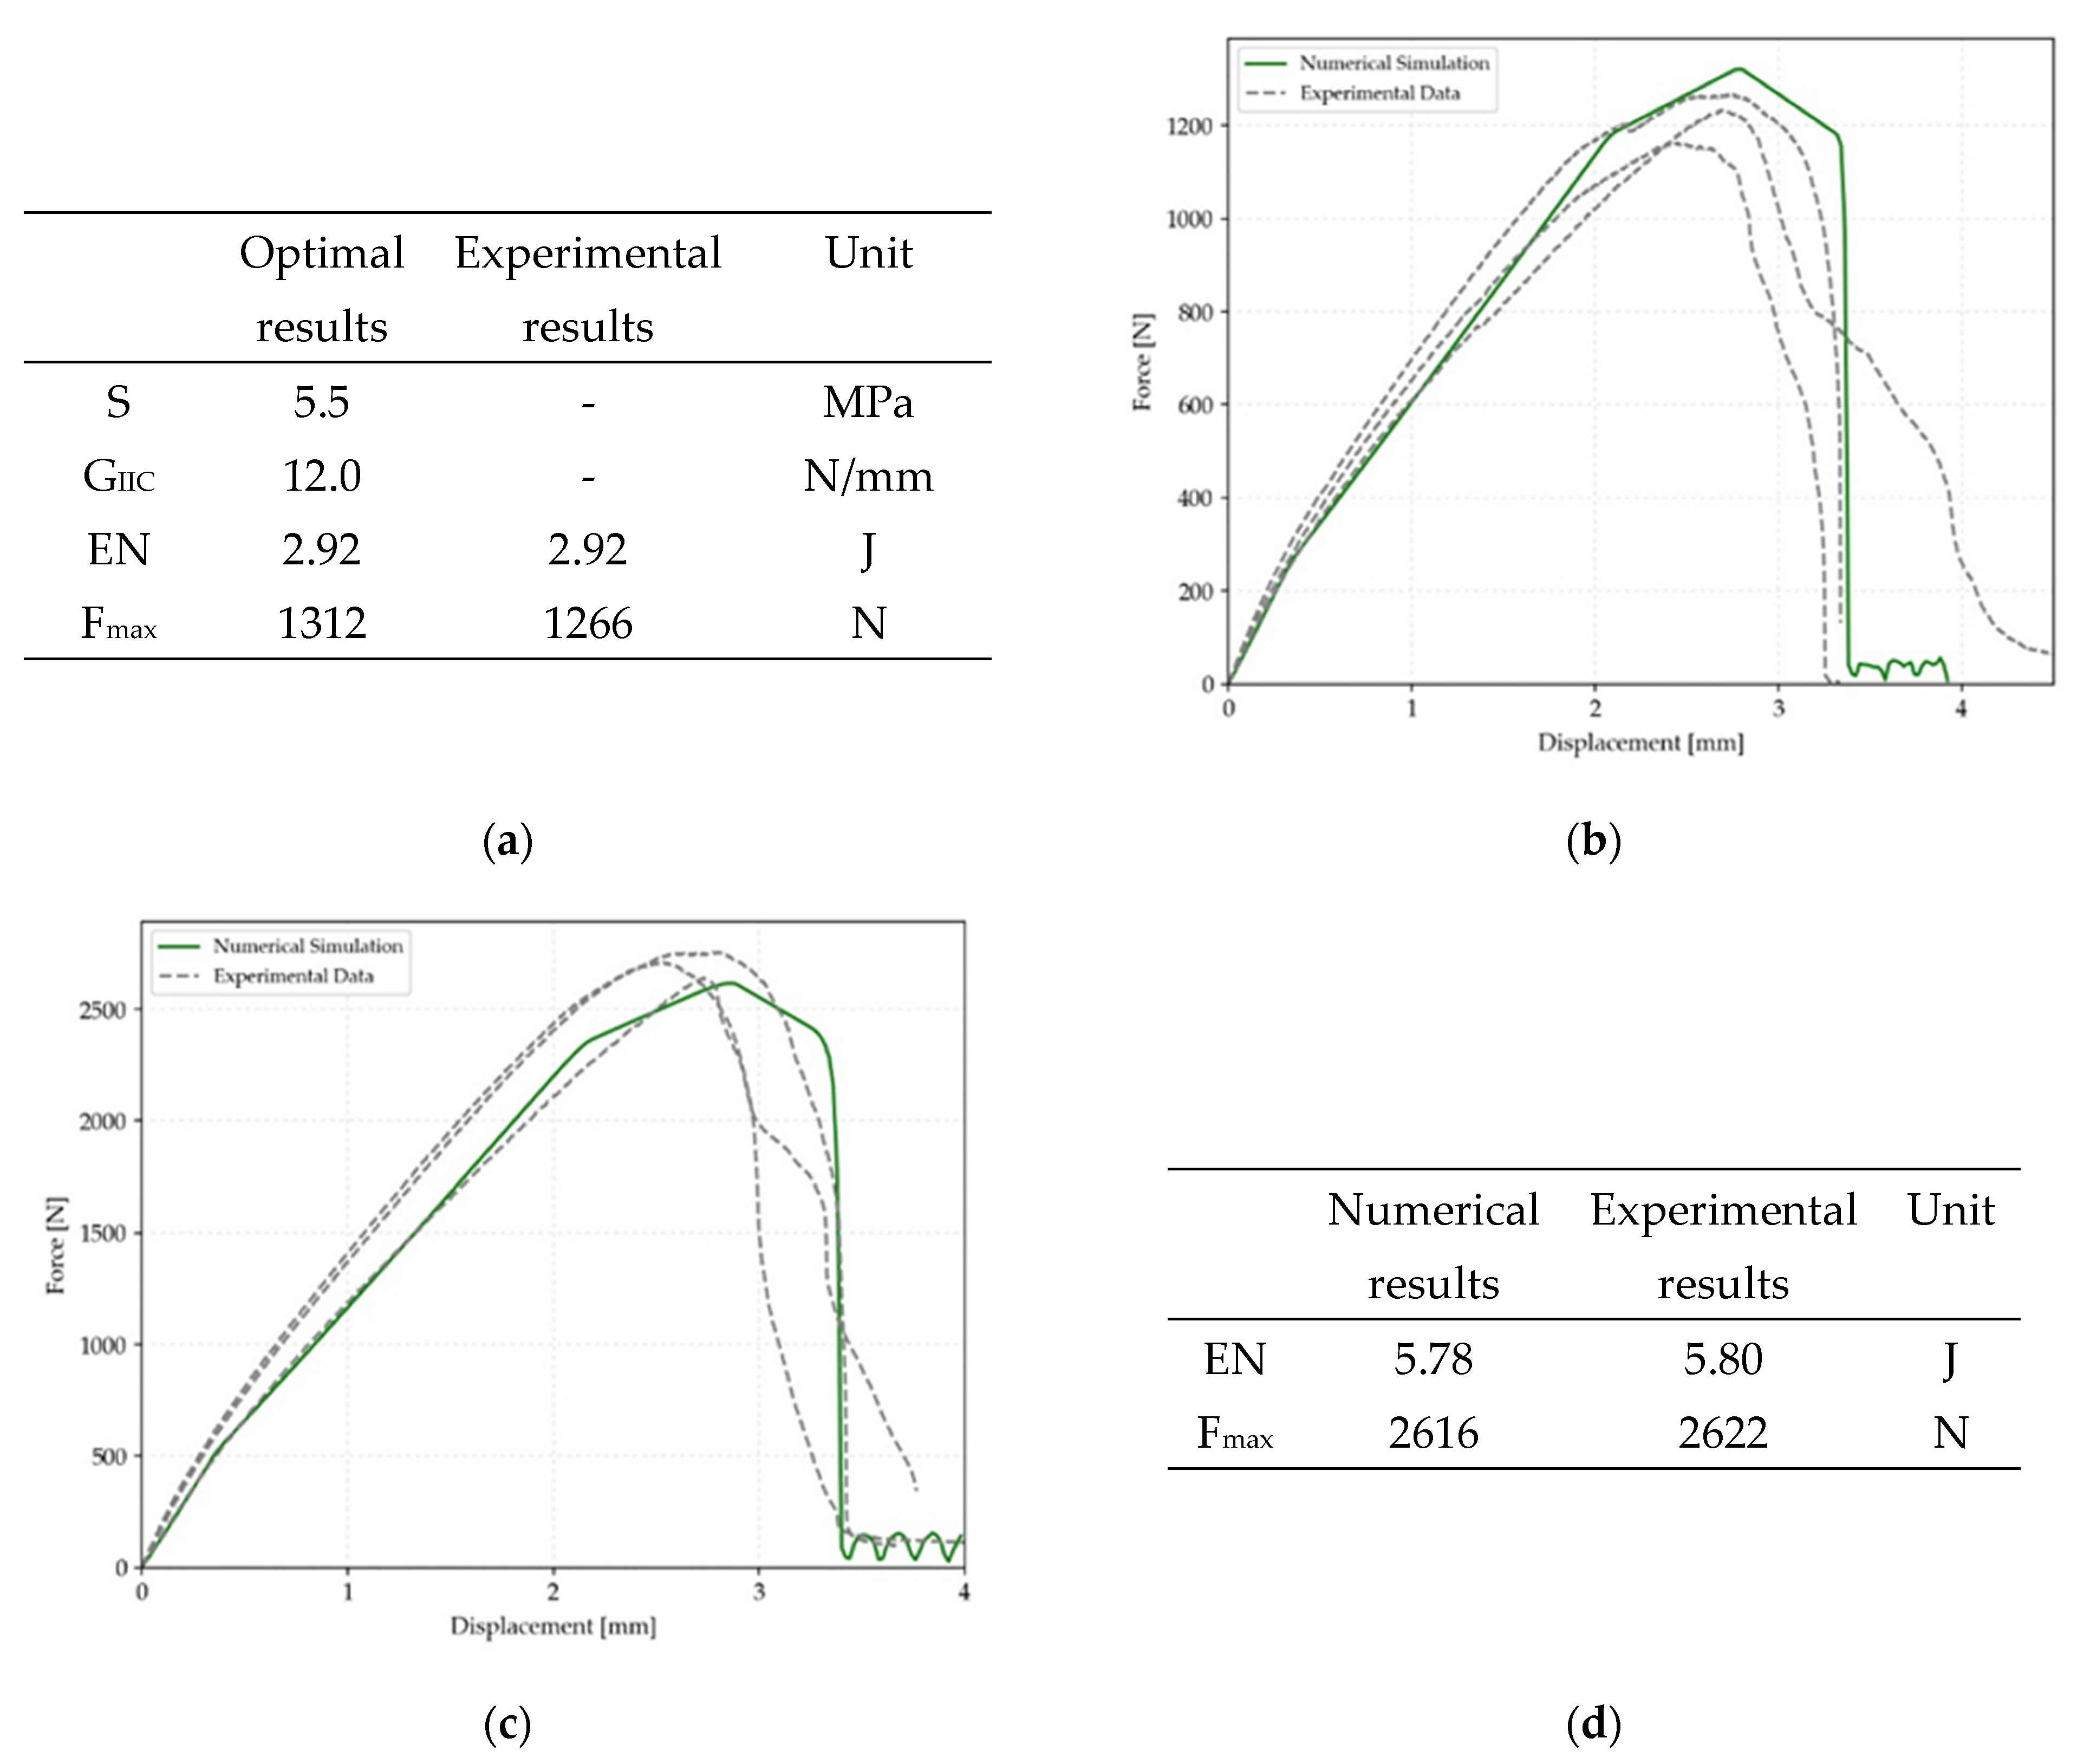
3.3. Numerical Model

In this section, the results of the optimisation process are used to simulate the mechanical behaviour of the adhesive joints. Figure 5a shows the result of the optimisation process obtained on the MS-MS specimens made with 12 mm overlap. Figure 5b displays the three experimental curves obtained for the MS-MS configuration (12 mm overlap) and the good agreement with the numerical curve. Figure 5c shows the experimental curves of SLJ tests carried out on MS-MS configuration that uses an overlap of 24 mm and the relative numerical curve that has been obtained by using the optimised cohesive parameters obtained from the 12 mm overlap configuration. Figure 5c shows that there is a very good agreement with the initial trend and with the maximum force. The model can also detect the change in the slope observed at 1000 N. On the other hand, the ultimate load is slightly underestimated. The table of Figure 5d reports the values obtained in numerical and experimental results for the MS-MS curve made with 24 mm overlap that shows that the absorbed energy is underestimated as well, mainly due to the lower ultimate displacement as well as the slightly lower maximum force that is obtained from the simulation compared to the experimental test.
Figure 6 shows the results obtained on the SLJ configuration made with composite substrates CS-CS. Figure 6a displays a table with the results of the optimisation procedure that has been used to simulate the SLJ made with 12 mm overlap. It is worth noticing that the value of the shear strength for the CS-CS configuration is reduced by 45%, similar to the experimental results. Figure 6b shows the comparison between experimental and numerical curves related to the CS-CS configuration made with 12 mm overlap. A very good agreement is found for the initial trend, the maximum load, slightly higher in the numerical simulation, and the final displacement. The results illustrated in Figure 6c display that a very good agreement is also found for 24 mm overlap configuration. Finally, the table reported in Figure 6d shows that the numerical and experimental results of the absorbed energy and maximum load, are very close to each other, confirming the good agreement of the FEM analysis.
Similar results have been obtained for the configuration MS-CS. The table reported in Figure 7a shows the optimised parameters for the configuration MS-CS. It is worth noting that the value of the shear stress is an intermediate value between the configurations MS-MS and CS-CS, closer to the CS-CS configuration due to the similar obtained failure surface. Figure 7b displays a good agreement between numerical and experimental curves for the configuration made with 12 mm overlap. A good agreement is still presented in Figure 7c for the CS-CS configuration made with 24 mm overlap. The use of the 12 mm overlap parameters led to correct numerical curves both for the initial trend, force and maximum displacements as well as for the SLJ made with 24 mm overlap. The maximum obtained load from numerical simulations and experiments led to a very similar value, while the absorbed energy is slightly lower for the numerical model, as shown in the Table of Figure 7d.
The numerical modelling activity showed that the cohesive parameters that fits well with the SLJ test results for the specific configurations varies significantly among the three different configurations MS-MS, CS-CS and MS-CS. The numerical activity has been used to demonstrate that the mixed adhesive failure obtained with the SLJ specimens made with composite laminates led to a significant drop in the cohesive parameters. The drop of the cohesive parameters has been depicted for the SLJ configurations prepared with the composite materials, CS-CS and MS-CS, which have been compared to the MS-MS configuration since the failure surfaces exhibit a cohesive type. The drop of the parameters S, GIIC, EN and Fmax for the CS-CS configuration compared to MS-MS is, respectively, 45%, 50%, 50% and 45%, similar to the experimental mechanical result. On the other hand, the MS-CS configuration displays a drop of S, GIIC, EN and Fmax of 32%, 34%, 36% and 34%, respectively, compared to MS-MS configuration. Again, these results are very close to the experimental results. The experimental activity together with the numerical simulation proves that the mixed adhesive/cohesive failure led to lower values of the cohesive properties.

3.4. Ageing Cycles

The results of the ageing cycles presented in Section 2.1 are reported in this section. As reported in Section 2.1, the SLJ tests have been carried out for three different ageing cycles on the configuration MS-CS prepared with both 12 and 24 mm overlaps and with a thickness of 1.5 mm, which is the advised datasheet thickness. Figure 8 presents the load-displacement curves of the MS-CS configuration with an overlap of 12 mm before and after the ageing cycle (a), the load-displacement curves for the configuration with an overlap of 24 mm before and after the ageing cycle (b) and the summary of the results with the shear strengths and stiffnesses (c). Figure 8a,b show that the load-displacement curve of SLJ prepared with both 12 and 24 mm overlaps present the same initial trend. For both graphs, the maximum load is slightly higher for the SLJ tests after the ageing A, which is the cycle that conditioned the SLJ at 90 °C. On the other hand, the maximum load illustrates that the SLJ tests after the ageing B led to slightly lower loads while cycle C is not influencing the load-displacement curve. Figure 8c reports the summary of the results related to the ageing cycles. The comparison between the unaged SLJ and SLJ aged with cycle A show that there is a slight increase in the shear strength although it is not significant by looking at the presented error bars. On the other hand, SLJ conditioned with cycle B exhibit a slight decrease in the shear strength. This slight drop was also reported by Ciardiello et al. [13] for the same adhesive and an ageing cycle that presents high relative humidity. The drop is 25% for the SLJ prepared with 12 mm overlap and 15% for the SLJ prepared with 24 mm overlap. Finally, the stiffnesses reported in Figure 8c show that their values do not vary after the ageing cycles.

4. Conclusions

The effects of 12 and 24 mm overlap together with three different adhesive thick-nesses 1.5, 3.0 and 4.0 mm have been studied with regard to different substrate configurations. These configurations are made only with painted steel and composite substrates. Furthermore, a dissimilar configuration with both steel and composite material has been studied. The SLJ specimens have been prepared by not using surface pretreatment in order to assess the mechanical performances of the adhesive joints without the treatment that is usually required when polyurethane adhesive is used. The following main conclusion has been reported and discussed in Section 3:
  • The SLJ showed that the adhesive joints with the composite substrate presented a mixed adhesive/cohesive failure surface that led to a detrimental effect on the mechanical properties of the SLJ. The shear strength presents a drop of 45% and 30%, respectively, for CS-CS and MS-CS configurations compared to MS-MS SLJ.
  • The analysis carried out by FEM modelling showed that the different failure surfaces led to different cohesive parameters. Thus, the drop in shear strength does not depend on the different substrate stiffnesses but is related to the different failure modes. The stiffnesses vary with the adhesive overlap and thickness.
  • Lap shear tests carried out on the aged adhesive joints showed that the adhesive presents a good mechanical response to both the hot cycle (ageing A) and mixed cycle (ageing C). On the other hand, the mechanical properties after the humid cycle (ageing B) are lower. This drop in shear strength is related to a decrease in the mechanical properties of the adhesive itself, since the failure surfaces do not change after ageing.

Author Contributions

Conceptualisation, R.C. and L.G.; methodology, R.C. and C.B.N.; software, C.B.N.; validation, R.C., C.B.N. and L.G.; investigation, R.C. and C.B.N.; data curation, R.C.; writing—original draft preparation, R.C.; writing—review and editing, C.B.N. and L.G.; supervision, L.G. All authors have read and agreed to the published version of the manuscript.

Funding

This research received no external funding.

Data Availability Statement

Data will be available on request.

Conflicts of Interest

The authors declare no conflict of interest.

References

  1. Ciardiello, R.; Boursier Niutta, C.; Di Sciullo, F.; Goglio, L. Single-lap joints of similar and dissimilar adherends bonded with a polyurethane adhesive used in the automotive industry. IOP Conf. Ser. Mater. Sci. Eng. 2021, 1038, 12031. [Google Scholar] [CrossRef]
  2. Ciampaglia, A.; Mastropietro, A.; De Gregorio, A.; Vaccarino, F.; Belingardi, G.; Busto, E. Artificial Intelligence for Damage Detection in Automotive Composite Parts: A Use Case. SAE Int. J. Adv. Curr. Prac. Mob. 2021, 3, 2936–2945. [Google Scholar]
  3. Ciampaglia, A.; Santini, A.; Belingardi, G. Design and analysis of automotive lightweight materials suspension based on finite element analysis. Proc. Inst. Mech. Eng. C J. Mech. Eng. Sci. 2021, 235, 1501–1511. [Google Scholar] [CrossRef]
  4. Ciampaglia, A.; Fiumarella, D.; Boursier Niutta, C.; Ciardiello, R.; Belingardi, G. Impact response of an origami-shaped composite crash box: Experimental analysis and numerical optimization. Compos. Struct. 2021, 256, 113093. [Google Scholar] [CrossRef]
  5. Boursier Niutta, C.; Ciardiello, R.; Tridello, A. Experimental and Numerical Investigation of a Lattice Structure for Energy Absorption: Application to the Design of an Automotive Crash Absorber. Polymers 2022, 14, 1116. [Google Scholar] [CrossRef] [PubMed]
  6. Chang, F.; Scott, R.A.; Springer, G.S. Failure of Composite Laminates Containing Pin Loaded Holes—Method of Solution. J. Comp. Mater. 1989, 18, 255–278. [Google Scholar] [CrossRef]
  7. Somarathna, H.M.C.C.; Raman, S.N.; Mohotti, D.; Mutalib, A.A.; Badri, K.H. The use of polyurethane for structural and infrastructural engineering applications: A state-of-the-art review. Constr. Build. Mater. 2018, 190, 995–1014. [Google Scholar] [CrossRef]
  8. Technical Industrial Report. In Global Automotive Adhesives & Sealants Market-Size, Share, COVID-19 Impact & Forecasts up to 2028; GlobeNewswire: Los Angeles, CA, USA, 2021.
  9. Segura, D.M.; Nurse, A.D.; McCourt, A.; Phelps, R.; Segura, A. Chapter 3 Chemistry of Polyurethane Adhesives and Sealants. In Handbook of Adhesives and Sealants, 1st ed.; Cognard, P., Ed.; Elsevier Science Ltd.: Amsterdam, The Netherland, 2005; Volume 1, pp. 101–162. [Google Scholar]
  10. Pereira, A.M.; Ferreira, J.M.; Antunes, F.V.; Bartolo, B.J. Analysis of manufacturing parameters on the shear strength of aluminium adhesive single-lap joints. J. Mater. Process. Technol. 2010, 210, 610–617. [Google Scholar] [CrossRef]
  11. Prolongo, S.; Ureña, A. Effect of surface pre-treatment on the adhesive strength of epoxy–aluminium joints. Int. J. Adhes. Adhes. 2009, 29, 23–31. [Google Scholar] [CrossRef]
  12. Stammen, E.; Dilger, K.; Böhm, S.; Hose, R. Surface Modification with Laser: Pretreatment of Aluminium Alloys for Adhesive Bonding. Plasma Process. Polym. 2007, 4, 39–43. [Google Scholar] [CrossRef]
  13. Ciardiello, R.; D’Angelo, D.; Cagna, L.; Croce, A.; Paolino, D. Effects of plasma treatments of polypropylene adhesive joints used in the automotive industry. Proc. Inst. Mech. Eng. C J. Mech. Eng. Sci. 2022, 236, 6204–6218. [Google Scholar] [CrossRef]
  14. Zain, N.M.; Ahmmad, S.H.; Ali, E.S. Green Polyurethane Adhesive Bonding of Aluminum: Effect of Surface Treatment. Appl. Mech. Mater. 2013, 393, 51–56. [Google Scholar] [CrossRef]
  15. Ciardiello, R.; Belingardi, G.; Martorana, B.; Brunella, V. Effect of accelerated ageing cycles on the physical and mechanical properties of a reversible thermoplastic adhesive. J. Adhes. 2020, 96, 1003–1026. [Google Scholar] [CrossRef]
  16. Belingardi, G.; Brunella, V.; Ciardiello, R.; Martorana, B. Thermoplastic Adhesive for Automotive Applications. In Adhesives-Applications and Properties, 1st ed.; Rudawska, A., Ed.; IntechOpen: London, UK, 2016; Volume 1, pp. 341–362. [Google Scholar]
  17. Boursier Niutta, C.; Ciardiello, R.; Belingardi, G.; Scattina, A. Experimental and numerical analysis of a pristine and a nano-modified thermoplastic adhesive. In Proceedings of the PVP® Pressure & Vessels, Prague, Czech Republic, 15–20 July 2018. [Google Scholar]
  18. Gleich, D.M.; Van Tooren, M.J.L.; Beukers, A. Analysis and evaluation of bondline thickness effects on failure load in adhesively bonded structures. J. Adhes. Sci. Technol. 2001, 15, 1091–1101. [Google Scholar] [CrossRef]
  19. LSTC. 2019 LS-DYNA Keyword Manual Volume II; Livermore Software Technology Corporation (LSTC): San Francisco, CA, USA, 2014. [Google Scholar]
  20. Banea, M.D.; da Silva, L.F.M.; Campilho, R.D.G. The effect of adhesive thickness on the mechanical behavior of a structural polyurethane adhesive. J. Adhes. 2015, 91, 331–346. [Google Scholar] [CrossRef]
  21. Leal, A.J.S.; Campilho, R.D.S.; Silva, S.; Silva, F.J.G.; Moreira, F.J.P. Comparison of different test configurations for the shear fracture toughness evaluation of a ductile adhesive. Procedia Manuf. 2019, 38, 940–947. [Google Scholar] [CrossRef]
  22. Forrester, A.I.J.; Sóbester, A.; Keane, A.J. Engineering Design via Surrogate Modelling: A Practical Guide; John Wiley & Sons, Ltd.: Hoboken, NJ, USA, 2008; pp. 60–100. [Google Scholar]
  23. Powell, M.J.D. Advances in Optimization and Numerical Analysis, 1st ed.; Kluwer Academic: Dordrecht, The Netherland, 1994; pp. 51–67. [Google Scholar]
  24. da Silva, L.F.M.; Rodrigues, T.N.S.S.; Figueiredo, M.A.V.; de Moura, M.F.S.F.; Chousal, J.A.G. Effect of Adhesive Type and Thickness on the Lap Shear Strength. J. Adhes. 2006, 82, 1091–1115. [Google Scholar] [CrossRef]
Figure 1. (a) SLJ in LS-Dyna environment (12 mm overlap); (b) material model; (c) normalised point chosen for the simulations.
Processes 11 00433 g001
Figure 2. Load-displacement curves for the configurations MS-MS (a), CS-CS (b) and MS-CS (c).
Processes 11 00433 g002
Figure 3. Shear strengths and stiffnesses for the configurations MS-MS (a), CS-CS (b) and MS-CS (c); decrease of stiffness for the different adhesive configurations (d).
Processes 11 00433 g003
Figure 4. (a) Representative failure surfaces of the MS-MS, CS-CS and MS-CS SLJ configurations; (b) higher magnification of the CS-CS substrate; (c) representative adhesive failures of the CS substrate.
Processes 11 00433 g004
Figure 5. MS-MS configuration: (a) Optimised parameter of SLJ test with 12 mm overlap; (b) Comparison between experimental and numerical load-displacement curves (12 mm overlap); (c) Comparison between experimental and numerical load-displacement curves (24 mm overlap); (d) Comparison between experimental and numerical parameters (24 mm overlap).
Processes 11 00433 g005
Figure 6. CS-CS configuration: (a) Optimised parameter of SLJ test with 12 mm overlap; (b) Comparison between experimental and numerical load-displacement curves (12 mm overlap); (c) Comparison between experimental and numerical load-displacement curves (24 mm overlap); (d) Comparison between experimental and numerical parameters (24 mm overlap).
Processes 11 00433 g006
Figure 7. MS-CS configuration: (a) Optimised parameter of SLJ test with 12 mm overlap; (b) Comparison between experimental and numerical load-displacement curves (12 mm overlap); (c) Comparison between experimental and numerical load-displacement curves (24 mm overlap); (d) Comparison between experimental and numerical parameters (24 mm overlap).
Processes 11 00433 g007
Figure 8. (a) Load-displacement with and without ageing, 12 mm overlap; (b) Load-displacement with and without ageing, 24 mm overlap; (c) Summary of the results.
Processes 11 00433 g008
Table 1. Mechanical properties of the specimens.
SteelCFRPPolyurethane Adhesive
Tensile strength [MPa]4407308.2
Young’s Modulus [Mpa]207 × 10360 × 10320
Maximum elongation [%]24.01.2114
Table 2. Lower and upper limits for the three different configurations.
Lower BoundUpper BoundUnit
MS-MS
S8.013.0MPa
GIIC16.026.0N/mm
CS-CS
S5.011.0MPa
GIIC10.022.0N/mm
MS-CS
S5.511.5MPa
GIIC10.022.0N/mm
Table 3. Configurations that present similar strength.
12 mm24 mm
1.5 mmMS-MS Processes 11 00433 i001 Processes 11 00433 i002
CS-CS Processes 11 00433 i003
MS-CS
3.0 mmMS-MS Processes 11 00433 i004
CS-CS Processes 11 00433 i005 Processes 11 00433 i006
MS-CS Processes 11 00433 i007 Processes 11 00433 i008
4.0 mmMS-MS Processes 11 00433 i009 Processes 11 00433 i010
CS-CS Processes 11 00433 i011 Processes 11 00433 i012
MS-CS Processes 11 00433 i013 Processes 11 00433 i014
The same symbol indicates that the configurations present similar shear strength with 10% of variation included.
Table 4. Configurations that present similar stiffness.
12 mm24 mm
1.5 mmMS-MS Processes 11 00433 i015
CS-CS Processes 11 00433 i016 Processes 11 00433 i017
MS-CS
3.0 mmMS-MS Processes 11 00433 i018
CS-CS
MS-CS Processes 11 00433 i019 Processes 11 00433 i020
4.0 mmMS-MS Processes 11 00433 i021 Processes 11 00433 i022
CS-CS Processes 11 00433 i023
MS-CS Processes 11 00433 i024
The same symbol indicates that the configurations present similar stiffness with 10% of variation included.
Disclaimer/Publisher’s Note: The statements, opinions and data contained in all publications are solely those of the individual author(s) and contributor(s) and not of MDPI and/or the editor(s). MDPI and/or the editor(s) disclaim responsibility for any injury to people or property resulting from any ideas, methods, instructions or products referred to in the content.

