


A Turbulent Mass Diffusivity Model for Predicting Species Concentration Distribution in the Biodegradation of Phenol Wastewater in an Airlift Reactor

Abstract
:1. Introduction
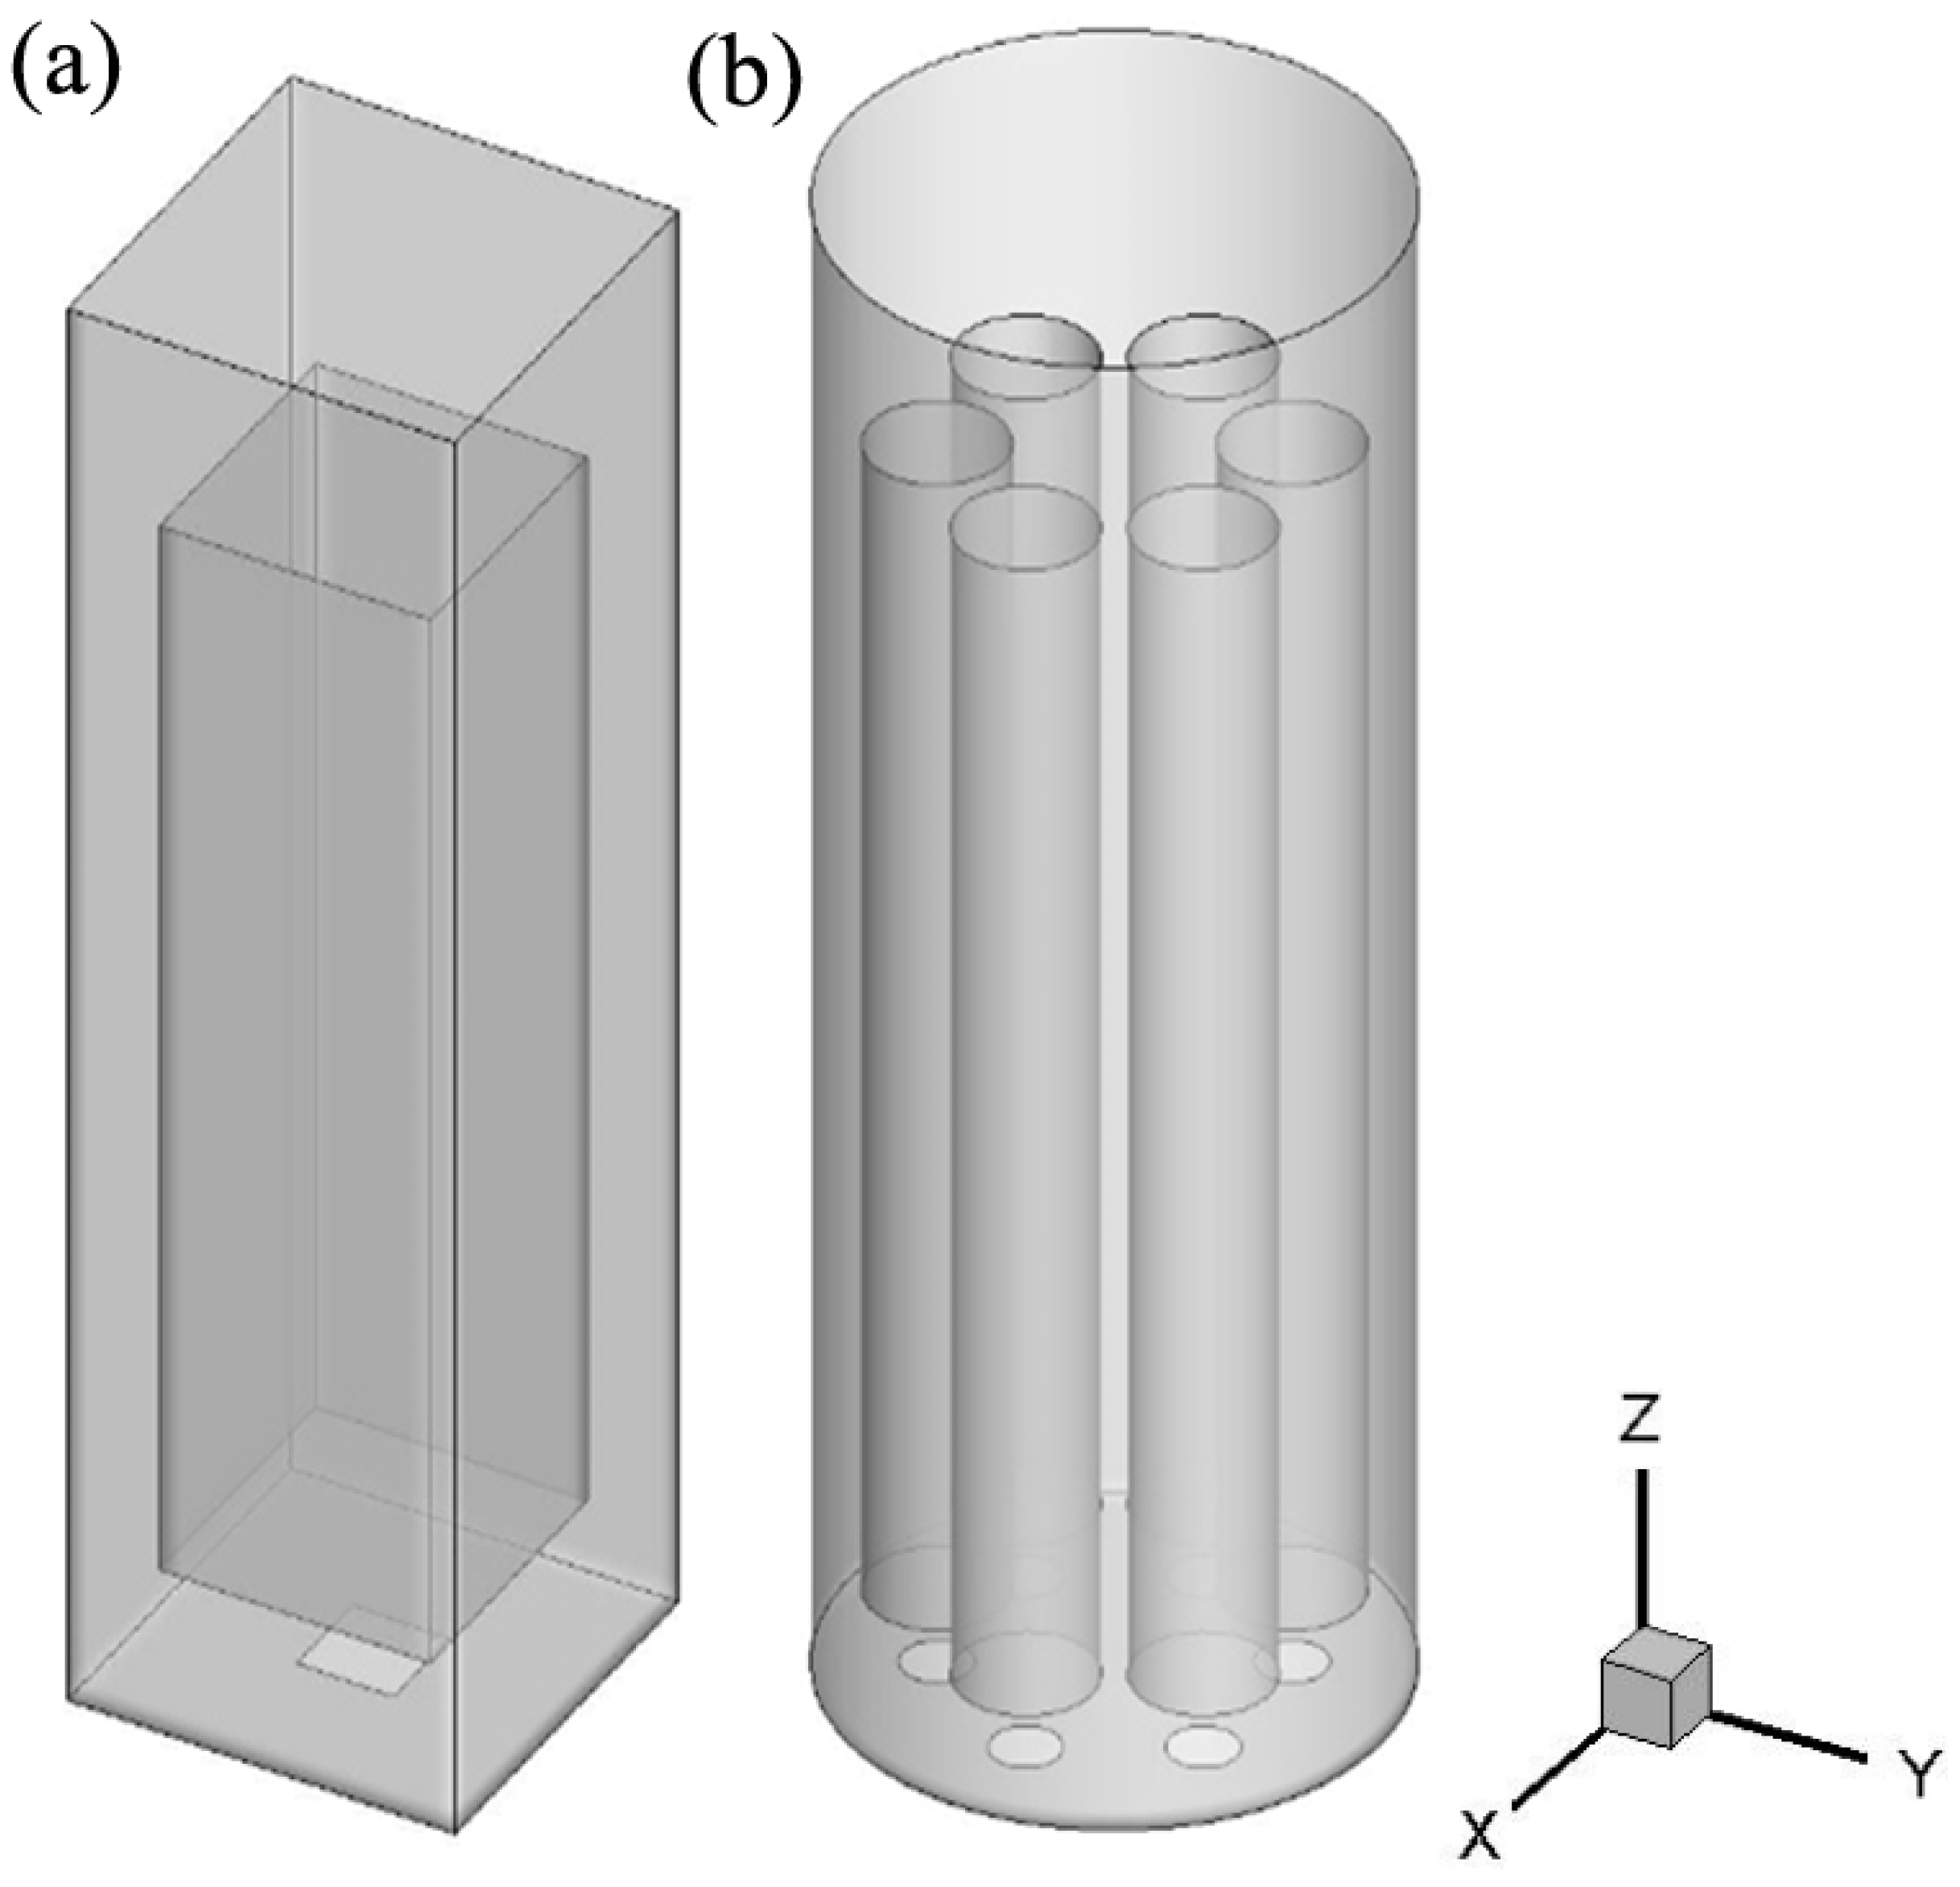
2. Simulated Case
3. Model Equations
3.1. Continuity Equations
3.2. Momentum Conservation Equations
3.3. Bubble Size Distribution (PBM)
3.4. Species Conservation Equations
3.5. Microbial Kinetics
4. Simulation Setup
5. Results and Discussion
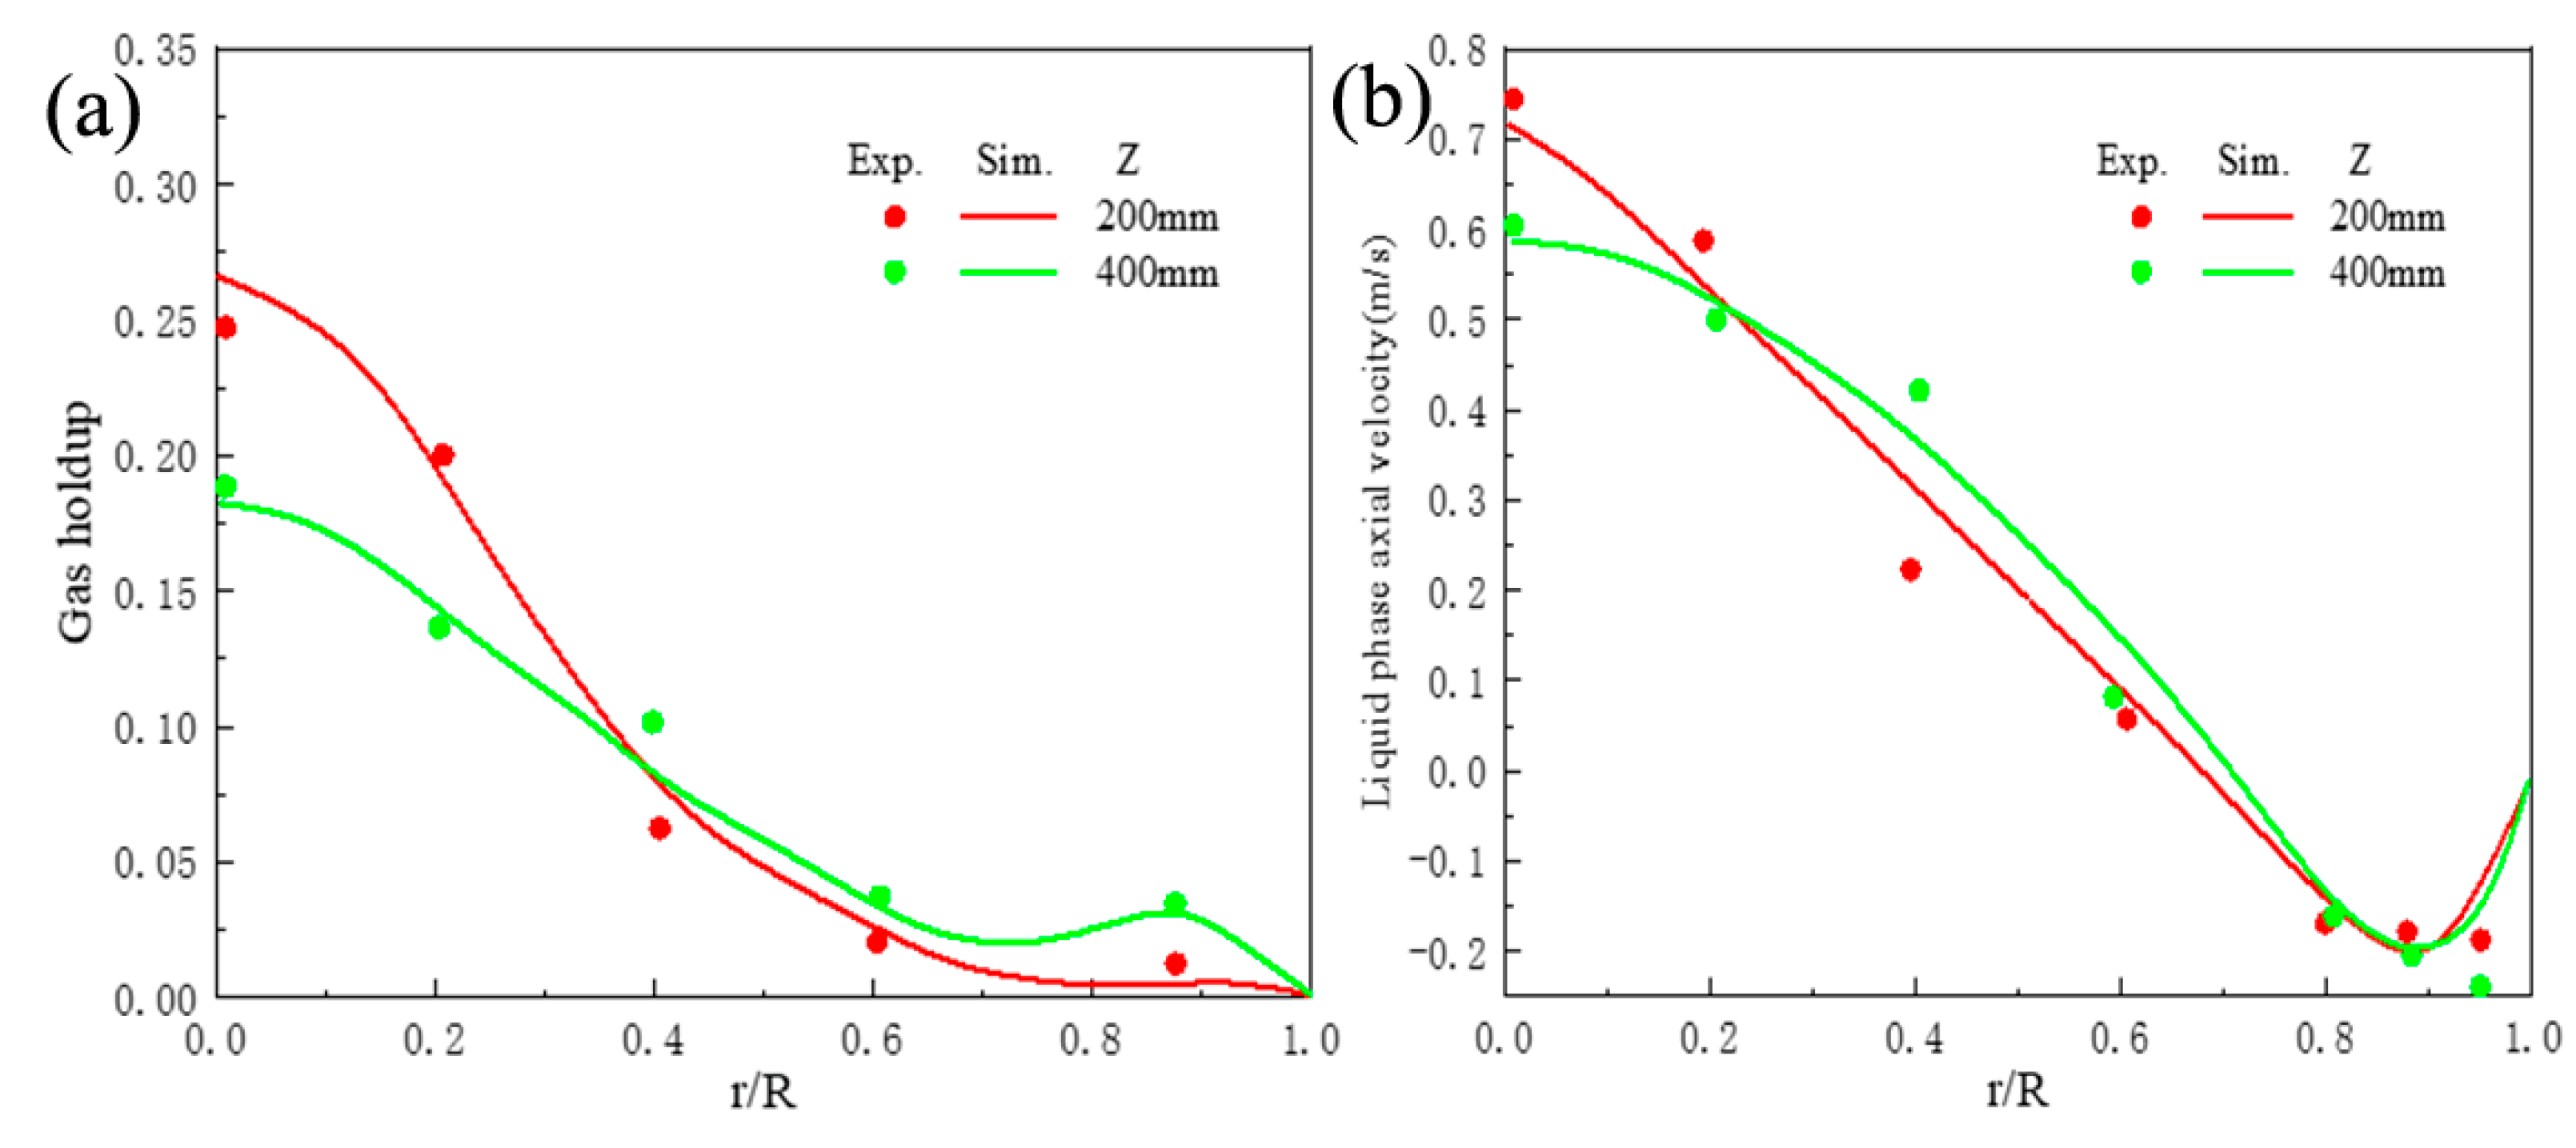
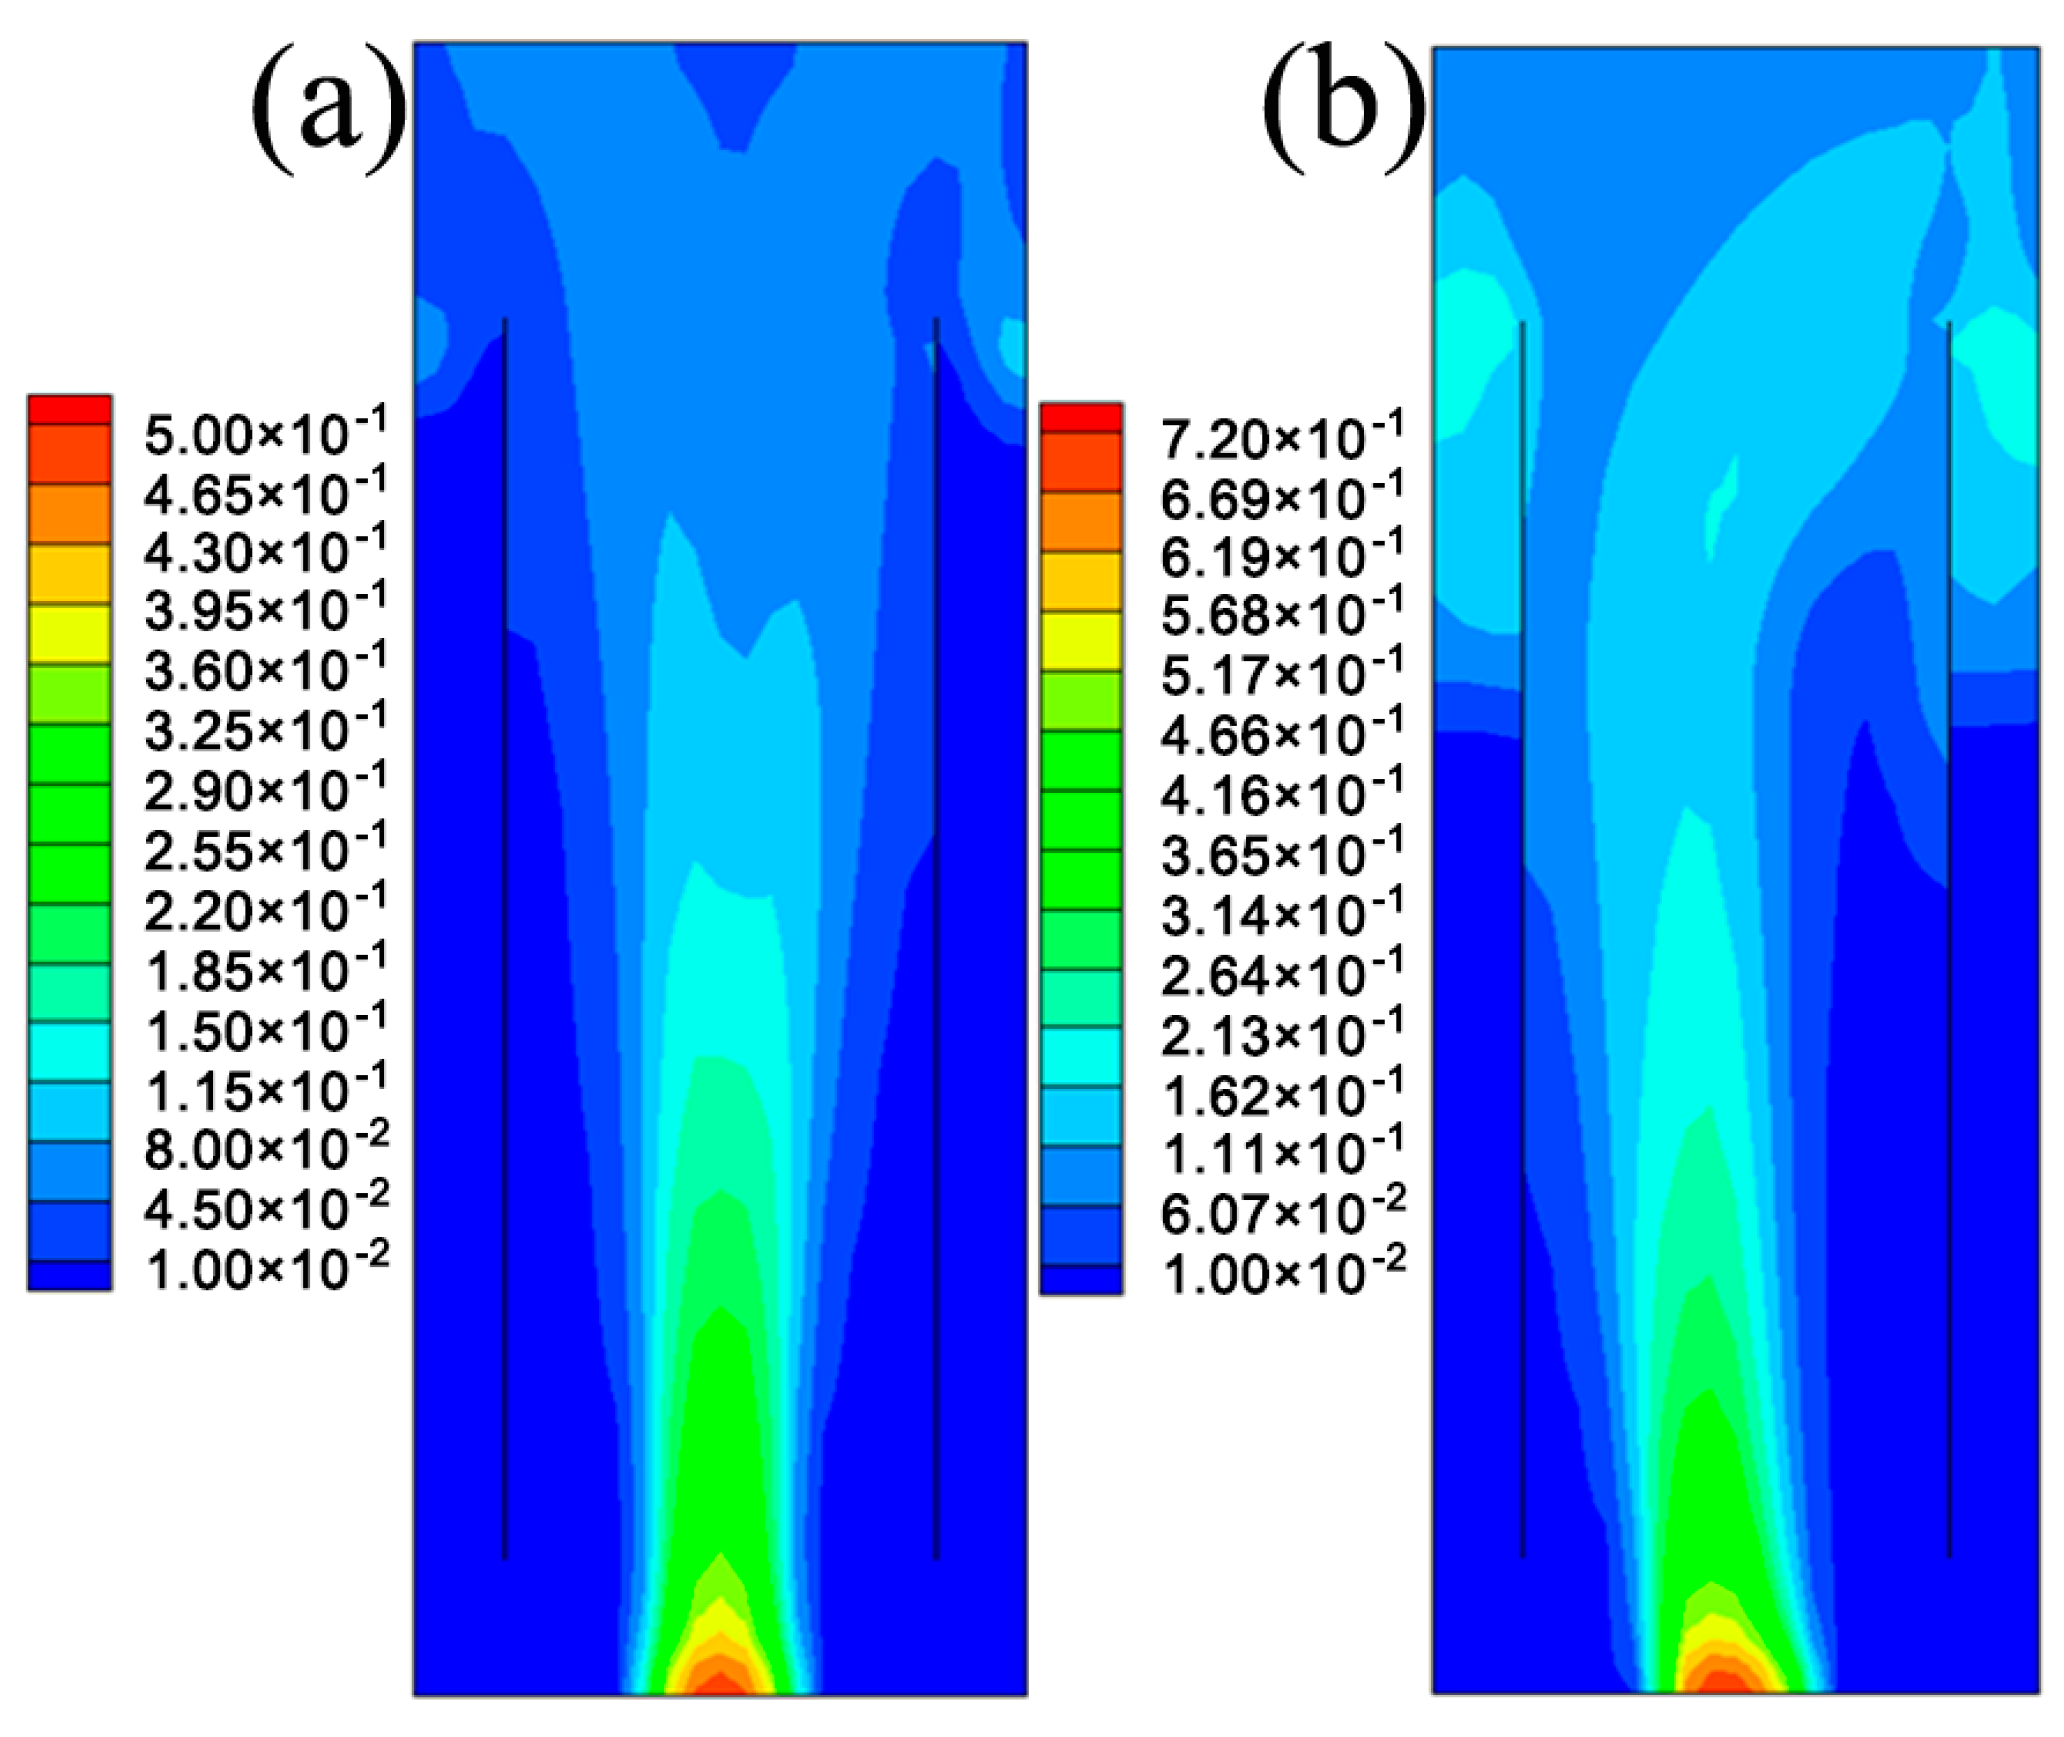
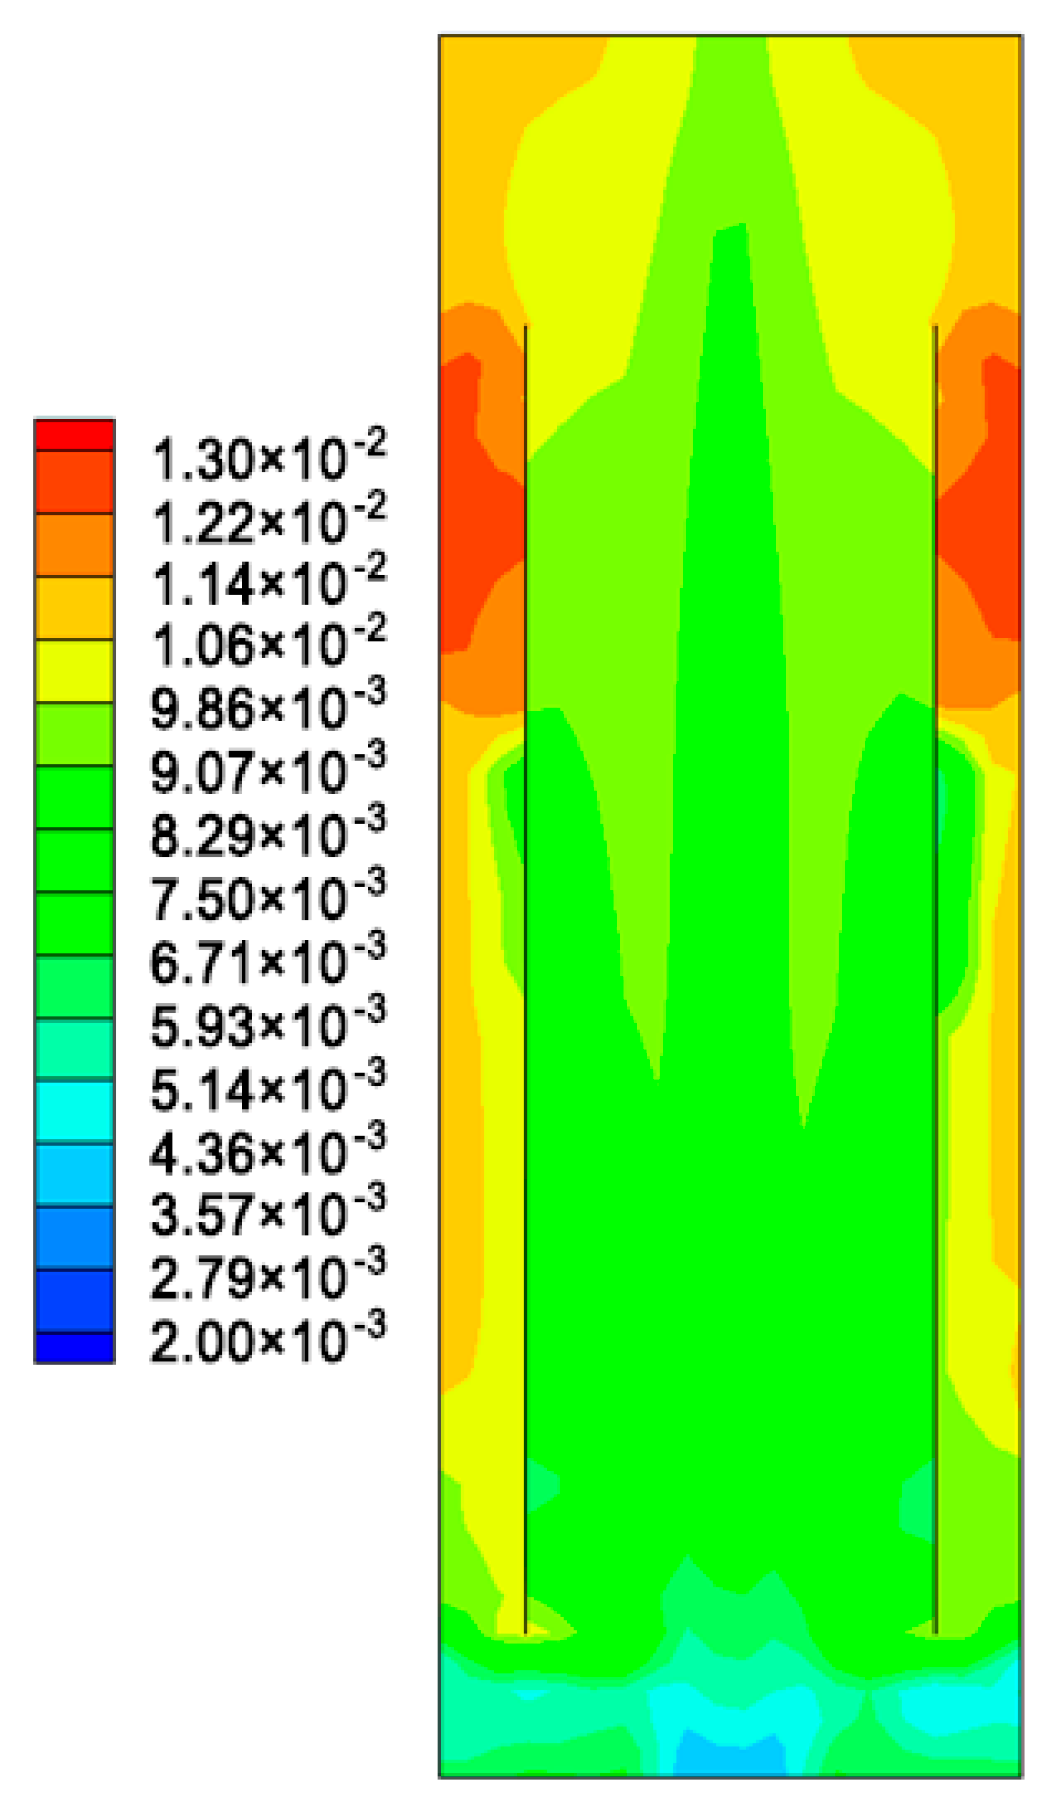
5.1. The Hydrodynamic and Mass Transfer Performance of Rectangle ALR
5.2. Comparison between Different Structures of ALRs
6. Conclusions
Author Contributions
Funding
Data Availability Statement
Conflicts of Interest
References
- Wadaugsorn, K.; Limtrakul, S.; Vatanatham, T.; Ramachandran, P.A. Hydrodynamic behaviors and mixing characteristics in an internal loop airlift reactor based on cfd simulation. Chem. Eng. Res. Des. 2016, 113, 125–139. [Google Scholar] [CrossRef]
- Luo, H.-P.; Al-Dahhan, M.H. Local characteristics of hydrodynamics in draft tube airlift bioreactor. Chem. Eng. Sci. 2008, 63, 3057–3068. [Google Scholar] [CrossRef]
- Wang, X.; Jia, X.; Wen, J. Transient modeling of toluene waste gas biotreatment in a gas–liquid airlift loop reactor. Chem. Eng. J. 2010, 159, 1–10. [Google Scholar] [CrossRef]
- Ansoni, J.L.; Santiago, P.A.; Seleghim, P. Multiobjective optimization of a flat-panel airlift reactor designed by computational fluid dynamics. Chem. Eng. Sci. 2019, 195, 946–957. [Google Scholar] [CrossRef]
- Han, Y.; Zhang, L.; Liu, M.; Niu, J. Numerical simulation of the hydrodynamic behavior and the synchronistic oxidation and reduction in an internal circulation micro-electrolysis reactor. Chem. Eng. J. 2020, 381, 122709. [Google Scholar] [CrossRef]
- Feng, W.; Wen, J.; Jia, X.; Yuan, Q.; Sun, Y.; Liu, C. Modeling for local dynamic behaviors of phenol biodegradation in bubble columns. AIChE J. 2006, 52, 2864–2875. [Google Scholar] [CrossRef]
- Muñoz Sierra, J.D.; Oosterkamp, M.J.; Spanjers, H.; van Lier, J.B. Effects of large salinity fluctuations on an anaerobic membrane bioreactor treating phenolic wastewater. Chem. Eng. J. 2021, 417, 129263. [Google Scholar] [CrossRef]
- Kamali, M.; Aminabhavi, T.M.; Tarelho, L.A.C.; Hellemans, R.; Cuypers, J.; Capela, I.; Costa, M.E.V.; Dewil, R.; Appels, L. Acclimatized activated sludge for enhanced phenolic wastewater treatment using pinewood biochar. Chem. Eng. J. 2022, 427, 131708. [Google Scholar] [CrossRef]
- Patil, S.S.; Jena, H.M. Biodegradation of diethyl phthalate from synthetic wastewater in a batch operated internal loop airlift bioreactor. Int. Biodeterior. Biodegrad. 2019, 143, 104728. [Google Scholar] [CrossRef]
- Livingston, A.G. Biodegradation of 3,4-dichloroaniline in a fluidized bed bioreactor and a steady-state biofilm kinetic model. Biotechnol. Bioeng. 1991, 38, 260–272. [Google Scholar] [CrossRef] [PubMed]
- Gholami, F.; Zinatizadeh, A.A.; Zinadini, S.; McKay, T.; Sibali, L. An innovative jet loop-airlift bioreactor for simultaneous removal of carbon and nitrogen from soft drink industrial wastewater: Process performance and kinetic evaluation. Environ. Technol. Innov. 2020, 19, 100772. [Google Scholar] [CrossRef]
- Feng, W.; Wen, J.; Liu, C.; Yuan, Q.; Jia, X.; Sun, Y. Modeling of local dynamic behavior of phenol degradation in an internal loop airlift bioreactor by yeast candida tropicalis. Biotechnol. Bioeng. 2007, 97, 251–264. [Google Scholar] [CrossRef] [PubMed]
- Wen, J.P.; Chen, Y.; Jia, X.Q.; Mao, G.Z. Removal of toluene from air streams using a gas-liquid-solid three-phase airlift loop bioreactor containing immobilized cells. J. Chem. Technol. Biotechnol. 2006, 81, 17–22. [Google Scholar]
- Šimčík, M.; Mota, A.; Ruzicka, M.C.; Vicente, A.; Teixeira, J. Cfd simulation and experimental measurement of gas holdup and liquid interstitial velocity in internal loop airlift reactor. Chem. Eng. Sci. 2011, 66, 3268–3279. [Google Scholar] [CrossRef]
- Gandhi, A.B.; Gupta, P.P.; Joshi, J.B.; Jayaraman, V.K.; Kulkarni, B.D. Development of unified correlations for volumetric mass-transfer coefficient and effective interfacial area in bubble column reactors for various gas− liquid systems using support vector regression. Ind. Eng. Chem. Res. 2009, 48, 4216–4236. [Google Scholar] [CrossRef]
- Lu, X.; Ding, Y.; Yu, J.; Long, B.; Zheng, X. Experimental study of hydrodynamics and bubble size distribution of an external loop airlift reactor. Can. J. Chem. Eng. 2019, 97, 1685–1693. [Google Scholar] [CrossRef]
- Särkelä, R.; Eerikäinen, T.; Pitkänen, J.-P.; Bankar, S. Mixing efficiency studies in an airlift bioreactor with helical flow promoters for improved reactor performance. Chem. Eng. Process.—Process Intensif. 2019, 137, 80–86. [Google Scholar] [CrossRef]
- Young, M.A.; Carbonell, R.G.; Ollis, D.F. Airlift bioreactors: Analysis of local two-phase hydrodynamics. AIChE J. 1991, 37, 403–428. [Google Scholar] [CrossRef]
- Teli, S.M.; Mathpati, C.S. Experimental and numerical study of gas-liquid flow in a sectionalized external-loop airlift reactor. Chin. J. Chem. Eng. 2021, 32, 39–60. [Google Scholar] [CrossRef]
- Zhong, F.; Xing, Z.; Cao, R.; Liu, Y.; Ma, Y.; Shang, W.; Liang, M.; Mei, X. Flow regimes characteristics of industrial-scale center-rising airlift reactor. Chem. Eng. J. 2022, 430, 133067. [Google Scholar] [CrossRef]
- Huang, Q.; Zhang, W.; Yang, C. Modeling transport phenomena and reactions in a pilot slurry airlift loop reactor for direct coal liquefaction. Chem. Eng. Sci. 2015, 135, 441–451. [Google Scholar] [CrossRef]
- Kouzbour, S.; Stiriba, Y.; Gourich, B.; Vial, C. Cfd simulation and analysis of reactive flow for dissolved manganese removal from drinking water by aeration process using an airlift reactor. J. Water Process Eng. 2020, 36, 101352. [Google Scholar] [CrossRef]
- Mavaddat, P.; Mousavi, S.M.; Amini, E.; Azargoshasb, H.; Shojaosadati, S.A. Modeling and cfd-pbe simulation of an airlift bioreactor for phb production. Asia-Pac. J. Chem. Eng. 2014, 9, 562–573. [Google Scholar] [CrossRef]
- Sun, Z.; Liu, B.; Yuan, X.; Liu, C.; Yu, K. New turbulent model for computational mass transfer and its application to a commercial-scale distillation column. Ind. Eng. Chem. Res. 2005, 44, 4427–4434. [Google Scholar] [CrossRef]
- Li, W.B.; Liu, B.T.; Yu, K.T.; Yuan, X.G. Rigorous model for the simulation of gas adsorption and its verification. Ind. Eng. Chem. Res. 2011, 50, 8361–8370. [Google Scholar] [CrossRef]
- Li, W.; Yu, K.; Liu, B.; Yuan, X. Computational fluid dynamics simulation of hydrodynamics and chemical reaction in a cfb downer. Powder Technol. 2015, 269, 425–436. [Google Scholar] [CrossRef]
- Zhang, C.; Yuan, X.; Luo, Y.; Yu, G. Prediction of species concentration distribution using a rigorous turbulent mass diffusivity model for bubble column reactor simulation part ii: Analogy between turbulent mass and momentum transfer in toluene emissions biodegradation process. Chem. Eng. Sci. 2018, 189, 360–368. [Google Scholar] [CrossRef]
- Huang, Q.S.; Yang, C.; Yu, G.Z.; Mao, Z.S. 3-d simulations of an internal airlift loop reactor using a steady two-fluid model. Chem. Eng. Technol. 2007, 30, 870–879. [Google Scholar] [CrossRef]
- Schiller, L.A.; Naumann, Z. A drag coefficient correlation. Ver. Dtsch. Ing. 1935, 77, 318–320. [Google Scholar]
- Troshko, A.A.; Zdravistch, F. Cfd modeling of slurry bubble column reactors for fisher–tropsch synthesis. Chem. Eng. Sci. 2009, 64, 892–903. [Google Scholar] [CrossRef]
- Zhang, C.; Yuan, X.; Luo, Y.; Yu, G. Prediction of species concentration distribution using a rigorous turbulent mass diffusivity model for bubble column reactor simulation part i: Application to chemisorption process of CO2 into naoh solution. Chem. Eng. Sci. 2018, 184, 161–171. [Google Scholar] [CrossRef]
- Luo, H. Coalescence, Breakup and Liquid Circulation in Bubble Column Reactors. Ph.D. Thesis, University of Trondheim, Trondheim, Norway, 1993. [Google Scholar]
- Luo, H.; Svendsen, H.F. Theoretical model for drop and bubble breakup in turbulent dispersions. AIChE J. 1996, 42, 1225–1233. [Google Scholar] [CrossRef]
- Liu, G.B.; Yu, K.T.; Yuan, X.G.; Liu, C.J. New model for turbulent mass transfer and its application to the simulations of a pilot-scale randomly packed column for CO2−NaOH chemical absorption. Ind. Eng. Chem. Res. 2006, 45, 3220–3229. [Google Scholar] [CrossRef]
- Li, W.; Zhao, X.; Liu, B.; Tang, Z. Mass transfer coefficients for co2 absorption into aqueous ammonia using structured packing. Ind. Eng. Chem. Res. 2014, 53, 6185–6196. [Google Scholar] [CrossRef]
- Jia, X.; Wen, J.; Zhou, H.; Feng, W.; Yuan, Q. Local hydrodynamics modeling of a gas–liquid–solid three-phase bubble column. AIChE J. 2007, 53, 2221–2231. [Google Scholar] [CrossRef]
- Sinha, J.; Bae, J.T.; Park, J.P.; Kim, K.H.; Song, C.H.; Yun, J.W. Changes in morphology of paecilomyces japonica and their effect on broth rheology during production of exo-biopolymers. Appl. Microbiol. Biotechnol. 2001, 56, 88–92. [Google Scholar] [CrossRef]
- Talvy, S.; Cockx, A.; Liné, A. Modeling of oxygen mass transfer in a gas–liquid airlift reactor. AIChE J. 2007, 53, 316–326. [Google Scholar] [CrossRef]


| Type of ALR | Volume-Averaged Gas Holdup | Volume-Averaged Sauter Bubble Size (m) | Volume-Averaged Shear Stress (kg·m−1s−2) |
|---|---|---|---|
| original | 0.053 | 0.0092 | 3.798 |
| novel | 0.073 | 0.0079 | 1.370 |
Disclaimer/Publisher’s Note: The statements, opinions and data contained in all publications are solely those of the individual author(s) and contributor(s) and not of MDPI and/or the editor(s). MDPI and/or the editor(s) disclaim responsibility for any injury to people or property resulting from any ideas, methods, instructions or products referred to in the content. |
© 2023 by the authors. Licensee MDPI, Basel, Switzerland. This article is an open access article distributed under the terms and conditions of the Creative Commons Attribution (CC BY) license (https://creativecommons.org/licenses/by/4.0/).
Share and Cite
Li, L.; Hao, R.; Jin, X.; Hao, Y.; Fu, C.; Zhang, C.; Gu, X. A Turbulent Mass Diffusivity Model for Predicting Species Concentration Distribution in the Biodegradation of Phenol Wastewater in an Airlift Reactor. Processes 2023, 11, 484. https://doi.org/10.3390/pr11020484
Li L, Hao R, Jin X, Hao Y, Fu C, Zhang C, Gu X. A Turbulent Mass Diffusivity Model for Predicting Species Concentration Distribution in the Biodegradation of Phenol Wastewater in an Airlift Reactor. Processes. 2023; 11(2):484. https://doi.org/10.3390/pr11020484
Chicago/Turabian StyleLi, Liang, Runqiu Hao, Xiaoxia Jin, Yachao Hao, Chunming Fu, Chengkai Zhang, and Xihui Gu. 2023. "A Turbulent Mass Diffusivity Model for Predicting Species Concentration Distribution in the Biodegradation of Phenol Wastewater in an Airlift Reactor" Processes 11, no. 2: 484. https://doi.org/10.3390/pr11020484