Abstract
The modified exponentially weighted moving-average (modified EWMA) control chart is an improvement on the traditional EWMA control chart. Herein, we provide more details about the modified EWMA control chart using various values of an additional design parameter for detecting small-to-moderate shifts in the process mean of an autoregressive fractionally integrated (ARFI(p, d)) process with exponential white noise running thereon. The statistical performances of the two charts were evaluated in terms of the average run length (ARL) obtained by solving integral equations (IEs). This provides an exact formula with proven existence and uniqueness verified by applying Banach’s fixed-point theorem. The accuracy of the proposed formula for the ARL was compared with the ARL derived by using the numerical IE technique for the out-of-control state. Although their accuracies were identical for various out-of-control situations and long-term memory processes, the exact formula method required less than 0.01 s to compute the ARL whereas the numerical IE method took 3–4 s. The strengths of using the exact formula are that it is simple to calculate and the computational time is significantly reduced. Comparing their standard deviations of the run length and median run lengths yielded the same results. Finally, practical examples with real-life data corresponding to ARFI(p, d) processes with exponential white noise are provided to demonstrate the applicability of the proposed exact formula.
1. Introduction
One of the primary goals of statistical process control (SPC) is the sensitive identification of an out-of-control situation and the differentiation between two distinct sources of variation in a production process: common and assignable causes. The former is attributable to the inherent variability of a process whereas the latter is attributable to unknown factors that are not inherent in the process. A process operating with only common-cause variation is in control whereas a process with special-cause variation is out of control. Control charts are a vital component of the SPC toolkit and are effective at identifying the assignable cause and special-cause variations. Indeed, it is a highly effective method for identifying and eliminating infrequent process deviations (cf., Montgomery, [1]).
A control chart is a graphical representation of the upper control limit (UCL), the center line (CL), and the lower control limit (LCL). When the plotted statistic falls inside the control limits, the process is stable and in control. Any point that falls outside the control limits indicates that the process is out of control. Therefore, the necessary corrective steps must be implemented to bring the process back into the in-control state. There are two types of control charts: those with no memory and those with memory. The most well-known memoryless control chart is the Shewhart control chart [1], which is based solely on the most current observations and historical data is disregarded. For this reason, it is most effective at detecting large shifts in the process parameter of interest. Numerous studies have been aimed at enhancing the sensitivity and detection capability of the exponentially weighted moving-average (EWMA) control chart [2,3,4,5,6]. The modified EWMA control chart developed by Patel and Divecha [7] is an improvement thereon. Khan et al. [8] presented the modified EWMA control chart in greater depth and published a generalized version of it. Gan [9] introduced three modified EWMA statistics for detecting small shifts in a process parameter, for which the Shewhart control chart is less effective. Patel and Divecha [7] presented the modified EWMA control chart that is effective at detecting small and abrupt shifts in a process parameter. Khan et al. [10] recently developed the modified EWMA statistic to improve its ability to rapidly detect process parameter shifts by including a second parameter. As opposed to the traditional EWMA statistic, the modified one is capable of detecting shifts in the overall mean. Schmid [11] subsequently suggested the modified EWMA control chart for monitoring processes involving time-series data. All of these authors concluded that the modified EWMA control chart is more capable of detecting shifts in a process parameter than the standard EWMA control chart; for more details, refer to ([12,13]).
Herein, we propose a new EWMA control chart using the modified EWMA statistic that is efficient at detecting changes in the mean of underlying time-series processes. Time-series processes involving wind speed, air temperature, air quality, and hydrological data have hyperbolic autocorrelation functions that decrease slowly and are referred to as long-memory processes. Autoregressive fractionally integrated moving-average (ARFIMA(p, d, q)) models with the fractional differencing parameter d are widely used to represent long-range dependent behavior [14,15,16,17]. The ARFIMA model can be simplified to the ARFI model by imposing p, d, q = 0, Although many types of control charts have been used for time-series modeling—see for instance, [18,19,20])—our focus is on detecting changes in the mean of a long-memory ARFI process running on the modified EWMA control chart.
Numerous researchers have investigated the construction of forecasting models using serially correlated observations that have included the modified EWMA control chart. In a time series, the observations can be generated from a seemingly random process. However, especially involving econometric observations, there can be both autoregressive (AR) and/or moving-average (MA) components. Another important thing to consider when building a model is how to measure the errors. Smaller errors indicate a more efficient model. Commonly, normally distributed white noise signifies errors in a time-series model involving autocorrelated data. However, under certain circumstances, white noise can be exponentially distributed. For example, Jacob and Lewis [21] modeled an ordered ARMA(1,1) process by considering that the observations are exponential white noise. Ibazizen and Fellag [22] used Bayesian concepts for an AR(1) process with exponential white noise, while Pereira and Turkman [23] employed exponential white noise in the Bayesian analysis of threshold AR models. Suparman [24] recently developed estimators for the AR model parameters with exponential white noise for cases where the order is unknown.
One-sided problems are important in many fields, such as engineering (loading capacity, tear strength, etc.), environmental science (concentration of particulate matter, ozone level, high tide, etc.), economics, and finance (interest rate, unemployment rate, riskiness of financial assets, etc.), for which we are interested only in the increase (or only in the decrease) in the parameter of interest. The dynamics can be evaluated using the one-sided modified EWMA control chart.
The average run length (ARL) is an important metric used to evaluate the performances of control charts. The in-control ARL (ARL0) is defined as the average number of observations (or monitoring points) before a signal point falls outside the control limits while assuming that the process is in control. In contrast, the out-of-control ARL (ARL1) is the average number of observations that are required before a shift in the mean is detected when the process is out of control: ARL0 should be as large as possible while ARL1 should be as small as possible. There are several techniques for computing the ARL, such as Monte Carlo simulation, Markov chain, Martingale, and numerical integration equations (IEs) based on several quadrature rules (e.g. midpoint, trapezoidal, Simson's rule, and Gauss–Legendre [25]). The exact formula for defining the ARL require solving Fredholm IEs of the second kind [26]. For example, Crowder [27] developed an estimator for the ARL of a Gaussian process running on the standard EWMA control chart using the IE approach. Champ and Rigdon [28] defined the ARL of processes on the CUSUM and EWMA control charts using this method and compared the findings to those obtained using the Markov chain approach. The Fredholm IE of the second kind has been utilized to define the ARL for control charts; see [29,30,31,32,33]). Recently, Silpakob et al. [34] used the Fredholm IE of the second kind to derive the exact formula for the ARL of a process running on the modified EWMA control chart. The key aim of the present study is to derive the by using analytical IE as an exact formula for detecting a change in the mean of an ARFI(p, d) process with exponential white noise running on the modified EWMA control chart
The remainder of the article is outlined as follows: We provide a brief description of the ARFI(p, d) process with exponential white noise and the modified EWMA scheme in Section 2. Additionally, sensitivity analysis of the proposed design to detect changes in the mean of an ARFI(p, d) process with exponential white noise running on the modified EWMA control chart is presented. The analytical and approximated ARLs derived using the exact formula and the numerical IE technique for an ARFI(p, d) process with exponential white noise running on the modified EWMA control chart and the algorithm used to test them are provided in Section 3. Construction of the control limits, the results of the study, and a comparison of the proposed exact formula with existing ones are discussed in Section 4. Section 5 presents the real-life applicability of the proposed exact formula on the modified EWMA and existing charts. Concluding remarks and our future research direction are highlighted in Section 6. Finally, Appendix A, Appendix B and Appendix C show some important derivations used in the study.
2. Preliminaries
Here, we provide brief details about the ARFI(p, d) model with exponential white noise and the modified EWMA scheme.
2.1. The ARFI(p, d) Model
In the process, parameters p and d are non-negative integers denoting the order of the AR process and the degree of fractional differencing, respectively [14,15]. It is a simple form of the model, where and is fractional.
The long-memory process is defined as
where is the i-th AR coefficient, is a constant term for the time series, and the exponential white noise process consists of independent identically distributed (i.i.d) random variables with mean and variance Since can be any real number, is referred to as a backward-shift operator; i.e.,
For a stationary process, is in the range of 0 to 0.5; see for further details McLeod and Hipel [35]. Hence, can be expanded as a binomial series for the powers of the backward-shift operator as follows:
Equations and (2) can be rearranged for a generalized long-memory process running on the modified EWMA control chart as follows:
where are the coefficients for the AR component and the initial values of are 1.
2.2. The Modified EWMA Control Chart
Let be the sequence of a generalized long-memory process with exponential white noise. The modified EWMA statistic (Khan et al. [8]) for detecting small-to-moderate shifts in the process mean can be expressed as the following recursive equation:
where is an additional parameter, represents the current value of the modified EWMA statistic, and denotes the previous value of the modified EWMA statistic given that is the initial value and denotes the previous value of the process. The range of exponential smoothing parameter is . The modified EWMA statistic performs sensitively for small shifts in the process mean and small values of .
Remark 1.
The termof the modified EWMA statistic is set with In addition, the modified EWMA control chart is the same as the Shewhart control chart when
Meanwhile, and are the target mean and variance of , respectively, and Hence, the UCL and LCL of the modified EWMA control chart, respectively, become
where is a positive coefficient that determines the control limit width (the control limit coefficient), and and represent the target mean and standard deviation of process, respectively, when the process is in control. The centerline (CL) of the modified EWMA control chart is the target value (usually the same as ).
Remark 2.
The modified EWMA control chart is the same as the standard EWMA control chart when
2.3. The Design of the Modified EWMA Scheme
Here, the design of the modified EWMA scheme for running an process with exponential white noise is covered.
Let be a sequence of continuous i.i.d. random variables from an exponential distribution with parameter Now, the process is in control when and out of control when The change point models for are as follows:
where change point provides the sequence of for the in-control state () and the out-of-control state Following on from Equation (3), the process can be substituted into Equation (4). Thereby, the modified EWMA statistic in (4) is derived as
where and Accordingly, the proposed modified EWMA statistic becomes
The corresponding stopping time is arrived at if exceeds a given predetermined threshold for the first time; i.e.,
where and denote the LCL and UCL, respectively. For the in-control process, the modified EWMA statistic can be restructured in the error term , where
Subsequently, can be rearranged according to as follows:
Hence, for , the structure of the modified EWMA scheme can now be used for the analytical and approximated ARLs in the following section.
3. Derivation of Analytical and Approximate ARLs for Process with Exponential White Noise on a Modified EWMA Control Chart
In this section, analytical and approximated ARLs are derived as the solution of the IE for a ARFI(p, d) process with exponential white noise on the modified EWMA control chart to detect changes in the process mean. Additionally, this will be used to construct a numerical algorithm in the next part.
To assess the modified EWMA control chart, the stochastic properties of the related stopping time need to be determined. Considering the change point in (6), the ARL can be defined more rigorously with as the expectation for fixed change point Therefore,
Let denote the for an ARFI(p, d) process running on the modified EWMA control chart when the initial value is u defined as
Thus,
Based on the above equation, the integral equation (IE) derived from the Fredholm IE of the second kind can be written in the form:
By solving the IE, the integral variable can be adjusted by setting
Thus, can be reworked as
where Therefore,
In the next step, the IE in Equation is used to calculate the analytical and approximate ARLs for detecting a change in the mean of an ARFI(p, d) process running on the modified EWMA control chart.
3.1. The Analytical ARL Using the Exact Formula
Here, we offer a new alternative to the ARL computation obtained by solving the IE for the ARL of an ARFI(p, d) process running on the modified EWMA control chart.
First, the IE in Equation (10) can be converted by setting new variables as
Subsequently, this equation can be rewritten as
By substituting from Equation (8) into constant we obtain
The details of the calculation are shown in Appendix A.
By using the solution for to solve the IE for in Equation (11), we attain the exact formula for the ARL of an ARFI(p, d) process running on the modified EWMA control chart as
From Equation (13) given we can rearrange the equation as follows:
Finally, the exact formula for the of an ARFI(p, d) process running on the modified EWMA control chart is
This is an easy one-step calculation scheme. The details of the calculation are shown in Appendix B.
In the previous equation, the in-control state occurs when exponential parameter Conversely, the out-of-control state occurs when exponential parameter Hence, ARL1 can be expressed as
The exact ARL in Equation (15) was assessed by using Banach’s fixed-point theorem to verify its existence and uniqueness, the procedure for which is presented in Appendix C.
3.2. The Approximate ARL Based on the Numerical IE
The numerical IE technique was used to verify the accuracy of the analytical ARL derived by using the exact formula. The approximate ARL is derived based on the IE in Equation (9) by applying numerical quadrature rules that can be computed using many methods; see for instance (cf., [25,26]), as cited therein. In this study, we used a composite Simpson’s rule method. The IE in Equation (9) is solved by using a linear equation system on interval [L, H], the length of which is 2m. The weight of each point is determined as follows:
Hence, the numerical IE technique () for the ARL of a change in the mean of an ARFI(p, d) process running on the modified EWMA control chart can be written as
3.3. The Algorithm for Computing the Exact ARL
The Algorithm 1 was used to find the control chart coefficient and result for the ARL.
| Algorithm 1. The exact formula of ARL for a long-memory ARFI (p, d) process on a modified EWMA control chart |
| The algorithmic description of the exact formula for a long-memory ARFI(p, d) process running on a modified EWMA control chart is as follows. |
| Input: |
| Set the values of the model coefficients: |
| Set the values of the model coefficients: |
| Set the parameters for the modified EWMA control chart: = 0.05, 0.10, 0.20; k = 0.0, 0.2, 0.5, 1.0, 2.0 |
| Set the mean: for the in-control ARL0 |
| Set the mean shifts: |
| Output: |
| In-control ARL |
| 1: Solve the ARFI model defined as for a generalized long-memory ARFI(p, d) process with exponential white noise. |
| 2: Determine the values of the process coefficients and the initial values of . |
| 3: Specify for the in-control exponential white noise; i.e., |
| 4: Compute modified EWMA statistic for the long-memory ARFI(p, d) process given in Equation (7). |
| 5: Determine the values of the control chart coefficient for various combinations of and |
| 6: Calculate UCL (H) corresponding to the desired ARL0 by using Equation (15). |
| 7: Execute Steps 2–6 while in control and then calculate the value of corresponding to each combination. |
| Out-of-control ARL |
| 8: Compute ARL1 for shifts in the process mean as given in Equation (16), where H is attained as per steps 6 and 7. |
| 9: Record the computational time for the first out-of-control ARL1 signal. |
| 10: Repeat steps 6–9 and calculate ARL1 corresponding to the specific shift size |
4. Performance Evaluation and Comparison
4.1. Construction of the Control Limits
We calculated UCL (H) based on the exact formula for the in-control process, with process mean according to Equation (15). The pre-specified value of ARL0 was set as 370. The control limits under various combinations of and can be adjusted to match the pre-chosen value of ARL0. For various parameter combinations, we chose 0.05, 0.10, and 0.20 for the modified EWMA control chart. Although the value of can be selected independently of the value of we chose 0.0, 0.02, 0.5, 1.0, 2.0, 1, 0.10, 0.20, 0.15, 0.30, 0.45, and From the results in Table 1, the modified EWMA control chart with 0.05 and 0.2 and the standard EWMA control chart with 0.05 and 0 running an ARFI(1, 0.15) process yielded H = >1.>847423905 and >2.>067005240, respectively. Moreover, the modified EWMA control chart produced a higher value of H irrespective of the value of λ. Moreover, H remained higher for large values of λ and k, compared to lower values of the two parameters. For example, using 0.20 and 2.0 for the ARFI(1, 0.15) process provided H = >5.>252565020 while 0.05 and 0.2, yielded H = >2.>067005240.

Table 1.
The UCL (H) values for the modified EWMA control chart for ARL0 = 370.
4.2. Performance of the Control Charts
All of the computational routines were implemented using the Mathematica program. Since modified EWMA statistic is sensitive to changes in the mean of an ARFI(p, d) process, ARL1 was considered to be the best tool for measuring the control chart’s sensitivity. In the study, denoting changes in the process mean was defined as when was set as 0.01, 0.05, 0.10, 0.50, 1.00, and 3.00, and denotes the in-control process mean. For this task, the shifts in the process mean were set to be small (δ < 1.00) and moderate (1.00 ≤ δ < 3.00) [36].
To compare the performance in terms of ARL1 obtained from using the proposed formula and the numerical IE technique, we set ARL0 = 370 and then calculated ARL1 using Equations (16) and (17), respectively. ARL1 in Equation (17) determined the number of division points as 500. The smaller the ARL1 value, the better the statistical performance.
Furthermore, the performance of the proposed formula was compared with the numerical IE technique in terms of computational time (s) and percentage accuracy expressed as
where and denote the ARL values obtained by using the exact formula and numerical IE techniques, respectively. A value greater than 95% means that the proposed formula provided an ARL1 value close to that for the numerical IE technique, which indicates excellent agreement between them.
The boldface values in Table 2, Table 3, Table 4, Table 5, Table 6 and Table 7 indicate the smallest ARL1 values obtained using the exact formula under various shifts in the mean of the process running on the modified EWMA control chart with various values of when 2.0, except for the ARFI(1, 0.15) process where we used 2.0 and 1.0 under various mean shifts. The main findings from Table 2, Table 3, Table 4, Table 5, Table 6 and Table 7 are as follows:
Table 2.
The ARL1 results using the exact formula and the numerical IE technique for ARFI(1, d) processes running on the modified EWMA control chart with = 0.05.
Table 3.
The ARL1 results using the exact formula and the numerical IE technique for ARFI(1, d) processes running on the modified EWMA control chart with = 0.10.
Table 4.
The ARL1 results using the exact formula and the numerical IE technique for ARFI(1, d) processes running on the modified EWMA control chart with = 0.20.
Table 5.
The ARL1 results using the exact formula and the numerical IE technique for ARFI(2, d) processes running on the modified EWMA control chart with = 0.05.
Table 6.
The ARL1 results using the exact formula and the numerical IE technique for ARFI(2, d) processes running on the modified EWMA control chart with = 0.10.
Table 7.
The ARL1 results using the exact formula and the numerical IE technique for ARFI(2, d) processes running on the modified EWMA control chart with = 0.20.
- The ARL1 values tended to decline rapidly and monotonically as was increased.
- The ARL1 values created by the exact formula were comparable to those approximated by using the numerical IE technique. The percentage accuracy results were around 99% in all cases, meaning that they are in good agreement.
- The computational time to calculate ARL1 using the exact formula (less than 0.001 s) was substantially less than that required by the numerical IE technique (3–4 s) in all cases.
- For all settings of and , the ARL value of the ARFI(1, 0.45) process was shorter than those of the ARFI(1, 0.30) and ARFI(1, 0.15) processes (Figure 1a). The ARFI(2, d) process also yielded similar results to ARFI(1, d), with the ARL of ARFI(2, 0.45) being the shortest (Figure 1b).
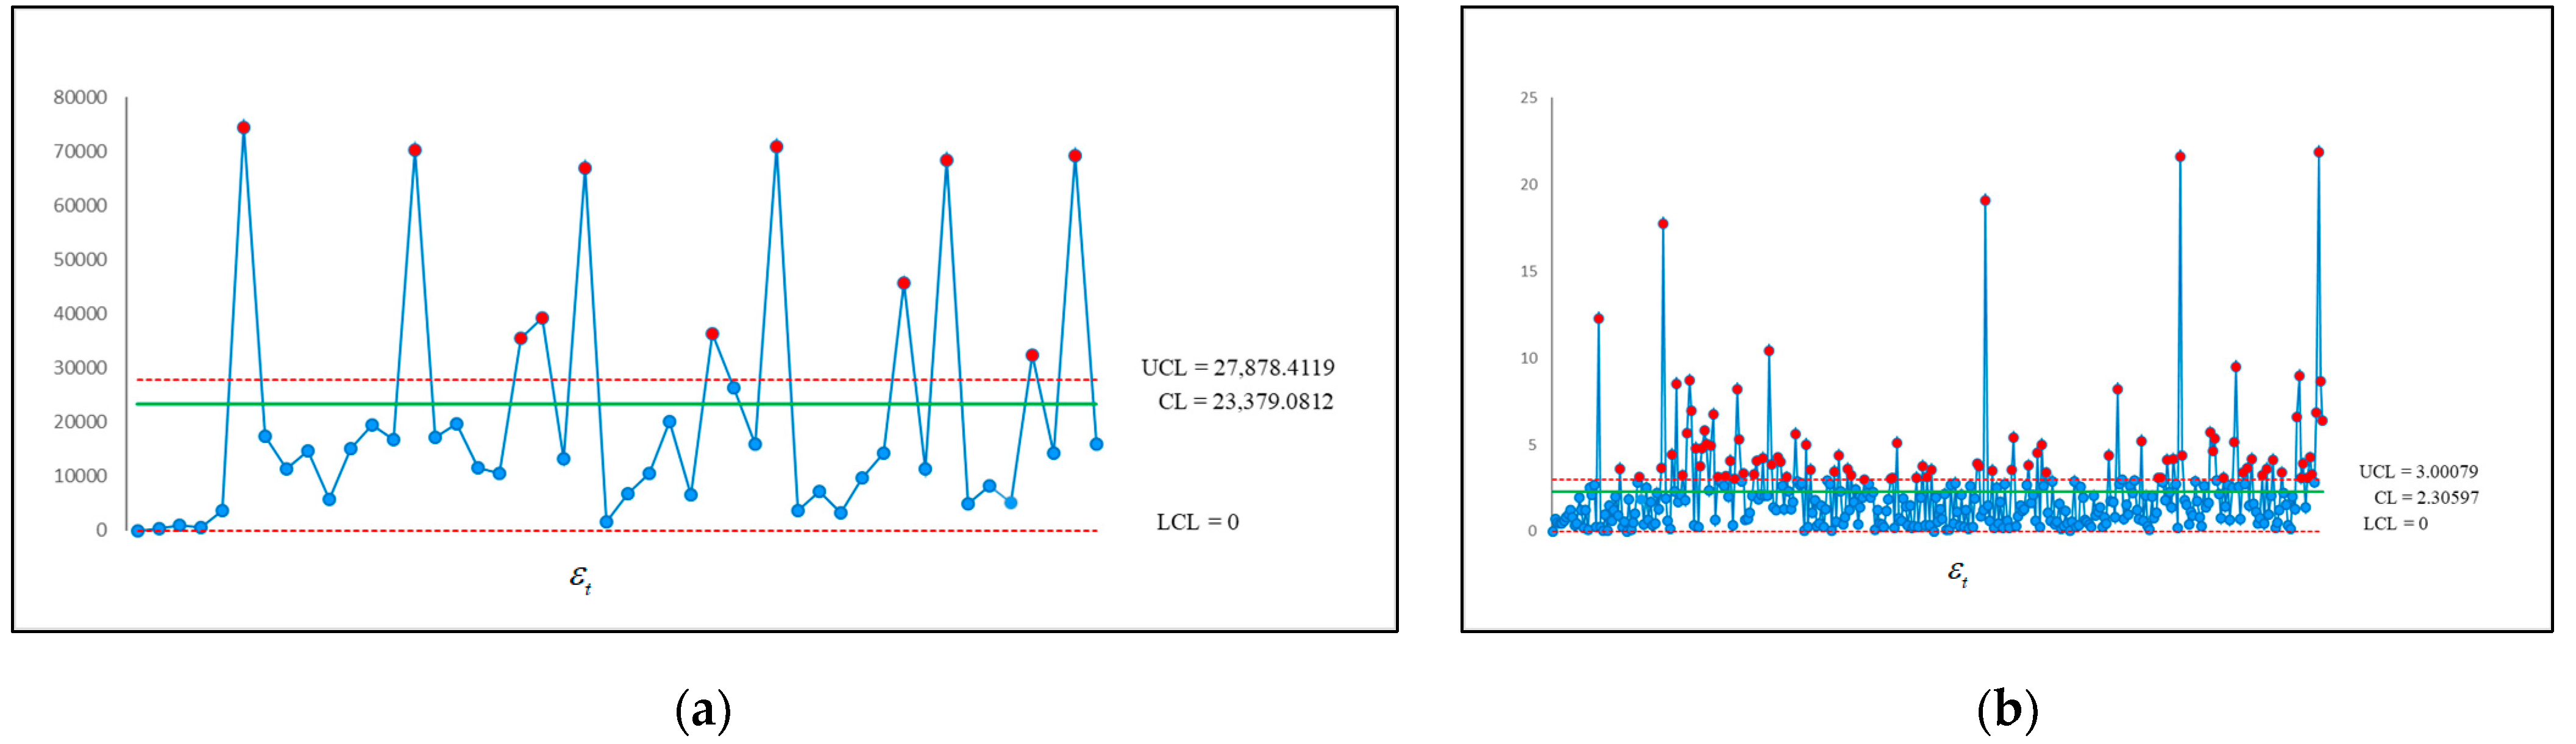
 Figure 1. Graphical displays of the illustrative for the proposed formula running modified EWMA charts applied to the dataset: (a) Application 1; (b) Application 2.
To detect small-to-moderate shifts in the process mean, the modified EWMA control chart with small and large performed better than with large and large Moreover, the modified EWMA control chart performed better than the standard EWMA control chart with various parameters of when for all of the processes tested. Thus, the parameter combination of 0.05 and 2.0 is recommended for practical applications.
In summary, the results show that the exact formula provides a good method for detecting shifts in the mean of an process with exponential white noise running on the modified EWMA control chart. In particular, calculating the ARL is simple and the computational time is significantly reduced.
4.3. Evaluation of the Modified EWMA Control Chart
We compared the performances of the modified EWMA control chart and the standard EWMA control chart. The ARL of the modified control chart was determined using the exact formula. In addition, some other properties of the RL, such as the standard deviation of the run length (SDRL) and the median run length (RML), were also considered [37]. For the modified EWMA control chart, the in-control SDRL and MRL are, respectively, calculated by using
where type 1 error (false alarm) The associated probability of a false alarm is referred to as the false alarm rate (FAR). In our study, a FAR value of 0.0027 provided ARL0370, SDRL0370, AND MRL0. In contrast, the out-of-control ARL, SDRL, and MRL values are, respectively, calculated by using
where the probability of type II error ARL11 is desired for large-size shifts in the process mean. The probabilities of the two types of error are the inverse and vice versa, which is consistent with the technique using the previously proposed formula (cf. Table 1, Table 2, Table 3, Table 4, Table 5, Table 6 and Table 7).
Here, we discuss the performance of the modified EWMA control chart compared to the standard EWMA control chart. The modified EWMA control chart attained smaller ARLs than the standard EWMA control chart. We calculated the ARL values obtained using the exact formula (see Table 1, Table 2, Table 3, Table 4, Table 5, Table 6 and Table 7), , and (see Equations (19) and (20)) for both control charts running the processes given in Table 8. The control chart performance with the lowest provided the best performance. We conclude that the and values were smaller than the values in all cases. Overall, based on the results in Table 2, Table 3, Table 4, Table 5, Table 6 and Table 7, is recommended.
Table 8.
The comparative performances of the standard and modified EWMA control charts for various shift sizes when = 0.05.
For 0.05, we can see that the value of on the modified EWMA control chart was smaller than on the standard EWMA control chart for every value of the shift parameter. Thus, the modified EWMA control chart is more sensitive than the EWMA control chart in detecting small-to-moderate shifts in the mean of long-memory processes.
We noticed that the modified EWMA control chart running the process did have good detection ability for small-to-moderate shifts in the process mean and performed better than with the and processes. In addition, as the value of increased for the processes, so did the ARL1 values of the modified EWMA control chart performed when was small. Finally, for 2 and 0.05, the detection ability of the modified EWMA control chart for small-to-moderate shifts in the mean of processes were very sensitive. Thus, it can be concluded that a small smoothing parameter value is appropriate for detecting smaller-to-moderate shifts in the mean of an process running on the modified EWMA control chart using the exact formula.
5. Application of the Proposed Exact Formula for the ARL
Here, we illustrate the applicability of the proposed formula on two real-life datasets following processes with exponential white noise running on the modified EWMA control chart. The first dataset comprises the incidence of pneumonia in Thailand and the second one comprises the Netflix Inc. stock price. Since time-series modeling decomposes the actual series into fitted values and residuals, we used the Eviews 10 statistical software package to fit and evaluate the parameters of the and models. Thereafter, whether the residuals behaving as white noise were exponentially distributed was tested using the Kolmogorov–Smirnov test in the SPSS software package.
Application 1.
The monthly incidence of pneumonia per 100,000 people from January 2014 until September 2022 was obtained from the Ministry of Public Health in Thailand. The dataset consisting of 105 observations was downloaded from https://hdcservice.moph.go.th accessed on 1 October 2022. The followingmodel was found to be suitable:
whereand AR coefficient
Application 2.
The daily Netflix Inc. (NFLX: NASDAQ) stock price from 17 February 2015 to 25 January 2018 were downloaded from https://www.investing.com/equities/netflix,-inc.-historical-data accessed on 1 October 2022. The dataset consisting of 743 observations was fitted to anmodel as follows:
whereand
In both applications, we used Equation (15) in conjunction with Equations (21) and (22) to compute the UCLs for ARL0 = 370. Initially, we focused on the one-sided upper modified EWMA control chart with an upper control limit (UCL) for detecting shifts in the mean of a process. Previously, researchers have suggested with as appropriate for the modified EWMA control chart. These yield calculations of 27,878.4119 and 3.00079 for the and models, respectively. Moreover, CL = 23,379.0812, LCL = 0 and CL = 2.30598, LCL = 0, respectively, as shown in Figure 1. The ARL performances obtained from using the exact formula and numerical IE technique were compared against SDRL and MRL benchmarks (Table 9). It is noteworthy that although the proposed formula was as accurate as the numerical IE technique for both applications, the computational time using the former was substantially less than using the latter (less than 1 s versus approximately 10 s). Moreover, the ARL1 results using both techniques were similar to those reported in Table 2, Table 3, Table 4, Table 5, Table 6 and Table 7. Similar to the ARL, the SDRL and MRL results also show a decreasing pattern as the shift size was increased for both applications, which is similar to the results in Table 8.
Table 9.
Comparative ARL, SDRL, and MRL performance of EWMA and Modified EWMA charts for various shifts when = 0.05.
The performance of the proposed formula for both applications running on the modified EWMA control chart is graphically presented in Figure 1. In Figure 1a, the control chart triggered the first out-of-control signal for Application 1 at the sixth point, while in Figure 1b, the control chart detected the first out-of-control signal for Application 2 at the 22nd point.
6. Conclusions
Besides the well-established ARL derivations, more performance techniques adopted for the calculation of the analytical ARL of control charts running underlying autocorrelated processes are needed. A reasonable approach is using the exact formula for the ARL Herein, we provided the derivation of the exact formula for the ARL and an algorithm for calculating its value for an process running on the modified EWMA control chart. The exact formula was able to sensitively detect a change in the mean of the process. Furthermore, the formula for the out-of-control ARL (ARL1) is suggested as the best tool for measuring the control chart’s sensitivity to changes in the mean of a process. A performance comparison of the ARL derived by using the exact formula for a process running on the standard EWMA control chart against the modified EWMA control chart shows that the latter was more efficacious. The SDRL and MRL performance measures were found to provide similar results.
Deriving the ARL using the exact formula for an
process running on the modified EWMA control chart is really useful and highly recommended. For long-memory processes, we use the advanced concept of fractional integration when modeling, which has derived from the development of Supharakonsakun et al. [38]. Long-memory processes are found in many fields, such as hydrology or even in economics. An important result of this study is the proposed ARL using the exact formula in this situation which provided the efficacy of the proposed explicit formulas with processes involving real data. In future work, the algorithms for the ARL derived using the exact formula will be implemented as a package freely available for everyone to use. Comparing the modified EWMA control chart with other control charts can also be extended by considering the most desirable control chart parameter settings for processes in future research.
Author Contributions
Conceptualization, W.P. and Y.A.; methodology, W.P. and Y.A.; software, W.P. and Y.A.; validation, Y.A. and W.P.; formal analysis, Y.A.; investigation, W.P.; resources, W.P. and Y.A.; data curation, Y.A.; writing—original draft preparation, W.P.; writing—review and editing, W.P.; visualization, Y.A.; supervision, Y.A.; project administration, W.P. and Y.A.; funding acquisition, Y.A. All authors have read and agreed to the published version of the manuscript.
Funding
This research was funded by National Research Council of Thailand (NRCT) and King Mongkut’s University of Technology North Bangkok with contact no. N42A650318.
Data Availability Statement
Data in this paper are available from the corresponding author upon request.
Acknowledgments
The authors are deeply thankful to the editor and reviewers for their valuable suggestions to improve the quality of this manuscript.
Conflicts of Interest
The authors declare no conflict of interest.
Appendix A
Show the calculation of the constant of IE.
Therefore, the solution is completed.
Appendix B
Show the calculation in addition to (15).
where Therefore, the solution is complete.
Appendix C
Show the proof of the existence and uniqueness of the exact ARL in Equation (15) running on a modified EWMA scheme of the long-memory ARFI (p, d) process.
Proof. (Existence).
For proving Banach’s fixed point theorem [39], let be a set of all continuous functions on the interval Define the sequence of iterations for by fixing some point such that Then, orbit is a Cauchy sequence of IE, since is a contraction mapping, Then
continuing inductively give
By applying the triangle inequality and the properties of sums, for we have
if as Thereby, is a Cauchy and has a limit , which is a fixed point on by completeness. The contraction maps are continuous as follows:
Thus, the proof of existence is complete. □
Proof. (Uniqueness).
We first show that the operator
is the contraction mapping for two arbitrary functions on a complete metric space then we apply the inequality which is proven as follows:
where is a positive constant. Therefore, is a contraction mapping in complete metric space Hence, by Banach’s fixed point theorem, the uniqueness of the exact ARL such that is confirmed, as desired. □
References
- Montgomery, D.C. Introduction to Statistical Quality Control Case Study; Wiley: New York, NY, USA, 2008. [Google Scholar]
- Roberts, S.W. Control Chart Tests Based on Geometric Moving Averages. Technometrics 1959, 42, 239–250. [Google Scholar] [CrossRef]
- Crowder, S. Design of Exponentially Weighted Moving Average Schemes. Int. J. Qual. Eng. Tech. 1989, 21, 155–162. [Google Scholar] [CrossRef]
- Hsoon, N.G.C.; Case, K.E. Development and evaluation of control charts using exponentially weighted moving averages. J. Qual. Technol. 1989, 21, 242–250. [Google Scholar]
- Lucas, J.M.; Saccucci, M.S. The exponentially weighted moving average control schemes: Properties and enhancements (with discussion). Technimetrics 1990, 32, 23–26. [Google Scholar] [CrossRef]
- Riaz, M.; Ahmad, S.; Mahmood, T.; Abbas, N. On Reassessment of the HWMA Chart for Process Monitoring. Processes 2022, 10, 1129. [Google Scholar] [CrossRef]
- Patel, A.K.; Divecha, J. Modified exponentially weighted moving average (EWMA) control chart for an analytical process data. J. Chem. Eng. Mater. Sci. 2011, 2, 12–20. [Google Scholar]
- Khan, N.; Aslam, M.; Jun, C.H. Design of a control chart using a modified EWMA statistic. Qual. Reliab. Eng. Int. 2017, 33, 1095–1104. [Google Scholar] [CrossRef]
- Gan, F.F. Monitoring Poisson observations using modified exponentially weighted moving average control charts. Commun. Stat.-Simul. Comput. 1993, 19, 103–124. [Google Scholar] [CrossRef]
- Khan, N.; Yasmin, T.; Aslam, M.; Jun, C.H. On the performance of modified EWMA charts using resampling schemes. Oper. Res. Decis. 2018, 28, 29–43. [Google Scholar]
- Schmid, W. On EWMA charts for time series. Front. Stat. Qual. Control. 1997, 5, 115–137. [Google Scholar]
- Herdiani, E.T.; Fandrilla, G.; Sunusi, N. Modified Exponential Weighted Moving Average (EWMA) Control Chart on Autocorrelation Data. J. Phys. Conf. Ser. 2018, 979, 012097. [Google Scholar] [CrossRef]
- Lampreia, S.P.G.F.S.; Requeijo, J.F.G.; Dias, J.A.M.; Vairinhos, V.M.; Barbosa, P.I.S. Condition monitoring based on modified CUSUM and EWMA control charts. J. Qual. Maint. Eng. 2018, 24, 119–132. [Google Scholar] [CrossRef]
- Granger, C.W.J.; Joyeux, R. An introduction to long-range time series models and fractional differencing. J. Time Ser. Anal. 1980, 1, 15–30. [Google Scholar] [CrossRef]
- Hosking, J.R.M. Fractional differencing. Biometrika 1981, 68, 165–176. [Google Scholar] [CrossRef]
- Palma, W. Long-Memory Time Series: Theory and Methods; Wiley: New York, NY, USA, 2007. [Google Scholar]
- Beran, J.; Feng, Y.; Ghosh, S.; Kulik, R. Long-Memory Processes—Probabilistic Properties and Statistical Methods; Springer: Berlin/Heidelberg, Germany, 2013. [Google Scholar]
- Ramjee, R.; Crato, N.; Ray, B.K. A note on moving average forecasts of long memory processes with an application to quality control. Int. J. Forecast. 2002, 18, 291–297. [Google Scholar] [CrossRef]
- Rabyk, L.; Schmid, W. EWMA control charts for detecting changes in the mean of a long-memory process. Metrika 2016, 79, 267–301. [Google Scholar] [CrossRef]
- Okhrin, Y.; Schmid, W. Stochastic inequalities for the run length of the EWMA chart for long-memory processes. Revstat. Stat. J. 2019, 17, 67–90. [Google Scholar]
- Jacobs, P.A.; Lewis, P.A.W. A mixed autoregressive-moving average exponential sequence and point process (EARMA 1,1). Adv. Appl. Probab. 1977, 9, 87–104. [Google Scholar] [CrossRef]
- Ibazizen, M.; Fellag, H. Bayesian estimation of an AR(1) process with exponential white noise. J. Theor. Appl. Stat. 2003, 37, 365–372. [Google Scholar] [CrossRef]
- Pereira, I.M.S.; Turkman, M.A.A. Bayesian prediction in threshold autoregressive models with exponential white noise. Soc. Estad. Investig. Oper. Test 2004, 13, 45–64. [Google Scholar] [CrossRef]
- Suparman, S. A new estimation procedure using a reversible jump MCMC algorithm for AR models of exponential white noise. Int. J. GEOMATE 2018, 15, 85–91. [Google Scholar]
- Paichit, P.; Peerajit, W. The average run length for continuous distribution process mean shift detection on a modified EWMA control chart. Asia-Pac. J. Sci. Technol. 2022, 27, 109–118. [Google Scholar]
- Peerajit, W. Cumulative Sum Control Chart Applied to Monitor Shifts in the Mean of a Long-memory ARFIMAX(p, d*, q, r) Process with Exponential White Noise. Thail. Stat. 2022, 20, 144–161. [Google Scholar]
- Crowder, S. A simple method for studying run length distributions of exponentially weighted moving average charts. Technometrics 1987, 29, 401–407. [Google Scholar]
- Champ, C.W.; Rigdon, S.E. A comparison of the markov chain and the integral equation approaches for evaluating the run length distribution of quality control charts. Commun. Stat.-Simul. Comput. 1991, 20, 191–204. [Google Scholar] [CrossRef]
- Phanyaem, S.; Areepong, Y.; Sukparungsee, S. Explicit formulas of average run length for ARMA(1, 1) process of CUSUM control chart. Far East J. Appl. Math. 2014, 90, 211–224. [Google Scholar]
- Sunthornwat, R.; Areepong, Y. Average run length on CUSUM control chart for seasonal and non-seasonal moving average processes with exogenous variables. Symmetry 2020, 12, 173\. [Google Scholar] [CrossRef]
- Phanthuna, P.; Areepong, Y.; Sukparungsee, S. Run length distribution for a modified EWMA scheme fitted with a stationary AR(p) model. Commun. Stat.-Simul. Comput. 2021. [Google Scholar] [CrossRef]
- Areepong, Y.; Peerajit, W. Integral equation solutions for the average run length for monitoring shifts in the mean of a generalized seasonal ARFIMAX(P, D, Q, r)s process running on a CUSUM control chart. PLoS ONE 2022, 17, e0264283. [Google Scholar] [CrossRef]
- Phanthuna, P.; Areepong, Y. Detection Sensitivity of a Modified EWMA Control Chart with a Time Series Model with Fractionality and Integration. Emerg. Sci. J. 2022, 6, 1134–1152. [Google Scholar] [CrossRef]
- Silpakob, K.; Areepong, Y.; Sukparungsee, S.; Sunthornwat, R. A New Modified EWMA Control Chart for Monitoring Processes Involving Autocorrelated Data. Intell. Autom. Soft Comput. 2023, 36, 218–298. [Google Scholar] [CrossRef]
- Mcleod, I.; Hipel, K.W. Simulation Procedures for Box-Jenkins Models. Water Resour. Res. 1978, 14, 969–975. [Google Scholar] [CrossRef]
- Aning, R.O.; Abbasi, S.A.; Riaz, M. Monitoring of serially correlated processes using residual control charts. Sci. Iran. 2017, 24, 1603–1614. [Google Scholar]
- Fonseca, A.; Ferreira, P.H.; Nascimento, D.C.; Fiaccone, R.; Correa, C.U.; Piña, A.G.; Louzada, F. Water Particles Monitoring in the Atacama Desert: SPC Approach Based on Proportional Data. Axioms 2021, 10, 154. [Google Scholar] [CrossRef]
- Supharakonsakun, Y.; Areepong, Y.; Sukparungsee, S. The Performance of a Modified EWMA Control Chart for Monitoring Autocorrelated PM2.5 and Carbon Monoxide Air Pollution Data. PeerJ 2020, 8, e10467. [Google Scholar]
- Sofonea, M.; Han, W.; Shillor, M. Analysis and Approximation of Contact Problems with Adhesion or Damage; Chapman and Hall/CRC: New York, NY, USA, 2005. [Google Scholar]
Disclaimer/Publisher’s Note: The statements, opinions and data contained in all publications are solely those of the individual author(s) and contributor(s) and not of MDPI and/or the editor(s). MDPI and/or the editor(s) disclaim responsibility for any injury to people or property resulting from any ideas, methods, instructions or products referred to in the content. |
© 2023 by the authors. Licensee MDPI, Basel, Switzerland. This article is an open access article distributed under the terms and conditions of the Creative Commons Attribution (CC BY) license (https://creativecommons.org/licenses/by/4.0/).