Article

Leakage Characteristics of Proportional Directional Valve

Faculty of Mechanical Engineering, Department of Hydromechanics and Hydraulic Equipment, VSB-Technical University of Ostrava, 17. Listopadu 2172/15, 708 00 Ostrava-Poruba, Czech Republic
*
Author to whom correspondence should be addressed.
Processes 2023, 11(2), 512; https://doi.org/10.3390/pr11020512
Submission received: 20 January 2023 / Revised: 31 January 2023 / Accepted: 6 February 2023 / Published: 8 February 2023

Abstract

:
This paper deals with the analysis of leakage characteristics of the proportional directional valve. These characteristics distinguish a real directional valve from an ideal one. The ideal directional valve is characterized by zero leakage due to its perfect geometry. The investigated element is the three-position four-way proportional directional valve with zero spool lap and feedback from the spool position. The spool position is measured by the inductive position sensor and processed by external electronics. Internal leakage occurs due to axial and radial clearances between the spool and the sleeve. The magnitude of axial clearances that occur at throttle edges and their effect on the directional valve leakage is the subject of research. The blocked-line pressure sensitivity curve, the leakage flow curve and the center flow curve are determined by experiment. Individual characteristics are determined for different working fluid temperatures and different supply pressures. The flow through internal leaks in the center position of the valve spool is determined by analytical calculations. The flow through internal leaks is also simulated using the Ansys Fluent software. Subsequently, the geometry of the flow simulation model is modified to take into account manufacturing tolerances. From simulation results, the effect of the manufacturing tolerance magnitude on the internal leakage of the directional valve is evaluated. Finally, simulated dependencies are compared with experimentally determined characteristics.

1. Introduction

Proportional directional valves allow continuous control of the magnitude and direction of flow in hydraulic systems. In industrial applications, they are used to control hydraulic motors [1,2,3]. From the point of view of control element design, we distinguish between spool and poppet valves. Poppet valves ensure a perfect seal in certain direction of fluid flow. In the case of the spool valve, due to manufacturing inaccuracies and the need for good sliding properties, leaks occur between the spool and the sleeve. These leaks result in internal fluid leakage [4,5,6,7]. Fluid leakage is undesirable but inevitable. In many spool valve applications, internal leakage is an important factor affecting the design of hydraulic systems. Internal fluid leakage can cause energy losses in the hydraulic system or unwanted movement of the unloaded hydraulic motor [8]. The amount of internal fluid leakage between the spool and the sleeve is influenced by the radial clearance and the type of spool overlap [9,10]. The magnitude and the type of the spool lap may vary depending on the required function of the hydraulic system [11,12]. The actual dimensions of the radial clearance and functional surfaces of the spool depend mainly on the precision of the manufacturing process. The same applies to the spool overlap in the axial direction. The magnitude of internal leakage can also be affected by surface topography errors, which include roughness, corrugation and shape error. These errors lead to an irregular gap field between the spool and the sleeve [13]. Radial clearance also results in radial forces that adversely affect spool dynamics [14]. In the case of the spool valve, adhesive and abrasive wear of functional surfaces and edges occurs during use. This wear causes progressively larger leaks and can lead to failure of the hydraulic system [15,16,17]. There are several expert studies dealing with the analysis of internal leakage rates by analyzing acoustic emission signals. This technique can be used to achieve non-destructive real-time testing of valve internal leakage without the need to disassemble or disconnect the valve [18]. Another factor influencing internal leakage may be thermal deformation of valve flow orifices caused by viscous heating [19]. Although manufacturing inaccuracies are on the order of a few microns, this can significantly affect the behavior of the valve in the center position area of the spool. The analysis of leakage characteristics in this paper is performed as part of extensive research. This extensive research focuses on the development of a complex 1D mathematical model of a selected directional valve with zero spool lap. In this complex mathematical model, both the dynamics of the spool and static properties of the directional valve are included. Static properties of the directional valve are also affected by leakage due to internal leaks. Results of this research are then used to define the mathematical model with the possibility of parameterization.

2. Experimental and Analytical Methods

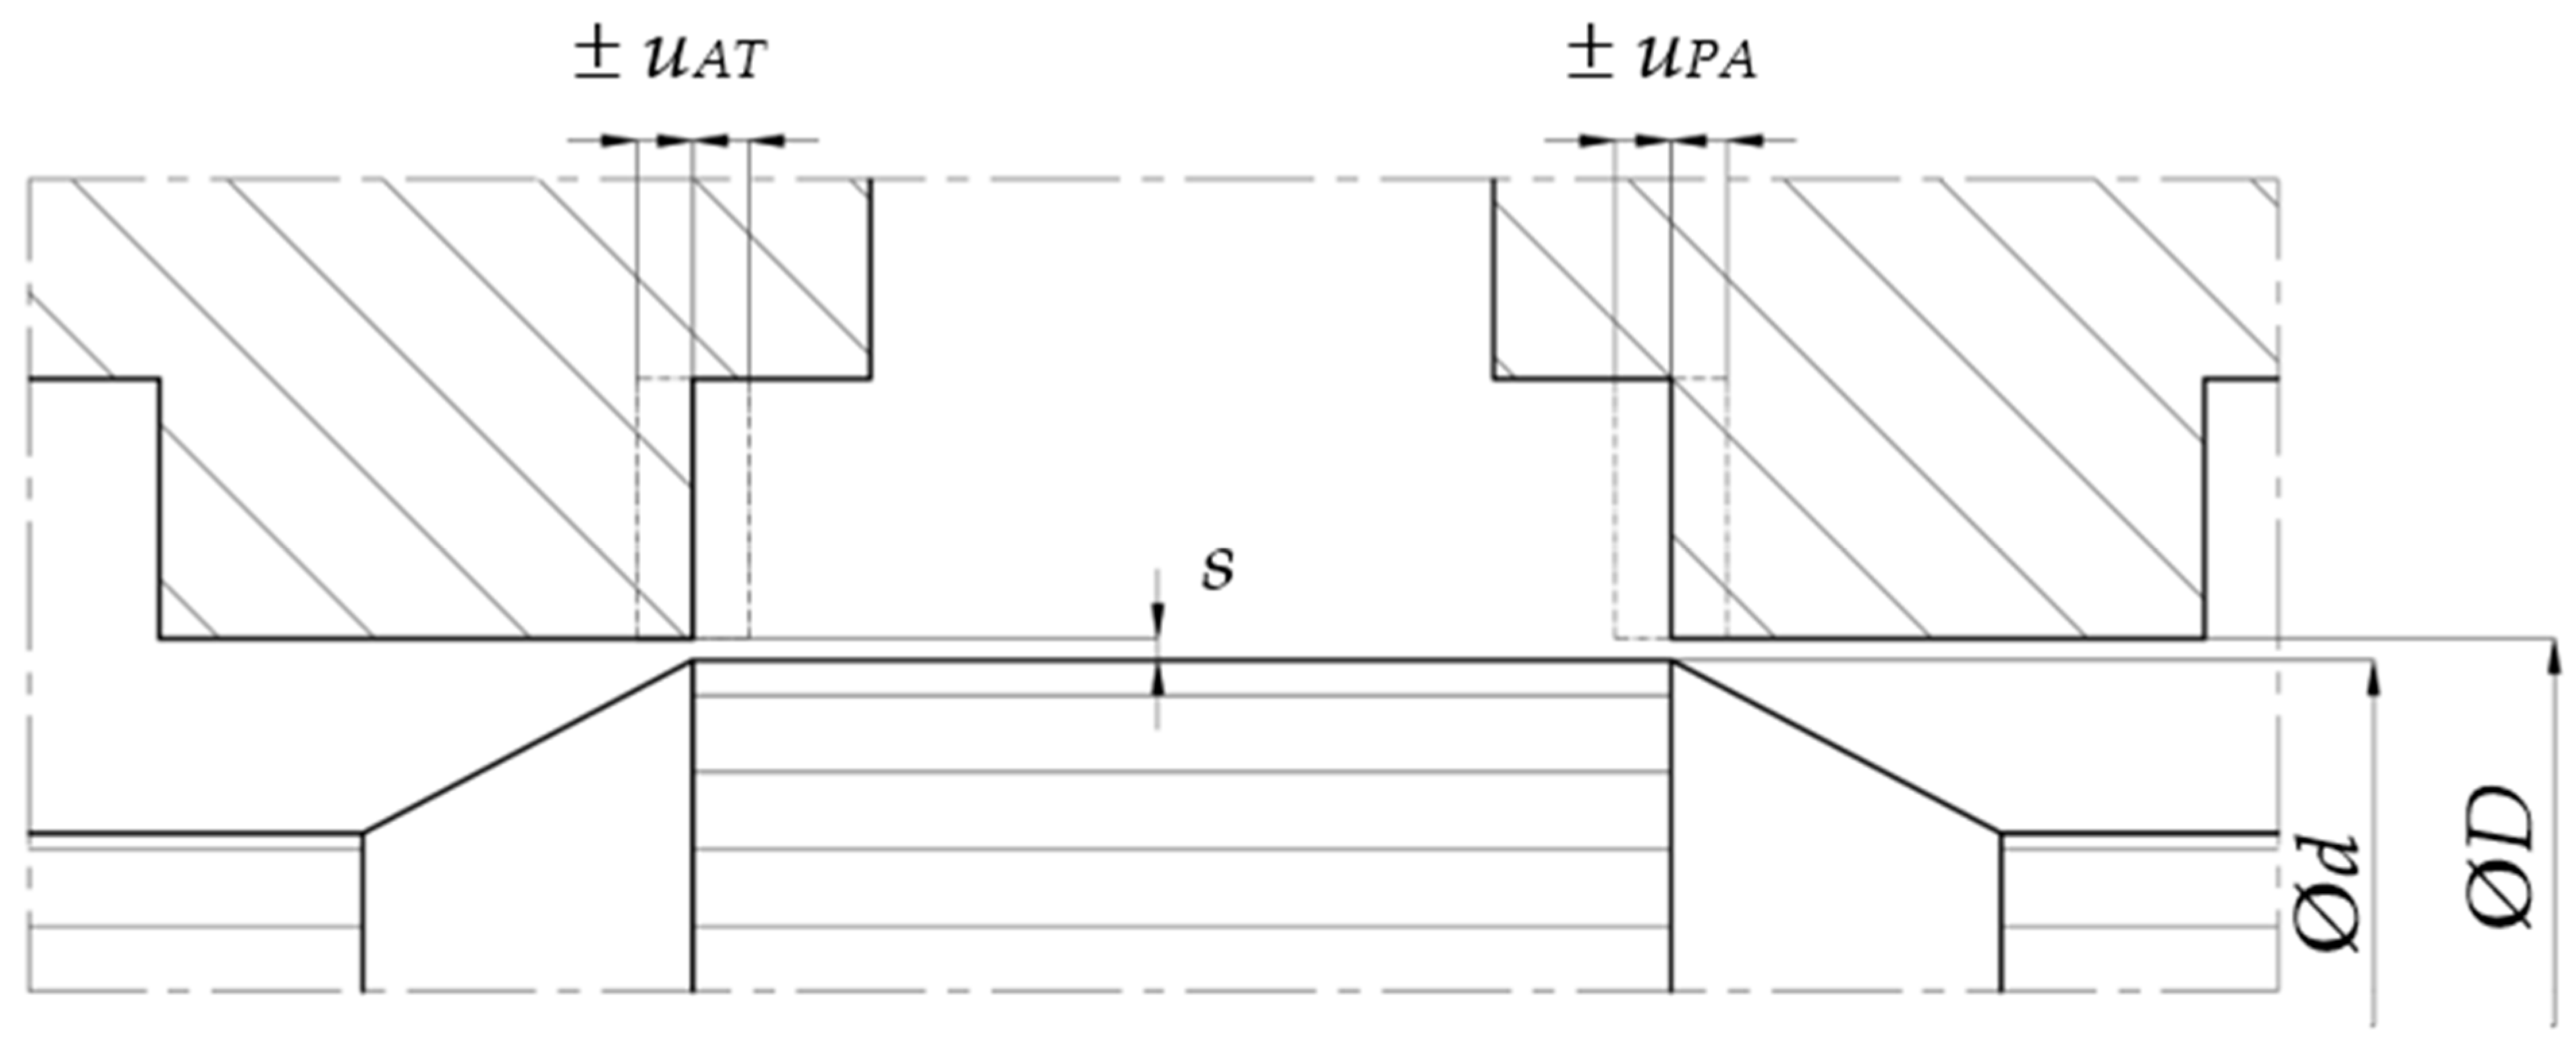
2.1. General Valve Analysis

The investigated element is the proportional directional valve PRL2-06-32-0-24 from Argo Hytos. This directional valve is mainly used for continuous control of hydraulic cylinders or rotary hydraulic motors. Furthermore, the directional valve can also be used for continuous pressure control depending on the control signal as a pilot valve. It is a directly controlled, three-position, four-way directional valve with a zero spool lap. The valve spool is in the sharp-edged design and is characterized by an almost linear dependence of the flow rate on the control signal. The control part of the directional valve consists of a linear motor. The armature of the linear motor is firmly connected to the spool. The direct control of the valve spool increases the dynamics of the directional valve with minimal dependence on the operating pressure. The directional valve also includes a built-in inductive spool position sensor. Feedback from the spool position ensures higher accuracy of the directional valve [20].
The flow is controlled in the above mentioned spool valve by four pairs of throttle edges: PA, PB, BT, AT. Depending on the magnitude and direction of the spool stroke, flow areas on each of the throttle edges change. Equations for calculating the flow through throttle edges of spool over the entire spool stroke range are given below. The index used in equations below, i = 1, 2, 3, 4, corresponds to the given throttle edge, see Figure 1.
Equation (1) can be used to determine the flow through throttle edges PA and BT (for x < 0) or PB and AT (for x > 0) when the spool is deflected from the center position [21]:
Q O i = C D A i 2 ρ Δ p i ,
where CD is the discharge coefficient, A is the flow area, ρ is the fluid density, and Δp is the pressure drop across throttle edges. The flow area A is formed by the shell of a truncated cone and is dependent on the spool stroke x. This equation is used to analytically calculate the center flow rate for specified underlap tolerance.
When the valve spool is deflected from the center position, throttle edges are overlapped at PB and AT (for x < 0) or PA and BT (for x > 0) and a narrow annular gap is created between the spool and the sleeve due to radial clearance. In this case, we consider the flow as laminar and can use Equation (2) to calculate the flow rate. In the case where we consider an eccentrically placed spool in the sleeve, we can use the modified Equation (3) [21,22]:
Q G i = π   D s 3 12   η   l Δ p i ,
Q G e i = π   D   s 3 12   η   l ( 1 + 1.5 ε 2 ) Δ p i ,
where D is the sleeve diameter, s is the radial clearance, η is the dynamic viscosity, l is the length of the narrow annular gap, Δp is the pressure drop across the narrow annular gap, and ε is the spool fit eccentricity. Equation (2) is used to analytically calculate the center flow rate for specified overlap tolerance. The length of the narrow annular gap is given by Equation (4) [21]:
l = x ± u i ,
where x is the spool stroke and u is the edge overlap magnitude.
If the spool is in the center position, the leakage is only due to radial clearance. Equation (5) can be used to calculate the center flow rate [22,23]:
Q C i = π   w   s 2 32   η Δ p i ,
where s is the radial clearance, η is the dynamic viscosity, w is the width of the rectangular slit and Δp the pressure drop across the throttle edge. For the spool valve, the value of width w is equal to the area gradient. This equation is used to analytically calculate the center flow rate for ideal zero spool lap.
Figure 1 shows the flow through the spool valve with zero spool lap and blocked load ports. The spool is centered in the middle position. The flow analysis for each throttle edge and the spool stroke is shown in Table 1.
For the spool valve, there are several critical dimensions that are important for its proper operation. These dimensions include the axial and radial clearance between the spool and the sleeve (see Figure 2). For high-performance valves, these dimensions are strictly tolerated. In the case of axial tolerance, the range is uAT = uPA = (−2.54–2.54) μm or lower. In some case, a tolerance of uAT = uPA = (−7.62–7.62) μm may be acceptable for less powerful valves [23]. These tolerances significantly affect the leakage and the pressure sensitivity around the center position. The diameter of the spool d and the diameter of the sleeve D were determined using the coordinate-measuring machine Wenzel LH 65. The radial clearance s = 3 μm between the spool and the sleeve was determined. The magnitude of leakage due to axial clearances that occur at throttle edges is the subject of research. Ideally, the axial clearance is zero for zero spool lap. In reality, there is either positive or negative spool lap. The specific value of the overlap is affected by the deviation created during production.

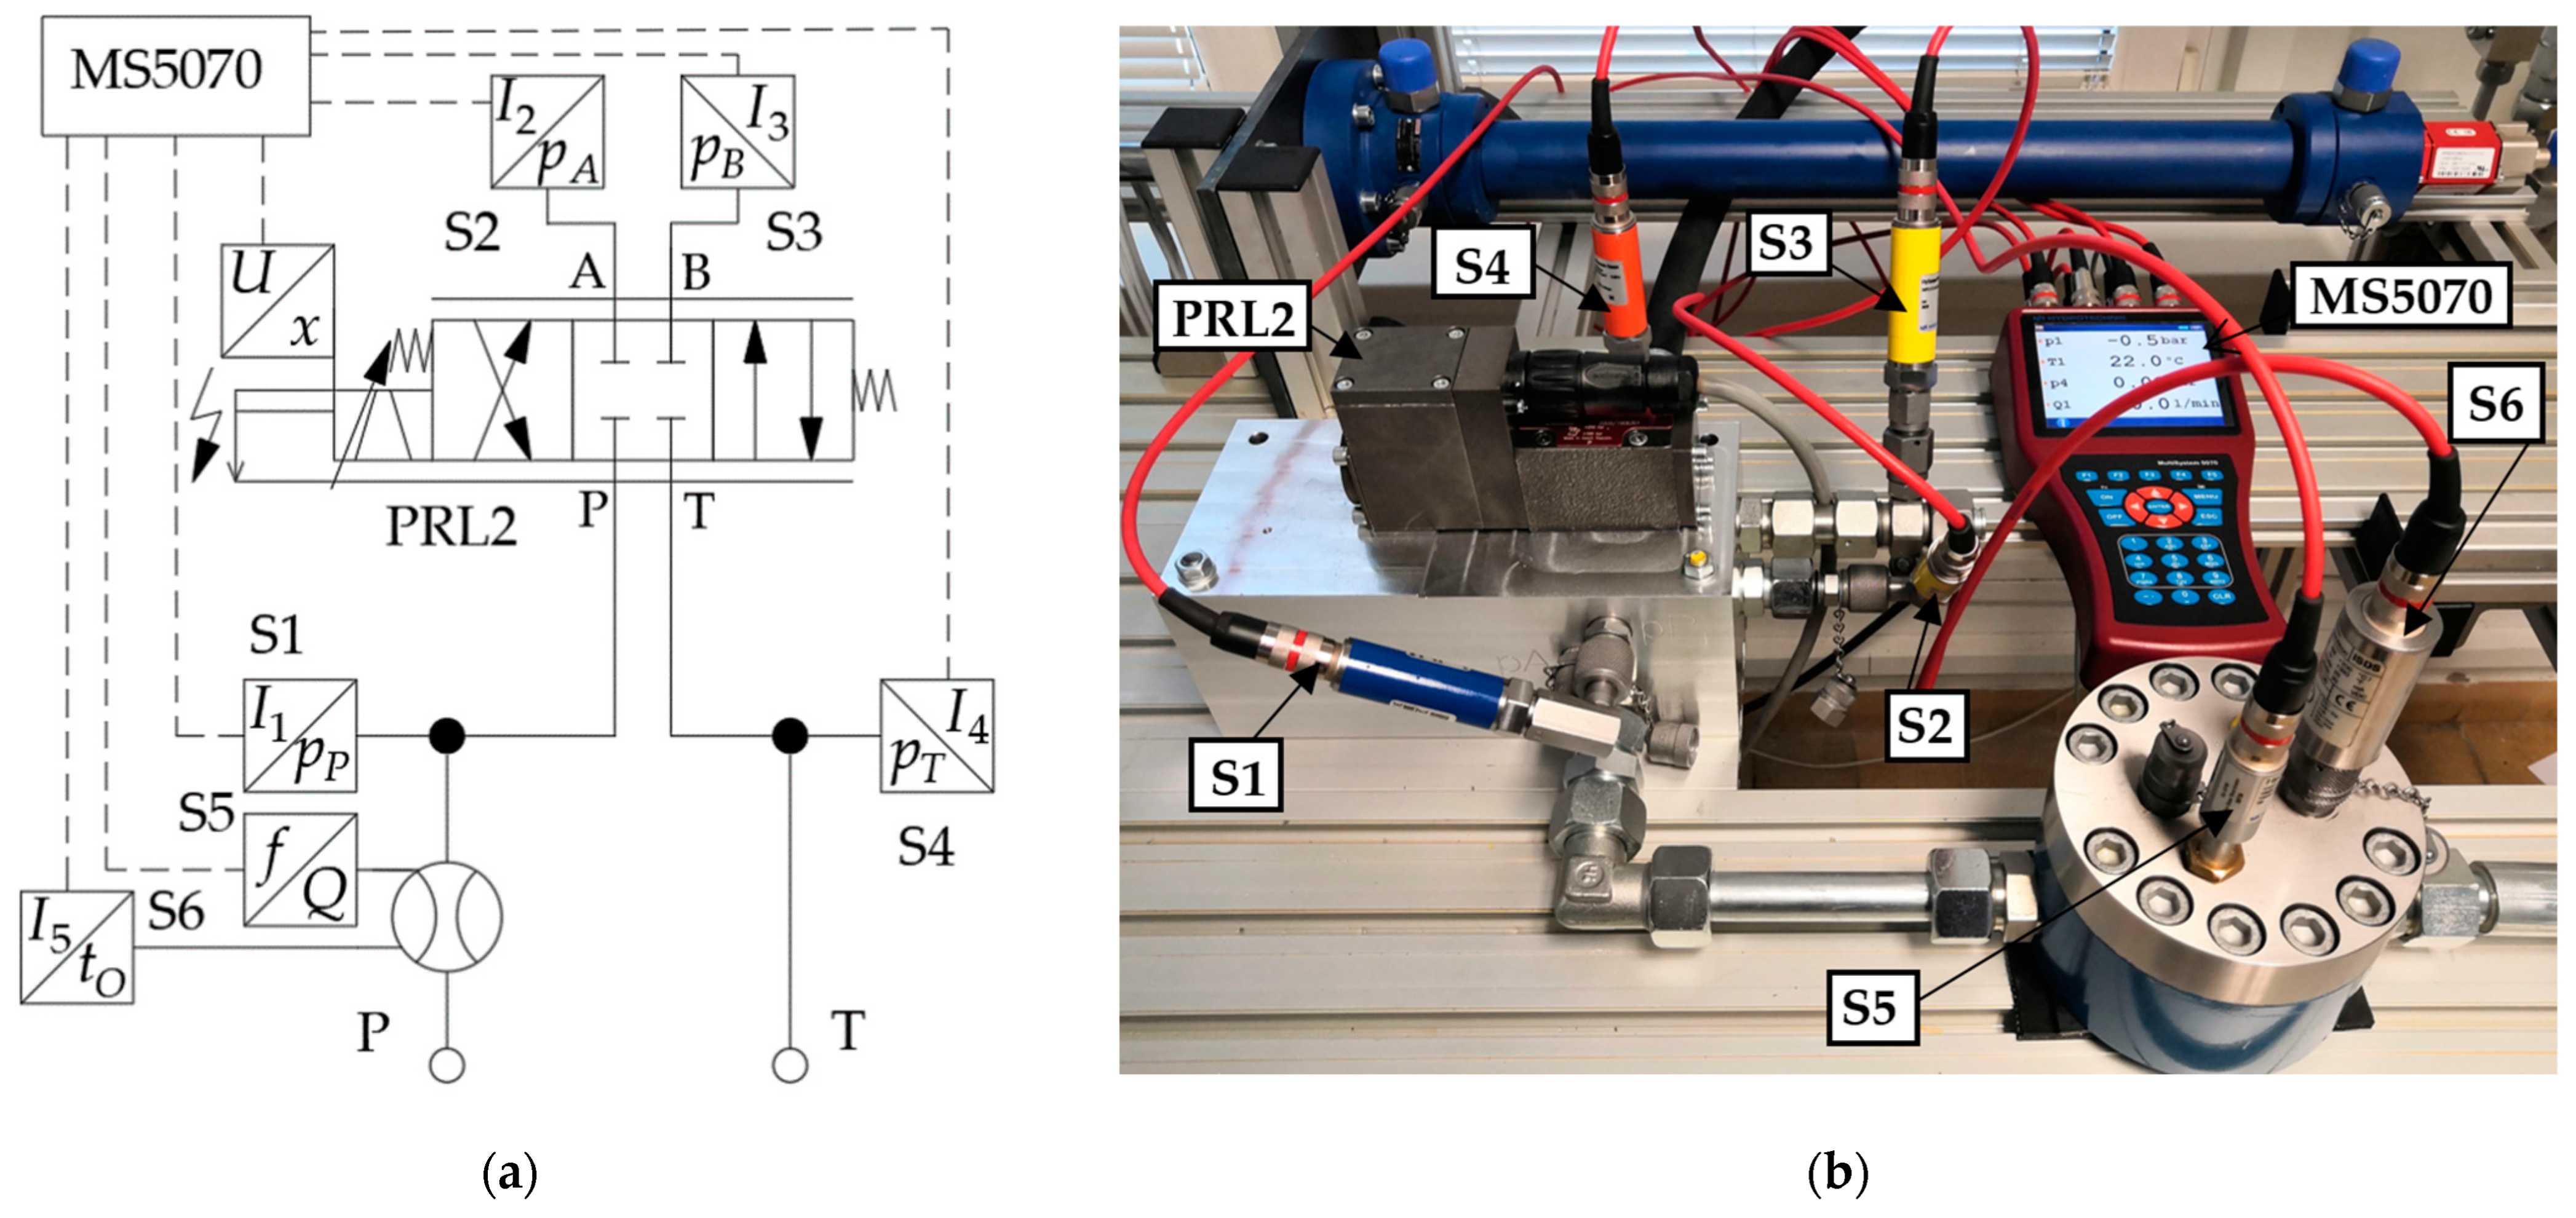
2.2. Experimental Test Stand

Figure 3a shows the hydraulic scheme of the experimental test stand that was used to determine leakage characteristics of the proportional directional valve. The source of pressure energy was the hydraulic unit with constant pressure control. The investigated element was the proportional directional valve PRL2 from Argo Hytos. The supply pressure pP was supplied into the directional valve by the pressure line to port P. The fluid was drained back to the tank from port T by the return line. Load ports of directional valve A and B were blocked by pressure sensors S2 and S3. The flow between ports A and B was zero. Measuring points for connection pressure sensors S1 and S2 were placed in the hydraulic system. The spool position was measured by the integrated inductive position sensor. The flow rate before the proportional directional valve was measured by the flow meter S5. The flow meter allowed the connection of the temperature sensor S6 by the temperature sump. The measuring instrument MS5070 from Hydrotechnik was used to record individual measurements. The working fluid was HV46 oil. The experimental equipment is shown in Figure 3b. The measuring range and accuracy of all sensors used is shown in Table 2.

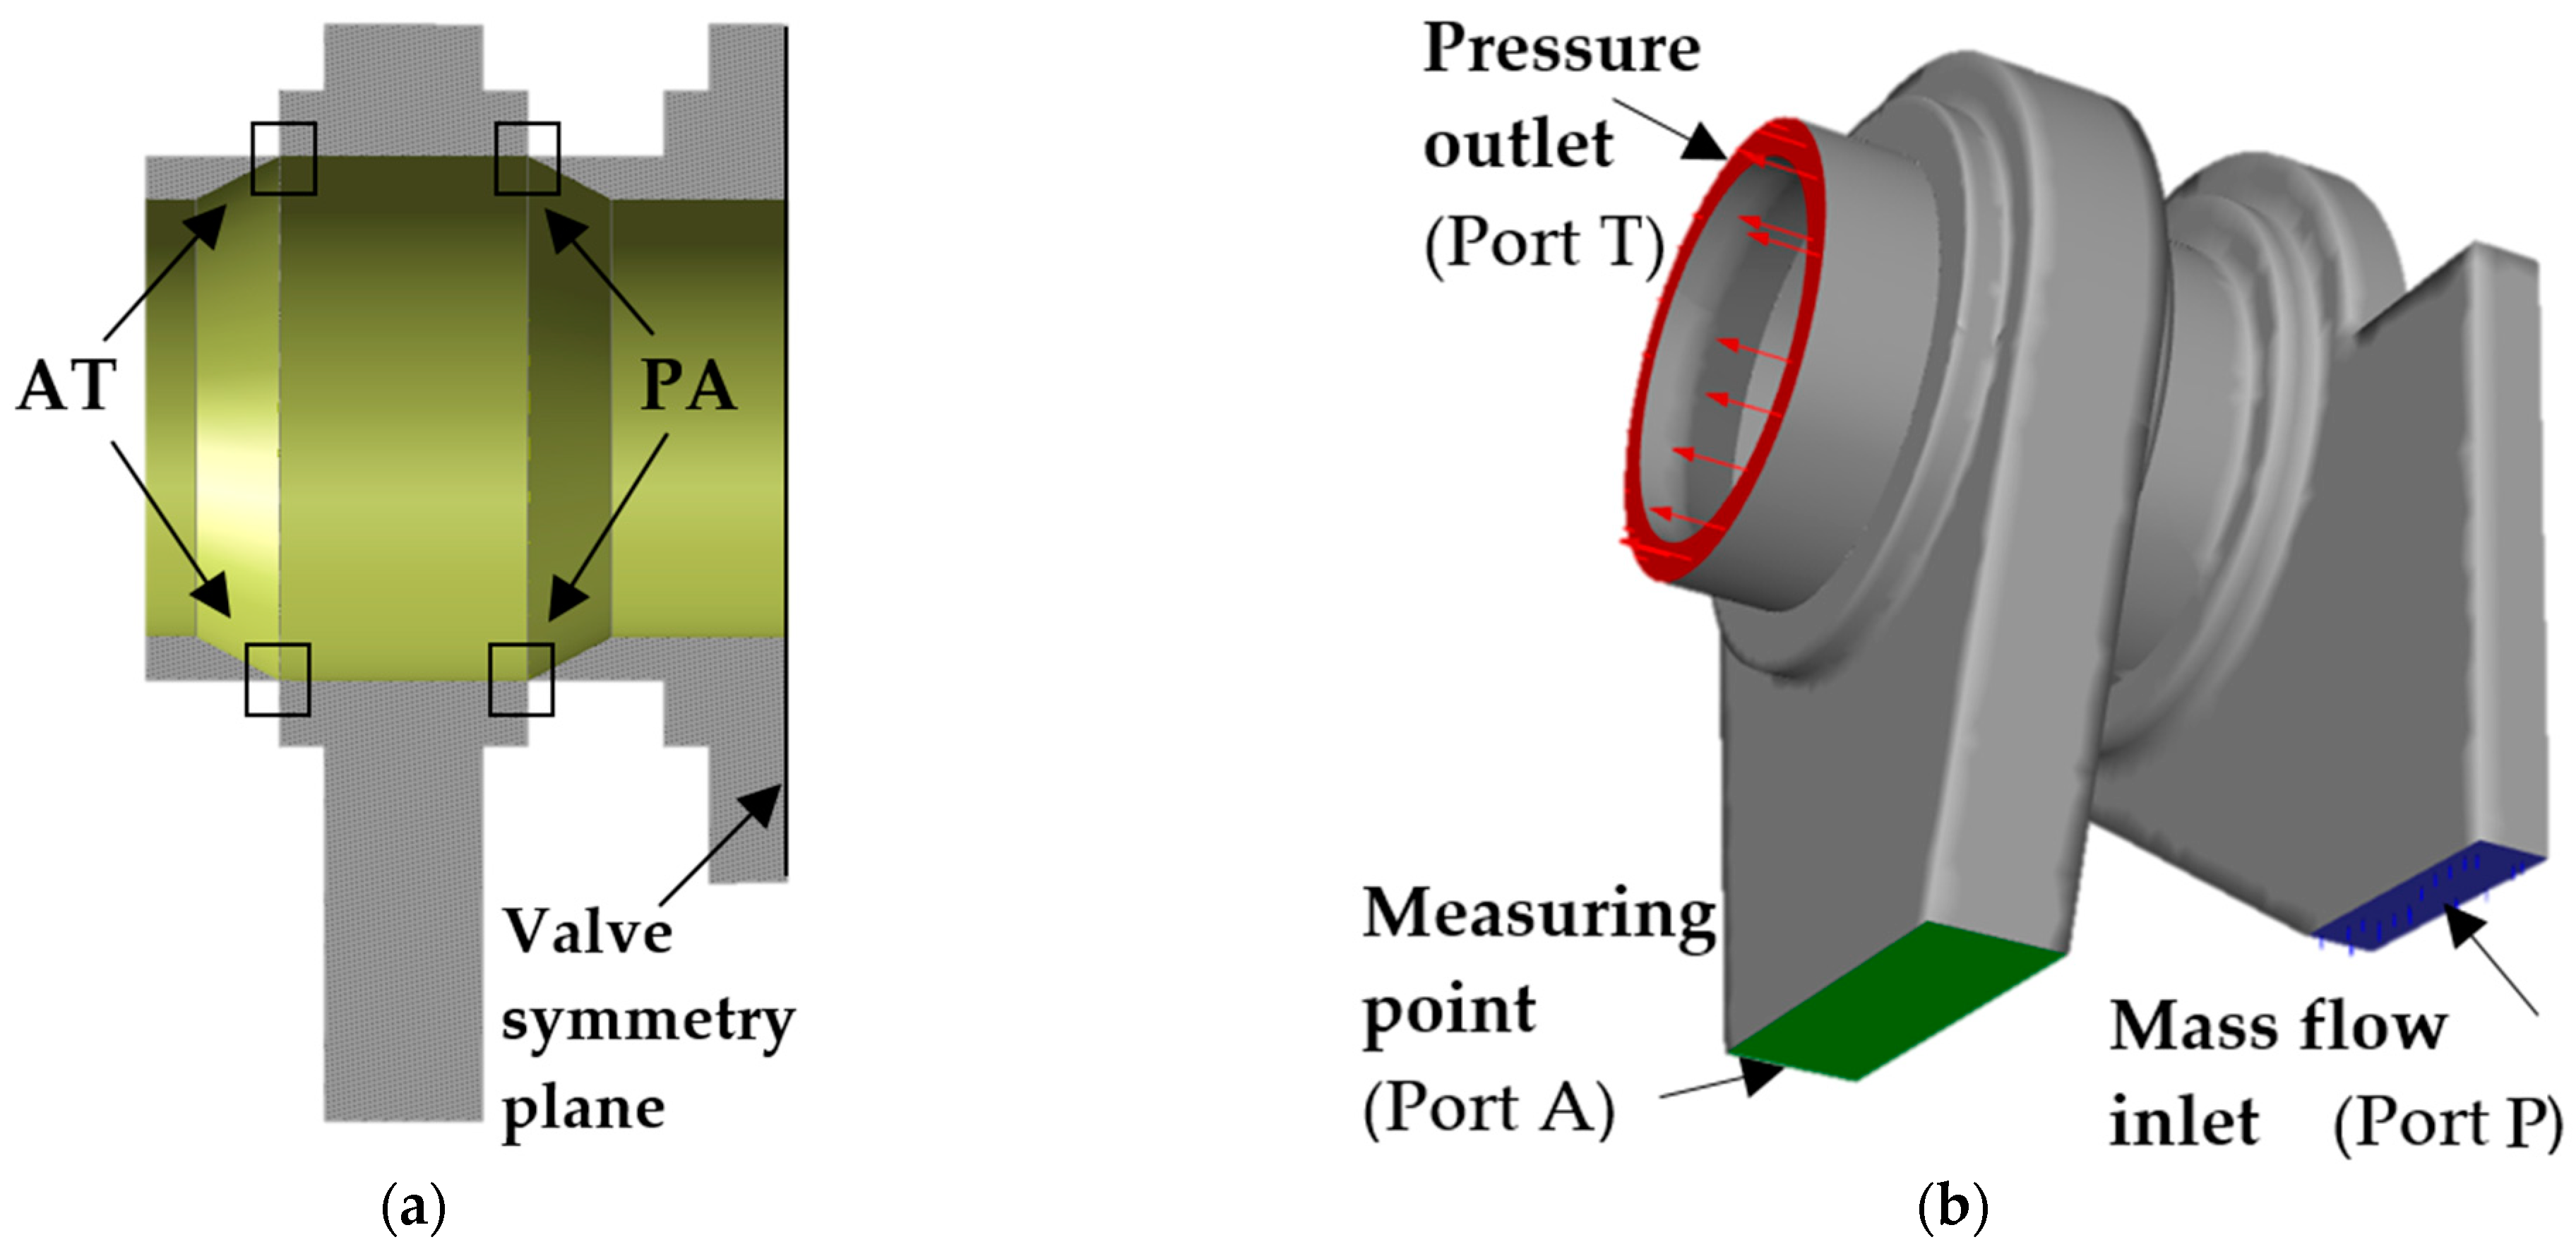
2.3. Numerical Simulation

Numerical simulation of the flow through the spool was performed in Ansys Fluent to determine the center flow curve. The inverse geometry of the solved area corresponds to the examined spool and was created in Ansys Design Modeler. To simplify the calculation, only half of the spool and the sleeve for the load channel A was modelled, see Figure 4a. The mesh of the modelled area was created in Ansys Mesher. The mesh refinement was used in the area of the narrowest cross-section. To refine the calculation, the mesh adaptation was performed according to the velocity gradient. The monitored parameter for the mesh adaptation was the pressure drop at throttle edges. By adapting the mesh, further refinement of the mesh at throttle edges area was achieved.
Mathematical simulations were performed for three spool valve geometries with the constant radial clearance s = 3 μm and different axial clearances at throttle edges. The axial clearance on the pair of throttle edges PA and AT was assumed to be symmetrical. The first simulation was performed for the ideal spool valve geometry with zero spool lap, where uAT = uPA = 0 μm (Null tolerance). The second simulation was performed for the geometry of the spool valve taking into account axial clearance, when underlap of throttle edges occurs and uAT = uPA = −2.54 μm (Underlap tolerance). The last simulation was performed for the geometry of the spool valve taking into account axial clearance, when overlap of throttle edges occurs and uAT = uPA = 2.54 μm (Overlap tolerance). The k-ω RANS model (SST) was used for numerical simulations. Constant boundary conditions were considered for all numerical simulations performed. The boundary condition at the inlet is defined by the mass flow rate Qm, which corresponds to values from the experiment. The output boundary condition is the output pressure poutlet = 0 Pa. The mass flow rate was set to the half value, because flow through only one load channel was simulated. Physical properties of the oil were defined for the oil temperature tO = 39 °C. The oil dynamic viscosity corresponds to the value η = 0.0405 Pa∙s and the oil density corresponds to the value ρ = 852 kg∙m−3 for the oil temperature tO = 39 °C. The definition of each boundary conditions is shown in Figure 4b.

3. Results and Discussion

3.1. Experimental Measurements

Three leakage characteristics were measured and evaluated in the experiment. These characteristics describe the behavior of the investigated directional valve around of the center position, when leakage due to radial and axial clearance occurs. All measurements to determine leakage characteristics were made with load ports A and B blocked, i.e., with zero flow rate between ports A and B. Supply pressure, load ports pressures pA and pB, tank pressure pT, flow rate Q before of the directional valve, spool stroke and oil temperature were measured using sensors and the measuring instrument MS5070. To determine the blocked-line pressure sensitivity curve and the leakage curve, the supply pressure was set to the constant value during the measurement. These characteristics were successively determined for different supply pressure. The valve spool was centered in the center position to determine the center flow curve. Supply pressure was gradually increased during measurement in the range of 25 to 250 bar. All leakage characteristics were determined for different oil temperatures. Kinematic viscosity ν and density of oil measurements were also performed as part of the experiment. The dependence of oil kinematic viscosity and oil density on oil temperature is shown in Figure 5.

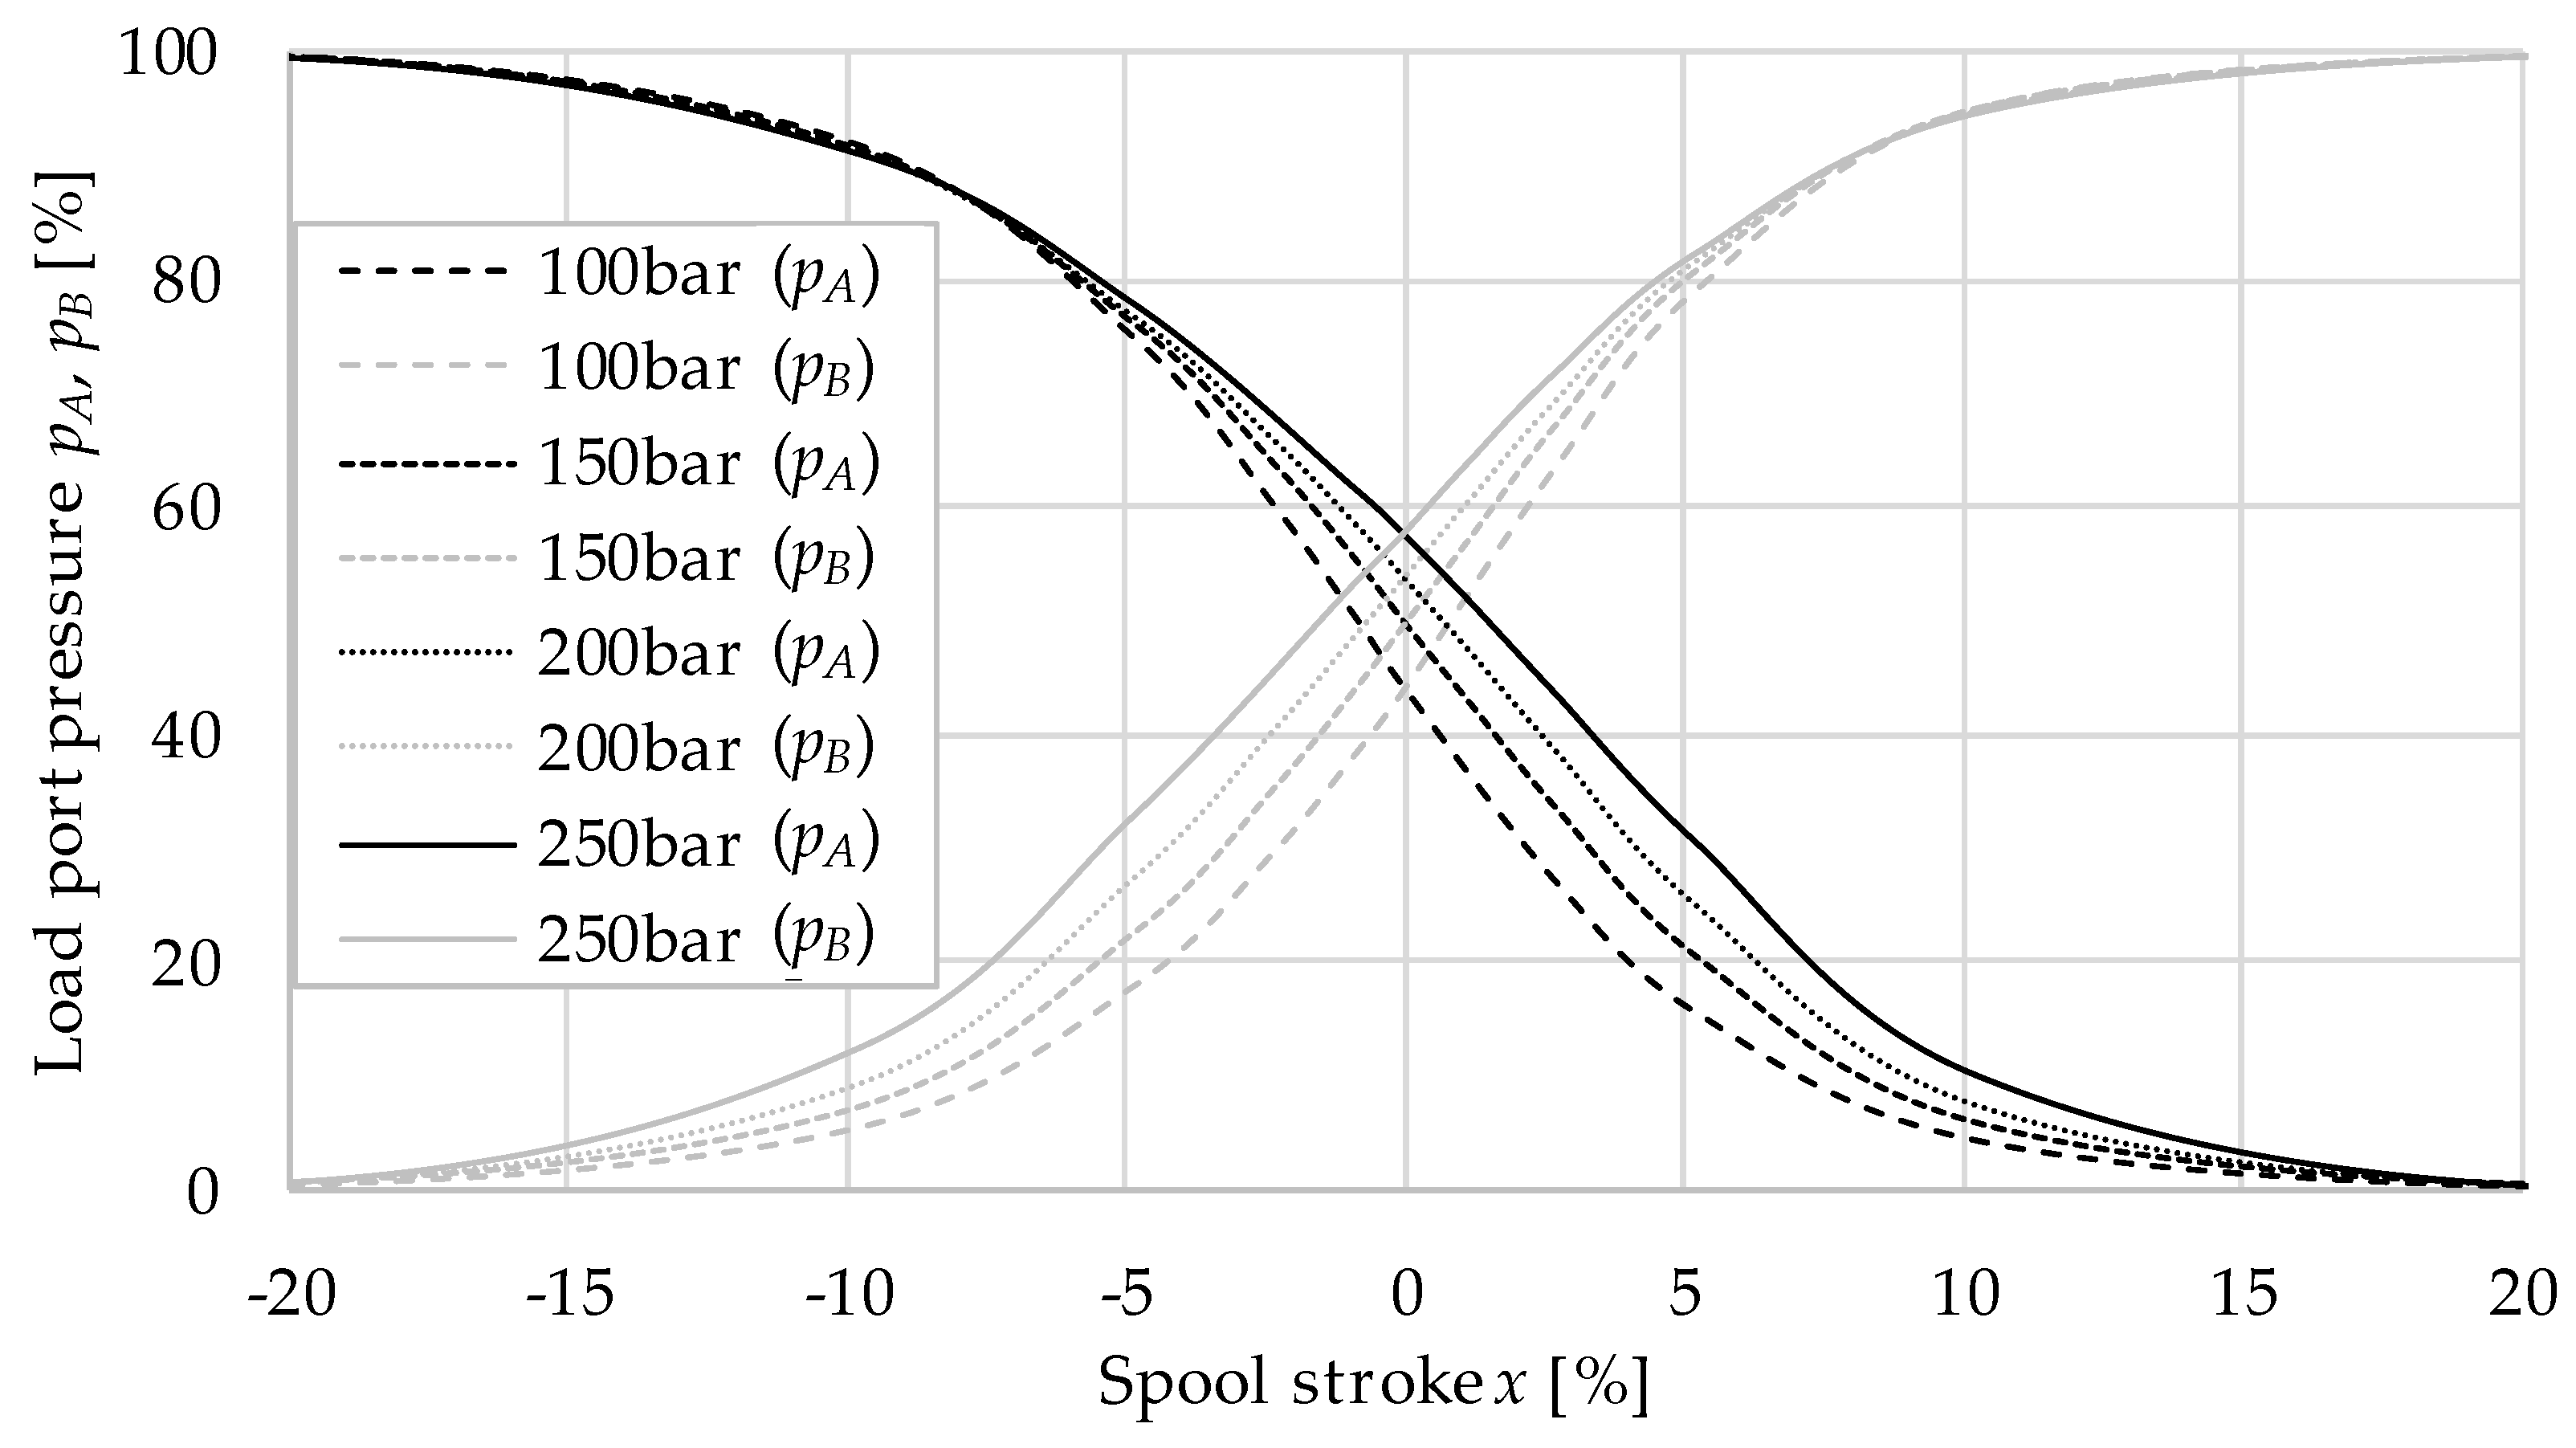
3.1.1. Blocked-Line Pressure Sensitivity Curve

Figure 6 shows blocked-line pressure sensitivity curves for different supply pressures from 100 to 250 bar. Measurements were performed for the oil temperature tO = 35 °C, which corresponds to the kinematic viscosity ν = 56 mm2∙s−1. The range of spool stroke was from −20 to 20% of the maximum stroke. The maximum spool stroke was x = 0.57 mm. Load ports pressures remained constant for greater than 20% spool stroke in both directions. Pressure transients at load ports A and B were evaluated as a percentage of the supply pressure. From the evaluation of measured characteristics it can be seen that load ports pressures for the same supply pressure are equal at zero spool stroke x = 0%. Figure 6 also shows the dependence of the magnitude of load ports pressures in the center position area of the spool on the supply pressure. The value of load ports pressures at zero spool stroke x = 0% increases with increasing supply pressure. Equality of pressures at load ports at the same supply pressure occurs in the center position of the spool. By evaluating pressure dependencies and their equality, it is possible to verify the control voltage value of the directional valve, which corresponds to the spool in the center position. In the case of a non-zero control voltage for the center position of the spool, it can be corrected. Correction of the center position of the spool is made possible by directional valve integrated electronics [20].
Figure 7 shows blocked-line pressure sensitivity curves for constant supply pressure pP = 250 bar and for different oil temperatures and kinematic viscosities. Measurements were performed for oil temperatures tO = 27 °C (ν = 80.2 mm2∙s−1), tO = 30 °C (ν = 67.8 mm2∙s−1) a tO = 37 °C (ν = 48.5 mm2∙s−1). Figure 7 also shows that the oil temperature change has little effect on the dependence of load ports pressures on the spool stroke. The blocked-line pressure sensitivity of the directional valve for different oil temperatures changes minimally.

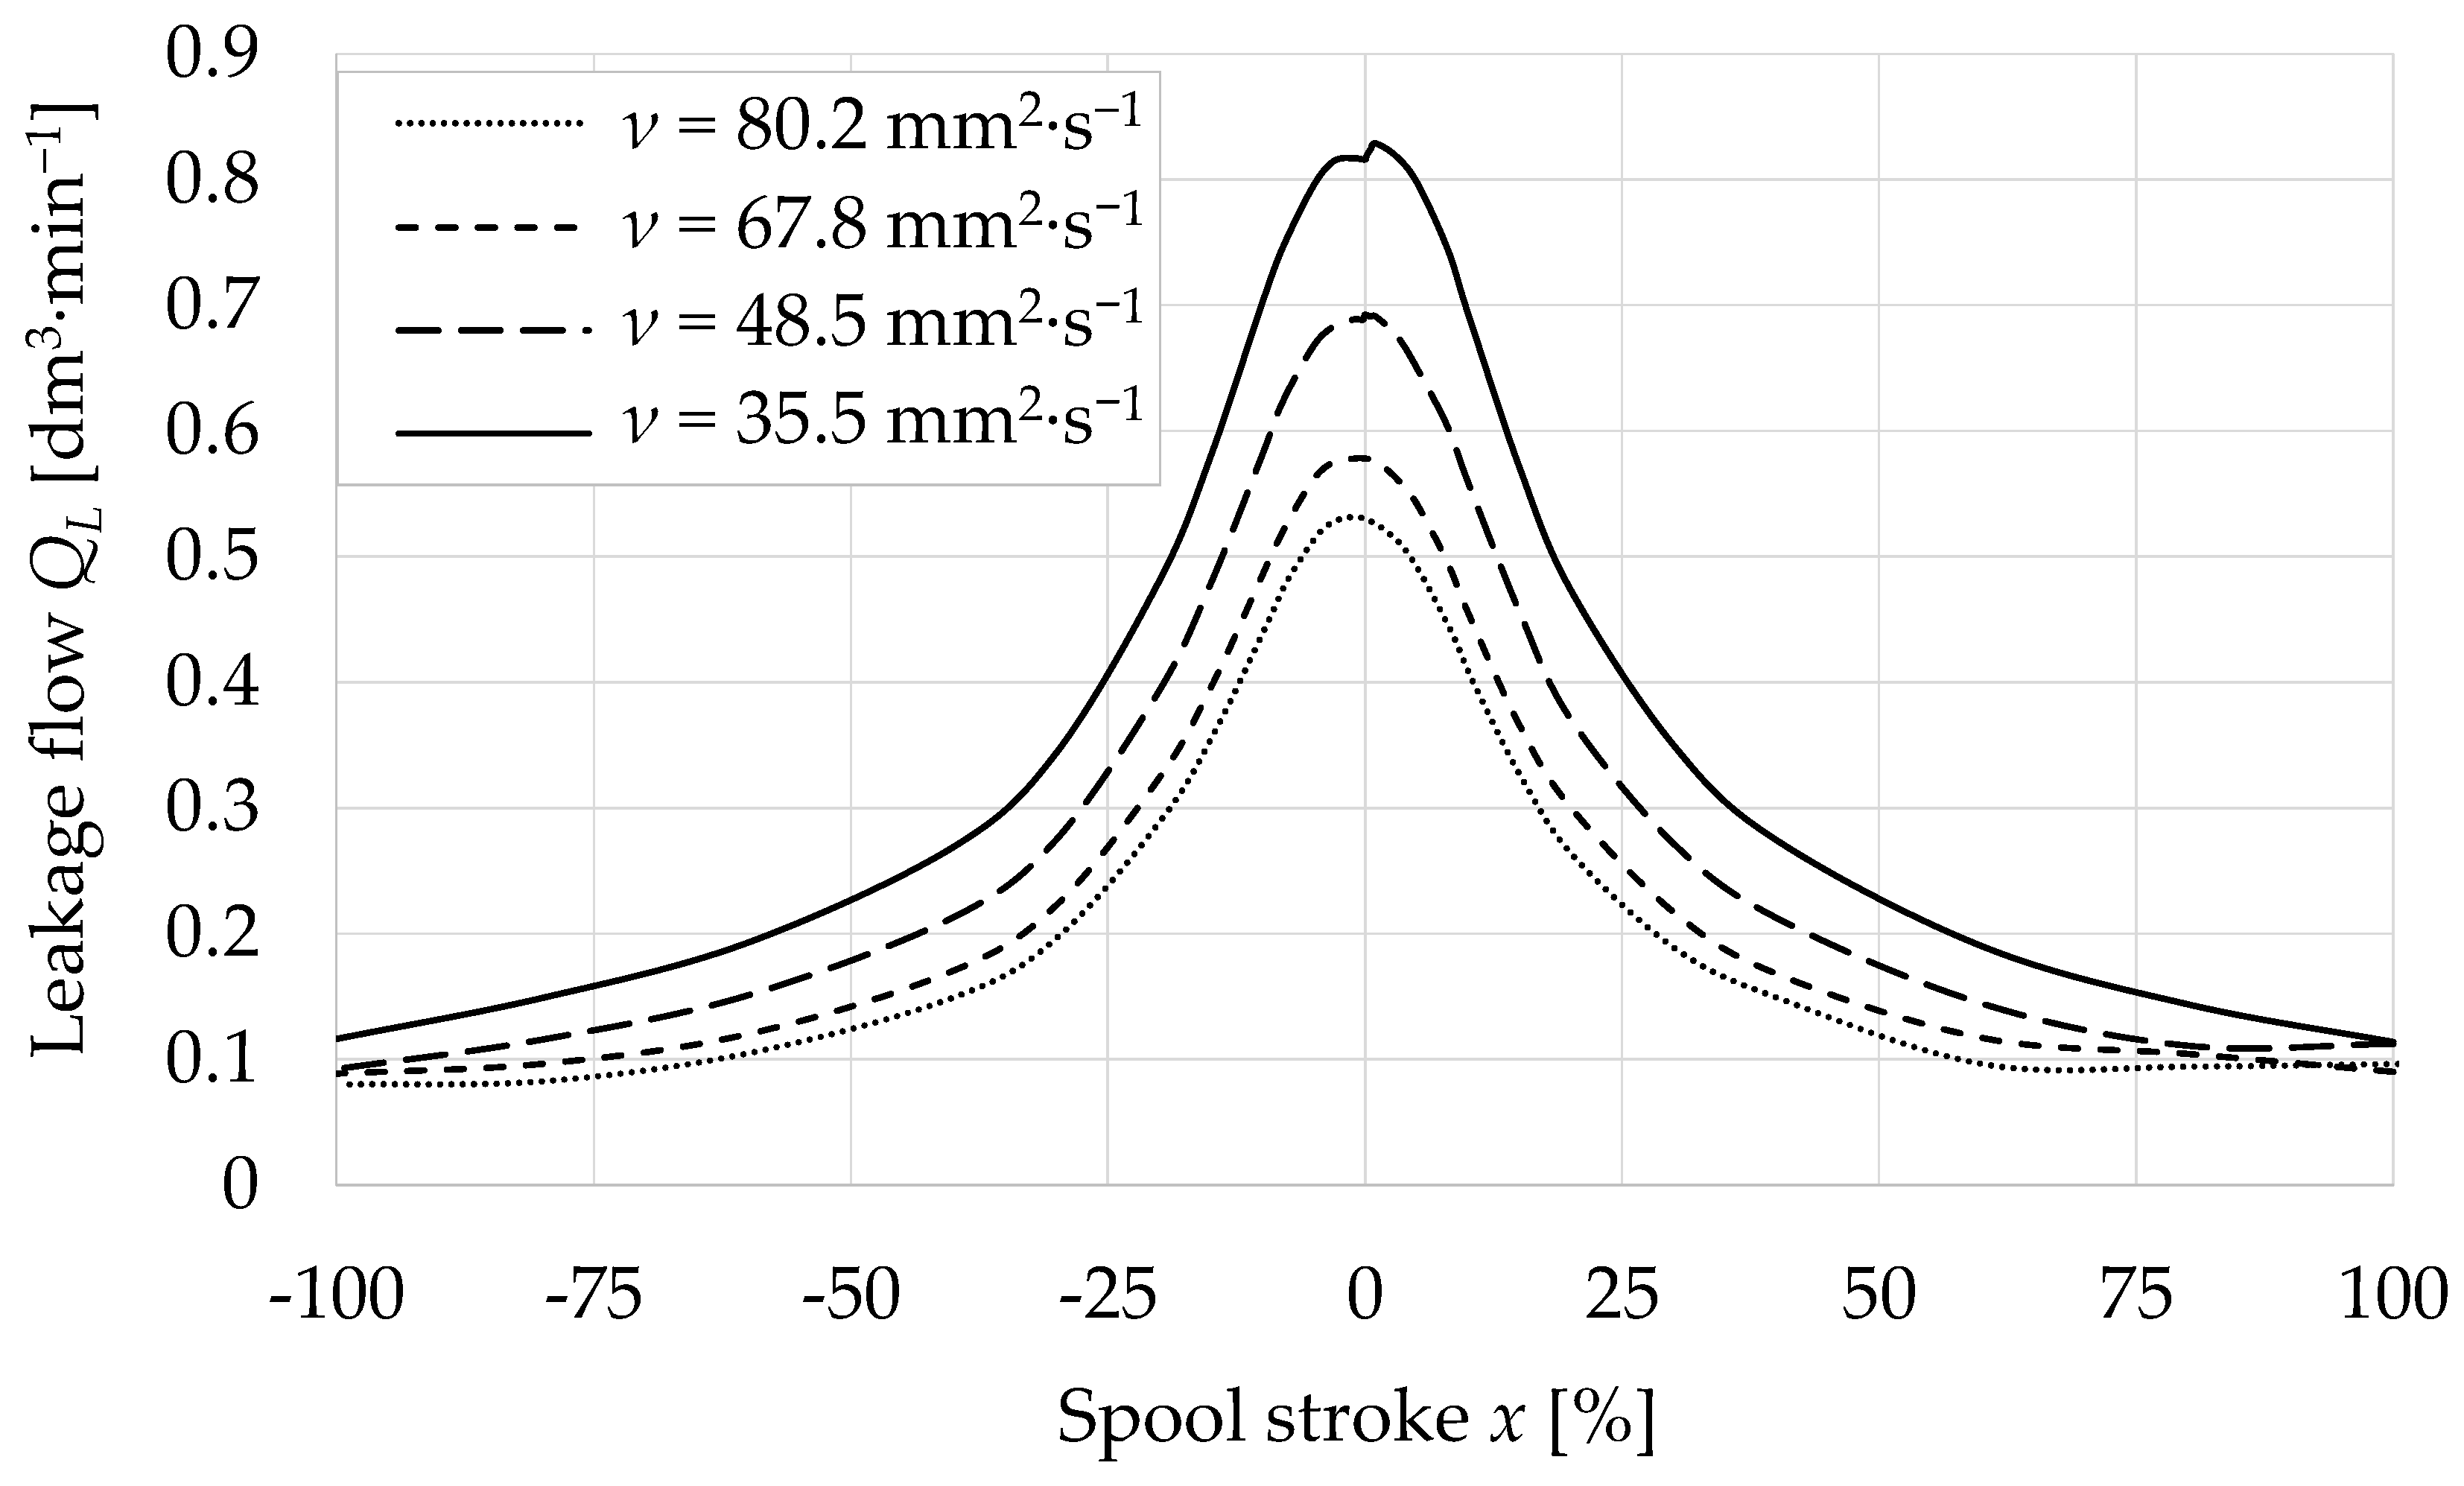
3.1.2. Leakage Flow Curve

Figure 8 shows leakage flow curves for different supply pressure from 100 to 250 bar and for the constant oil temperature tO = 35 °C, which corresponds to the kinematic viscosity ν = 56 mm2∙s−1. Figure 8 also shows that the leakage flow QL is maximum for the center position of the spool stroke and individual supply pressures decreases with the spool stroke in both directions. The leakage flow decrease is due to the increasing length of the narrow annular gap, which corresponds to the spool stroke and the edge overlap magnitude according to Equation (4). It can also be seen from Figure 8 that the leakage flow increases with the increasing supply pressure over the entire range of the valve spool stroke.
Figure 9 shows determined leakage curves for a constant supply pressure pP = 250 bar and for different oil temperatures and kinematic viscosities. Measurements were performed for oil temperatures tO = 27 °C (ν = 80.2 mm2∙s−1), tO = 30 °C (ν = 67.8 mm2∙s−1), tO = 37 °C (ν = 48.5 mm2∙s−1) a tO = 45 °C (ν = 35.5 mm2∙s−1). Figure 9 shows that the oil temperature change affects the magnitude of the leakage flow and as the fluid temperature increases, the leakage flow increases.

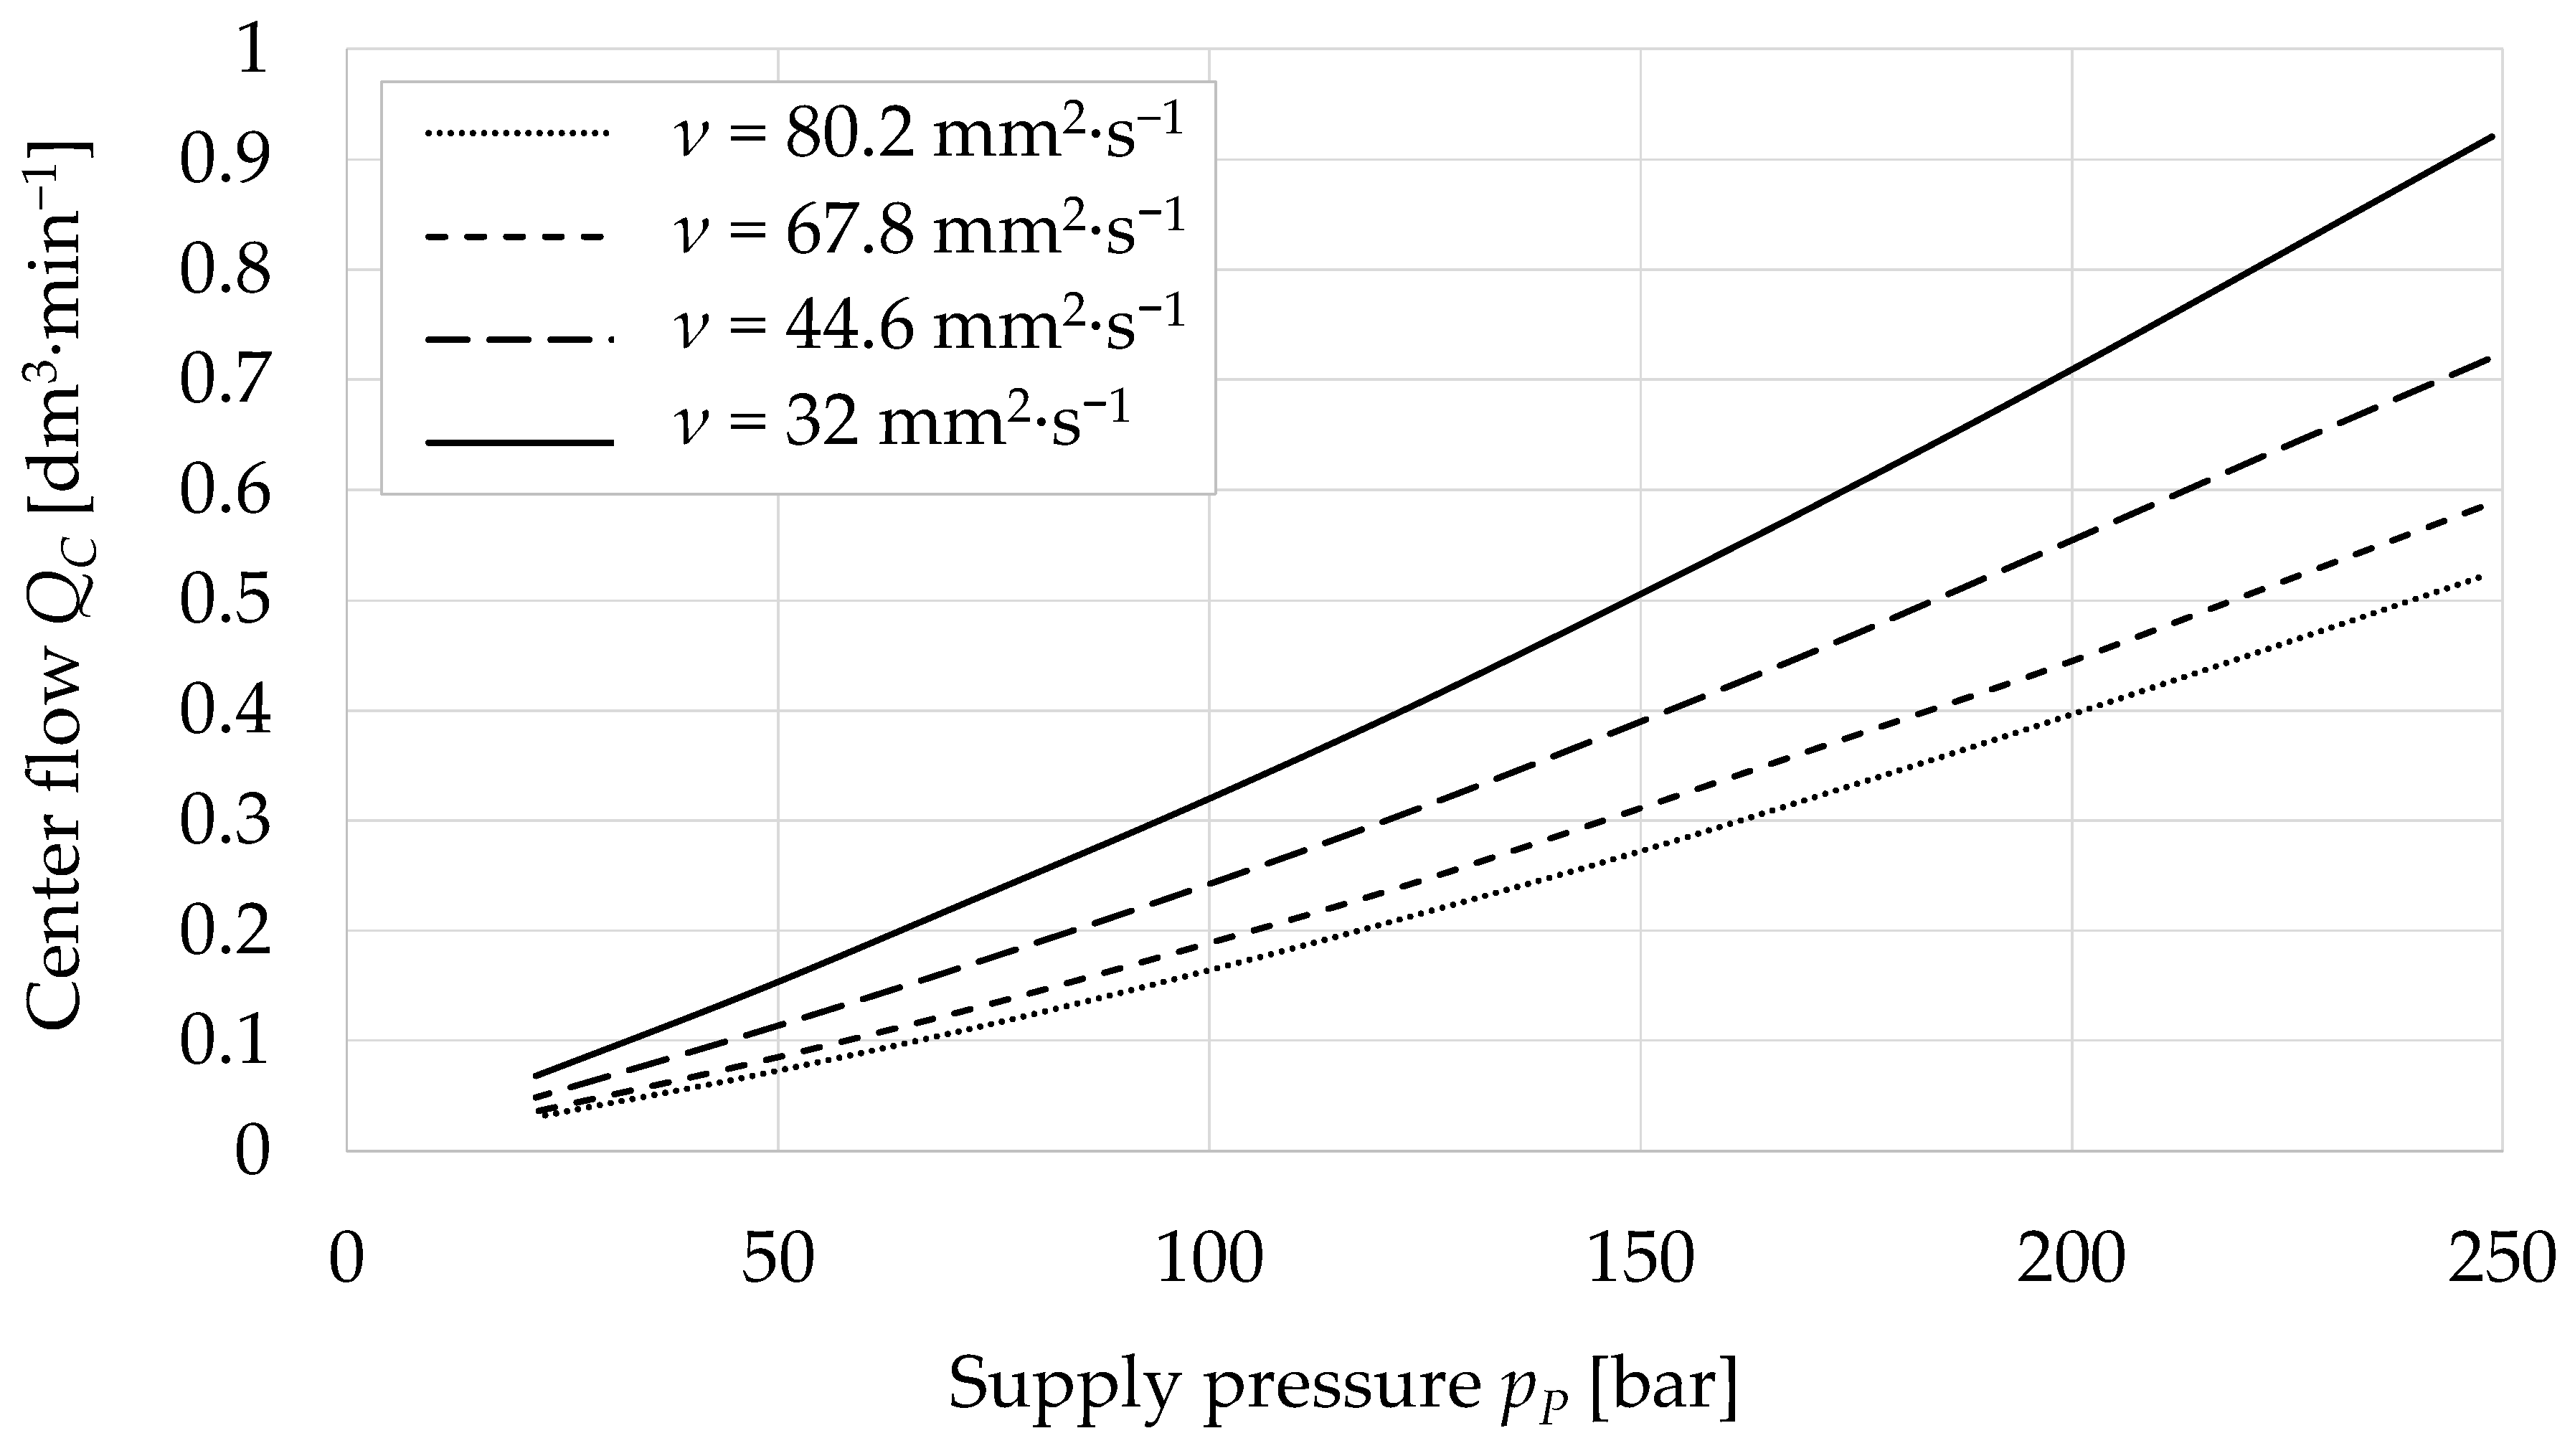
3.1.3. Center Flow Curve

Figure 10 shows measured center flow curves for different oil temperatures and kinematic viscosities. Measurements were performed for oil temperatures tO = 27 °C (ν = 80.2 mm2∙s−1), tO = 30 °C (ν = 67.8 mm2∙s−1), tO = 39 °C (ν = 44.6 mm2∙s−1) and tO = 48 °C (ν = 32 mm2∙s−1). Figure 10 also shows that the center flow QC increases depending on the increasing supply pressure. The center flow increases with increasing oil temperature (decreasing viscosity of the oil). Comparing Figure 9 and Figure 10, the center flow for the maximum supply pressure and the maximum leakage flow for the same oil temperature correspond to each other.
Figure 11 compares the analytically determined and the experimentally measured center flow dependence on the supply pressure. Analytical calculations were performed for three different spool valve geometries. These geometries take into account the symmetrical axial clearance of the spool valve. In the case of spool valve geometry with the negative axial clearance (Underlap tolerance) uAT = uPA = −2.54 μm, an underlap occurs between throttle edges. The center flow was then determined using Equation (1). The spool stroke value in the equation corresponds to the value of the underlap tolerance uAT = uPA = −2.54 μm. In the case of spool valve geometry with positive axial clearance (Overlap tolerance) uAT = uPA = 2.54 μm, an overlap occurs between throttle edges. The narrow annular gap of length is formed between the spool and the sleeve due to radial clearance. This length corresponds to the overlap tolerance value uAT = uPA = 2.54 μm. The center flow for the overlap tolerance was determined using Equation (2). In the case of ideal spool valve geometry, the axial clearance is zero uAT = uPA = 0 μm (Null tolerance). The center flow was then determined using Equation (5). Figure 11 shows that analytically determined center flow curves for null tolerance and overlap tolerance geometries are identical. The experimentally measured dependence of the center flow almost corresponds to analytically determined dependences for the null tolerance and the overlap tolerance in the flow rate area up to QC = 0.4 dm3∙min−1. At flow rates higher than QC = 0.4 dm3∙min−1, the experimentally determined pressure drop at the spool is lower than the analytical calculation for the null tolerance and the overlap tolerance. For further comparison, the CFD analysis of the spool valve was performed. The CFD analysis of the spool valve was performed for selected tolerances.

3.2. Numerical Simulation

Center flow curves determined by numerical simulations for each directional valve geometry are shown in Figure 12. Center flow curves are determined for oil temperature tO = 39 °C. Overlap tolerance (uAT = uPA = 2.54 μm) and underlap tolerance (uAT = uPA = −2.54 μm) curves define the range of center flow, i.e., the grey area in the graph, which is affected by the magnitude of the axial clearance. Across the range of center flow, axial clearance is defined for maximum permitted manufacturing tolerances of high performance valve [23]. Figure 12 shows a comparison of numerically simulated dependencies and the experimentally determined center flow curve. From the comparison it can be seen that the experimentally determined curve is within the specified range of manufacturing tolerances. The comparison also shows that the slight overlap of control edges can be predicted for the measured valve. Figure 12 shows the comparison at half center flow QC/2 due to the mathematical simulation of the half model.

4. Conclusions

This paper deals with the analysis of leakage characteristics of a proportional directional valve. Measurements were taken to determine blocked-line pressure sensitivity curves, leakage flow curves and center flow curves. The blocked-line pressure sensitivity curve and the leakage flow curve were measured for different supply pressures and constant oil temperature. All characteristics were determined at different oil temperatures and constant supply pressure. Determined center flow curves by analytical calculation for different valve geometries were compared with experimentally determined curves. Subsequently, numerical simulations of the flow with the spool in the center position were performed for different valve geometries taking into account the size of axial clearances. Center flow curves determined by numerical simulation were compared with the experimentally determined center flow curve.
(1)
Measurements shows that the pressure sensitivity curve changes significantly for different supply pressures. For different oil viscosities, the pressure sensitivity curve changes only minimally. The magnitude of the leakage flow changes over the entire range of the spool stroke depending on the supply pressure and oil viscosity. The magnitude of the center flow is also significantly affected by the oil viscosity.
(2)
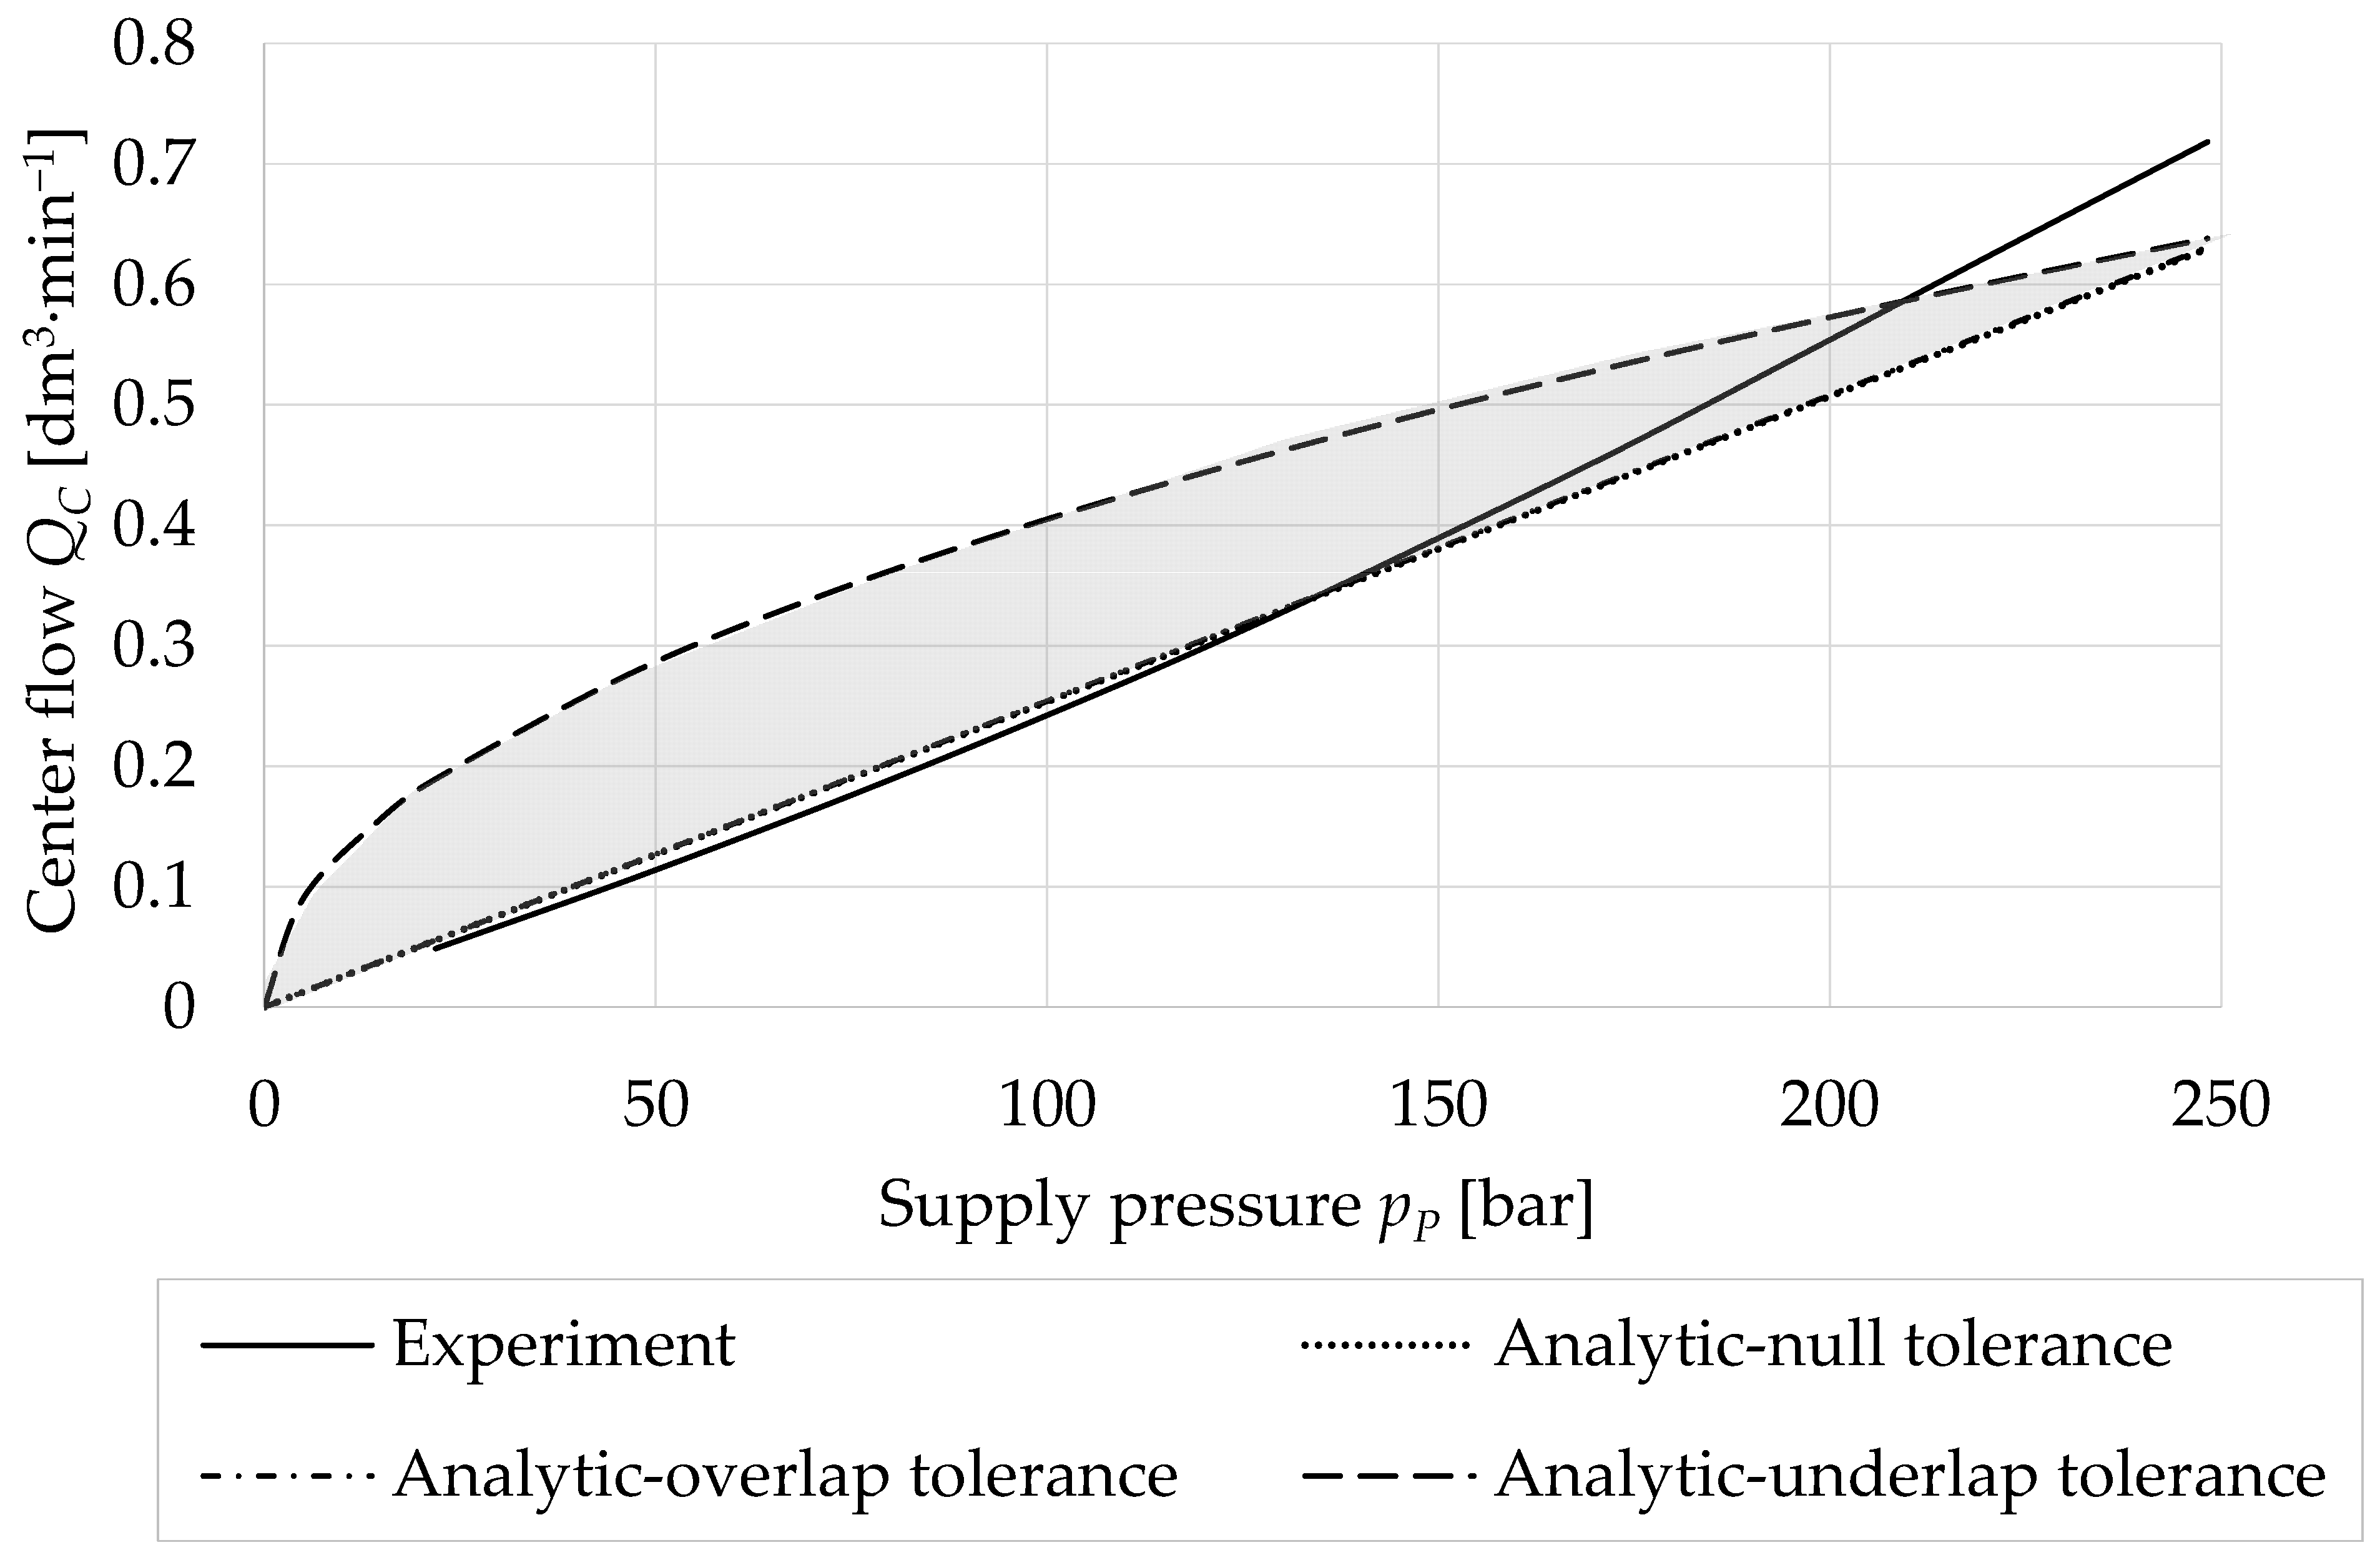
From comparison, the experimentally measured dependence of the center flow curve nearly matches analytically determined dependences for null tolerance and overlap tolerance in the lower flow rate area. At higher center flow, the experimentally determined pressure drop at the spool is lower than in the case of the analytical calculation for the null tolerance and the overlap tolerance.
(3)
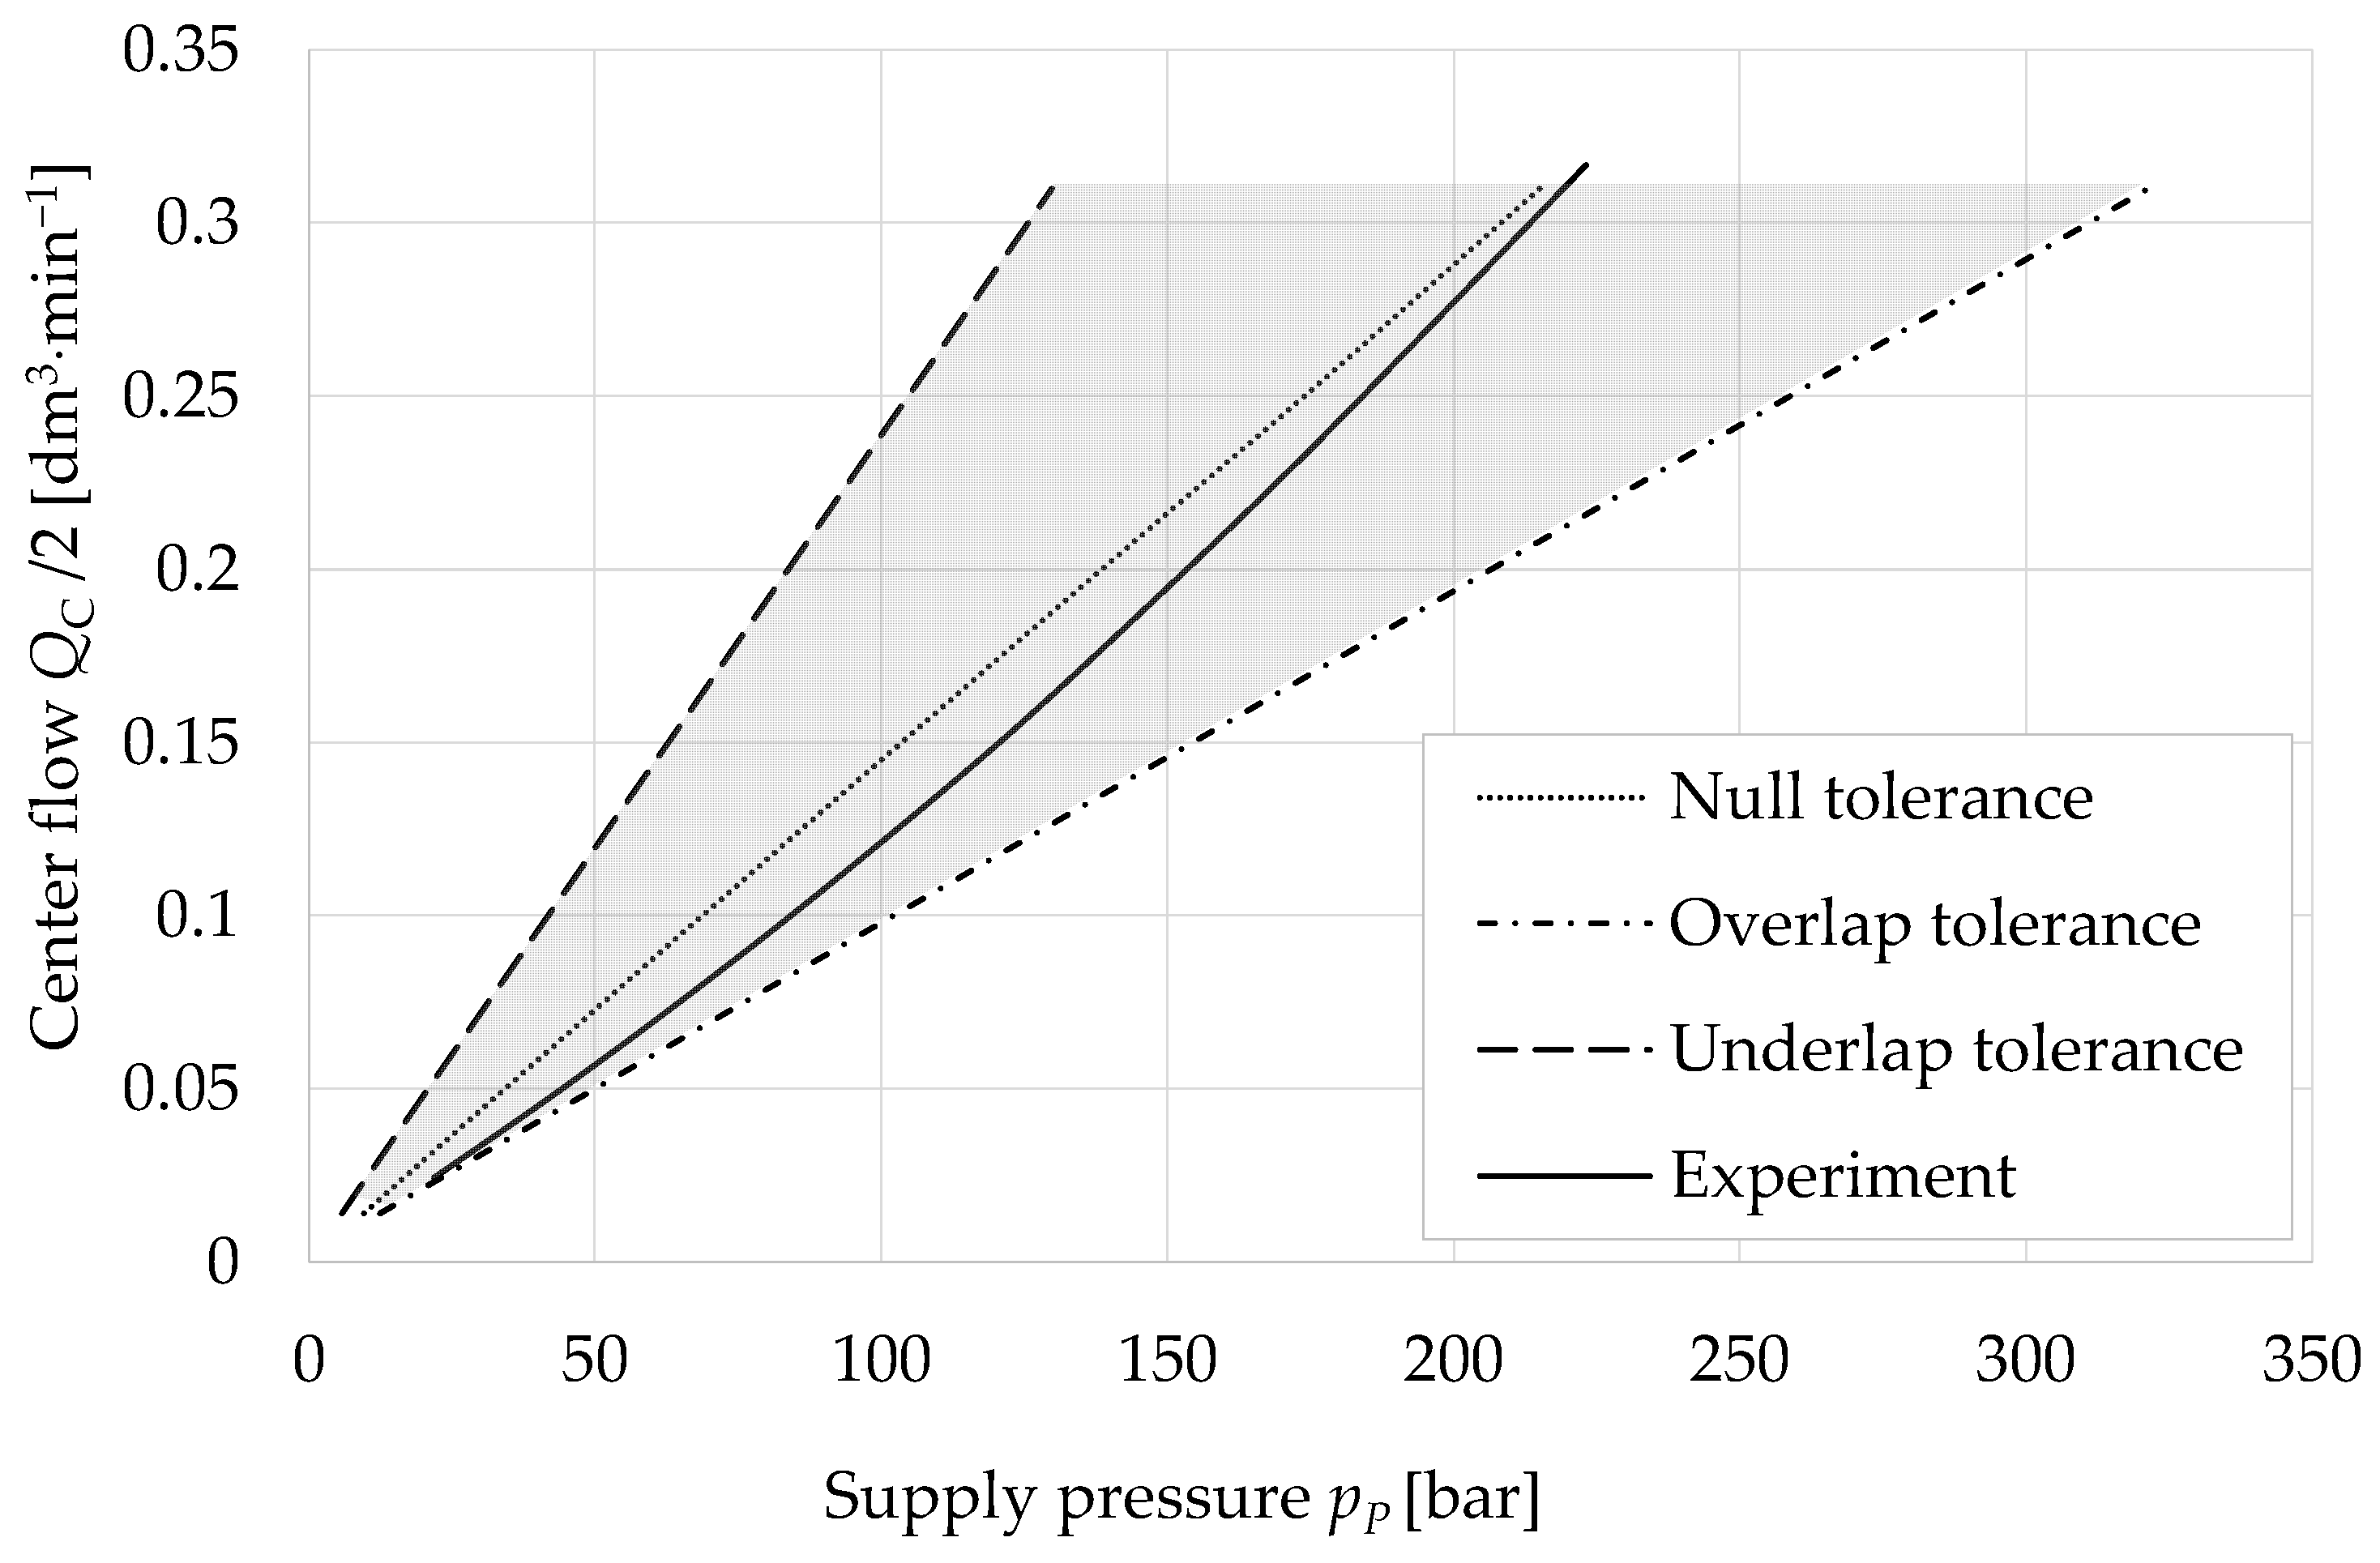
The overlap tolerance curve and the underlap tolerance curve, determined by numerical simulations, define the range of center flow that is affected by the maximum allowable manufacturing tolerance. The null tolerance curve, determined by numerical simulation, defines the center flow for the ideal zero spool lap geometry.
(4)
The experimentally determined center flow curve is within the specified range defined by the selected tolerance. The comparison of the numerical simulation and the experiment also shows that the slight overlap of control edges can be predicted for the measured valve.
The pressure sensitivity measurement shows that the resistance of throttle edge 1 (PA) and 4 (AT) is different. For the basic numerical simulation model, axial clearances for these edges were considered symmetrical. The next part of the research will deal with asymmetry of individual spool edges. Individual resistances of throttle edges will be solved separately.

Author Contributions

Conceptualization, M.L., L.H. and A.B.; methodology, M.L., A.B. and T.P.; validation, L.H., A.B. and F.D.; formal analysis, M.L., L.H. and T.P.; resources, M.L., A.B. and T.P.; data curation, M.L. and F.D.; writing—original draft preparation, M.L.; visualization, M.L. All authors have read and agreed to the published version of the manuscript.

Funding

“This work was supported by the European Regional Development Fund in the Research Centre of Advanced Mechatronic Systems project, project number CZ.02.1.01/0.0/0.0/16_019/0000867 within the Operational Programme Research, Development and Education” and “The work presented in this paper was supported by a grant SGS” Experimental methods for fluid mechanisms mathematical models verification “SP2023/015”.

Institutional Review Board Statement

Not applicable.

Informed Consent Statement

Not applicable.

Data Availability Statement

Not applicable.

Conflicts of Interest

The authors declare no conflict of interest.

References

  1. Hružík, L.; Bureček, A.; Vašina, M. Effect of Oil Viscosity on Pulsating Flow in Pipe. Mech. Mach. Sci. 2017, 44, 137–143. [Google Scholar] [CrossRef]
  2. Soon, C.C.; Ghazali, R.; Jaafar, H.I.; Hussien, S.Y.S.; Sam, Y.M.; Rahmat, M.F. The Effects of Parameter Variation in Open-Loop and Closed-Loop Control Scheme for an Electro-Hydraulic Actuator System. Int. J. Control. Autom. 2016, 9, 283–294. [Google Scholar] [CrossRef]
  3. Li, S.; Du, J.; Shi, Z.; Xu, K.; Shi, W. Characteristics Analysis of the Pilot-Operated Proportional Directional Valve by Experimental and Numerical Investigation. Energies 2022, 15, 9418. [Google Scholar] [CrossRef]
  4. Gordić, D.; Babić, M.; Milovanović, D.; Savić, S. Spool valve leakage behaviour. Arch. Civ. Mech. Eng. 2011, 11, 859–866. [Google Scholar] [CrossRef]
  5. Ledvoň, M.; Hružík, L.; Bureček, A.; Dýrr, F. Experimental and Numerical Analysis of Leakage Characteristics of Proportional Directional Valve. MATEC Web Conf. 2022, 369, 02007. [Google Scholar] [CrossRef]
  6. Mondal, M.K.; Manna, N.K.; Saha, R. Study of leakage flow through a spool valve under blocked-actuator port condition—Simulation and experiment. Proc. Inst. Mech. Eng. Part C J. Mech. Eng. Sci. 2014, 228, 1405–1417. [Google Scholar] [CrossRef]
  7. Eryilmaz, B.; Wilson, B.H. Modeling the internal leakage of hydraulic servovalves. ASME Int. Mech. Eng. Congr. Expo. 2000, 26645, 337–343. [Google Scholar] [CrossRef]
  8. Mao, X.; Wu, C.; Ding, H.; Li, B.; Liu, Y. Effect Analysis of Leakage in the Middle Position and Improvement of an O-type 3-position-4-way Directional Valve with the Spool Structure. IOP Conf. Ser.-Earth Environ. Sci. 2020, 508, 012160. [Google Scholar] [CrossRef]
  9. Tamburrano, P.; Plummer, A.R.; Elliott, P.; De Palma, P.; Distaso, E.; Amirante, R. Internal leakage in the main stage of servovalves: An analytical and CFD analysis. AIP Conf. Proc. 2019, 2191, 020146. [Google Scholar] [CrossRef]
  10. Afatsun, A.C.; Tuna Balkan, R. A mathematical model for simulation of flow rate and chamber pressures in spool valves. J. Dyn. Syst. Meas. Control. 2019, 141, 021004. [Google Scholar] [CrossRef]
  11. Lu, Z.; Zhang, J.; Xu, B.; Wang, D.; Su, Q.; Qian, J.; Yang, G.; Pan, M. Deadzone compensation control based on detection of micro flow rate in pilot stage of proportional directional valve. ISA Trans. 2019, 94, 234–245. [Google Scholar] [CrossRef] [PubMed]
  12. Zhang, L.; Fu, W.; Yuan, X.; Meng, Z. Research on Optimal Control of Excavator Negative Control Swing System. Processes 2020, 8, 1096. [Google Scholar] [CrossRef]
  13. Tang, W.; Xu, G.; Zhang, S.; Jin, S.; Wang, R. Digital twin-driven mating performance analysis for precision spool valve. Machines 2021, 9, 157. [Google Scholar] [CrossRef]
  14. Rituraj, R.; Scheidl, R. Stability Analysis of Spools with Imperfect Sealing Gap Geometries. Int. J. Fluid Power 2021, 21, 383–404. [Google Scholar] [CrossRef]
  15. Chen, Y.; Gong, W.; Kang, R. Coupling behaviour between adhesive and abrasive wear mechanism of aero-hydraulic spool valves. Chin. J. Aeronaut. 2016, 29, 1119–1131. [Google Scholar] [CrossRef]
  16. Liu, X.; Ji, H.; Min, W.; Zheng, Z.; Wang, J. Erosion behaviour and influence of solid particles in hydraulic spool valve without notches. Eng. Fail. Anal. 2020, 108, 104262. [Google Scholar] [CrossRef]
  17. Fang, X.; Yao, J.; Yin, X.; Chen, X.; Zhang, C. Physics-of-failure models of erosion wear in electrohydraulic servovalve, and erosion wear life prediction method. Mechatronics 2013, 23, 1202–1214. [Google Scholar] [CrossRef]
  18. Song, F.; Peng, L.; Chen, J.; Wang, B. Internal Leakage Predicition of Hydraulic Spool Valves Based on Acoustic Emission Technology. J. Phys. Conf. Ser. 2021, 2113, 012016. [Google Scholar] [CrossRef]
  19. Chen, Q.; Ji, H.; Zhao, H.; Zhao, J. Optimization Algorithm and Joint Simulation to Micro Thermal Deformation Using Temperature Measurement in the Orifice of Hydraulic Valve. Processes 2020, 8, 1136. [Google Scholar] [CrossRef]
  20. Ledvoň, M.; Polášek, T.; Bureček, A.; Hružík, L. Modeling and Dynamic Analysis Directional Valve. AIP Conf. Proc. 2019, 2118, 030026. [Google Scholar] [CrossRef]
  21. Manring, N.D. Hydraulic Control Systems; John Wiley & Sons, Inc.: Hoboken, NJ, USA, 2005. [Google Scholar]
  22. Fitch, E.C.; Hong, I.T. Hydraulic Component Design and Selection; BarDyne: Stillwater, OK, USA, 1998. [Google Scholar]
  23. Merritt, H.E. Hydraulic Control Systems; John Wiley & Sons, Inc.: Hoboken, NJ, USA, 1967. [Google Scholar]
Figure 1. Flow analysis through the spool valve in center position x = 0.
Processes 11 00512 g001
Figure 2. Detail of throttle edge geometry at zero spool lap.
Processes 11 00512 g002
Figure 3. (a) Scheme of experimental equipment, (b) experimental equipment.
Processes 11 00512 g003
Figure 4. (a) Section of modelled area for load port A, (b) boundary conditions.
Processes 11 00512 g004
Figure 5. Dependence of oil kinematic viscosity and density on oil temperature.
Processes 11 00512 g005
Figure 6. Blocked-line pressure sensitivity curves for different supply pressures.
Processes 11 00512 g006
Figure 7. Blocked-line pressure sensitivity curves for different oil temperatures.
Processes 11 00512 g007
Figure 8. Leakage curves for different supply pressures.
Processes 11 00512 g008
Figure 9. Leakage curves for supply pressure pP = 250 bar and different oil temperatures.
Processes 11 00512 g009
Figure 10. Center flow curves for different oil temperatures.
Processes 11 00512 g010
Figure 11. Experimentally determined and analytically calculated center flow curves for different oil temperatures.
Processes 11 00512 g011
Figure 12. Numerically simulated center flow curves and experimentally determined center flow curve.
Processes 11 00512 g012
Table 1. Flow analysis for individual throttle edges and valve spool stroke.
Q O i = C D A i 2 ρ Δ p i Q G i = π   D   s 3 12   η   l Δ p i Q C i = π   w s 2 32   η Δ p i
x < 0i = 1, 3i = 2, 4-
x = 0--i = 1, 2, 3, 4
x > 0i = 2, 4i = 1, 3-
Table 2. Technical parameters of used sensors.
SensorsMeasuring RangeMeasuring Accuracy
Pressure sensor S1(0–400) bar±0.25% of full scale
Pressure sensor S2, S3(0–250) bar±0.25% of full scale
Pressure sensor S4(0–60) bar±0.25% of full scale
Flow meter S5(0.05–5) dm3·min−1up to ±0.4% of reading
Temperature sensor S6(−50–200) °C0.3 + 0.005·tO °C
Disclaimer/Publisher’s Note: The statements, opinions and data contained in all publications are solely those of the individual author(s) and contributor(s) and not of MDPI and/or the editor(s). MDPI and/or the editor(s) disclaim responsibility for any injury to people or property resulting from any ideas, methods, instructions or products referred to in the content.

