Abstract
The sulfide stress cracking (SSC) behavior of three micro-alloying 110 ksi grade Cr-Mo casing steels were evaluated according to the A-Method tensile test specified in the NACE TM0177 standard (NACE A-method). The fractures of SSC specimens and the micro-structures of the casing steels were characterized by scanning electron microscopy (SEM) with electron backscattering diffraction (EBSD) and transmission electron microscopy (TEM) in the BF and STEM mode. The results show that on the premise of 110 ksi, the yield strength of Co-Mo steel was satisfactory, finer spherical carbides increased the number of irreversible traps; widened polygonised martensitic laths, lowered dislocation density, and lowered the proportion of high-angle grain boundaries and the Σ3 boundaries decreased hydrogen permeability and diffusivity. The SSC resistance of Co-Mo steel with above micro structure characteristics was enhanced.
1. Introduction
The research of high strength casing with excellent SSC resistance casing steel has always been one of the hot and difficult points in the development of oil and gas fields with high temperature, high pressure and a wet hydrogen sulfide (H2S) atmosphere [1,2,3,4,5,6,7,8]. To avoid breaking, 110 ksi grade anti-sulfide casing steel with a specified minimum yield strength (YS) of 758 MPa was required during the NACE A-method standard tensile test with different tensile loads for 720 h [9]. Therefore, even higher strength steels with different SSC resistance were developed [10,11,12].
When OCTG steels are exposed to a wet H2S-bearing medium, hydrogen atoms are generated by an electro-chemical reaction and introduced into the steel, which tends to concentrate around the microstructural defects of steel, and then initiates cracks. Previous studies have reported the influence of composition, heat-treatments, micro-structures morphologies on the SSC resistance of high strength casing steel. It is well known that compared with C-Mn steel, quenched and tempered Cr-Mo steels provide both terrific mechanical properties and the advantage of SSC resistance. The high strength and SSC resistance OCTGs are usually manufactured by modified the alloying elements of AISI 4130 steel [13]. V. P. Koval’ and Y. Yoshino [14,15] investigated the influence of C, Ni and Mn on SSC resistance of steel st. 20. The results showed that C (>0.25 wt%) increases the formation of carbides and cementite which locating at the grain boundaries. Thus, the hydrogen atoms are easy to be concentrated and induce crack initiation; Mn (>1 wt%), like Ni (>0.1 wt%), has no negative effect on hydrogen absorption and diffusion, but enhancing the formation of brittle fresh martensite, which can increase the SSC susceptibility. The Cr, Mo and Nb, V, Ti dispersoids are known to delay the softening of quenched structures during tempering processing. As all of the dispersoids form finely dispersed intragranular carbides, more irreversible ‘hydrogen traps’ are provided, which result in SSC resistance. Moreover, a critical Mo content of about 0.75% wt. is beneficial to the SSC resistance of modified AISI 4130 steels [16,17,18,19,20]. Adding W content to 0.38% wt. can significantly refine the carbides to increase the number of irreversible traps and to decrease hydrogen permeability and diffusivity, enhancing SSC resistance [21].
It is generally accepted that the ‘quenching and high temperature tempering (Q&T)’ is the optimal heat treatment process for modified high strength and SSC resistant Cr-Mo casing steel [22,23]. The heat treatment process consists of austenitization at 890–930 °C within 45–60 min before quenching, and tempering at 700–710 °C for about 45–120 min.
Microstructural defects are also considered to play a key role in hydrogen’s interaction with steel. They are categorized as reversible traps and irreversible traps based on their binding enthalpies with hydrogen [24,25]. Reversible traps include grain boundaries, lattice and dislocations, while irreversible traps consist of secondary phase particles, inclusions and voids [26,27]. Hydrogen traps have significant effects on the SSC resistance of steel.
The present work aimed to investigate the effects of microstructure characteristics on the SSC behavior of three modified 110 ksi grade casing steels. The microstructure morphologies of the specimens were characterized by scanning and transmission electron microscopy (SEM, TEM) and EBSD. The hydrogen interaction with steel closely related to SSC behavior was illustrated by the NACE A-method standard tensile test.
2. Materials and Methods
2.1. Materials and Heat Treatment
The chemical compositions (wt%) of the three modified 110 ksi casing steels are shown in Table 1. After rolling to the desirable specification and dimension at the final temperature of 950 °C, the casing steels were subsequently treated by air cooling.

Table 1.
Chemical compositions of three modified 110 ksi casing steel (wt%).
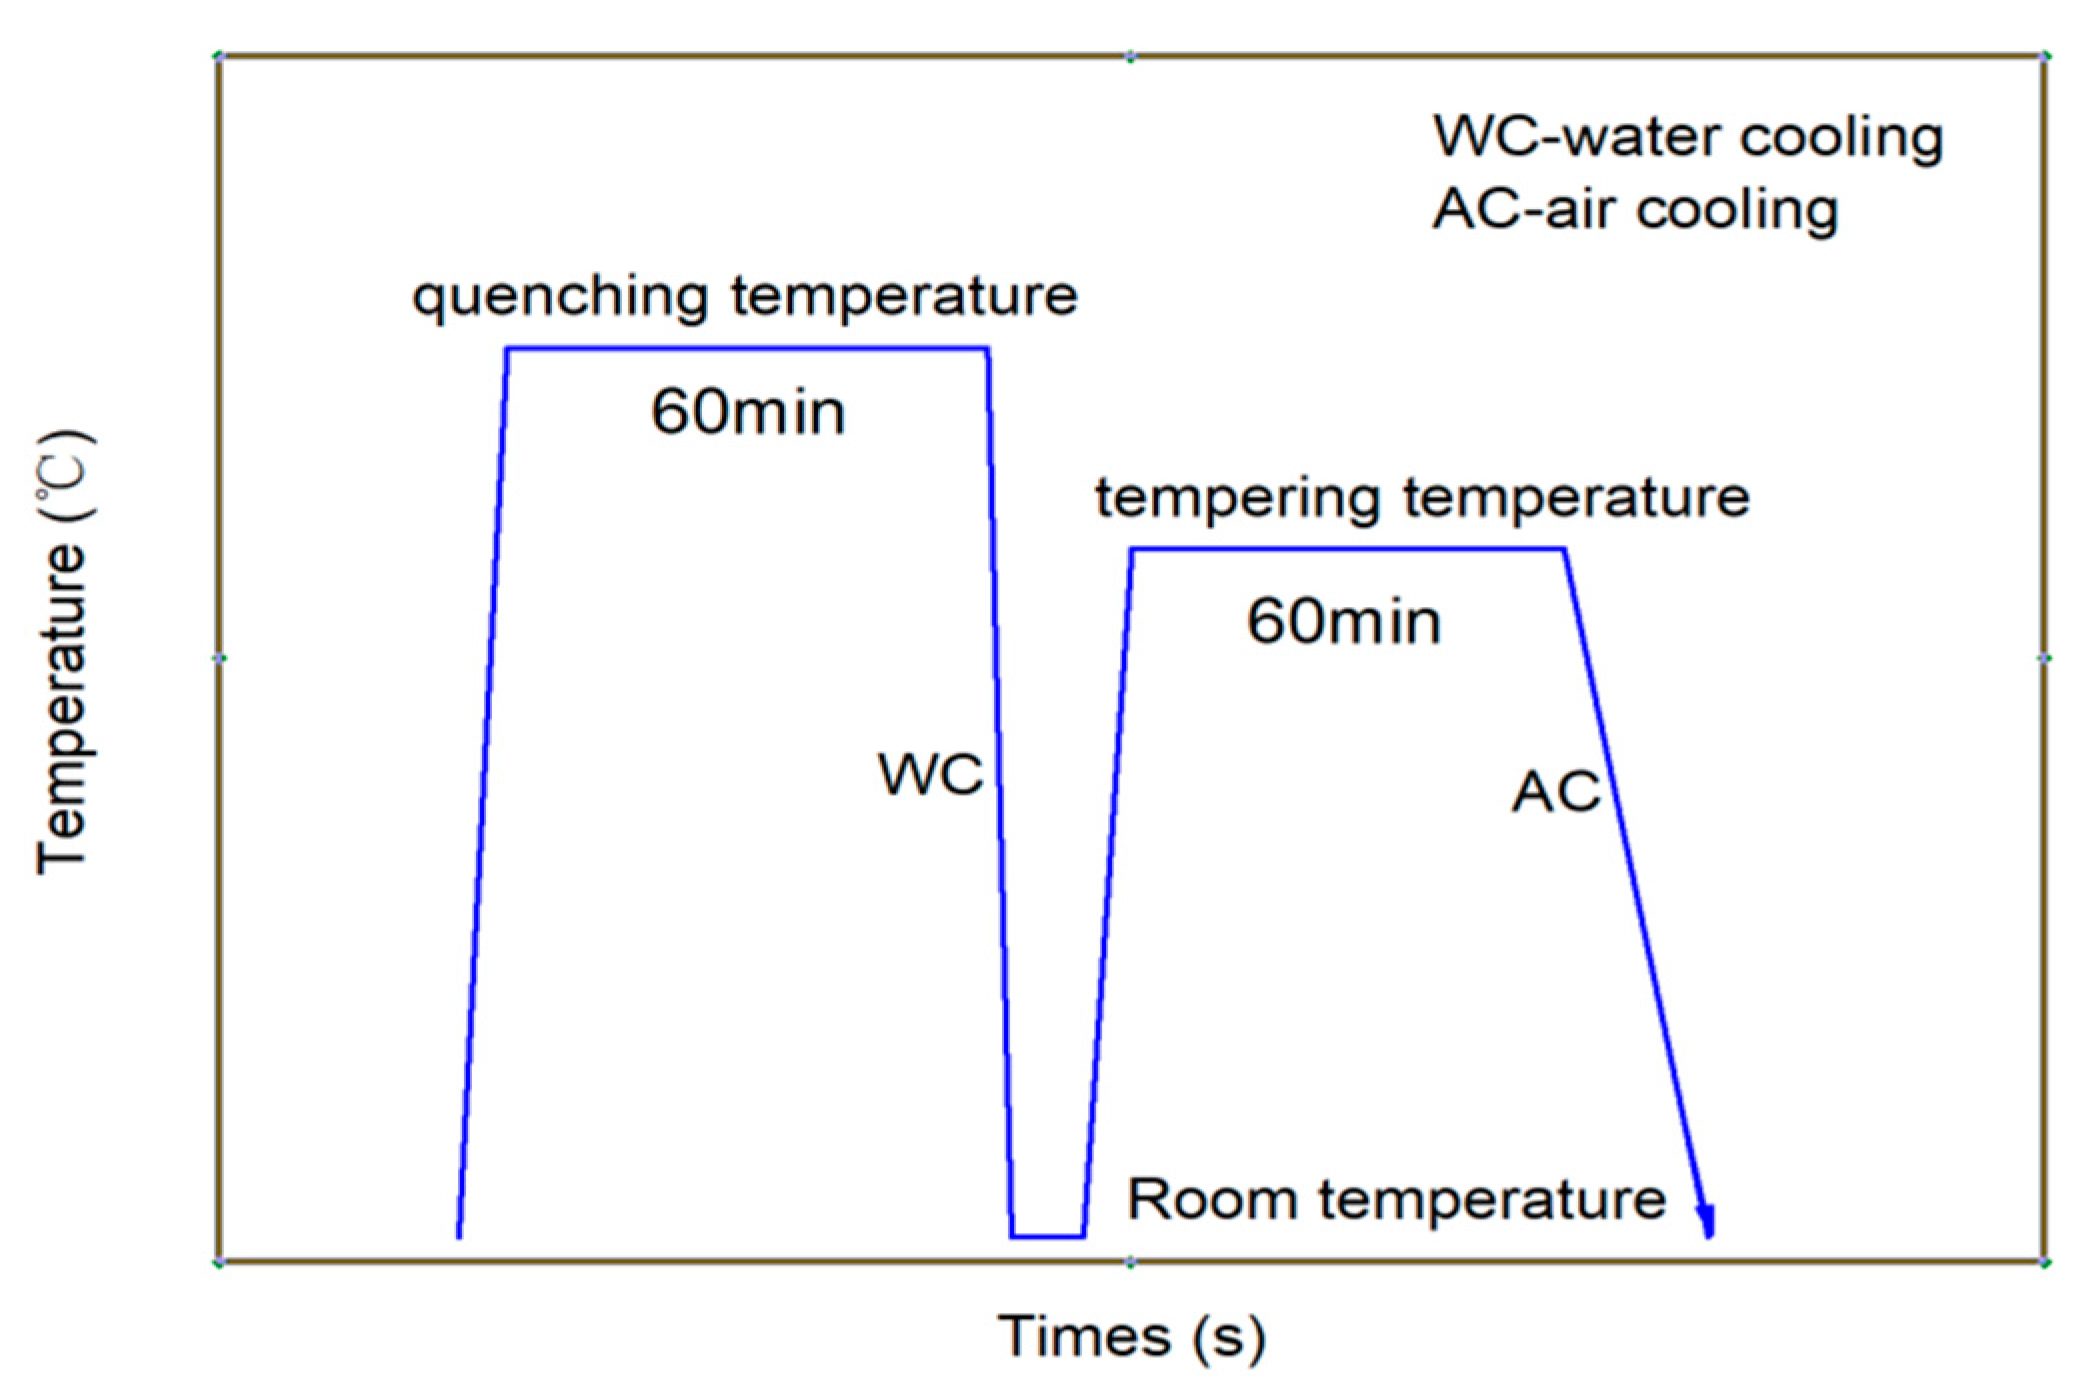
A quenching and tempering heat treatment process was adopted to obtain high strength and decreased hardness. The casing steels were austenitized at 900–930 °C for 60 min, and then followed by water quenching. Afterwards, the quenched steels were tempered within 690–710 °C for 60 min and then cooled in air to room temperature, as shown in Figure 1.
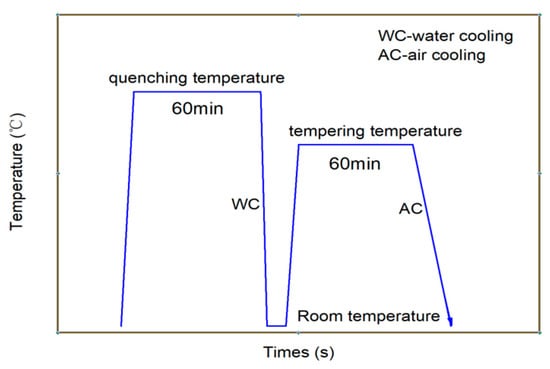
Figure 1.
Schematic drawing of the heat treatment routes of the experimental casing steel.
2.2. Assessment of Mechanical Property and SSC Resistance
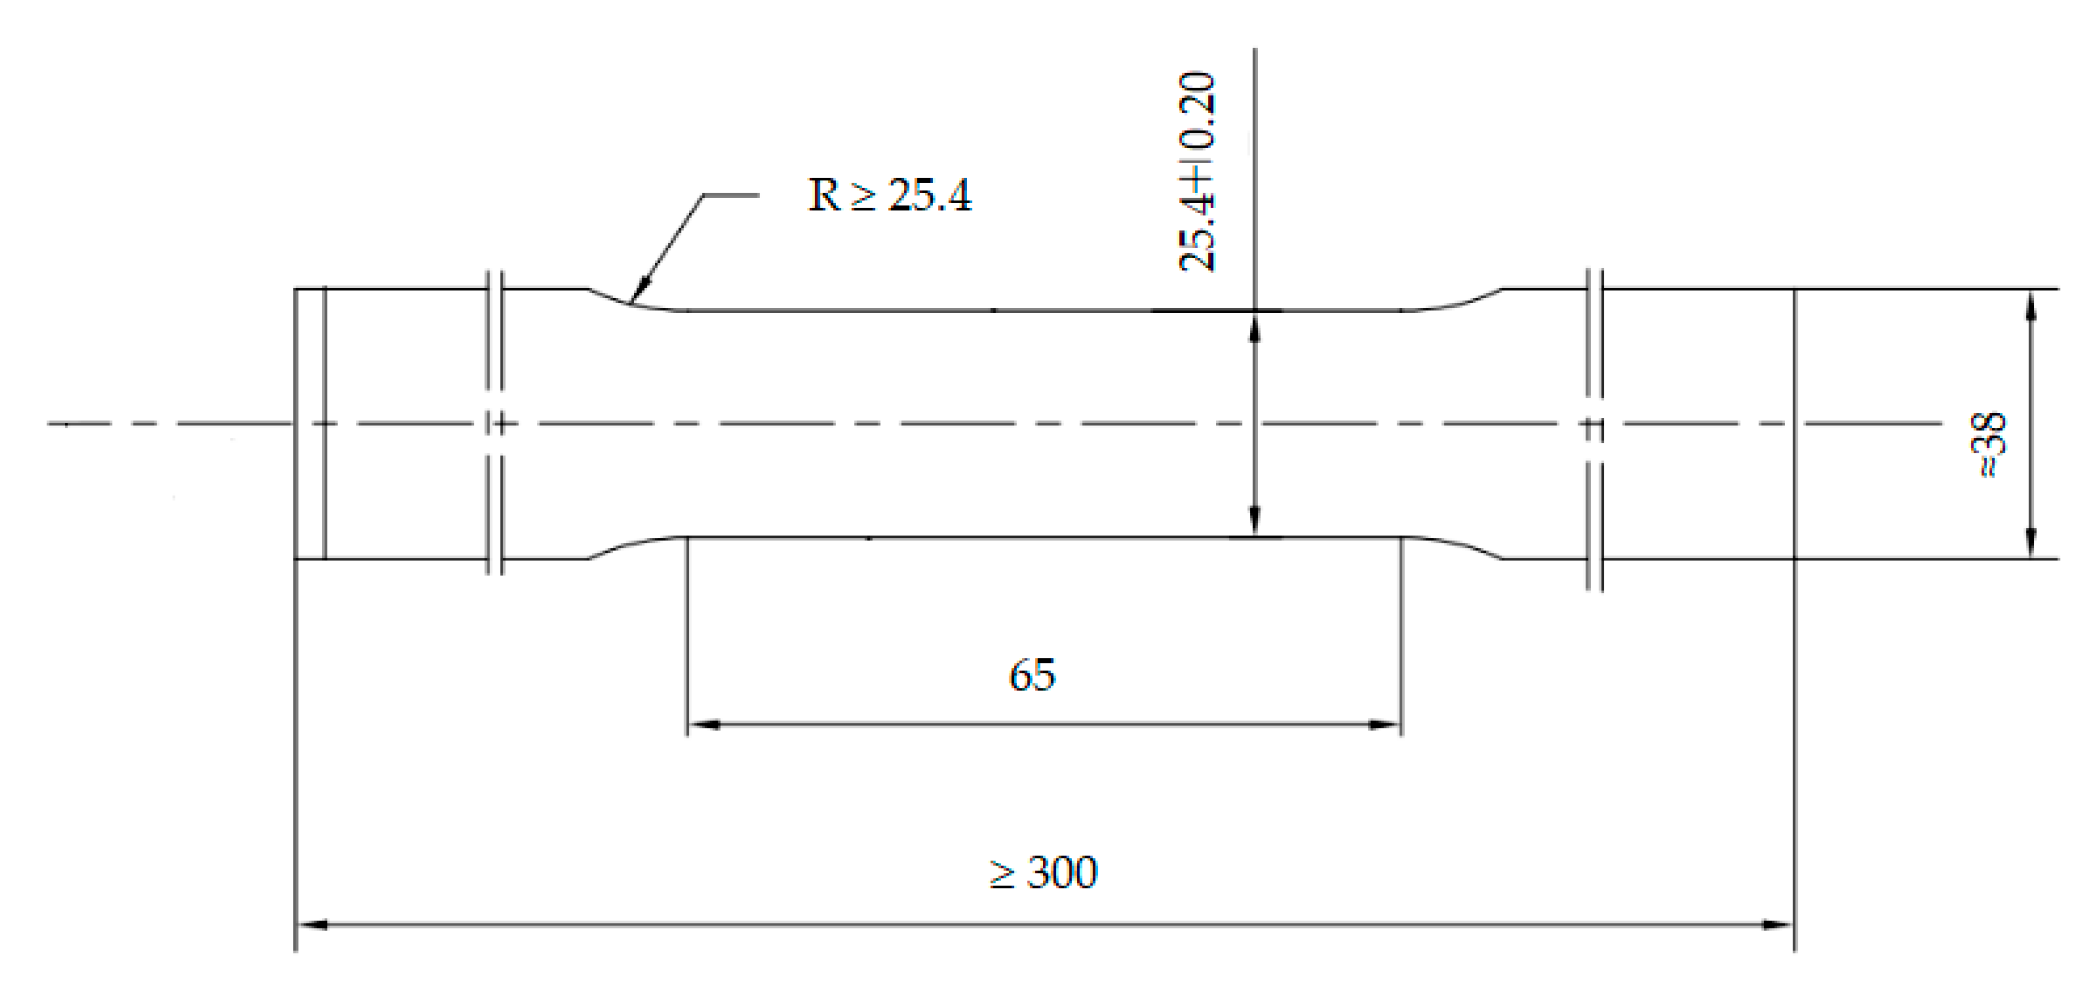
According to the standard ASTM A370-10 [28], the tensile specimens were prepared along the rolling direction of the casing. The geometry and dimensions are shown in Figure 2. The tensile tests were performed by a SHT4106 material mechanics testing machine (MTS System Corporation, Washington, DC, USA) at room temperature. A set of three samples was conducted in the test. It is worthy to note that yield strength (YS) was defined as the tensile stress required to produce 0.7% elongation under load. The average values of the three samples were decided to be the tensile properties. Rockwell hardness tests were carried out by a RB 2002T tester (Wilson, Norwood, MA, USA) with a load of 1500 N.
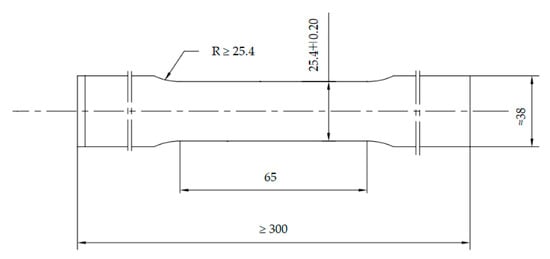
Figure 2.
Geometry and dimensions of tensile specimen.
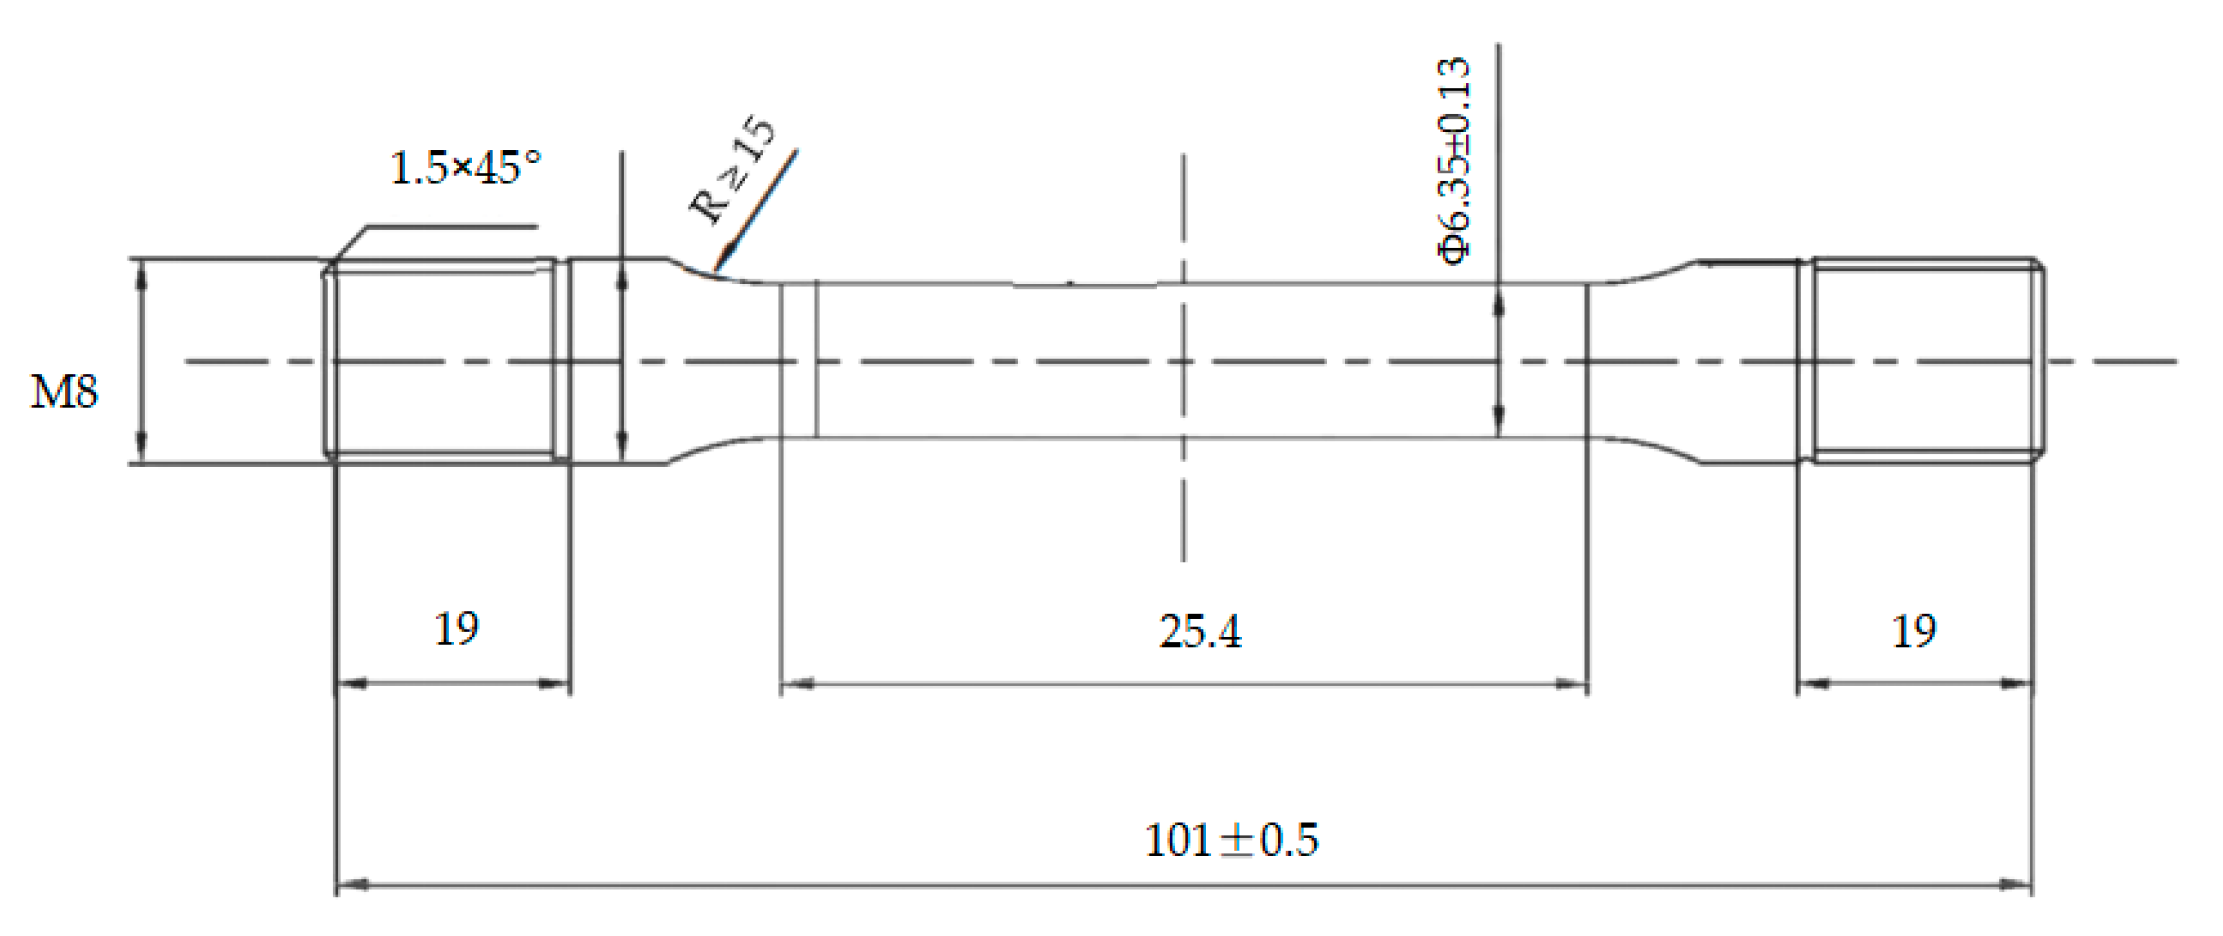
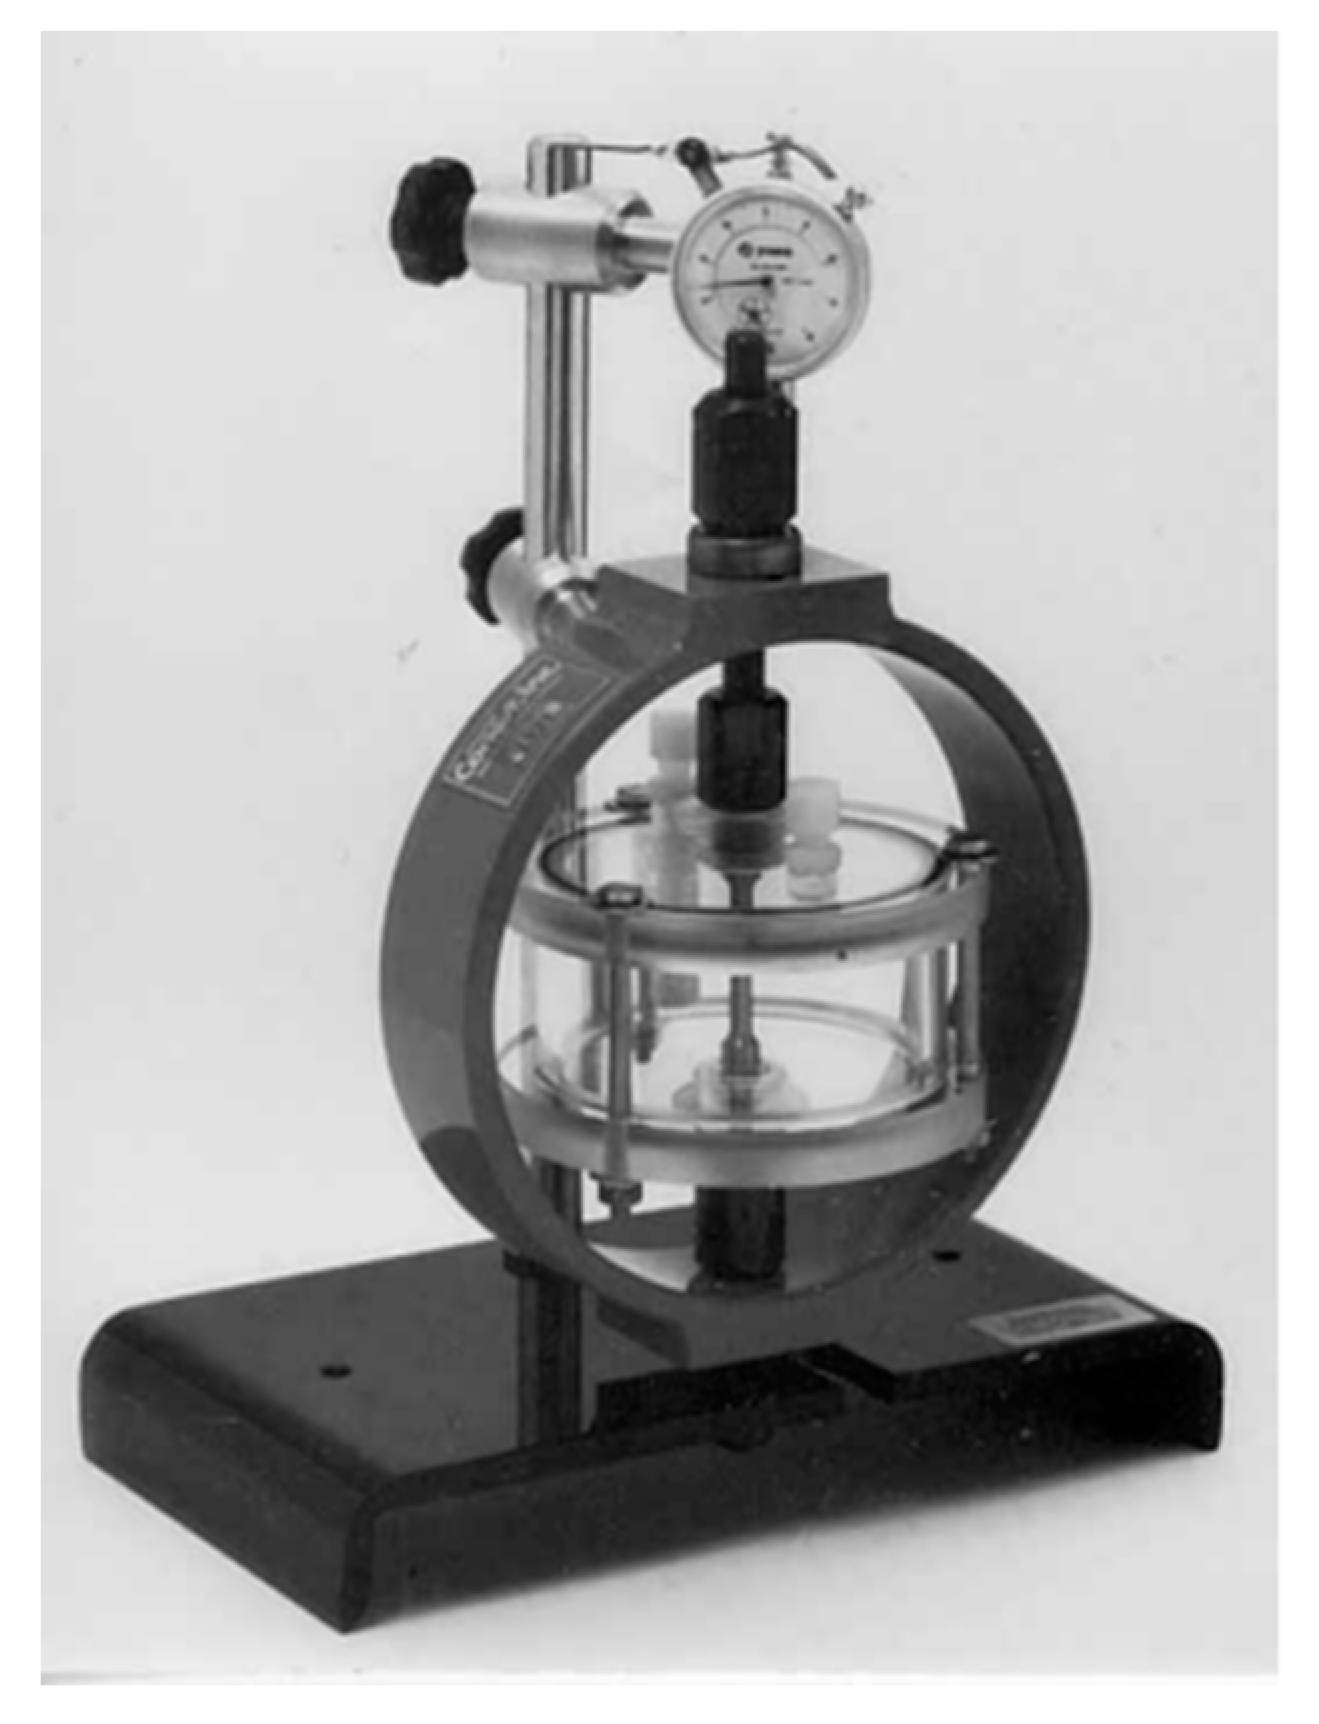
According to the A-tensile test method specified in the NACE standard TM0177-2016, the resistance to SSC of casing steels was evaluated by using round rod tensile test specimens with thread at both ends, as shown in Figure 3. The specimens were polished by silicon carbide paper up to 1200 grit before testing. The test solution consisted of 5.0 wt% sodium chloride and 0.5 wt% glacial acetic acid dissolved in distilled water. The specimen was assembled in a proof ring containing the test solution with saturated H2S, and was stressed at 85% of the casing yield strength for 720 h. If the specimen broke before 720 h of loading, or the micro-crack was observed in the gauge length section under microscope (10× magnification) after 720 h of loading, the SSC test was defined as failed. The fracture time was recorded. The PH value of the test solution before and after testing was 2.7 and 3.5, respectively. The proof ring was selected for this sustained load device, as shown in Figure 4.
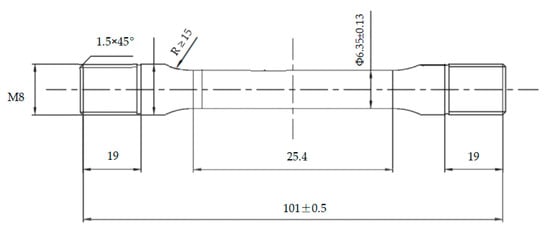
Figure 3.
Geometry and dimensions of SSC test method-A tensile specimen.

Figure 4.
Proof ring.
2.3. Microstructure Observation
The specimens used for microstructural observation were cut by electric discharge machining (EDM) from the cross sections of the tested samples. The specimens for the SEM analysis were ground with silicon carbide papers progressively up to 1500 grit and were then polished and etched with a 4% nital alcohol solution. Another three specimens for EBSD analysis were cut by EDM, polished with 1 μm diamond paste, and then argon ion beam etching was used for further fine polishing to remove surface residual stress at the final stage.
The SEM micrograph and EBSD maps were obtained by Tescan mira 3 field emission scanning electron microscope equipped with NordlysNano EBSD detector. For local misorientation mapping, an EBSD scan was performed under 30 kV and 16 nA electron beams with a bin size of 2 × 2 to achieve a decent angular resolution, and the scan step size was set at 100 nm to ensure appropriate spatial resolution [29]. The specimen was tilted at an angle of 70°. The grain boundaries and local strain distribution of the three specimens were calculated from the corresponding EBSD data, with the help of HKL Channel 5 (Oxford Instrument, Abingdon, UK) software.
TEM discs approximately 0.4 mm in thickness were cut from the steel using EDM and mechanically polished to approximately 50 μm, and then prepared by a twinjet electropolishing apparatus with 5 vol% perchloric acid and 95 vol% alcohol solutions at around −30 °C [22]. TEM bright field (BF) imaging and selected area electron diffraction (SAED) patterns were obtained using a Thermo ScientificTM Talos F200X transmission electron microscope (TEM) (Thermo Fisher Scientific, Shanghai, China) at an acceleration voltage of 200 kV. The morphology, scale, and distribution of precipitation particles, as well as the morphology and width of the martensite lath were further analyzed in STEM (scanning transmission electron microscope) mode. The crystal structure of precipitation particles was determined by SAED analysis.
3. Results
3.1. Mechanical Property and the SSC Resistance
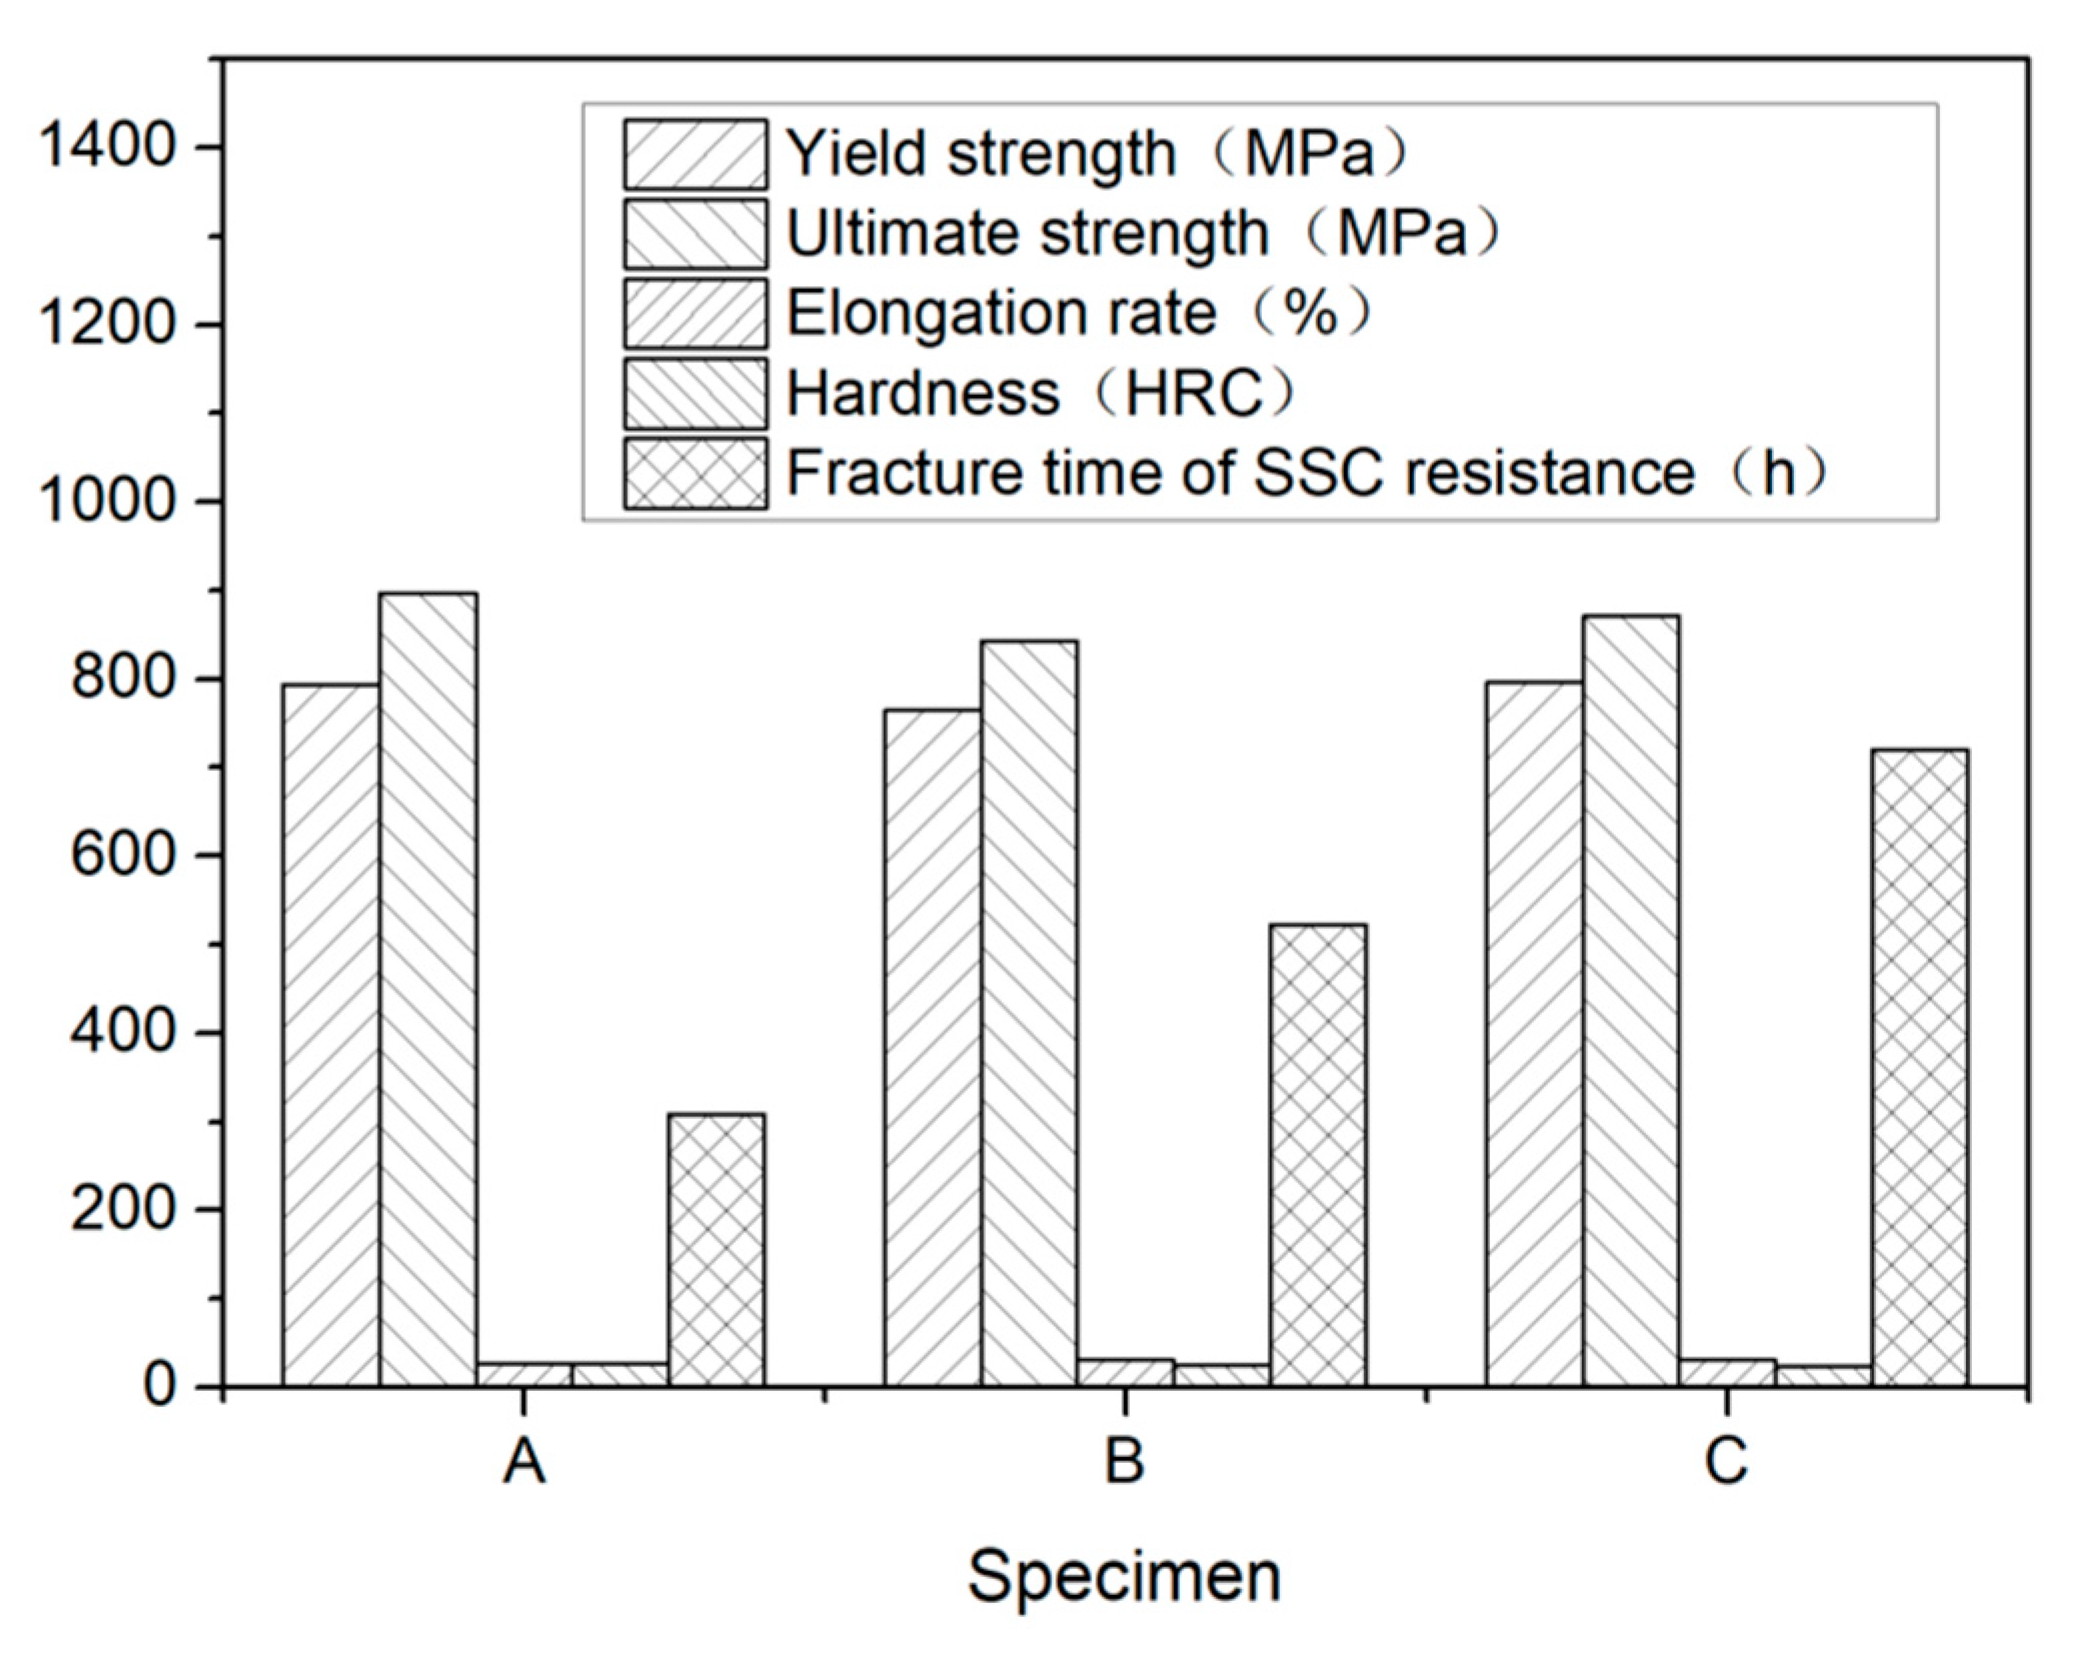
The mechanical properties and the breakage time of the SSC testing specimens are presented in Table 2 and illustrated in Figure 5, respectively. While steel A and C had a nearly the same yield and ultimate strengths, steel B had a lower tensile strength than steel A and C. The hardness of steel A was higher than steel B and C. Although there exists some differences among the three steels, the mechanical properties of steel A, B, and C can all achieve the requirements of 110 ksi grade steel specified in API Spec 5CT [30].
Table 2.
Mechanical properties and fracture time of SSC test.
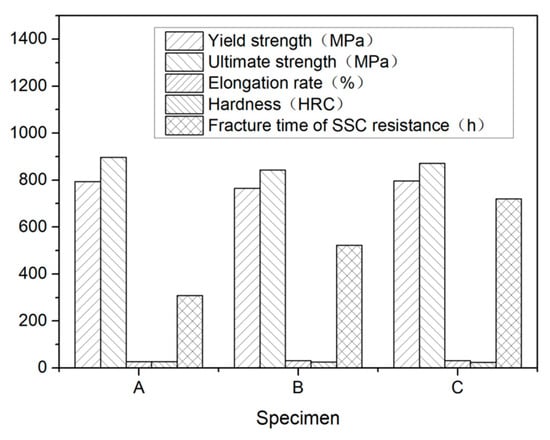
Figure 5.
Mechanical properties and fracture time of SSC testing.
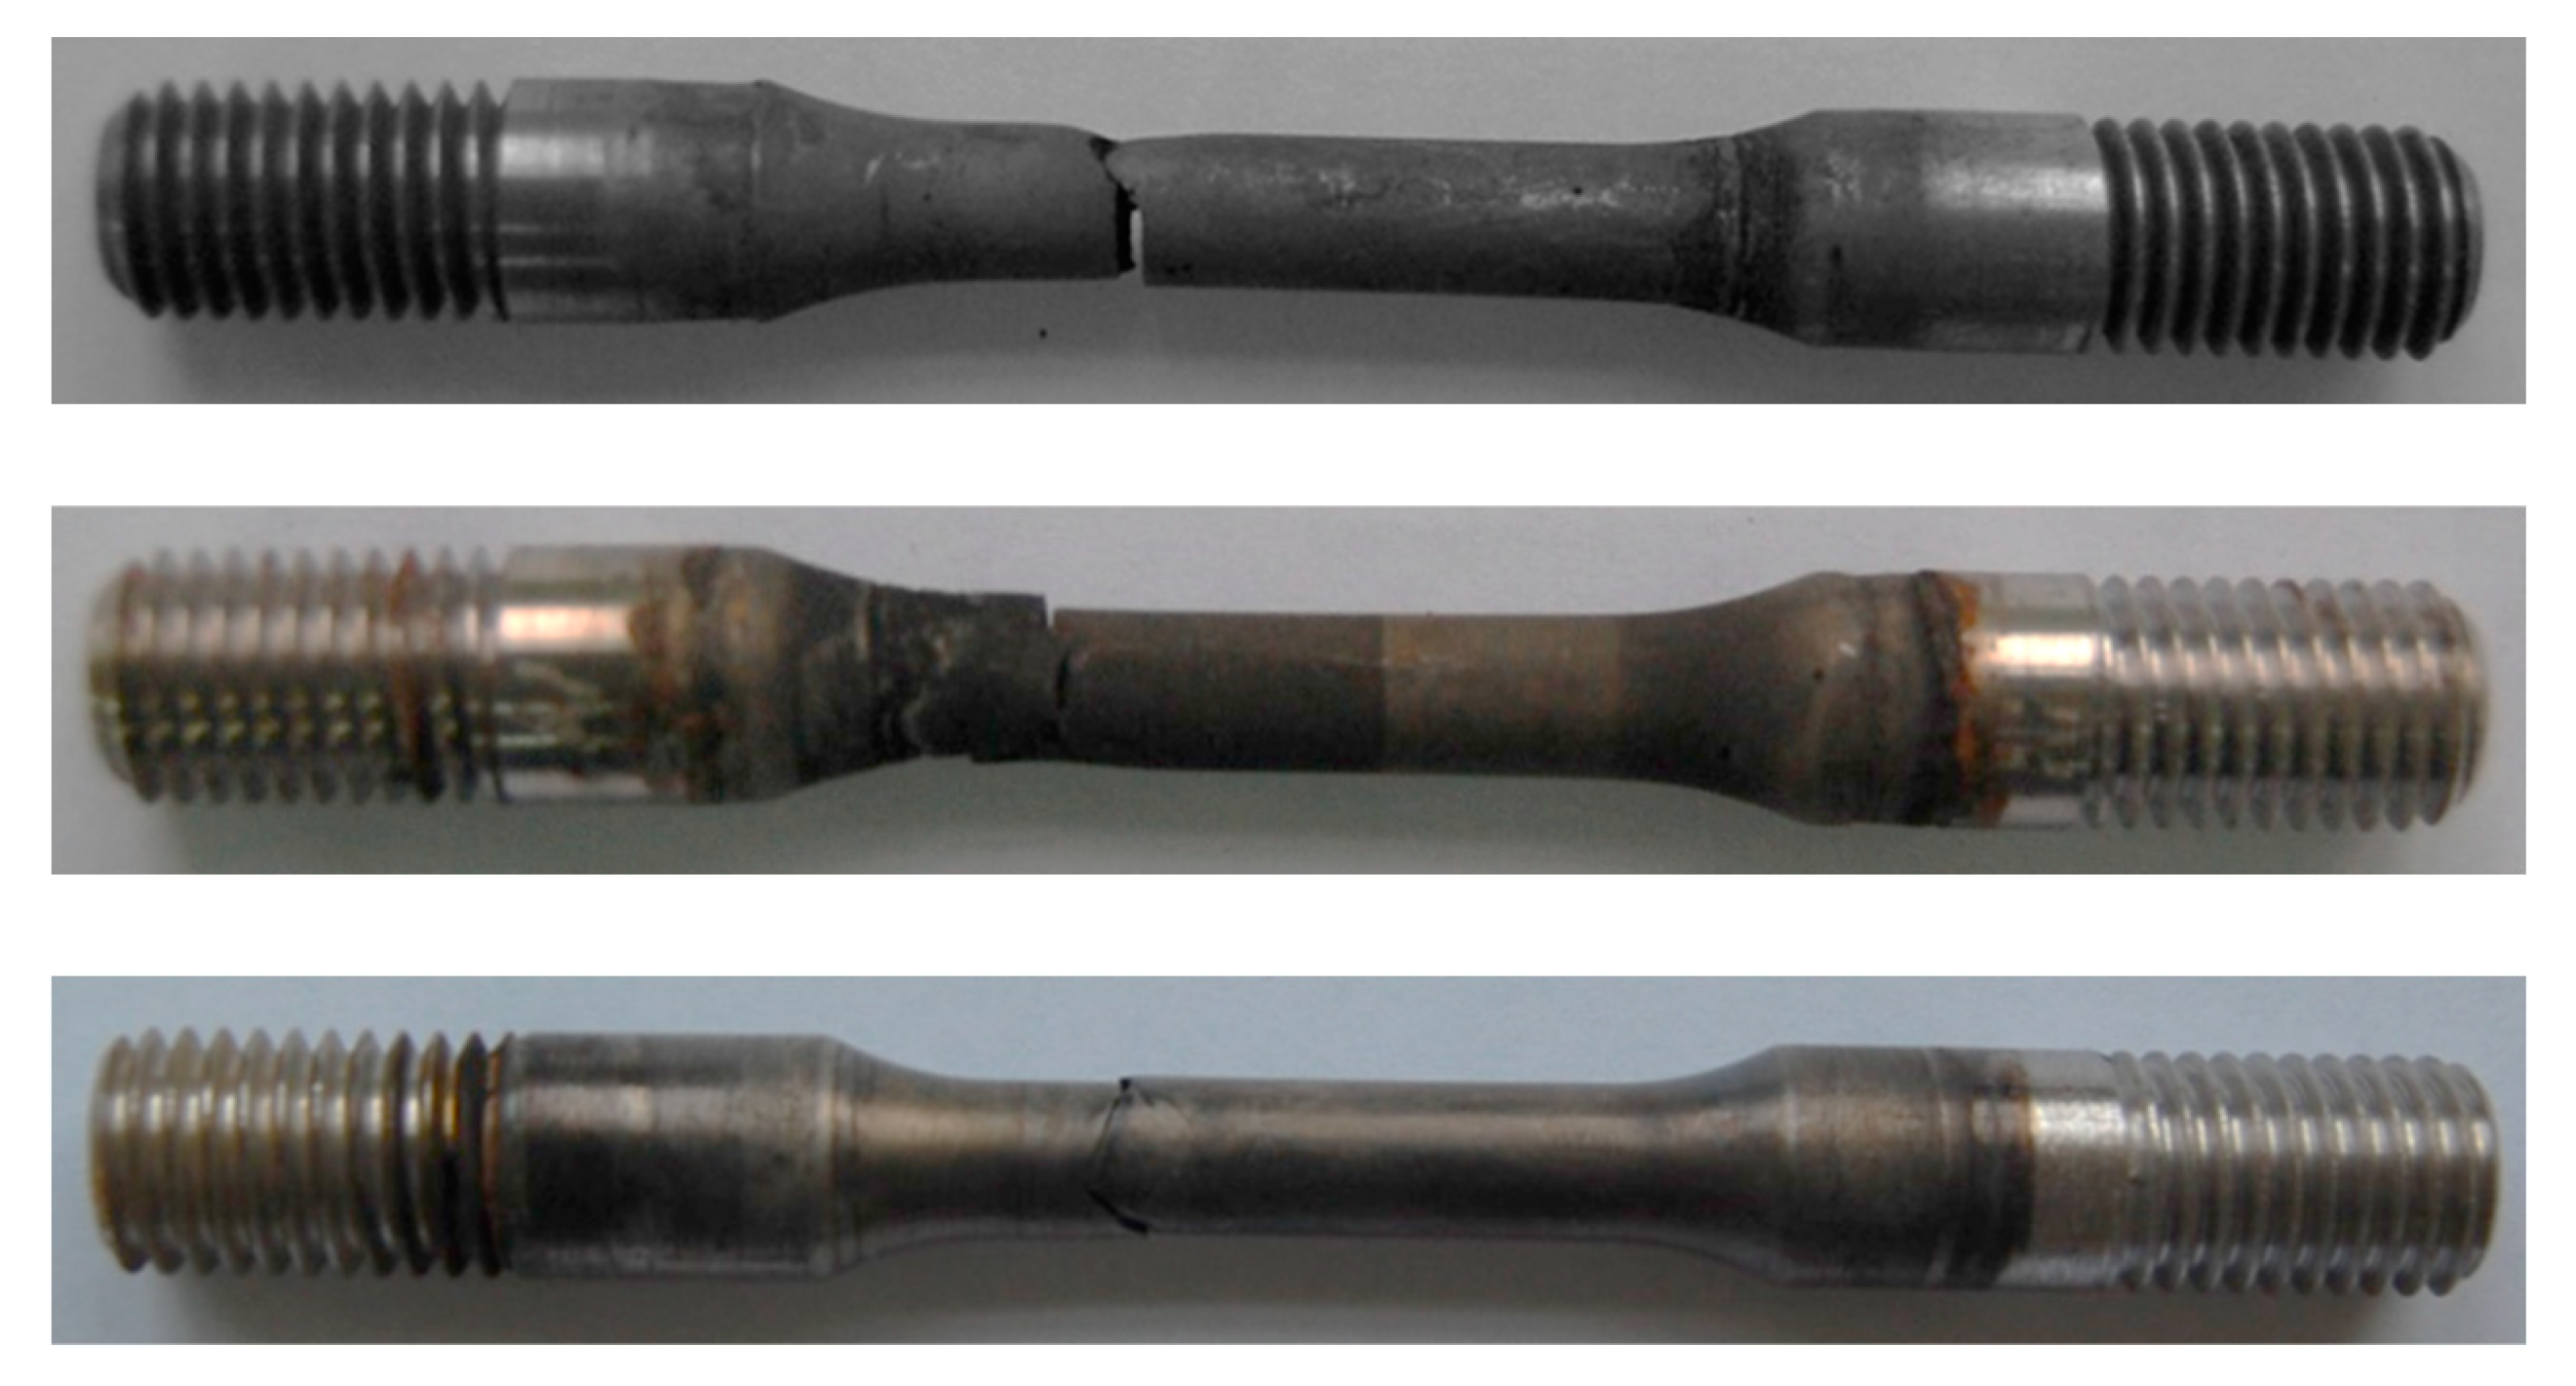
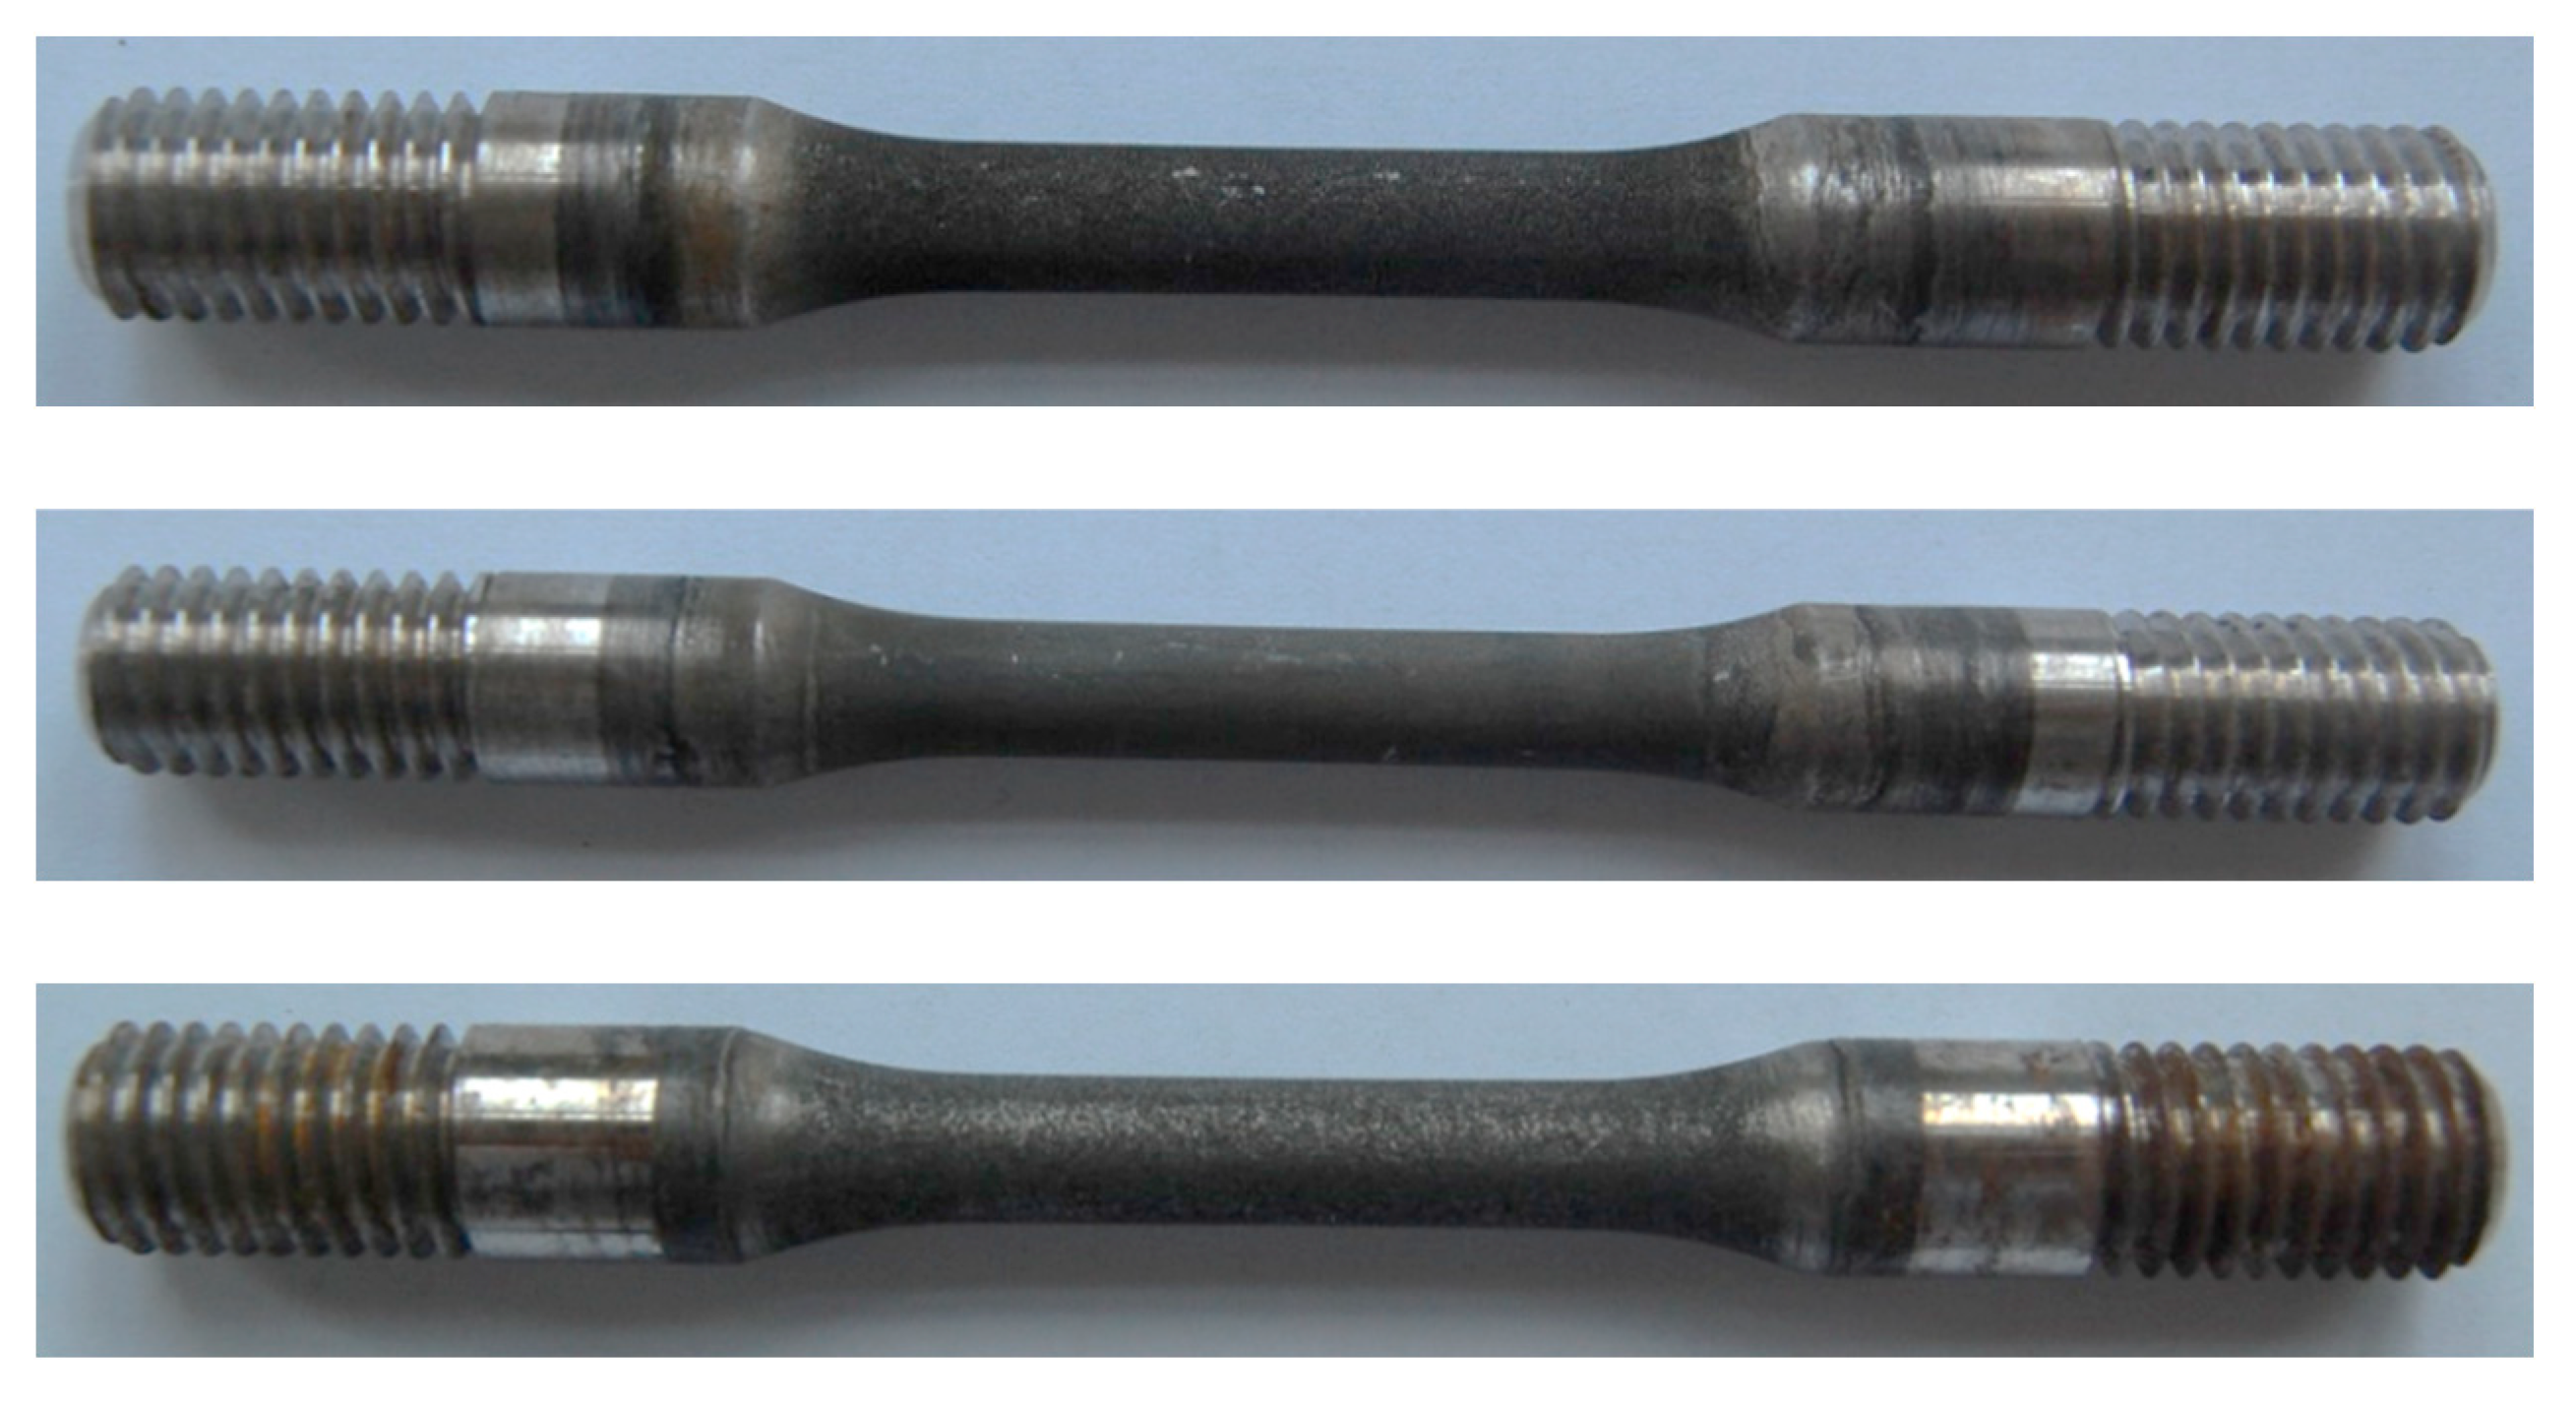
The results of SSC resistance evaluation test of three steels had significant difference. The average break times of steel A and B were 309 h and 523 h, respectively (shown in Figure 6 and Figure 7) while the three specimens of steel C were not broken and has no cracks under microscope after 720 h of loading with 644 MPa, which meet the requirement of C110 grade specified in API Spec 5CT. The specimens of steel C were shown in Figure 8.
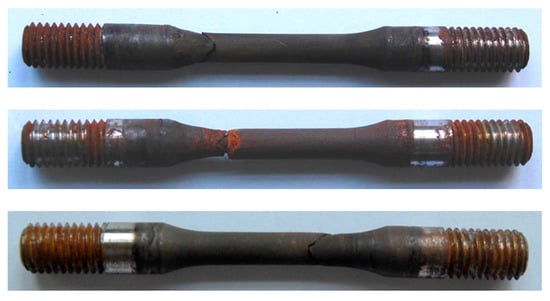
Figure 6.
SSC evaluation test specimens of steel A.
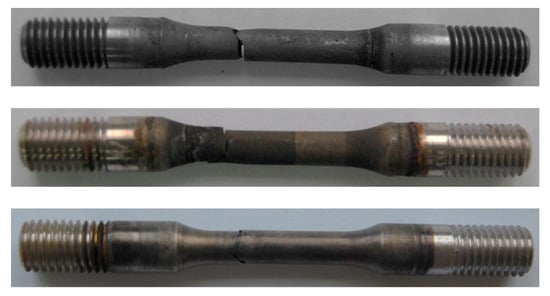
Figure 7.
SSC evaluation test specimens of steel B.
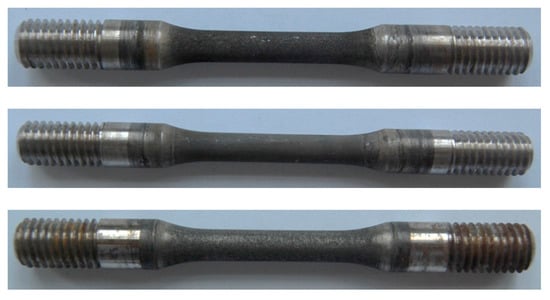
Figure 8.
SSC evaluation test specimens of steel C.
3.2. Fracture Surface and Microstructure Observation
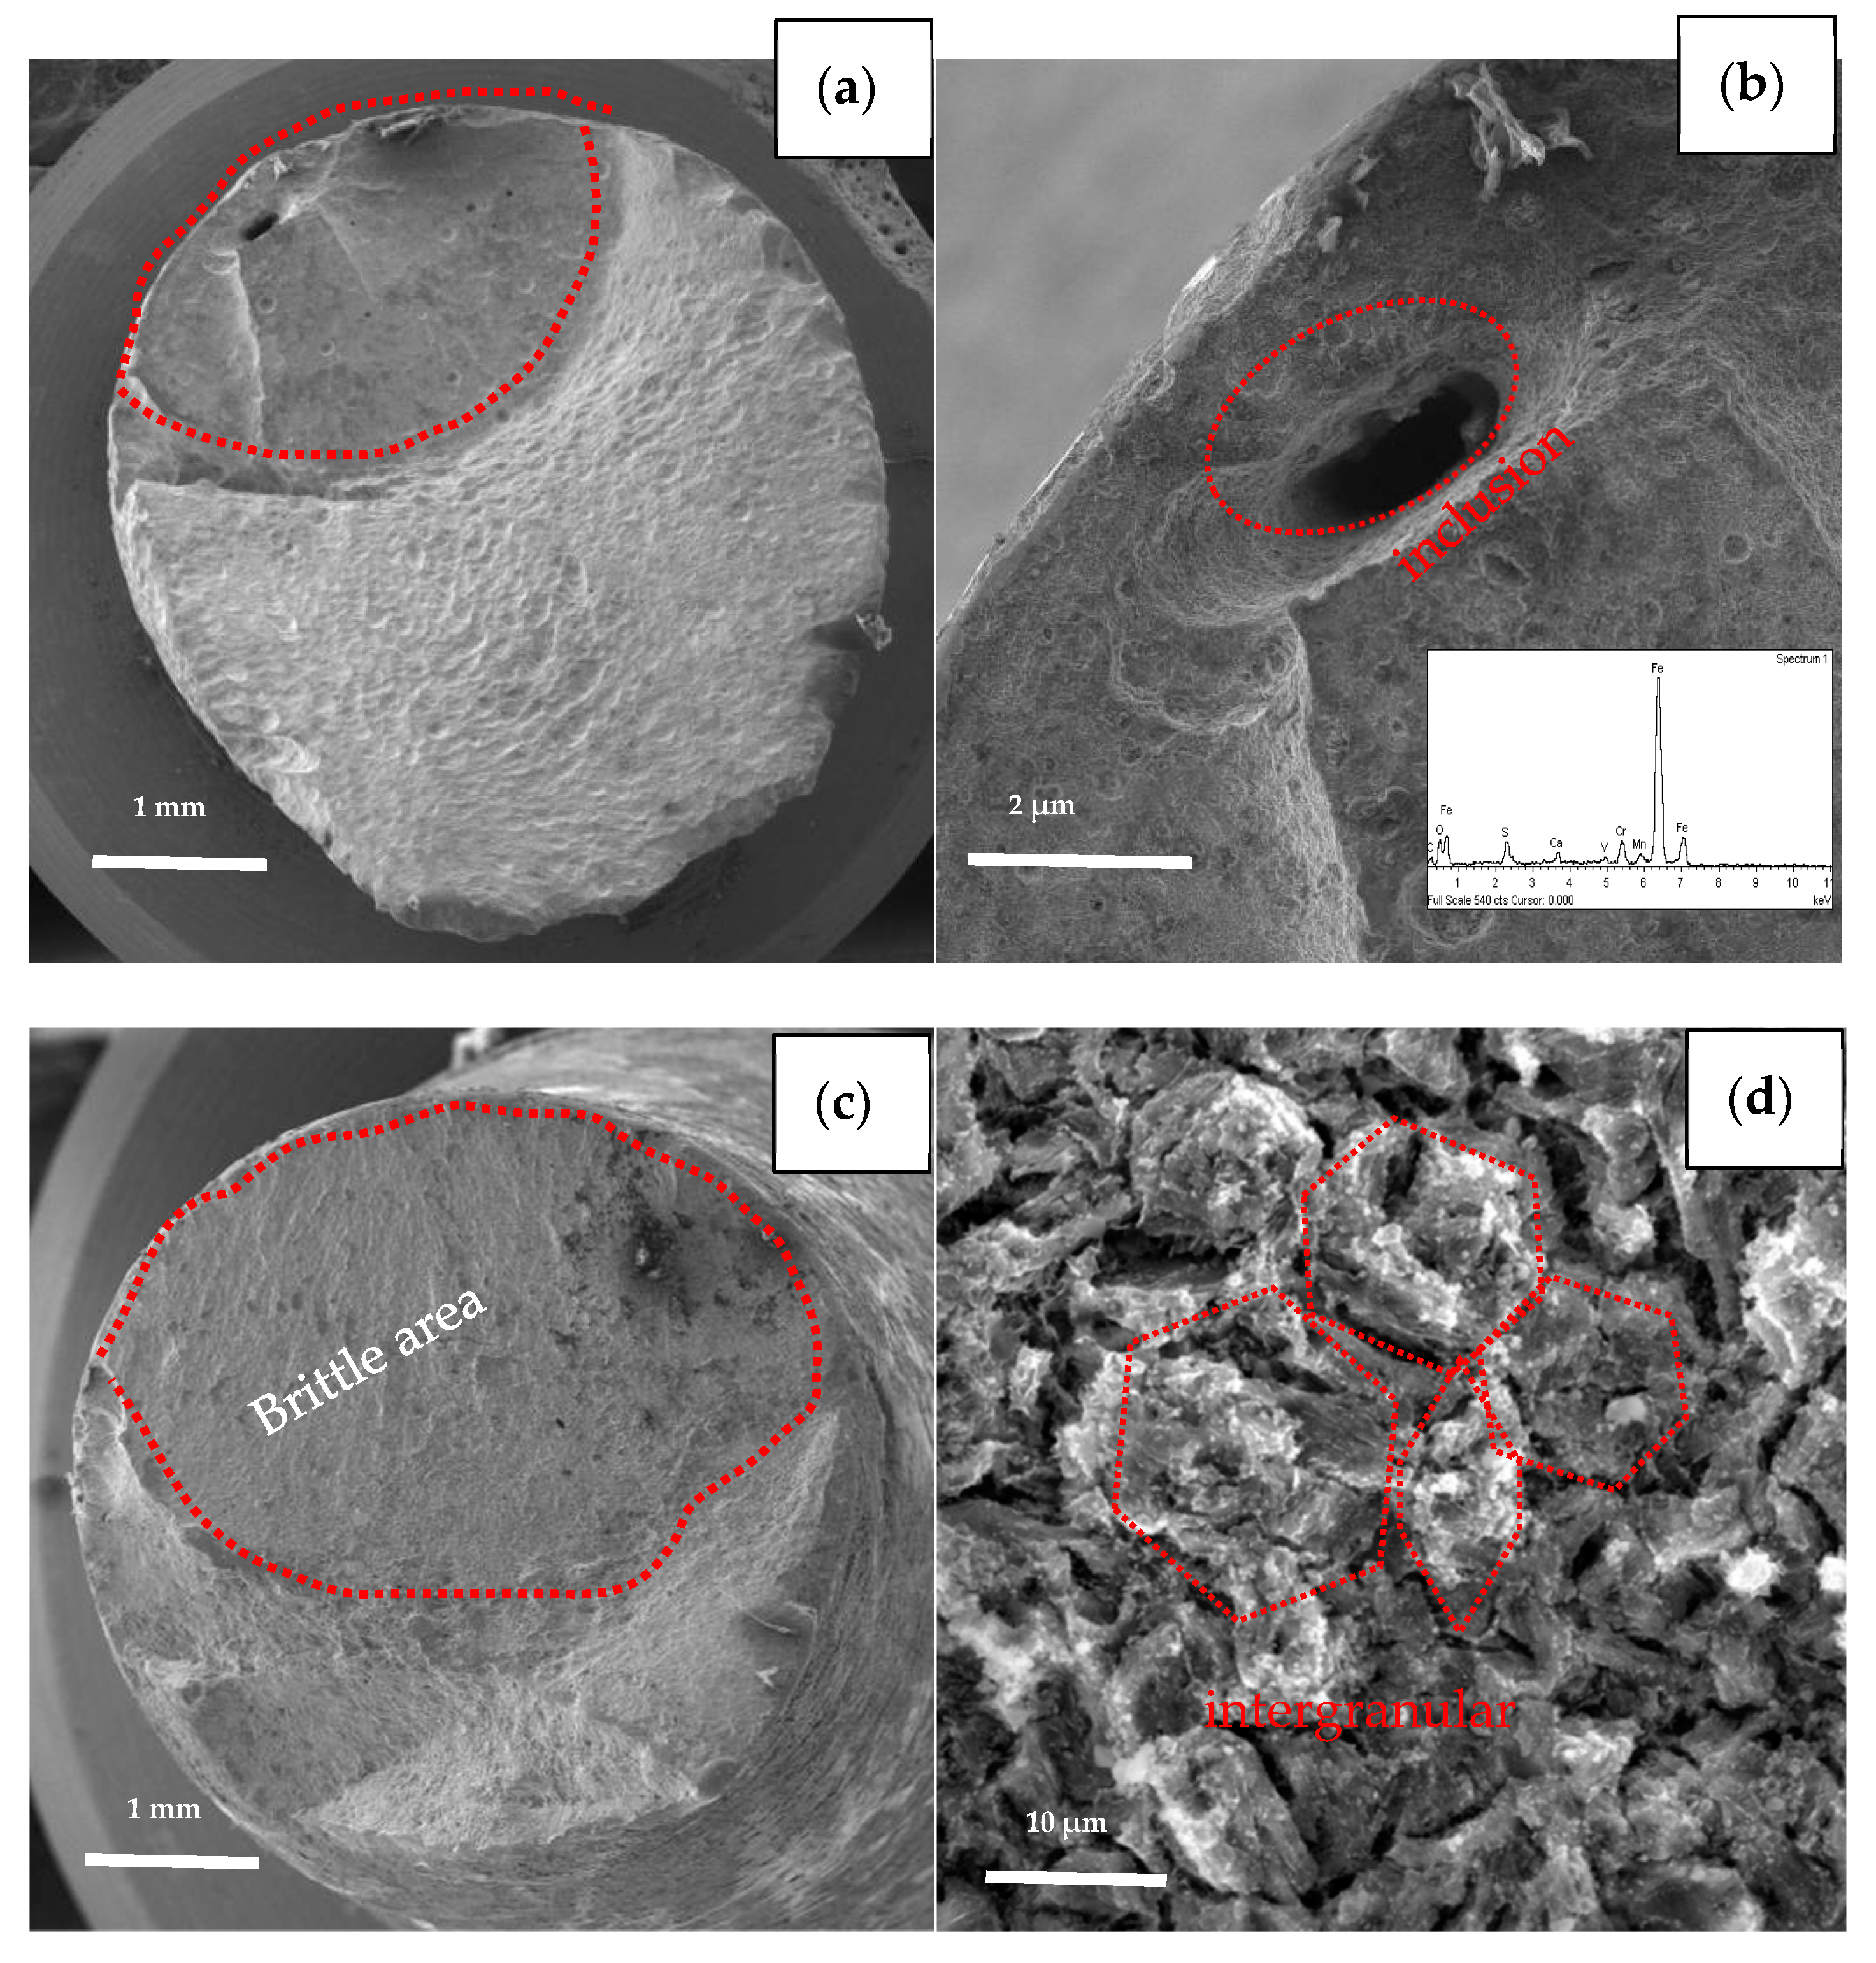
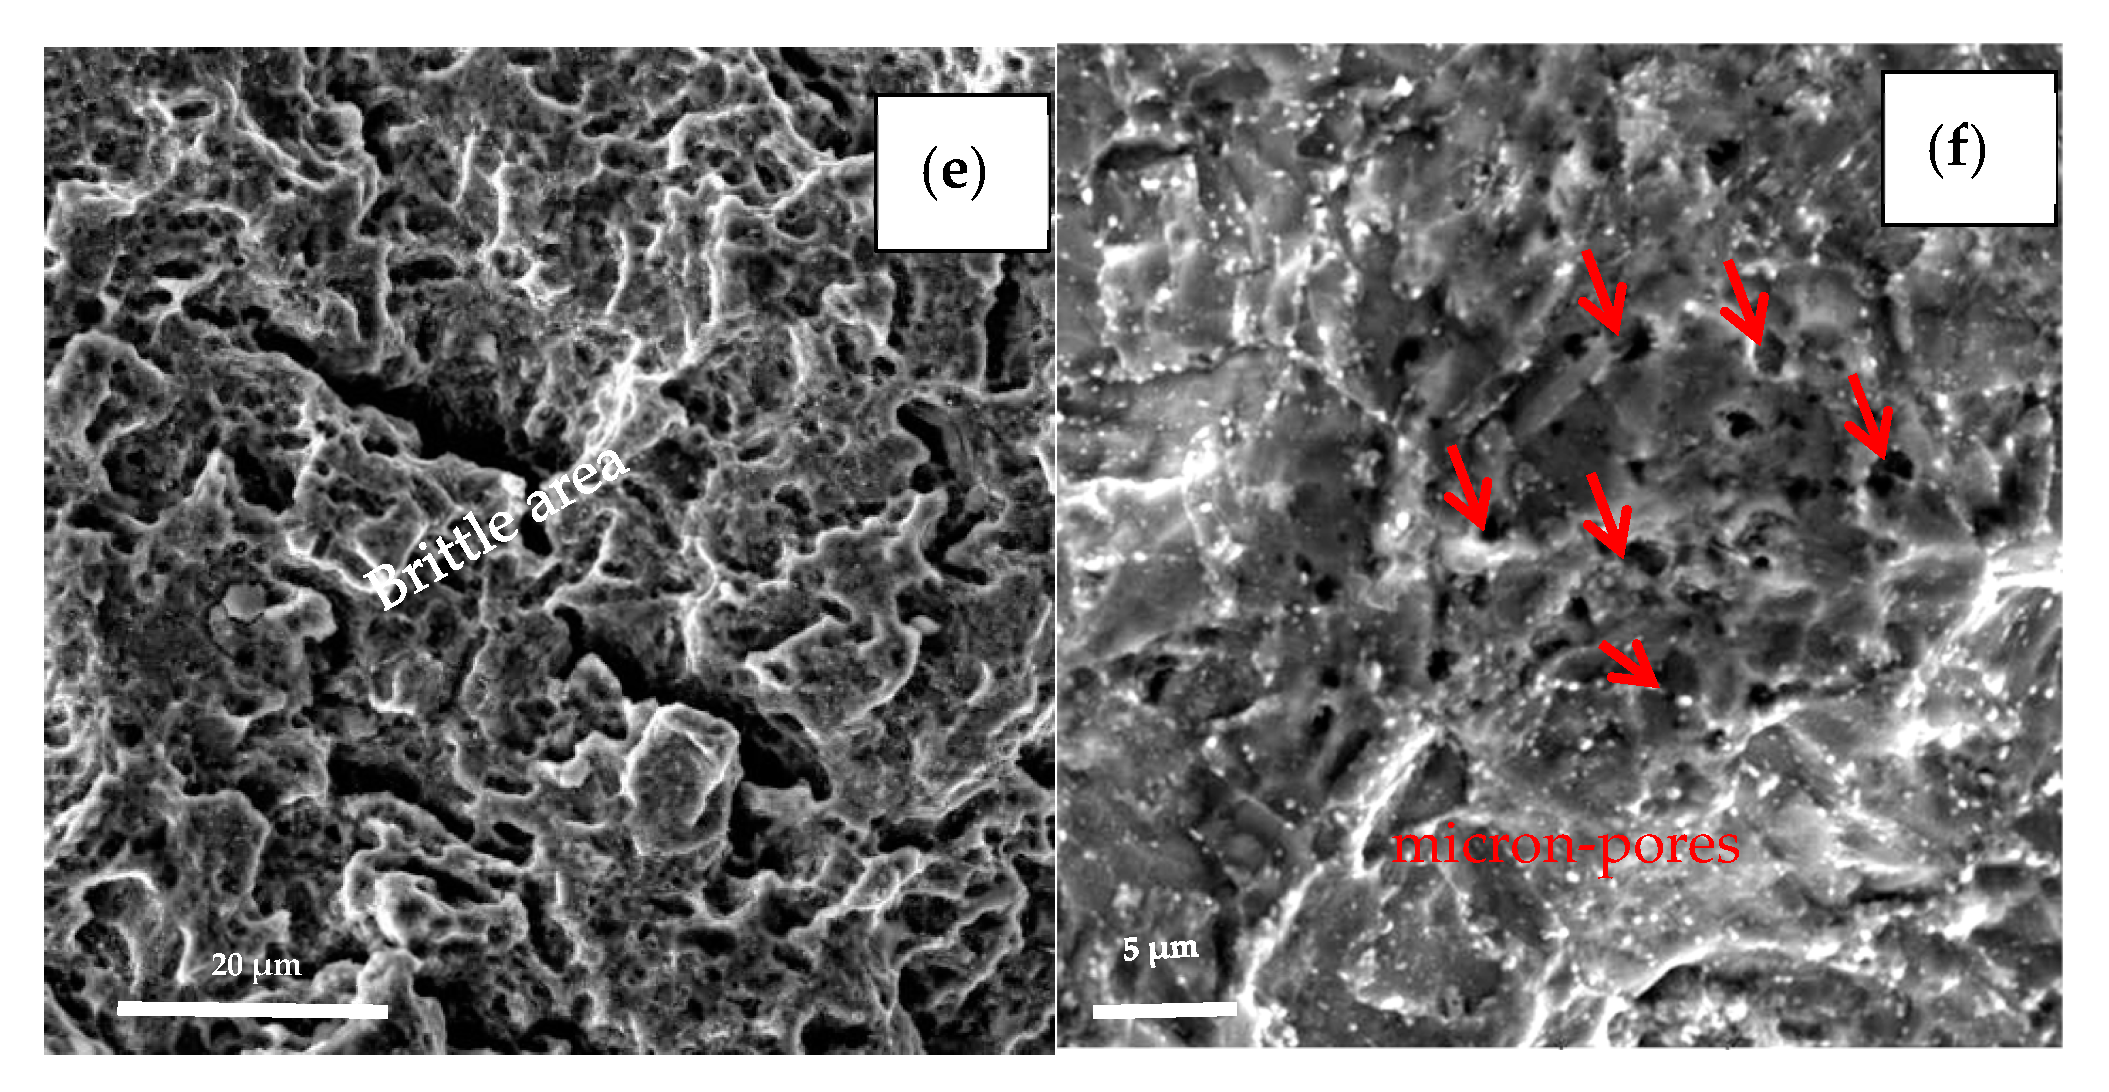
3.2.1. Fractography
The specimens with the earliest and last fracture of the SSC test were selected to be examined by SEM. The earliest fractured specimen ruptured at 196 h with loading, which belongs to steel A, while the last fractured specimen (steel B) broke at 647 h with loading as shown in Figure 9. Comparing the two fracture behaviors, the brittle area of the earliest broken specimen (steel A) is smaller than latter one (steel B), (see Figure 9a,c). The fracture of steel A specimen originates in a micron scale hole, which was caused by the loss of oversize inclusion. Analyzed by EDS, the inclusion is composed of Mn, S, Ca, O, etc., as shown in Figure 9b. The fracture of the steel B specimen is initiated from the outside surface, and “intergranular” surfaces with numerous secondary cracks perpendicular to the surface, following prior austenitic grain boundaries are observed at the initiate zone, as shown in Figure 9d. In addition, the propagation zone exhibits mainly non-intergranular type fractures with secondary cracks (Figure 9e). There are also many micro-pores (pointed by red arrow in Figure 9f) distributed along the grain boundaries and within the grains, several of them are filled with slightly larger particles, as shown in Figure 9f.


Figure 9.
Fracture surfaces morphologies of the earliest broken specimen (a,b) and the last broken specimen (c–f).
3.2.2. Microstructure Observation
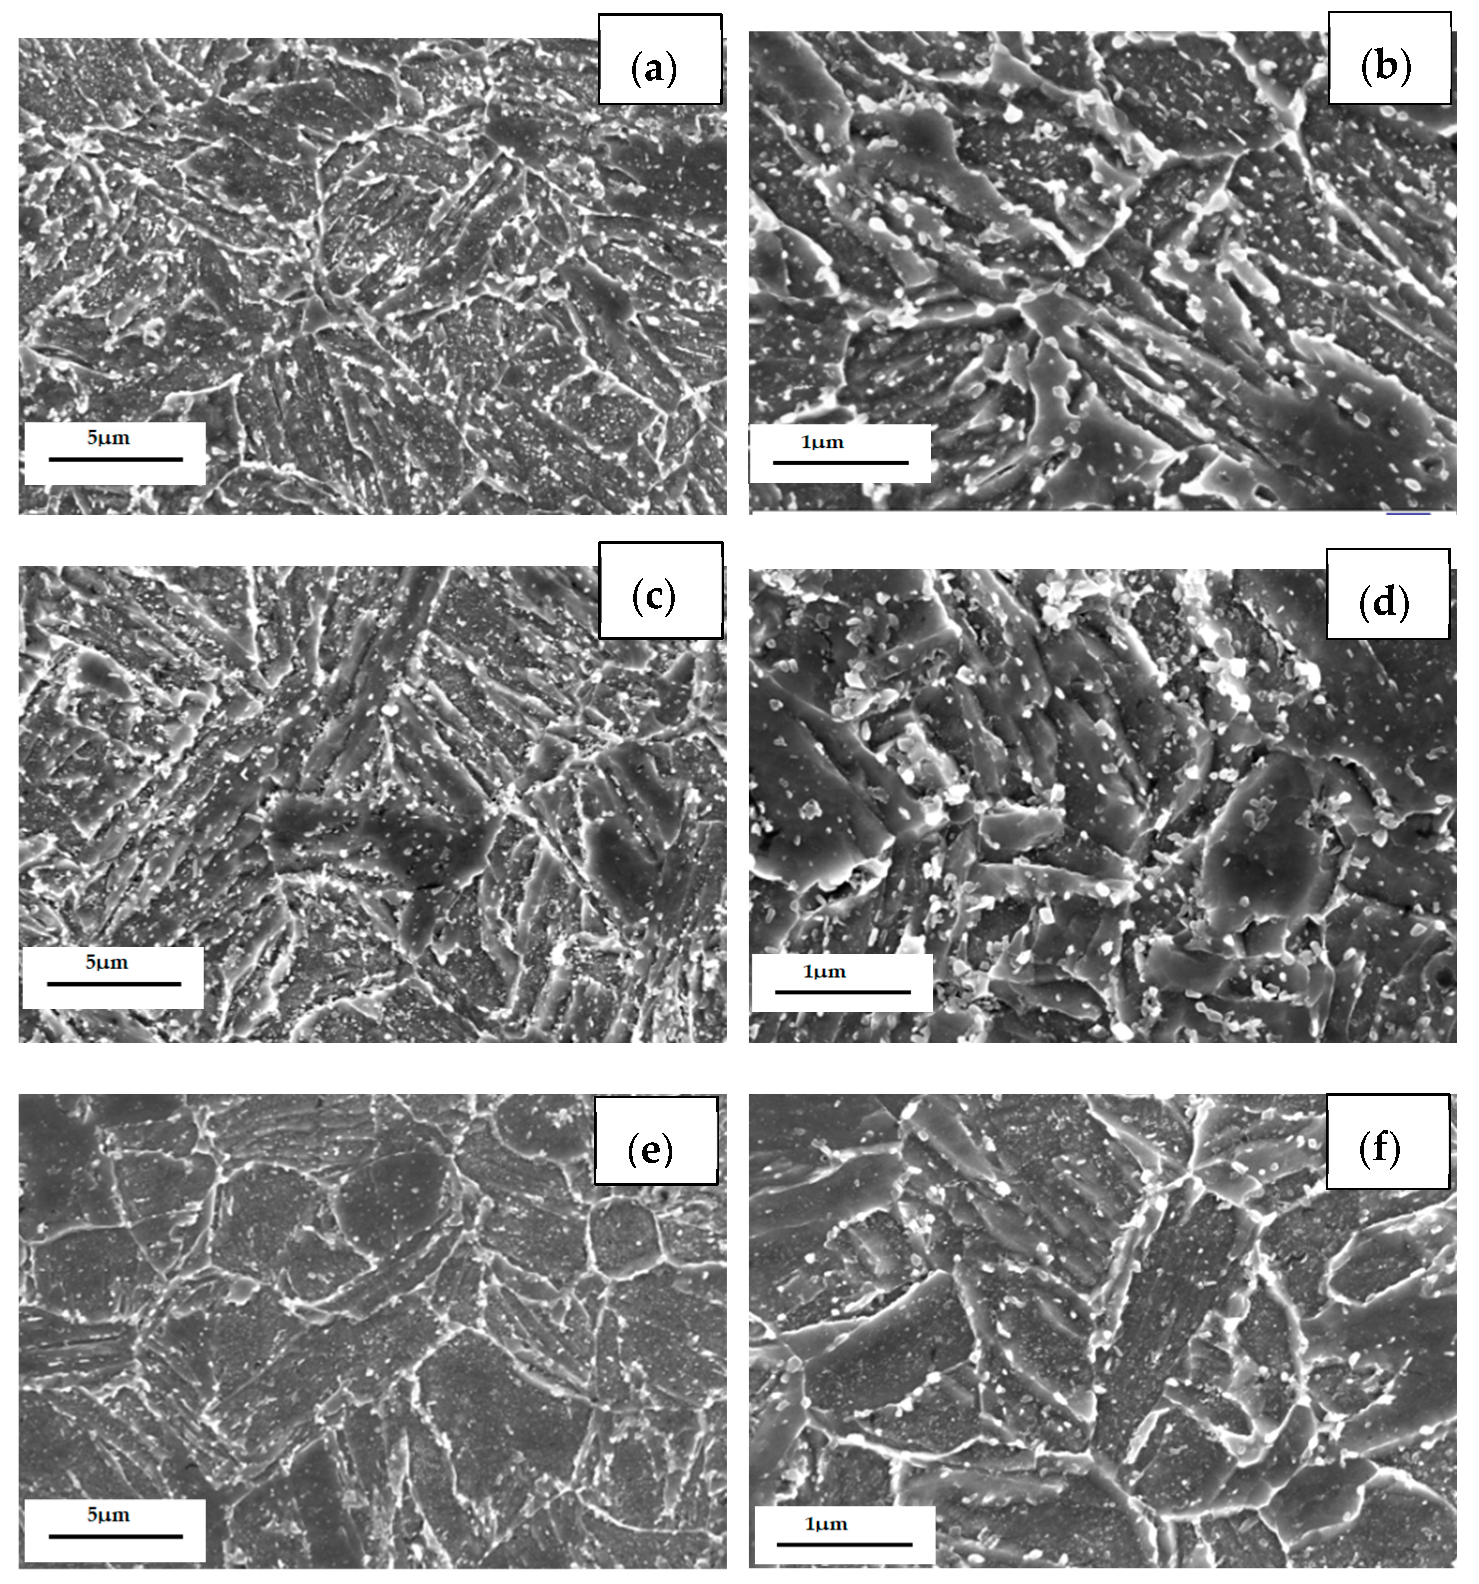
As shown in Figure 10, the microstructure of the three casing steels was characterized by SEM. Recrystallized ferrite grains, spheroidized cementite with uniformly distributed carbide particles can be observed for all three quenched and tempered casing steel microstructures. The lath martensite of steel B is wider than steel A, but thinner than steel C. The lath martensite of steel C is already replaced by equi-axed ferrites, as shown in Figure 10a,c,e. The cementite particles (white color precipitated from martensite) are distributed inside ferrite grains or along ferrite grain boundaries. Due to the greater ease of diffusion at the grain boundaries, cementite preferentially nucleates in these locations and gradually spheroidized by a diffusion transformation during tempering. The sizes of carbides in the three specimens range from several tens of nanometers to hundreds of nanometers. A closer observation reveals that there are more coarsened particles that are distributed along the grain boundaries in steel A than the other two steels; on the other hand, more tens of nano-scale particles are distributed inside the ferrite grains in steel C than the other two steels, as seen in Figure 10b,d,f.

Figure 10.
SEM micrographs of (a) steel A, (c) steel B and (e) steel C specimens; (b,d,f) are higher magnification images of (a,c,e).
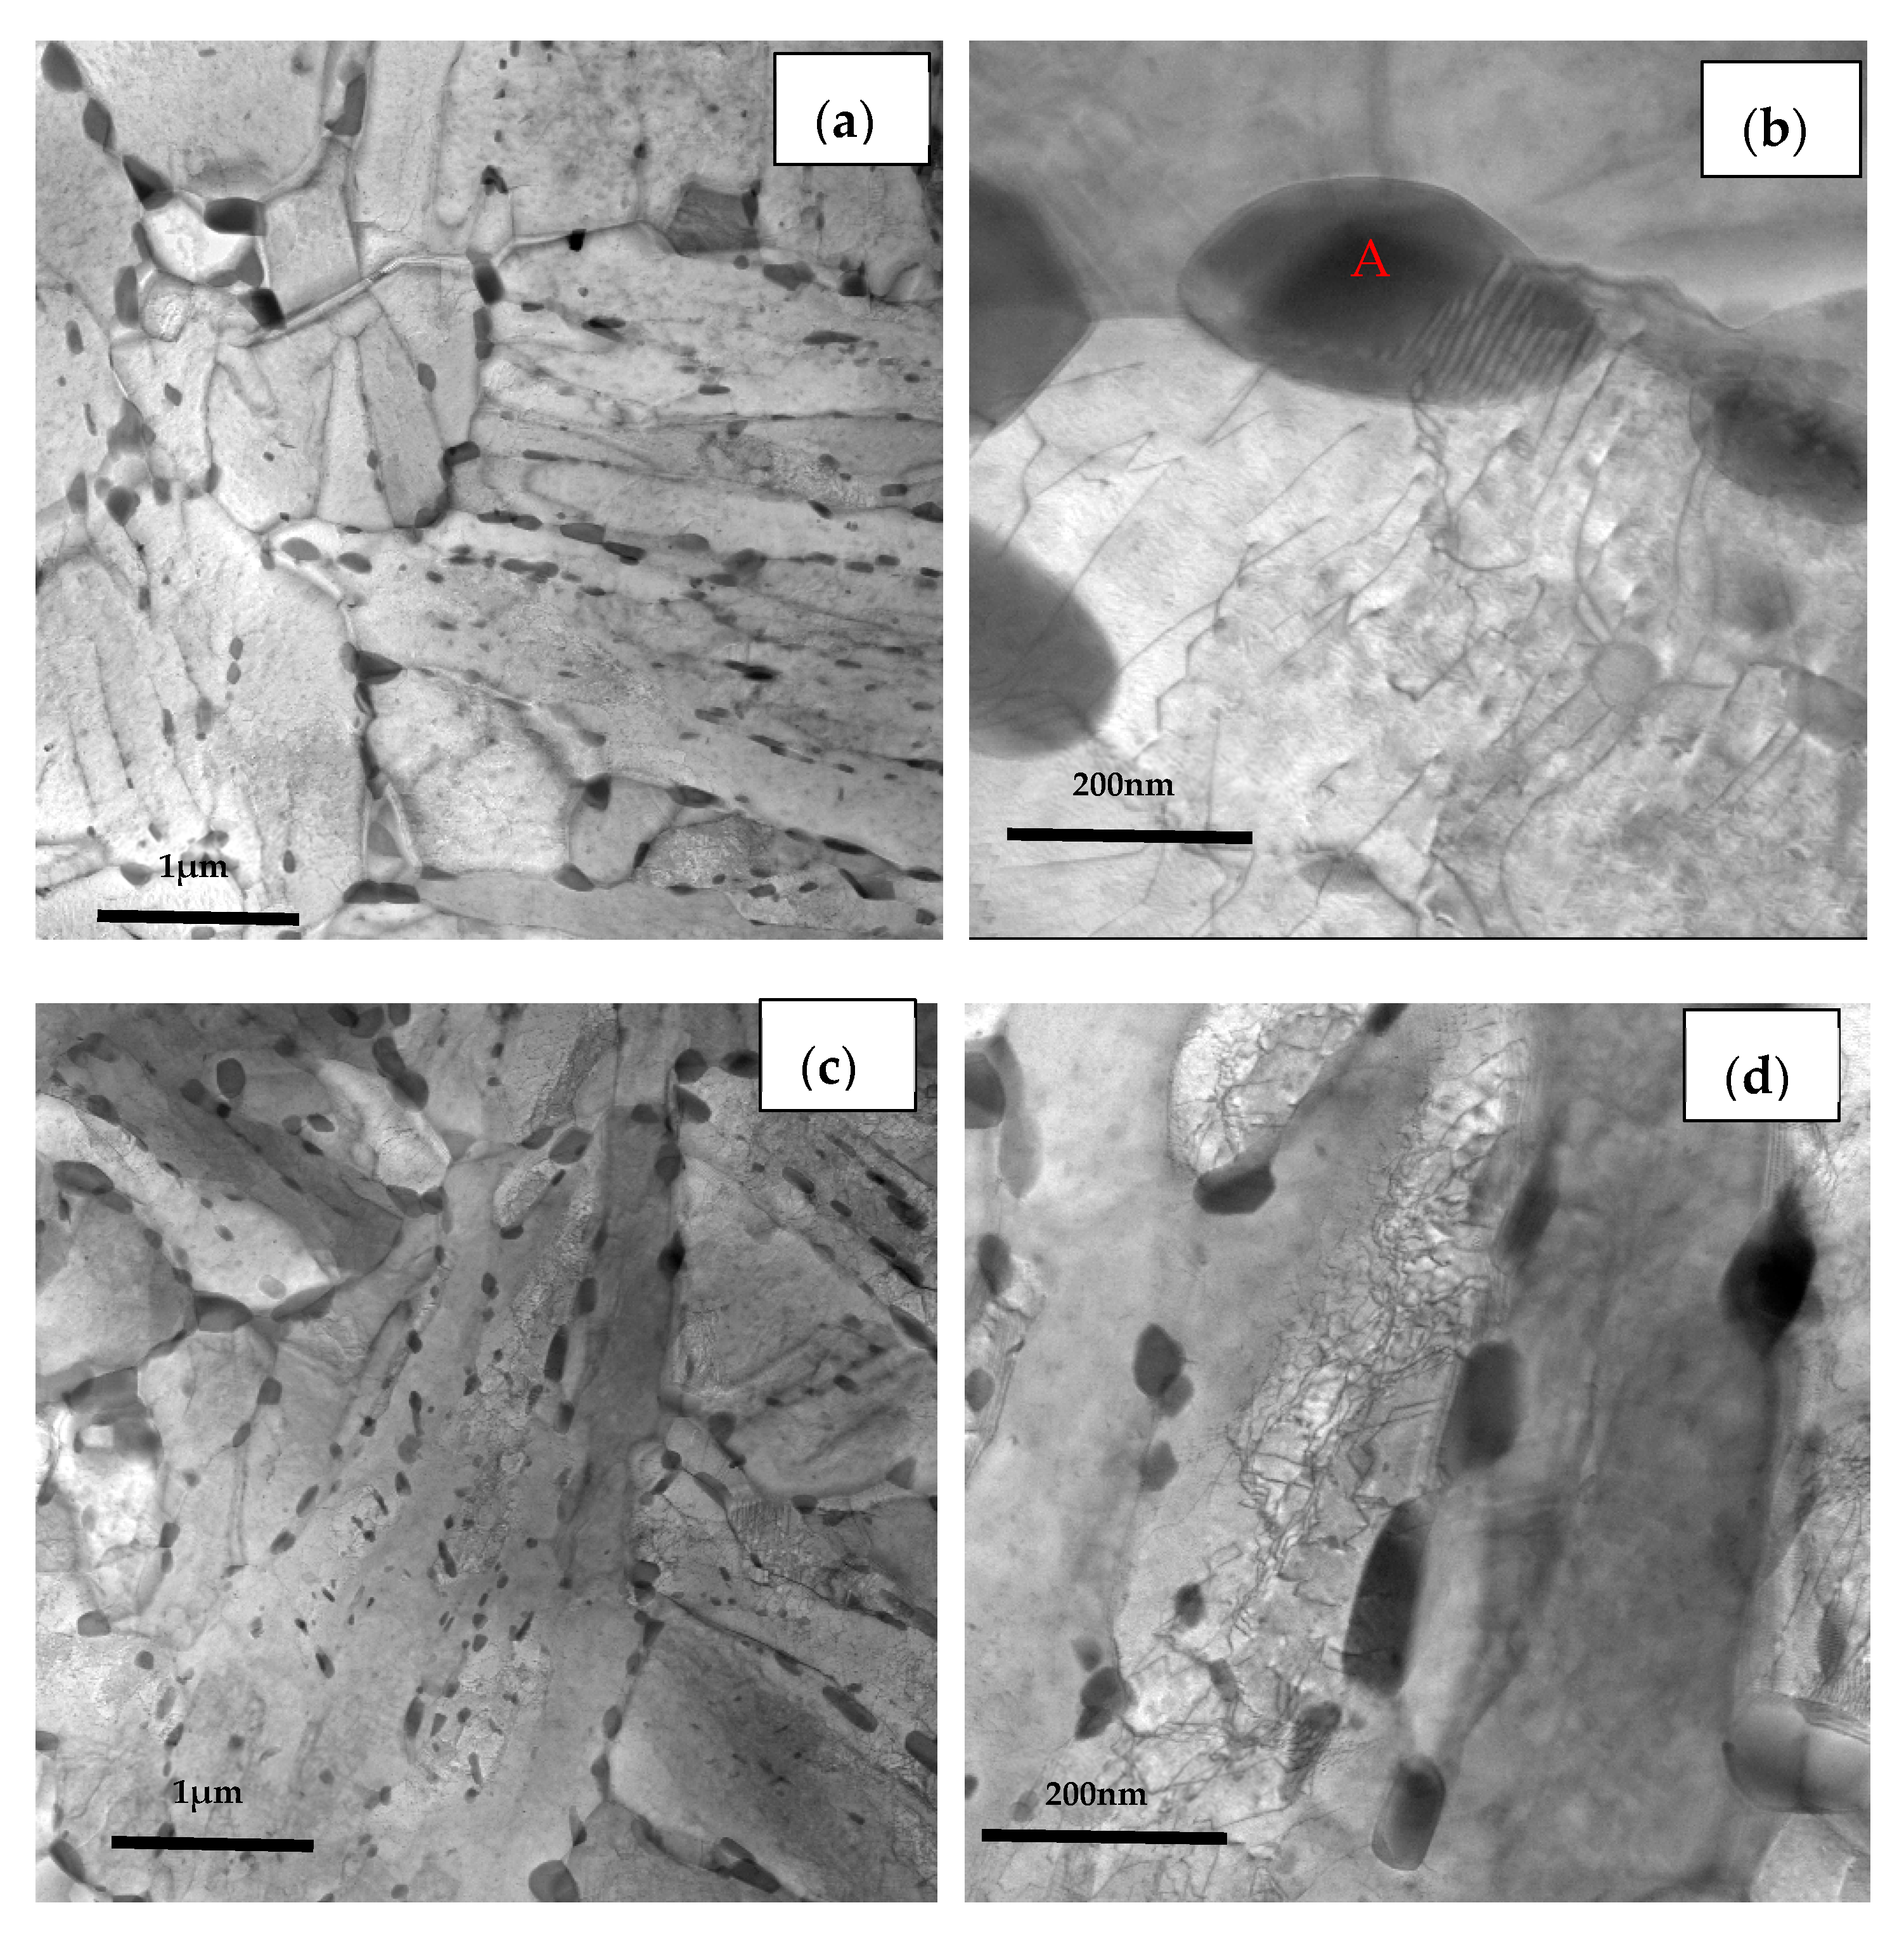
The TEM images of the three casing steel specimens are shown in Figure 11 (STEM BF mode), respectively. It is shown that some granular precipitates from ten to hundreds of nanometers are distributed along the boundaries of grain and lath or inside of the matrix. The size of the precipitates along the boundaries of the grain are larger than the ones inside of the grains, as shown in the Figure 11a,c,e. These results are consistent with the SEM images which shown in Figure 10.
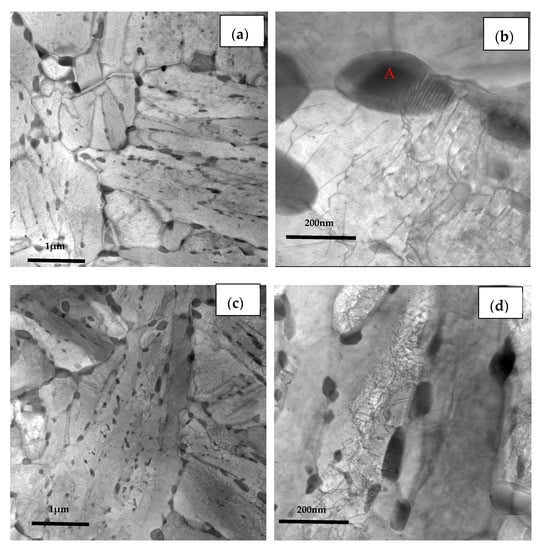
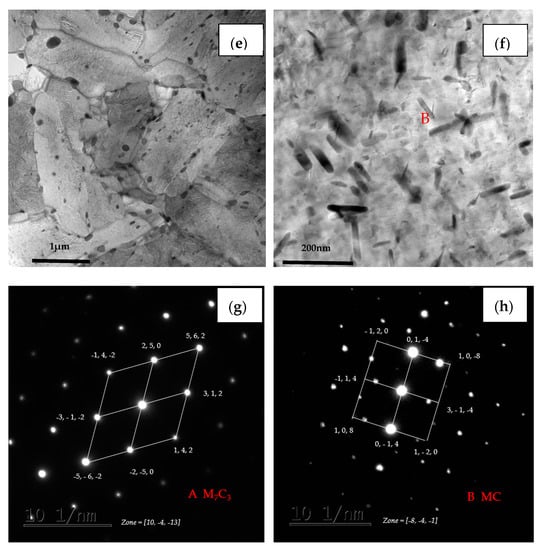
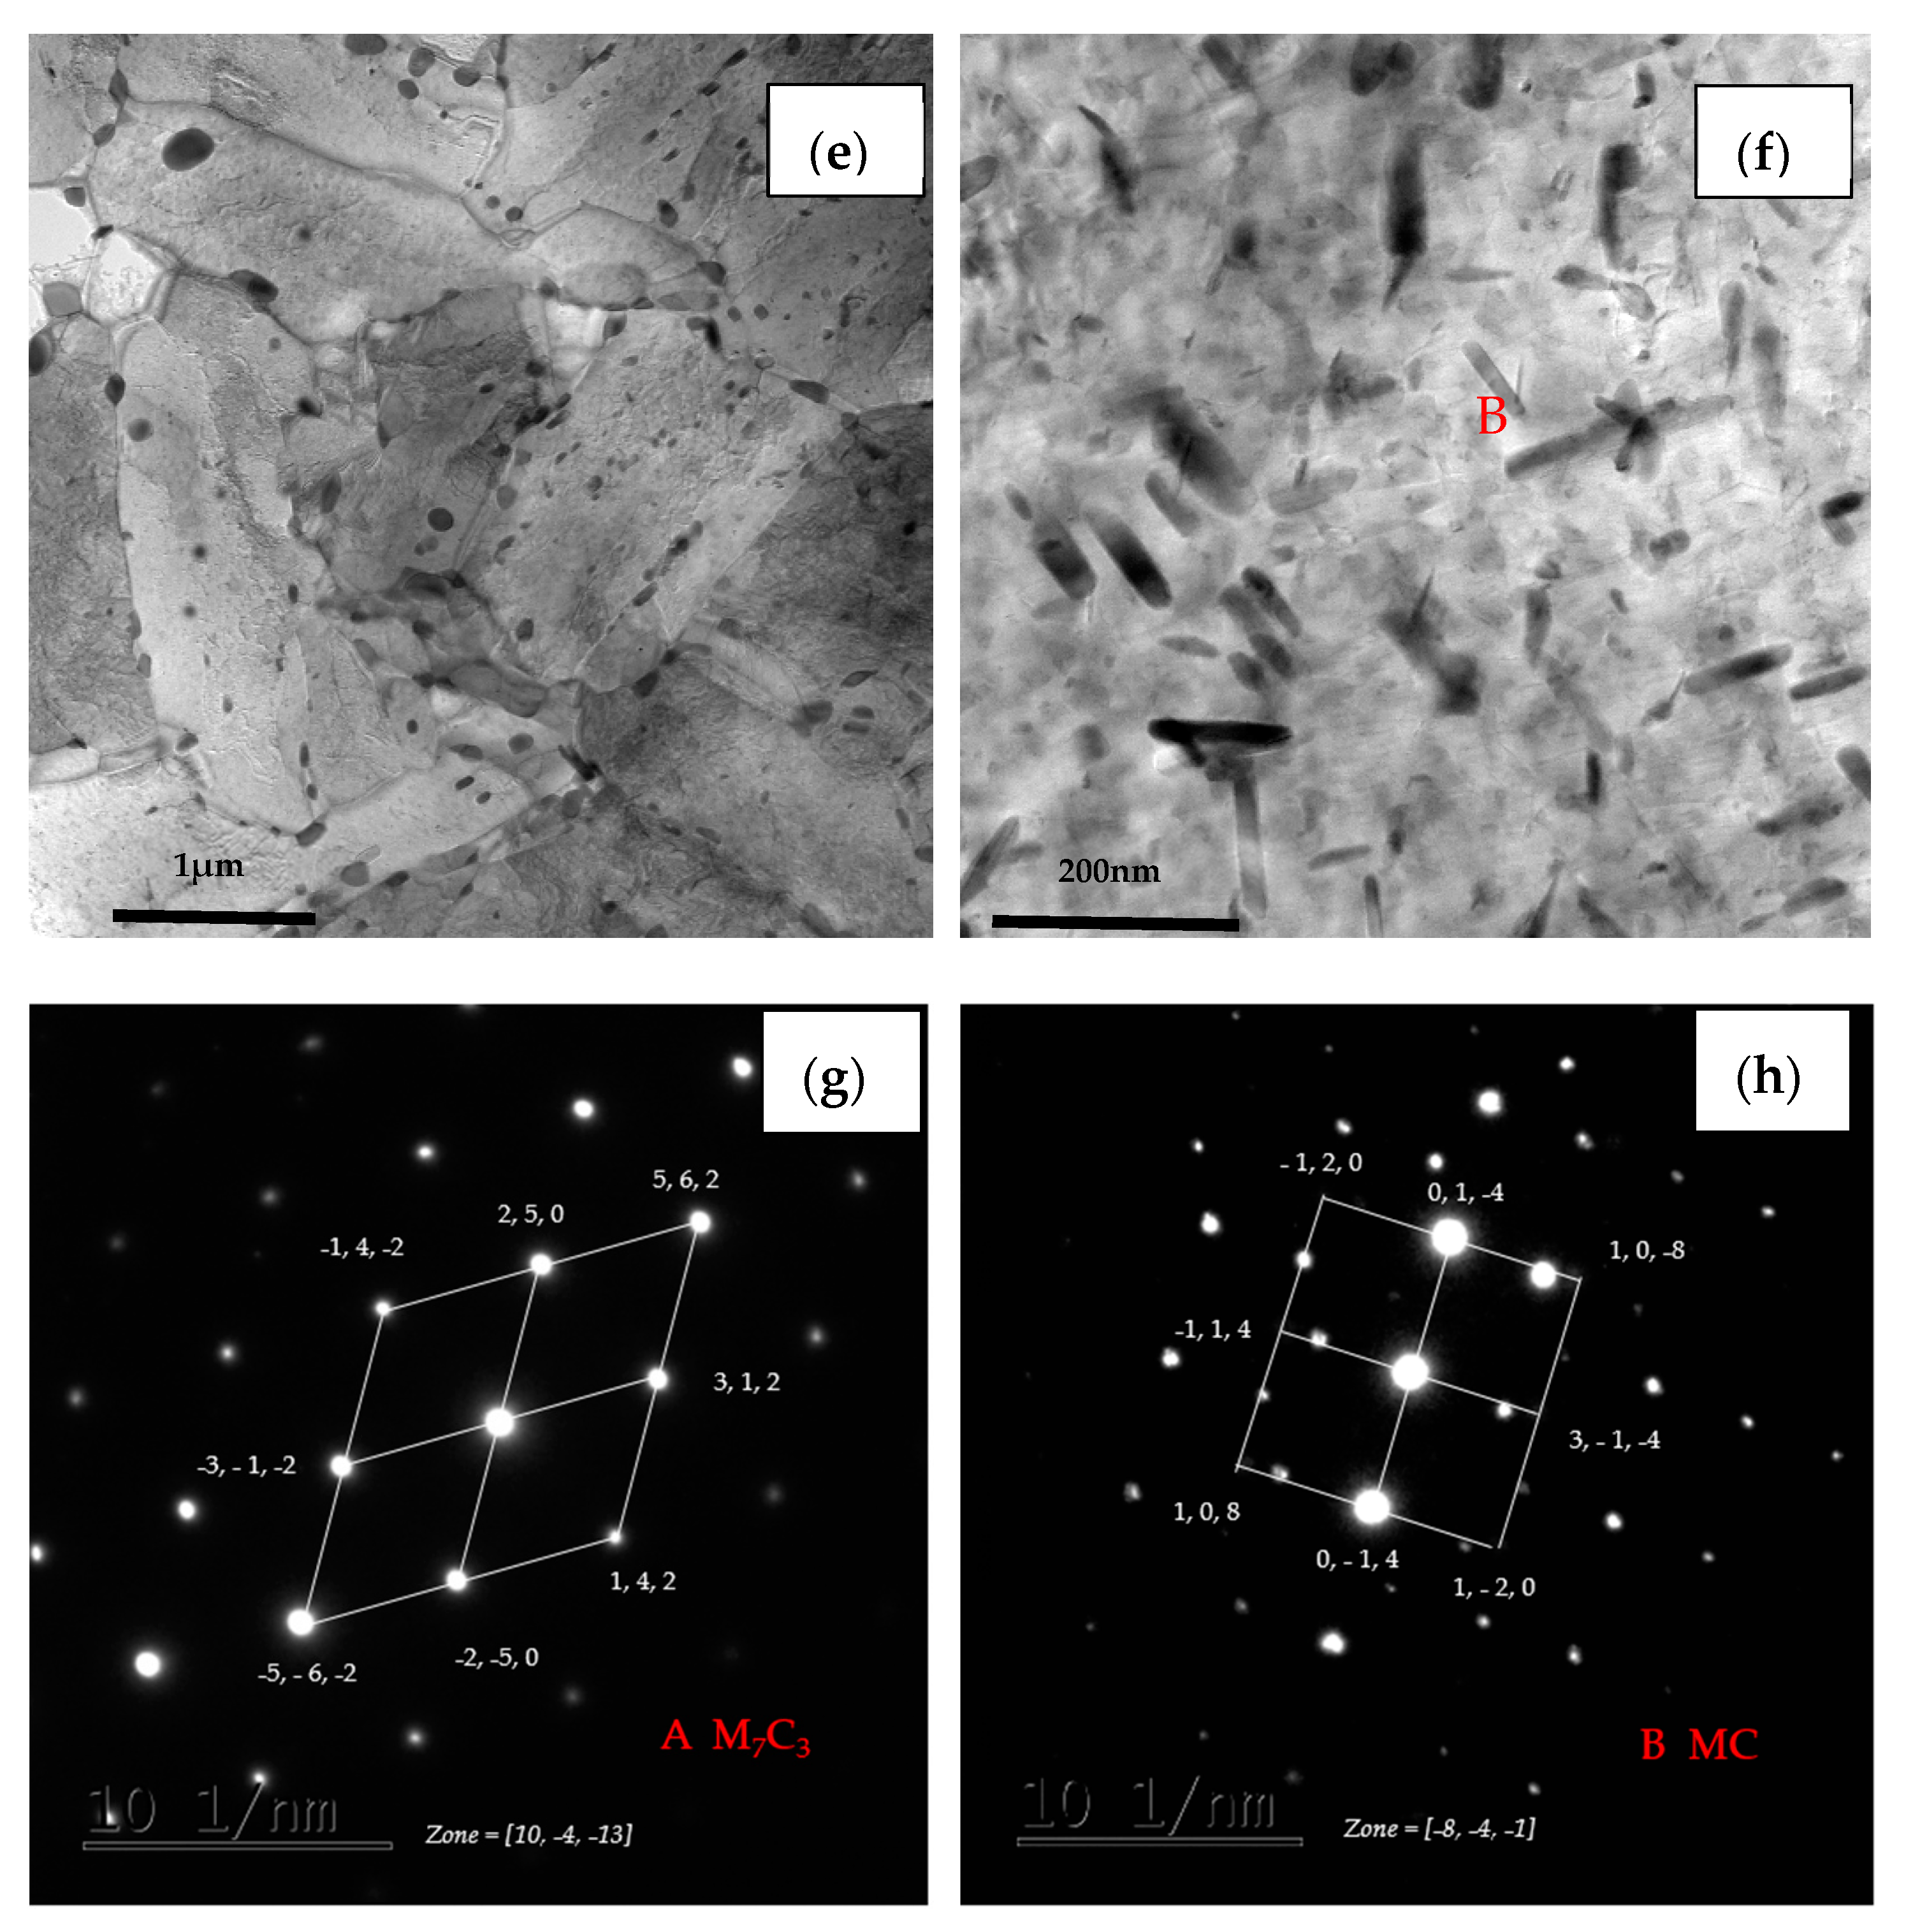
Figure 11.
TEM micrographs of (a) steel A, (c) steel B and (e) steel C specimens; (b,d,f) are higher magnification images of (a,c,e); (g,h) are SAED of carbide patterns indicated with arrows in (b) and (f).
Furthermore, the coarse precipitates along the boundaries of steel A are obviously more than steel B and steel C (Figure 11b,d,f), and the tiny precipitates with a size less than 100 nm distributed uniformly in matrix of steel C are also the most numerous of the three (Figure 11f). The SAED pattern shown in Figure 11g indicates that the coarse precipitate is mainly M7C3 carbides which has a hexagonal structure with lattice parameters a = 0.452 nm and c = 1.214 nm. The SAED pattern shown in Figure 11h presents that the coexisting tiny precipitate is MC which has a hexagonal structure with lattice parameters a = 0.3013 nm and c = 1.464 nm.
In addition, the lath of steel A specimen is the thinnest among the three kinds of specimens, while the lath of steel C is the widest and had been polygonised. The dislocation density is higher at the boundaries between the coarse precipitates and the matrix than inside of matrix. There is no dislocation distributing along the boundaries between the tiny precipitates and the matrix, as shown in Figure 11b,d,f. According to the indication from X.T. Wang [21], the coarse precipitates should be M7C3 carbides rich in Fe, Cr and Mn, the fine precipitates could be MC-type carbides rich in Mo, Ti and V.
3.2.3. Crystallographic Analysis
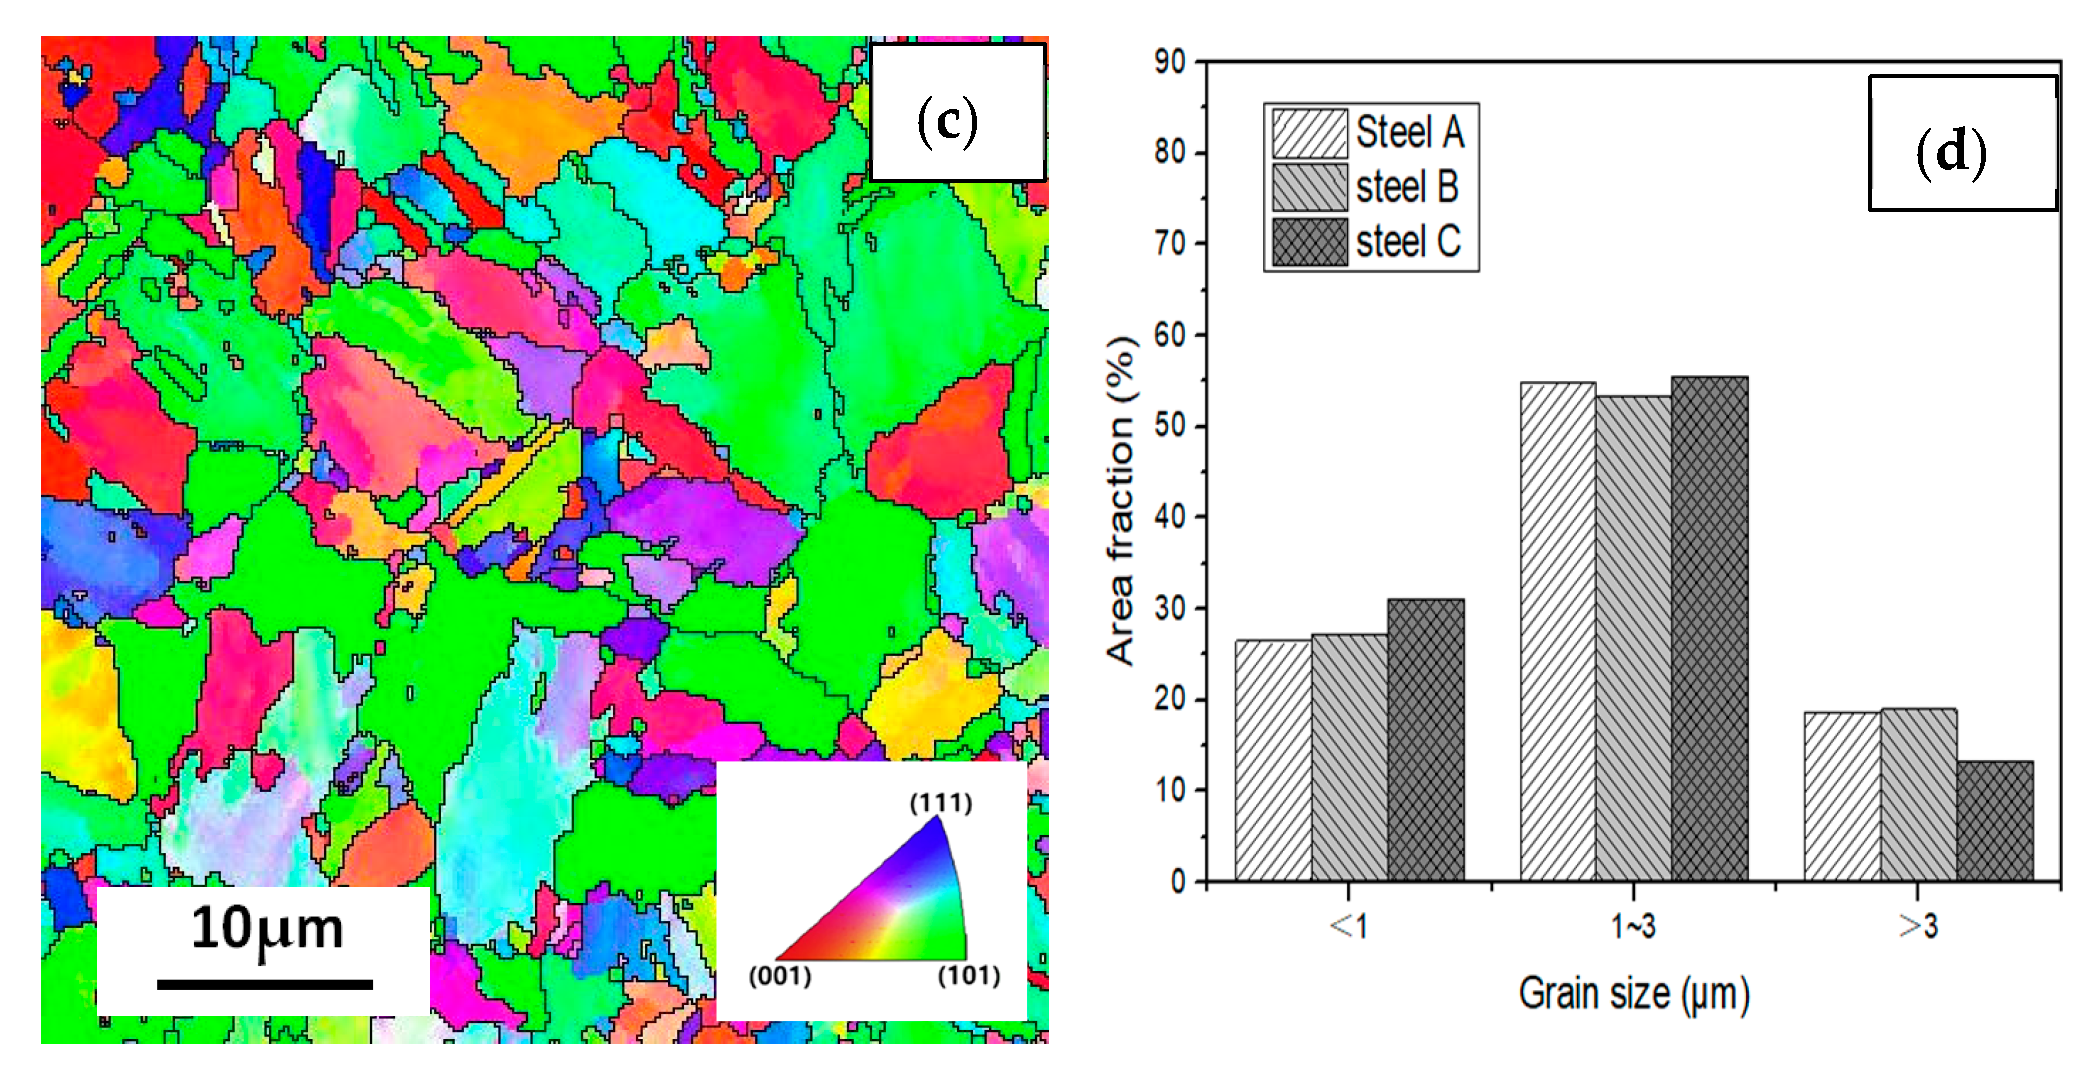
Figure 12 shows the EBSD inverse pole figure maps at the RD-TD planes of the three casing steel specimens. The orientations of grains in the samples are random. there is no obvious texture. And there was no significant difference in grain size among three specimens. However, the size of the packet and block varied in different steels, which shows that the packet and block size of steel B is between steel A and steel C. The size of steel A is the smallest, while most of the packet and block in steel C has already polygonised. The results can be related to the above analysis of SEM and TEM.
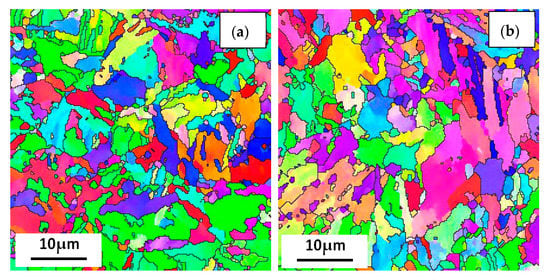
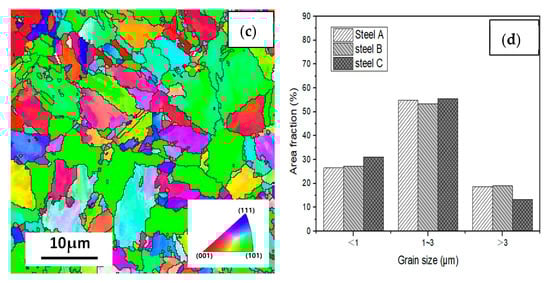
Figure 12.
IPF maps at the cross section (RD-TD) planes for (a) steel A, (b) steel B and (c) steel C specimens; and (d) the histograms showing their grain size distributions.
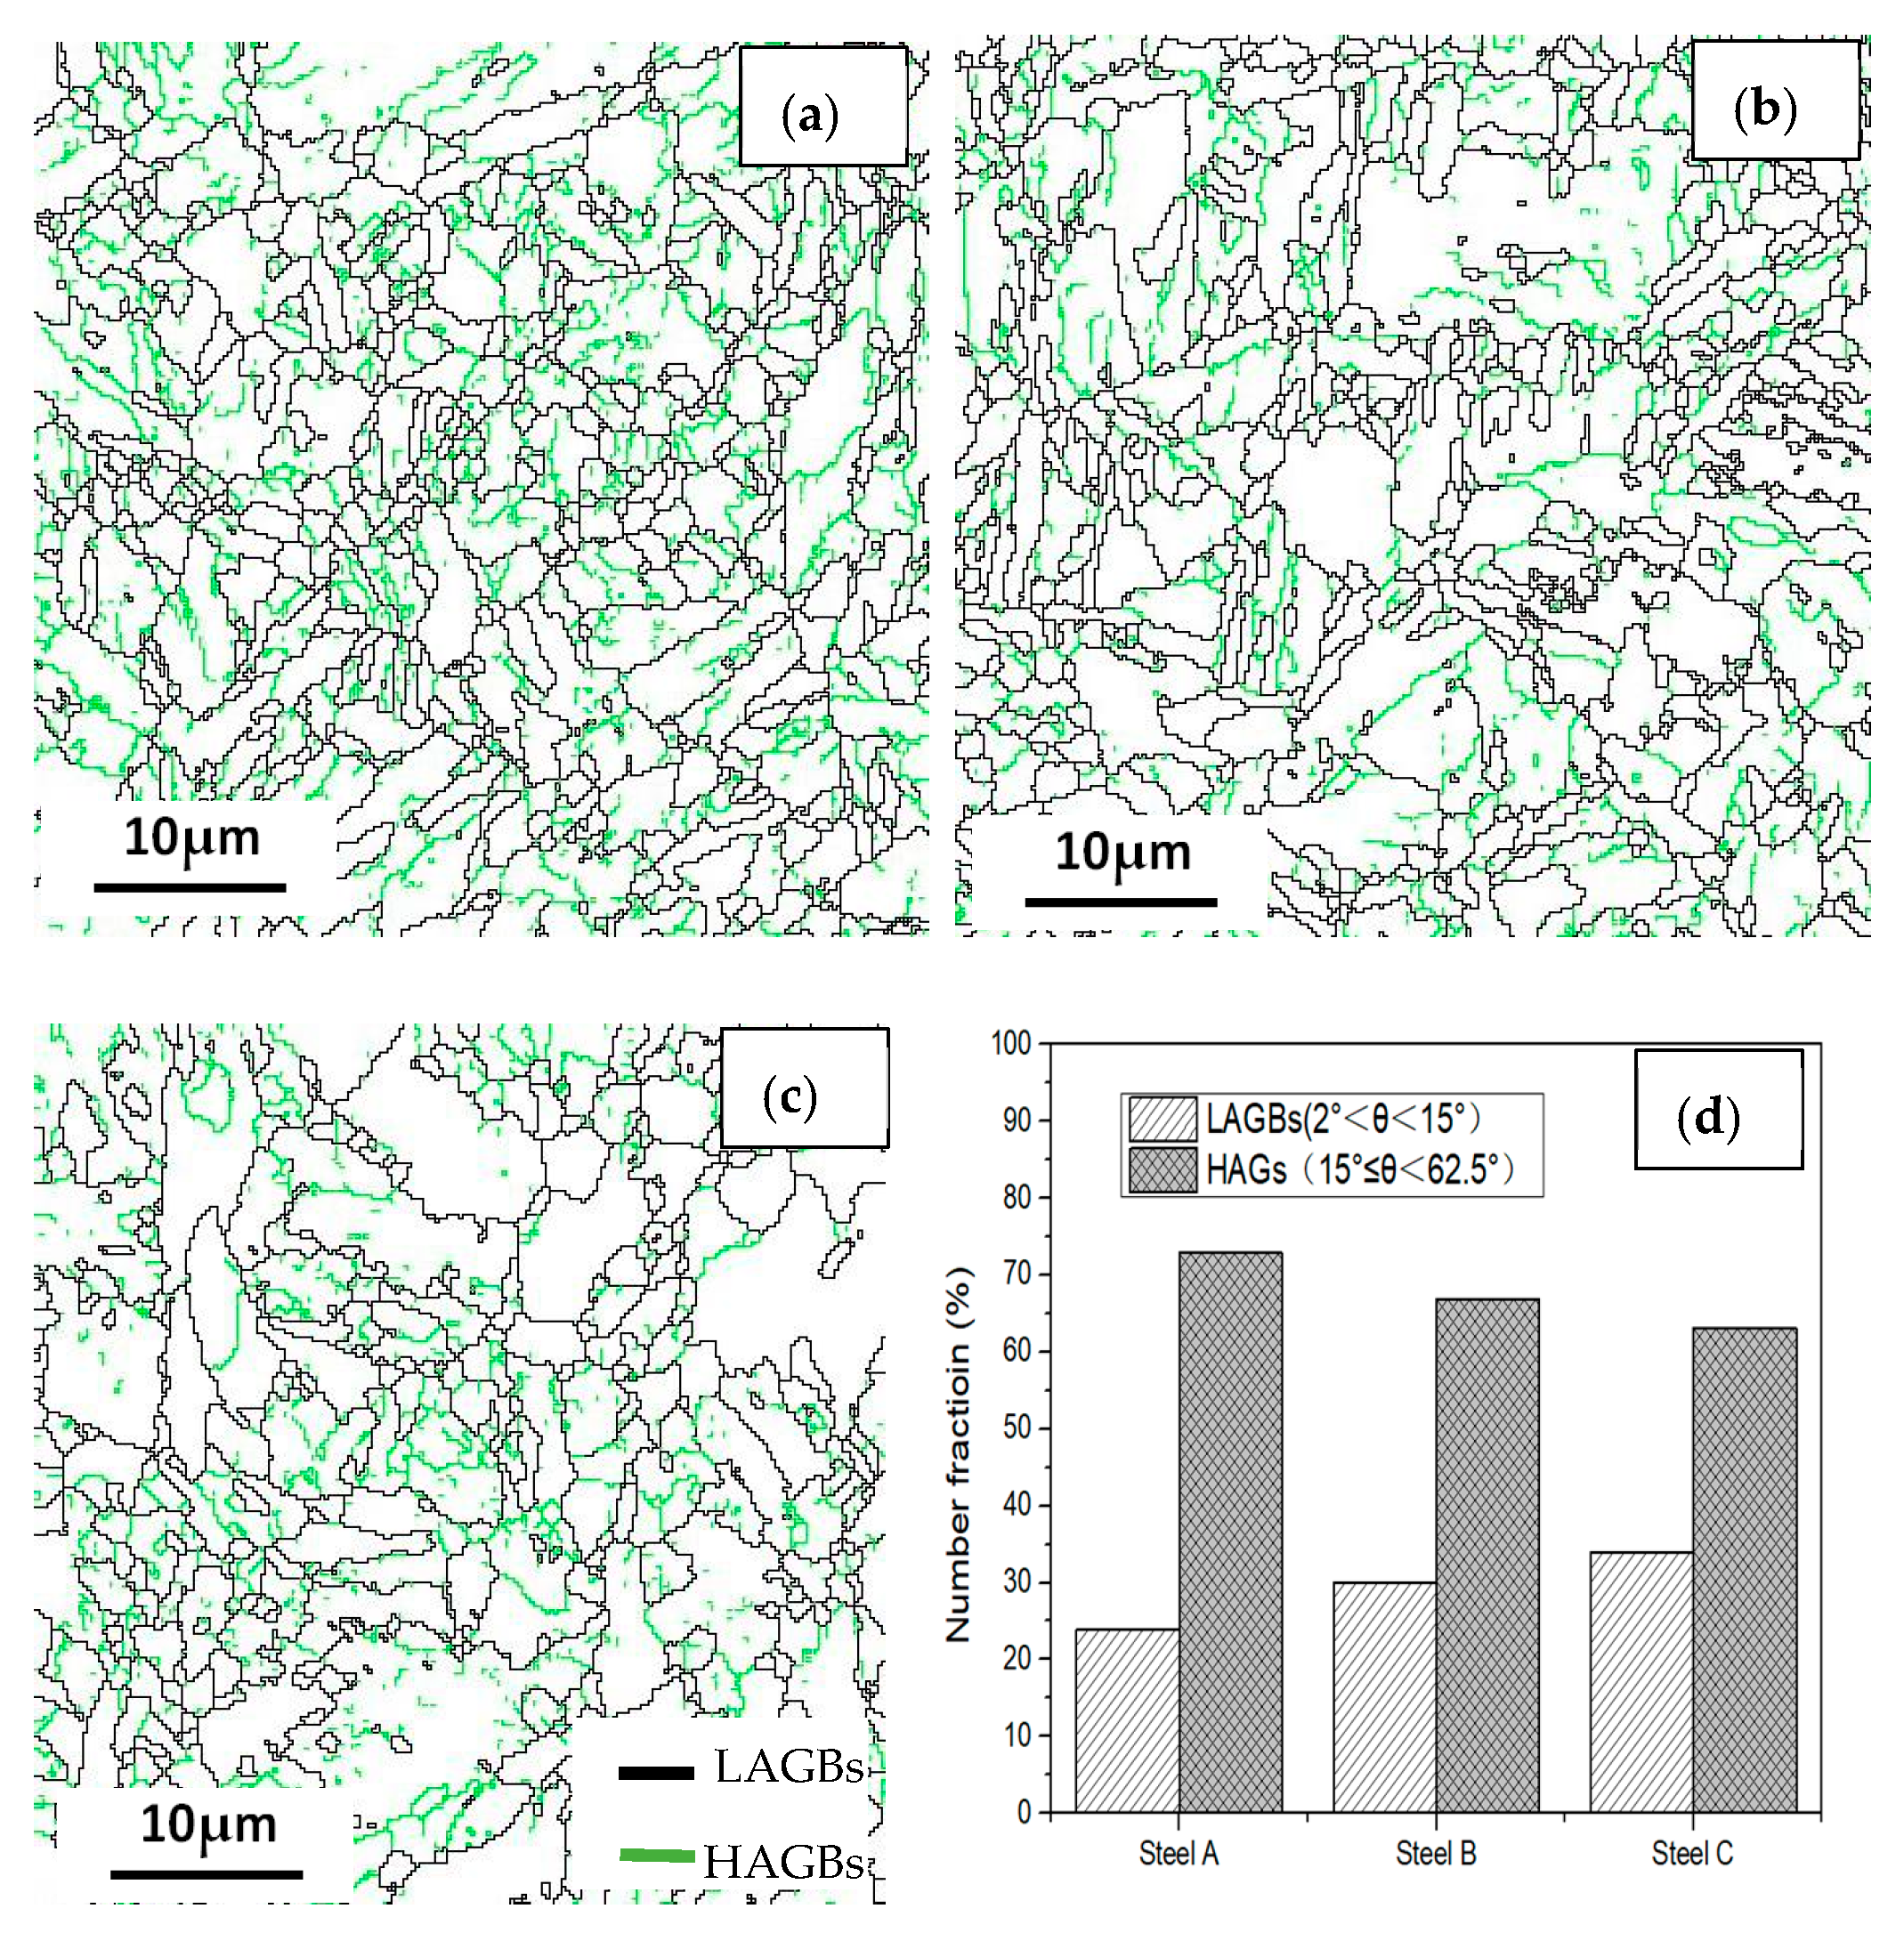
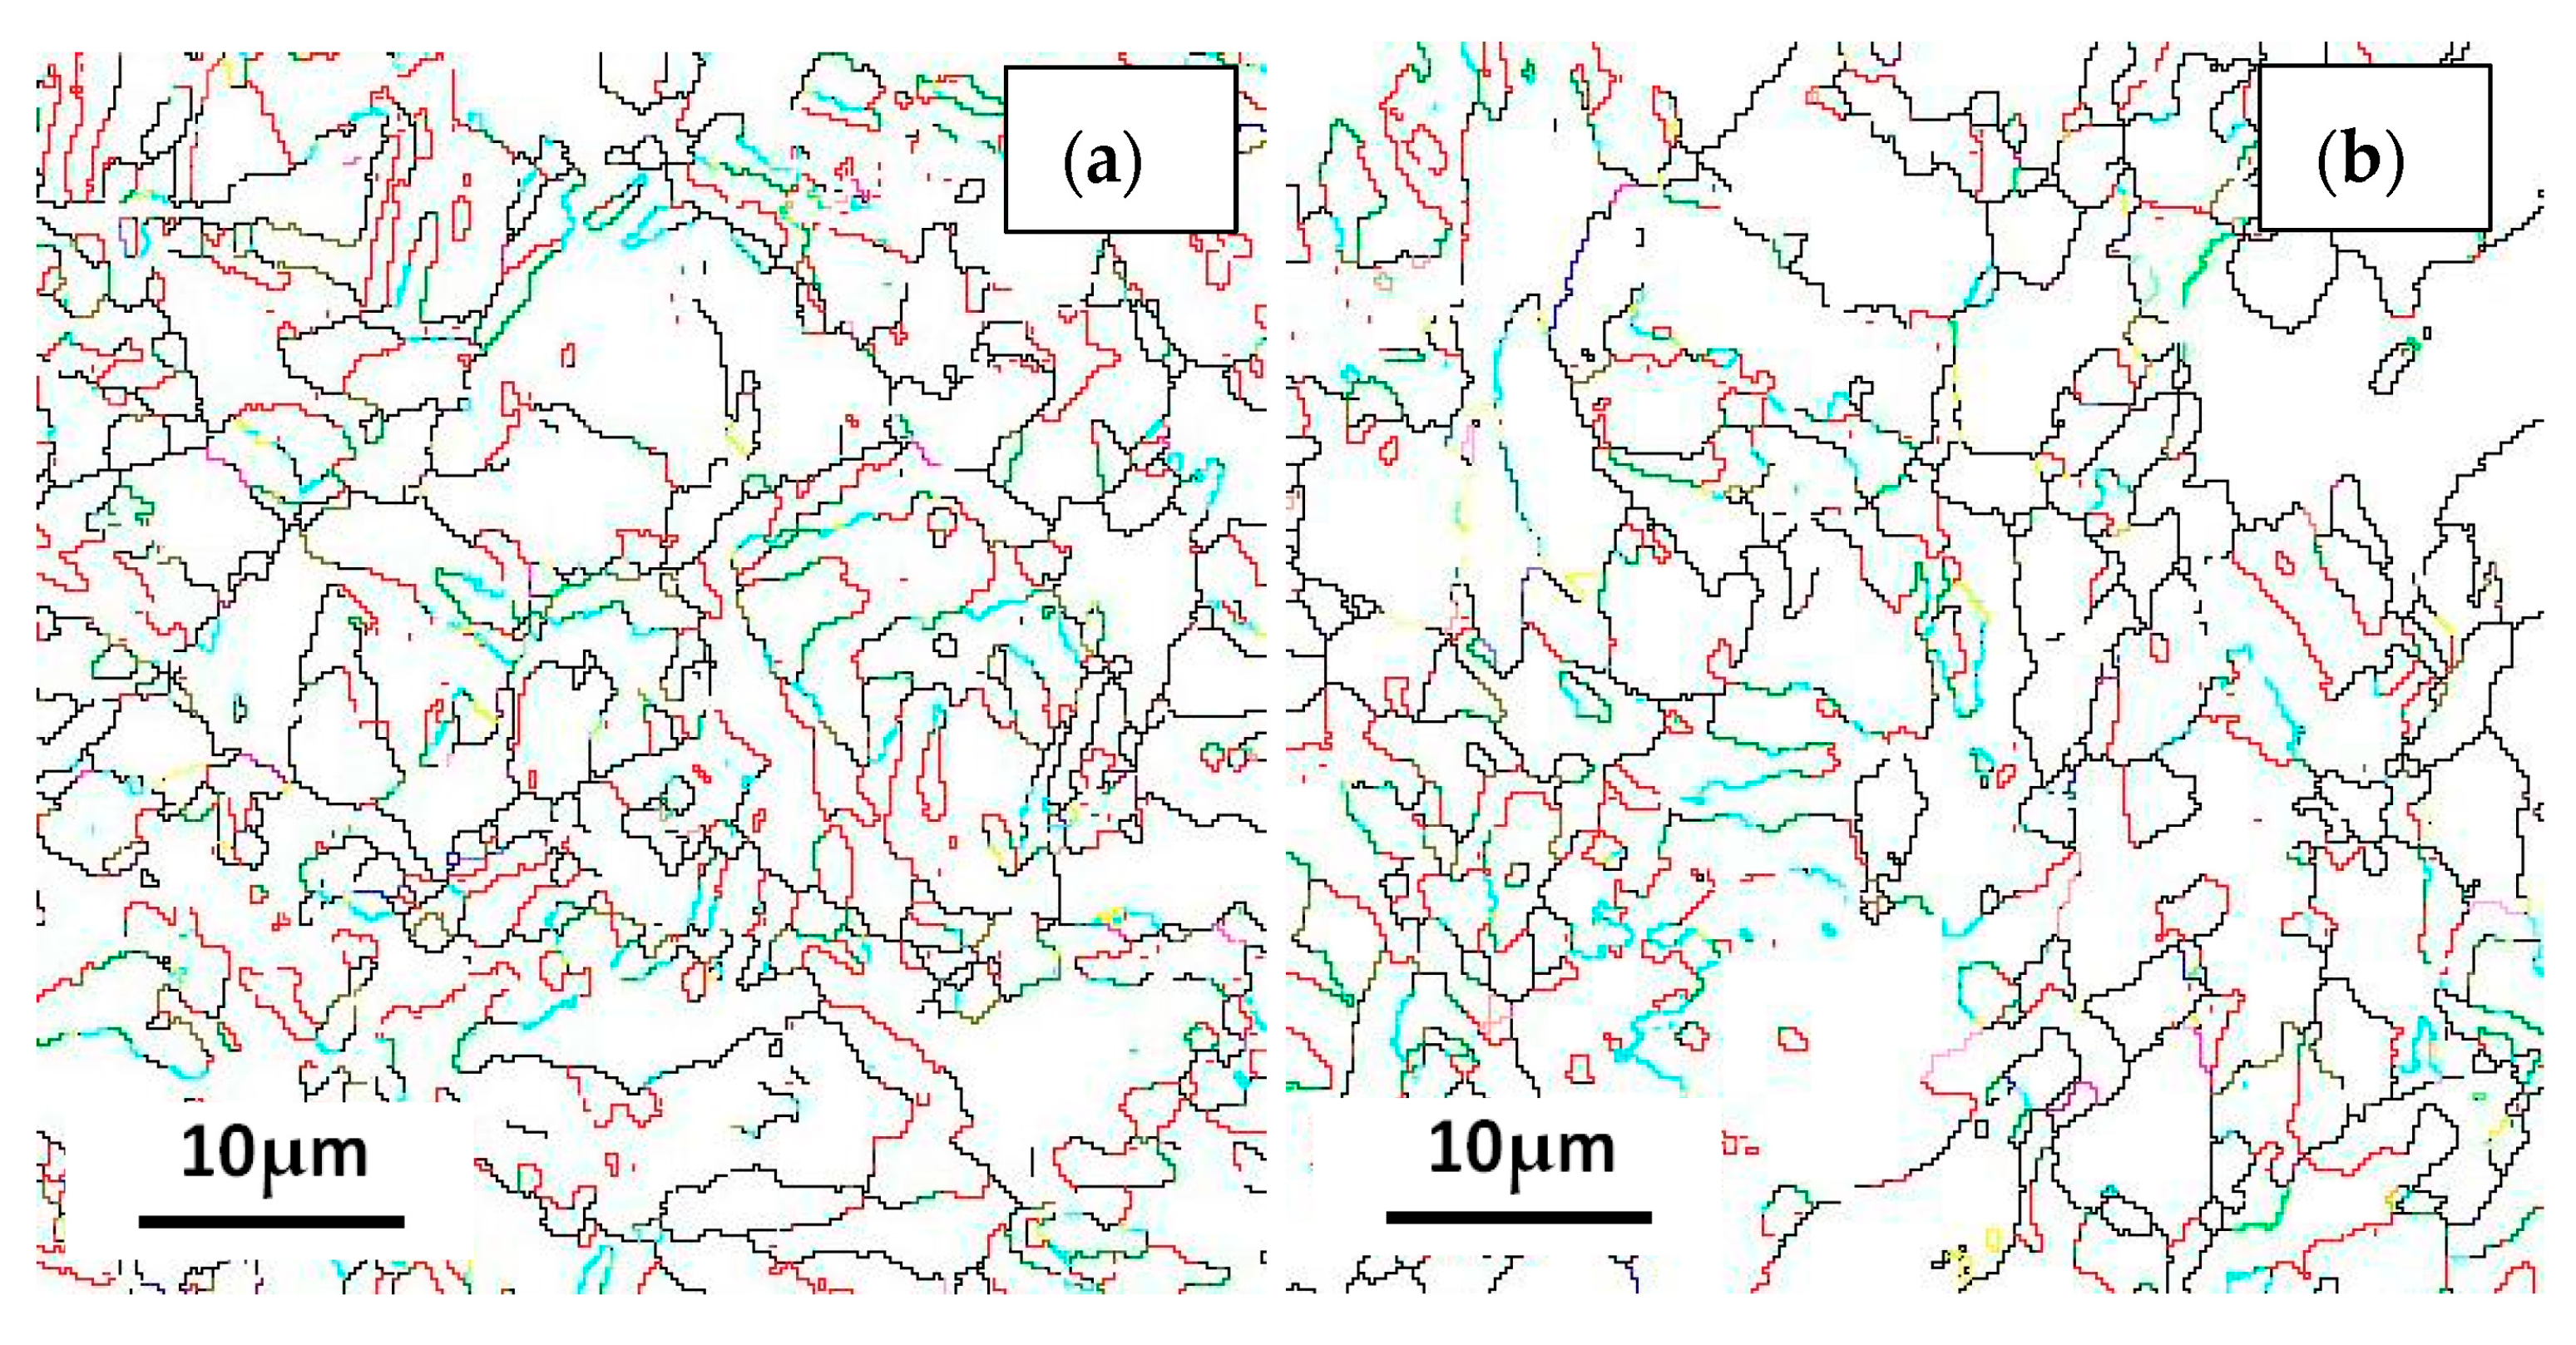
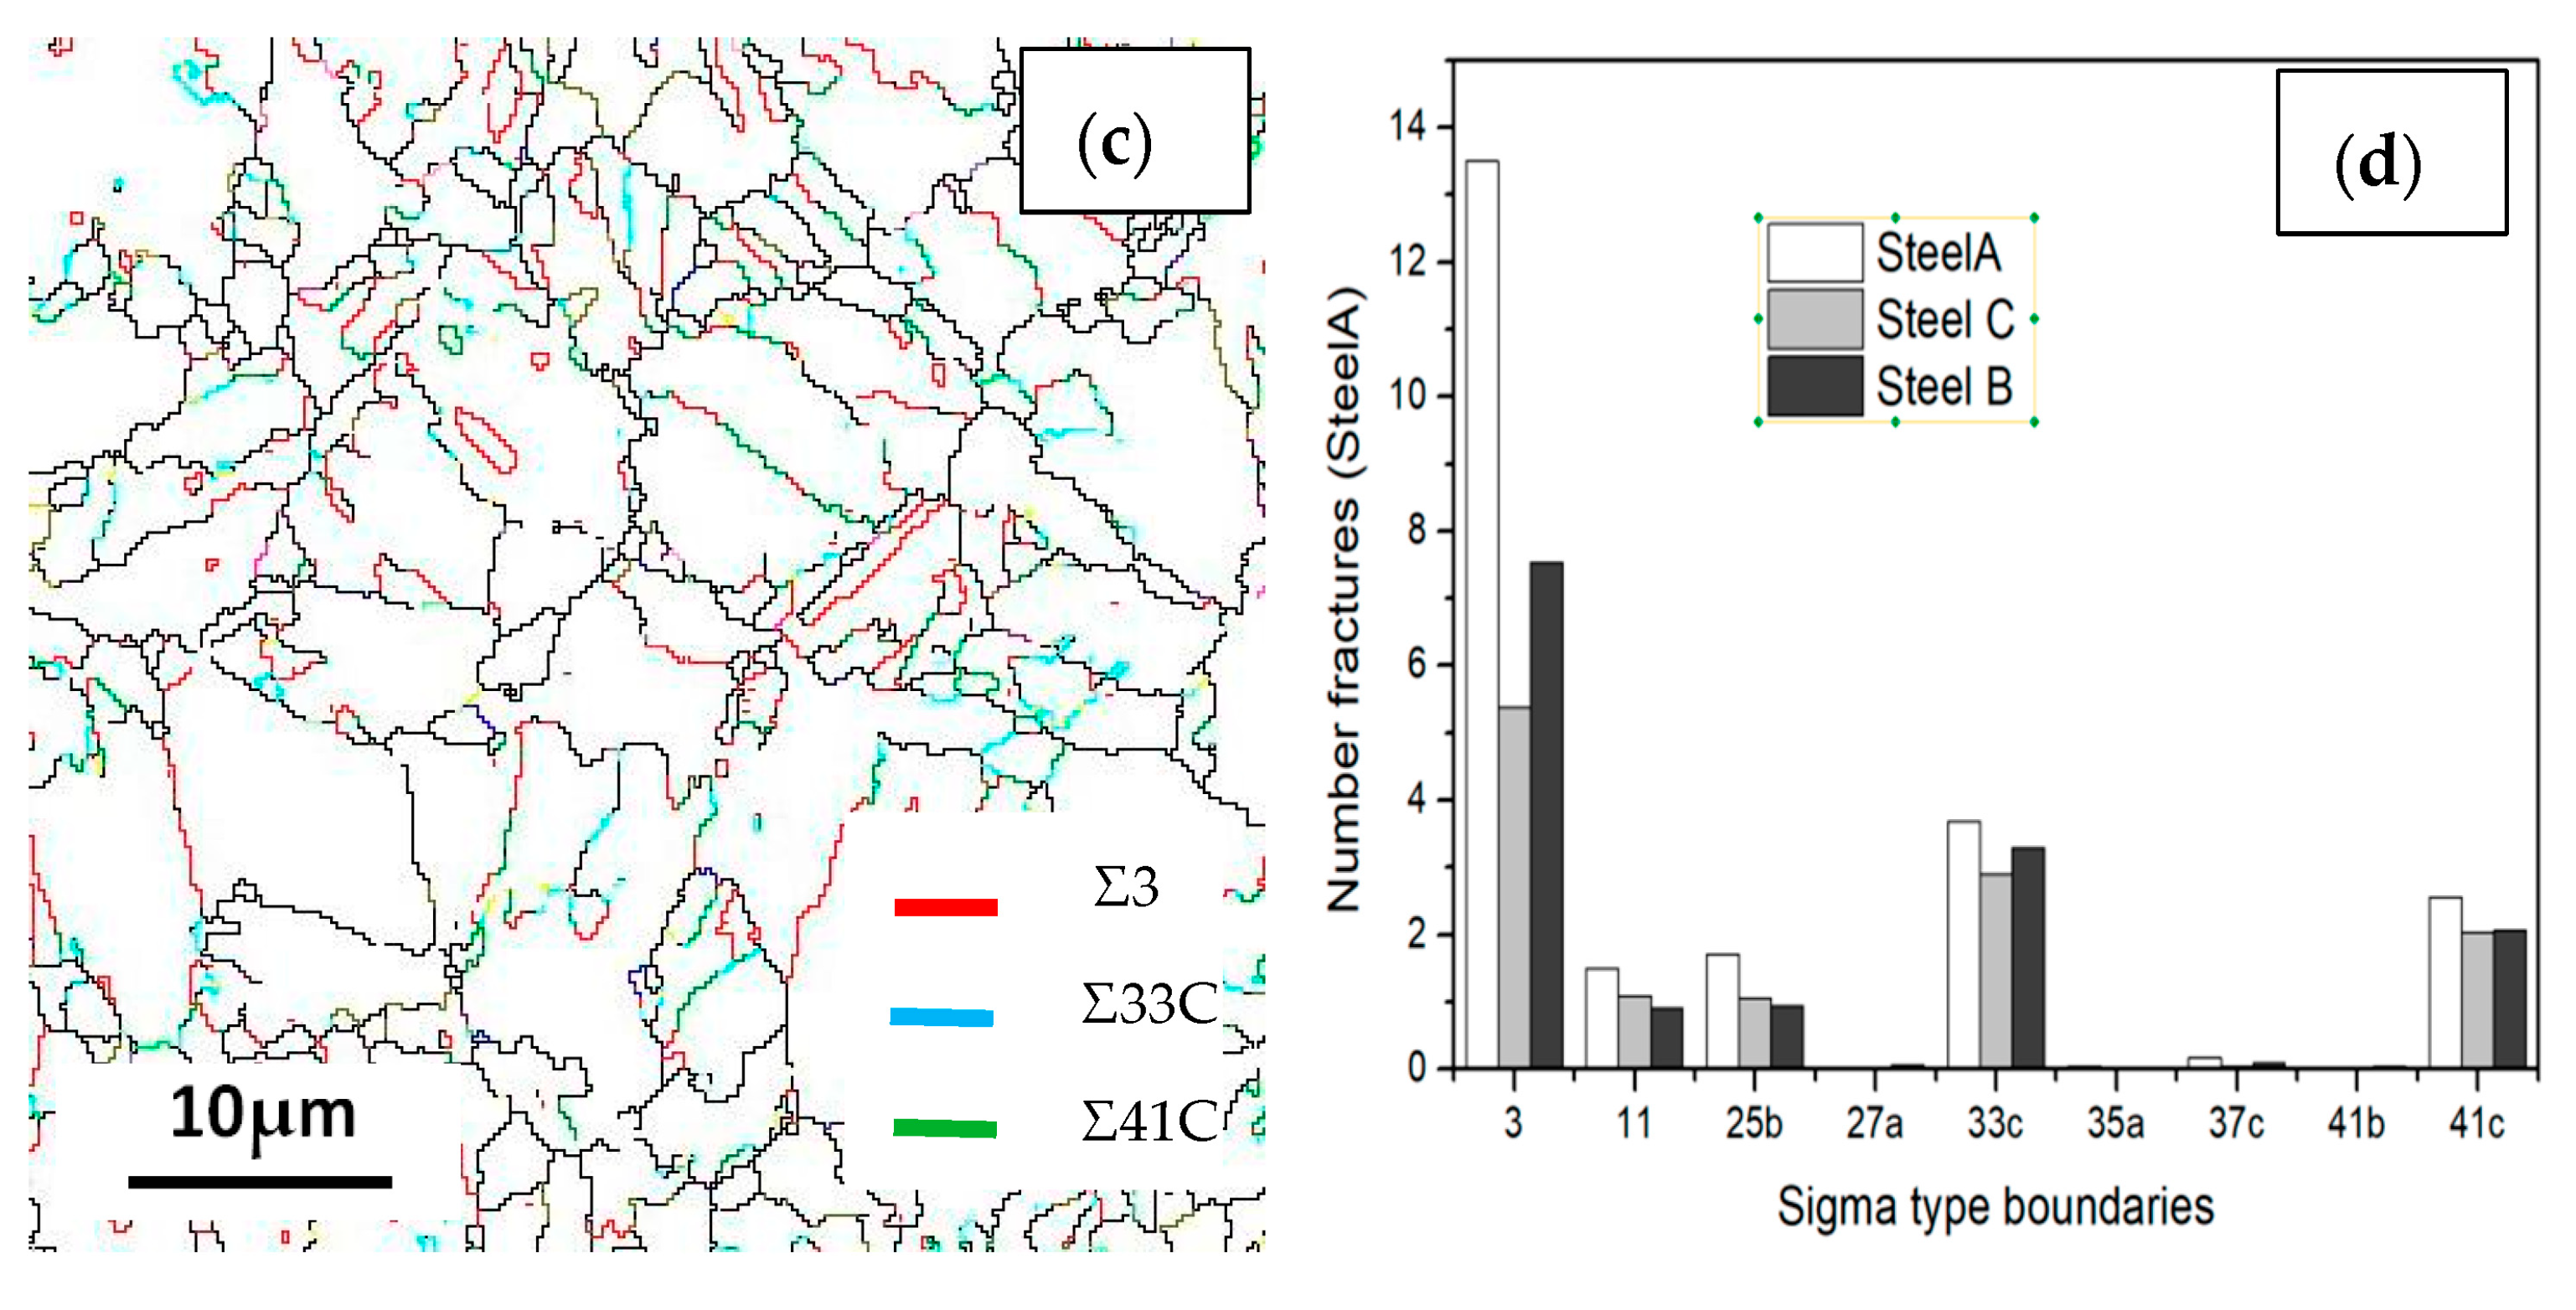
Boundary distributions of the three steels are exhibited in Figure 13 and Figure 14. Low angle grain boundaries (LAGBs, 2°–15°) and high angle grain boundaries (HAGBs, 15°–60°) are defined on the basis of the grain misorientation angles. The number fracture of LAGBs and HAGBs shown in Figure 13 indicate that steel A has the greatest proportion of HAGBs, and steel C has the lowest percentage of HAGBs. The number fracture of LAGBs in three steels is opposite. As we known, the HAGBs is not beneficial for SSC resistance of Co-Mo steels. The corresponding number of fractions of various coincidence site lattice (CSL) type grain boundaries are illustrated in Figure 14. The CSL grain boundaries mainly consist of Σ3, Σ11, Σ25b, Σ33c and Σ41c. Among them, the relative fraction of the Σ3 boundaries is greater than that of the other boundaries. The Σ3 boundaries proportion of steel A is the greatest among the three steel specimens.
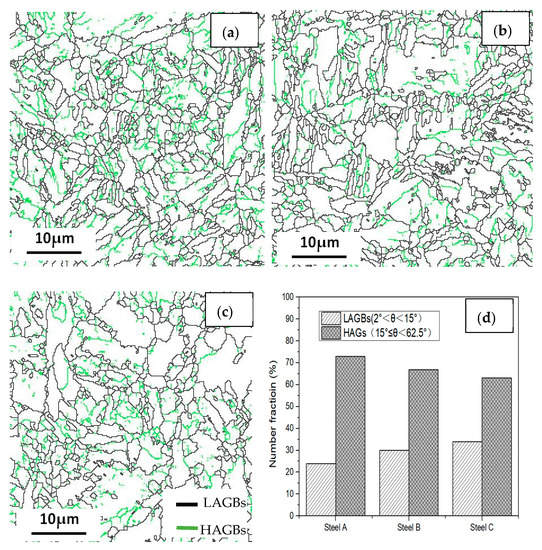
Figure 13.
Grain boundary distributions of the (a) steel A, (b) steel B and (c) steel C specimens; and (d) the histograms showing their LAGBs and HAGBs number fractions.
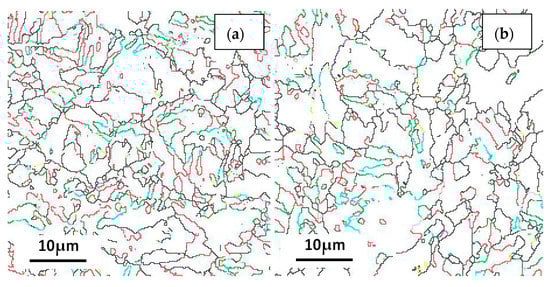
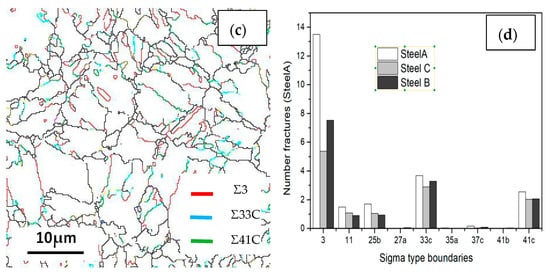
Figure 14.
Coincidence site lattice (CSL) of the (a) steel A, (b) steel B and (c) steel C specimens; and (d) the histograms showing their LAGBs and HAGBs number fractions.
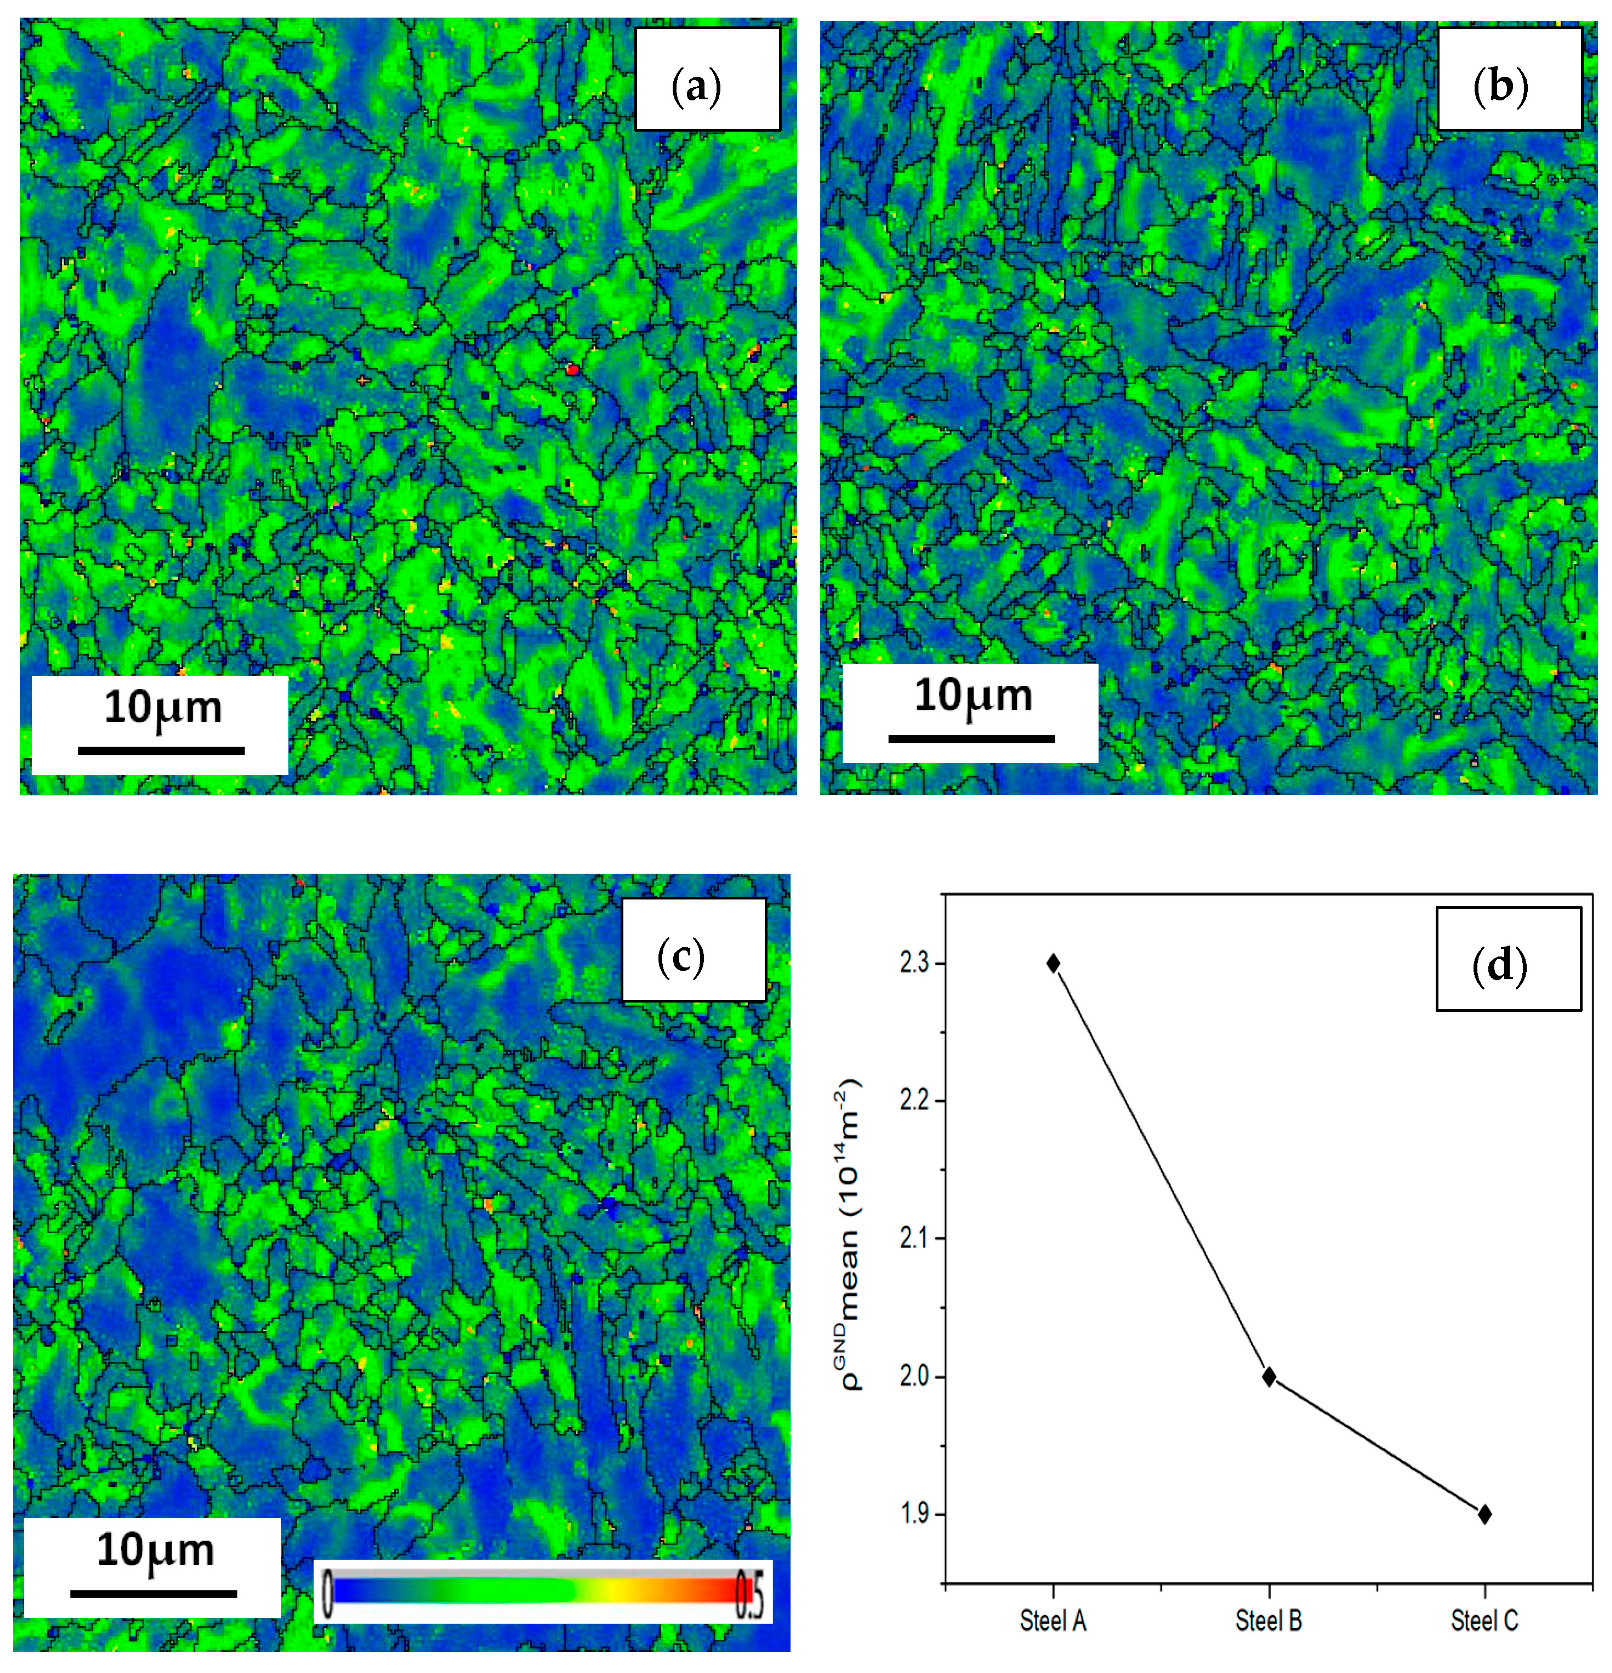
The KAM chart, also known as a local orientation difference chart, is used to describe the deformation degree of material grains. It is necessary to use this data to quantitatively calculate the geometric necessary dislocations (GND). First, we defined the limit of the general grain boundary misorientation as 3°. Any misorientation greater than this value would be excluded in local misorientation calculation since it is caused by a grain boundary, not by GND accumulation. The local misorientation of every single point was then determined by the 24 surrounding points. To extrapolate the GND density information, we use a simple method from the strain gradient theory by Gao and Kubin [31,32]:
where ρGND is the GND density at points of interest, θ represents the local misorientation, b is the Burger’s vector (0.25 nm) and μ is the unit length (100 nm) of the point. It can be seen from the formula that it is the mean local orientation difference that affects the number of geometrically necessary dislocations. As shown in Figure 15, local orientation, the green color lines in the difference plot, can be approximated as dislocations, which are caused by lattice distortion resulted from plastic deformation. The deformation difference of the three steel specimens are the results of different heat-rolling processes. Therefore, the greatest mean GND value is shown in steel A, while that of steel C is the lowest. The dislocation density of steel A is the considered the greatest among the three steels.
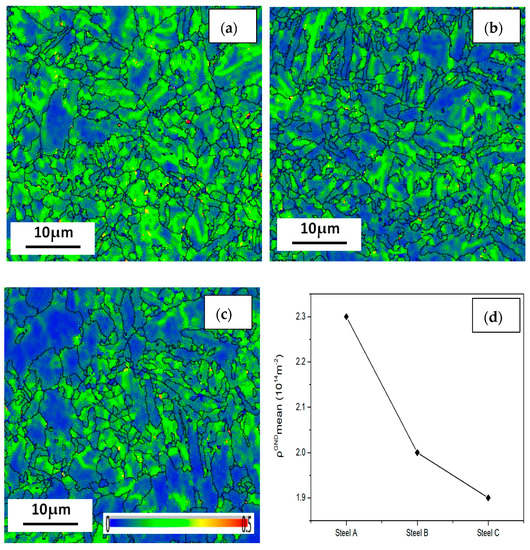
Figure 15.
Geometrically necessary dislocations (GND) of the (a) steel A, (b) steel B and (c) steel C specimens; and (d) the curve showing their GND number fractions.
4. Discussion
There are minor differences between the chemical compositions of the three steels. If reducing the Cr content (from 1.0 wt. % in steel A to 0.5 wt.% in steel B and C), increase V content (from 0.04 wt. % in steel A to 0.11 wt. % in steel C), Ti content (from 0.002 wt. % in steel A to 0.023 wt. % in steel C), and Cu content (0.08 wt. % in steel C), there are less larger carbides distributed along the grain boundaries and more fine carbides distributed in steel C (see in Figure 10), resulting in high strength and excellent SSC resistance of Steel C.
4.1. Effect of the Size and Distribution of Precipitate Carbides on SSC Behavior of Co-Mo Steels
With the reduction of Cr content, the tempering resistance of martensite during high temperature tempering is decreased, resulting in the strength reduction for steel B and C decrease. The procedure of reducing the Cr content can eliminate the semi-continuous carbides and reduce the number of the larger carbides along the grain boundary, which is beneficial to improve the SSC resistance of steels. Adding V content is able to increases the temper softening resistance of quenched and tempered steel, which can be used to achieve the high strength of steels. Besides, the fine VC, NbC and Ti (C, N) precipitated during austenite or martensite, are usually considered as irreversible hydrogen trap and play strengthen role in steels. Cu has a beneficial effect which means that the formation of a copper containing scale on to the steel surface during the SSC process may act as physical barrier impeding hydrogen entry into the steel and enhance the SSC resistance [20]. The addition of Mo, V, Ti, and Cu in the Q&T steels can refine the cementite and precipitates according to Charbonnier et al.’s work [2]. Zhenqiang Wang et al.’s results present that the (Ti, Mo) C precipitates in Ti-Mo added steel are finer and more dispersive than TiC in Tiadded variant. Moreover, the volume fraction of (Ti, Mo) C precipitates is greater than that of TiC [16]. Yuchen Lin et al. show that the co-precipitation of copper and TiC carbides may significantly increase the hydrogen trapping capability of the steels [27].
There are many micro-pores and larger carbides distributed along the boundaries between grain and martensite lath, and the intergranular cracks trends to propagated along the micro-pores near the crack initiation zone (Figure 9). Comparing the similar size of micro-pores and larger carbides, it is rational to assume that hydrogen atoms were used to gather around the larger carbides to decrease the binding force between carbides with matrix of steels. The size and distribution of precipitate carbides play an important role in the strengthening and SSC resistance of steel. The large spherical carbides in the three steels were confirmed to be M7C3 (rich in Fe, Cr, Mn and C) via TEM BF images and SAED patterns (Figure 11). Yoshino et al.’s work [33] indicated that the precipitation of M7C3 carbides could enhance hydrogen entry by introducing irreversible hydrogen traps. The fine carbides were determined as MC carbides (rich in Ti, V, Mo, Nb and C) with the diameter of 10–30 nm. The hydrogen was most likely trapped at the broad semi coherent interfaces between carbides of less than 30 nm and the matrix. The size of carbides in the range of 30–70 nm has poor capture capability since the total semi coherent interfacial area between the particles and the matrix was reduced. The carbides (with a size ≥ 70 nm) may lose their ability to trap hydrogen because of the incoherent interface [34]. As the precipitate grows, the side interface gradually loses its coherency resulting in a simultaneous increase in the trapping activation energy, i.e., the energy barrier for trapping.
Therefore, the dispersoid additions (Mo, V, Ti, Nb, Cu) modify the microstructure and the trapping process in a beneficial way: by refining the cementite particle size and precipitating as fine carbides, they increase the number and, above all, improve the distribution of the high energy trapping sites. The total interfacial areas between the particles and the matrix increased, and thus the amount of trapped hydrogen increased. Furthermore, the increasing number of finer precipitates not only irreversibly traps more hydrogen atoms but also improves the strength by dispersion strengthening.
4.2. Effect of Size of Packet, Block and Lath on SSC Behavior of Co-Mo Steels
The size and width of packet, block and lath are presented variation in the three steels. Large carbides on the grain boundaries hinder the widening of lath. With the larger carbides located on the grain boundaries, steel A has the smallest size of lath (Figure 9, Figure 10 and Figure 11), while steel C, with less large carbides, has polygonised during tempering. In addition, Cr-Mo steels, quenched and tempered at different temperatures and warming times, usually exhibit varied width and size of packet, block and lath in different scales. Adding more microalloying compositions (such as Mo, V, Ti) could improve the high temperature strength of steel, hence the tempering temperature can be raised appropriately. The higher tempering temperature may lead to the lath wider and even polygonal. Yu Sun, Qingfeng Wang and Chuanyou Zhang et al. proposed [5,12] indicate that the KISSC value gradually increase with the increase of tempered martensite packet, block and lath size. In other words, when the original austenite grain size is the same, the martensite packet block and lath size slightly increases with the increase of tempering time and tempering temperature, and the KISSC value increases. In conclusion, the coarsening of martensitic substructure is beneficial to the improvement of SSC resistance of martensitic steel.
On the one hand, Chuanyou Zhang et al.’ word presented that the dependence of the yield strength of 25CrMo48V martensitic steel tempered at 650 °C for different times on the lath width and the precipitated particle size can be described as follows:
where w is the average lath width, and Dp is the average precipitated particle size.
On the other hand, Yu Sun et al. study show that the H trap density provided by martensite lath (ML), containing boundaries of prior austenite grain (PAG), martensite packets (MP), blocks (MB), e.g., NT-ML (including the NT-PAG, NT-MP and NT-MB), was estimated as follows:
where dML is the width of the martensite lath, xa is the atomic distance. This equation indicates that the NT-ML is in inverse proportion to dML.
Above all, the size and width of martensite packet, block and lath are inversely proportional to strength and proportional to SSC resistance. In other words, premising on meeting the strength of requirement, the wider the martensite packet, block and lath, the stronger of steel SSC resistance. Therefore, steel C has the best SSC resistance.
4.3. Effect of Crystallographic Features on SSC Behavior of Co-Mo Steels
Steels with larger grain sizes crack more easily because they have fewer grain boundaries in which strain is mainly concentrated. However, the difference in the grain sizes is relatively small among the three steels. Caron et al.’s work [35] showed that the total grain boundary area fraction in a unit volume may increase after tempering due to the change of dislocations into polygonised boundaries. LAGBs, which act as lower energy reversible hydrogen traps, can will be formed preferentially. In this regard, the hydrogen assisted cracks might not nucleate at LAGBs. In contrast, HAGBs have higher energy because of the dislocation accumulation, which were regarded as preferential paths for crack propagation. The CSL boundaries, particularly Σ3, have a key role in determining SSC. The Σ3-type boundary is considered as a special HAGB that is sensitive to hydrogen-assisted cracking [36]. The high concentration of Σ3 boundaries in steel A may make the cracks easier to initiate and extend along the HAGBs. Reducing the Σ3-type boundary in steel C may be one of factors that enhance the SSC resistance.
When steel is rolled to a pipe in a certain outside diameter and wall thickness, which generates strain gradient near the grain boundaries to fit the different strains across the boundaries. The strain gradient needs to be accommodated by GND, in the form of dislocation pile-up near the boundaries [29], as shown in Figure 15. Hydrogen normally segregates near the dislocation pile-up sites. Dislocations trapped in hydrogen atoms that accumulate at grain boundaries interfaced with the metal matrix can accelerate the diffusion of hydrogen. The high dislocation density allows hydrogen atoms to move along grain boundaries and reach the crack tips, which contributes to crack propagation. Consequently, the higher GND of steel A accelerate the SSC of steel, while the lower GND of steel C improves the SSC resistance.
4.4. Effect of Hydrogen Trap on SSC Behavior of Co-Mo Steels
The hydrogen traps are categorized as reversible traps and irreversible traps. The grain boundaries, dislocations and lattice sites belong to reversible traps; precipitates, inclusions and voids belong to irreversible traps [1]. The broken time and the size of the brittle fracture area of the three steels of SSC-A method tensile test specimens, according to NACE TM0177 standard, are varied. The longer the breakage time and the larger of the brittle fracture area, the more content of irreversible traps. It could indirectly demonstrate that steel B has more irreversible traps than Steel A. The incubation period before fracture (broken time) is longer, and the area of the brittle zone after fracture is larger than steel A. Meanwhile, Steel C has the most irreversible traps, reducing the diffusion and aggregation of hydrogen atoms and the formation of hydrogen molecules, so that it cannot break within 720 h under the same test conditions. However, the over-size inclusions and some voids are prone to cause stress concentration and accelerate the SSC. The irreversible traps here mainly mean the fine precipitated carbides.
5. Conclusions
Three 110 ksi steels with different microalloying elements, varied size and distribution of precipitate carbides, and martensite packet, block and lath were investigated by SEM, EBSD, TEM with EDS. The conclusions can be summarized as follows:
- With the decrease of Cr content and the increase of V, Ti and Cu content, the number of larger carbides distributed along the grain boundary decreases, and the number of smaller carbides distributed along the grain boundary and in the grain increases significantly. Although the strength of the Co-Mo steel is slightly lower, SSC resistance has improved dramatically.
- Steel C, with finer spherical precipitate MC-type carbides and a smaller number of larger M7C3-type carbides distributed along the grain boundaries, increases the number of irreversible traps and decrease the high energy H gathering site, which improves the SSC resistance of Cr-Mo steels.
- Wider polygonised martensitic laths and lower dislocation density play an important role in enhancing the SSC resistance of Cr-Mo steels.
- Lower proportion of high-angle grain boundaries and the Σ3 boundaries decrease hydrogen permeability and diffusivity, which will decrease the initiation of SSC of Cr-Mo steels.
Author Contributions
C.L., H.Z. and L.H. conceived and designed the experiments; C.L., J.W. and Y.T. performed the experiments; C.L. and F.L. analyzed the data; D.L., J.L. and Y.Q. contributed analysis tools; C.L. wrote the paper. All authors have read and agreed to the published version of the manuscript.
Funding
This research was funded by supports of Scientific Research and Technology Development of China National Petroleum Corporation (2021DJ4403, 2021DJ2705, 2021ZG14], Study on Key Technologies of Petroduction Increase and Transformation of Gulong Shale Oil (2021ZZ10-04), Innovative Talents Promotion Plan-Young Science and Technology Star Project (2021KJXX-63).
Data Availability Statement
Not applicable.
Conflicts of Interest
The authors declare no conflict of interest.
References
- Hirth, J.P. Effects of hydrogen on the properties of iron and steel. Metall. Trans. A 1980, 11, 861–890. [Google Scholar] [CrossRef]
- Charbonnier, J.C.; Margot-Marette, J. Sulfide stress cracking of high strength modified Cr-Mo steels. Metall. Trans. A 1985, 16, 935–944. [Google Scholar] [CrossRef]
- Treseder, R.S. Factors in Sulfide Corrosion Cracking of High Strength Steels. Corrosion 1968, 17, 32–41. [Google Scholar] [CrossRef]
- Nagumo, M. Function of hydrogen in embrittlement of high-strength steels. ISIJ Int. 2001, 41, 590–598. [Google Scholar]
- Zhang, C.; Wang, Q. Effect of microstructure on the strength of 25CrMo48V martensitic steel tempered at different temperature and time. Mater. Des. 2012, 36, 220–226. [Google Scholar] [CrossRef]
- Todoshchenko, O.; Yagodzinskyy, Y. Hydrogen effects on fracture of high-strength steels with different micro-alloying. Corros. Rev. 2015, 33, 515–527. [Google Scholar]
- Wang, S. Corrosion Behavior and Sulfide Stress Cracking Sensitivity of Sulfide-resistant Casing Steel P110SS in hyperbaric H2S/CO2 environment. Corrosion Sci. Prot. Technol. 2013, 25, 7–12. [Google Scholar]
- Nirosha, D.A.; Wakshum, M.T. Effect of hydrogen on mechanical properties and fracture of martensitic carbon steel under quenched and tempered conditions. Mater. Sci. Eng. A 2021, 803, 140495. [Google Scholar]
- NACE TM0177-2016; Labortory Testing of Metals for Resistance to Sulfide Stress Cracking and Stress Corrosion Cracking in H2S Environments. NACE International: Houston, TX, USA, 2016.
- Zeng, D.; Chen, R. Research on Stress Corrosion Sensitivity of C110 Casing in Wellbore Protection Fluid. Energy Procedia 2012, 16, 816–821. [Google Scholar] [CrossRef]
- Liu, M.; Wang, C.H. Effect of quenching and tempering process on sulfide stress cracking susceptibility in API-5CT-C110 casing steel. Mater. Sci. Eng. A 2017, 688, 378–387. [Google Scholar] [CrossRef]
- Sun, Y. Study on Microstructure and Mechanical Properties and SSC Resistance of C110 Grade OCTG Steel; Yanshan University: Yanshan, China, 2018. [Google Scholar]
- Turconi, G.L.; Echaniz, G. Improvement of resistance to SSC initiation and propagation of high strength OCTG through microstructure and precipitation control. In Proceedings of the NACE Conference, Miami Beach, FL, USA, 19–22 June 2001; pp. 11–16. [Google Scholar]
- Koval, V.P.; Karvatskii, L.M. Influence of carbon, Nickel, Manganese, and vanadium on stress-corrosion cracking of steels in a medium containing hydrogen sulfide. Mater. Sci. 1979, 15, 72–75. [Google Scholar] [CrossRef]
- Yoshino, Y.; Minozaki, Y. Sulfide stress cracking resistance of low-alloy nickel steels. Corrosion 1986, 42, 222–233. [Google Scholar]
- Wang, Z.; Zhang, H. Effect of molybdenum addition on the precipitation of carbides in the austenite matrix of titanium micro-alloyed steels. J. Mater. Sci. 2016, 51, 4996–5007. [Google Scholar]
- Grobner, P.J.; Sponseller, D. Effect of molybdenum content on the sulfide stress cracking resistance of AISI 4130 type steel with 0.035% Cb. Corrosion 1979, 35, 240–249. [Google Scholar]
- Koh, S.U.; Lee, J.M. Effect of Molybdenum and Chromium Addition on the Susceptibility to Sulfide Stress Cracking of High-Strength, Low-Alloy Steels. Corrosion 2007, 63, 220–230. [Google Scholar]
- Wang, Q.; Sun, Y. Effect of Nb on microstructure and yield strength of a high temperature tempered martensitic steel. Mater. Res. Express 2018, 5, 4. [Google Scholar] [CrossRef]
- Mendibid, C.; Sourmail, T. Composition optimization of high-strength steels for sulfide stress cracking resistance improvement. Corros. Sci. 2009, 51, 2878–2884. [Google Scholar] [CrossRef]
- Wang, X.T.; Liu, M. Effects of chromium and tungsten on sulfide stress cracking in high strength low alloy 125ksi grade casing steel. Corros. Sci. 2019, 160, 108163. [Google Scholar]
- Luo, M.; Liu, M. Effect of tempering temperature at high temperature zone on sulfide stress cracking behavior for casing steel. Eng. Fail. Anal. 2019, 105, 227–236. [Google Scholar] [CrossRef]
- Wang, Q.; Zhang, C. Characterization of the microstructures and mechanical properties of 25CrMo48V martensitic steel tempered at different times. Mater. Sci. Eng. A 2013, 559, 130–134. [Google Scholar]
- Pressouyre, G.M. A classification of hydrogen traps in steel. Metall. Trans. A 1979, 10A, 1571–1573. [Google Scholar]
- Hou, J.; Peng, Q.J. Effects of cold working path on strain concentration, grain boundary microstructure and stress corrosion cracking in Alloy 600. Corros. Sci. 2011, 53, 2956–2962. [Google Scholar]
- Pešička, J. The evolution of dislocation density during heat treatment and creep of tempered martensite ferritic steels. Acta Mater. 2003, 51, 4847–4862. [Google Scholar]
- Lin, Y.; McCarroll, L. Hydrogen trapping and desorption of dual precipitates in tempered low-carbon martensitic steel. Acta Mater. 2020, 196, 516–527. [Google Scholar]
- ASTM Standard A370-10; Test Methods and Definitions for Mechanical Testing of Steel Products. ASTM International: West Conshohocken, PA, USA, 2010.
- Ma, X. Mechanical properties of copper/bronze laminates: Role of interfaces. Acta Mater. 2016, 116, 43–52. [Google Scholar] [CrossRef]
- API SPEC 5CT. Specification for Casing and Tube, 9th ed.; API: Washington, DC, USA, 2011. [Google Scholar]
- Gao, H.; Huang, Y. Mechanism-based strain gradient plasticity-I. Theory. J. Mech. Phys. Solids 1999, 47, 1239–1263. [Google Scholar] [CrossRef]
- Kubin, L.P.; Mortensen, A. Geometrically necessary dislocations and straingradient plasticity: A few critical issues. Scr. Mater. 2003, 48, 119–125. [Google Scholar]
- Yoshino, Y. Metallurgical influences on the hydrogen uptake by steel in H2S environment. Corrosion 1983, 39, 435–444. [Google Scholar] [CrossRef]
- Depover, T.; Verbeken, K. The effect of TiC on the hydrogen induced ductility loss and trapping behavior of Fe-C-Ti alloys. Corros. Sci. 2016, 112, 308–326. [Google Scholar]
- Caronk, R.N.; Krauss, G. The tempering of Fe-C lath martensite. Metall. Trans. 1972, 3, 2381–2389. [Google Scholar]
- Mohtadi-Bonab, M.A.; Eskandari, M. Texture, local misorientation, grain boundary and recrystallization fraction in pipeline steels related to hydrogen induced cracking. Mater. Sci. Eng. A 2014, 620, 97–106. [Google Scholar]


Disclaimer/Publisher’s Note: The statements, opinions and data contained in all publications are solely those of the individual author(s) and contributor(s) and not of MDPI and/or the editor(s). MDPI and/or the editor(s) disclaim responsibility for any injury to people or property resulting from any ideas, methods, instructions or products referred to in the content. |
© 2023 by the authors. Licensee MDPI, Basel, Switzerland. This article is an open access article distributed under the terms and conditions of the Creative Commons Attribution (CC BY) license (https://creativecommons.org/licenses/by/4.0/).