
FEM Simulation of Surface Micro-Groove Structure Fins Produced by Cryogenic-Temperature Extrusion Machining


Abstract
:1. Introduction
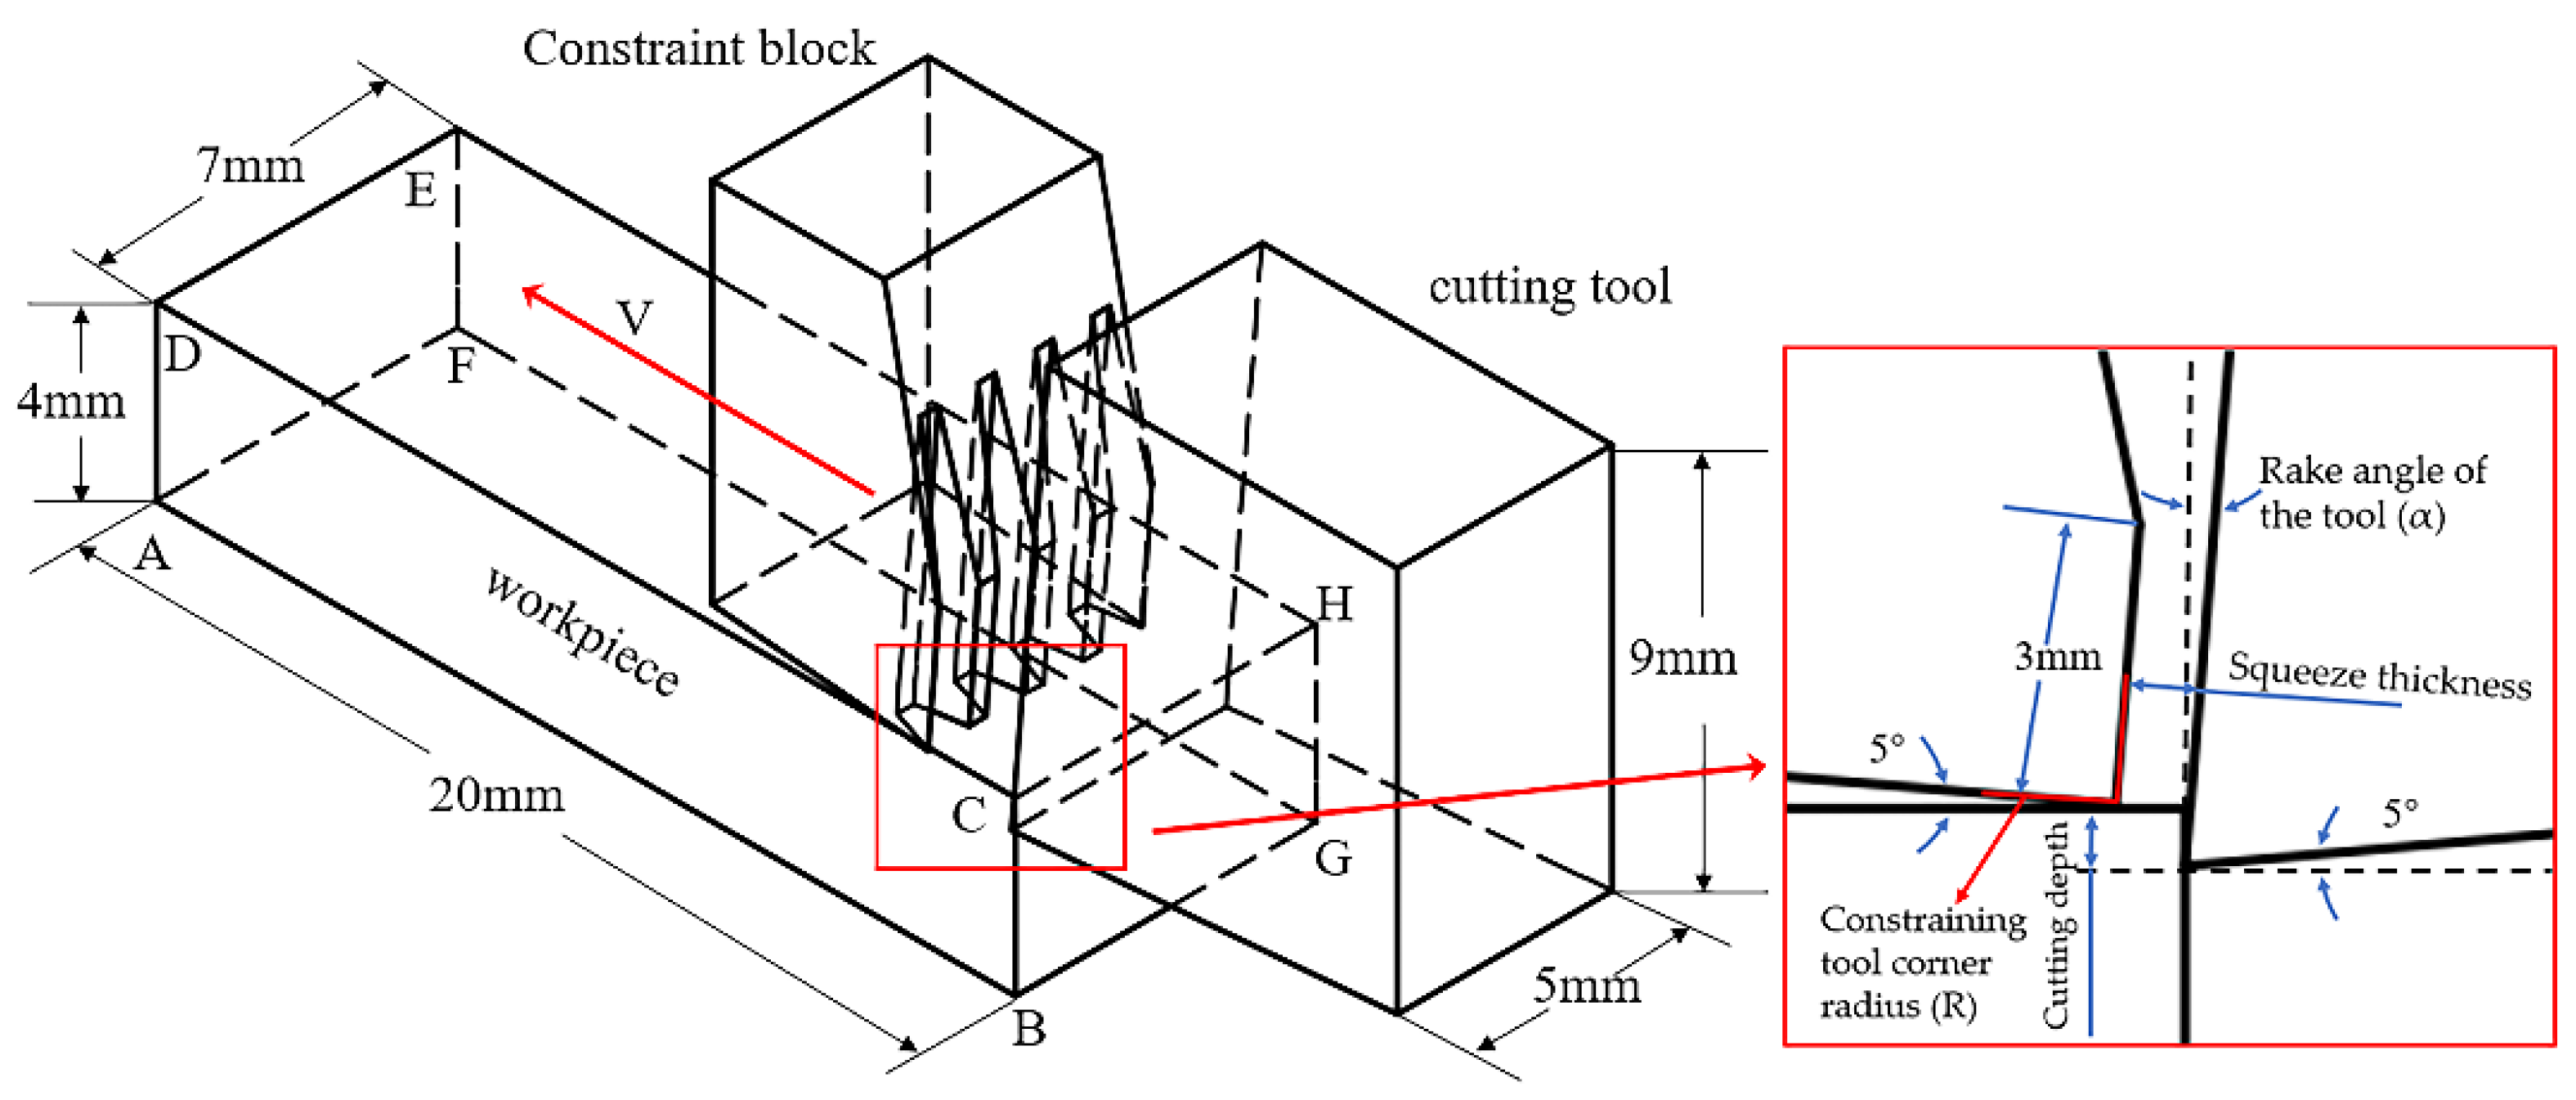
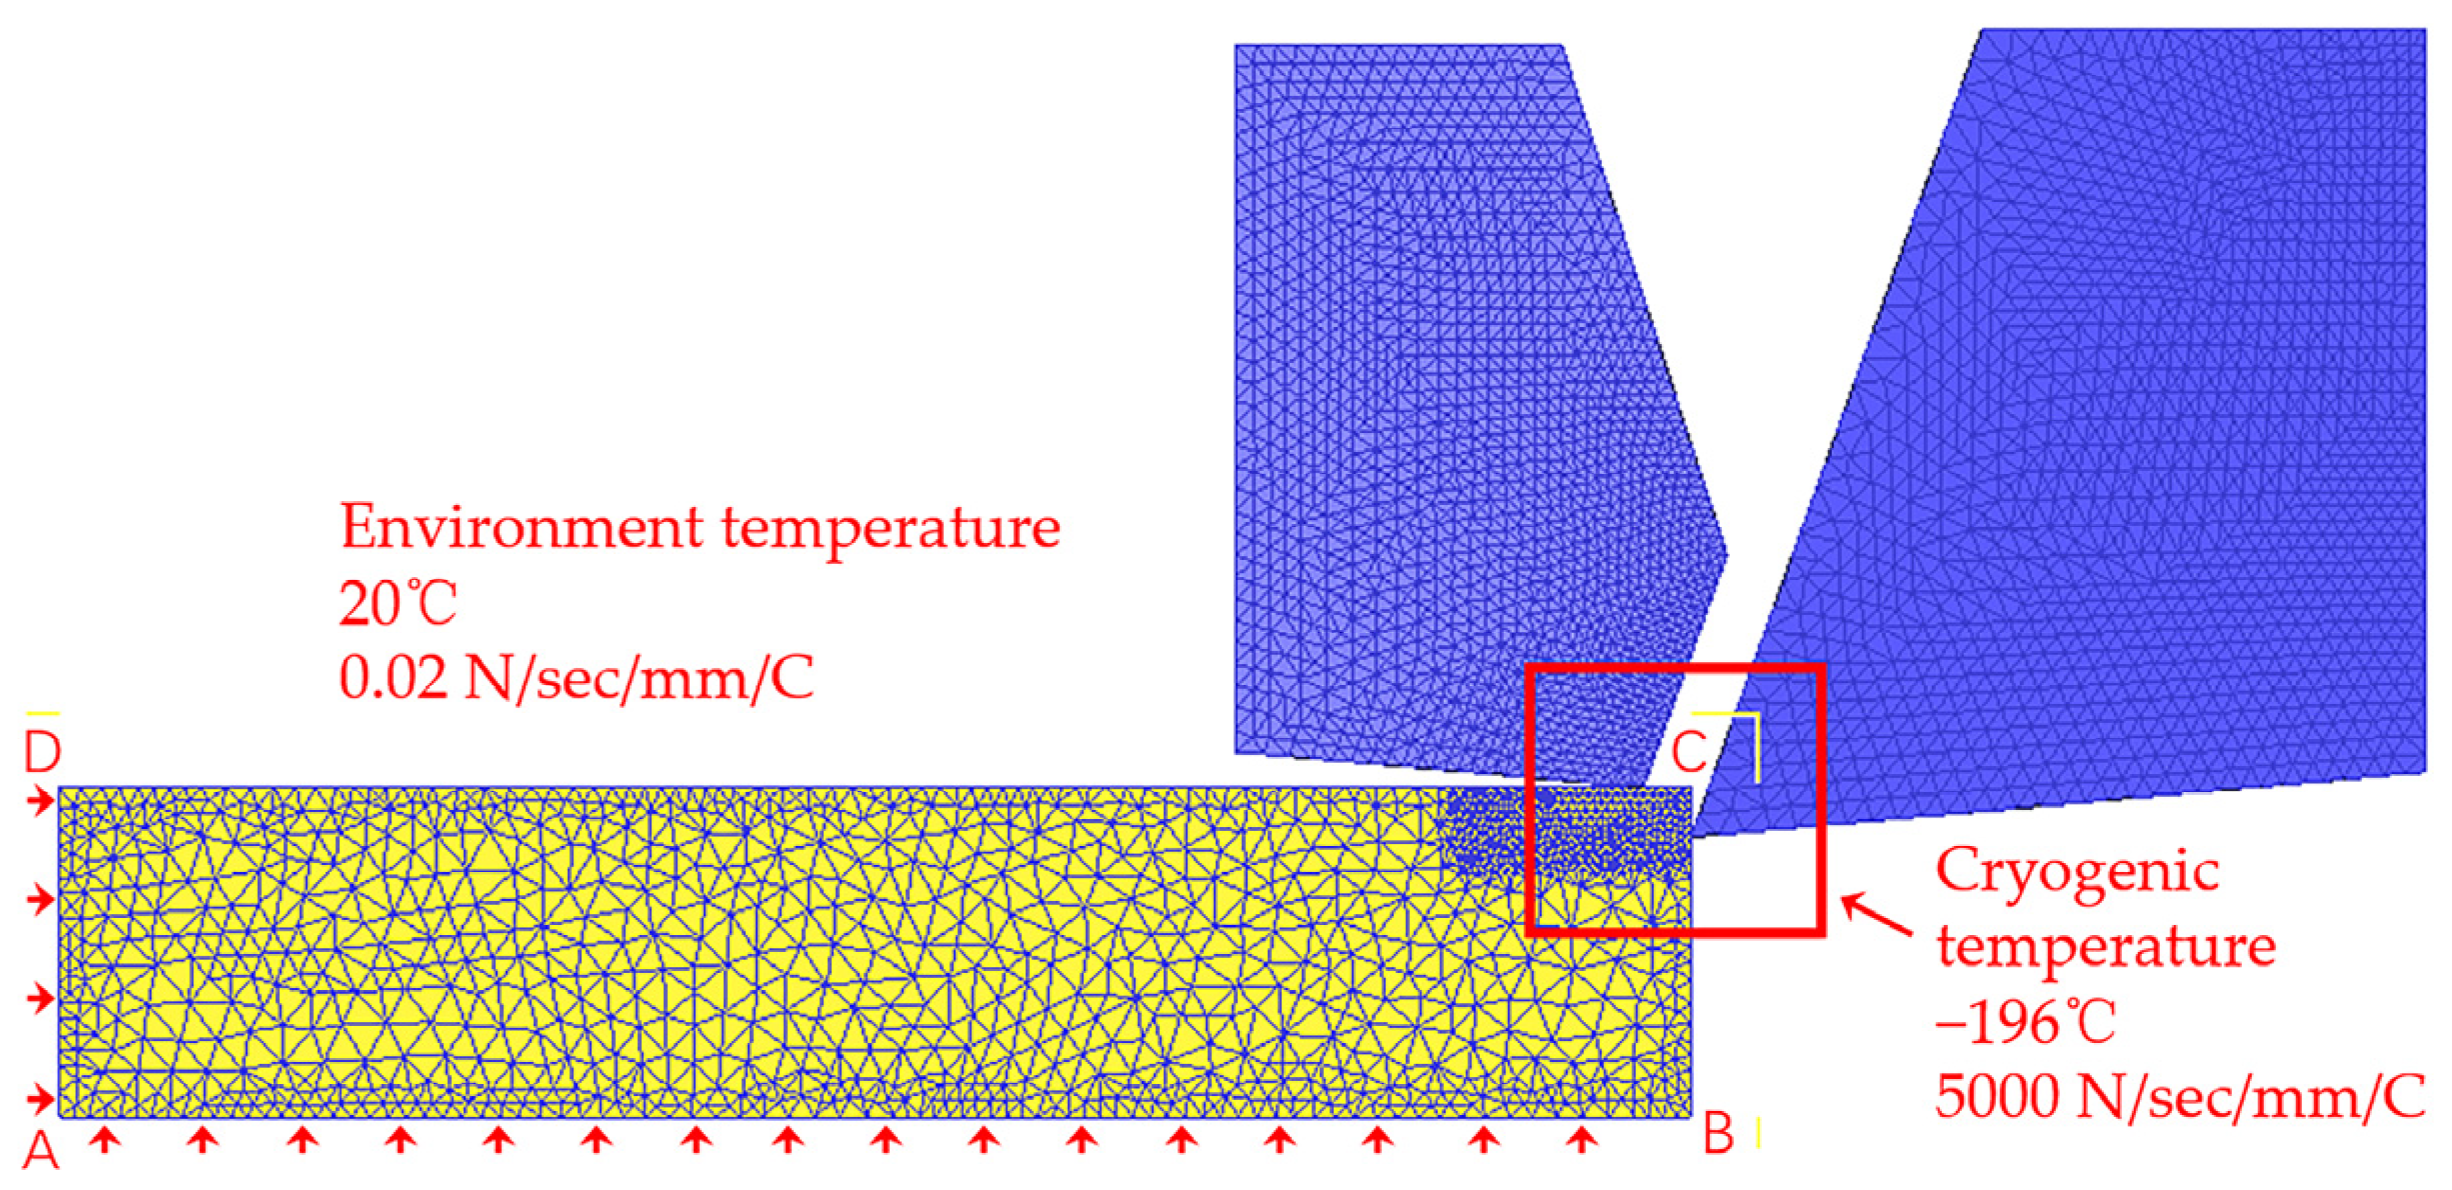
2. Establishment of the Finite Element Model
3. Simulation Results and Analysis
3.1. Influence of λ on Formability of Micro-Groove Fins
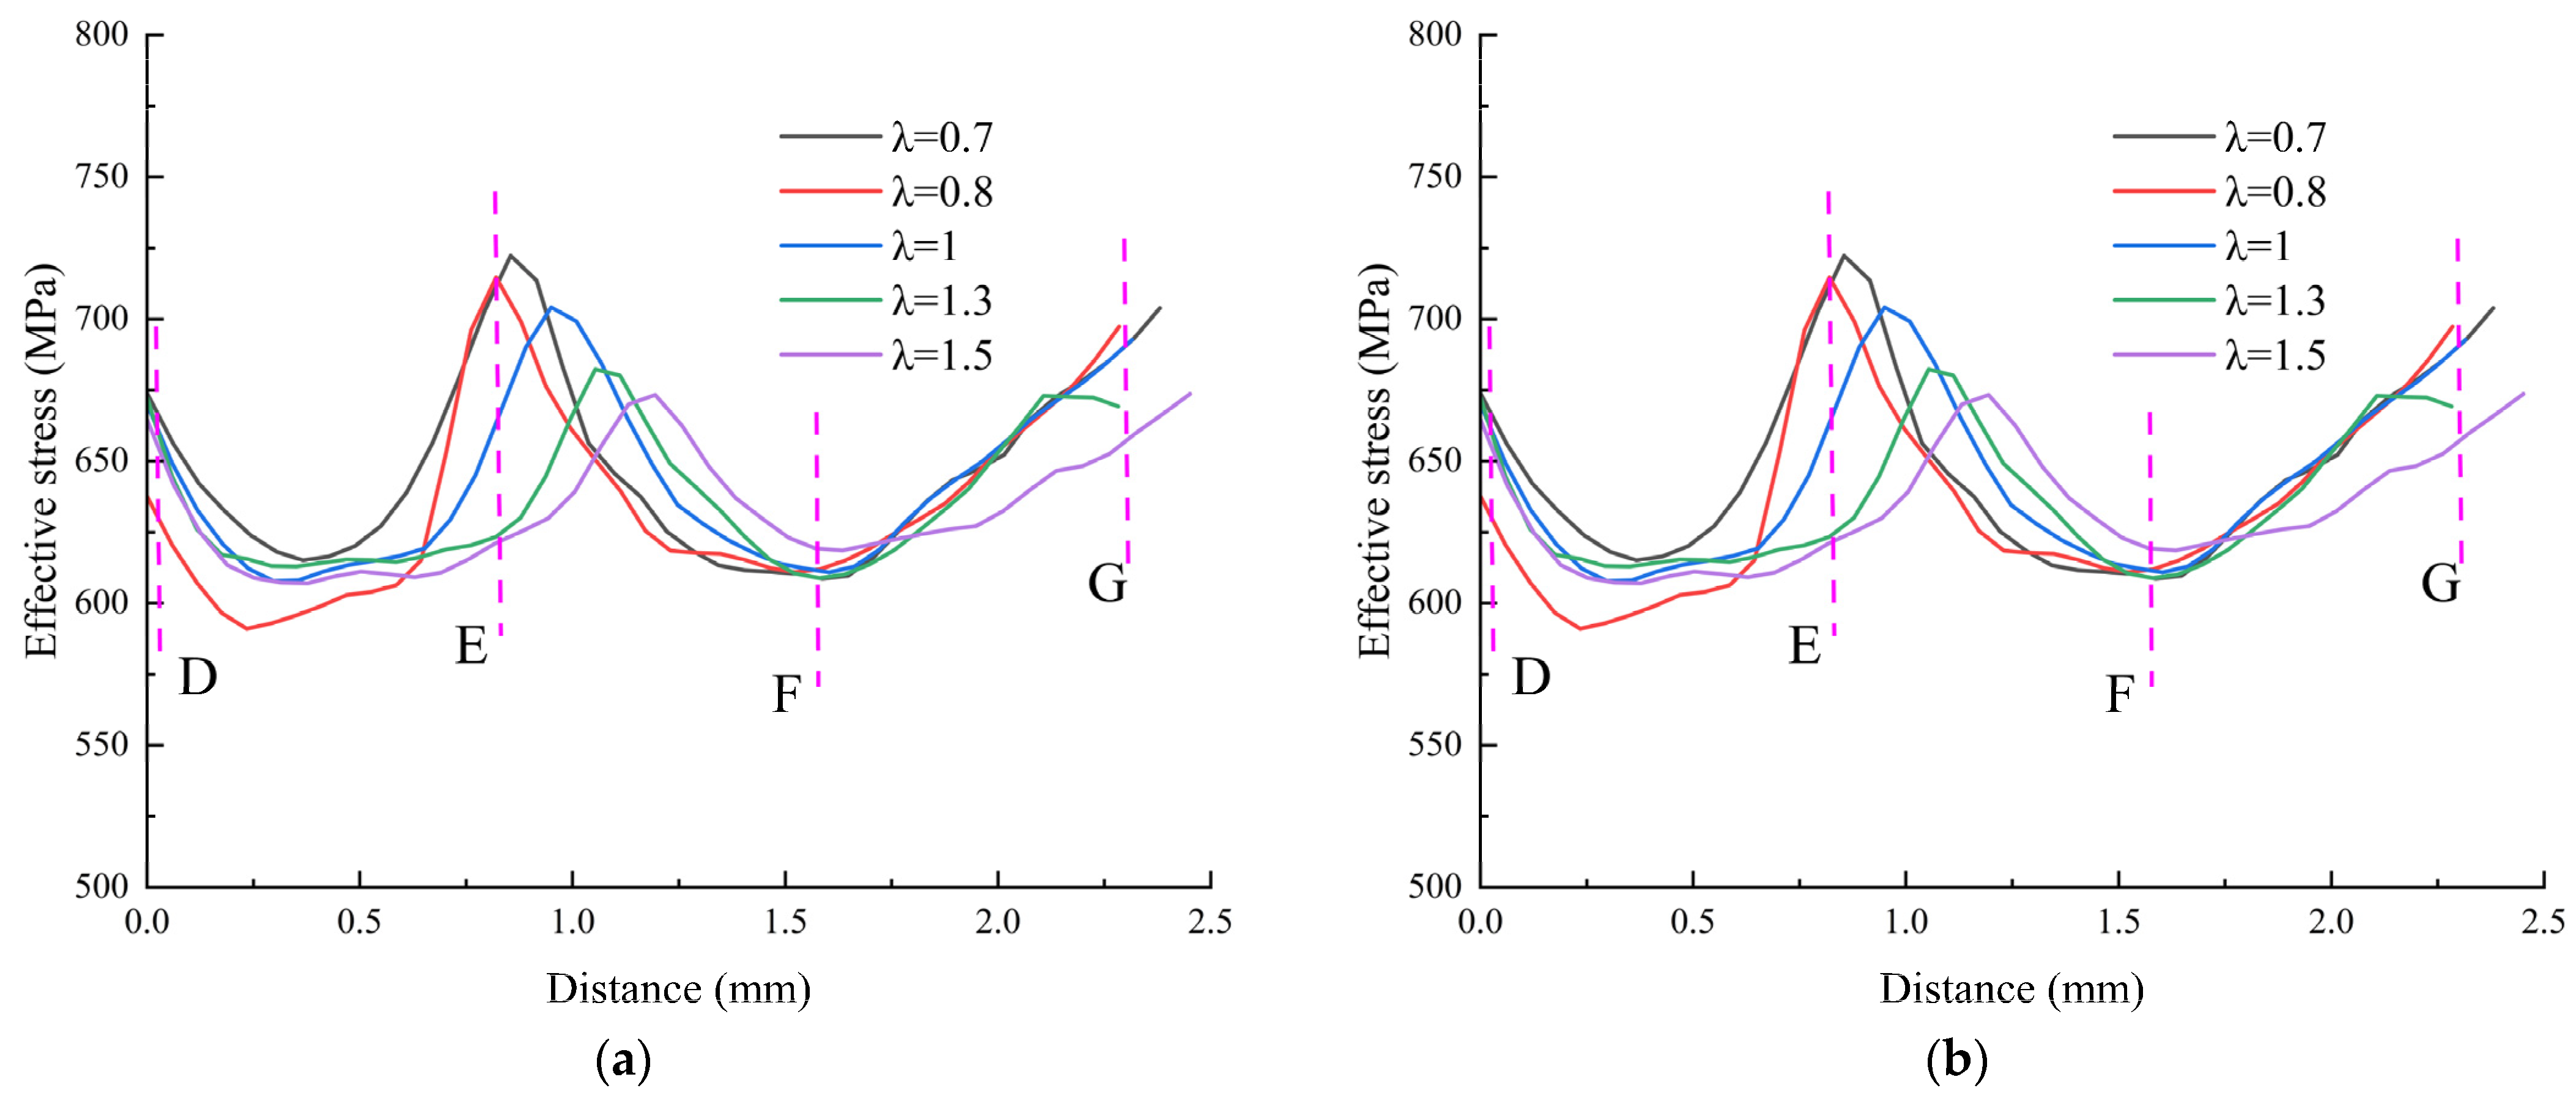
3.1.1. Effective Stress
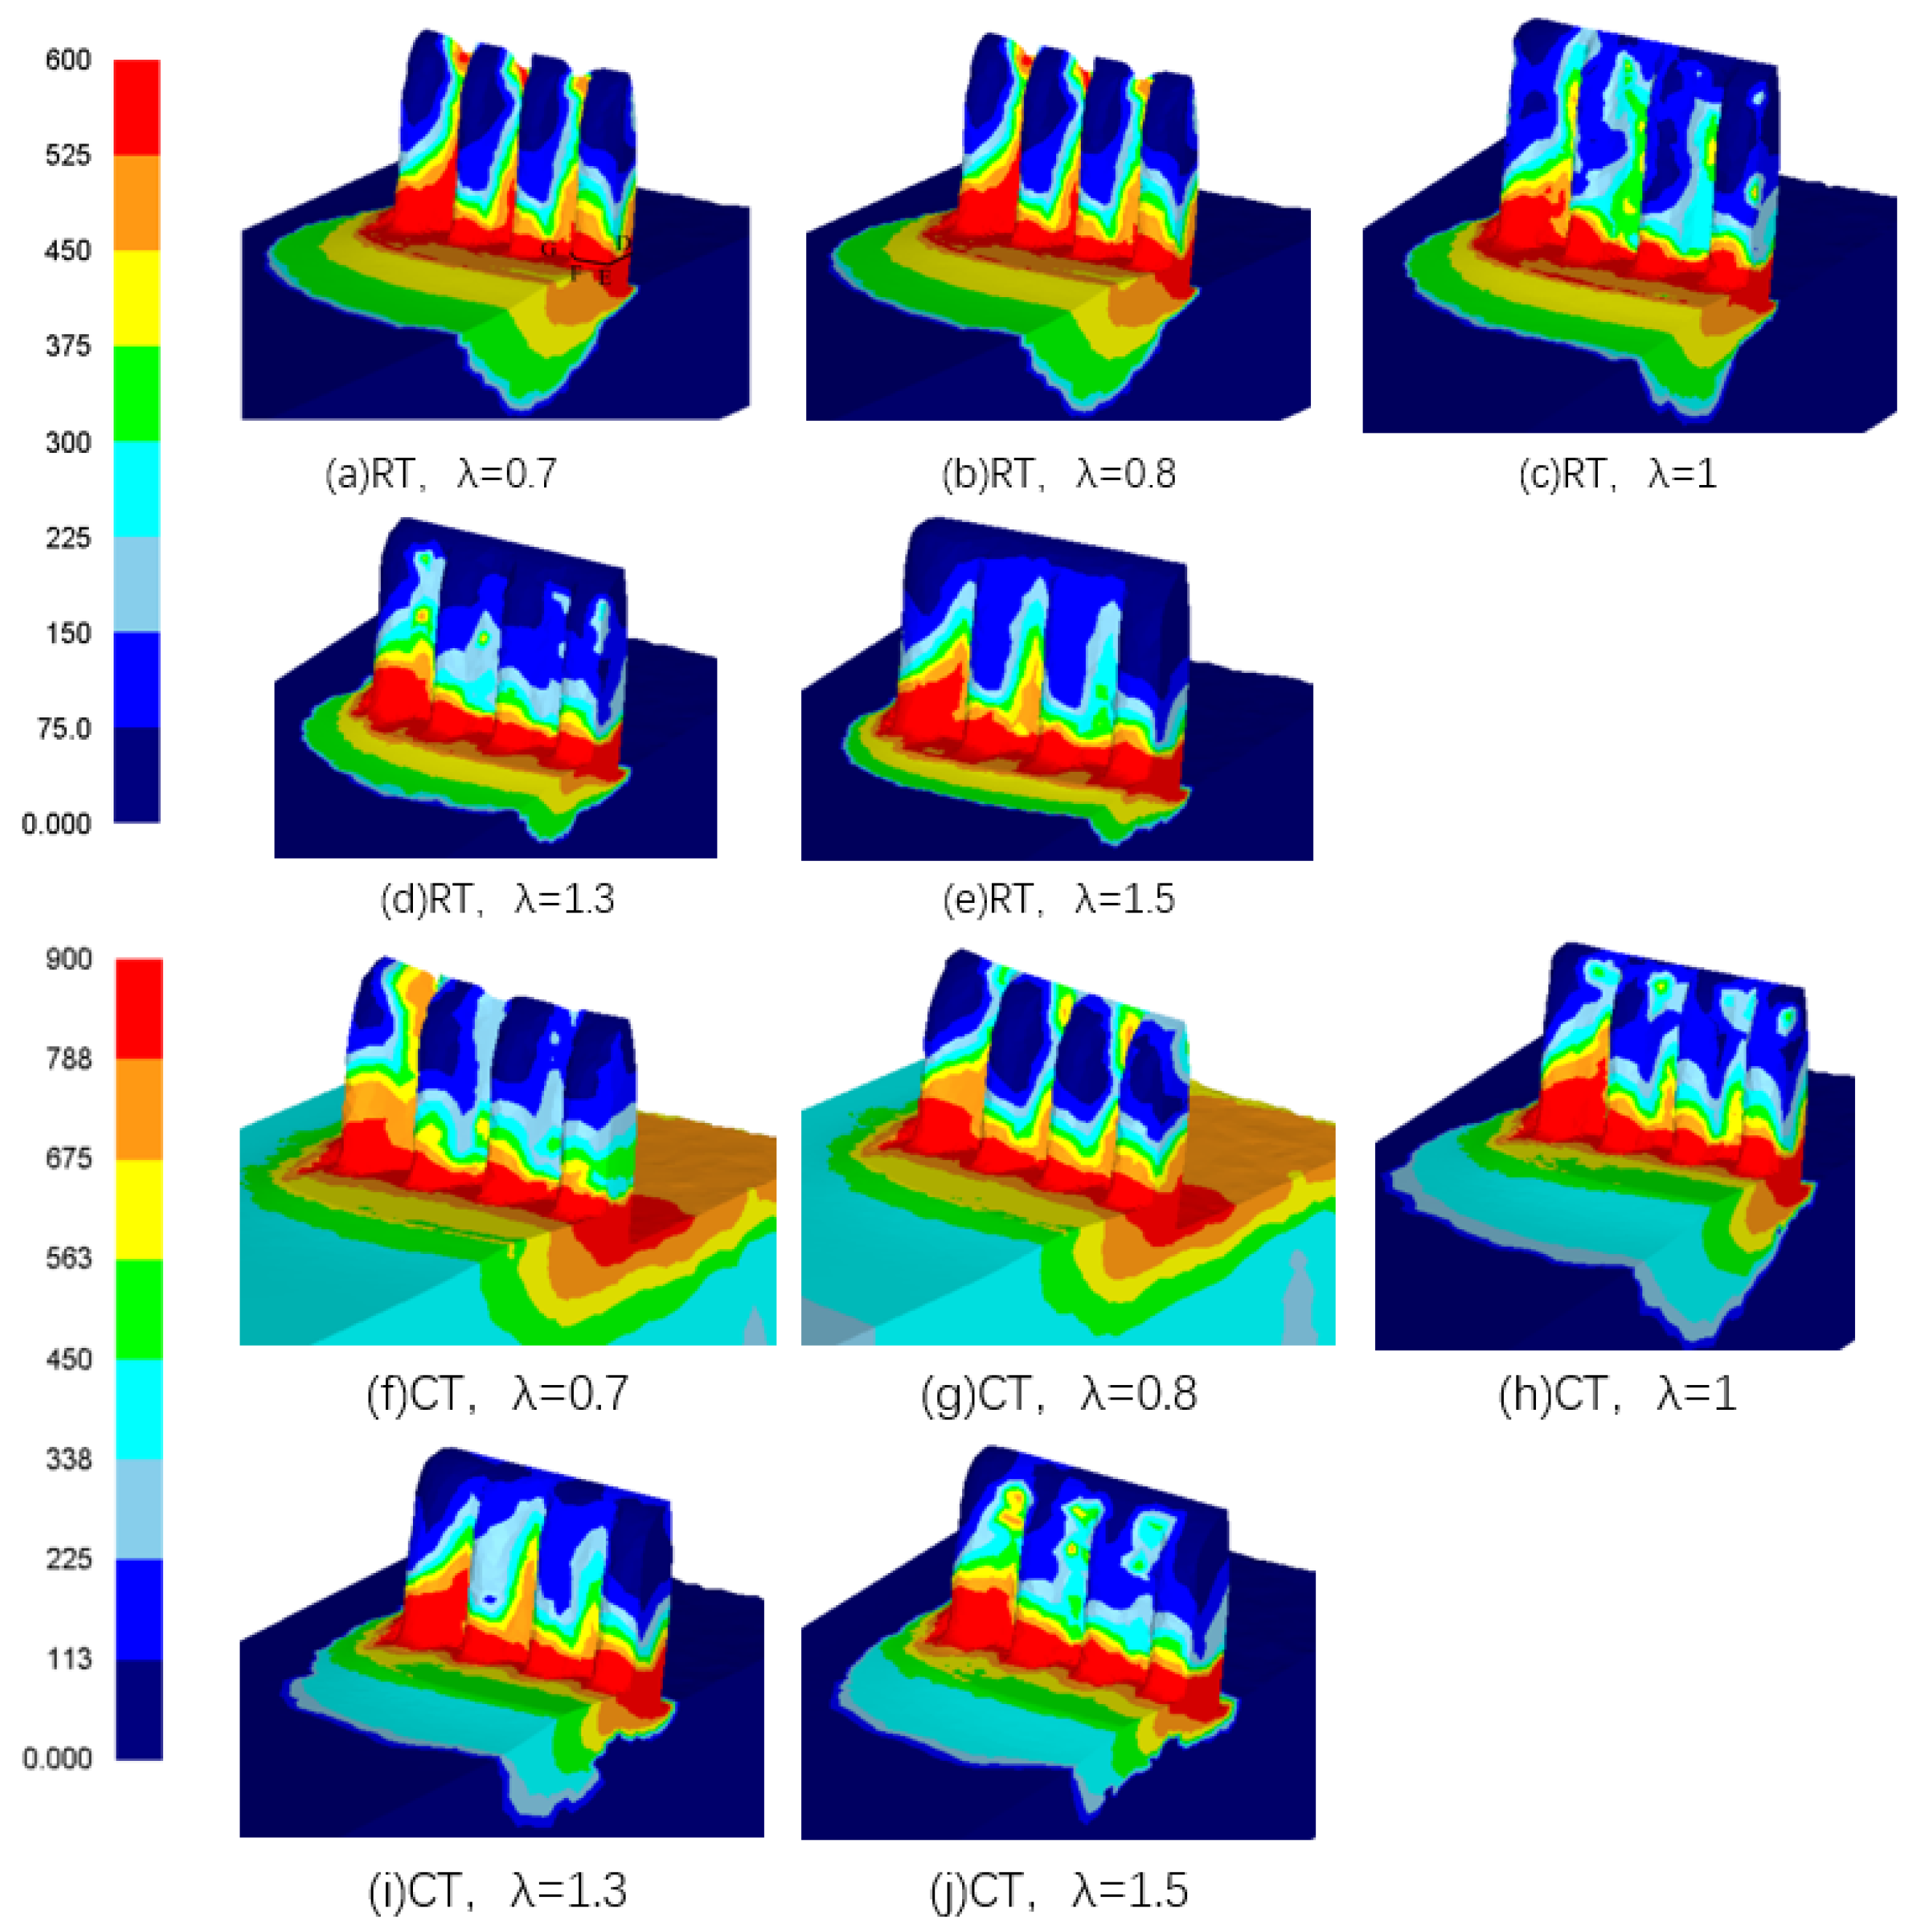
3.1.2. Temperature
3.1.3. Formability
3.2. Influence of α on Formability of Micro-Groove Fins
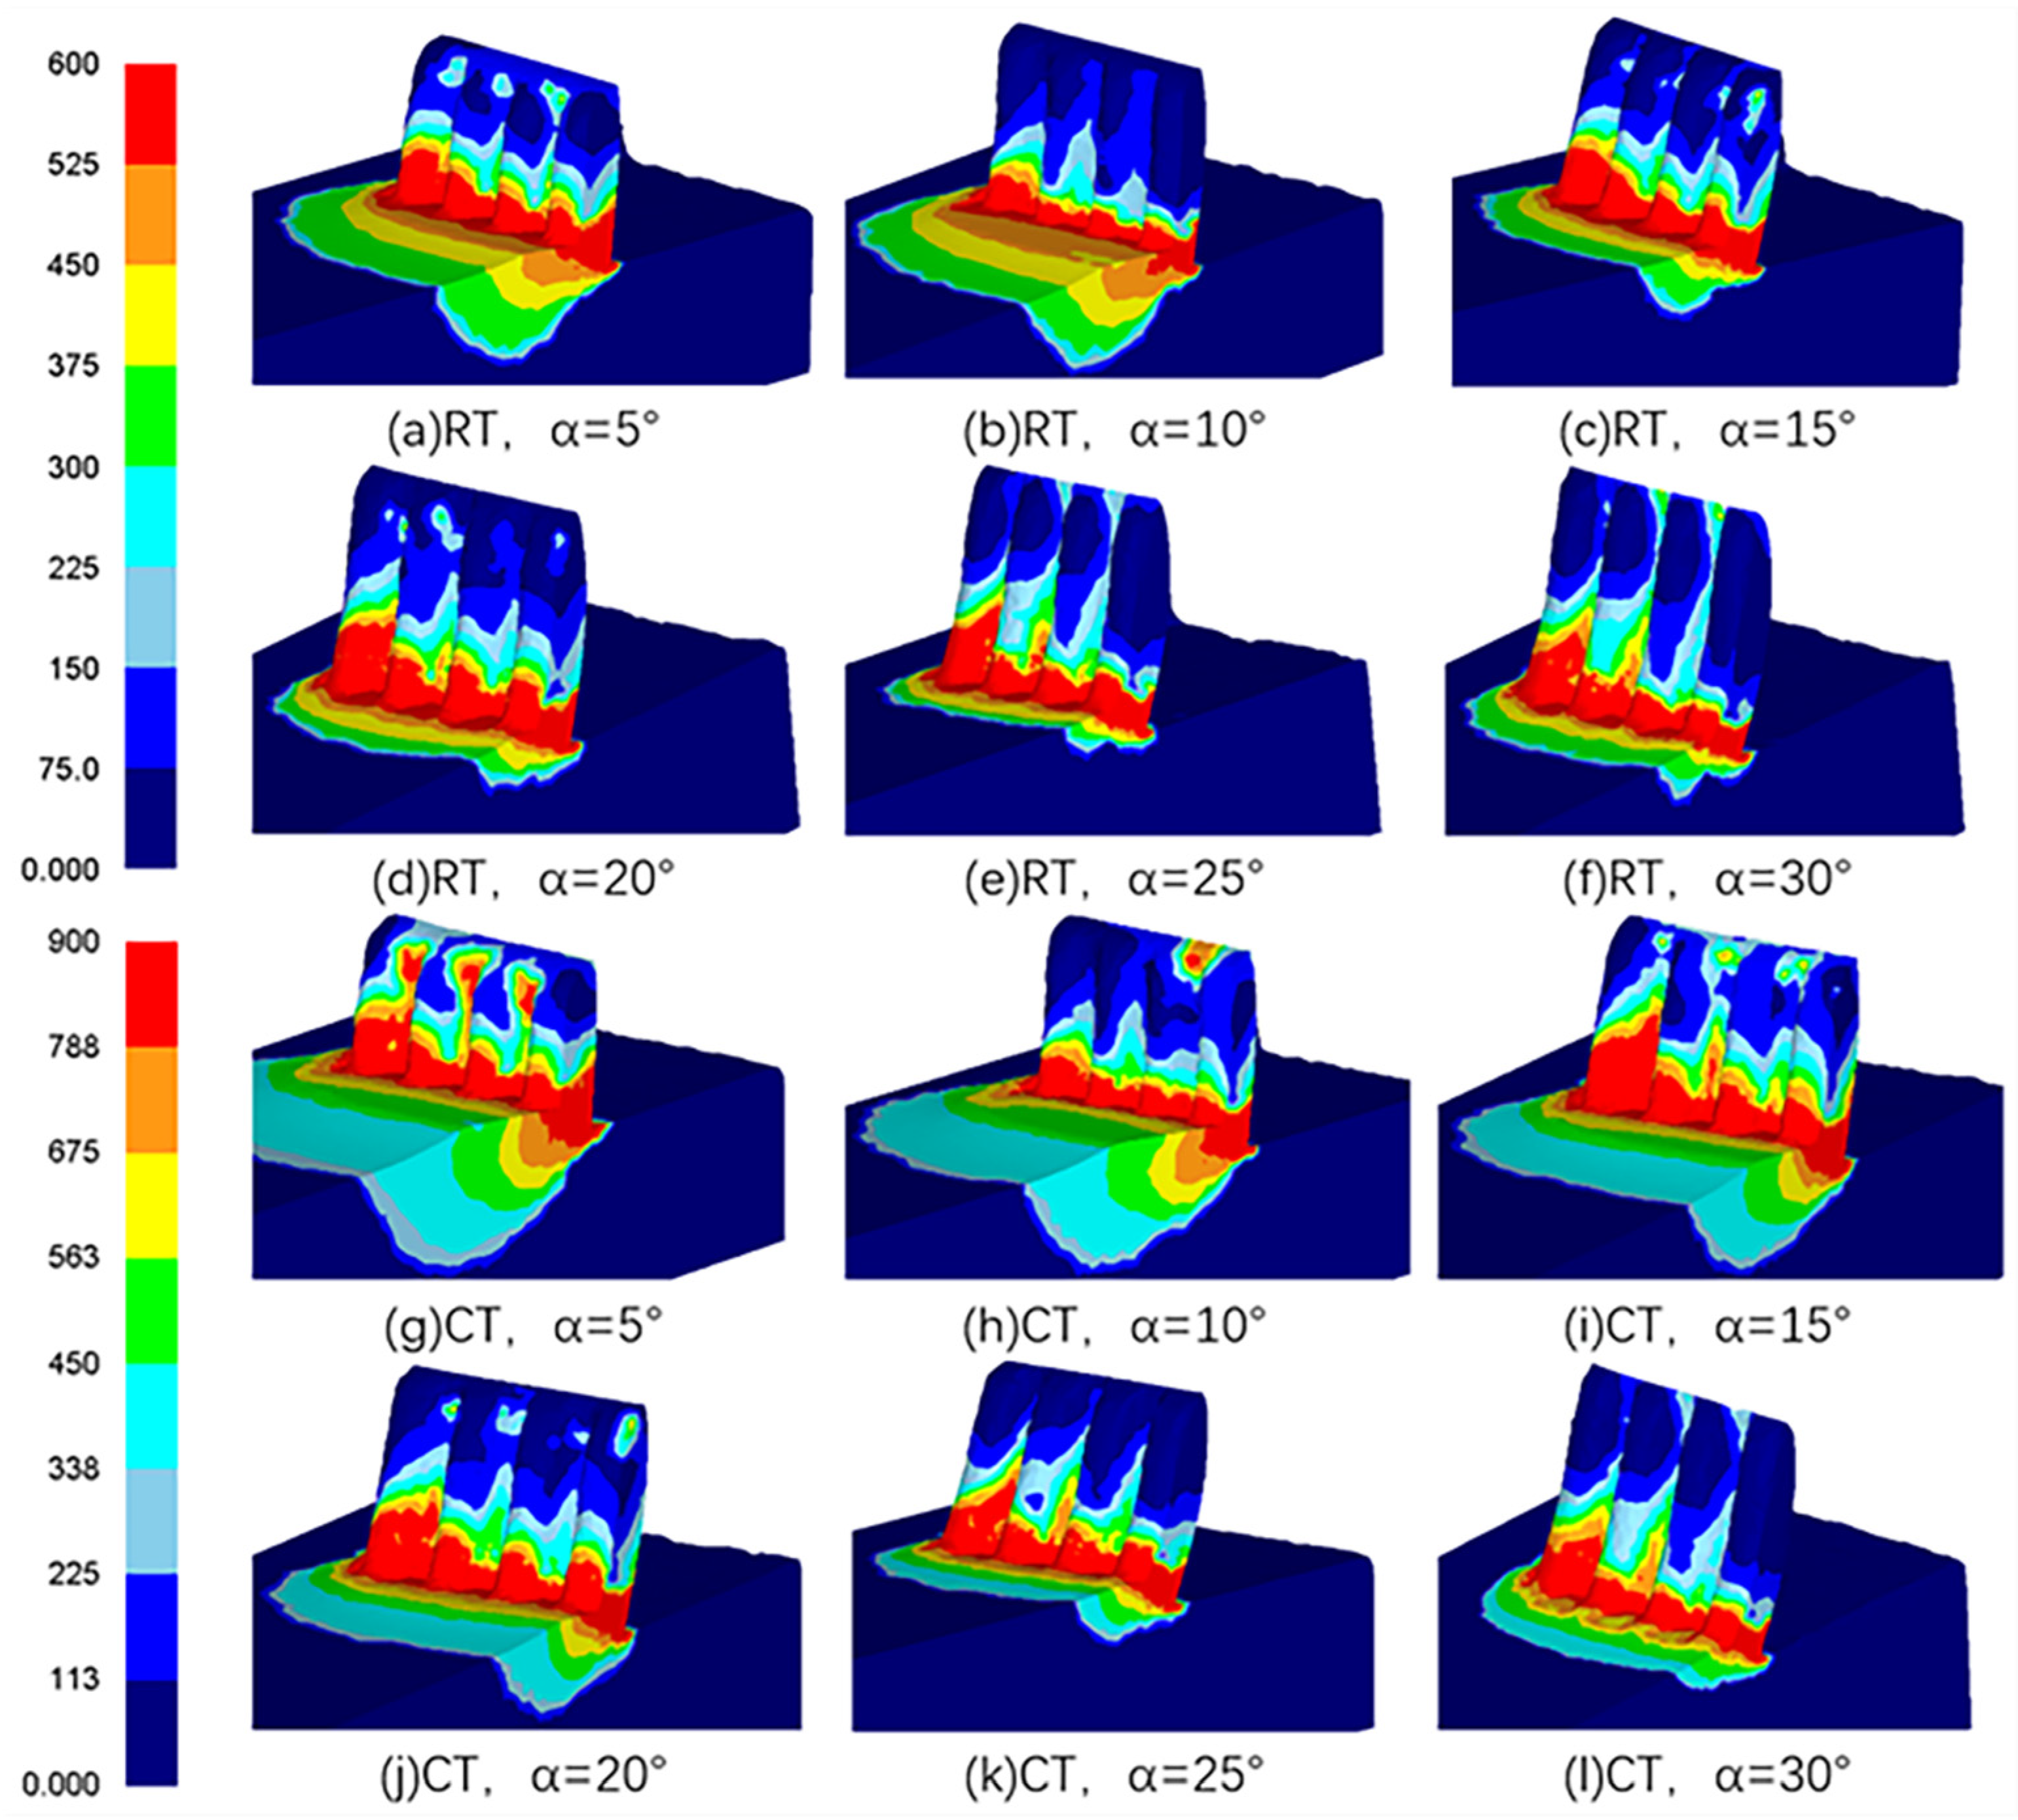
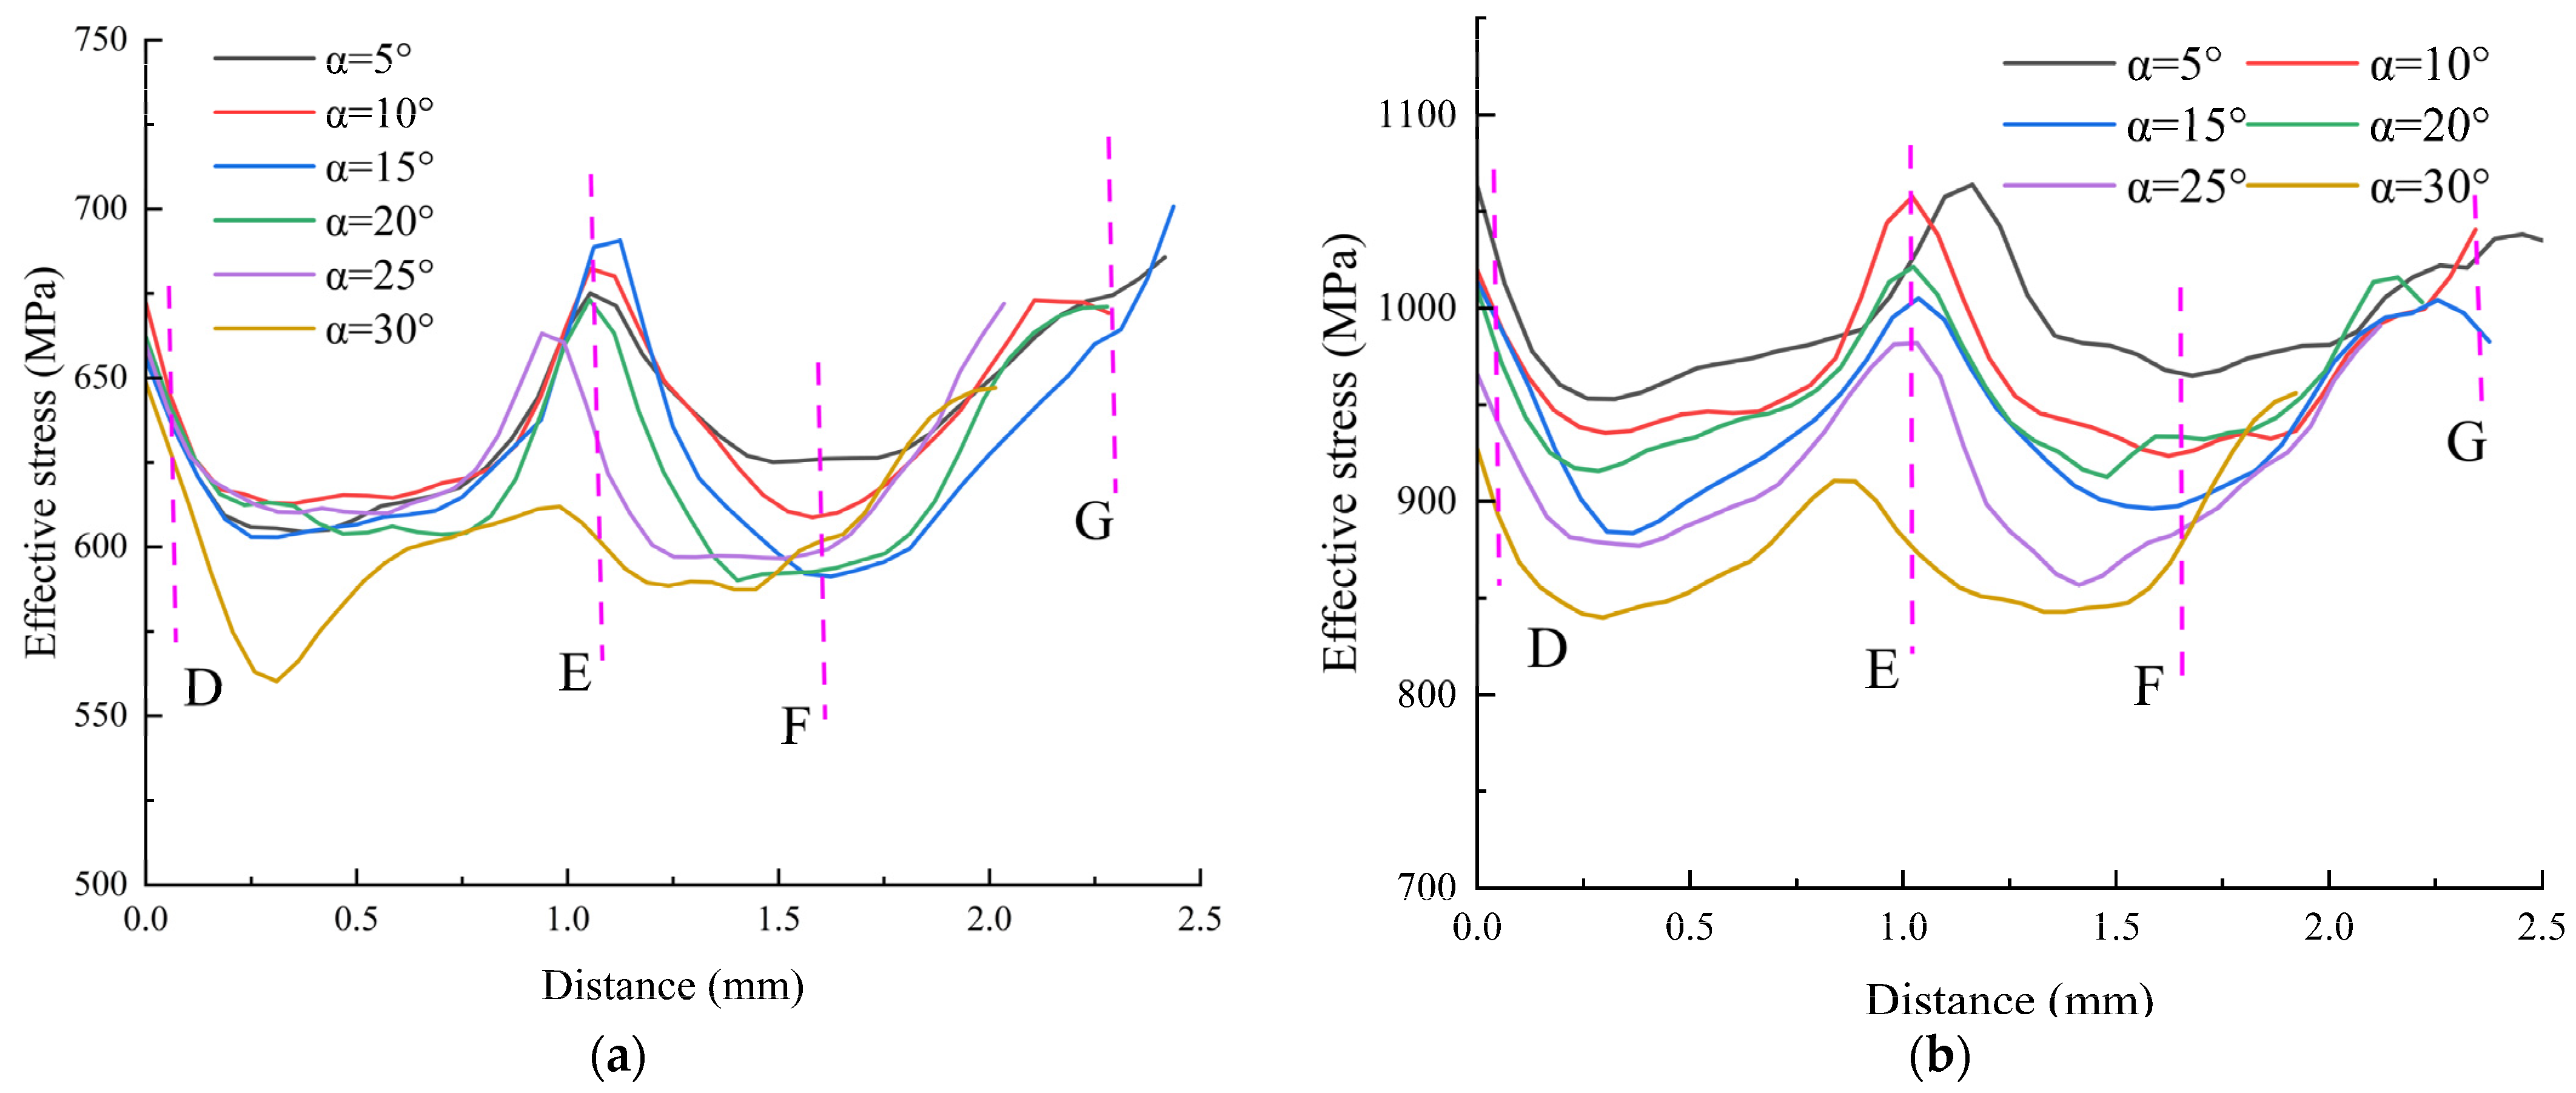
3.2.1. Effective Stress
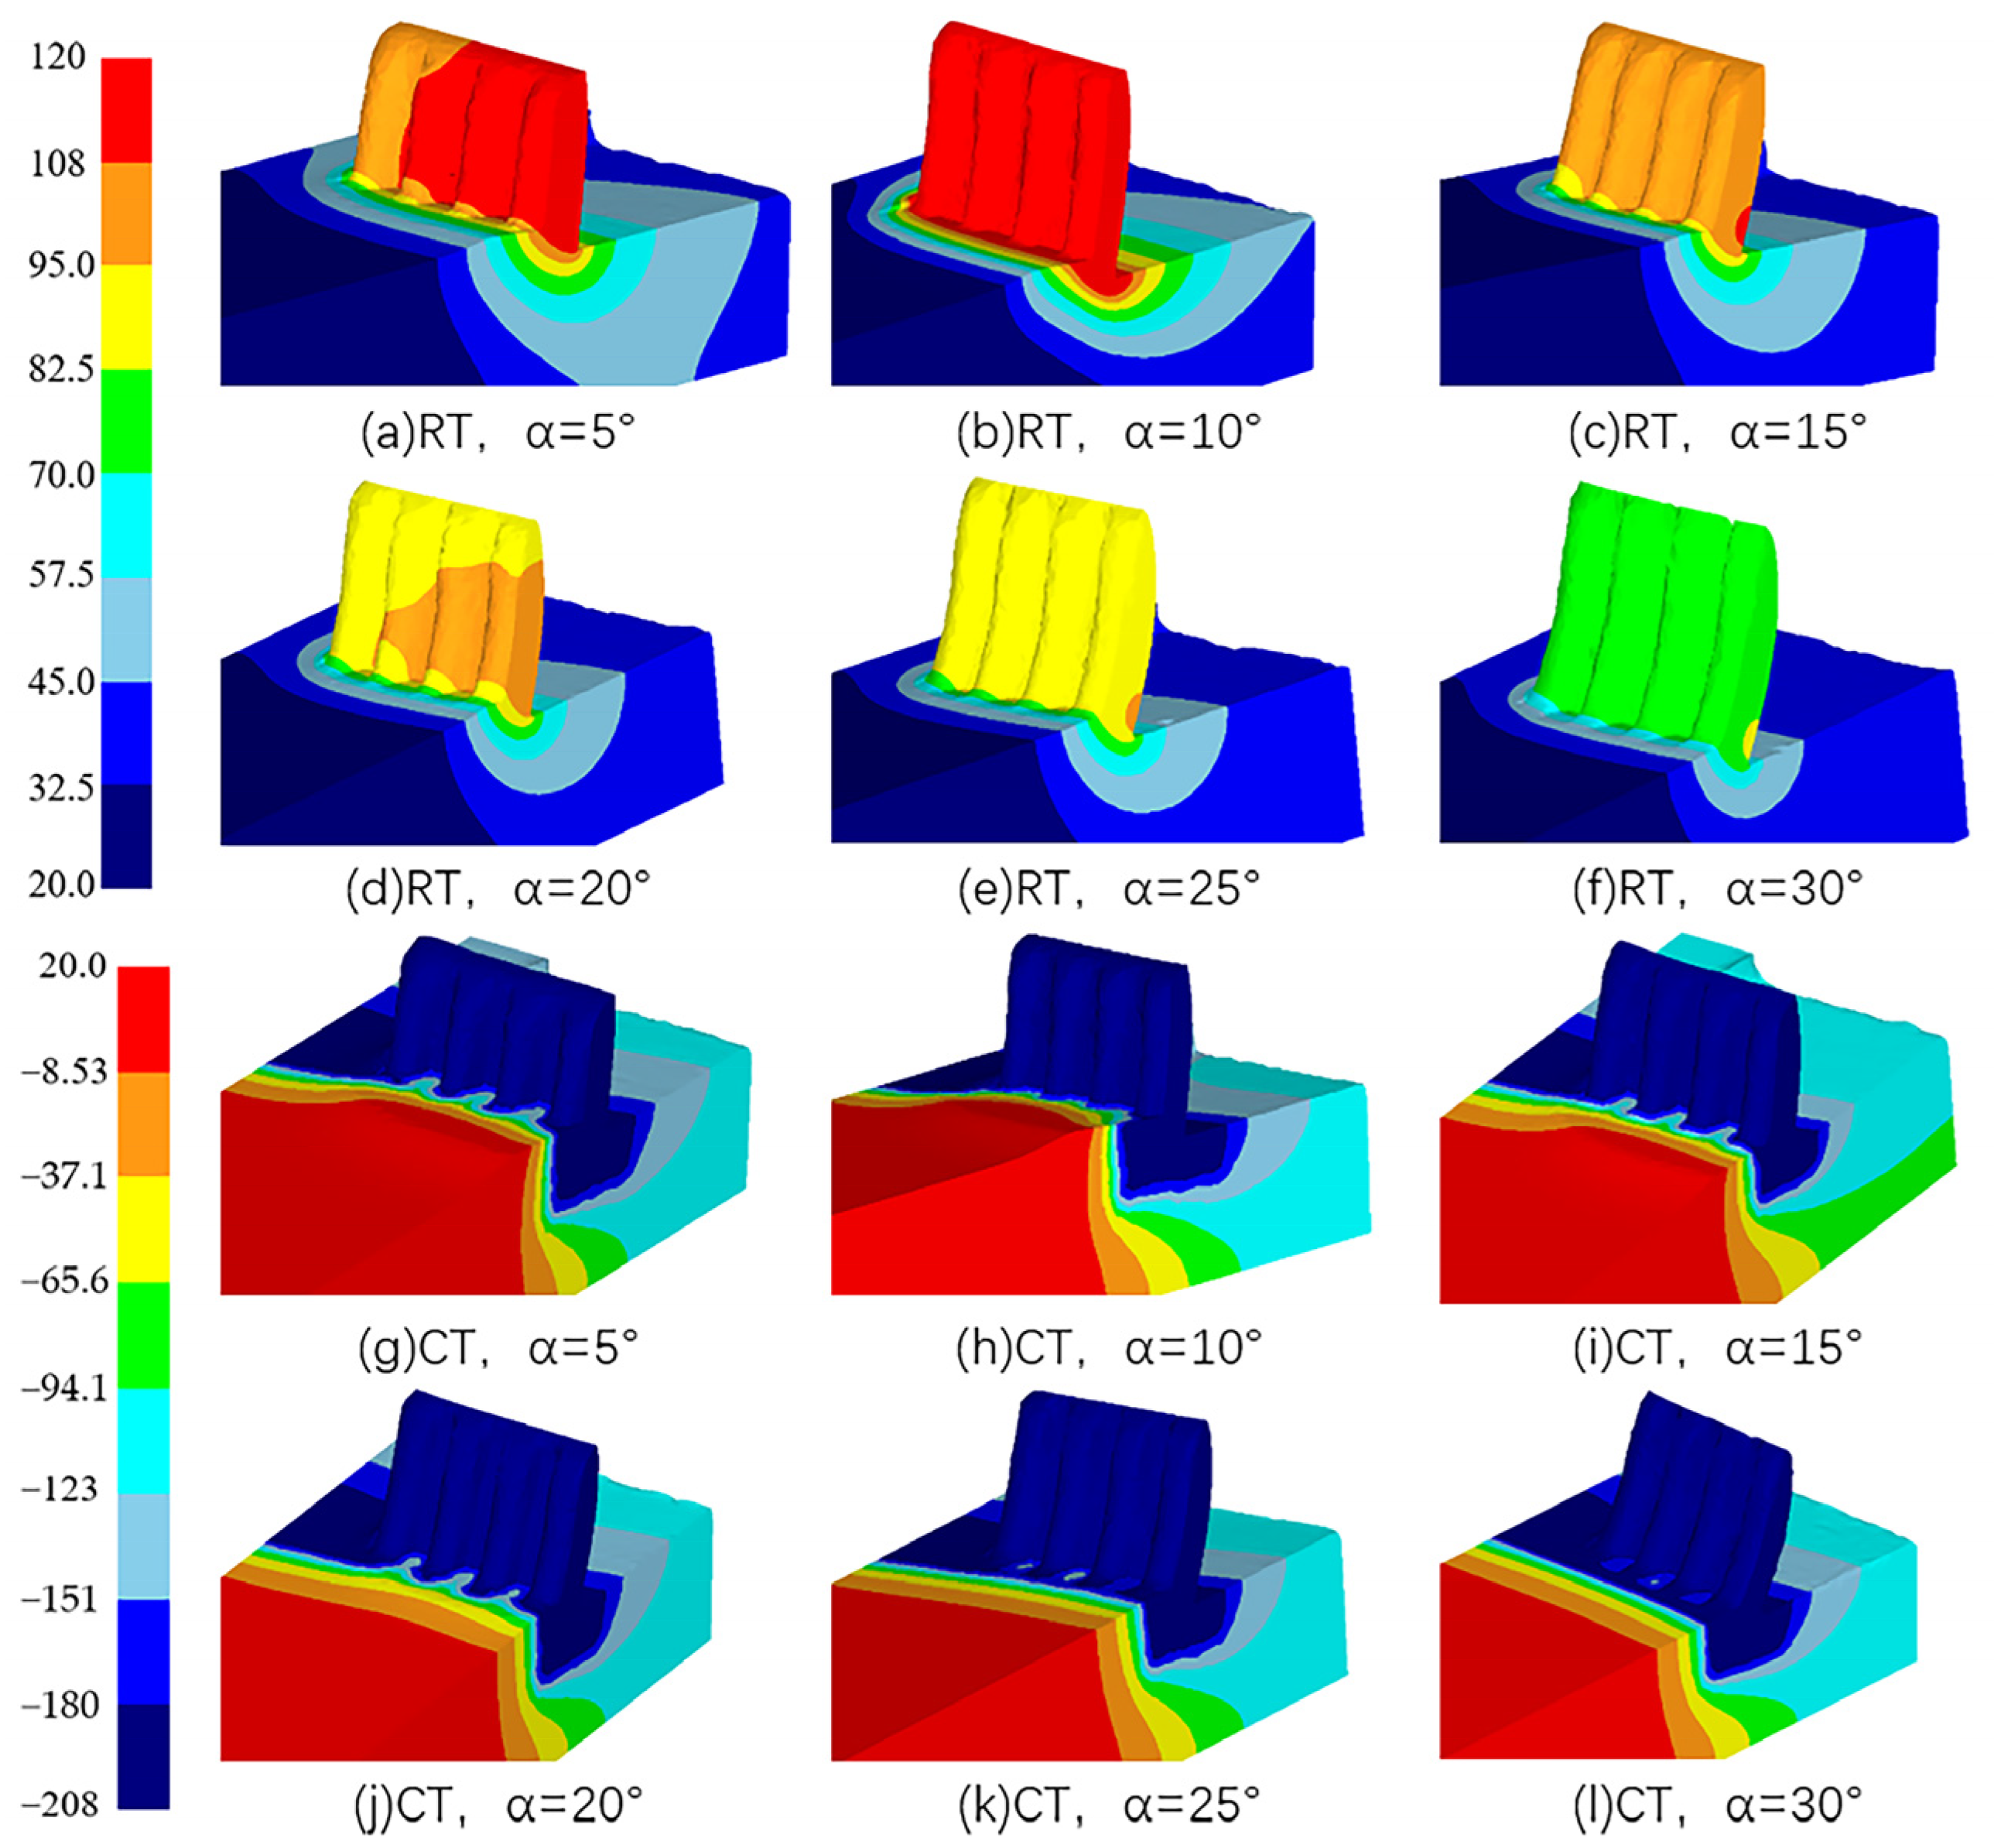
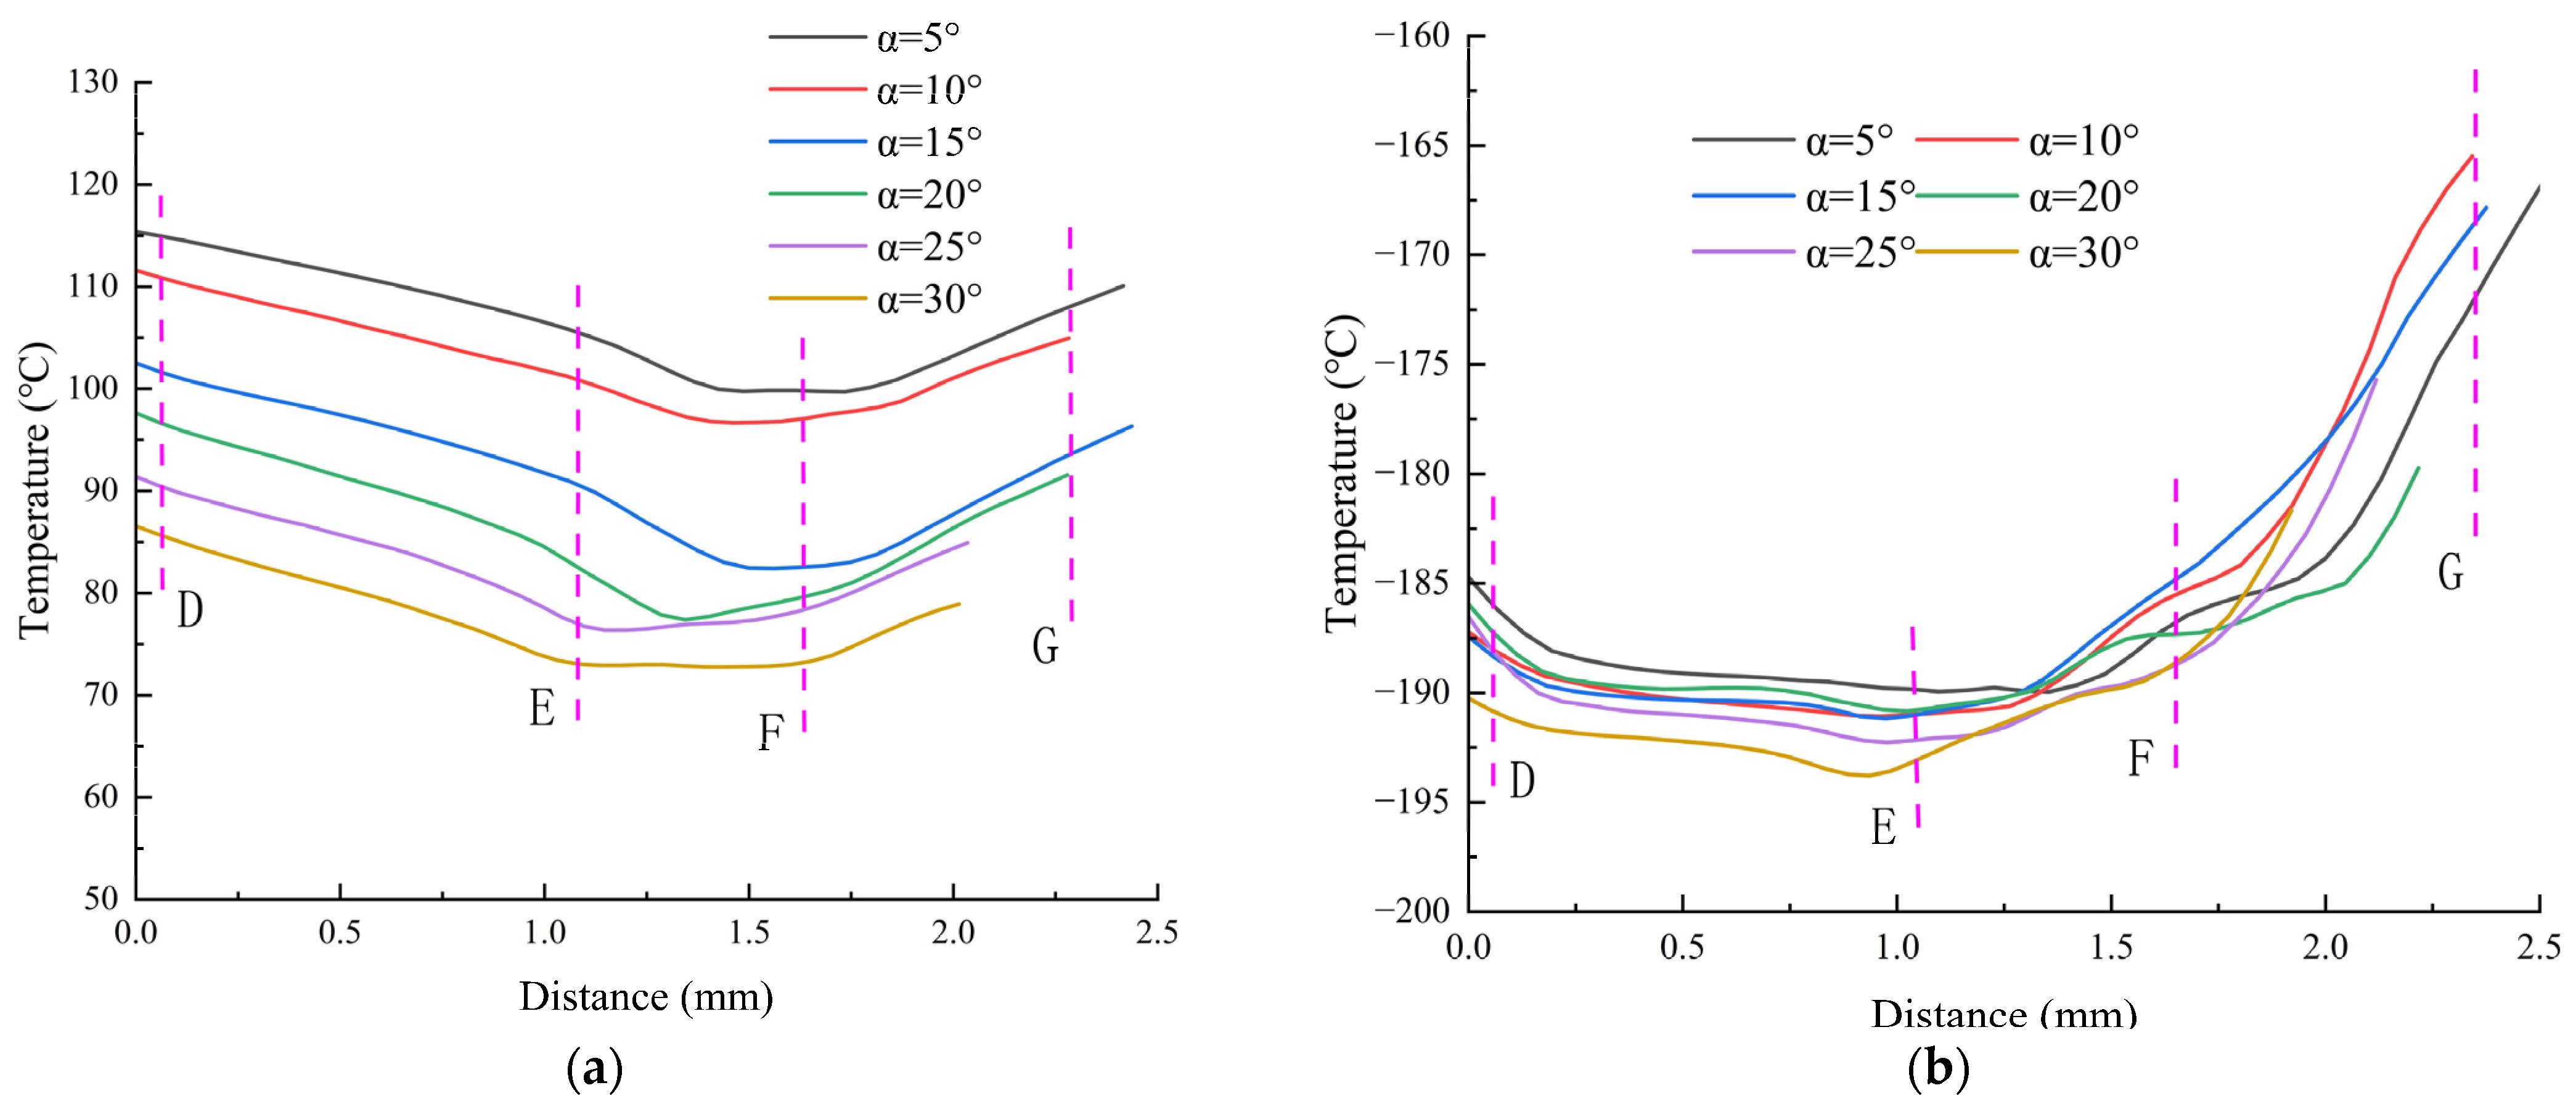
3.2.2. Temperature
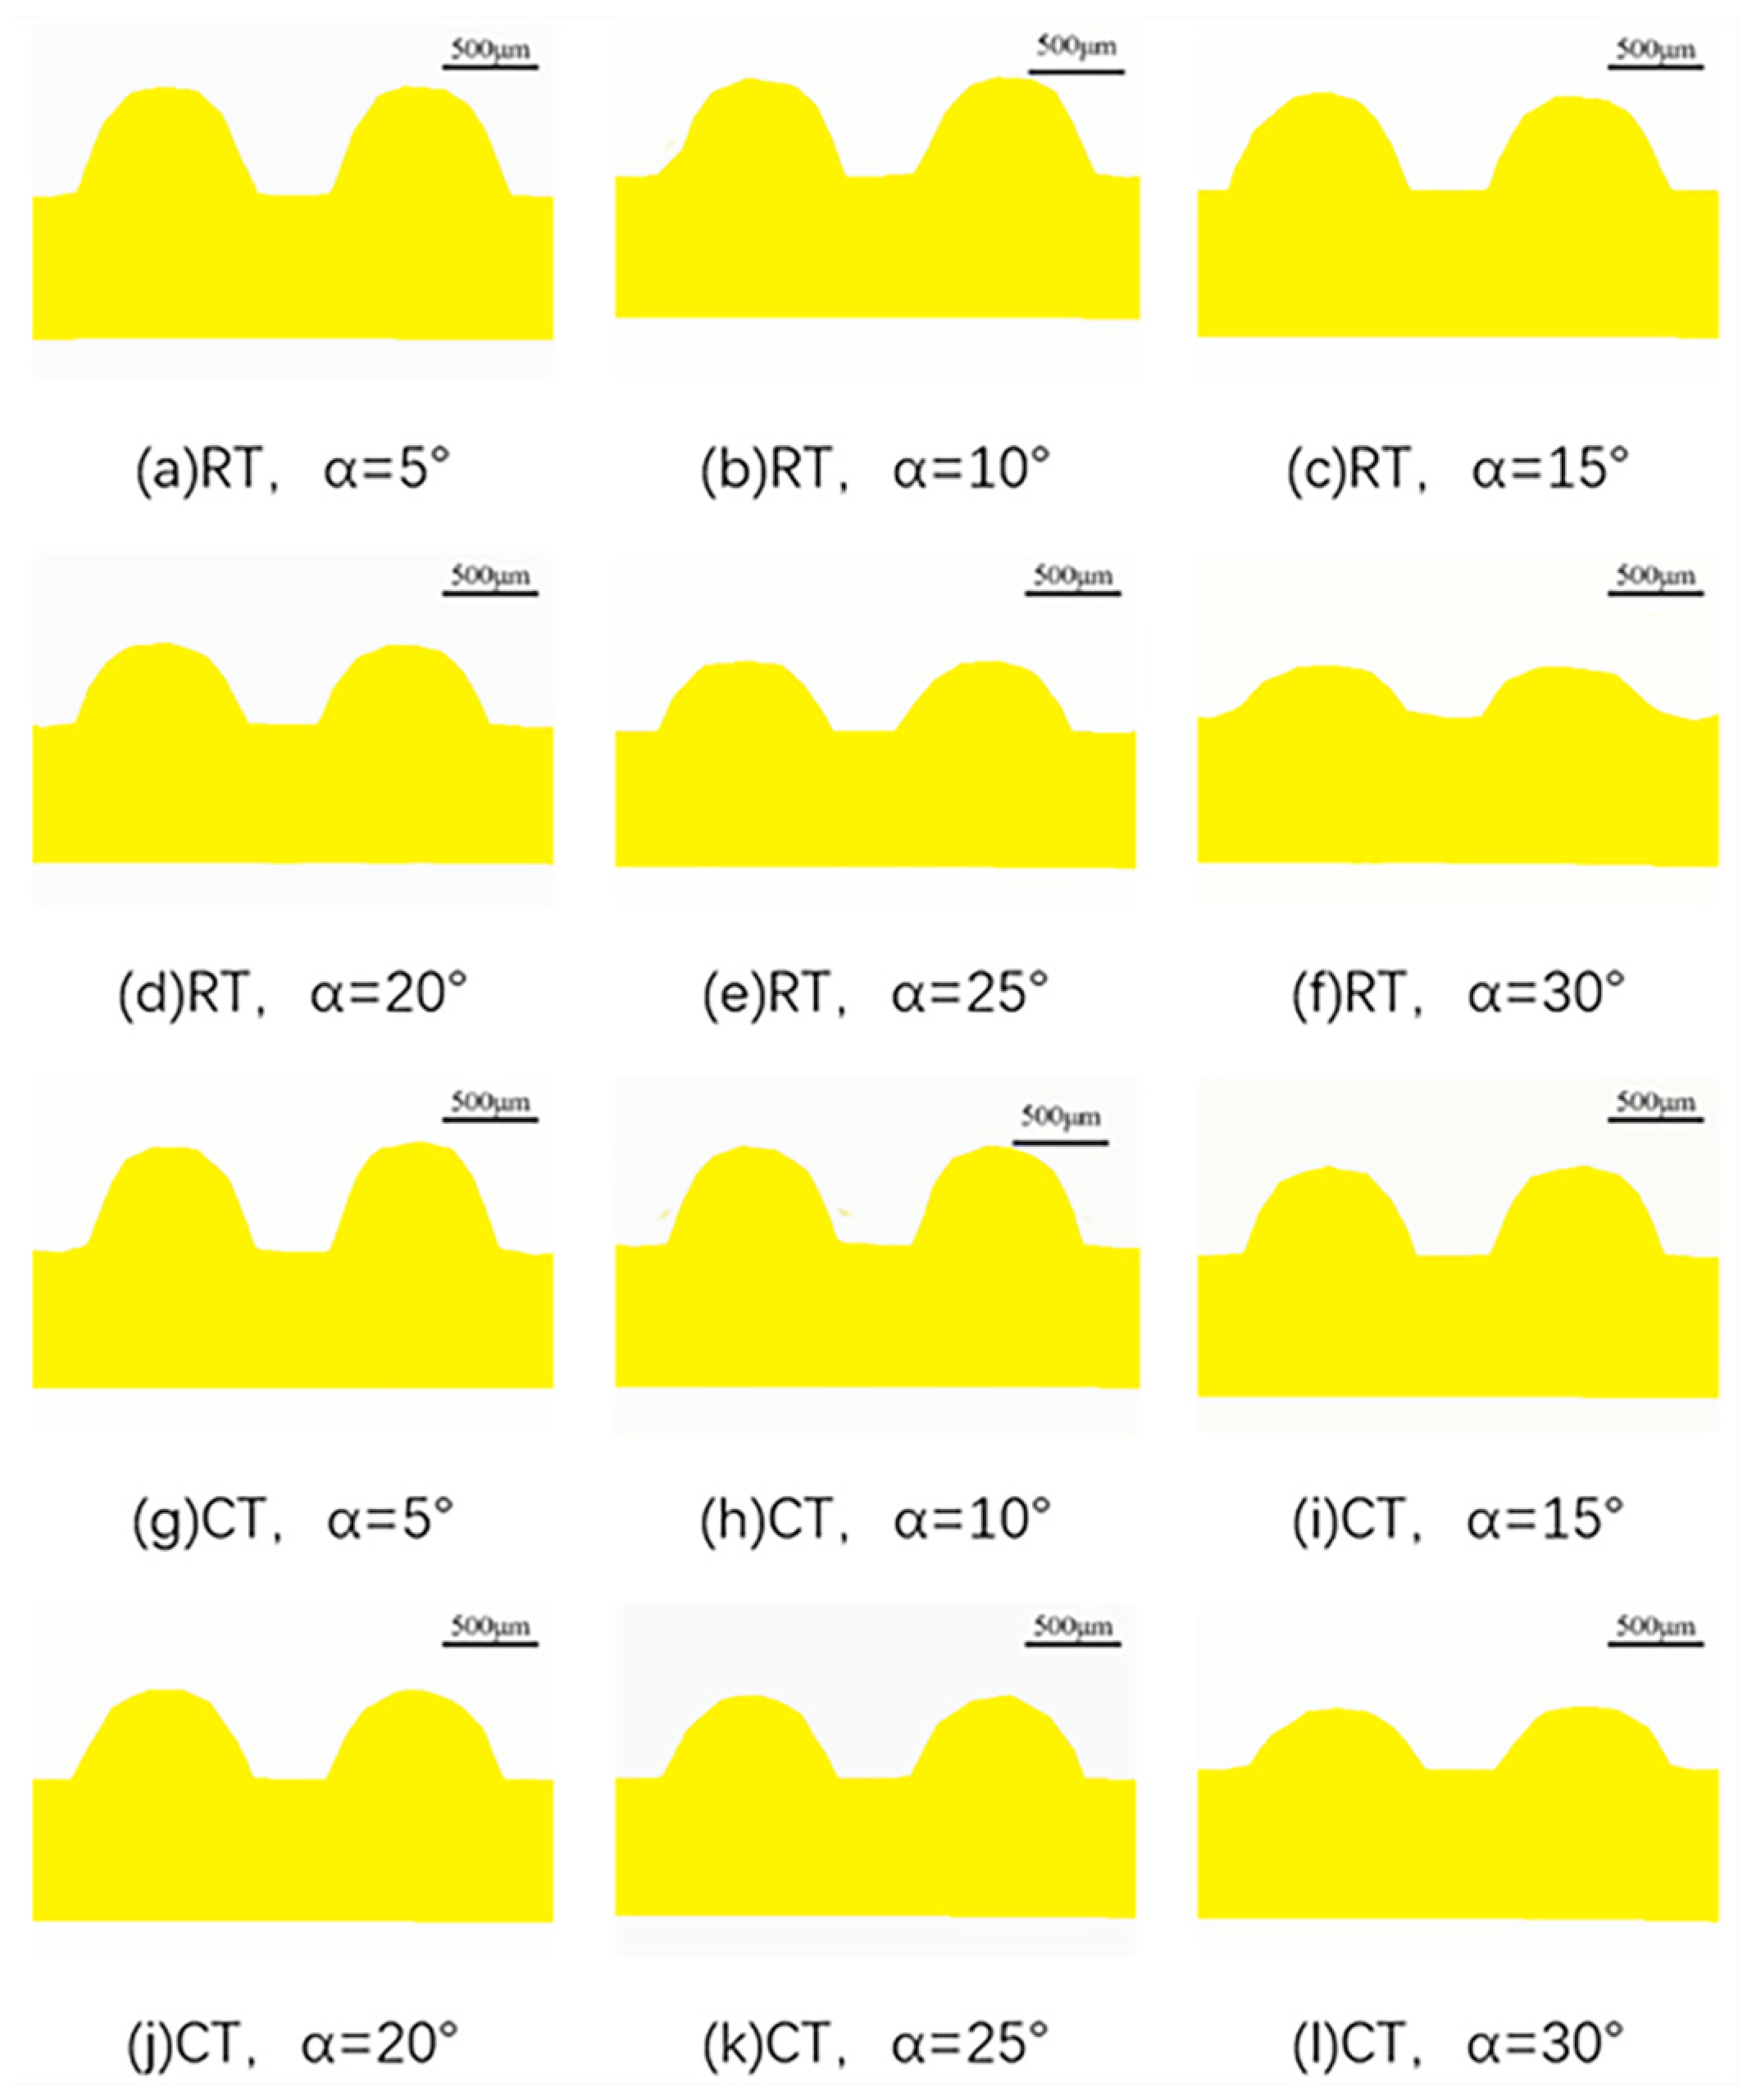
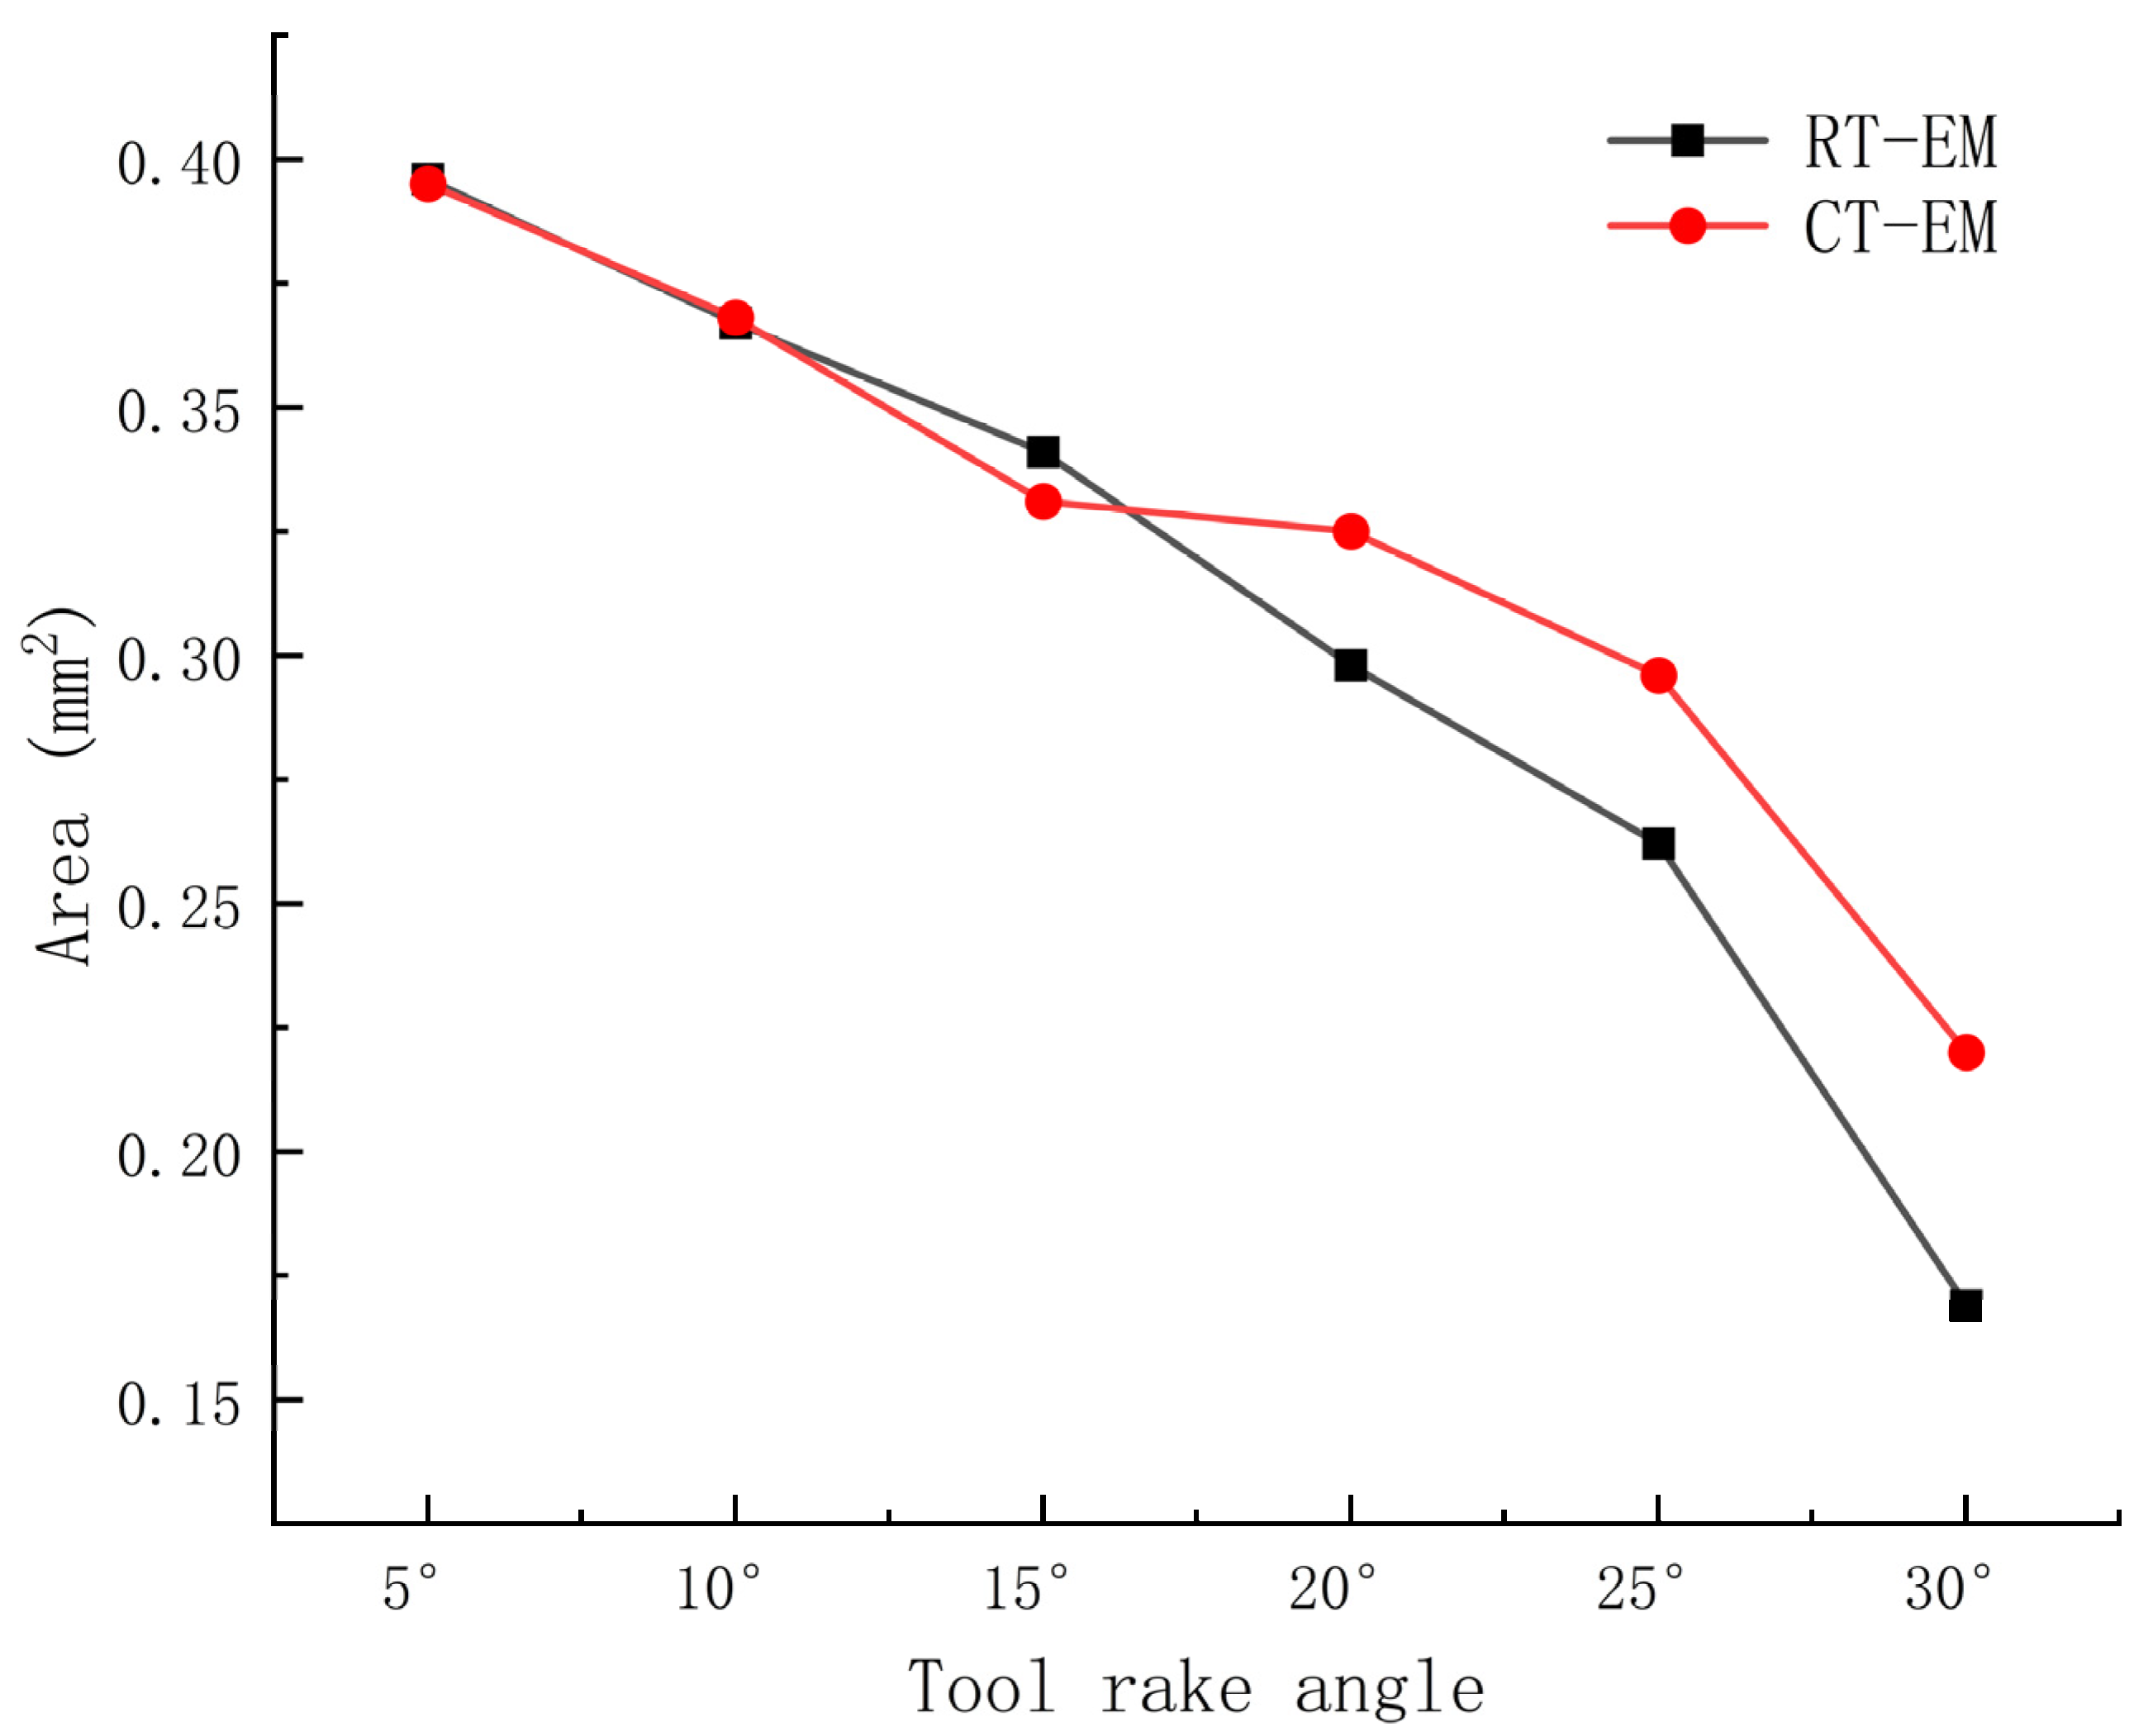
3.2.3. Formability
3.3. Influence of μ on Formability of Micro-Groove Fins
3.3.1. Effective Stress
3.3.2. Temperature
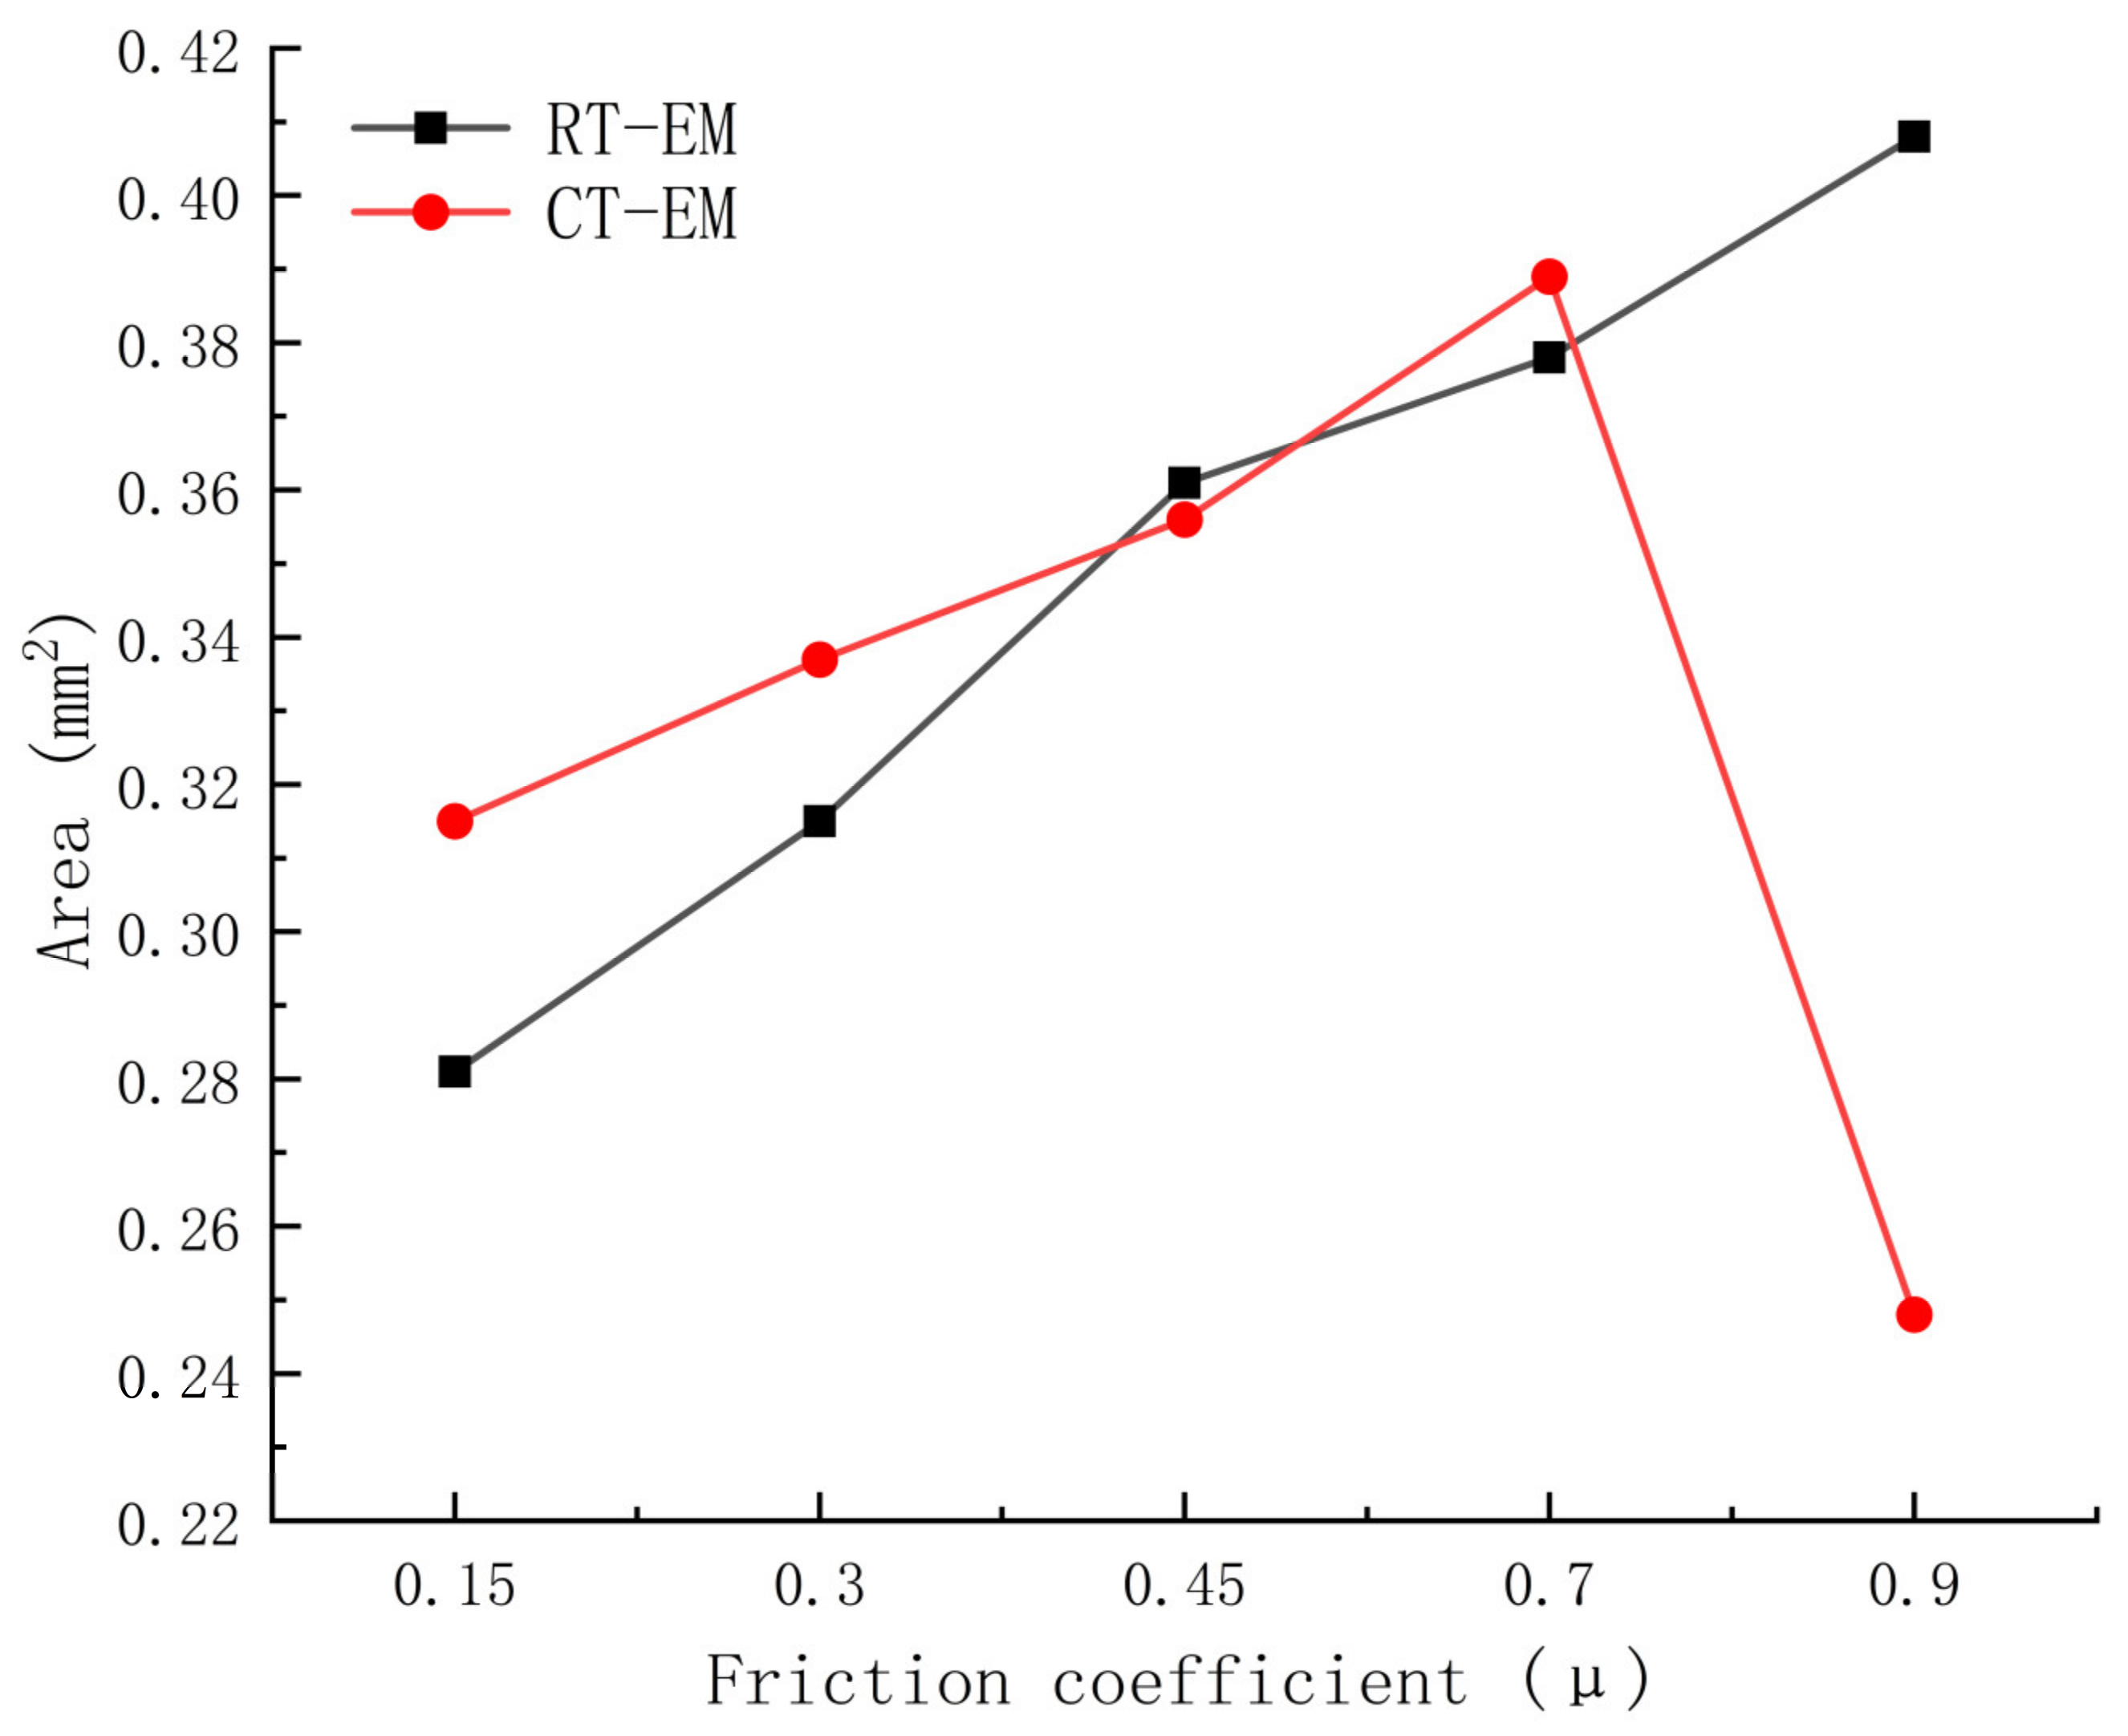
3.3.3. Formability
3.4. Influence of R on Formability of Micro-Groove Fins
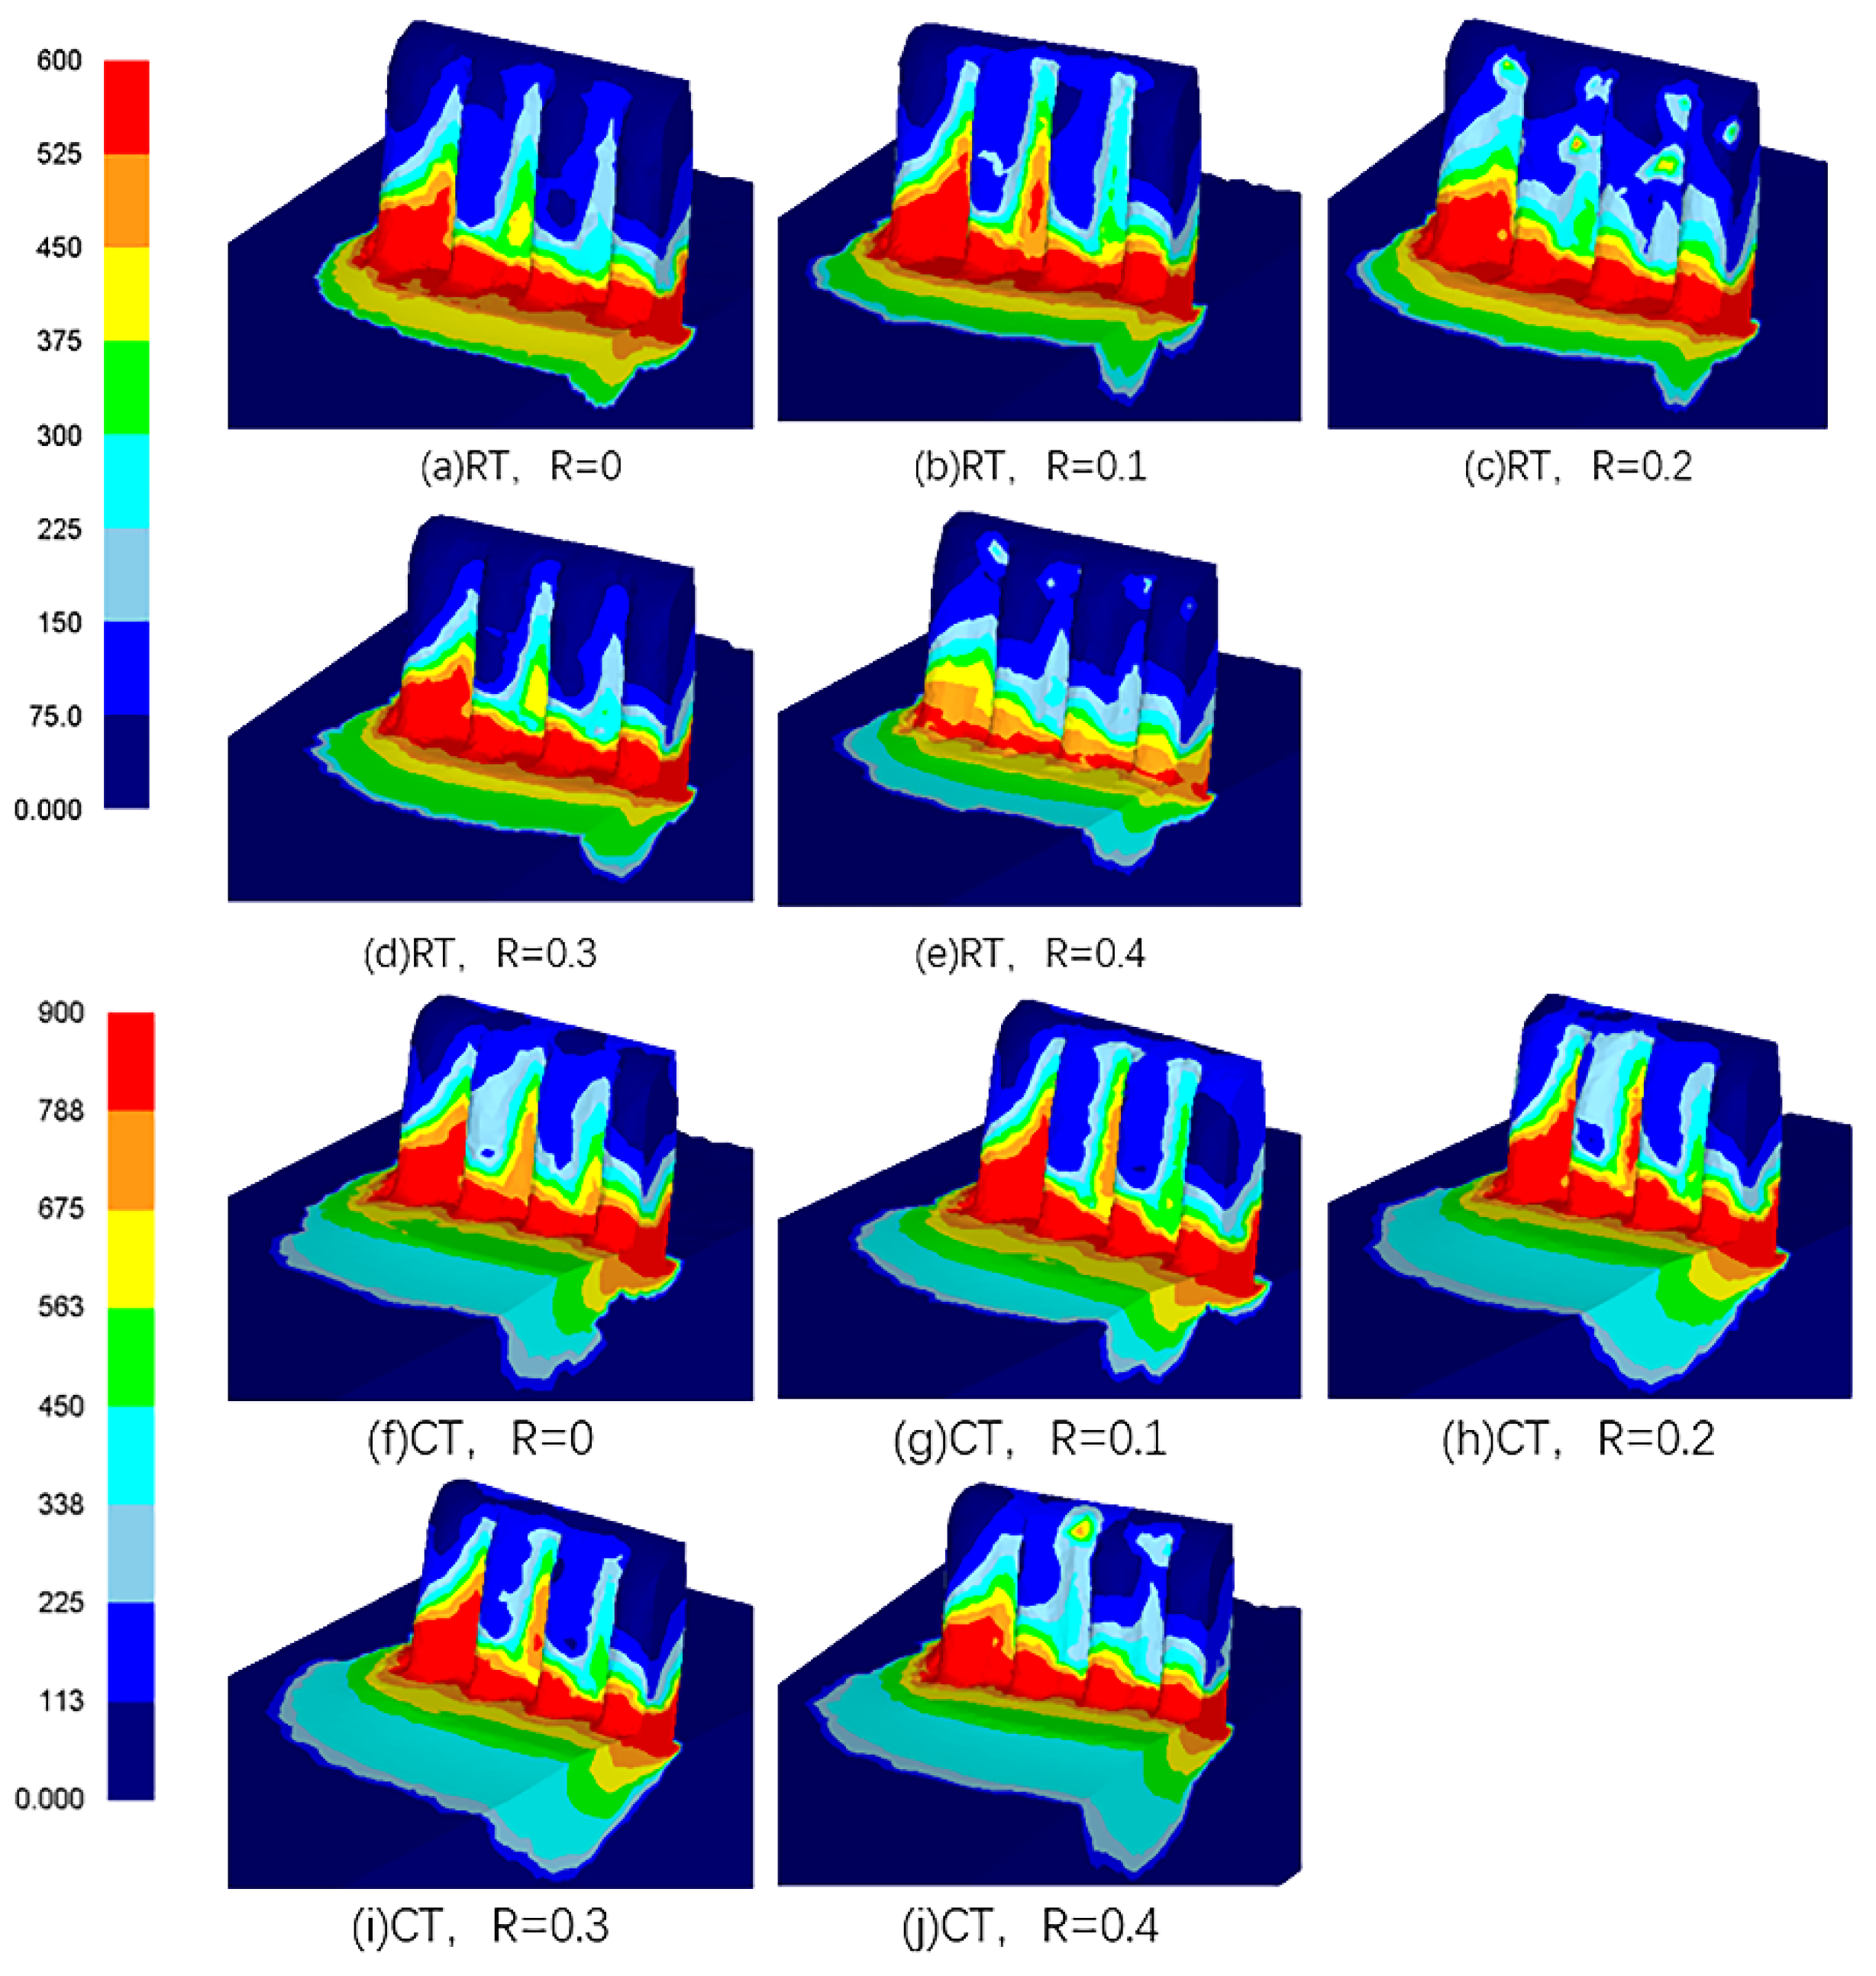
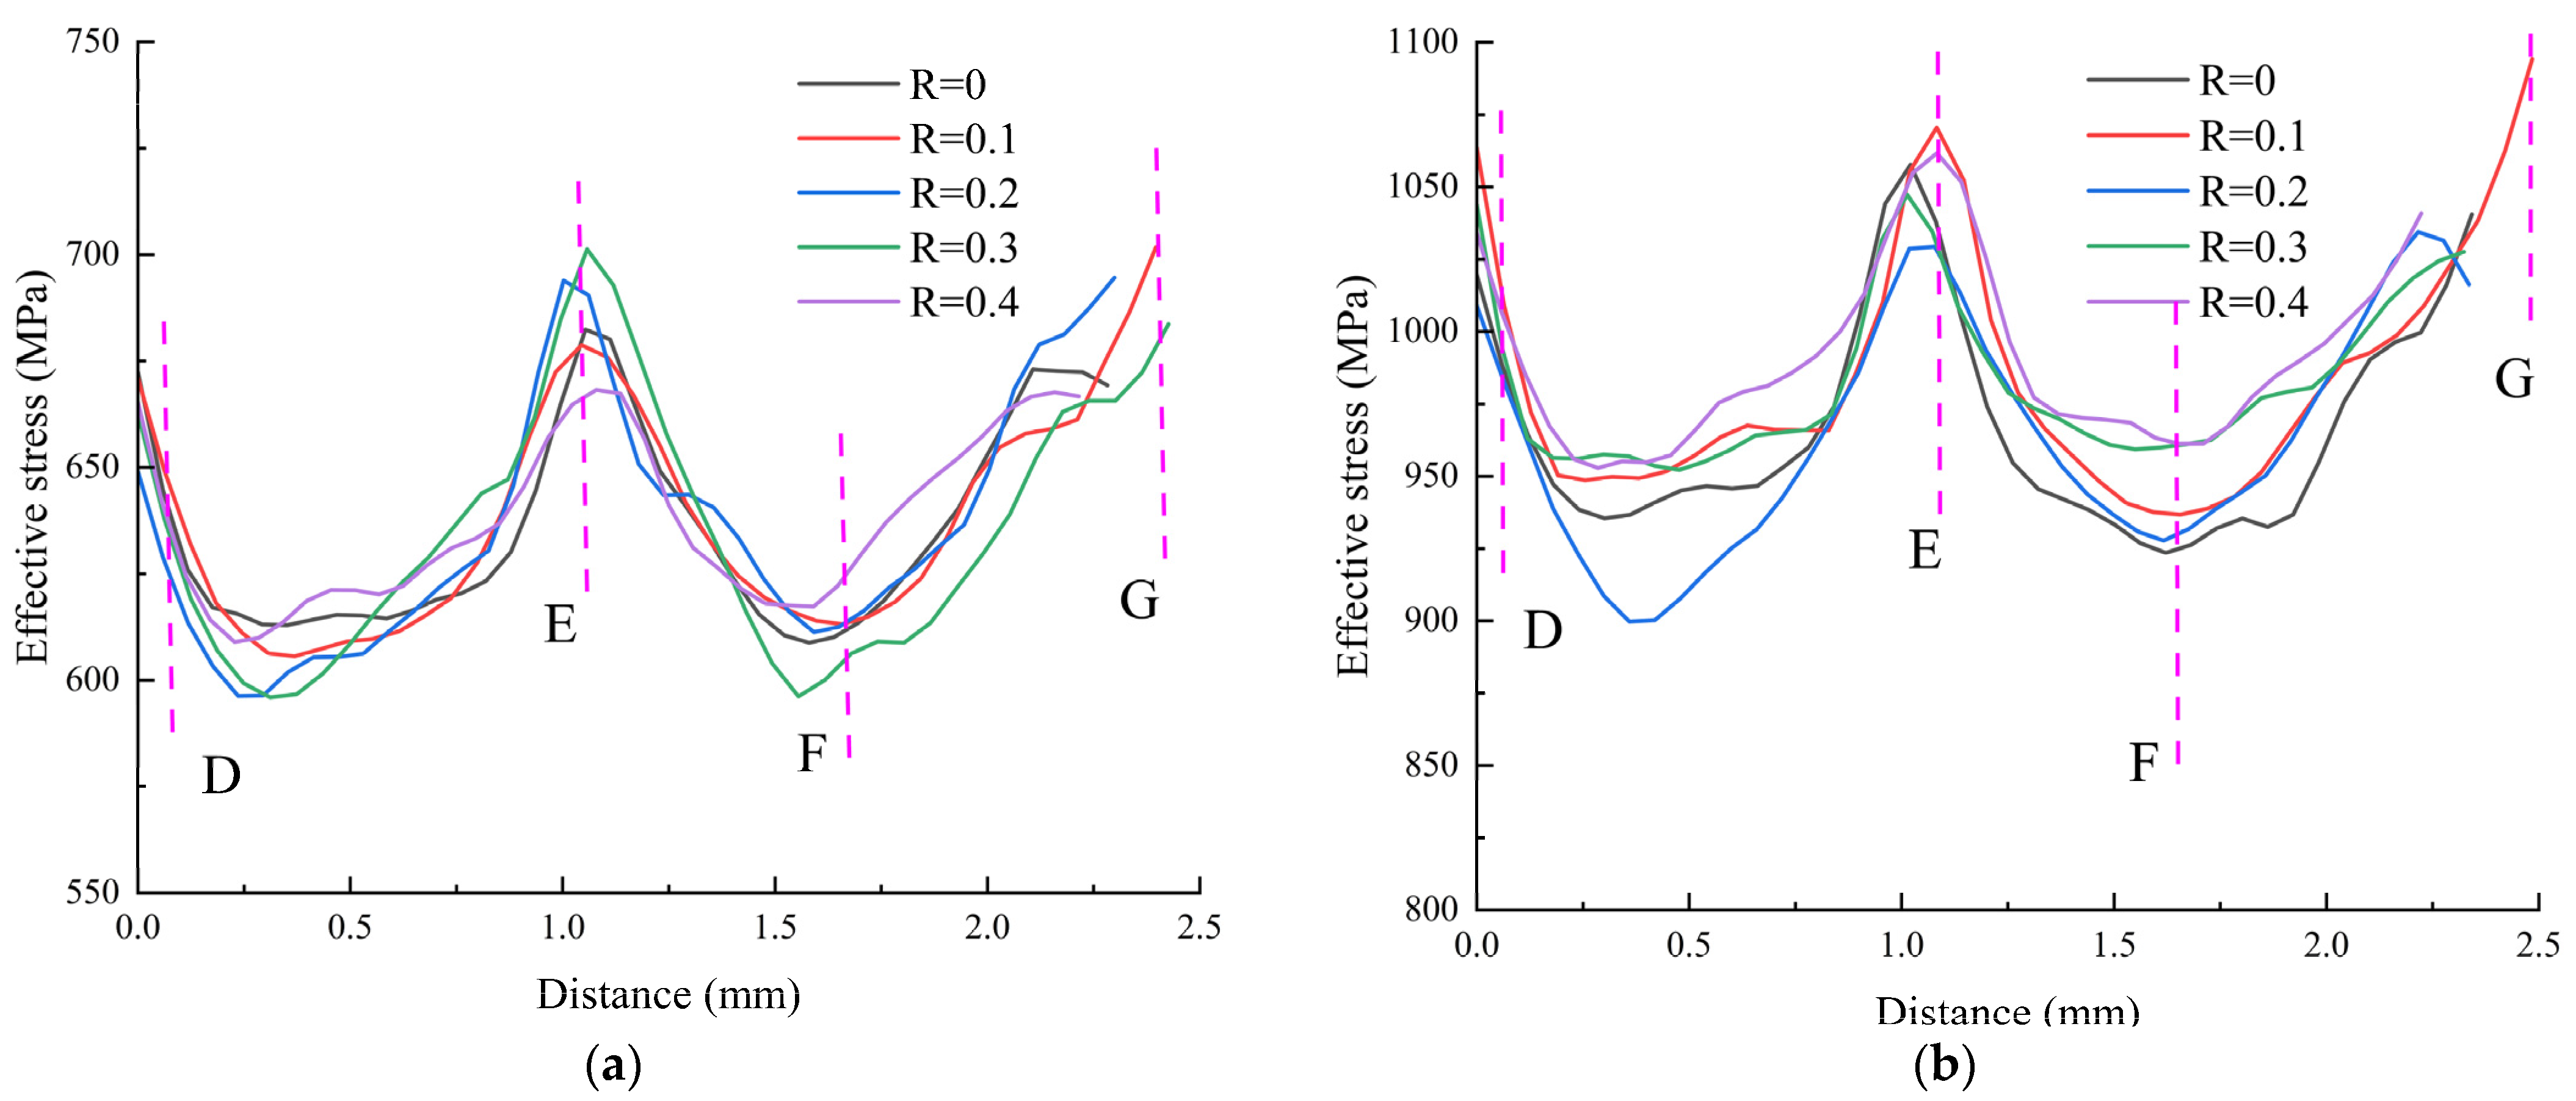
3.4.1. Effective Stress
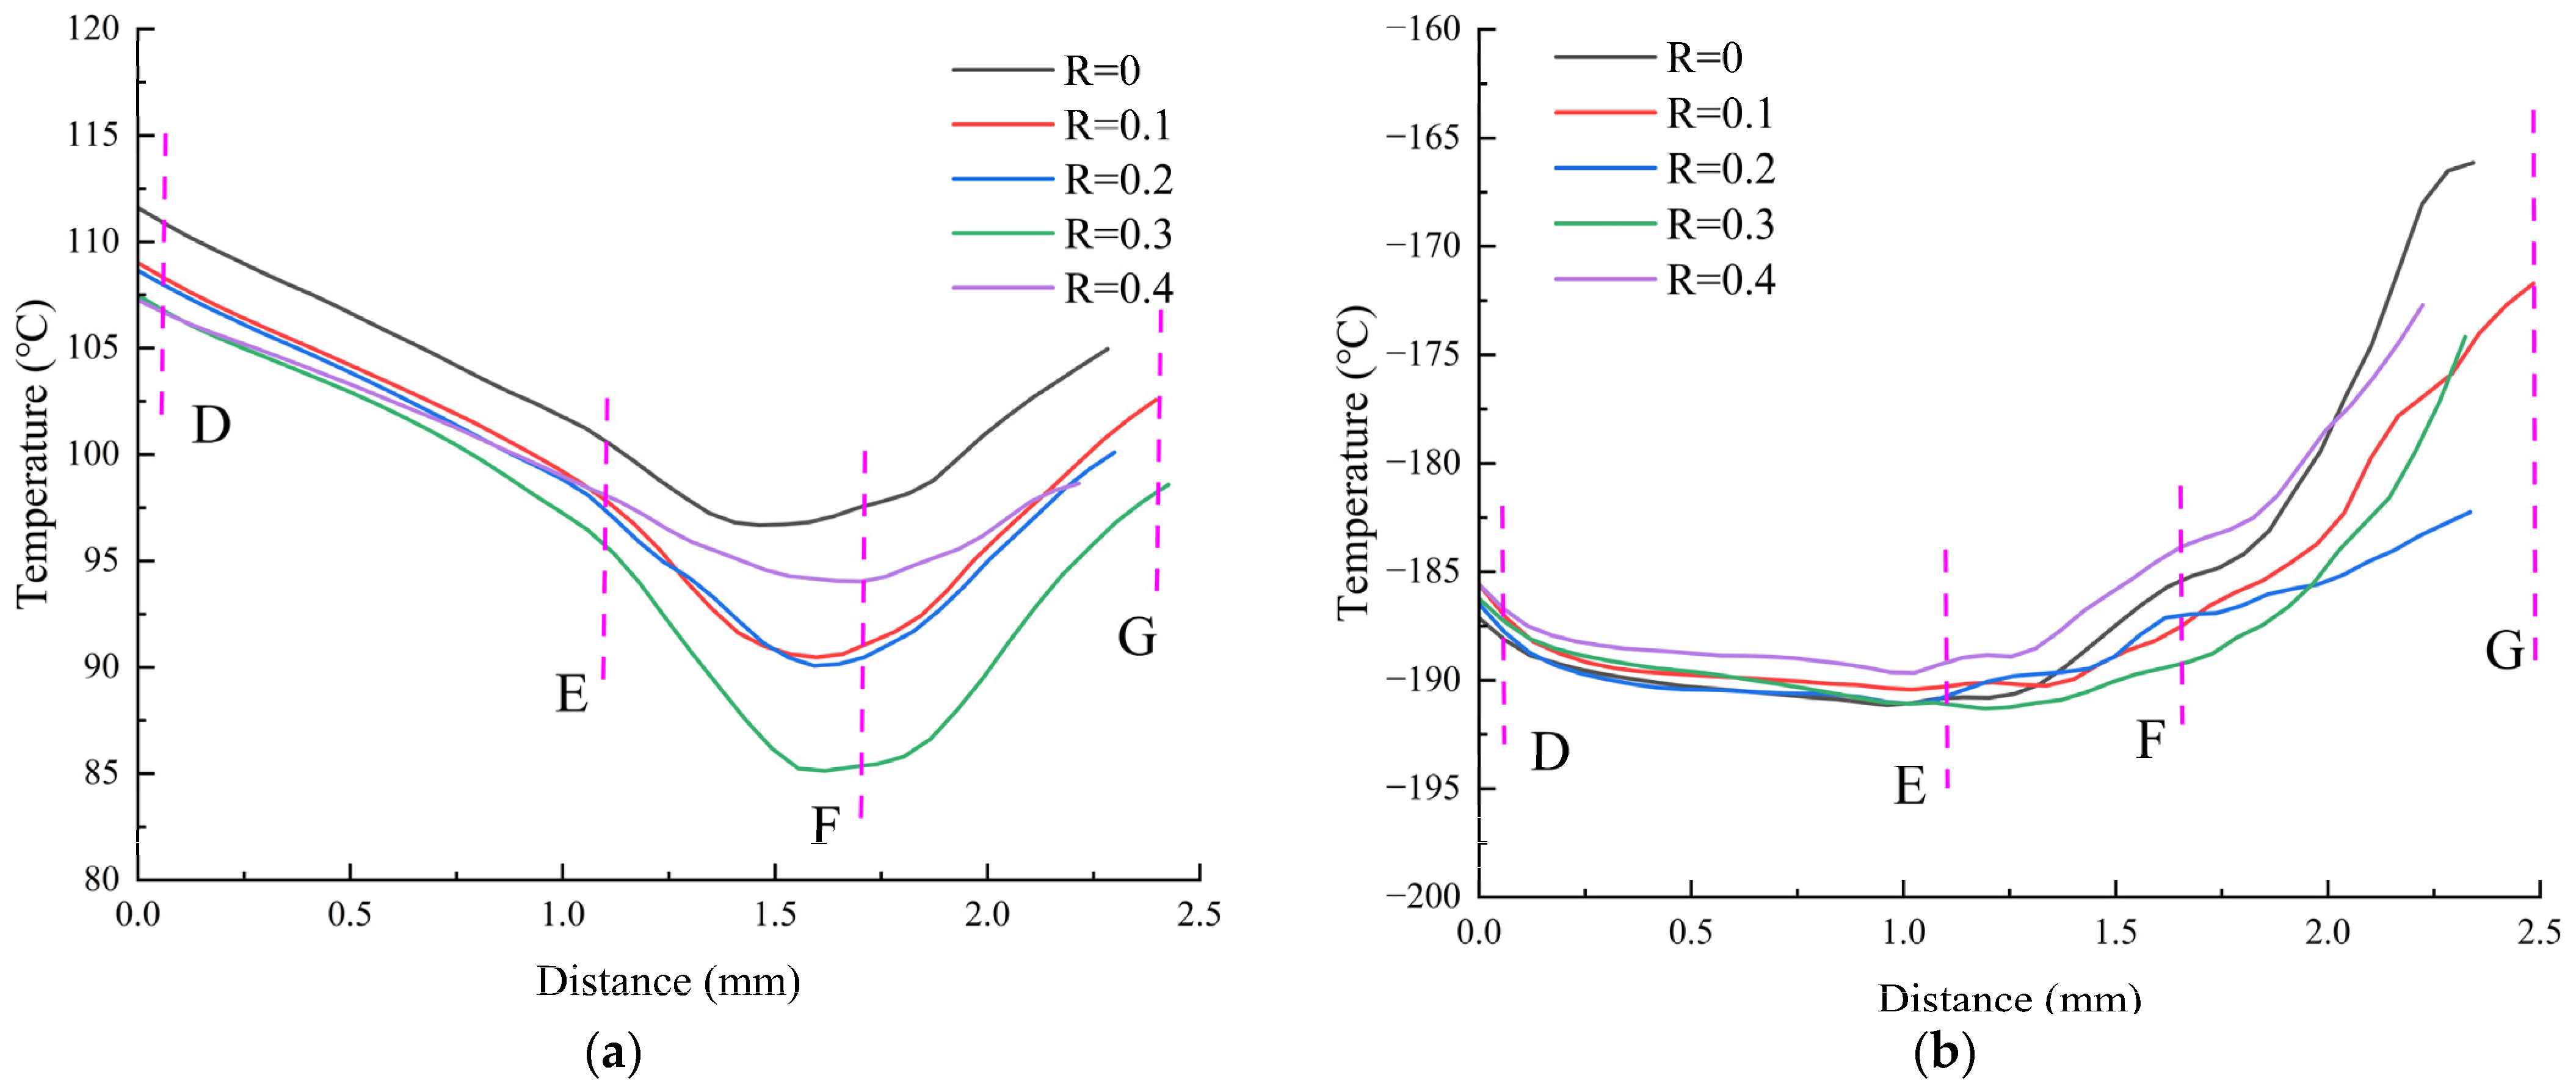
3.4.2. Temperature
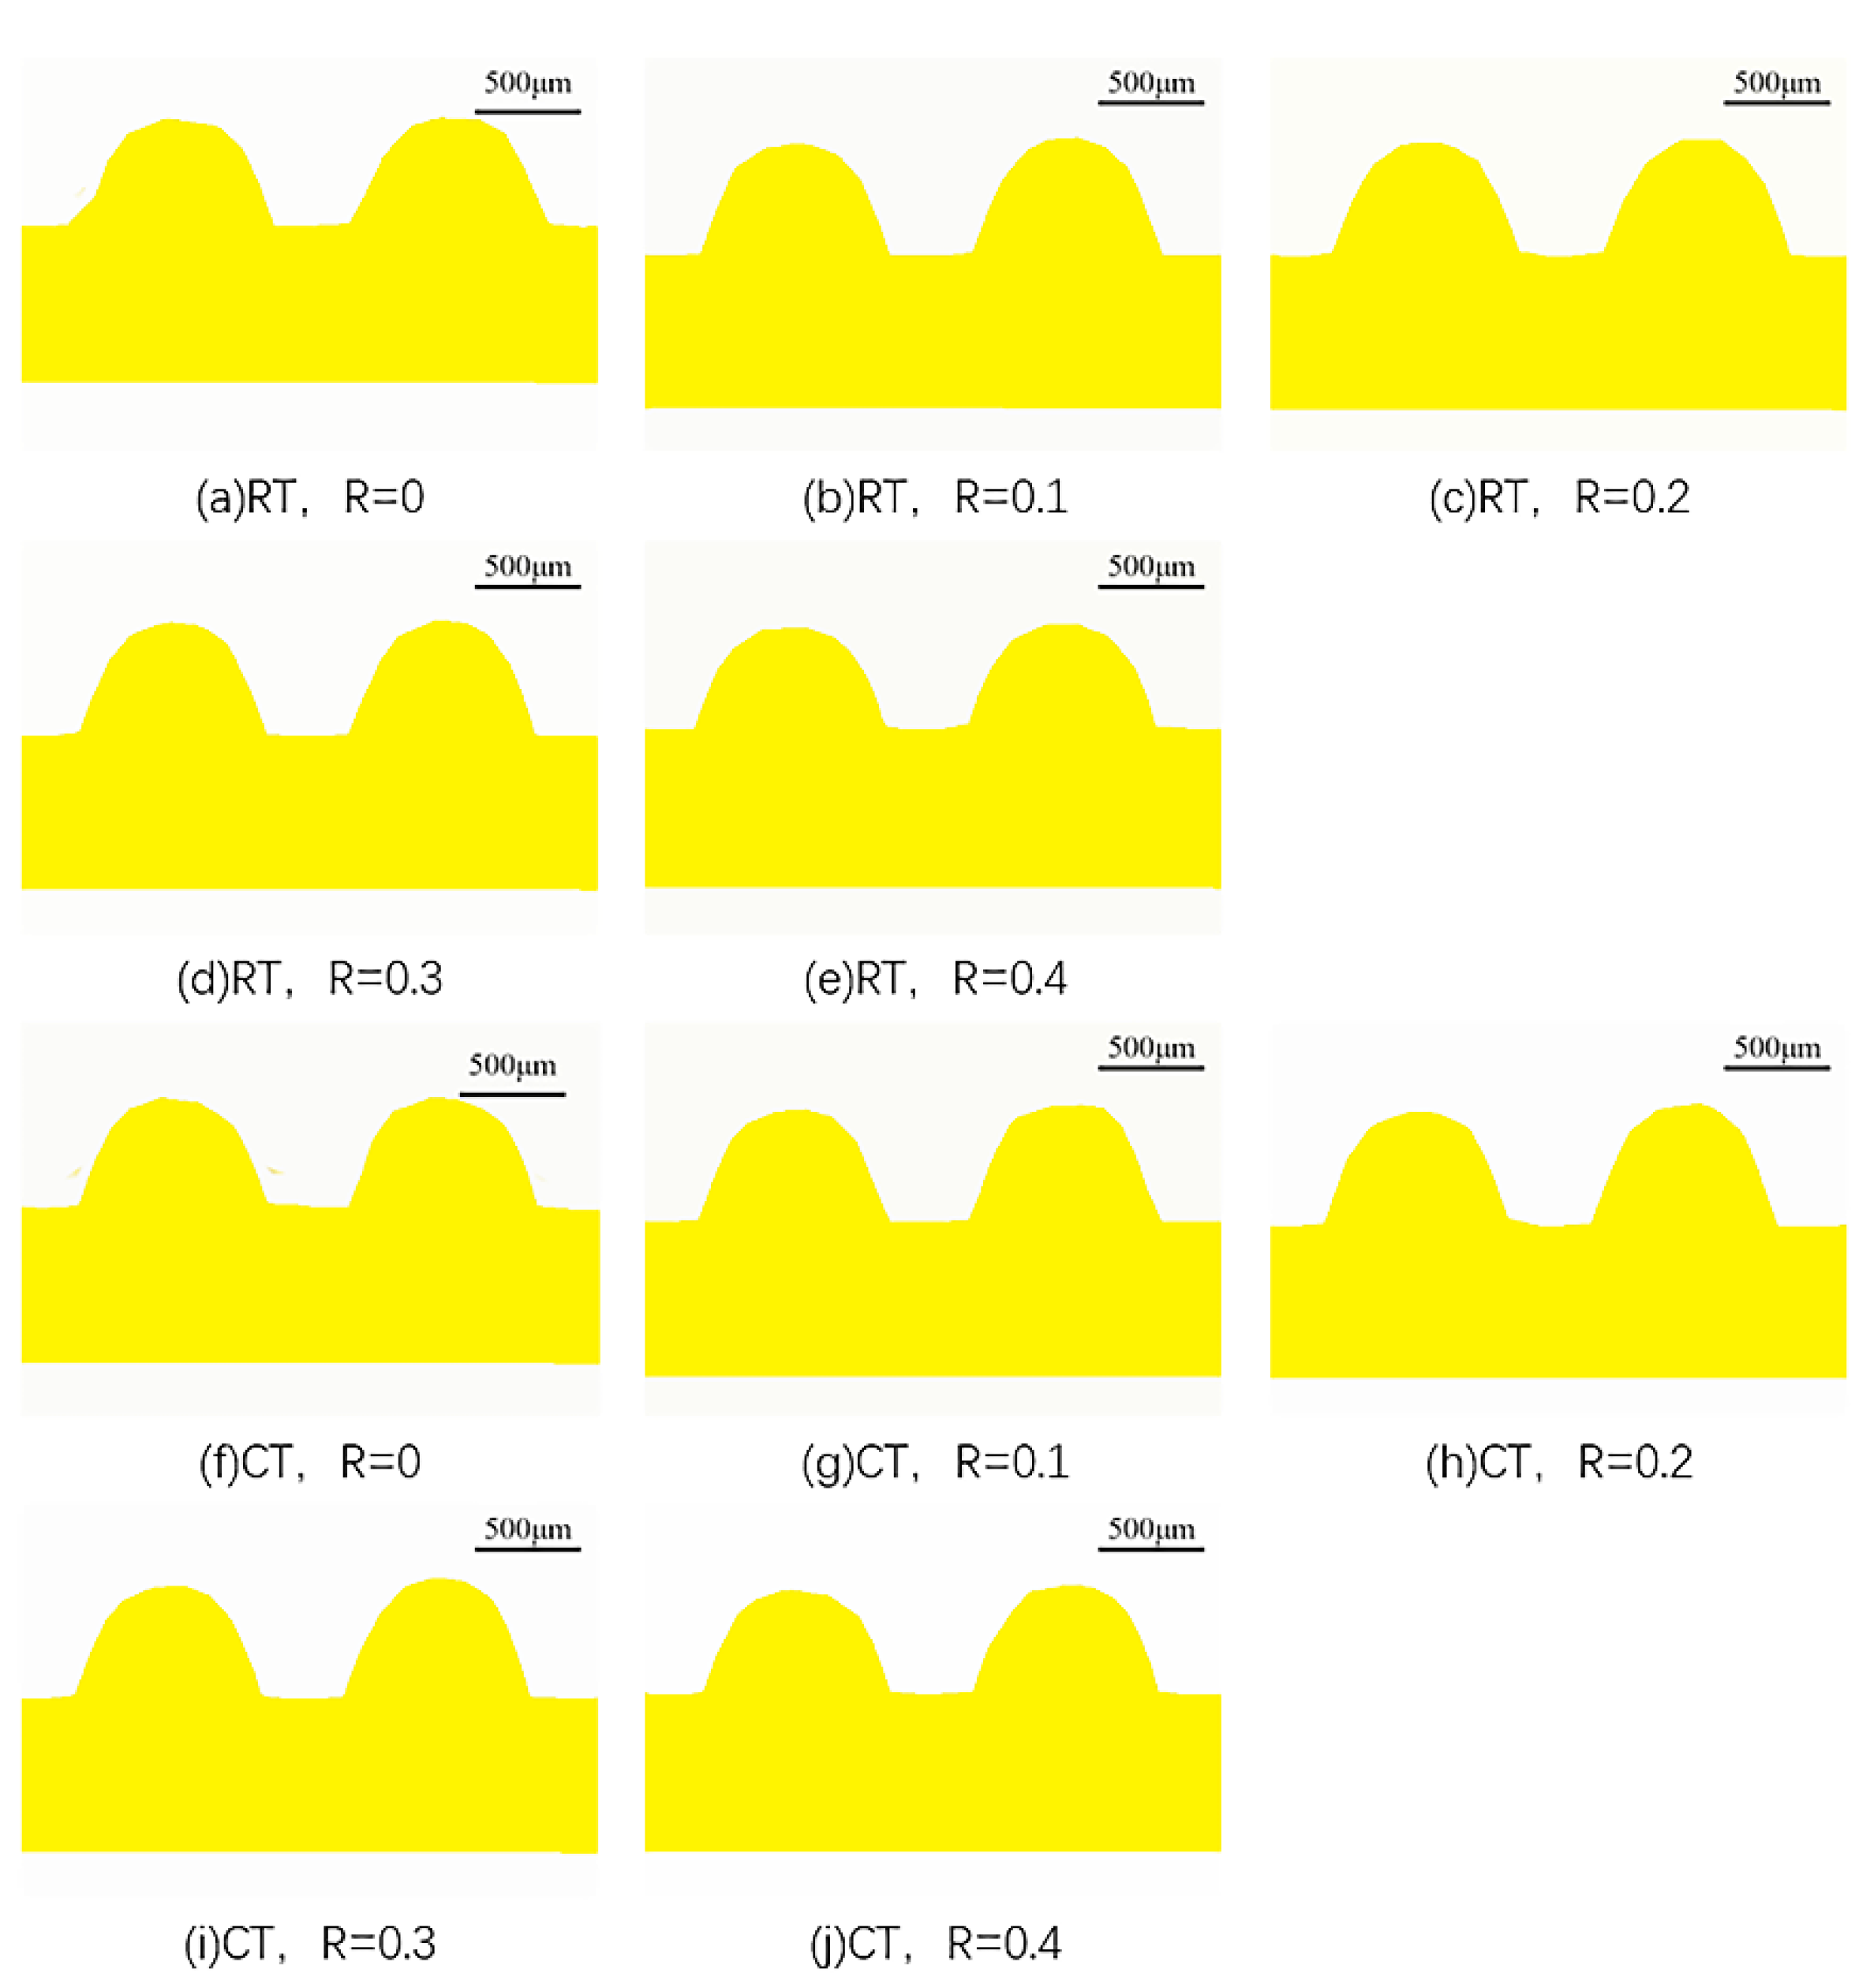
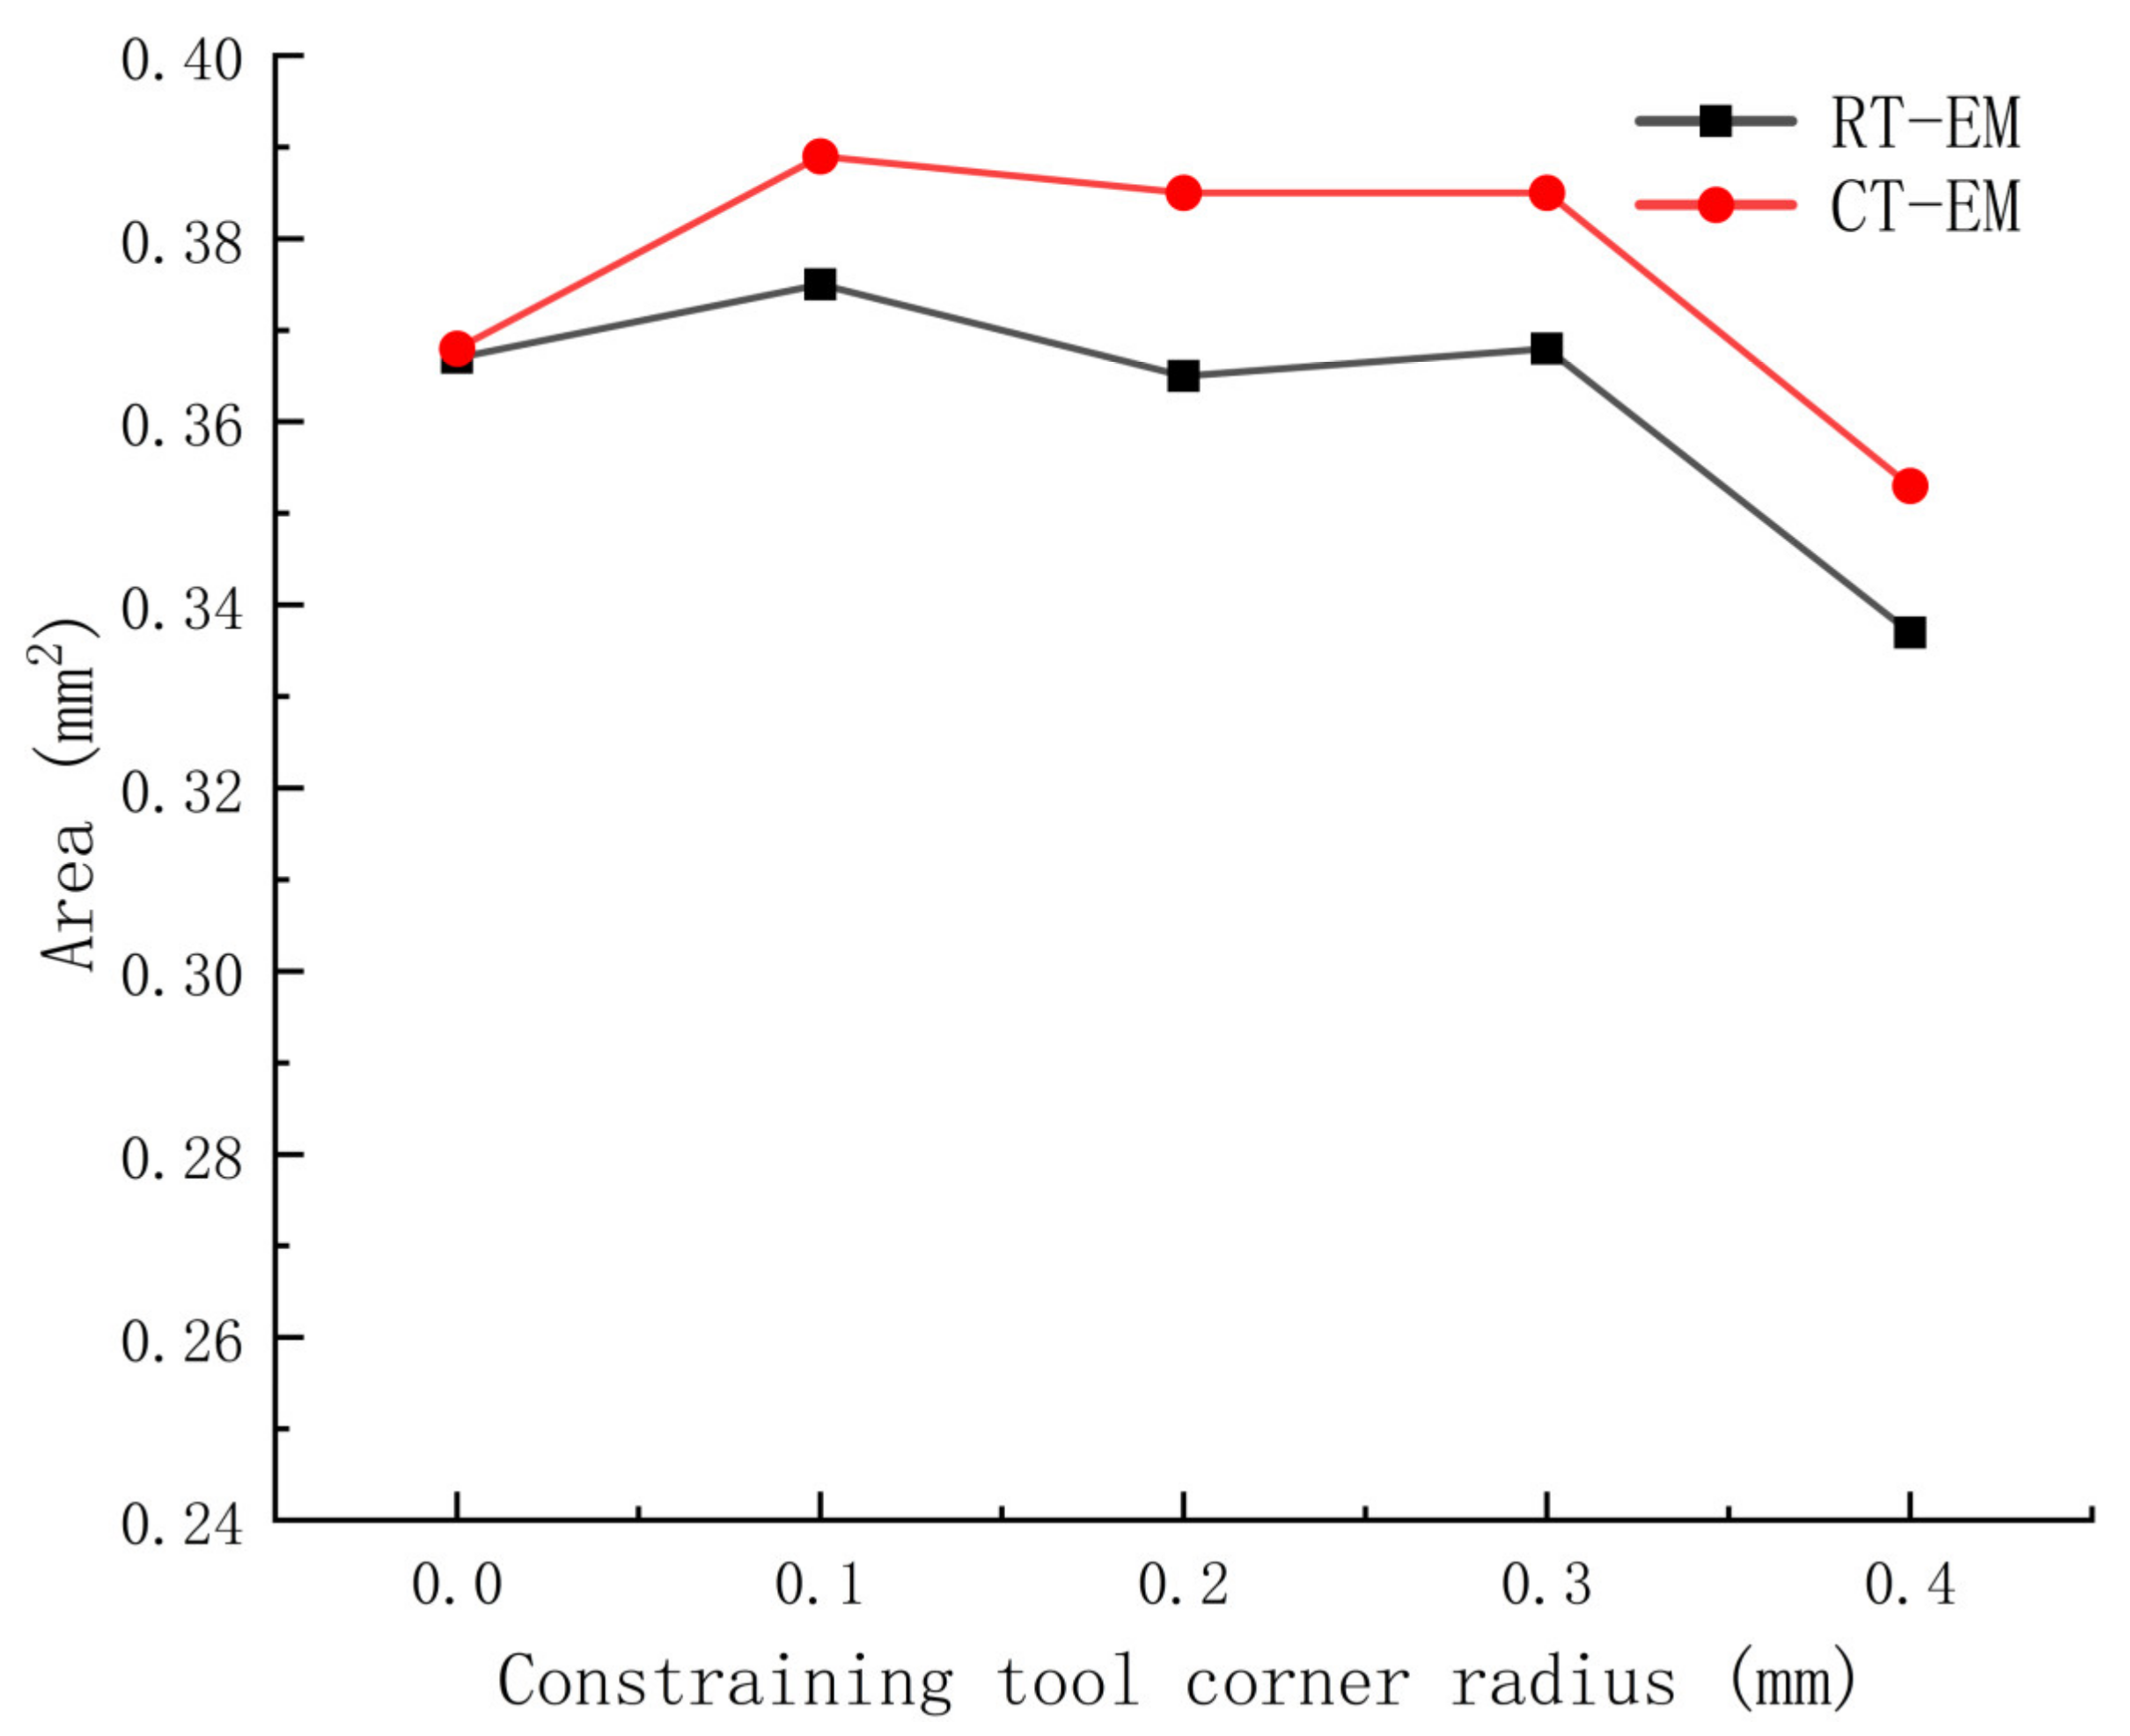
3.4.3. Formability
4. Conclusions
- (1)
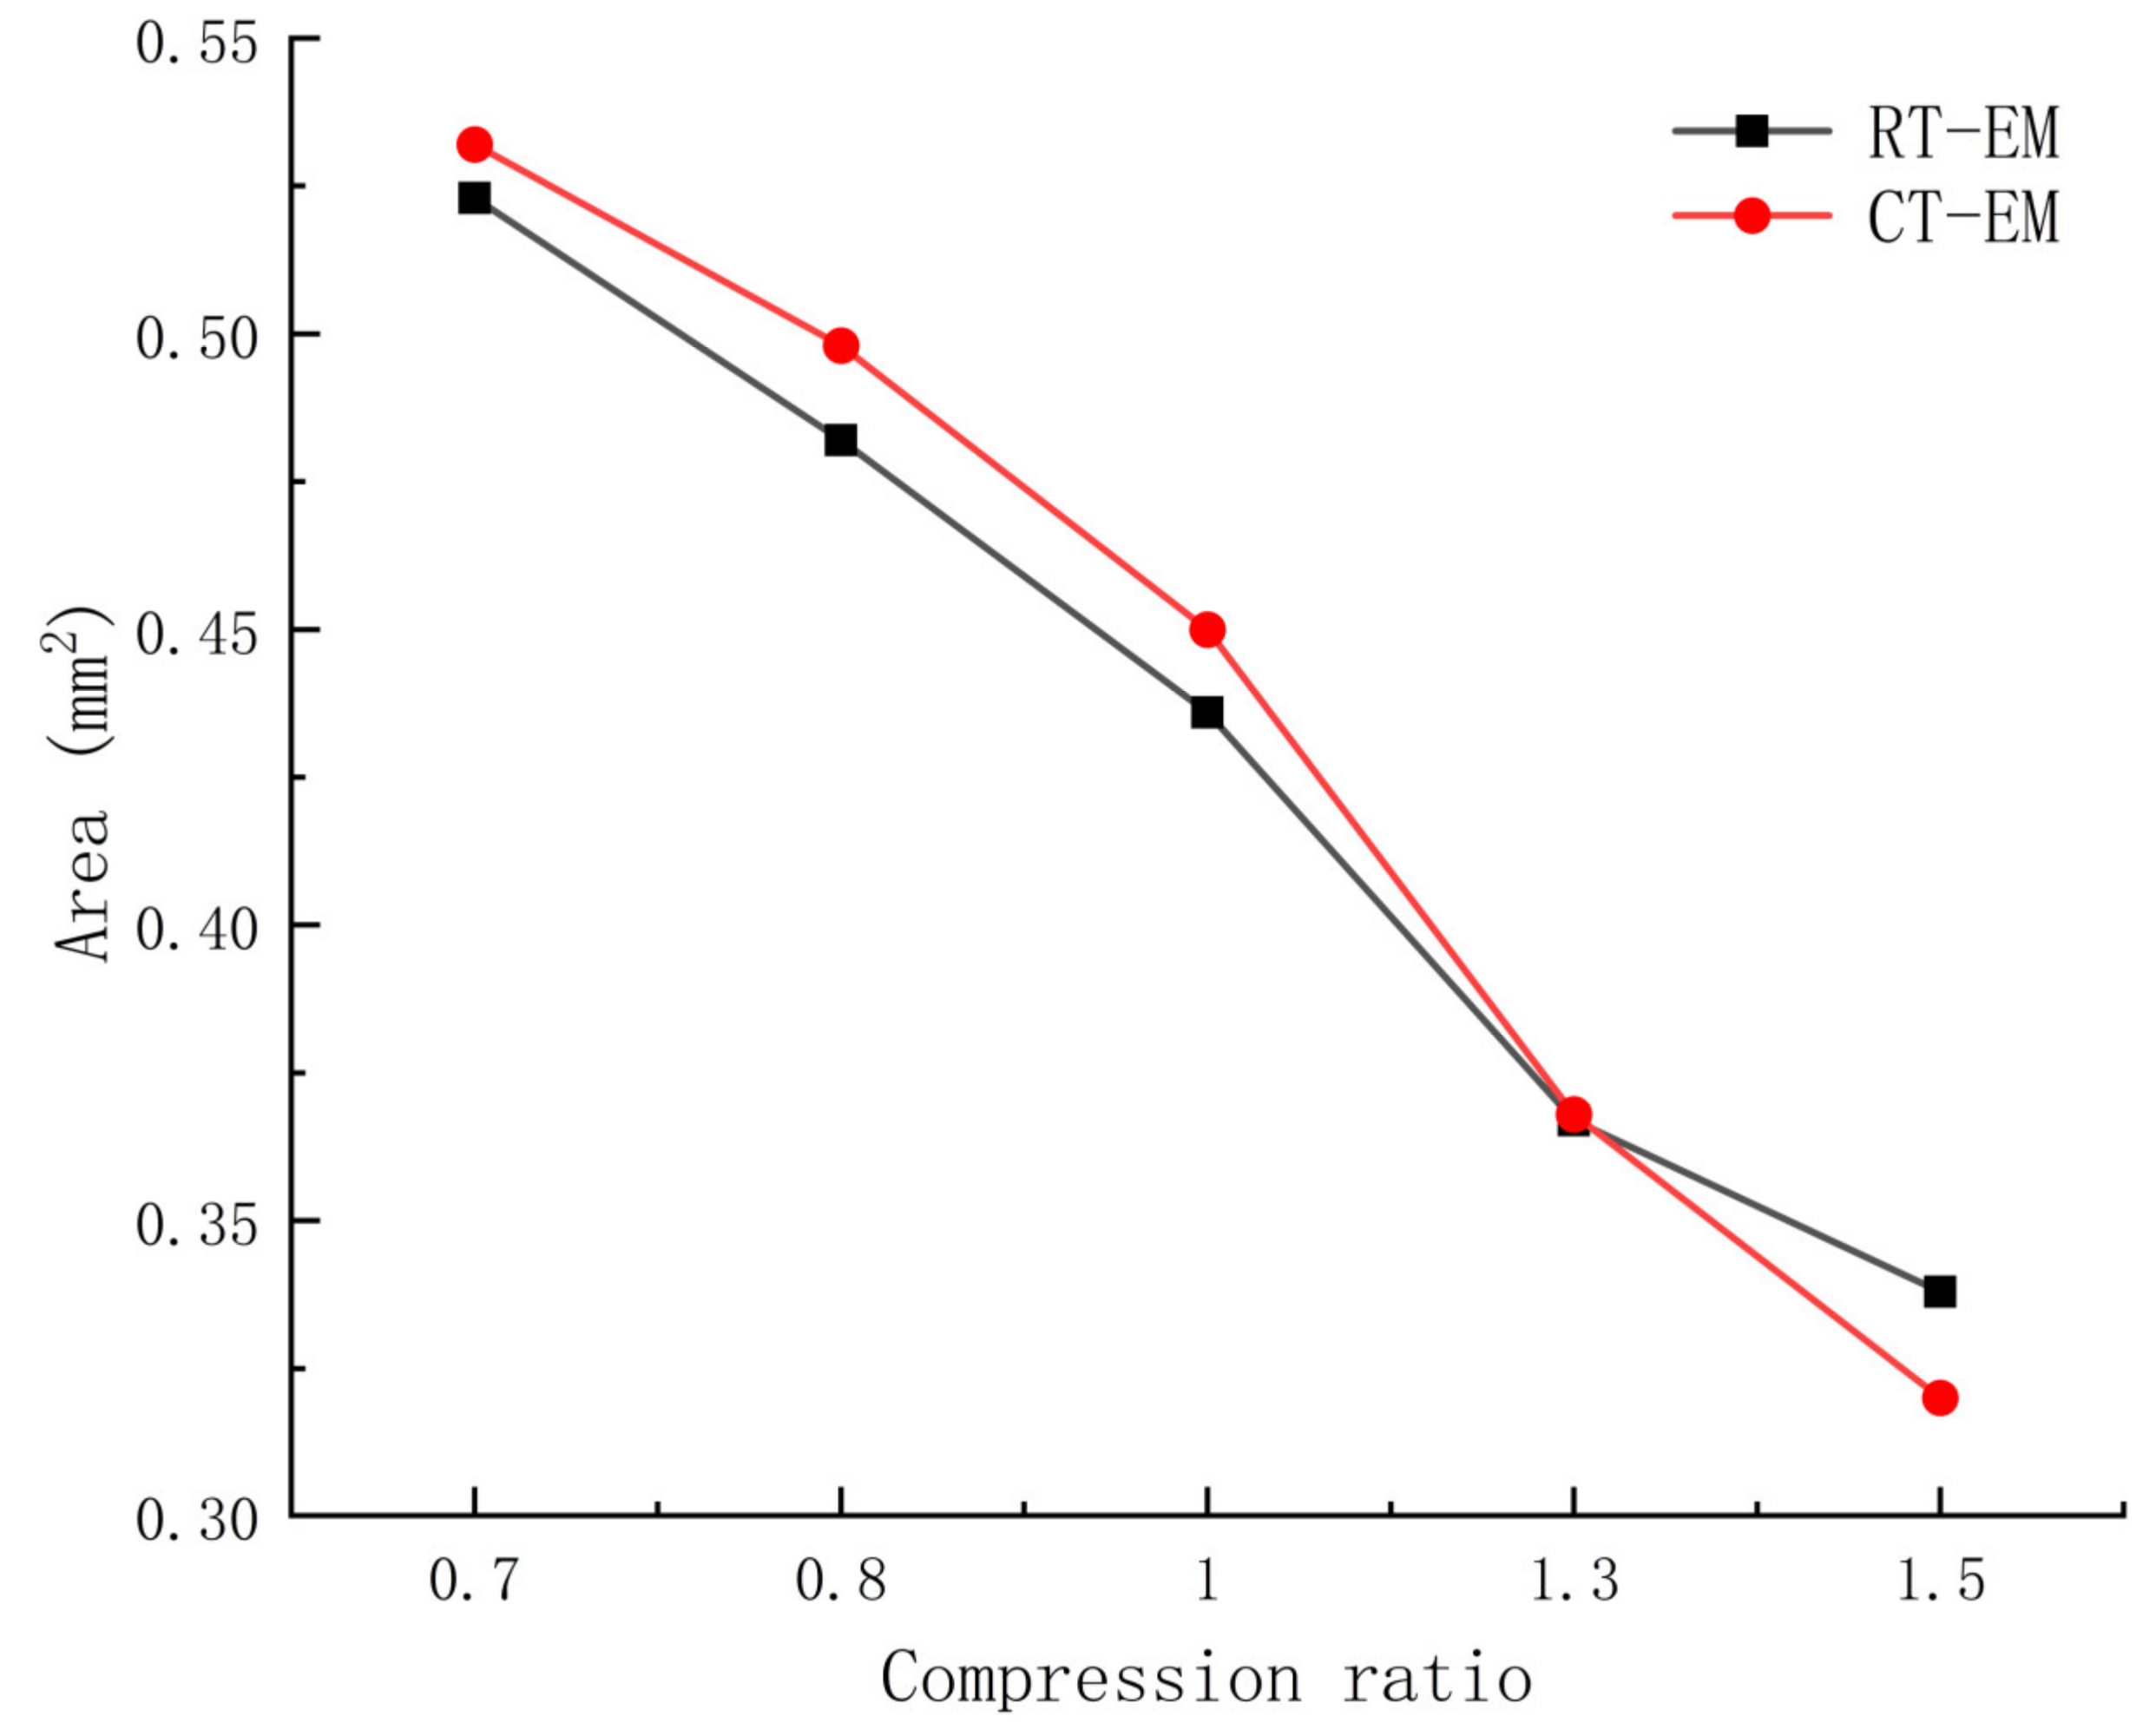
- CT can eliminate cutting heat and improve the processing performance of materials. Compared with RT-EM, CT-EM fins have a larger effective stress and cross-sectional area and better formability, which shows that CT-EM has more advantages than RT-EM in producing high-performance micro-groove fins.
- (2)
- With the decrease in λ and α, the effective stress, temperature and area of the fins gradually decrease. At a λ of 0.7, the cross-sectional area of CT-EM fins is the largest and the forming effect is the best. When the α is greater than 15°, the forming effect of CT-EM is better.
- (3)
- With the increase in μ, the maximum effective stress, temperature and area of CT-EM gradually increase, which is conducive to the formation of micro-groove fins. With the increase in R, the maximum effective stress and maximum temperature of CT-EM decrease slightly. At an R of 0.1 mm, the area of CT-EM is large, but the formability of fins under different R values is relatively close.
- (4)
- Reducing λ and α, or increasing μ, can improve the forming effect of the fins. CT-EM can produce the micro-groove fin with the best performance when λ = 0.7, α = 5°, μ = 0.75 and R = 0.1 mm.
Author Contributions
Funding
Informed Consent Statement
Data Availability Statement
Conflicts of Interest
References
- Surya, M.S. Optimization of turning parameters while turning Ti-6Al-4V titanium alloy for surface roughness and material removal rate using response surface methodology. Mater. Today Proc. 2022, 62, 3479–3484. [Google Scholar] [CrossRef]
- Wang, B.; Liu, Z. Influences of tool structure, tool material and tool wear on machined surface integrity during turning and milling of titanium and nickel alloys: A review. Int. J. Adv. Manuf. Technol. 2018, 98, 1925–1975. [Google Scholar] [CrossRef]
- Ononiwu, N.H.; Akinlabi, E.T.; Ozoegwu, C.G. Optimization techniques applied to machinability studies for turning aluminum metal matrix composites: A literature review. Mater. Today Proc. 2021, 44, 1124–1129. [Google Scholar] [CrossRef]
- Lu, X.; Miki, T.; Sasaki, Y.; Nagasaka, T. Thermodynamic criteria of alloying elements elimination during recycling end-of-life zinc-based products by remelting. Resour. Conserv. Recycl. 2022, 176, 105913. [Google Scholar] [CrossRef]
- Amini Mashhadi, H.; Moloodi, A.; Golestanipour, M.; Karimi, E.Z.V. Recycling of aluminum alloy turning scrap via cold pressing and melting with salt flux. J. Mater. Process. Tech. 2009, 209, 3138–3142. [Google Scholar] [CrossRef]
- Jäger, S.; Weber, S.; Röttger, A. Potential of the Recycling of Grinding Sludge by various Powder Metallurgical Processes. Procedia CIRP 2021, 104, 893–899. [Google Scholar] [CrossRef]
- Sherafat, Z.; Paydar, M.H.; Ebrahimi, R. Fabrication of Al7075/Al two phase material by recycling Al7075 alloy chips using powder metallurgy route. J. Alloys Compd. 2009, 487, 395–399. [Google Scholar] [CrossRef]
- Ab Rahim, S.; Lajis, M.; Ariffin, S. A Review on Recycling Aluminum Chips by Hot Extrusion Process. Procedia CIRP 2015, 26, 761–766. [Google Scholar] [CrossRef]
- Chiba, R.; Yoshimura, M. Solid-state recycling of aluminum alloy swarf into c-channel by hot extrusion. J. Manuf. Process. 2015, 17, 1–8. [Google Scholar] [CrossRef]
- Shahrom, M.S.; Yusoff, A.R. Cyclic extrusion compression back pressure technique for hot forging process in direct recycling of aluminum 6061 machining chip. J. Manuf. Process. 2017, 29, 1–9. [Google Scholar] [CrossRef]
- Peng, T.; Wang, Q.D.; Lin, J.B. Microstructure and mechanical properties of Mg–10Gd–2Y–0.5Zr alloy recycled by cyclic extrusion compression. Mater. Sci. Eng. A 2009, 516, 23–30. [Google Scholar] [CrossRef]
- Pei, Y.B.; Ma, H.J.; Yuan, M.; Teng, B.G. Solid-state recycling of Mg–Gd–Y–Zn–Zr alloy chips by isothermal sintering and equal channel angular pressing. J. Magnes. Alloys 2022, 8, 1154–1165. [Google Scholar] [CrossRef]
- Baysal, E.; Kocar, O.; Kocaman, E.; Köklü, U. An Overview of Deformation Path Shapes on Equal Channel Angular Pressing. Metals 2022, 12, 1800. [Google Scholar] [CrossRef]
- Abd El Aal, M.I. Wear and mechanical properties of Al chips and Al chips composites recycled by high-pressure torsion. J. Mater. Res. Technol. 2021, 14, 407–427. [Google Scholar] [CrossRef]
- Topolski, K. Relationship of microstructure and properties of high-purity titanium manufactured by unconventional method of chips recycling. J. Manuf. Process. 2022, 77, 426–438. [Google Scholar] [CrossRef]
- Yin, X.; Chen, H.; Deng, W. Effects of Machining Velocity on Ultra-Fine Grained Al 7075 Alloy Produced by Cryogenic Temperature Large Strain Extrusion Machining. Materials 2019, 12, 1656. [Google Scholar] [CrossRef]
- Bertolini, R.; Bruschi, S.; Ghiotti, A.; Pezzato, L.; Dabalà, M. Large strain extrusion machining of magnesium alloys for biomedical applications. Procedia CIRP 2018, 71, 105–110. [Google Scholar] [CrossRef]
- Wan, Z.P.; Yan, H.; Tang, Y. Forming mechanism of integral serrated high fins by plowing-extruding based on variational feed. Trans. Nonferrous Met. Soc. China 2010, 20, 400–404. [Google Scholar] [CrossRef]
- Zhang, J.Y.; Pang, X.Q.; Chen, H.T. Process and forming performance of ploughing extrusion cutting for recycling of metal chips. J. Mater. Process. Technol. 2019, 274, 116283. [Google Scholar] [CrossRef]
- Deng, W.J.; Zhang, J.Y.; Liu, L.; He, D.; Xia, W. Simulation Analysis of a New Chips Recycling Process Termed Forming Extrusion Cutting. Int. J. Simul. Model. 2016, 16, 694–706. [Google Scholar] [CrossRef]
- Zhang, J.Y.; Liu, L.; He, D.; Yin, X.L.; Deng, W.J. The effects of tool structure parameters on forming extrusion cutting (FEC). Int. J. Adv. Manuf. Technol. 2018, 98, 2705–2716. [Google Scholar] [CrossRef]
- Yin, X.L.; Deng, W.J.; Zou, Y.H.; Zhang, J.Y. Ultrafine grained Al 7075 alloy fabricated by cryogenic temperature large strain extrusion machining combined with aging treatment. Mater. Sci. Eng. A 2019, 762, 138106. [Google Scholar] [CrossRef]
- Arunprasath, K.; Sudhan, J.; Kavitha, S.; Paramasivan, S.; Vijayakumar, M. Cryogenic forming of AA6065 by ECAP. Mater. Today Proc. 2022, 66, 696–701. [Google Scholar] [CrossRef]
- Xiong, H.Q.; Zhou, Y.X.; Yang, P.; Kong, C.; Yu, H.L. Effects of cryorolling room temperature rolling and aging treatment on mechanical and corrosion properties of 7050 aluminum alloy. Mater. Sci. Eng. A 2022, 853, 143764. [Google Scholar] [CrossRef]
- Köklü, U.; Kayhanlar, H. An Experimental Investigation on Machinability of AZ31B Magnesium Alloy under Dry and Dipped Cryogenic Approaches. J. Mater. Eng. Perform. 2021, 31, 1285–1296. [Google Scholar] [CrossRef]
- Cobana, H.; Koklub, U. Drilling of AZ31 magnesium alloy under dry and cryogenic conditions. J. Mater. Manuf. 2022, 1, 7–13. [Google Scholar]


| Parameter | Material (Cu) | Tool (WC Carbide) |
|---|---|---|
| Young’s modulus (GPa) | 115 | 650 |
| Poisson’s ratio | 0.33 | 0.25 |
| Heat transfer (N/s/°C) | 430 | 59 |
| heat capacity (N/mm2/°C) | 3.42 | 15 |
| Emissivity | 0.7 | 0 |
| Parameter | Value |
|---|---|
| Cutting speed, m/s | 0.09 |
| Cutting depth td, mm | 0.6 |
| Compression ratio (λ) | 1.3 (0.7, 0.8, 1, 1.3, 1.5) |
| Rake angle of the tool (α), ° | 10° (5°, 10°, 15°, 20°, 25°, 30°) |
| Friction coefficient (μ) | 0.6 (0.15, 0.3, 0.45, 0.7, 0.9) |
| Constraining tool corner radius (R), mm | 0 (0, 0.1, 0.2, 0.3, 0.4) |
Disclaimer/Publisher’s Note: The statements, opinions and data contained in all publications are solely those of the individual author(s) and contributor(s) and not of MDPI and/or the editor(s). MDPI and/or the editor(s) disclaim responsibility for any injury to people or property resulting from any ideas, methods, instructions or products referred to in the content. |
© 2023 by the authors. Licensee MDPI, Basel, Switzerland. This article is an open access article distributed under the terms and conditions of the Creative Commons Attribution (CC BY) license (https://creativecommons.org/licenses/by/4.0/).
Share and Cite
Yin, X.; Wang, Z.; Guo, R.; Wang, W.; Yu, H.; Wang, H. FEM Simulation of Surface Micro-Groove Structure Fins Produced by Cryogenic-Temperature Extrusion Machining. Processes 2023, 11, 560. https://doi.org/10.3390/pr11020560
Yin X, Wang Z, Guo R, Wang W, Yu H, Wang H. FEM Simulation of Surface Micro-Groove Structure Fins Produced by Cryogenic-Temperature Extrusion Machining. Processes. 2023; 11(2):560. https://doi.org/10.3390/pr11020560
Chicago/Turabian StyleYin, Xiaolong, Zhilin Wang, Runyu Guo, Wan Wang, Hechun Yu, and Hanbin Wang. 2023. "FEM Simulation of Surface Micro-Groove Structure Fins Produced by Cryogenic-Temperature Extrusion Machining" Processes 11, no. 2: 560. https://doi.org/10.3390/pr11020560