Article

Damage Assessment of Roadway Wall Caused by Dynamic and Static Load Action of Gas Explosion

School of Resource, Environment and Safety Engineering, Hunan University of Science and Technology, Xiangtan 411201, China
*
Author to whom correspondence should be addressed.
Processes 2023, 11(2), 580; https://doi.org/10.3390/pr11020580
Submission received: 16 December 2022 / Revised: 28 January 2023 / Accepted: 8 February 2023 / Published: 14 February 2023
(This article belongs to the Section Materials Processes)

Abstract

:
In order to obtain the damage characteristics of a roadway wall caused by a gas explosion, the damage evaluation theory of a roadway wall under the dynamic and static loads of a gas explosion is analyzed in this paper. Meanwhile, an evaluation method (overpressure–impulse criterion) is selected to evaluate the damage of the roadway wall under the impact load of the gas explosion. A mathematical model and a physical analysis model of the roadway wall damage are established by LS-DYNA software. The dynamic response of the roadway wall caused by the dynamic and static loads of the gas explosion is numerically simulated. The overpressure and impulse of gas explosion propagation are measured, while the damage data of the roadway wall under different overpressure and impulse loads are obtained. The P-I curves of the roadway wall under different dynamic and static loads of gas explosion are drawn. The fitting formula of P-I curves of the roadway wall is obtained. The influence of different geostress loads (0–20 MPa) on the P-I curve is analyzed. The shape of the P-I curve is similar under different geostress conditions. The difference is mainly shown in different sizes of P0 and I0. The numerical simulation results show that the P-I curve and the effect of geostress on roadway wall damage could reflect the dynamic response of the roadway wall. The damage degree and damage range of the roadway wall increase with the increase in explosion load energy. Under the action of different geostresses, the overpressure asymptote P0 and the impulse asymptote I0 show linear changes. The above research results could provide a theoretical basis and data support for the evaluation of roadway wall damage caused by gas explosions.

1. Introduction

Gas explosion accidents in coal mines cause serious damage to roadway facilities and huge property losses [1,2,3].Therefore, related scholars have conducted a large amount of research on gas explosion damage characteristics and prevention techniques [4,5,6] and have achieved fruitful research results [7,8,9]. Moreover, in order to optimize the anti-explosion performance of engineering structures and facilitate accident investigation, many damage theories and assessment methods have been proposed. For example, Sun et al. proposed the equivalent yield strength calculation formula of the equivalent single freedom model of steel-reinforced concrete columns [10,11]. Jiang et al. established a damage constitutive model of rock under triaxial compression and verified the parameters in combination with the test curve and the extreme condition of multivariate function [12]. Ye analyzed the wall damage characteristics of blasting boreholes in coal seam and obtained the damage rules of the borehole wall. Meanwhile, an evaluation method was proposed [13]. Ding et al. put forward a failure criterion based on the shear bearing capacity of steel columns [14]. The dynamic response and damage assessment of steel columns under explosion load were investigated using the finite element method. Li used LS-DYNA to establish a numerical simulation method for the interaction between explosion shock waves and reinforced concrete columns [15]. The P-I curve and fitting formulas of reinforced concrete columns were obtained. Pan et al. constructed an anti-explosion overpressure–impulse (P-I) curve of steel pipe RPC (reactive powder concrete) based on an equivalent single degree of freedom (SDOF) model [16]. Wang analyzed the influence of explosion load and component parameters on two asymptotes of the P-I curve [17]. A simplified method for the P-I curve of the component is proposed. Tian et al. obtained the P-I curves of steel plate concrete composite beams (SPCCBs) under explosion load by numerical solution [18]. Shi fitted anti-explosion evaluation P-I curves of three types of explosion-proof walls and obtained a unified empirical equation to determine the fitting of the P-I curves [19]. Li studied the response and damage assessment of concrete slabs under explosion load [20]. The results showed that the P-I curve was suitable for evaluating the damage of reinforced concrete slabs under different explosion loads. Dragos et al. proposed a new equivalent single degree of freedom and obtained the P-I curve of a steel column under explosion load [21]. Chen established a method to predict the damage degree of a steel column under the combined action of explosion load and fire by using a P-I curve [22]. Soh analyzed the P-I curve of a component through a large number of numerical simulations and trial calculations [23]. Wu established a P-I curve with residual bearing capacity as the failure criterion [24]. Mutalib et al. studied the P-I curve of fiber-reinforced concrete columns through numerical simulation [25]. Yan established a coupling model of an “explosive–air-concrete column” by using the finite element analysis method, verified the correctness of the coupling model, and proposed a damage assessment method based on the bearing capacity [26]. Chen et al. obtained the asymptotic equation of the impulse region and the quasi-static region of the P-I curve and obtained the fitting formula of the dynamic region of the P-I curve through a large number of calculations [27].
The above related studies show that most of the research on structure damage is connected with the explosion of solid explosives. Moreover, the research on P-I evaluation of roadway wall damage by the impact load of gas explosions is still very limited. Furthermore, when analyzing roadway wall damage, researchers usually pay attention to extreme conditions of the load on roadway wall, such as the maximum pressure, displacement, velocity, and stress that the roadway wall could bear. Therefore, in this paper, the damage variable D obtained by numerical simulation is correlated with the maximum explosion pressure P and the positive explosion pressure impulse I. It is expected to obtain a P-I curve corresponding to different damage degrees of the roadway wall, so as to establish a roadway wall damage assessment and prediction model.

2. Theoretical Analyses on Damage Assessment of Roadway Wall Affected by Gas Explosion

2.1. Roadway Wall Damage Criteria

The common damage assessment criteria of a shock wave include an overpressure criterion, an impulse criterion, and an overpressure–impulse criterion.
Overpressure criterion: If the object damage is mainly caused by an overpressure peak, the overpressure criterion is applicable. When the object develops damage under the continuous small overpressure of an explosion, just the overpressure criterion is not suitable to evaluate the damage.
Impulse criterion: The impulse criterion assumes that the object damage caused by the explosion wave depends on the magnitude of the explosion impulse. If the impulse value exceeds the critical value of damage, the load object will be damaged. However, the peak value of overpressure is also high or low. When the overpressure is small, even if the load lasts for a long time, the object will not be damaged. Therefore, it is not comprehensive to use the impulse criterion only. It usually takes a long time for the impulse criterion to reach the damage of the applicable object.
Overpressure–impulse criterion: The advantages and disadvantages of the overpressure criterion and the impulse criterion are comprehensively considered in the overpressure–impulse criterion. This criterion assumes that the load object will be damaged when the overpressure and impulse together satisfy a certain critical condition. The overpressure–impulse (P-I) criterion is suitable for the damage assessment of most objects under an explosive load. Two important explosion parameters (overpressure and impulse) are considered simultaneously. In this paper, the overpressure–impulse criterion (i.e., P-I criterion) is adopted to evaluate the damage of a roadway wall under the impact load of a gas explosion.

2.2. Damage Assessment Method of P-I Curve

For the damage assessment of structures under an explosion load, the commonly used method is the overpressure–impulse curve, i.e., P-I curve. A P-I curve is the equal damage line of a certain component under the action of an explosion load, and each P-I curve corresponds to a certain degree of damage. Atypical P-I curve is shown in Figure 1. Each P-I curve has two asymptotes, namely an overpressure asymptote and an impulse asymptote, which respectively correspond to critical overpressure P0 and critical impulse I0. When the impulse load is less than I0, increasing the overpressure of the explosion load cannot make the structure reach the corresponding damage degree. Similarly, when the overpressure load is less than P0, increasing the impulse of the explosion load cannot make the structure reach the corresponding damage degree.
The P-I curve divides the figure into two parts. When the explosion load acting on the structural element falls on the upper right part of the P-I curve, the damage degree to the structural member is higher than that corresponding to the P-I curve. On the contrary, if the explosion load acting on the structural member falls at the lower left part of the P-I curve, the damage degree to the structural member is lower than the corresponding degree of the P-I curve [17]. In general, there is a group of P-I curves in the P-I curve figure, which correspond to different damage degrees. Accordingly, these curves divide the P-I curve figure into several regions. Each region corresponds to different damage degree grades (ranges)—e.g., mild damage, moderate damage, and severe damage. When a specific explosion load is projected into the P-I curve, the damage degrees of structural members under the action of the explosion load can be predicted according to the region they fall into. Although the objects of a P-I curve damage assessment are usually composite plates, concrete columns, walls, beams, and other structures [28,29,30], after the reasonable damage variable is determined, the method of establishing a P-I curve is also applicable to the damage assessment of surrounding rock walls, which has important reference value for the safety protection design of roadway walls. The HJC material model (Johnson–Holmquist concrete) contains damage parameters. This model has been used by many researchers to study the damage of coal and rock mass under high-velocity impact and explosion loads [31,32], and its reliability has been verified. In this paper, the damage parameter D in the HJC model is used as the damage variable.
At present, there are three commonly used methods to determine the P-I curve, which are the analytical method, the experimental method, and the numerical simulation method. In this paper, the data of the dynamic response and damage degree of a roadway wall under different explosion impact loads are obtained by the numerical simulation method. Additionally, critical data corresponding to the specific damage degree are selected. Finally, the P-I curve of the structure is obtained by curve fitting.

3. Numerical Model Establishment of Roadway

3.1. Mathematical Model

A gas explosion is a very rapid chemical reaction, with a large number of intermediate and instantaneous products being produced. In this paper, the intermediate process of the reaction is ignored. In order to carry out reasonable and effective numerical calculations, the following basic assumptions are made for the model: Firstly, the gas mixture in the gas section of the roadway is evenly mixed (9.5%CH4) with room temperature and pressure. Secondly, there is only a heat source of gas explosion in the roadway. Thirdly, the surrounding rock of the roadway is uniform and continuous. Finally, the roadway wall is smooth and adiabatic, while the roadway wall thermal effect is not considered.
The destructive effect of a gas explosion is caused by energy exchange. Based on the above assumptions, the basic control equations (mass, momentum, and energy equations) could be expressed as follows:
M = Δ ε ρ ε d v ε = Δ x ρ x d v x = Δ X ρ X d v X
t | X Δ ε ρ ε v ε d v ε = Δ ε t i d s ε + Δ ε ρ ε f i d v ε
E = V s i j ε i j ( p + q ) V ˙
where ε is a position vector representing the position of each point in the coordinate system; v is the motion velocity in space; ΔX, Δx, and Δε are the boundaries of the material domain, the spatial domain, and the reference domain of any continuum, respectively; ρ X , ρ x , and ρ ε representthe density of each substance in the continuum; t i is the force acting on the unit surface on the boundary Δ ε of the reference domain Δε; f i is the volume force per unit mass acting on an object; V is the relative volume of the current configuration; V ˙ is the relative volume deformation velocity of the current configuration; s i j and p arethe partial stress tensor and hydrostatic pressure, respectively; ε i j is the strain rate tensor; and q is the volume viscous resistance.

3.2. Physical Model

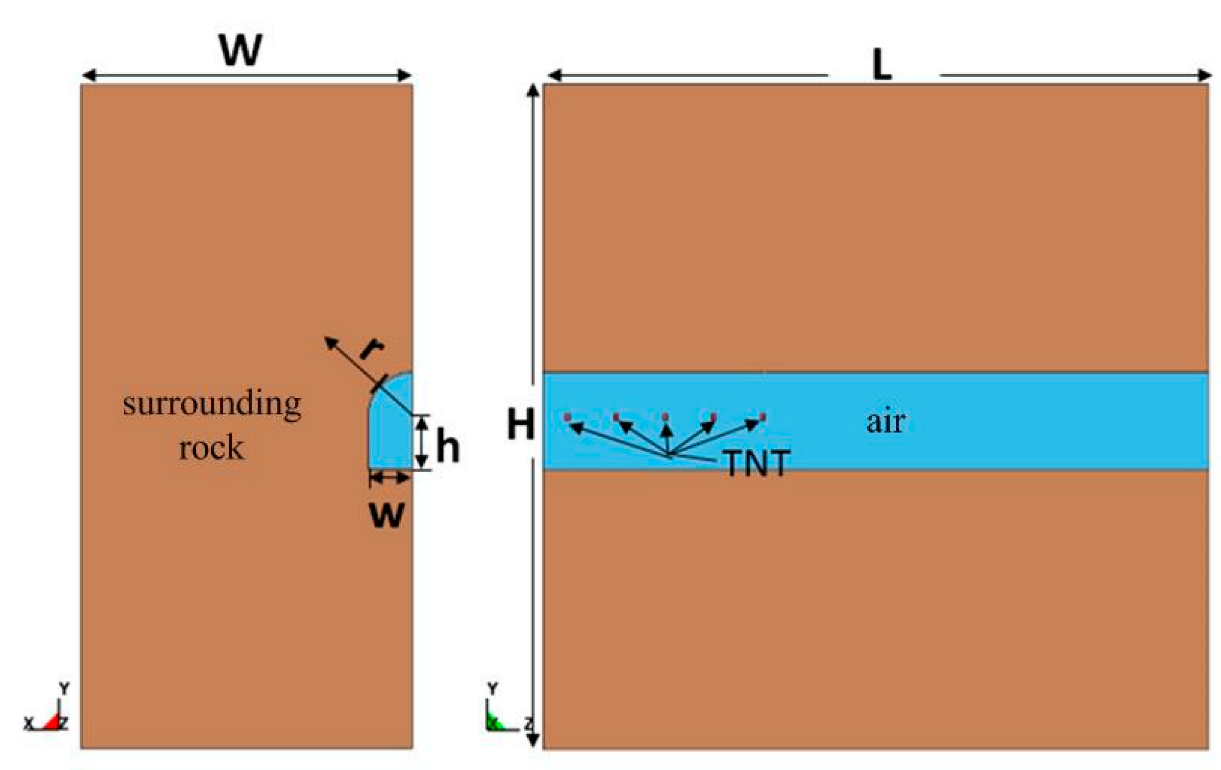
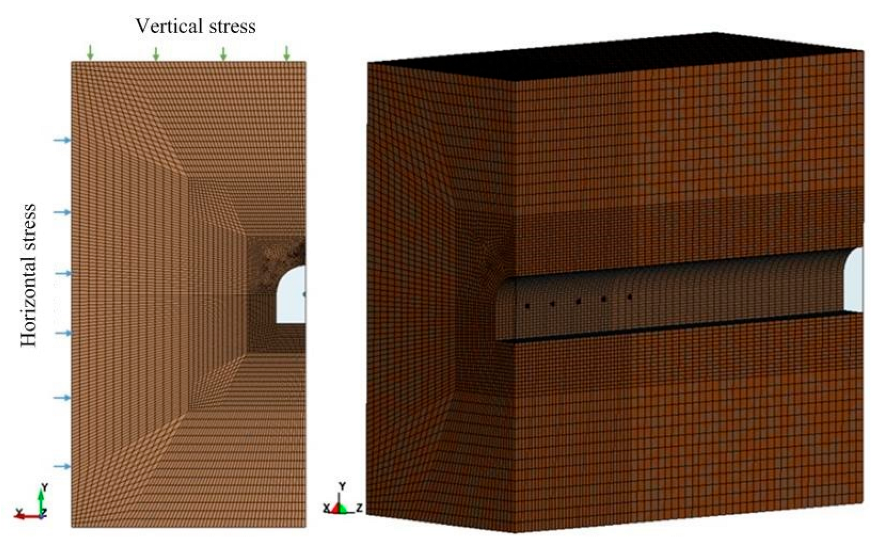
The physical model adopted in this paper is shown in Figure 2 and Figure 3. In order to make rational use of computing resources, a 1/4 model was adopted for calculation. Symmetric boundaries were set on the Y-Z plane and X-Y plane. The model was divided into surrounding rock, air, and TNT explosive. Among them, the TNT was divided into 5 parts and was evenly distributed on the roadway axis, which was 1.2 m away from the roadway bottom. The coordinates of the initiation point were (0, 0, 0.5). To eliminate the boundary effect, the length, width, and height of the calculation model were 15 m, 7.5 m, and 15 m, respectively. The cross-section of the underground roadway was generally arched. In this numerical simulation, it was assumed that the roadway height is 2 m, the width is 2 m, and the crown radius is 1 m.
The grid of the model was divided by a solid164 eight-node hexahedron grid, and the node information in each part was transmitted by a common node. The Lagrange algorithm was adopted in the roadway, while the ALE algorithm was adopted in the gas, TNT, and air. The opening at the right end of the roadway was provided with a non-reflective boundary to reduce boundary pressure reflection. In order to reduce the error and improve the calculation efficiency, the minimum grid size near the initiation point was set to 3 cm. The total number of grids was about 590,000. A Lagrange element was adopted for surrounding rock to observe deformation and damage. A Euler element was adopted for TNT and air to better simulate the propagation of the blast wave. In order to realize the coupling damage effect of the shock wave on the roadway wall, the ALE method was used to establish the model to make the fluid grid coincide with the solid grid. The fluid–solid coupling behavior was controlled through a keyword (Constrained_Lagrange_In_Solid) [33]. The damage range of the surrounding rock was simulated by using the Erosion keyword or the self-contained damage criterion of the material model.
In order to make the simulation results conform to real roadway cases, boundary conditions were set around the model. To reduce the boundary reflection effect, a non-reflection boundary was set at the top, both sides, and rear of the model. In order to prevent unreasonable displacement and deformation of the model in the Y direction under the gravity effect, a rigid boundary was set at the bottom of the model. The symmetrical boundary was set on the Y-Z plane and X-Y plane.
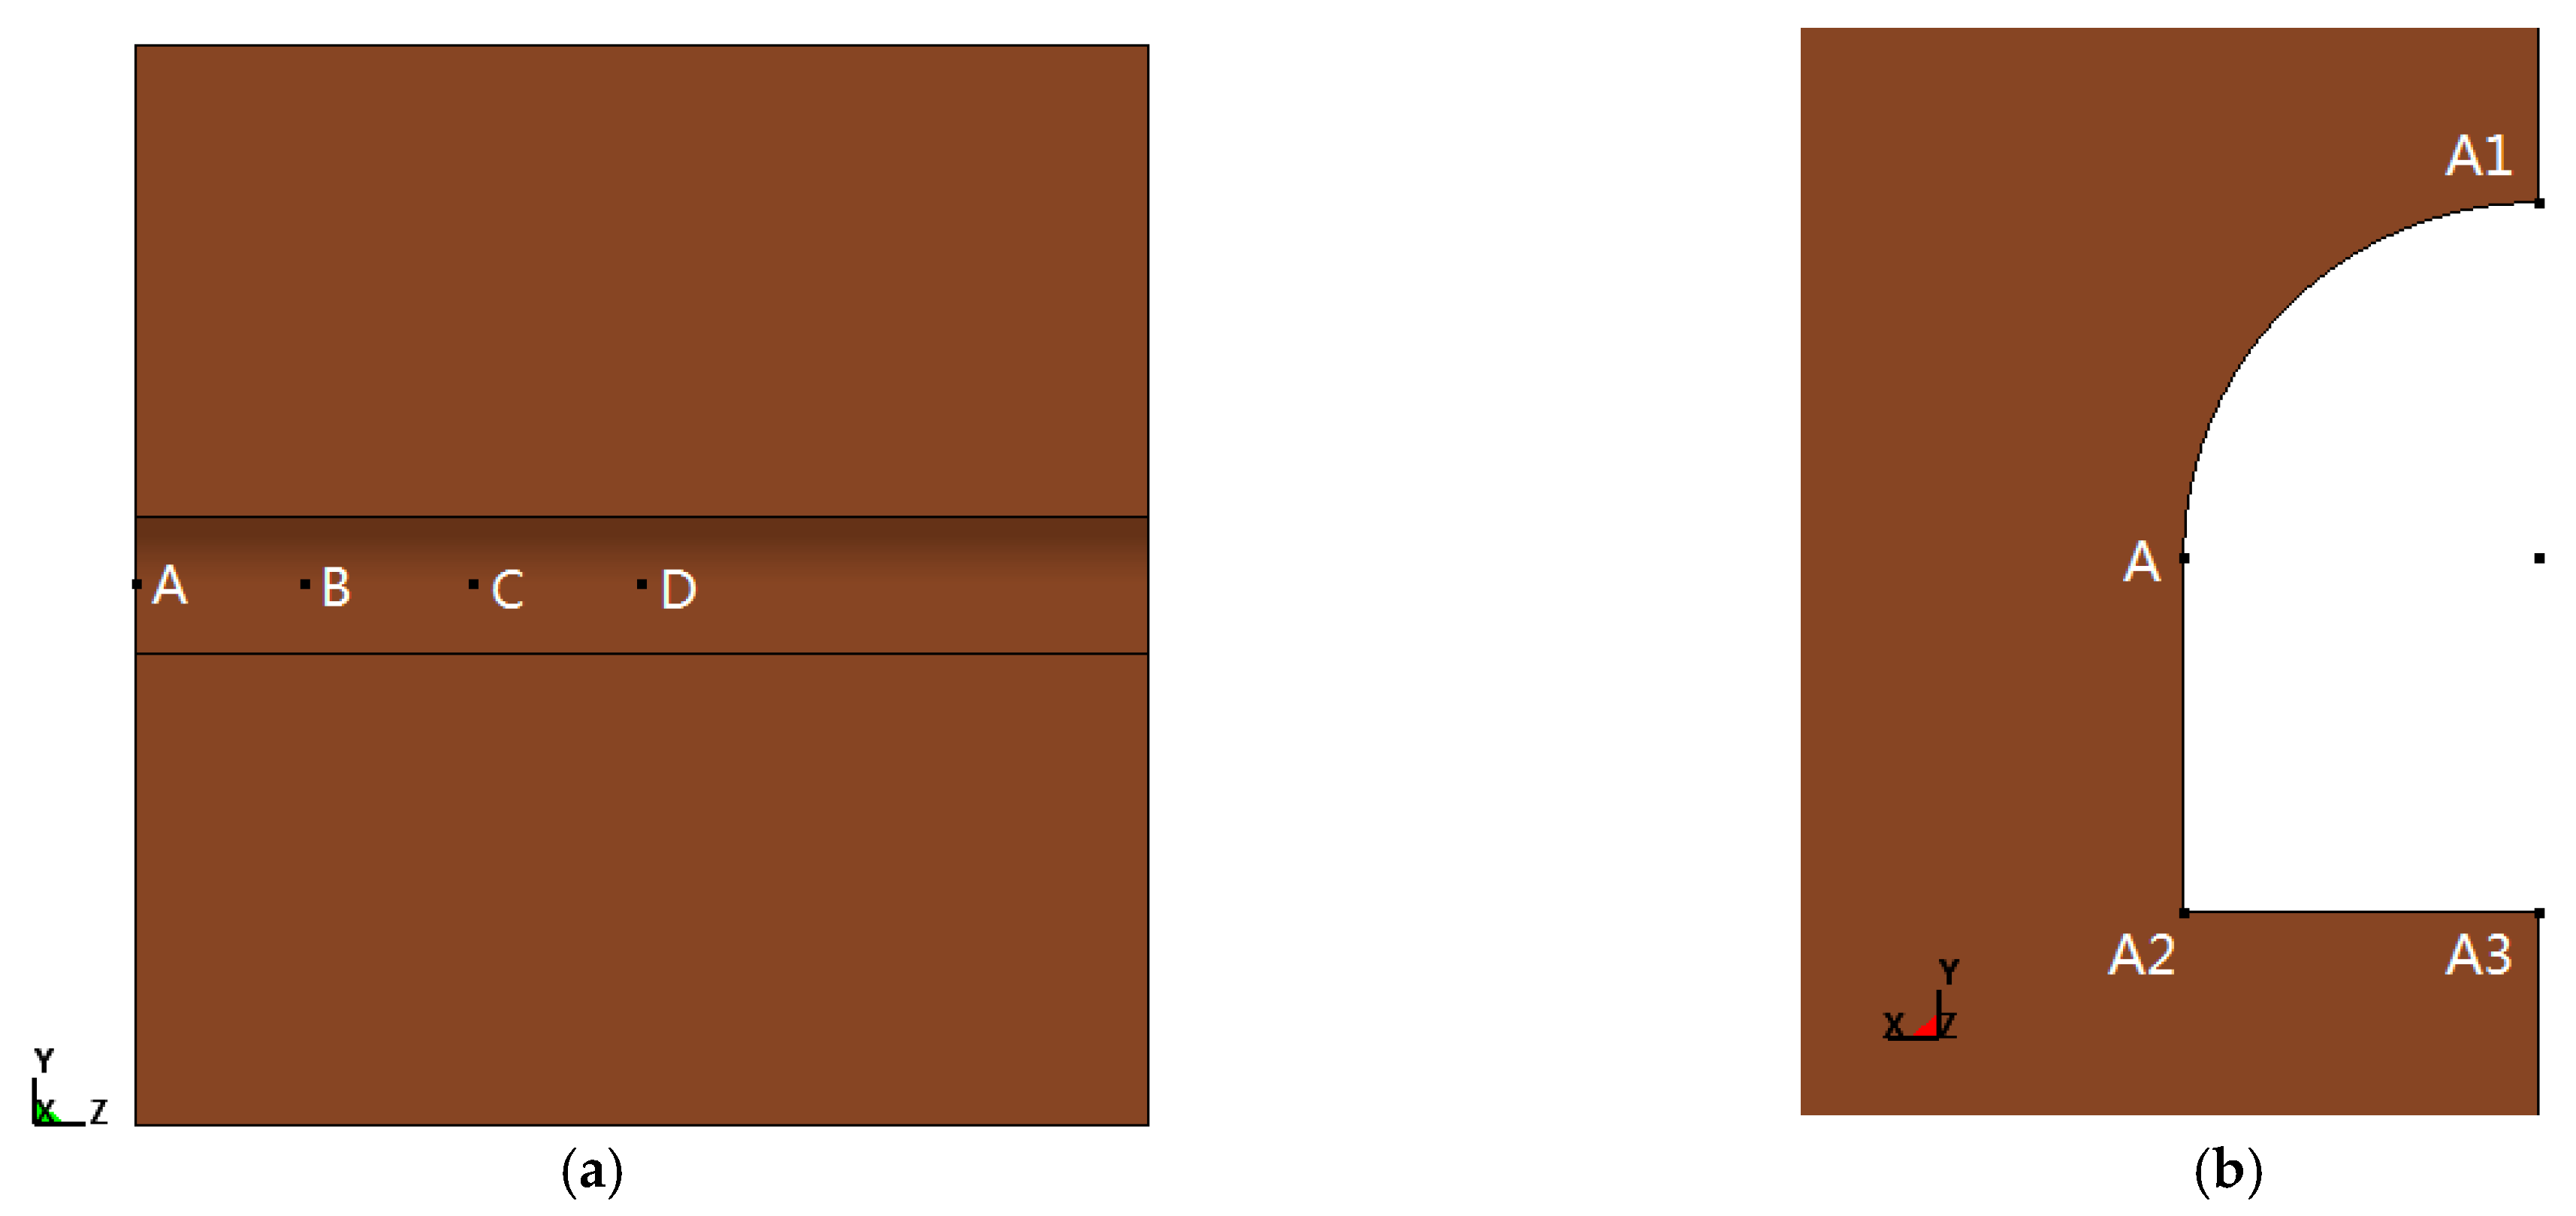
In order to observe the dynamic response pattern of the roadway wall, four measurement points were taken on the wall along the roadway axis and on the original section of the roadway. The positions of the measuring points are shown in Figure 4. The positions of each point on the roadway axis in Z coordinates are 0, 2.5 m, 5 m, and 7.5 m.

3.3. Material Model

The nonlinear material model and state equation used in the numerical model are briefly described as follows.
(1) The HIGH_EXPLOSIVE_BURN material and the Jones–Wilkins–Lee (JWL) equation of state are adopted in the TNT material model [33]. The JWL state equation is as follows:
p = A ( 1 ω A 1 V ) e R 1 V + B ( 1 ω R 2 V ) e R 2 V + ω E 0 V
where, p is the unit pressure, V is the relative volume, E0 is the initial internal energy density, the parameters A and B are material constants, R1 and R2 are dimensionless constants, and ω is the Gruneisen constant—namely, the change rate of pressure relative to internal energy under a constant volume condition. The parameters of the JWL state equation are shown in Table 1 [34].
(2) The NULL material and the LINEAR_POLYNOMIAL state equation are adopted in the material model of air. The calculation of partial stress does not need to be considered in null material, and the volume viscosity can be customized, which is suitable for defining a fluid medium such as air. The LINEAR_POLYNOMIAL state equation [34] is defined as the initial pressure by Equations (5) and (6):
P = C 0 + C 1 μ + C 2   μ 2 + C 3   μ 3 + ( C 4 + C 5   μ + C 6 μ 2 ) E 2
μ = 1 V 2 1
where, p is the initial pressure, C0C6 are the state equation parameters, E2 is the initial internal energy, and V 2 is the relative volume. The specific parameters are shown in Table 2 [34].
(3) The surrounding rock is described by the Johnson–Holmquist concrete (HJC) material model. This material model was established on the basis of the Ottosen model, with the addition of strain rate and other parameters which could reflect the damage changes of brittle materials such as concrete and rock under large deformation, a high strain rate, and high confining pressure [35]. The material parameters of the surrounding rock in this paper are shown in Table 3 [30].

4. Results Analysis and Discussion

4.1. Establishment of Roadway Wall P-I Curve

The initial energy of the explosive was changed to simulate explosion loads of different sizes. A large number of simulation calculations were carried out to obtain the damage data of the roadway wall under different overpressure and impulse loads.
Figure 5 shows three diagrams of damage distribution in the simulation. The damage degree and damage range of the roadway wall increase with the increase in explosion energy.

4.1.1. Classification of Damage Degree

In this numerical simulation, the damage parameter in the HJC constitutive model was used as the damage variable of the surrounding rock wall, and its standard definition is as follows:
D = Δ ε p + Δ μ p ε p f + μ p f
where Δ ε p is the equivalent plastic strain, Δ μ p is the plastic volume strain in one calculation cycle, and ε p f + μ p f is the plastic strain of the material when it breaks under normal pressure. The damage variable is 0 ≤ D ≤ 1; the greater D is, the greater the material damage is.
As for the critical value of damage, China’s technical code for the construction of rock foundation excavation engineering of hydraulic structures stipulates that when the change rate of wave velocity before and after blasting exceeds 10%, the rock mass is in the state of blasting damage. The corresponding rock mass damage threshold is Dcr = 0.19 [36]. It was approximated, and D = 0.2 was taken as the first damage grade of the roadway wall. The damage grade of the surrounding roadway wall was divided into four grades:
(1)
D = 0–0.2, slight damage. A small amount of plastic deformation has occurred on the roadway wall without obvious permanent damage. It can be used normally.
(2)
D = 0.2–0.5, moderate damage. The roadway wall has undergone a large amount of plastic deformation. After repair, it cannot bear the same gas explosion load.
(3)
D = 0.5–0.8, severe damage. The roadway wall has not completely failed, but most of it has been significantly deformed and cannot be repaired.
(4)
D = 0.8–1, the roadway wall is broken and collapsed.

4.1.2. Drawing of P-I Diagram

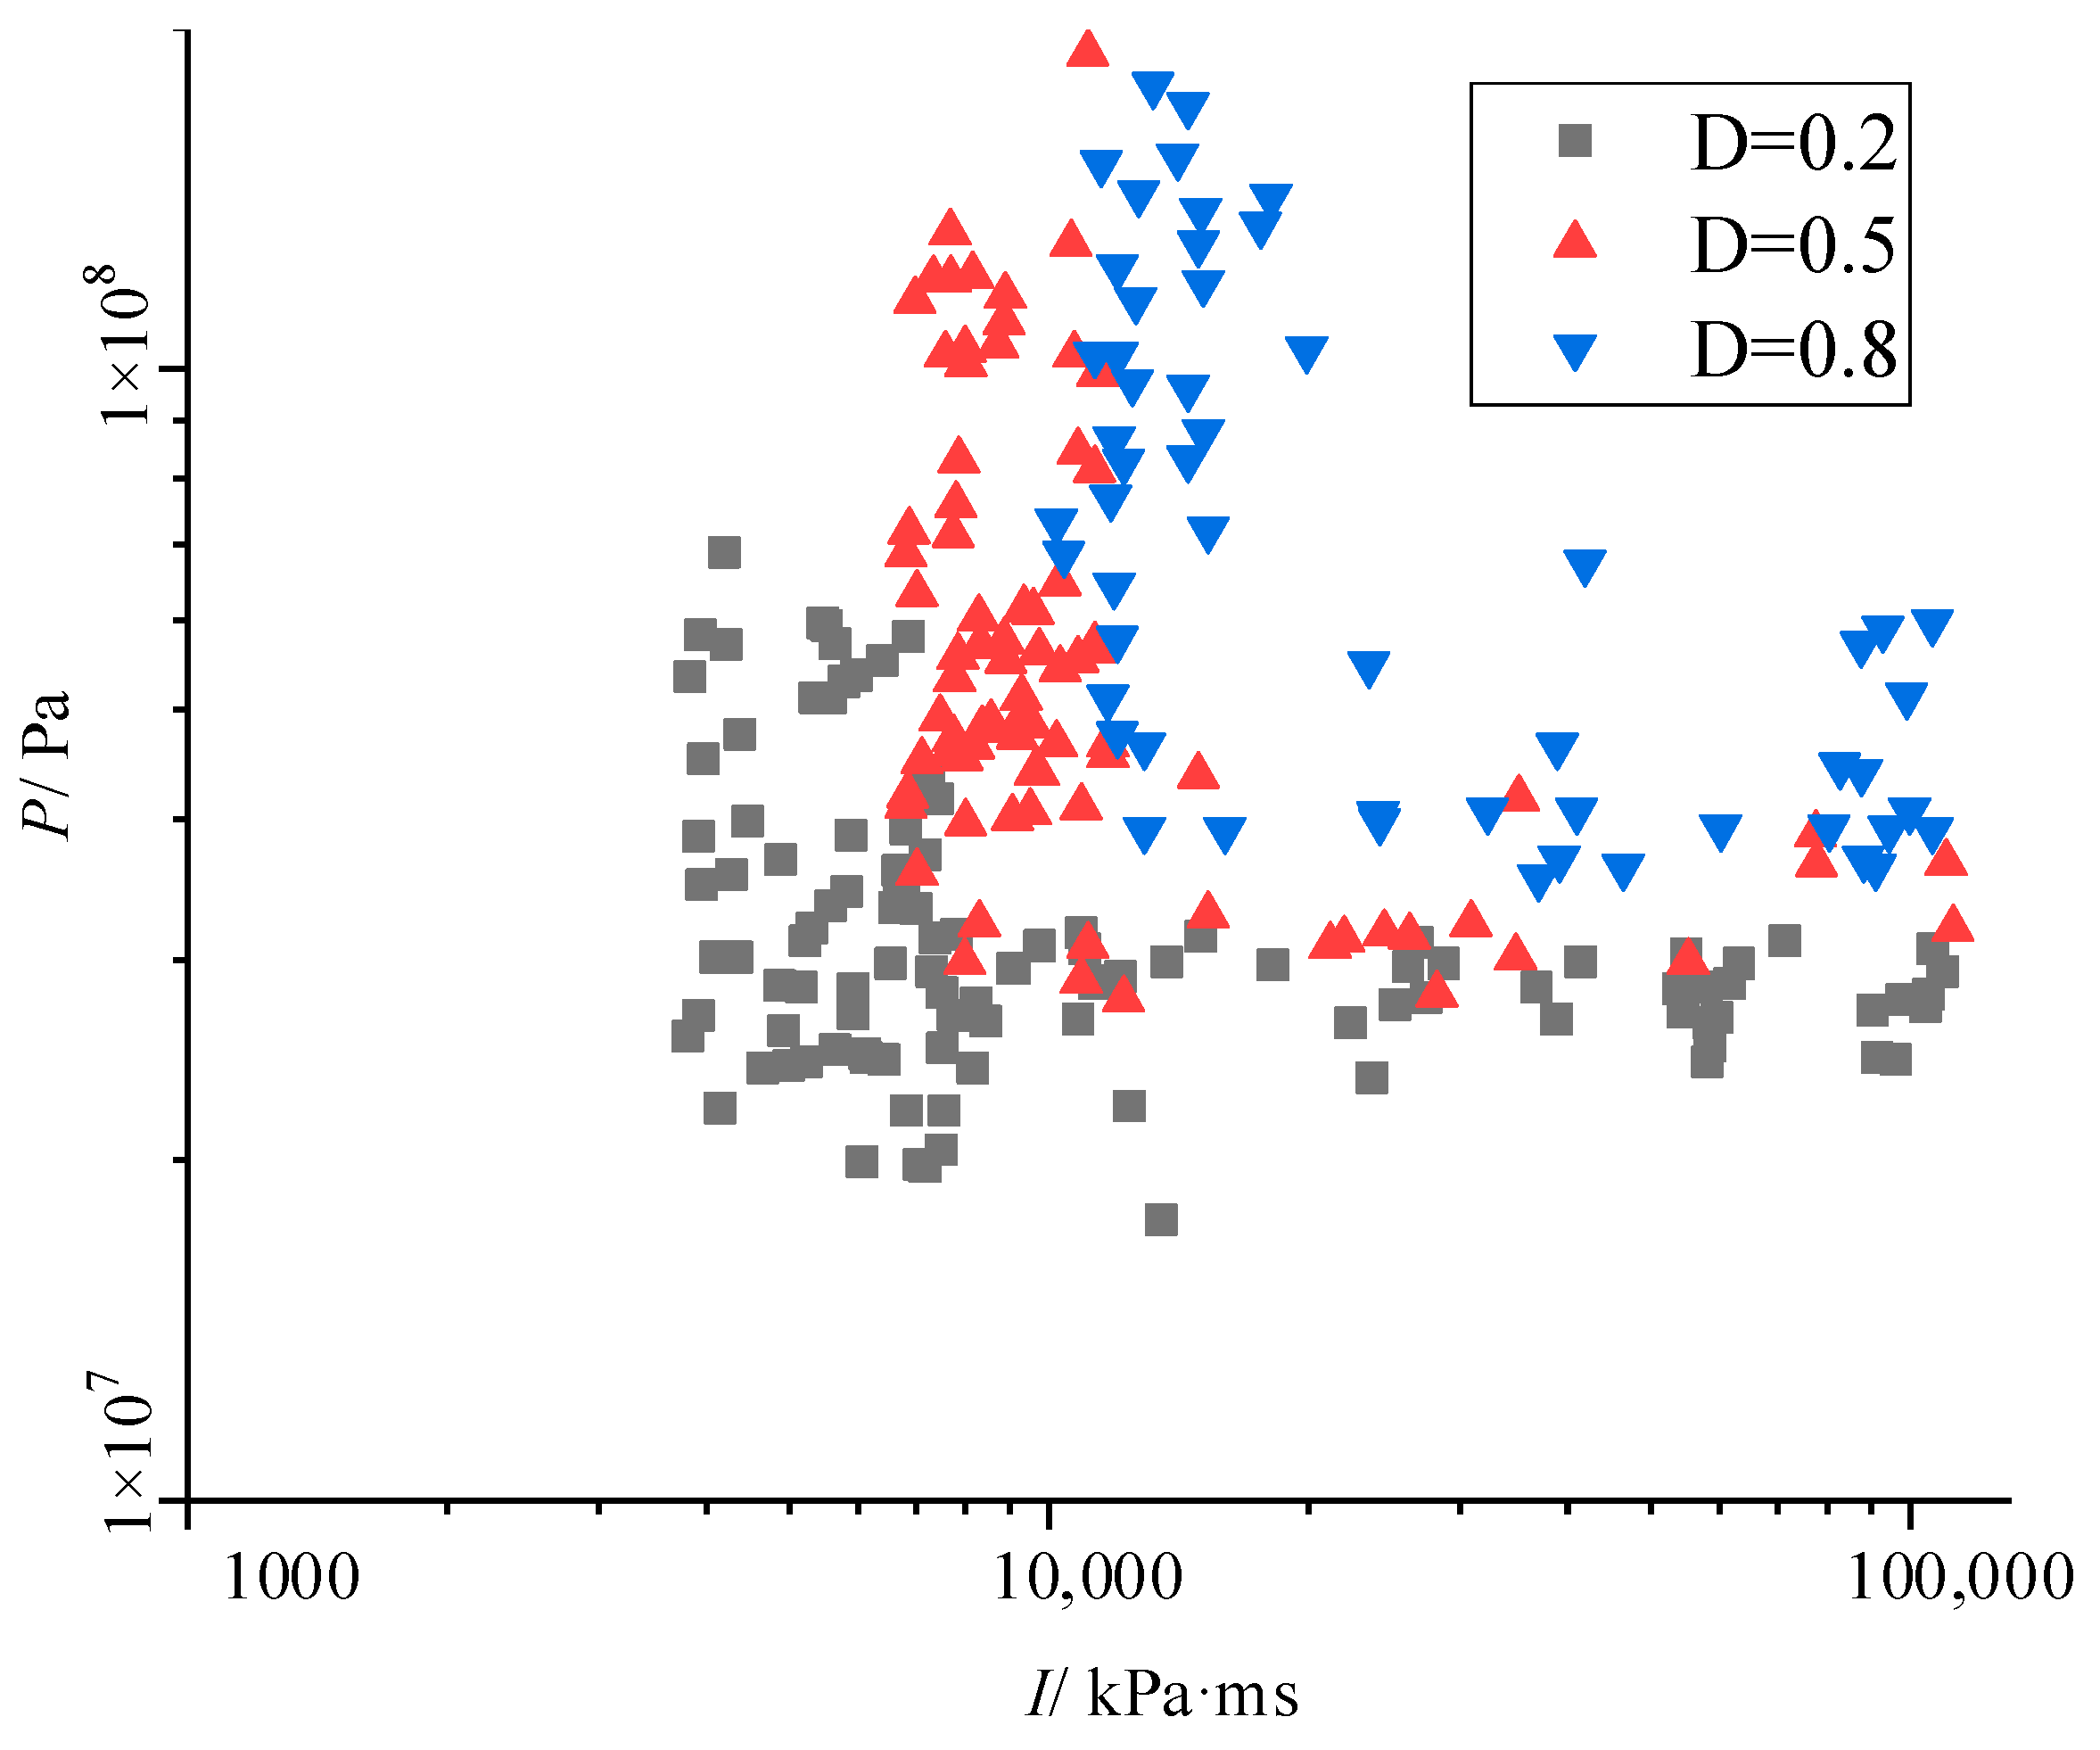
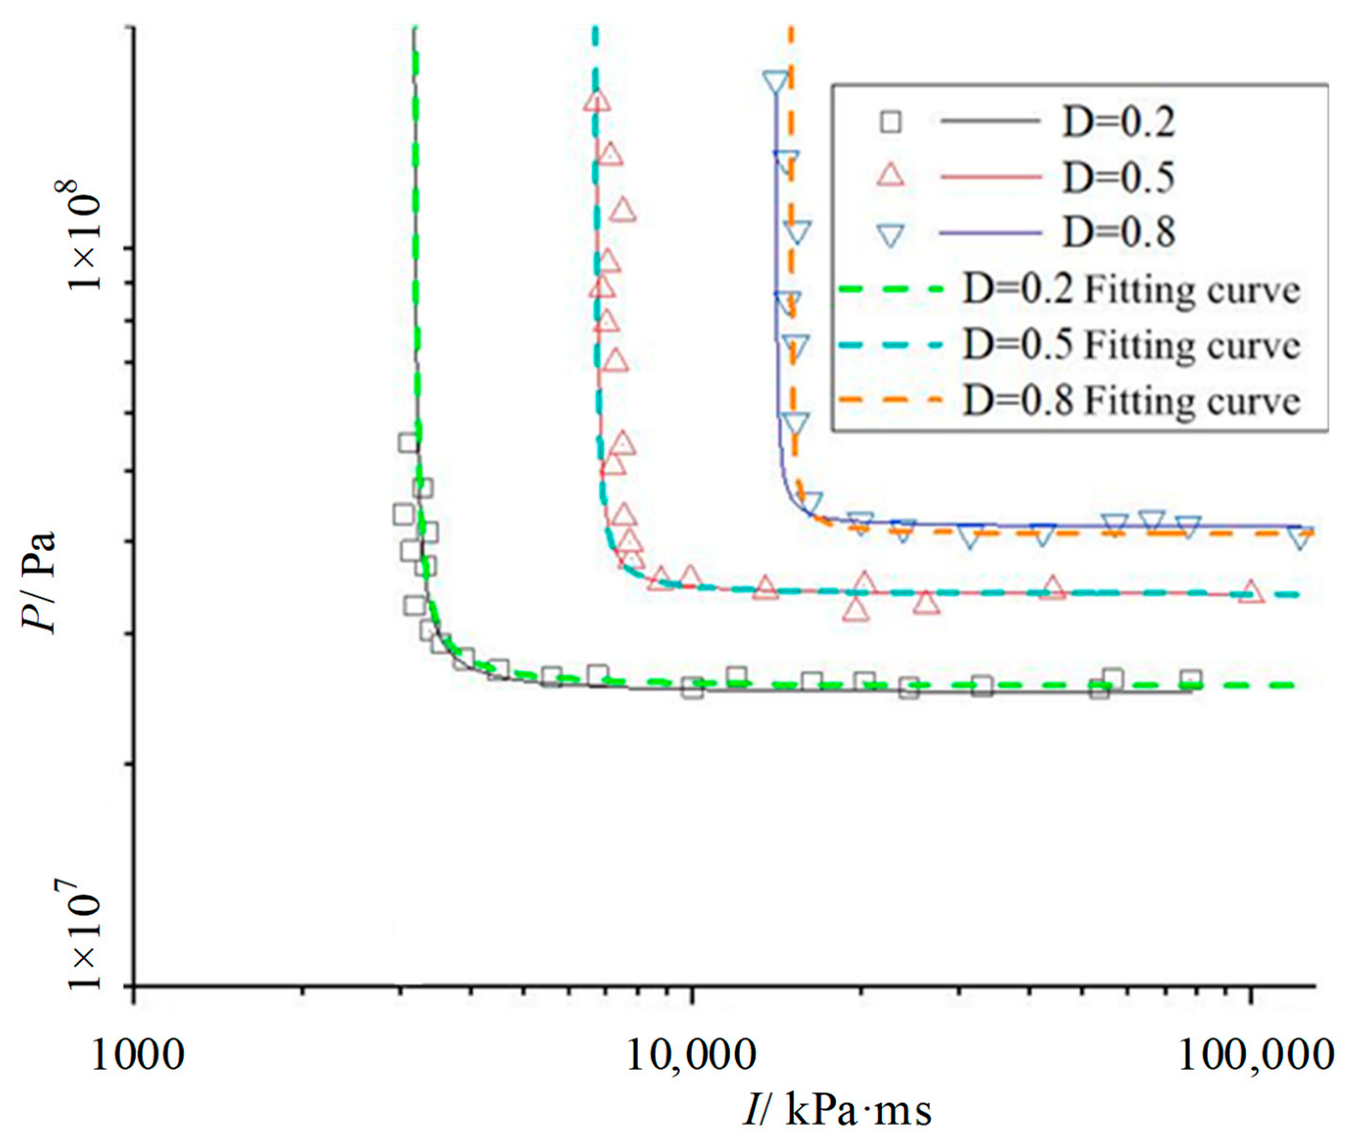
Based on a large number of trial calculations, hundreds of data points corresponding to different damage degrees of the surrounding roadway wall caused by gas explosion load under the condition of no geostress were obtained. The data points were drawn on a P-I diagram according to the damage grade, as shown in Figure 6.
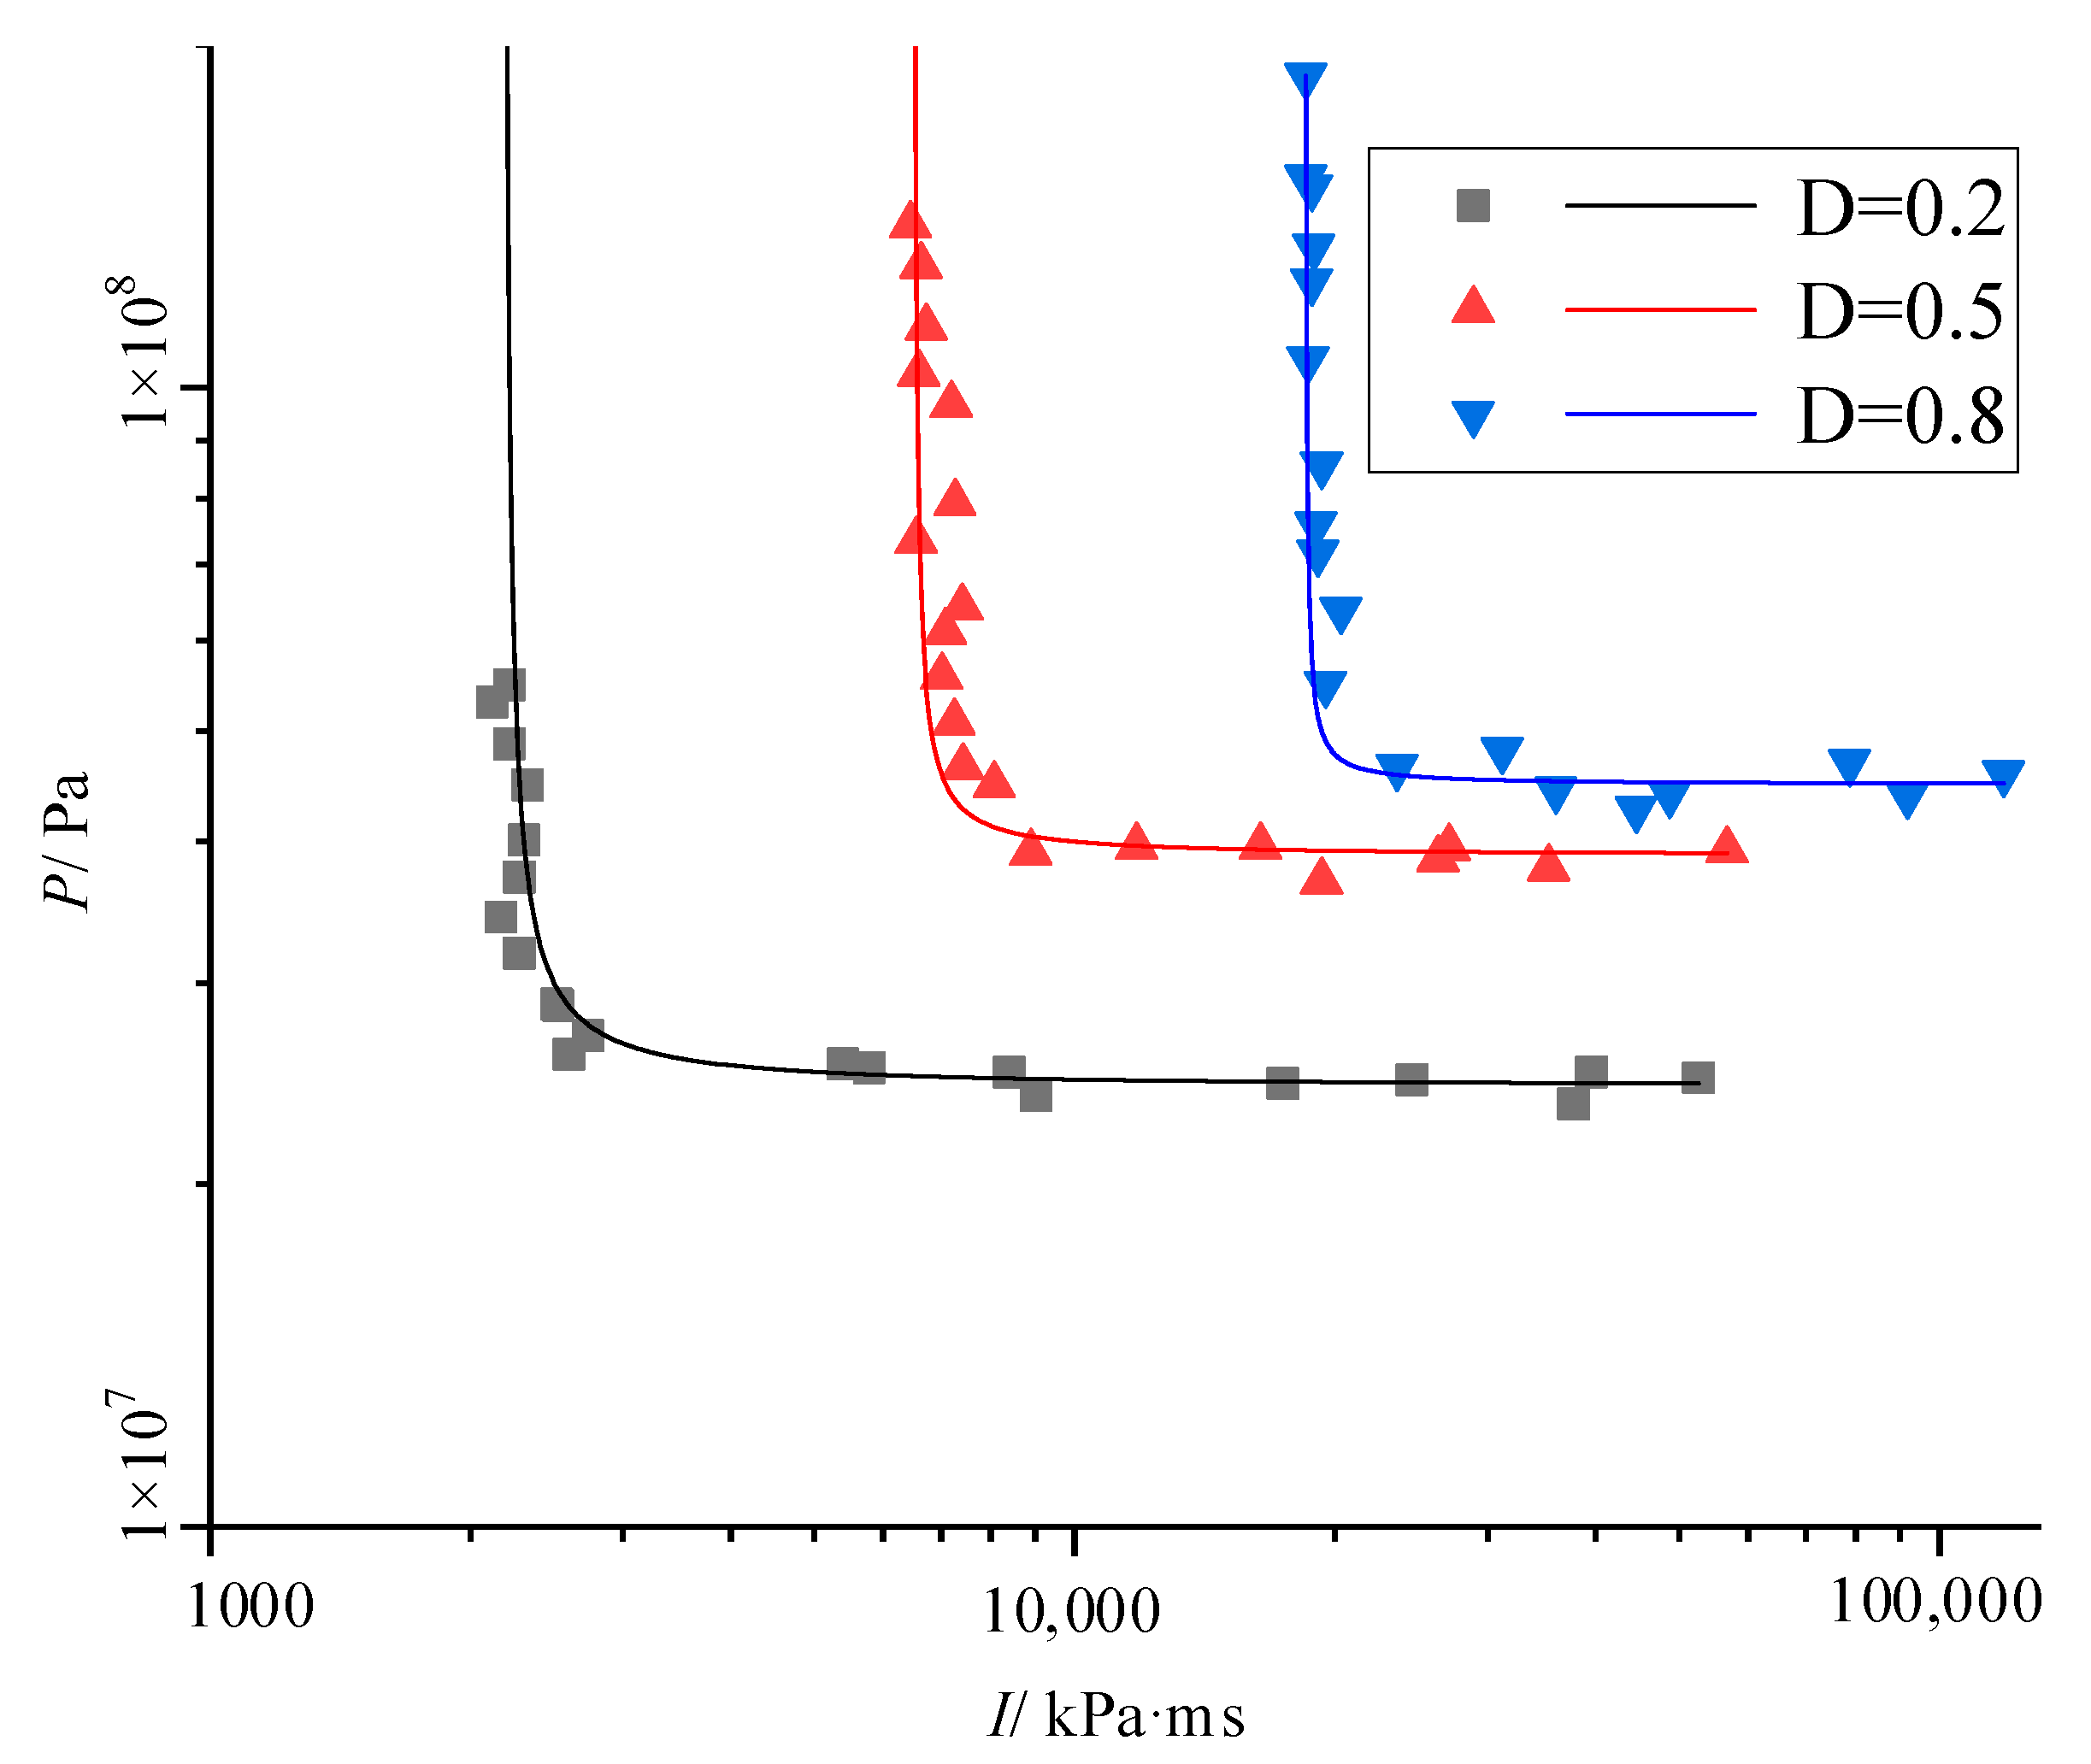
The data points were filtered, and the nonlinear curve was fitted using Origin software. After multiple parameter adjustments and fittings, the P-I curve with the best fitting degree with the filtered data points was obtained, as shown in Figure 7. From the lower left to the upper right, the damage degree of the roadway wall is shown to be increasing. The P-I diagram is divided into four parts by three damage curves, which correspond to the four damage grades of the roadway wall. When the P-I value falls at the lower left of the damage curve of D = 0.2, the damage degree of the roadway wall is small due to the small explosion load intensity. When the P-I value falls within the range of D = 0.2 and D = 0.8, the roadway wall is damaged to different degrees. When the P-I value falls above the right of D = 0.8, the roadway wall deformation caused by the explosion load will exceed the maximum value that the roadway wall can bear, and the roadway wall will collapse.
By fitting the critical value of the damage grade to the convergent mathematical expression, the P-I curve can have a clearer mathematical meaning. Combined with the analytical results of Section 2, formula (8) was chosen by referring to the relevant literature in Section 1.
( P P 0 ) ( I I 0 ) = α ( P 0 / 2 + I 0 / 2 ) β
The P-I curves of different damage grades on the roadway wall could be fitted as follows:
I 0 = α β
( P P 0 ) ( I I 0 ) = 0.039 ( P 0 / 2 + I 0 / 2 ) 1.5
The overpressure and impulse ( P 0 , I 0 . ) corresponding to each damage degree are shown in Table 4.
It can be seen from Table 5 that α and β have no change (0.039 and 1.5, respectively), which indicates that these two parameter values are not related to the damage grade of the roadway wall. P0 increases with the increase in the damage grade. However, the growth rates of P0 among different damage grades are ( v 0.2 0.5 = 0.833 × 10⁷ v 0.5 0.8 = 2.933 × 10⁷). This indicates that P0 does not increase linearly with the increase in the damage degree. When the damage degree of the roadway wall is low, the P0 difference between different damage grades is smaller. Similarly, I0 also increases with the increase in the damage grade. Its growth rates are v 0.2 0.5 = 9007.7 v 0.5 0.8 = 15,402. With the increase in I0, the damage degree of the roadway wall increases more and more slowly. Compared with the increase in P0 and I0, it can be seen that the damage degree of the roadway wall is more easily affected by the impulse asymptote I0.

4.1.3. Effect of Geostress Load on P-I Curve

In order to study the influence of geostress load on the P-I curve, the explosion load in the numerical model was changed for repeated trial calculation. The same processing method in the previous section was applied to obtain the P-I curve of the roadway wall when the horizontal geostress and the vertical geostress are 20 MPa.
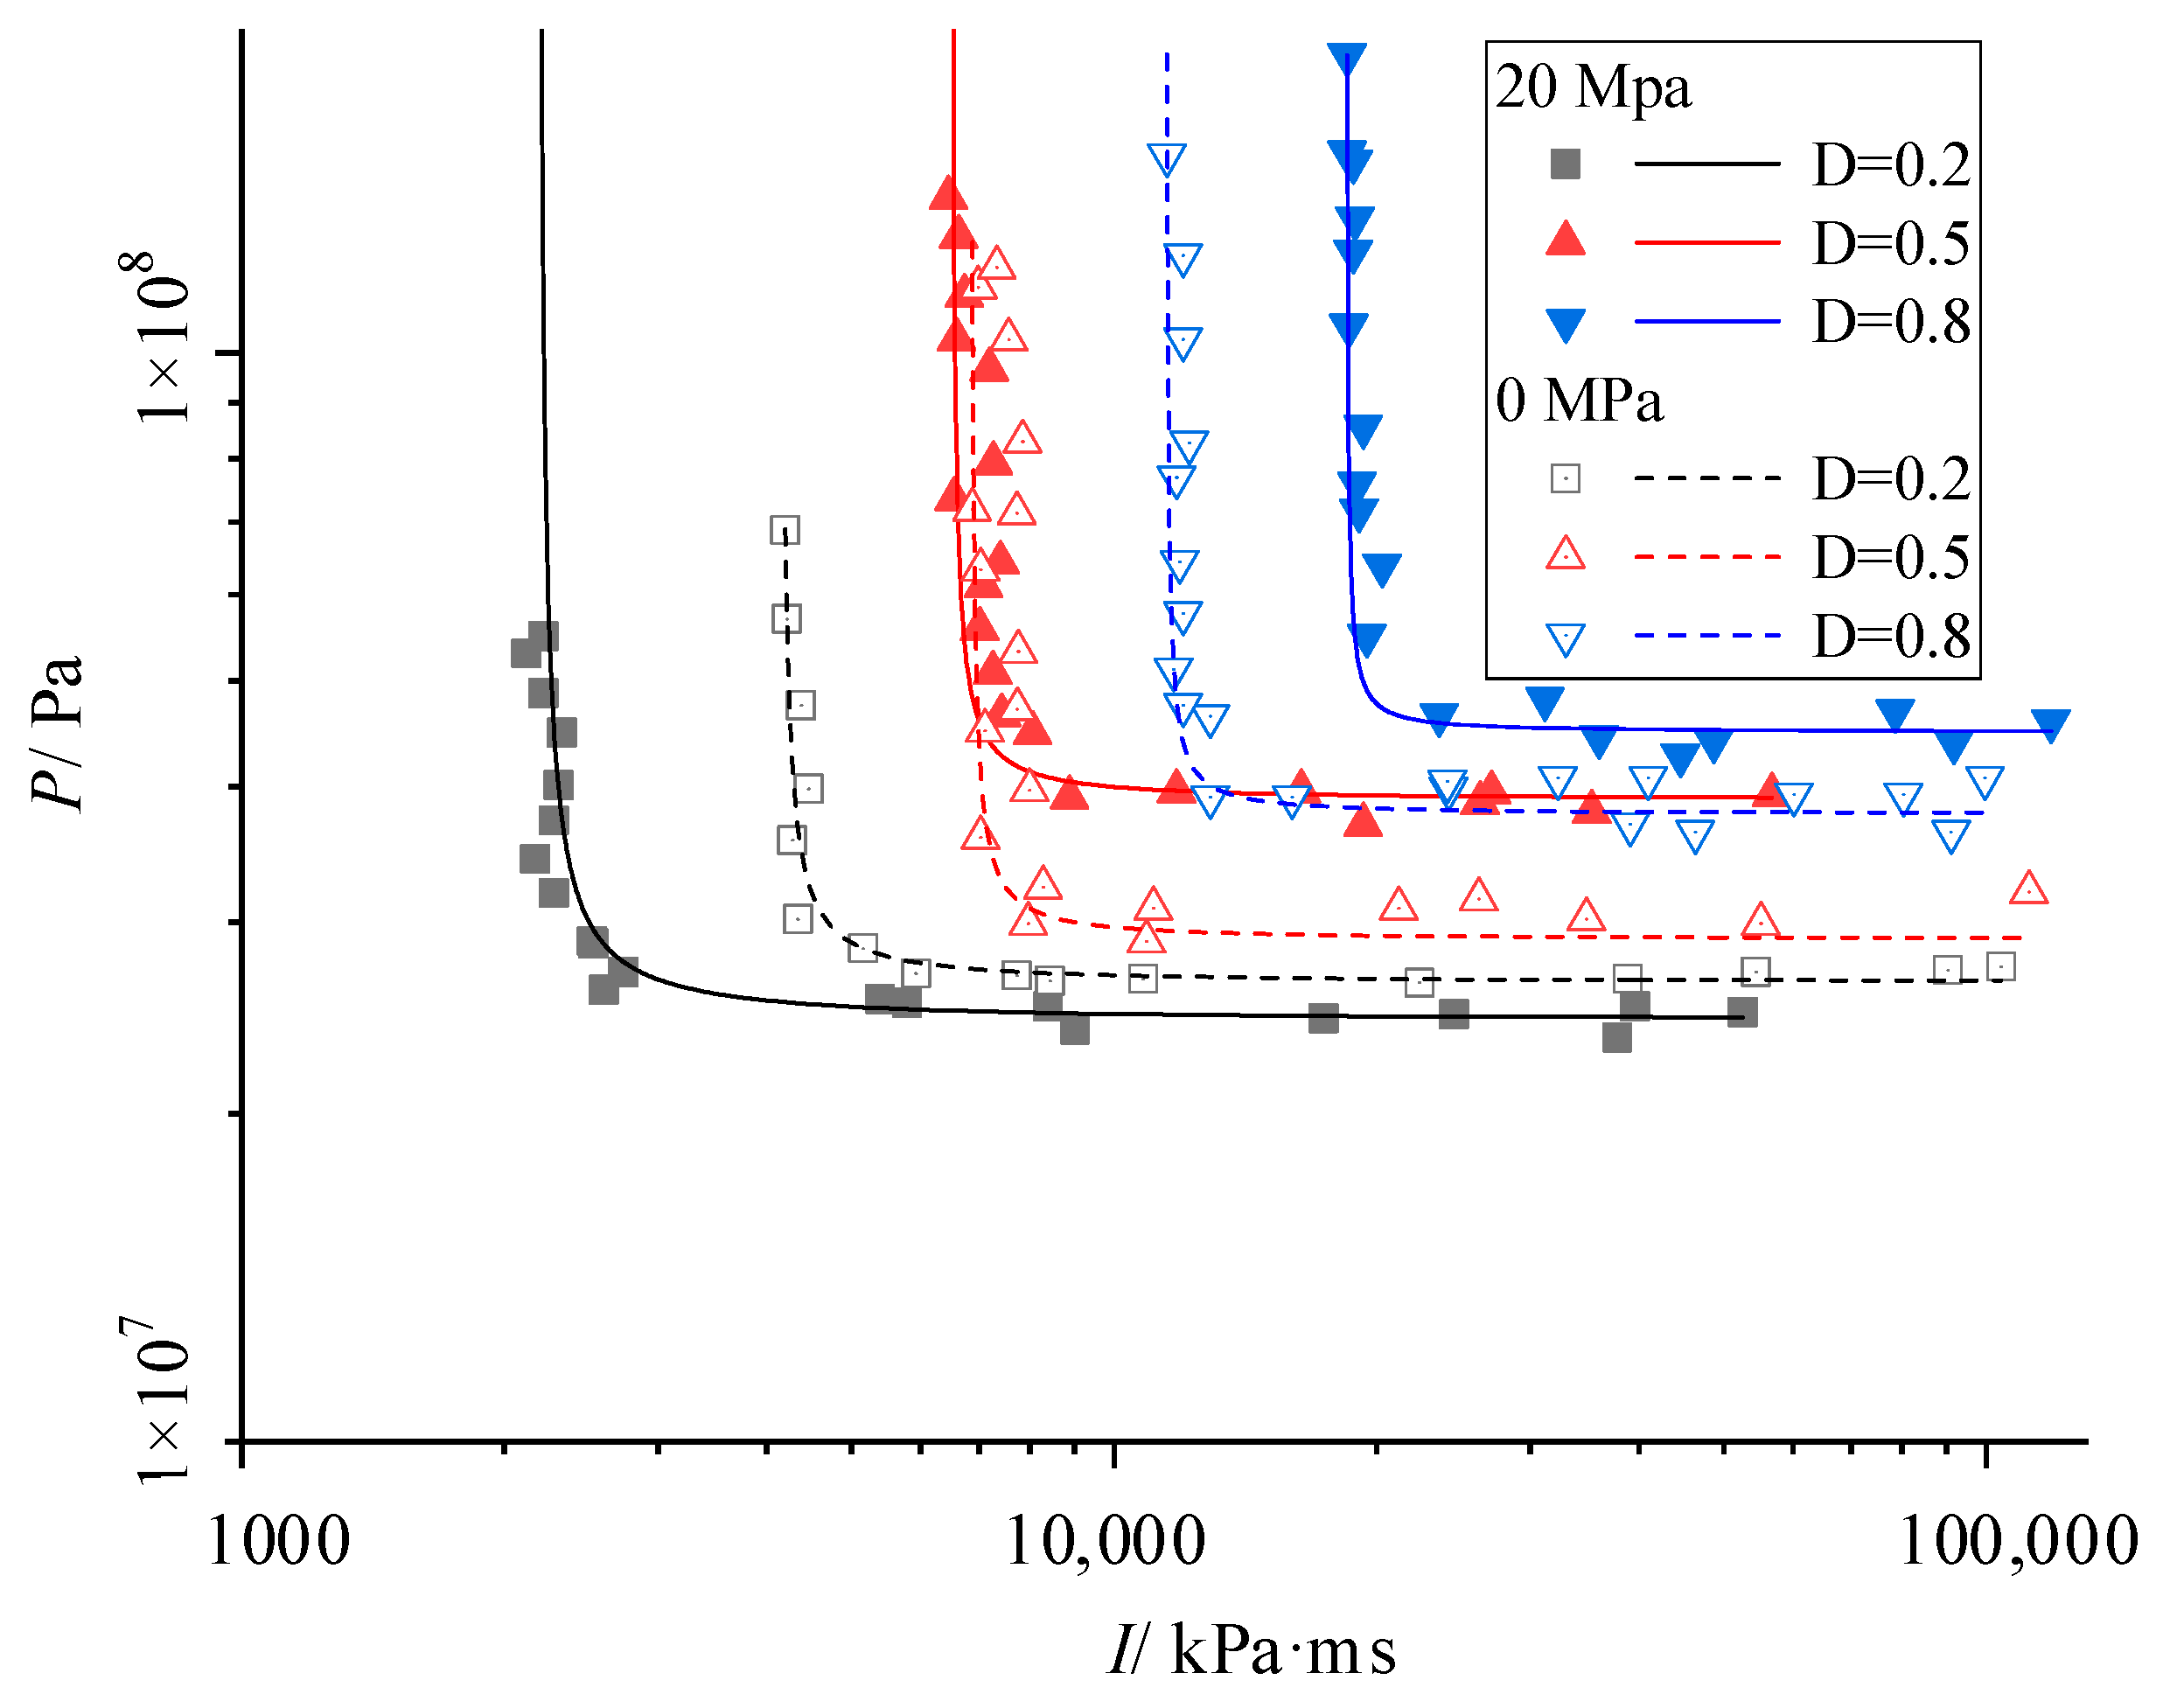
The P-I curve of the roadway wall under the coupling action of geostress and a gas explosion is shown in Figure 8. It can be seen that the fitting degree is good. Comparing Figure 7 and Figure 8, it can be seen that the P-I curve of the roadway wall is more dispersed after the geostress is applied. The low damage grade curve appears earlier and closer to the coordinate axis. It shows that the geostress could promote the overall damage of the roadway wall under the gas explosion load, and the gas explosion is more likely to damage the roadway wall under the high-stress condition.
( P P 0 ) ( I I 0 ) = α ( P 0 / 2 + I 0 / 2 ) β is the objective function, and the P-I curve fitting formulas of different damage grades on the roadway wall are as follows:
( P 2.45 × 10 7 ) ( I 2198.5 ) = 0.039 ( 2.45 × 10 7 / 2 + 2198.5 / 2 ) 1.5
( P 3.9 × 10 7 ) ( I 6518.3 ) = 0.039 ( 3.9 × 10 7 / 2 + 6518.3 / 2 ) 1.5
( P 4.42 × 10 7 ) ( I 18,470.1 ) = 0.039 ( 4.42 × 10 7 / 2 + 18,470.1 / 2 ) 1.5
The key parameters are shown in Table 5.
The P-I curves of the roadway wall under the conditions with geostress of 0 MPa and 20 MPa were compared, and the results are shown in Figure 9. It can be seen from Figure 9 that the distribution of the P-I curve on the roadway wall is denser without geostress. The three overpressure asymptotes are between the two damage grades of D = 0.2 and D = 0.5 on the roadway wall after geostress loading, and the impulse asymptote distribution is also denser. The density distribution of the overpressure asymptote changes after loading the geostress. The overpressure asymptote with D = 0.2 is lower, and the roadway wall damage at this grade is more likely to occur, while the overpressure asymptote with D = 0.5 and D = 0.8 is more upward. The reason is that the geostress load causes certain initial damage to the roadway wall before the explosion, so roadway wall damage of a low grade is more likely to occur. However, the critical value of explosion overpressure required to make the roadway wall reach severe damage is higher because the geostress has a blocking effect on the propagation of the explosion stress wave. After the geostress is loaded, the impulse asymptotes of the D = 0.5 damage grade are very close to each other, and the difference in I0 is not large, but the distribution of the other two impulse asymptotes is more dispersed. The growth rates of I0 are v 0.2 0.5 = 14,399 v 0.5 0.8 = 39,839, which are 1.6 times and 2.6 times the growth rate of I0 without geostress.

4.2. P-I Curve in Different Geostress States

The P-I curves of the roadway wall under the conditions with geostress of 0 MPa and 20 MPa were obtained in Section 4.1. On this basis, the general fitting formula of the P-I curve of the roadway wall under the conditions of 0–20 MPa geostress is studied in this section.

4.2.1. P-I Curve of Roadway Wall under Geostress of 10 MPa

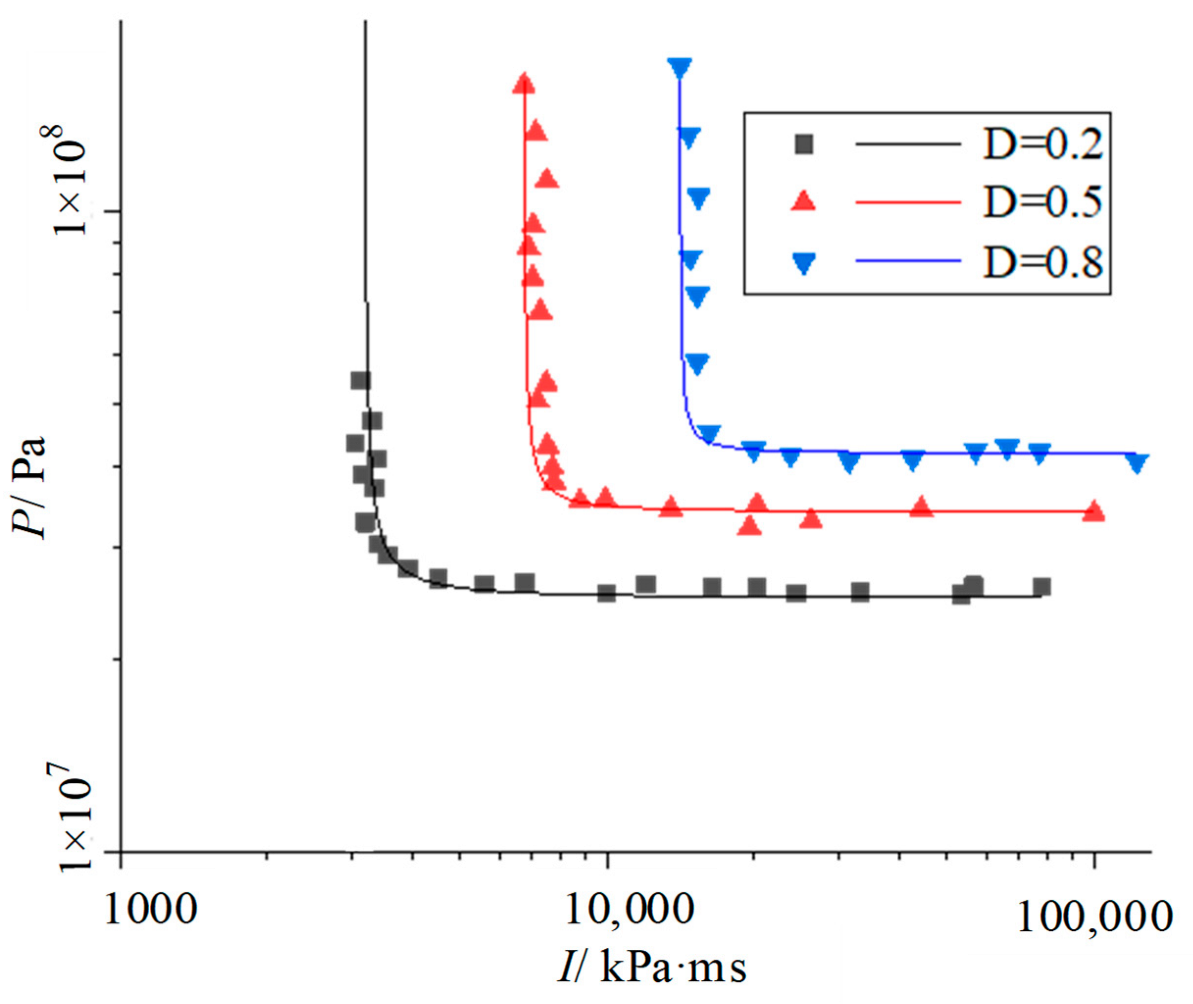
The value of 10 MPa is typical, in the middle of 0–20 MPa. In this section, the P-I curve of the roadway wall under 10 MPa geostress is first determined, as shown in Figure 10.
The fitting formulas for different damage grades are as follows:
( P 2.50 × 10 7 ) ( I 3169.2 ) = 0.039 ( 2.50 × 10 7 / 2 + 3169.2 / 2 ) 1.5
( P 3.40 × 10 7 ) ( I 6728.3 ) = 0.039 ( 3.40 × 10 7 / 2 + 6728.3 / 2 ) 1.5
( P 4.20 × 10 7 ) ( I 14,068.4 ) = 0.039 ( 4.20 × 10 7 / 2 + 14,068.4 / 2 ) 1.5
The key parameters are shown in Table 6. It can be seen that the fitting parameter values P0 and I0 of each damage degree with 10 MPa geostress are between the fitting parameter values corresponding to 0 MPa and 20 MPa.

4.2.2. Prediction of P-I Curve of Roadway Wall under Different Geostress Conditions

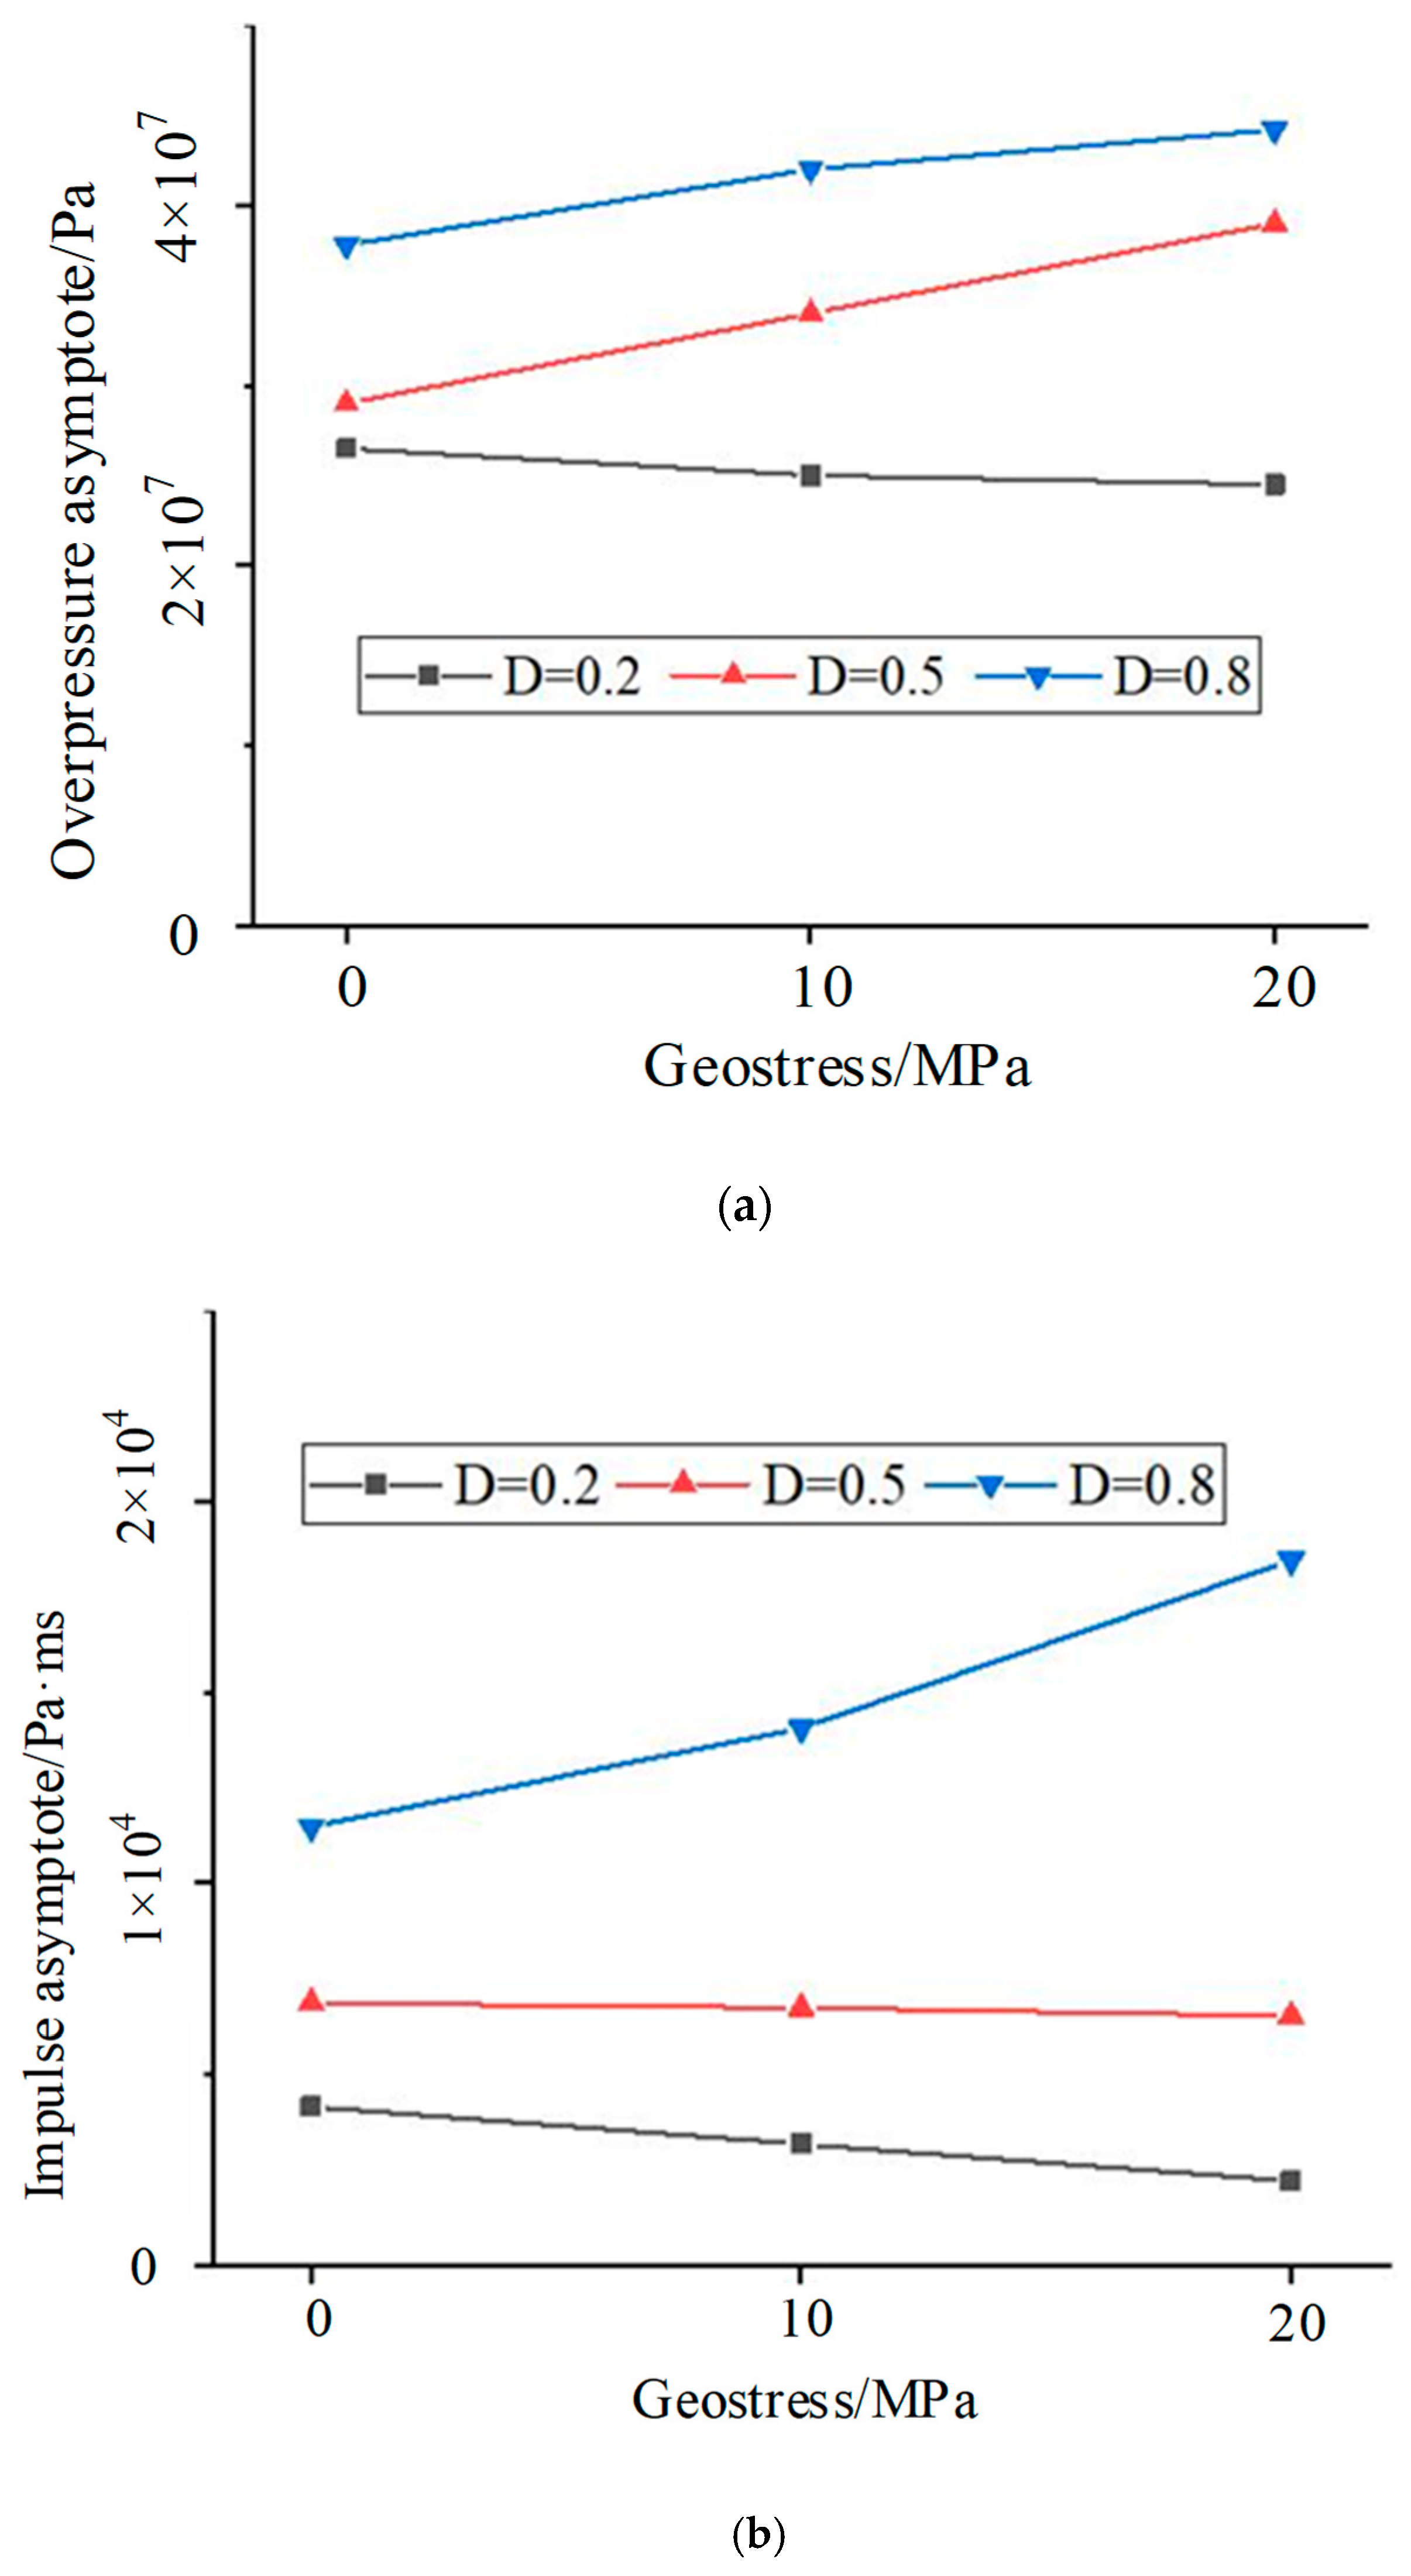
The shape of the P-I curve of the roadway wall is similar under different geostress conditions. The difference mainly lies in the difference of P0 and I0. The P0 and I0 values of each damage degree were compared, and the results are shown in Figure 11. It can be seen that P0 decreases with the increase in geostress when the damage degree D = 0.2. Under the conditions of D = 0.5 and D = 0.8, P0 increases with the increase in geostress. Under the conditions of D = 0.2 and D= 0.5, I0 decreases with the increase in geostress, whereas under the condition of D = 0.8, I0 increases with the increase in geostress. The P0 and I0 of each damage grade have obvious changes with the increase in geostress. Under the same damage grades, P0 and I0 change linearly with geostress, except I0 at D = 0.8.
It was assumed that the changes inP0 and I0 with the increase in geostress under the same damage grade are linear when geostress is k MPa (0≤ k ≤20), and the P0 and I0 of each damage grade are Pk and Ik, respectively. Their values can be calculated from Table 7.
When k is 10, the corresponding values of Pk are 2.55 × 10⁷, 3.40 × 10⁷, and 4.10 × 10⁷, respectively, and the corresponding values of Ik are 3177.1, 6688.1, and 14,974.4, respectively. The values of Pk and Ik were substituted into formula (9). A comparison was made with the P-I curve when the geostress is 10 MPa, as shown in Figure 12. It can be seen that the difference between the predicted fitting curve and the fitting P-I curve according to the original data is very small. The fitting degree with the original data points is also very high, which can be approximated to the P-I curve of the roadway wall when the geostress is 10 MPa.
Therefore, it can be concluded that the fitting formula of the P-I curve of the roadway wall is Formula (16) when the geostress is 0–20 MPa.
( P P k ) ( I I k ) = 0.039 ( P k / 2 + I k / 2 ) 1.5
where the geostress is k MPa (0 ≤ k ≤ 20), and the values of Pk and Ik corresponding to different damage grades can be calculated based on the formulas in Table 7.

5. Conclusions

The evaluation theory of roadway wall damage under the dynamic and static loads of a gas explosion has been analyzed. A damage analysis model of the roadway wall was established. Finally, the dynamic response of the dynamic and static loads of the gas explosion was numerically simulated. The following conclusions could be obtained.
(1) A large number of data points corresponding to different damage degrees on the roadway wall were obtained through a series of trial calculations by changing the explosion load. After filtering the data points, nonlinear curve fitting was carried out. P-I curves for assessment of the roadway wall damage caused by the gas explosion and different geostress loads were established. The critical overpressure value P0 and the critical impulse value I0 of the roadway wall corresponding to the P-I curve were obtained. The damage degree and damage range of the roadway wall were found to increase with the increase in explosion load energy.
(2) The P-I curves of the roadway wall under different geostress levels were compared. It was found that the overpressure asymptote P0 and impulse asymptote I0 show linear changes with the increase in local stress. Therefore, the mathematical expression of the roadway wall P-I curve under the condition of 0–20 MPa was obtained as Formula (16).
(3) The shapes of the P-I curves of the roadway wall were similar under different geostress conditions. The differences were mainly in the magnitudes of P0 and I0. The P0 and I0 of each damage degree varied significantly with increasing geostress. At the same damage degree, the P0 and I0 varied linearly with geostress, except for the case of I0 at D = 0.8.

Author Contributions

Conceptualization, Z.J. and Q.Y.; methodology, Z.J. and Q.Y.; software, Z.J. and H.L.; investigation, Q.Y.; writing—original draft preparation, Q.Y.; writing—review and editing, Q.Y. and Z.J. All authors have read and agreed to the published version of the manuscript.

Funding

This work received funding from the National Natural Science Foundation Project of China (52174177, 52174178), and the project was supported by the Scientific Research Fund of Hunan Provincial Education Department (20B240).

Institutional Review Board Statement

Not applicable.

Informed Consent Statement

Not applicable.

Data Availability Statement

Not applicable.

Conflicts of Interest

The authors declare no conflict of interest.

References

  1. Zhou, J.; Zhu, C.; Ren, J.; Lin, B.; Si, R.; Lu, X. Damage mechanism of roadway surrounding rock under coupling of high Pre-stress and explosion. J. China Coal Soc. 2020, 45, 319–329. [Google Scholar]
  2. Ye, Q.; Jia, Z.; Wang, H.; Pi, Y. Characteristics and control technology of gas explosion in gob of coal mines. Disaster Adv. 2013, 6, 112–118. [Google Scholar]
  3. Jiang, B.; Liu, Z.; Tang, M.; Yang, K.; Lv, P.; Lin, B. Active suppression of premixed methane/airexplosion propagation by non-premixed suppressant with nitrogen and ABCpowder in asemi-confined duct. J. Nat. Gas Sci. Eng. 2016, 29, 141–149. [Google Scholar] [CrossRef]
  4. Ye, Q.; Wang, G.G.; Jia, Z.; Zheng, C. Experimental study on the influence of wall heat effect on gas explosion and its propagation. Appl. Therm. Eng. 2017, 118, 392–397. [Google Scholar] [CrossRef]
  5. Cui, C.; Shao, H.; Jiang, S.; Zhang, X. Experimental study on gas explosion suppression by coupling CO2 to a vacuum chamber. Powder Technol. 2018, 335, 42–53. [Google Scholar] [CrossRef]
  6. Yang, Z.; Ye, Q.; Jia, Z.; Li, H. Numerical simulation of pipeline-pavement damage caused by explosion of leakage gas in buried PE pipelines. Adv. Civ. Eng. 2020, 2020, 4913984. [Google Scholar]
  7. Luo, Z.; Kang, X.; Wang, T.; Su, B.; Cheng, F.; Deng, J. Effects of an obstacle on the deflagration behavior of premixed liquefied petroleum gas-air mixtures in a closed duct. Energy 2021, 234, 121291. [Google Scholar] [CrossRef]
  8. Gao, K.; Liu, Z.; Wu, C.; Li, J.; Liu, K.; Liu, Y.; Li, S. Effect of low gas concentration in underground return tunnels on characteristics of gas Explosions. Process Saf. Environ. Prot. 2021, 152, 679–691. [Google Scholar] [CrossRef]
  9. Jiang, B.-Y.; Lin, B.-Q.; Shi, S.-L.; Zhu, C.-J.; Ning, J. Numerical simulation on the influences of initial temperature and initial pressure on attenuation characteristics and safety distance of gas explosion. Combustion. Sci. Technol. 2012, 184, 135–150. [Google Scholar] [CrossRef]
  10. Sun, J.; Li, G.; Lu, Y. Equivalent Single degree of freedom model of SRC columns under blast Loading. J. Vib. Shock. 2007, 26, 82–89. [Google Scholar]
  11. Sun, J.Y. Research on the Characteristics of SRC Columns Subjected to Blast Loading; Tongji University: Shanghai, China, 2006. [Google Scholar]
  12. Wei, J.; Jian, D.; Yin, L. Study on constitutive model of rock damage based on lognormal distribution. Chin. J. Undergr. Space Eng. 2010, 6, 1190–1194. [Google Scholar]
  13. Ye, Q.; Jia, Z.; Zheng, C. Study on hydraulic-controlled blasting technology for pressure relief and permeability improvement in a deep hole. J. Pet. Sci. Eng. 2017, 159, 433–442. [Google Scholar] [CrossRef]
  14. Yang, D.; Song, X.; Shi, Y. Failure criterion of steel columns under blast load based on maximum shear resistance. J. Beijing Univ. Technol. 2014, 8, 1151–1155. [Google Scholar]
  15. Li, Z.; Shi, Y.; Shi, X. Damage analysis and assessment of reinforced concrete slab under blast load. J. Build. Struct. 2009, 30, 60–66. [Google Scholar]
  16. Pan, J.; Chen, W.; Guo, Z.; Zhou, Z. Evaluation of fire and blast-damaged RPC-FST column based on pressure-impulse diagram. Prot. Eng. 2018, 5, 16–26. [Google Scholar]
  17. Wei, W. Study on Damage Effect and Evaluation Method of Reinforced Concrete Members under Explosion Load; University of National Defense Science and Technology: Changsha, China, 2012. [Google Scholar]
  18. Tian, Z.; Zhang, J.; Jiang, S. Damage assessment for steel-concrete composite beams subjected to blast loading. J. Vib. Shock. 2016, 35, 42–48. [Google Scholar]
  19. Shi, J.; Zhu, Y.; Chen, G.; Fu, J.; Liu, S. Assessment of blast resistance capacities of corrugated blast walls based on the P-I Model. J. Vib. Shock. 2017, 36, 188–195. [Google Scholar] [CrossRef]
  20. Li, T. Dynamic Response and Damage Assessment of Reinforced Concrete Slabs under Explosive Loading; Chang’an University: Xi’an, China, 2012. [Google Scholar]
  21. Dragos, J.; Wu, C.Q. Single-Degree-of-Freedom Approach to incorporate axial load effects on pressure impulse curves for steel columns. J. Eng. Mech. 2014, 141, 04014098. [Google Scholar] [CrossRef]
  22. Ye, C. Study on Damage and Continuous Collapse of Steel Structures under Combined Action of Explosion and Secondary Fire; Tianjin University: Tianjin, China, 2016. [Google Scholar]
  23. Soh, T.B.; Krauthammer, T. Load-Impulse Diagrams of Reinforced Concrete Beams Subjected to Concentrated Transient Loading. Ph.D. Thesis, Protective Technology Center, Pennsylvania State University, State College, PA, USA, 2004. [Google Scholar]
  24. Wu, S. Study on Dynamic Response of Composite Concrete Filled Steel Tubular Columns under Explosive Loading; Chang’an University: Xi’an, China, 2012. [Google Scholar]
  25. Mutalib, A.A.; Hao, H. Development of P-I diagrams for columns. Int. J. Impact Eng. 2011, 38, 290–304. [Google Scholar] [CrossRef]
  26. Yan, Q.; Du, X. Damage evaluation for a column of a typical subway station subjectedto internal blast loading. J. Vib. Shock. 2017, 36, 1–7. [Google Scholar]
  27. Chen, J.; Gao, K.; Sun, A. Simplified calculation method for pressure-impulse curve of a structure under blast load. J. Vib. Shock. 2016, 35, 224–232. [Google Scholar] [CrossRef]
  28. Livermore Software Technology Corporation (LSTC). LS-DYNA Keyword User’s Manual R9.0; Livermore Software Technology Corporation (LSTC): Livermore, CA, USA, 2016. [Google Scholar]
  29. Xu, H.; Wen, H.M. A computational constitutive model for concrete subjected to dynamic loadings. Int. J. Impact Eng. 2016, 91, 45–55. [Google Scholar] [CrossRef]
  30. Lu, X. Study on Damage and Failure Mechanism of Roadway under Coupling Action of Gas Explosion Load and High Stress; China University of Mining and Technology: Xuzhou, China, 2019. [Google Scholar]
  31. Cheng, P. Study on Damage Characteristics of Roadway Surrounding Rock under Dynamic and Static Load Coupling; Anhui University of Technology: Ma’anshan, China, 2016. [Google Scholar]
  32. Li, X.; Dong, Q.; Liu, T.; Luo, Y.; Zhao, H.; Huang, J. Model test study on propagation law of explosive stress wave in jointed rock mass under different ground stresses. J. Rock Mech. Eng. 2016, 35, 2188–2196. [Google Scholar]
  33. Xuan, Y. Analysis of Lateral Deflection and Damage Evaluation of Concrete Filled Steel Tubular Columns under Explosive Loading; Guangzhou University: Guangzhou, China, 2019. [Google Scholar]
  34. Wu, Y. Analysis of Dynamic Response and Continuous Collapse of Steel Frame Structure under Indoor Gas Explosion; Northeast Forestry University: Harbin, China, 2012. [Google Scholar]
  35. Shi, Y. Dynamic Response Behavior and Damage Mechanism of Reinforced Concrete Structures under Explosive Loading; Tianjin University: Tianjin, China, 2009. [Google Scholar]
  36. DL/T5389–2007; Technical Code for Construction of Rock Foundation Excavation of Hydraulic Structures. China Electric Power Press: Beijing, China, 2007.
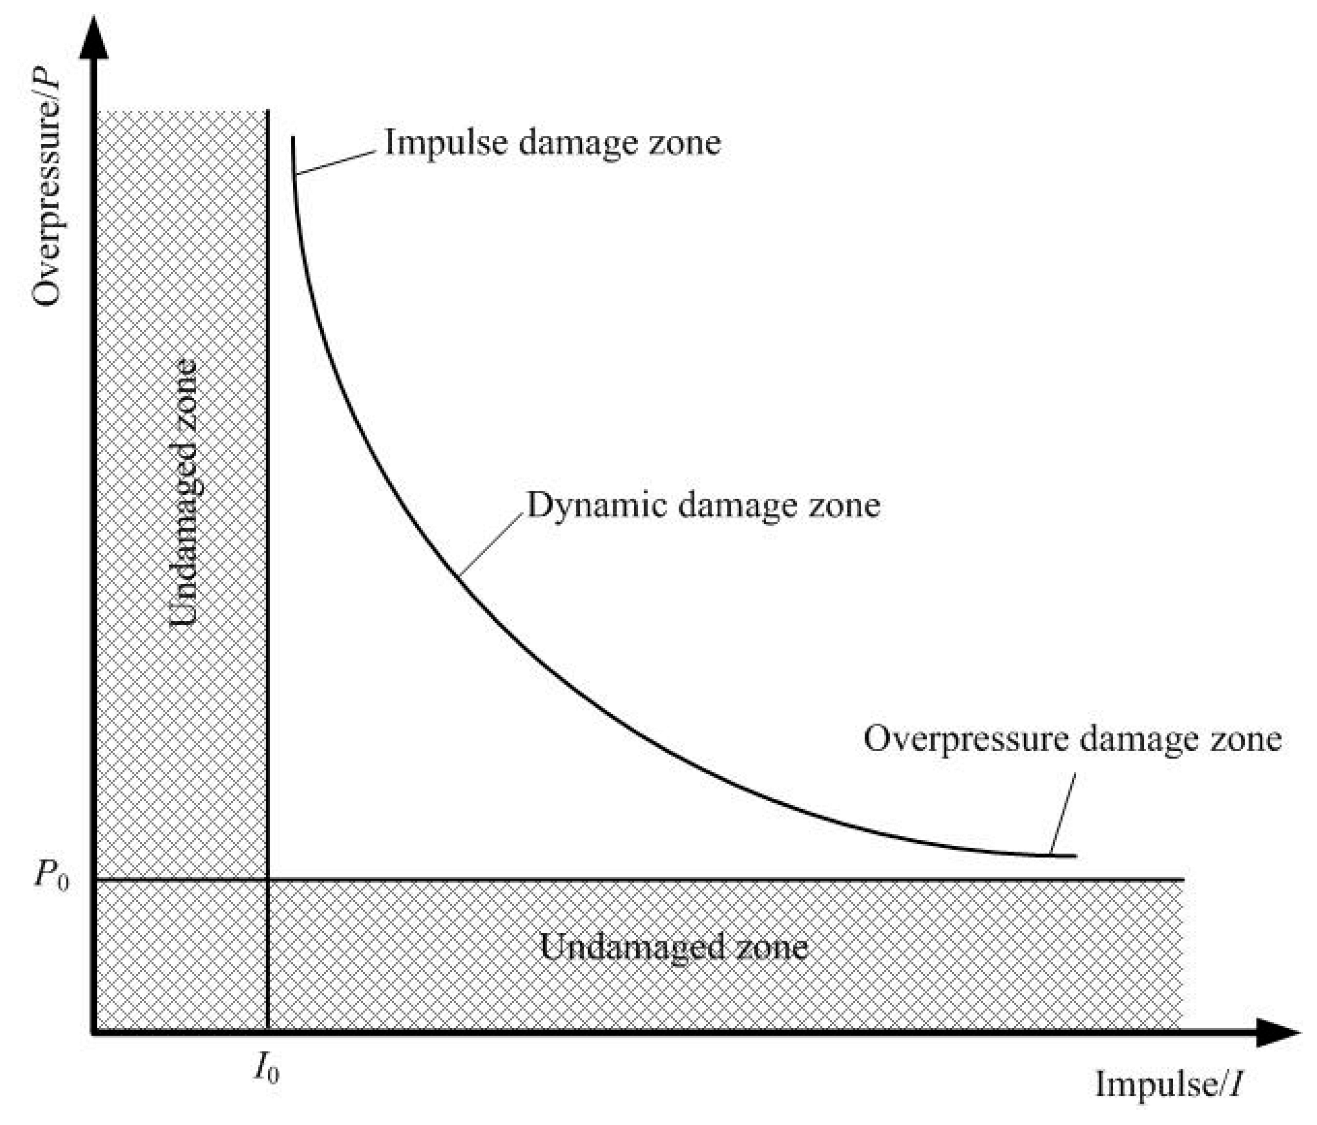
Figure 1. Schematic diagram of a P-I curve.
Processes 11 00580 g001
Figure 2. Sketch of model.
Processes 11 00580 g002
Figure 3. Grid division in finite element model.
Processes 11 00580 g003
Figure 4. Positions of measuring points. (a) Wall measuring point of roadway axis and (b) Wall measuring point of roadway section.
Processes 11 00580 g004
Figure 5. Damage of roadway wall under different explosion loads. (a) Explosion energy + 0 (b) Explosion energy + 4GJ and (c) Explosion energy + 16GJ.
Processes 11 00580 g005
Figure 6. Data points corresponding to different degrees of damage.
Processes 11 00580 g006
Figure 7. Fitting diagram of P-I curve.
Processes 11 00580 g007
Figure 8. P-I curve of roadway wall under geostress loading.
Processes 11 00580 g008
Figure 9. Influence of geostress on P-I curves.
Processes 11 00580 g009
Figure 10. P-I curves of roadway wall under 10 MPa geostress.
Processes 11 00580 g010
Figure 11. Parameters P0 and I0 under different geostresses. (a). Parameter P0 under different geostresses and (b). Parameter I0 under different geostresses.
Processes 11 00580 g011
Figure 12. P-I curves with k = 10.
Processes 11 00580 g012
Table 1. Parameters of JWL state equation.
MAT_HIGH_EXPLOSIVE_BURN
Density, ρ
(kg/m3)
Velocity, V
(m/s)
Pressure, PCJ
(Pa)
A
(Pa)
B
(Pa)
R1R2ωE
(J/m3)
V
1630693027 × 1093.71 × 10113.23 × 1094.150.950.358 × 1091
Table 2. Parameters of gas and air.
ρ (kg/m3)C0~C3C4C5C6E0 (J/m3)V0
Gas1.23400.2740.27403.4 × 1061
Air1.29000.40.402.5 × 1051
Table 3. Material parameters of surrounding rock.
Material ParametersParameter ValueMaterial ParametersParameter Value
ρ / ( k g / m 3 ) 2700 μ c 0.001
G / ( P a ) 1.486 × 10¹⁰ P l / ( P a ) 8 × 10⁸
A0.79 μ l 0.1
B1.6 K 1 / ( P a ) 8.5 × 10¹⁰
C0.007 K 2 / ( P a ) −1.71 × 10¹¹
N0.61 K 3 / ( P a ) 2.08 × 10¹¹
S max 4.8 × 10⁷ ε ˙ 0 / s 1 1
D 1 0.04 ε ˙ t , min 0.01
D 2 1 f c 4.8 × 10⁷
T / ( P a ) 4 × 10⁶ P c / ( P a ) 1.6 × 10⁷
Table 4. Fitted parameter values of three P-I curves.
D α β P 0 / Pa I 0 / KPa · ms
0.20.0391.52.65 × 1074155.6
0.52.90 × 1076857.9
0.83.78 × 10711,478.7
Table 5. Fitted parameter values of P-I curves under geostress loading.
D α β P 0 / Pa I 0 / KPa · ms
0.20.0391.52.45 × 1072198.5
0.53.9 × 1076518.3
0.84.42 × 10718,470.1
Table 6. Fitted parameter values of P-I curves under 10 MPa geostress.
D α β P 0 / Pa I 0 / KPa · ms
0.20.0391.52.50 × 1073169.2
0.53.40 × 1076728.3
0.84.20 × 10714,068.4
Table 7. The predicted values Pk and Ik under geostress of k MPa.
P k /PaD = 0.2 [ 2.45 + ( 20 k ) ( 2.65 2.45 ) 20 0 ] × 10 7 = [ 2.45 + 0.01 ( 20 k ) ] × 10 7
D = 0.5 [ 2.90 + k ( 3.90 2.90 ) 20 0 ] × 10 7 = [ 2.9 + 0.05 k ] × 10 7
D = 0.8 [ 3.78 + k ( 4.42 3.78 ) 20 0 ] × 10 7 = [ 3.78 + 0.032 k ] × 10 7
I k /KPa·msD = 0.2 2198.5 + ( 20 k ) ( 4155.6 2198.5 ) 20 0 = 2198.5 + 97.855 ( 20 k )
D = 0.5 6518.3 + ( 20 k ) ( 6857.9 6518.3 ) 20 0 = 6518.3 + 16.98 ( 20 k )
D = 0.8 11,478.7 + k ( 18,470.1 11,478.7 ) 20 0 = 11,478.7 + 349.57 k
Disclaimer/Publisher’s Note: The statements, opinions and data contained in all publications are solely those of the individual author(s) and contributor(s) and not of MDPI and/or the editor(s). MDPI and/or the editor(s) disclaim responsibility for any injury to people or property resulting from any ideas, methods, instructions or products referred to in the content.