Article

Kiwifruit Harvesting Damage Analysis and Verification

1
College of Mechanical and Electronic Engineering, Northwest A&F University, Yangling, Xianyang 712100, China
2
Key Laboratory of Agricultural Internet of Things, Ministry of Agriculture and Rural Affairs, Yangling, Xianyang 712100, China
3
Shaanxi Key Laboratory of Agricultural Information Perception and Intelligent Service, Yangling, Xianyang 712100, China
*
Author to whom correspondence should be addressed.
Processes 2023, 11(2), 598; https://doi.org/10.3390/pr11020598
Submission received: 31 December 2022 / Revised: 9 February 2023 / Accepted: 11 February 2023 / Published: 16 February 2023

Abstract

:
In order to reduce the mechanical damage during the kiwifruit picking process, the fruit rate of the picked fruit should be improved. The mechanical properties of the epidermis and interior of the fruit during the harvesting process were studied, so as to analyze the damage principle of the fruit. Firstly, a three-dimensional model of kiwifruit was constructed by point cloud scanning, and the flesh and placenta were filled in order to become a complete kiwifruit model. The elastic modulus, failure stress, and density of the kiwifruit skin, flesh, and placenta were obtained experimentally, and the material properties of the kiwifruit model were endowed with properties. Secondly, the finite element method was used to analyze the epidermis and internal stress of the kiwifruit by simulating the two processes of grabbing kiwifruit and picking to fruit boxes. The results show that the relative error of the simulation and test of the simulated grasping of kiwifruit was 6.42%, and the simulation and test of picking to fruit box confirmed the existence of damage, and the reflectivity of the damaged point in the detection was 6.18% on average, and the hardness value decreased to 8.30 kg / cm 2 on average. The results from this study can provide a reference for control strategies and damage avoidance during grasping.

1. Introduction

China is the country with the largest kiwifruit planting area and production in the world, with more than two million tons in 2020 [1]. The kiwifruit planted in Shaanxi Province is about 5.3 × 10 4 hectares, while production reaches 9.48 × 10 5 tons, which is the highest yield [2]. Kiwifruit harvesting in this region mainly relies on manual picking, which is labor-intensive, time-consuming, and labor-expensive [3]. Population aging and rising labor costs have led to a decrease in the labor available for agricultural harvesting [4]. Therefore, the mechanization and automation of kiwifruit picking and harvesting can further improve picking efficiency and reduce labor costs [5]. How to reduce the damage to kiwifruit during picking and collection is one of the focuses of harvesting robot research. The damage to the fruit during the picking process is mainly caused by the harvesting robot during the grasping process [6]. Excessive gripping force will cause damage to the extruded flesh tissue of the fruit and reduce the quality of the fruit. Less force can cause shedding, causing slipping and falling injuries to the fruit during clamping [7]. During the collection process, the fruit enters the basket along the pipe from a certain height and is damaged by gravity [8]. Therefore, understanding the epidermal and internal forces of fruits in the process of grasping and collecting is of great significance to improve the flexibility and stability of kiwifruit harvesting robots.
In order to avoid damage to kiwifruit during harvesting, it is necessary to study the cause of the damage, namely the stress changes of kiwifruit and its distribution [6]. At the same time, the size of the stress on the kiwifruit often depends on the grasping force exerted by the mechanical claw. Considering the uncertainty of the handling process and the grasping environment, different forces were applied sequentially to determine the stress changes of kiwifruit. A large number of experiments have been carried out by scholars at home and abroad to link the size and distribution of stress on fruits with fruit damage, such as the pendulum impact test, compression test, and drop test [9,10], but the above test has a low accuracy, high cost, and it is difficult to observe the change in internal stress on the fruit [11]. At present, the finite element method, as an ideal method to obtain the stress and distribution of agricultural products through computers, has been widely used in the study of stress changes and distribution under compression on potatoes, pineapples, apples, and other crops [12,13,14]. However, finite element analysis requires accurate models, and the handling process has not been considered in such studies. Therefore, in order to improve the picking efficiency and realize the lossless grasping of kiwifruit, the damage mechanism of kiwifruit was revealed by analyzing the stress changes and distribution of kiwifruit during the grasping process, which laid a foundation for the study of non-destructive picking of kiwifruit.
In order to solve the problems existing in the harvesting process, scholars have carried out many studies considering damage analysis. The progress of computer technology has promoted the development and application of the research topic, such as the discrete element method (DEM) [15] and finite element method (FEM) [16]. In order to understand the stress and strain distribution patterns of pears, Salarikia used the finite element method to simulate the process of free fall of pears onto steel and wood panel surfaces in two different ways, horizontal and vertical [17]. Han used the finite element method to analyze the horizontal collision damage sensitivity of sweet cherries [18]. Liu established an extended finite element (XFEM) model to study the cracking susceptibility of fruit peel during fruit development and postharvest treatment, which provided a new method for quantitatively predicting the cracking susceptibility of tomato peel [19]. Du used finite element simulation and high-speed camera verification to study the deformation behavior of kiwifruit under the fall situation. By comparing the solution results of the kiwifruit finite element model with a high-speed camera screen, it was found that the finite element solution results of fruit deformation under drop conditions were consistent with the visual observation results [20].
Although the above research has made great progress in fruit damage using the finite element method, there are not many analytical studies on kiwifruit damage. However, much progress has been made in determining the failure behavior of kiwi tissue (peel and flesh) when subjected to certain external forces. However, especially in terms of grasping harvest, there are few studies on kiwifruit damage under different grasping environmental conditions. Especially under the mechanical collection conditions of kiwifruit, there are few studies on grasping and collection. The reason for this is the lack of understanding of the kiwifruit picking environment and the difficulty in characterizing where kiwifruit is vulnerable to damage during the harvesting process. Secondly, in terms of finite element modeling, the establishment of the model is not perfect. The model established by Du has only two layers, peel and flesh, and does not distinguish between the peel, flesh, and placenta of kiwifruit. The overall model of kiwifruit is not accurate enough, which will lead to the inability to accurately observe the stress deformation inside the kiwifruit [20]. In view of this, in the study of kiwifruit picking damage analysis, these topics were studied: how to perform creep tests on the tissues of various parts of kiwifruit, how the tissue stress of each part of the kiwifruit changes during the process of kiwi grasping force, and whether there is damage during the collection of kiwifruit in the container and how it changes. Therefore, by establishing a three-dimensional model of kiwifruit, the epidermal and internal forces in the picking process and the harvesting process after picking were studied. The objectives of this study can be summarized as follows:
  • The finite element method was used to simulate the viscoelastic properties of kiwifruit samples.
  • Under different forces, we observed the stress–strain generated on different tissues of the sample.
  • During the packing process after picking, we observed the stress–strain generated on different tissues of the specimen.
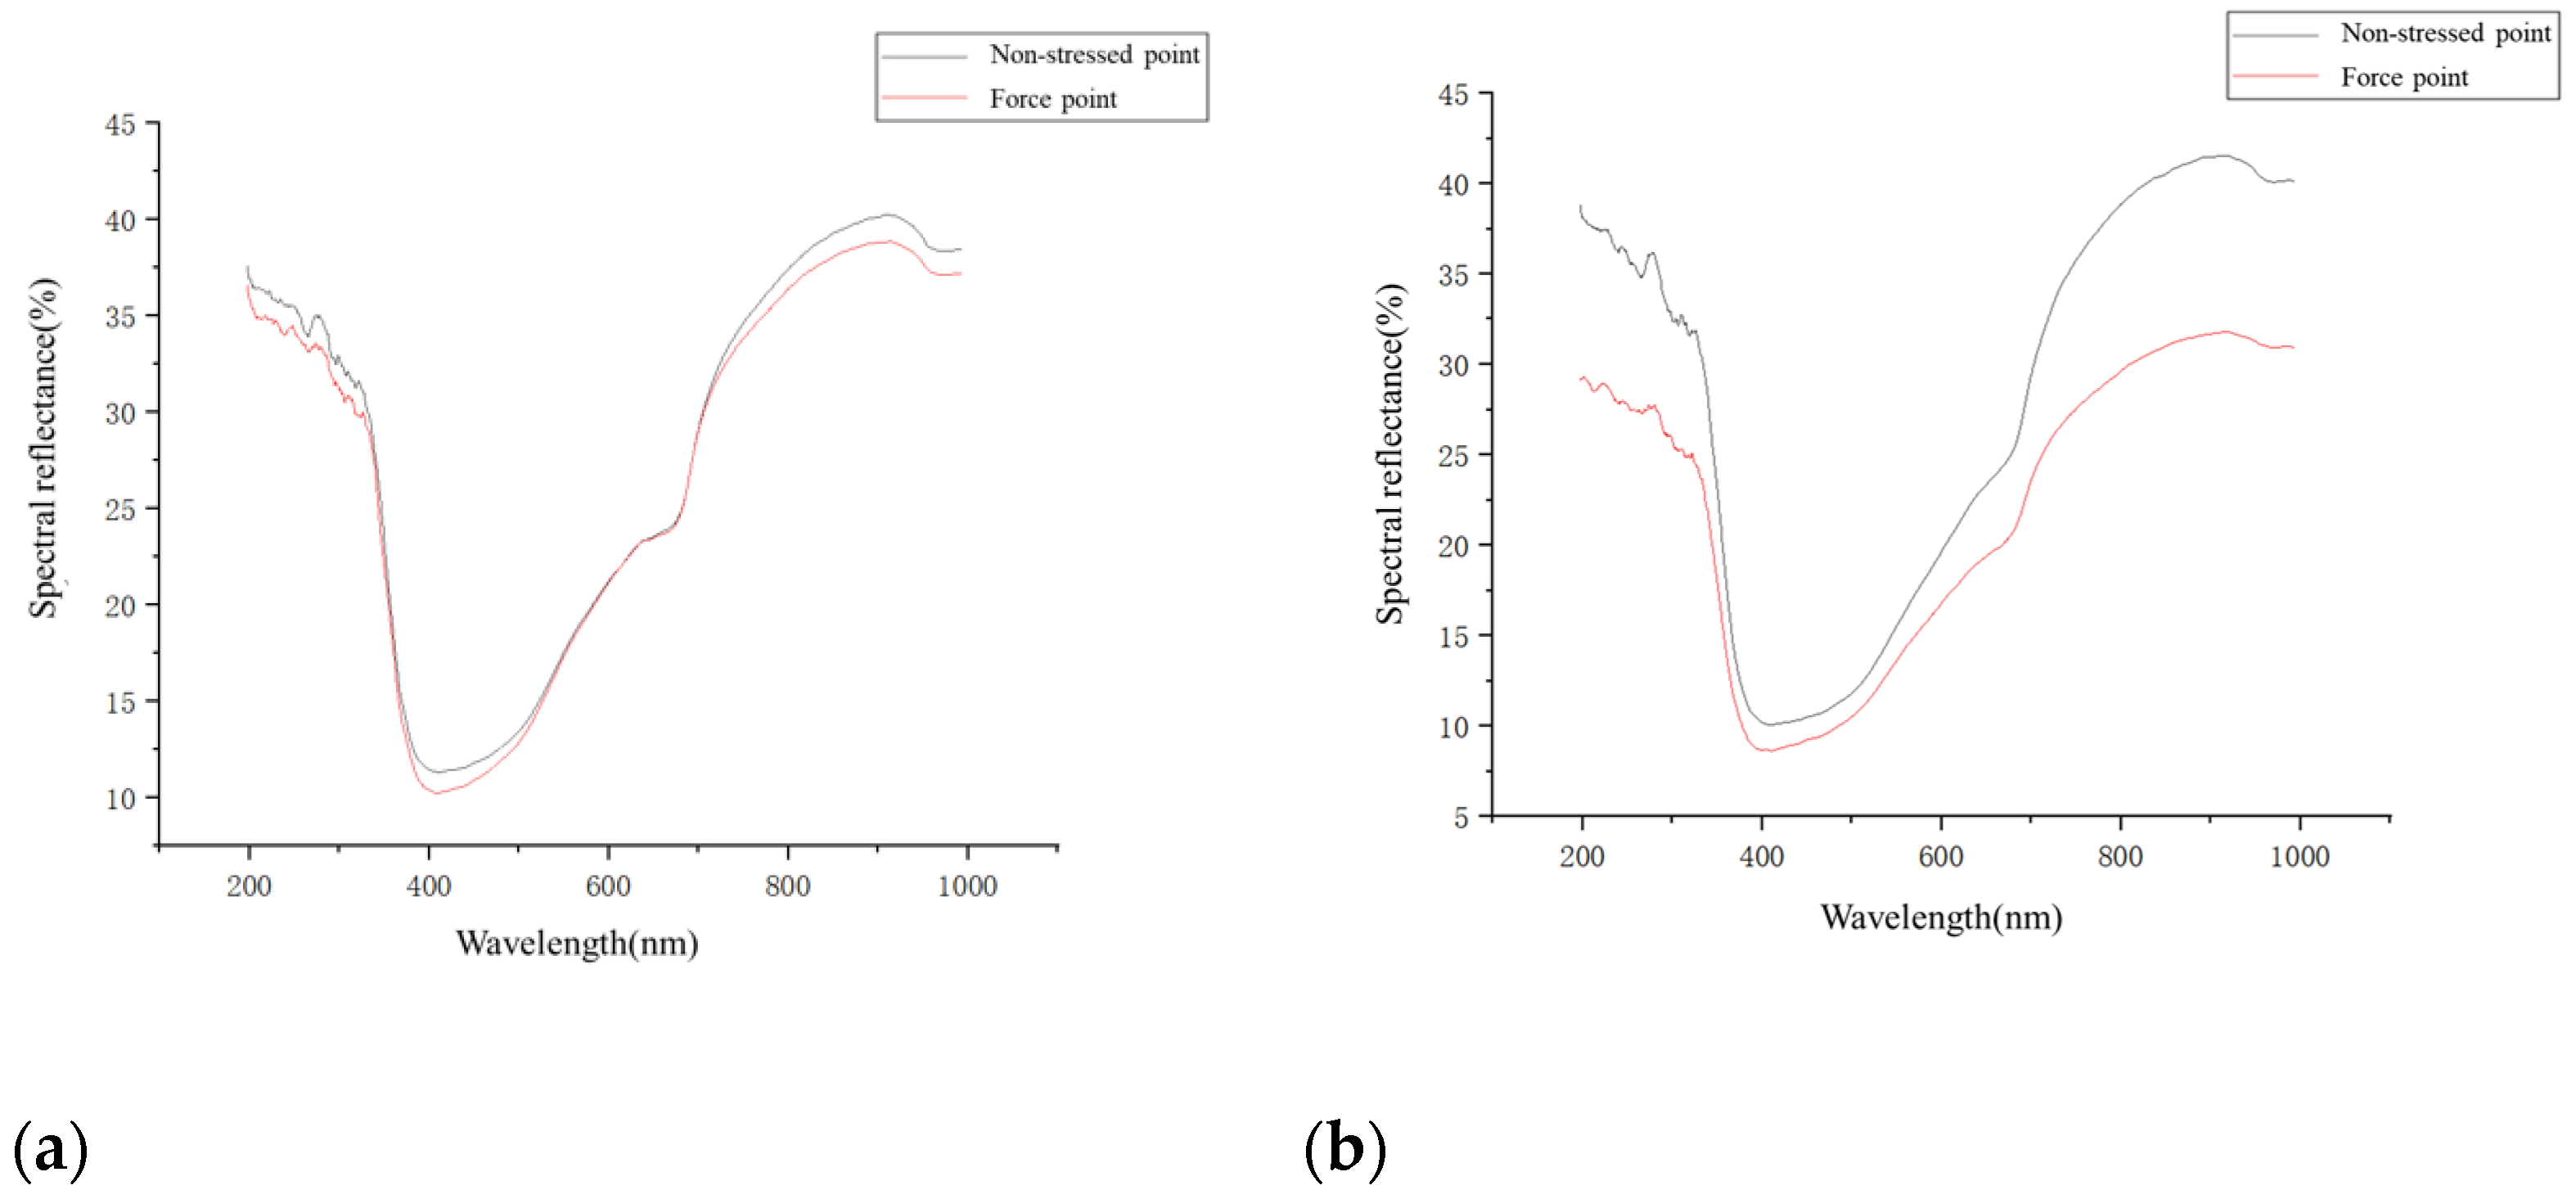
  • Comparison of laboratory results with finite element simulation results.

2. Materials and Methods
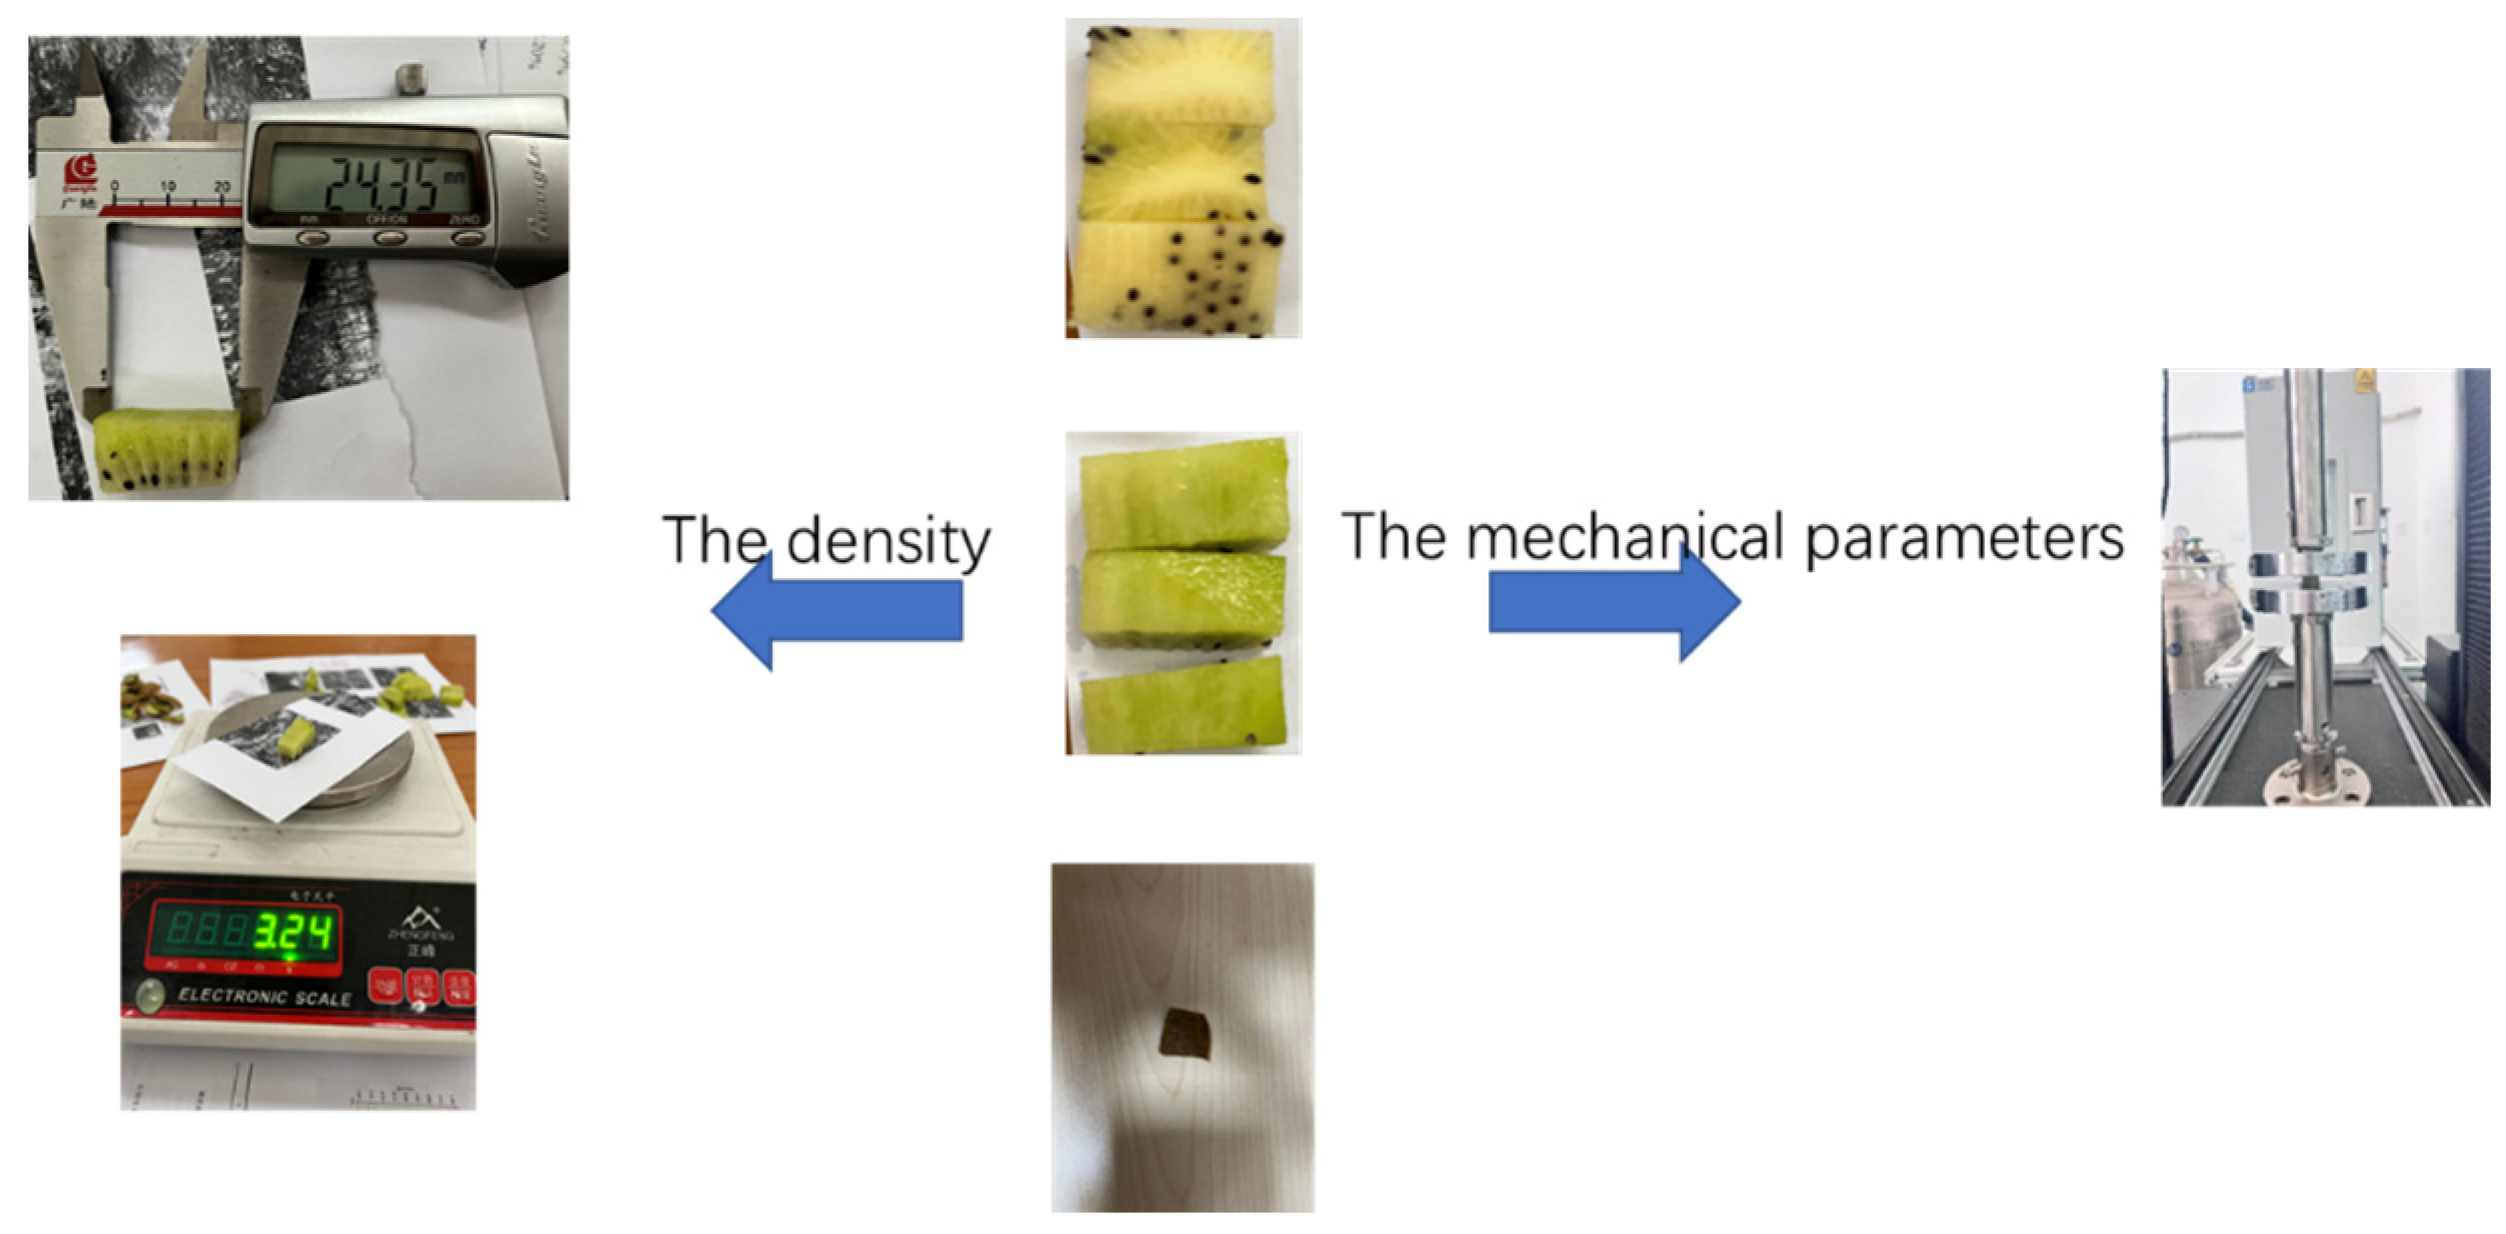
2.1. Test Materials

The most common variety “Xu Xiang”, with a more standardized shape, was selected as the research object. The “Xu Xiang” kiwifruit picked from the kiwifruit orchard in Baoji Mei County, Shaanxi Province, was selected as the test sample. Its diameter was mostly concentrated between 58~75 mm, and the mass was usually between 0.08~0.13 kg.

2.2. Experimental Designs

The mechanical properties of each part of the kiwifruit were studied. In this study, a universal testing machine (Instron 68TM-50, Instron, Norwood, MA, USA) was used for compression and tensile testing. The kiwifruit to be tested was placed in a laboratory environment for 5 h in order to adapt to the test temperature and reduce the influence of the environment on the test results. Firstly, the fruit knife cut each part of the kiwifruit tissue into equally sized slices, and each part of the tissue section was separated into 20 samples [21]. We measured the length L, width W, and height (or thickness) H of each part of the tissue with a vernier caliper, and measured the mass m with an electronic scale. This is shown in Figure 1. We used Formulas (1) and (2) to find the density ρ of the tissue of each part.
V = L × W × H
ρ = m/V
where ρ is density, m is mass, V is volume, L is length, W is width, and H is height.
The tensile test was carried out by holding both ends of the peel with the fixture of the testing machine. During the test, the loading speed was set to 1 mm/min. We recorded the corresponding stress–strain curve and test data to observe the entire stretching process of the upper and lower chucks. The compression mode of the universal testing machine was then used to compress the flesh and placenta, separately. During the test, the loading speed was set to 1 mm/min. We recorded the corresponding stress–strain curves and tested the data of the flesh and placenta. Formula (3) was used to obtain the elastic modulus and failure stress of each part of the tissue.
σ n = F n S ε n = Δ l l 0 E = σ n ε n
where σ n is the stress (Failure stress), MPa; F n is the test load, N; ε n is the strain; l 0 is the length before the specimen; ∆l is the amount of change in specimen length, mm; and E is the modulus of elasticity, MPa.

2.3. Finite Element Modeling and Simulation

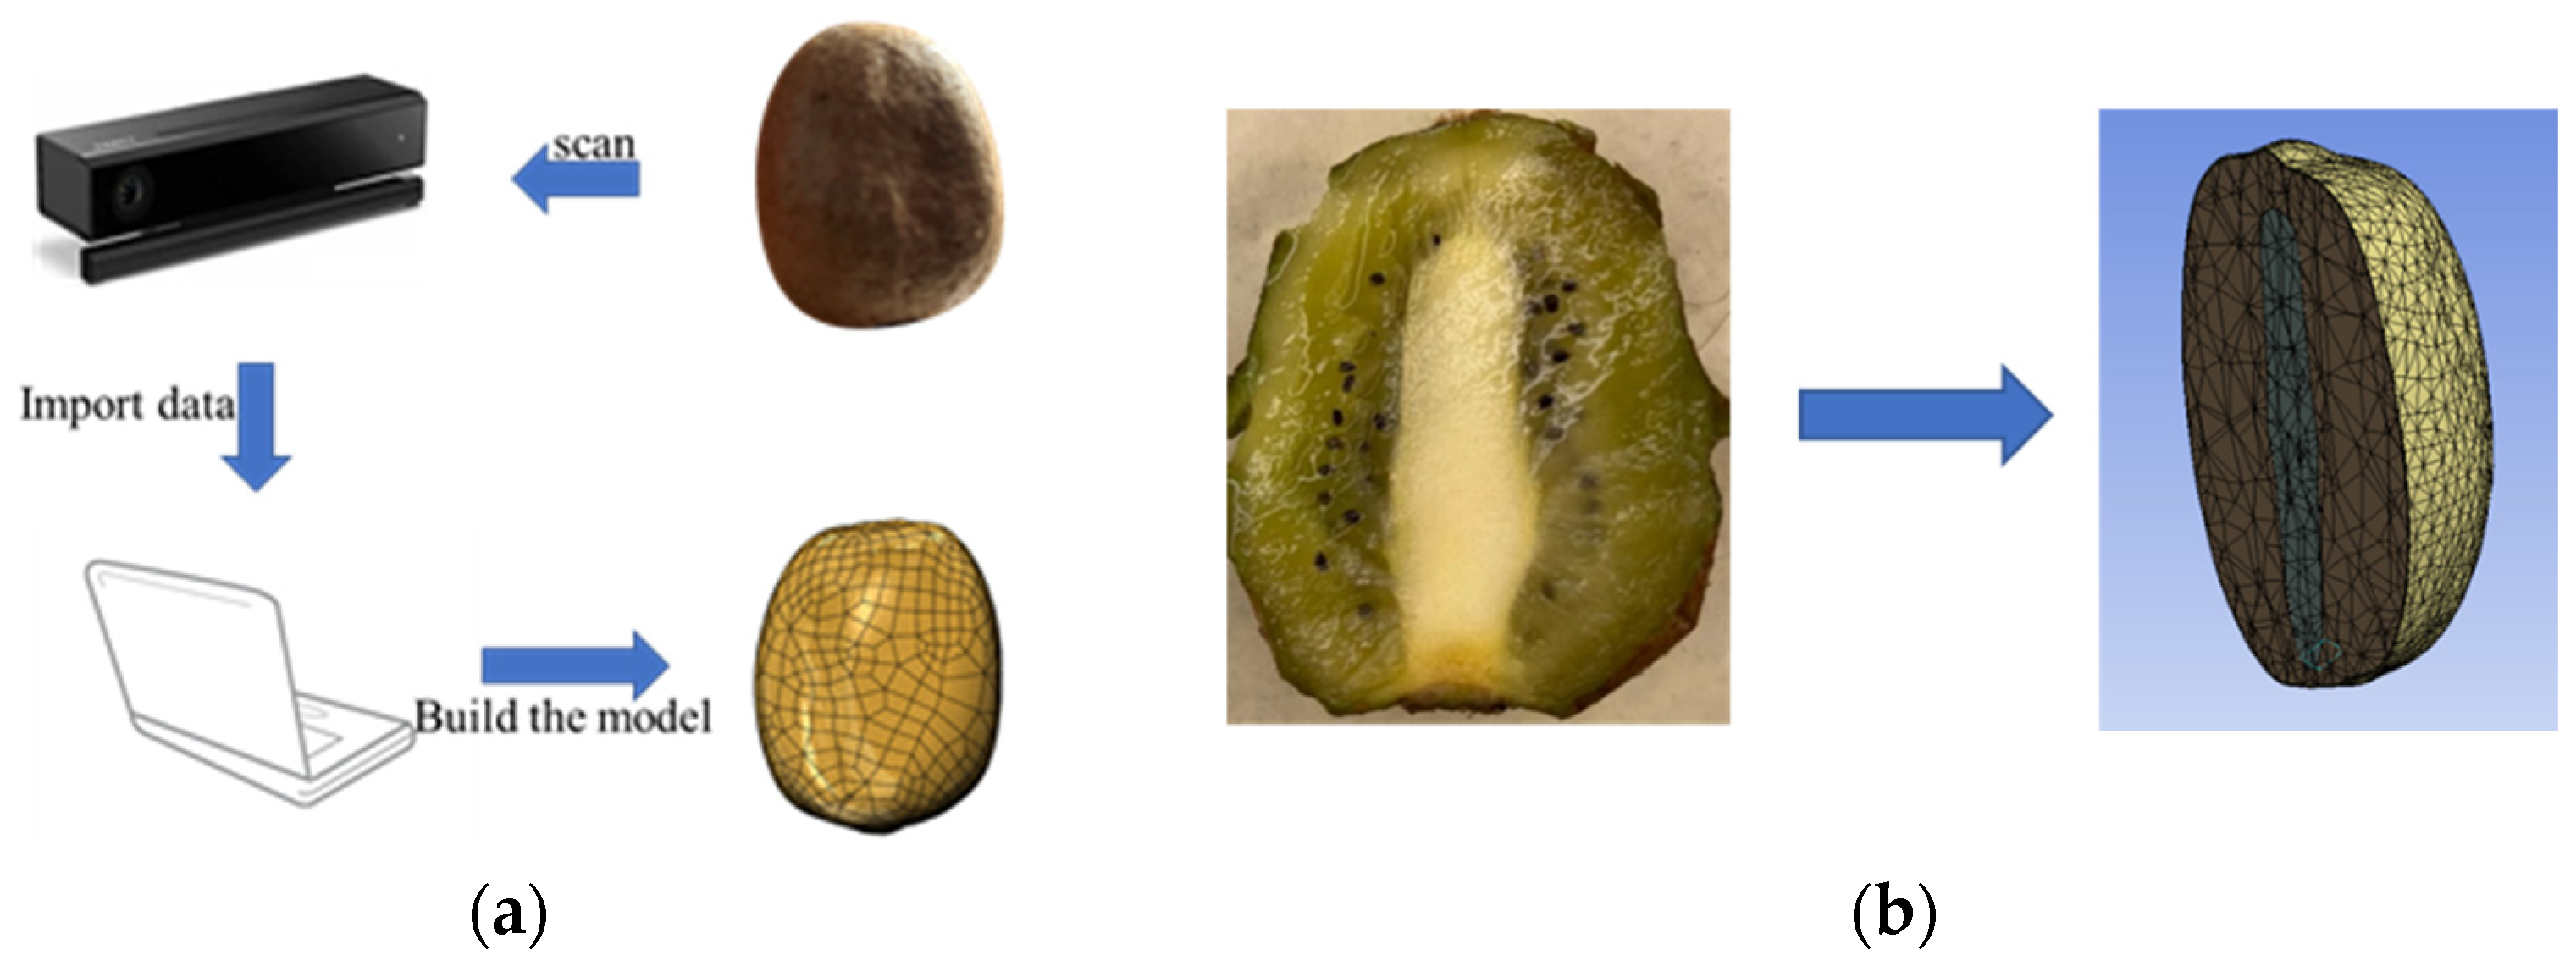
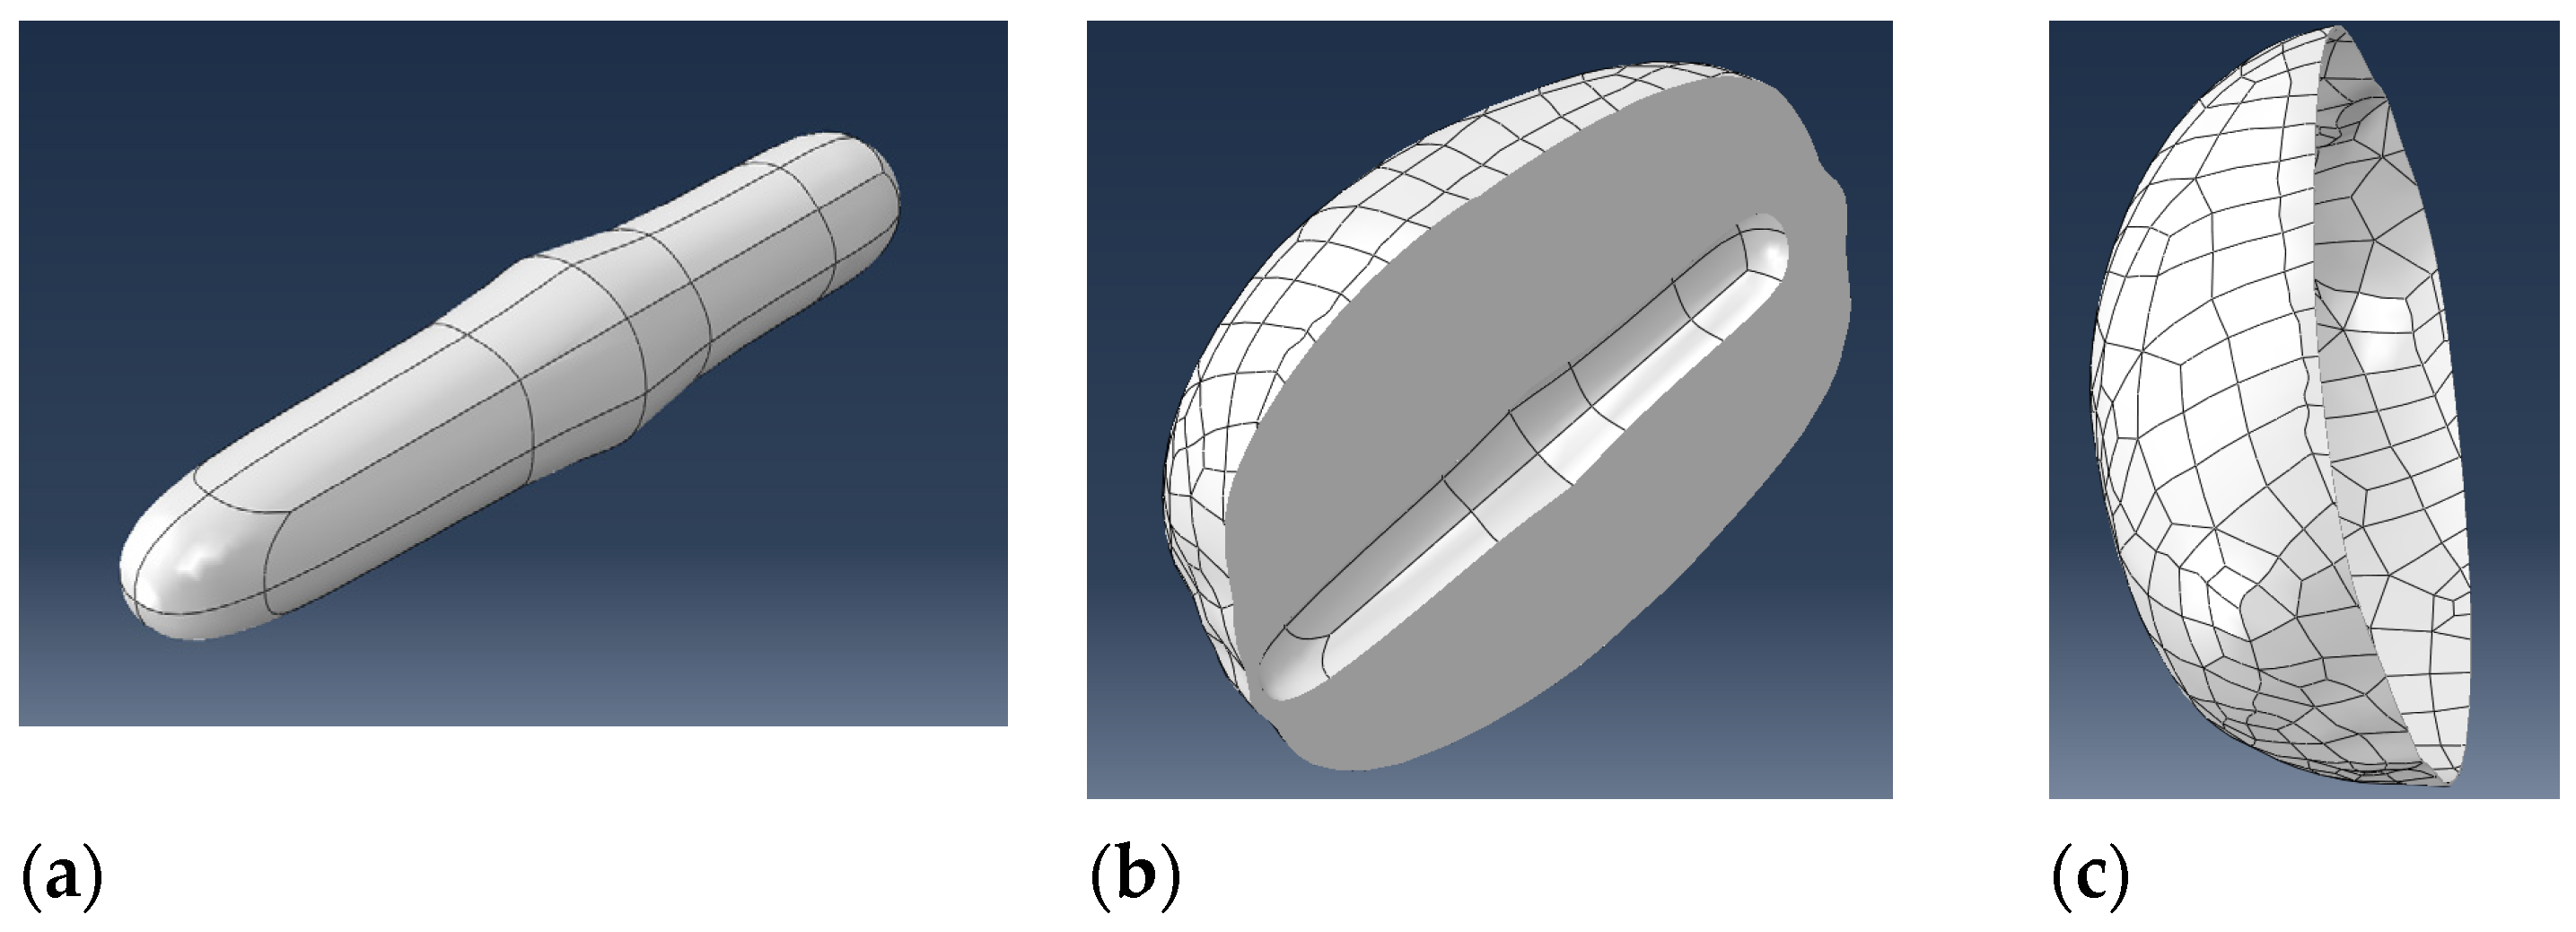
2.3.1. Kiwifruit Three-Dimensional Finite Element Model Establishment

First, the depth camera (Kinect 2.0) was used to scan the kiwifruit, measure a large amount of point cloud data on the surface of the kiwifruit, and reconstruct the generated kiwifruit point cloud data in three dimensions to form a three-dimensional model of the kiwifruit as a whole [22]. After importing the UG software, we filled and drew the internal structure of the kiwifruit according to the cut surface of the kiwifruit (as shown in Figure 2b). After the establishment of the three-dimensional model of the kiwifruit, the size of the kiwifruit (length × width × thickness) was 52.00*64.00*48.00 mm. Then, we converted the model format to .x_t format and imported it into Abaqus. This is shown in Figure 3.
The second step is the geometric modeling and material property definition of the test system. First, Abaqus2020/CAE software (Dassault Systems Simulia Corp, Waltham, MA, USA) was used to build a 3D system geometric model for simulating grabbing and packing kiwifruits after picking (Figure 4a,b). Grabbing kiwifruit models were replaced by compression simulation and experimentation. The reason for this is that compression can accurately reflect the stress–strain of kiwifruit, and the verification test can also more accurately control the control of force and the measurement of deformation. The grabbing kiwifruit model consisted of two parts: a pressure plate and a kiwifruit. The rigidity property of the pressure plate was selected, and the diameter of the pressure plate was 100 mm. In subsequent simulations, the plate was in contact with the axial surface of the kiwifruit. The pick-and-pack kiwifruit model consisted of five parts: branches, fruit stems, kiwifruit, pipe, and fruit boxes. The size of the fruit basket was 580 × 410 × 315 mm, because the material of the fruit basket was hard, so the material was defined as rigid in the simulation. The pipe was made of PE. The distance from the branches to the bottom of the basket was 900 mm. Secondly, the structure of each part of the kiwifruit was defined according to the modulus of elasticity, stress strength, and density measured in Section 2.1. Kiwifruit is mainly composed of peel, flesh and placenta, due to the different mechanical properties of different tissues of kiwifruit, fruit, so the model of kiwifruit established consisted of these three parts. The structure of each part was defined as a linear elastic material, and the same tissue part belonged to the same substance, containing the same elastic modulus, Poisson’s ratio, stress strength, and density.
The third step involved defining the interactions between the system geometry models to limit the degrees of freedom between components (sub models). First, the elastic modulus of the kiwifruit peel was greater than the modulus of elasticity of the internal tissue, so the outer surface of the peel geometry was defined as the main surface and the inner surface was defined as the secondary surface. In the grasping kiwifruit model, the contact pair algorithm was used to define the contact between the lower surface of the pressure plate and the outer surface of the kiwifruit. The contact used node-to-surface contact, which allowed each node on the outer surface of the peel to effectively interact with the points on the lower surface of the plate. The contact interaction characteristics of the master–slave surface followed the normal “hard” contact behavior, ensuring that each constraint position could not penetrate the peel and that there was no limit to the amount of contact pressure that could be transmitted when the lower surface of the plate came into contact with the outer surface of the peel. The tangential behavior followed the Coulomb friction model by means of “penalty”, which allowed for some relative motion of the surface when adhering (“elastic slip”). When the surface was attached, the sliding amplitude was limited to this elastic slip, and this condition was enforced by constantly adjusting the size of the penalty constraint. Finally, the coefficient of friction between the pressure plate and the peel was defined as 0.4 [23]. In the pick-packed kiwifruit model, a cohesive unit-based cohesive damage model between branches and fruit stems was established to simulate the process of kiwifruit separation from fruit stem breakage.
A structured mesh generation technology based on the tetrahedral element type was used to obtain a high-quality fruit finite element model mesh, due to the irregular shape of the kiwifruit fruit skin and the tissue shape of each part. There was large tissue deformation and some contact phenomena in the compression process of the fruit, so the robustness of each part of the kiwifruit was required in the simulation. The tetrahedral unit (C3D10M) with a small global size was used to mesh the tissues, and the peel flesh placenta generated 74,042, 450,830, and 29,777 units, respectively. The pressure plate adopted R3D4 units, generating a total of 37 units. The fruit basket used C3D8R cells, generating a total of 566 units. Pipelines did not need to be meshed.

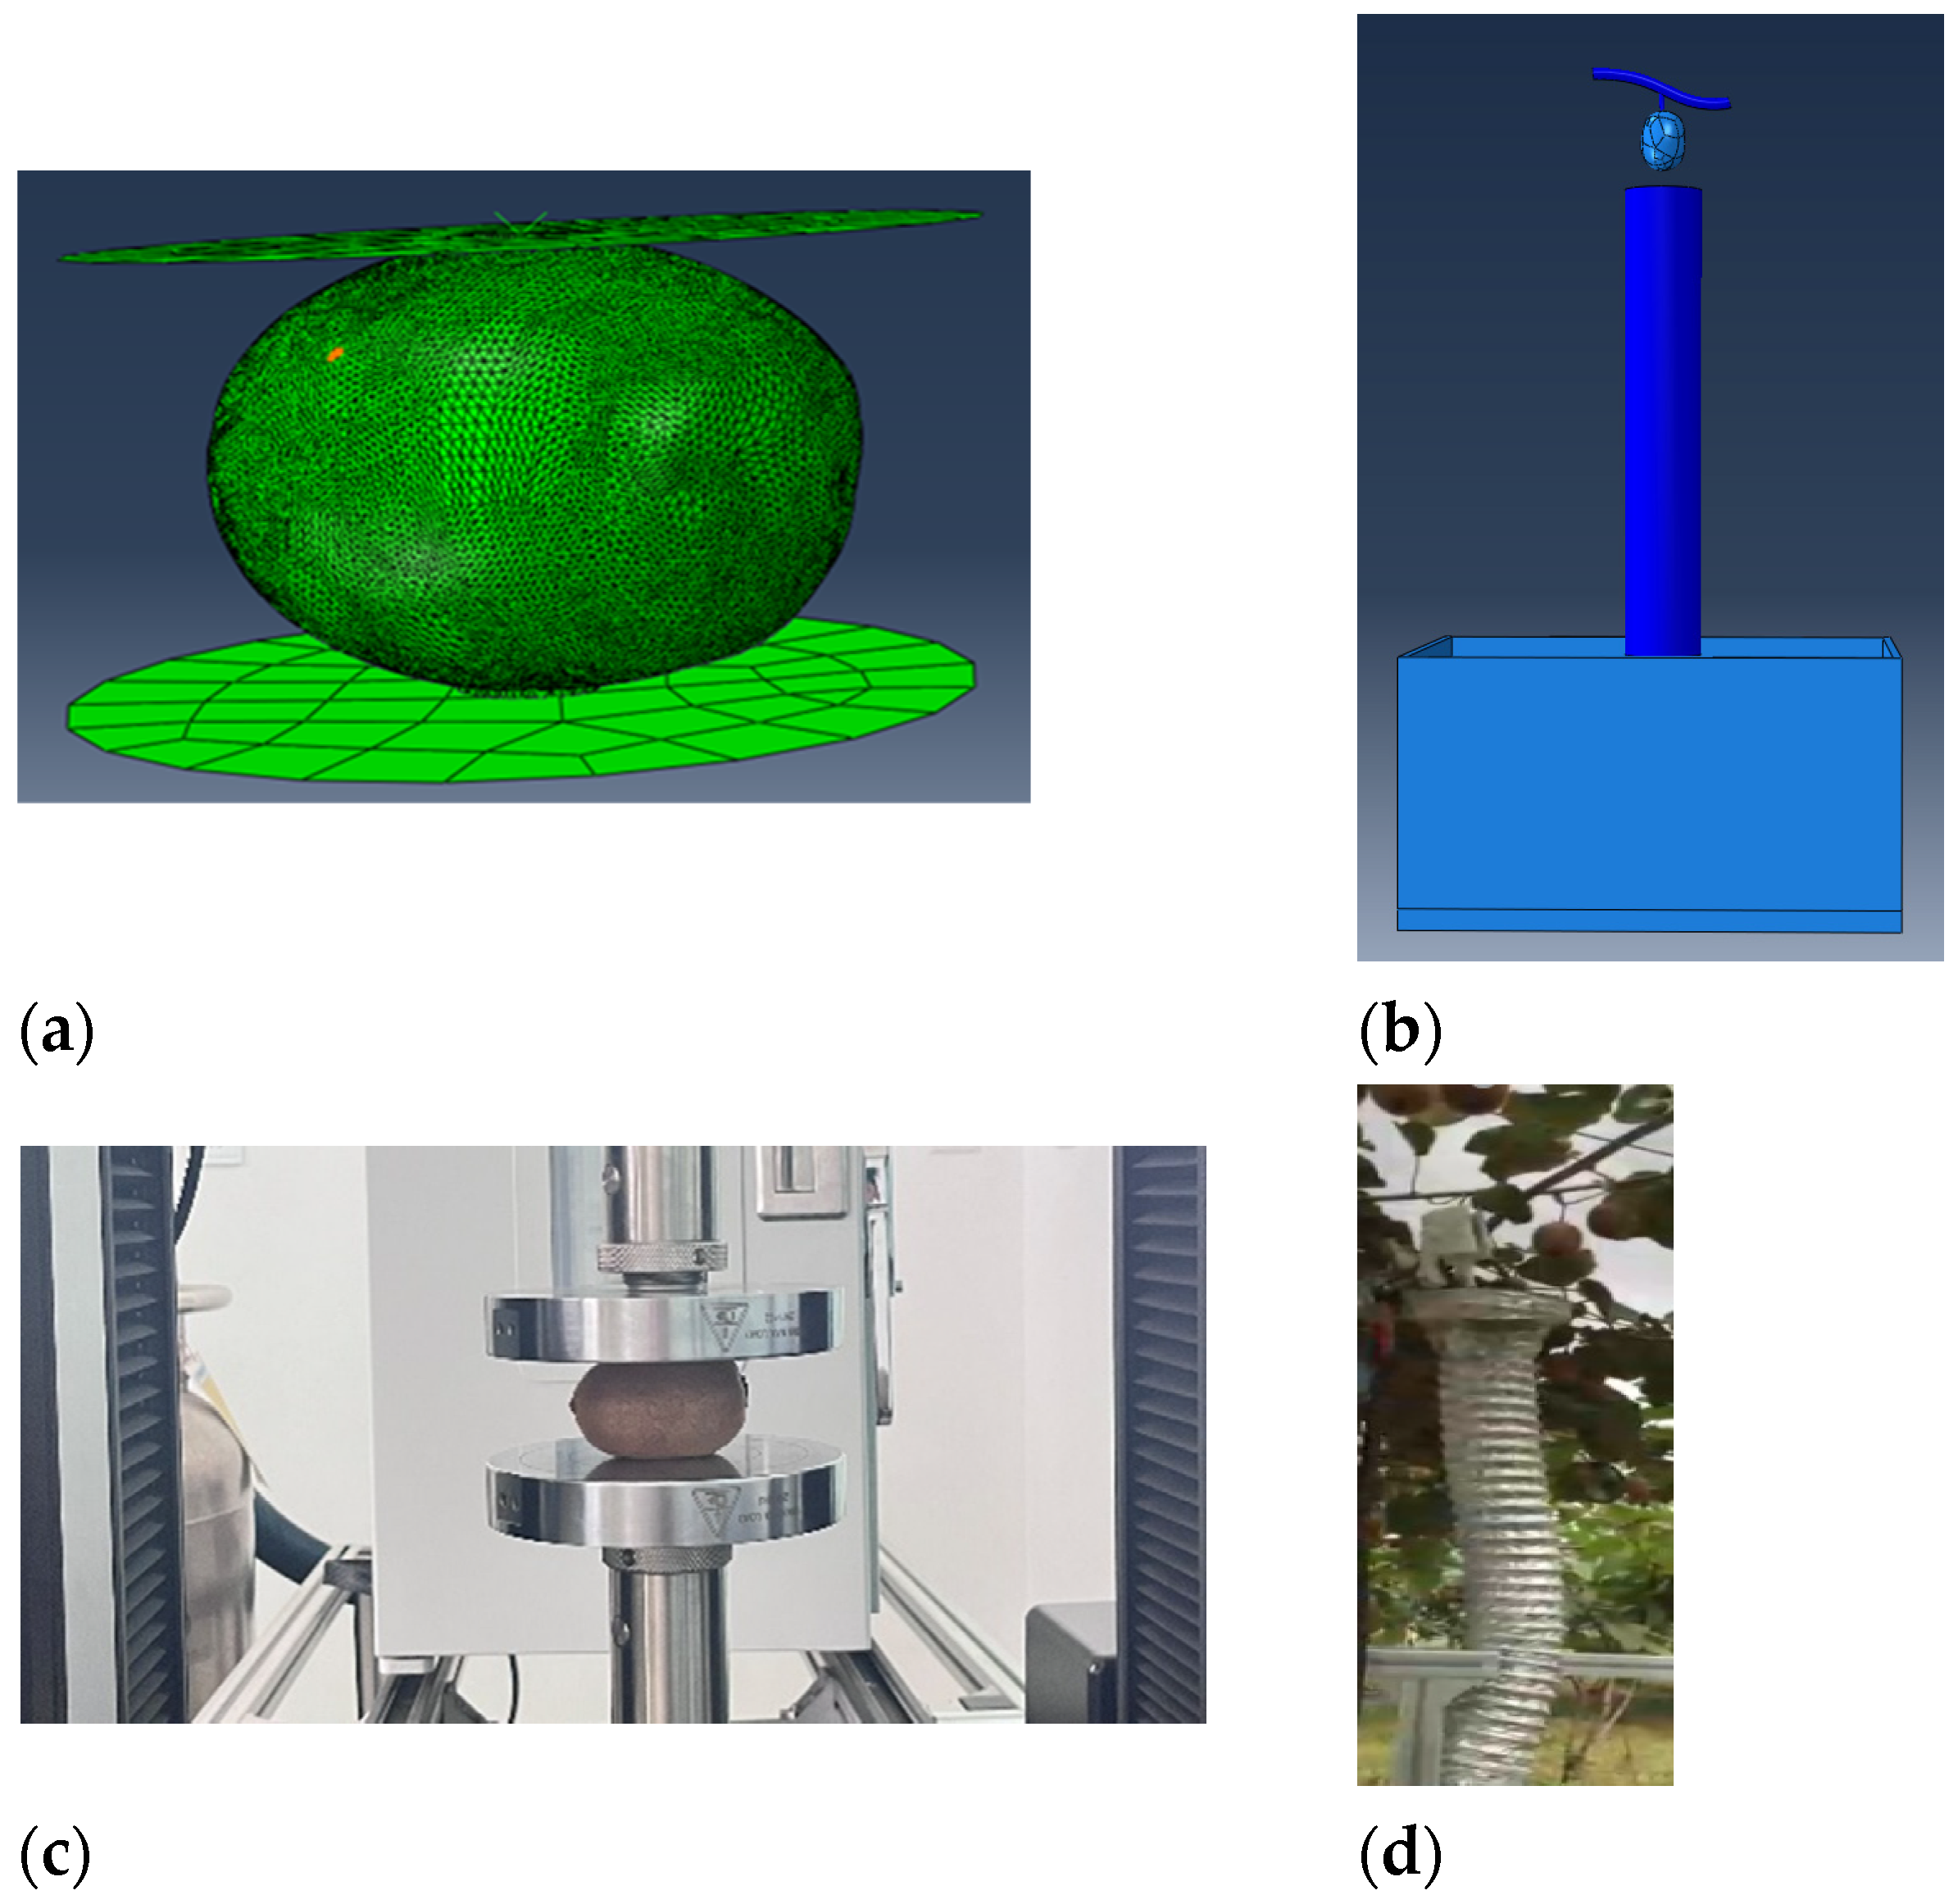
2.3.2. Kiwifruit Grabbing and Collection Simulation

In a kiwifruit grasping simulation, the force exerted on the fingers was written by Zhen Zhang on the gripping test [24]. In order to ensure the grasping stability and consider the instantaneous nature of contact, the loading force was 5, 25, 50, 100, 150, 180, and 250 N, separately, for the simulated loading test. In the container collection simulation, the actual picking method was simulated, and the simulation of the kiwifruit fruit falling to the kiwifruit basket below was obtained, as shown in Figure 4b. The simulation results were used to extract the strain parameters, internal changes of fruits, etc.

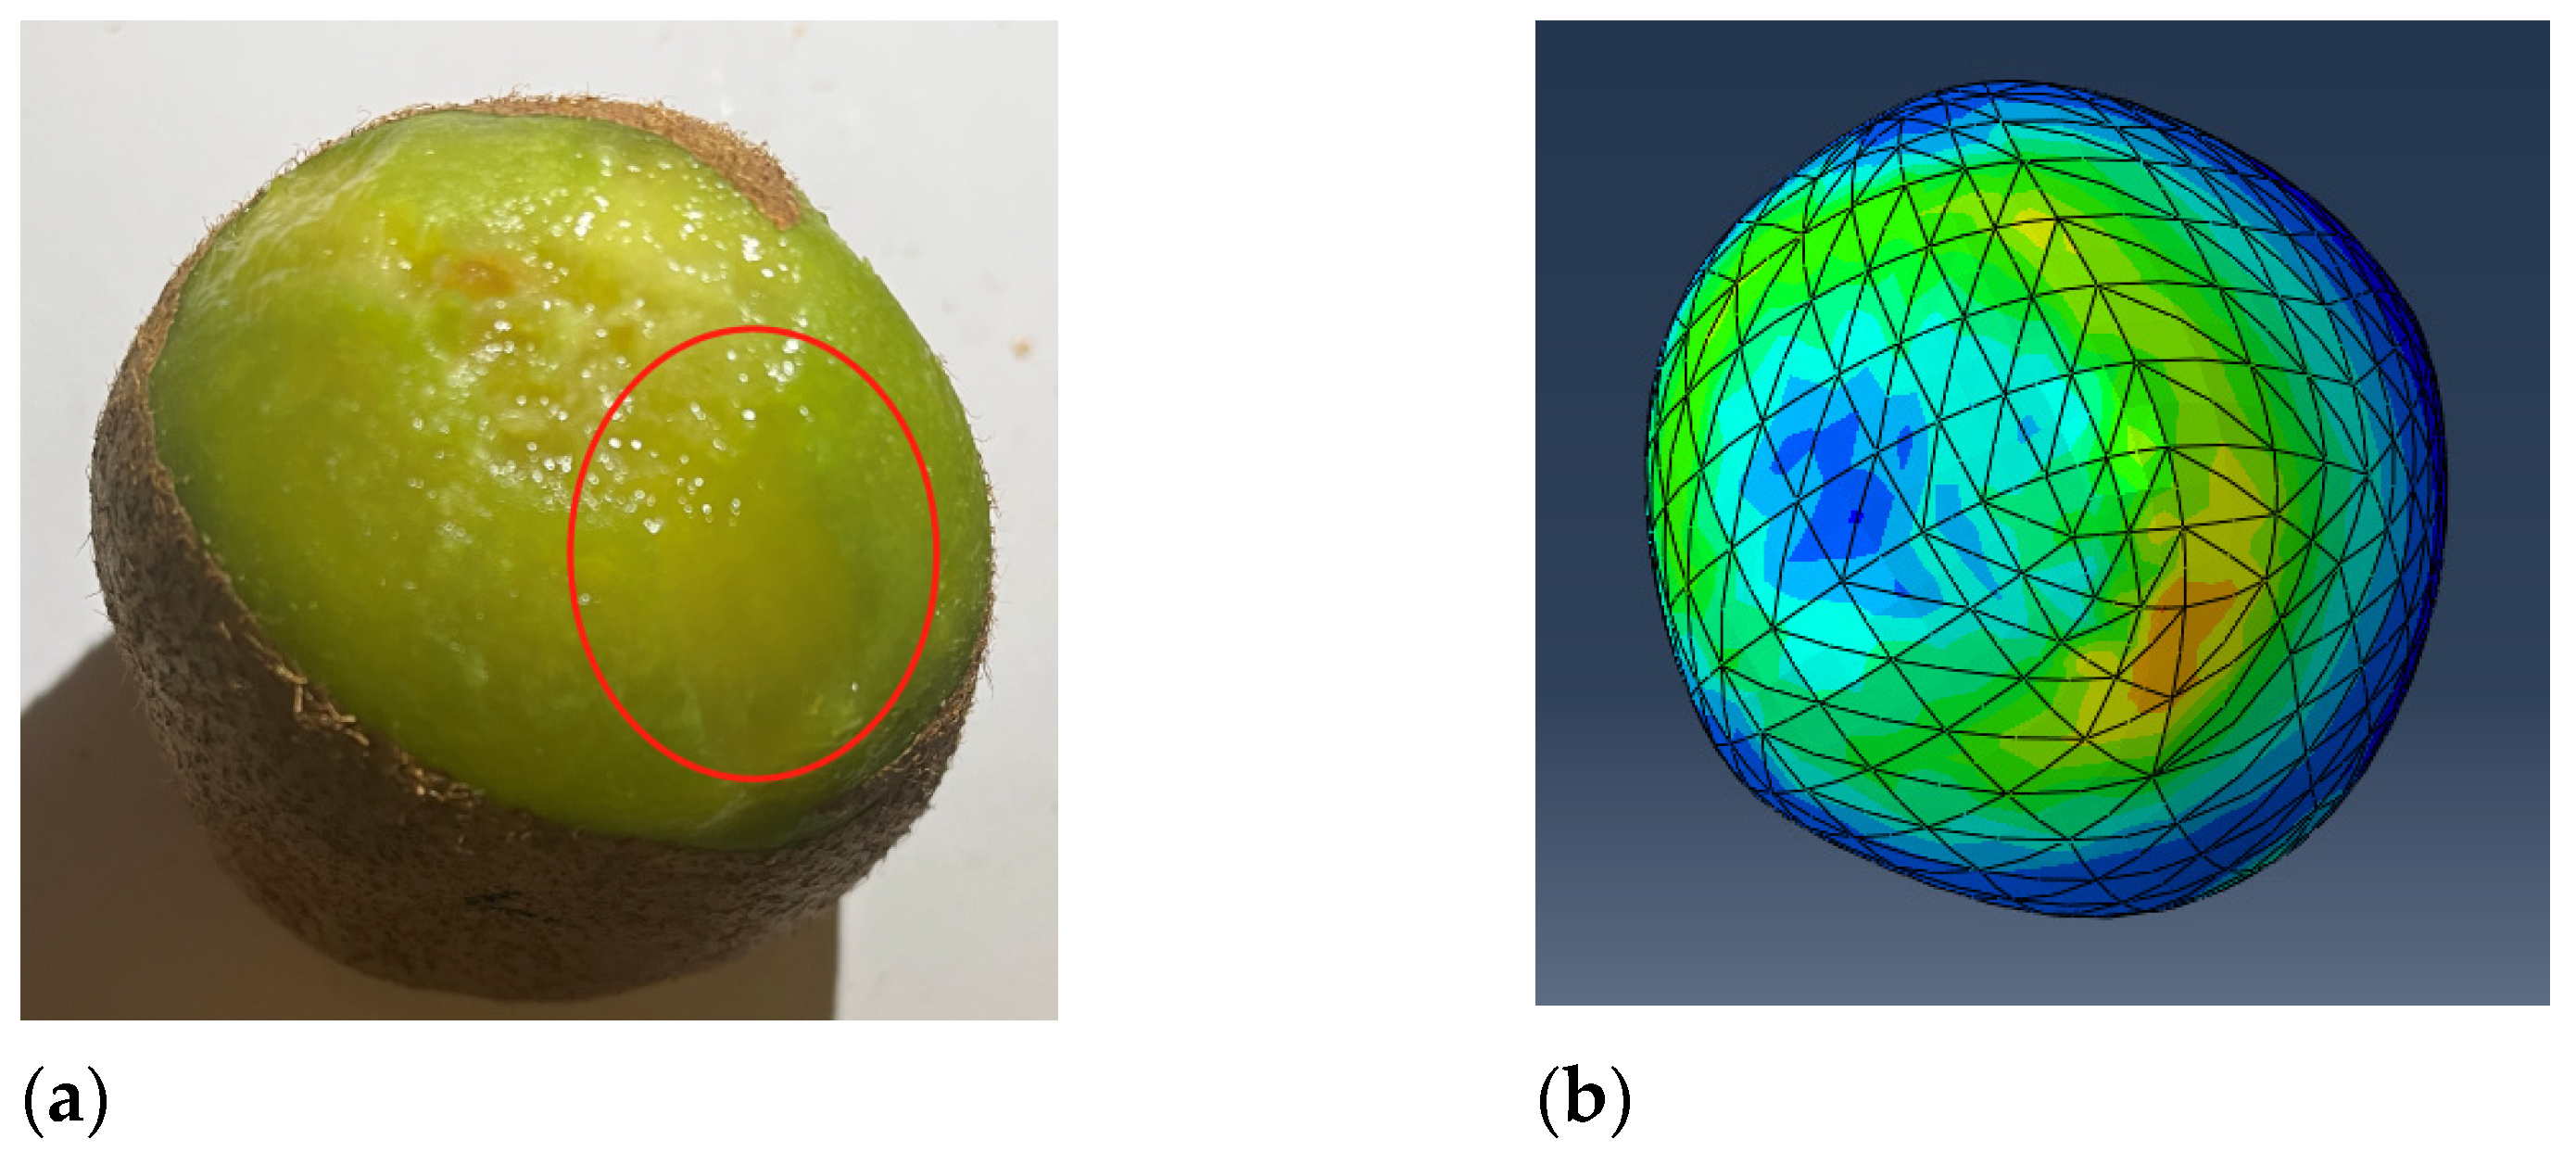
2.4. Kiwifruit Test Verification

In order to verify the accuracy of the finite element model of the 3D system of kiwifruit after grabbing and boxing, the test results of kiwifruit samples at room temperature were compared, such as the kiwifruit grabbing test and container collection test.

2.4.1. Kiwifruit Finite Element Model Validation Test

First, we verified the damage caused by the kiwifruit in actual grasping. As the mechanical claw could not monitor the grasping of force in real time, the compressive application of different forces by the universal testing machine simulated the actual situation of grasping, and the tissue stress–strain of each part of the kiwifruit fruit was analyzed, as shown in Figure 4c. We set seven groups of five kiwifruits in each group. The same force was applied to the simulation, the force value of different groups of kiwifruits gradually increased, the stable grasping lasted for about 10s, and the computer was used to calculate the shape variables of different clamping forces. In the pick-and-box test (Figure 4d), 10 kiwifruits were designed to be picked. To rule out the possibility of other injuries, sheared stems were used at the time of harvesting. We made sure that the quality of each kiwifruit was basically the same when dropped into the pipe. After falling into the fruit basket, the kiwifruit was allowed to stand at room temperature in the laboratory.
After the test, whether the kiwifruit itself was damaged needed to be further verified. Chrysanthi proposed that after mechanical damage to kiwifruit, the peel and internal tissues of kiwifruit will gradually secrete metabolites after 8 h, which will enhance fruit ripening through softening and ethylene exhalation [25]. Therefore, after the kiwifruit was damaged, a hardness test was carried out using a GY-4 fruit hardness tester (Edburg Instruments, Wenzhou, China) after standing for 72 h. At the same time, Guo et al. detected the hidden damage of kiwifruit through near-infrared [26], so a spectrometer (USB 4000-VIS–NIR, Ocean Optics, Orlando, FL, USA) was used for near-infrared detection to check the invisible damage suffered by kiwifruit. We determined the invisible damage suffered by kiwifruit and increased the verification effect of the test.

2.4.2. Statistical Analysis

MATLAB2021a was used to fit the data extracted from the simulation results. We used kiwifruit stress–strain as a potential indicator for assessing kiwifruit injury. The hardness value, the area of kiwifruit damage, and the refractive index difference of the near-infrared spectrum were used as the evaluation criteria for the simulation verification. The correlation coefficient was used to compare the correlation between kiwifruit simulation and deformation in the test.

3. Results

3.1. Kiwifruit Mechanical Parameters

Table 1 shows the parameters of the organization of each part of the kiwifruit. In this model, the elastic modulus, Poisson’s ratio, failure stress, and density of peel tissue were 11.2 MPa, 0.3, 1.51 MPa, and 0.551 g / cm 3 , respectively. The elastic modulus, Poisson’s ratio, failure stress, and density of the flesh tissues were 2.22 MPa, 0.3, 0.45 MPa, and 1.122 g / cm 3 , respectively. The elastic modulus, Poisson’s ratio, failure stress, and density of peel tissue were 4.17 MPa, 0.3, 1.60 MPa, and 1.063 g / cm 3 , respectively.

3.2. Simulation and Results Analysis

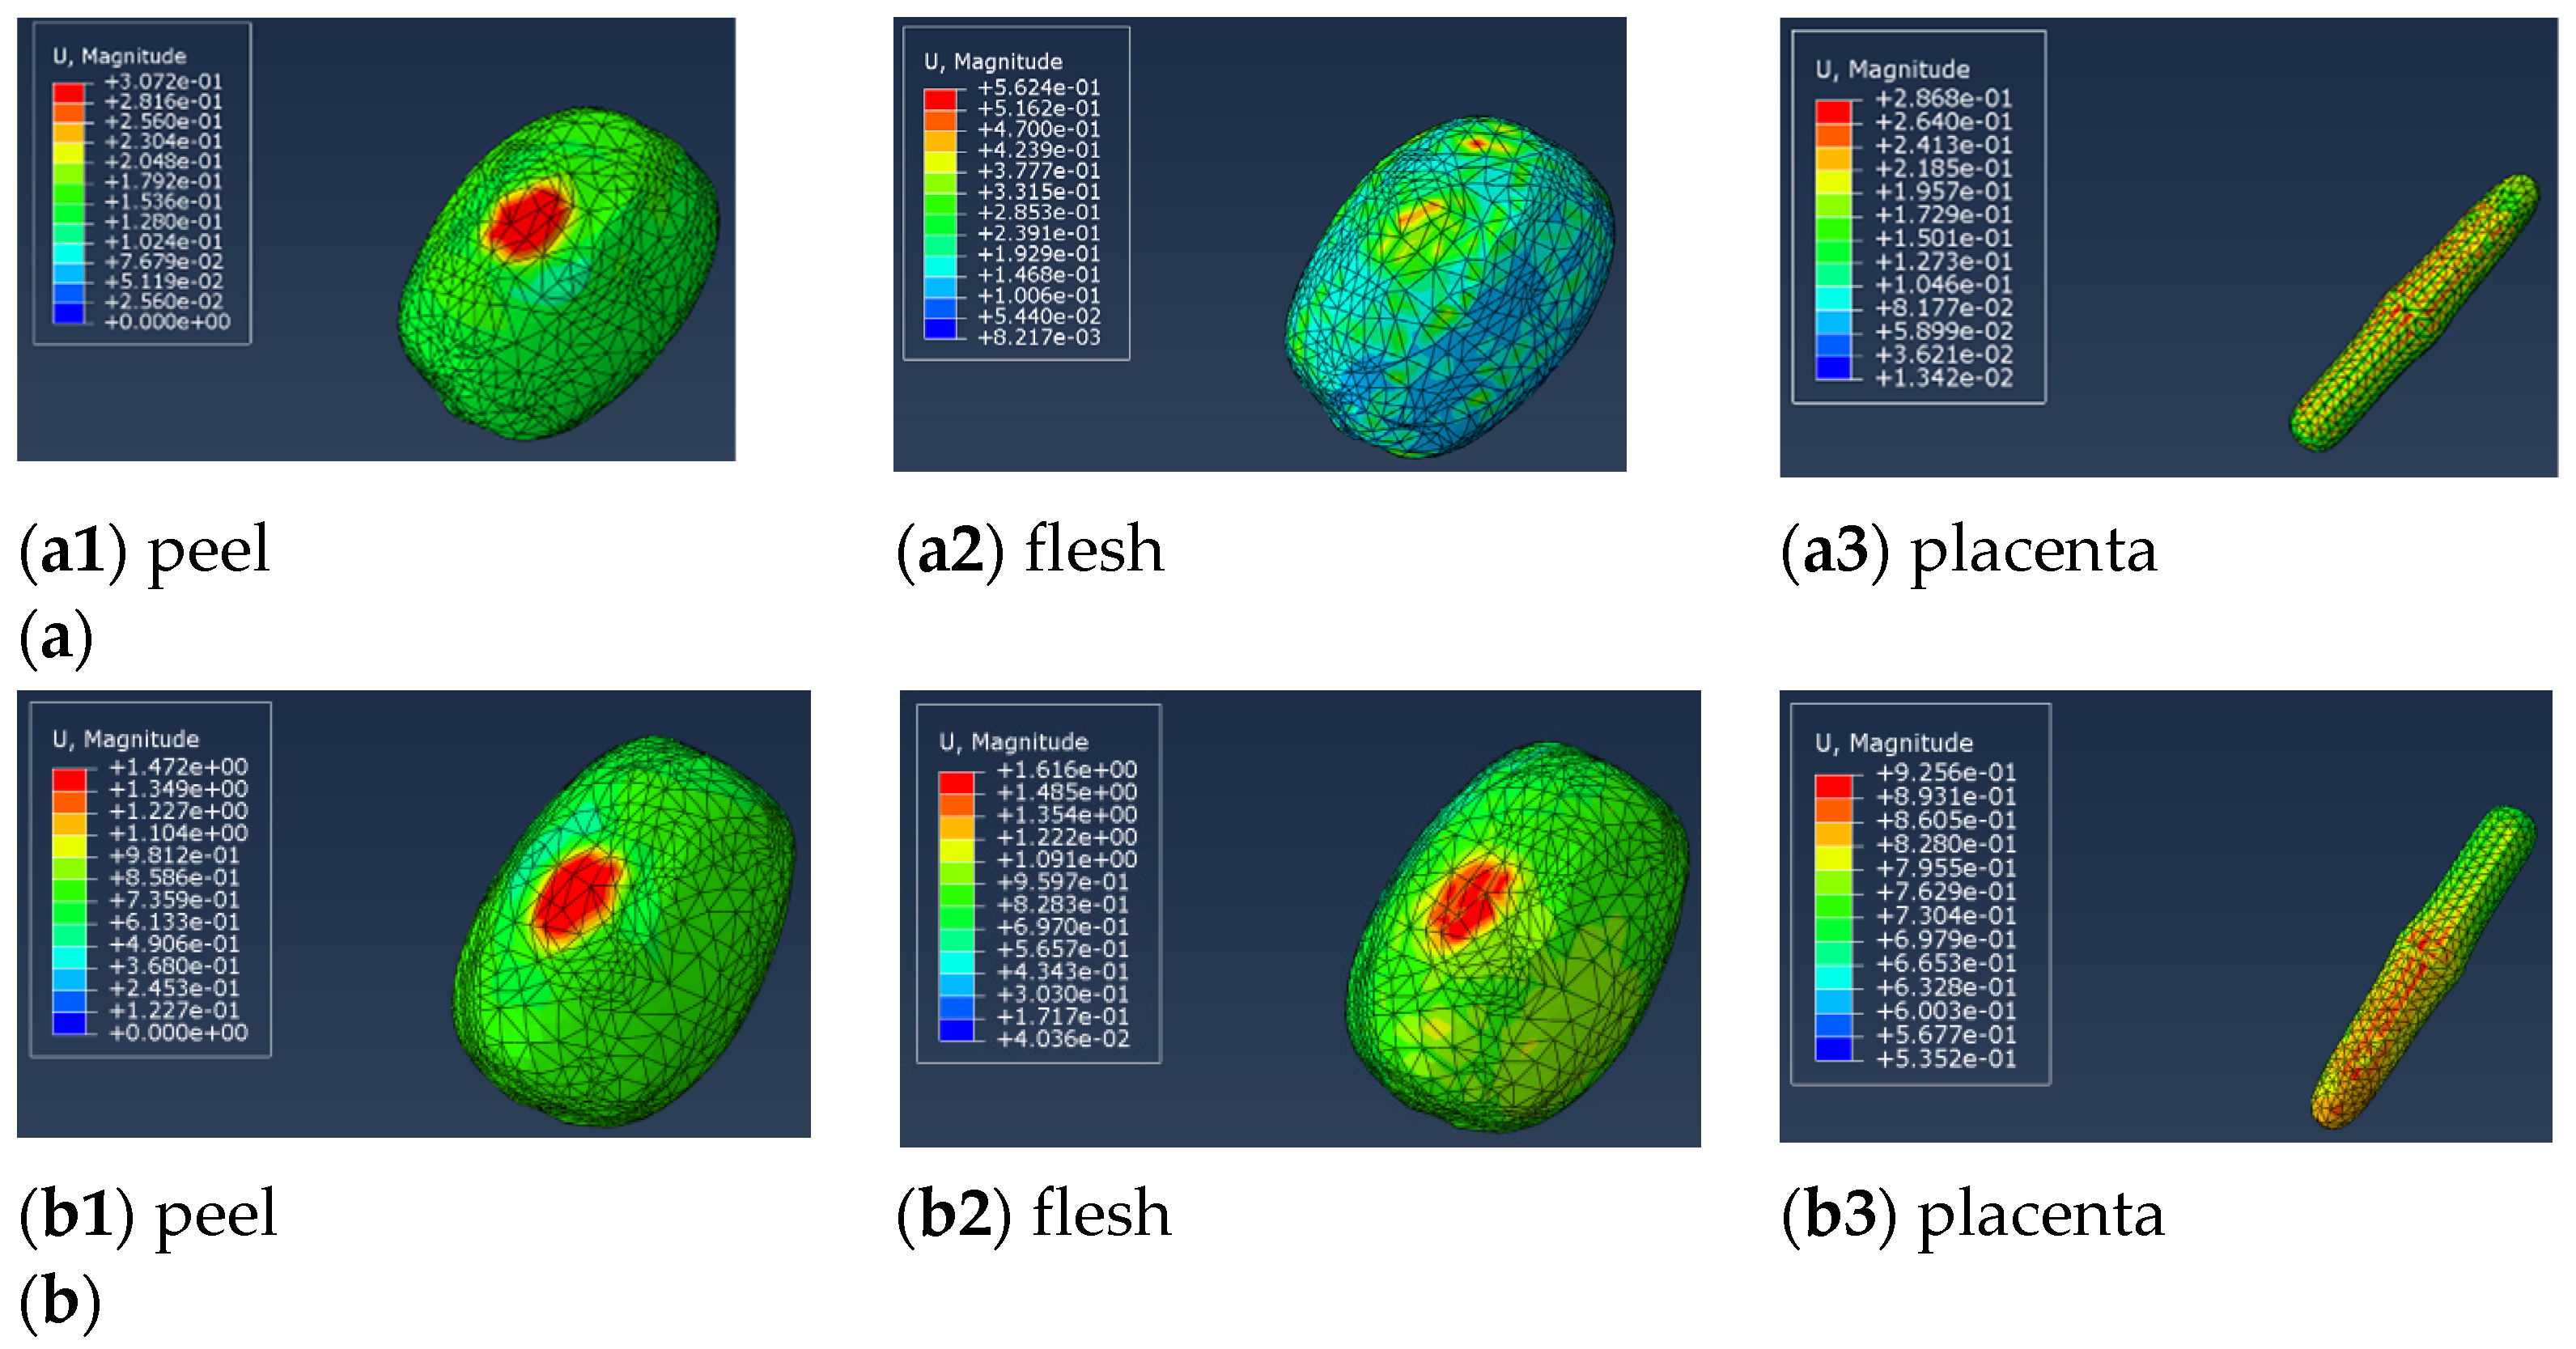
3.2.1. Analysis of Grasping Kiwifruit Results

Figure 5 shows the nodal stress cloud of each part of the kiwifruit in each group. Although it was difficult to measure the area and volume of kiwifruit damage in actual grasping experiments, the stress–strain distribution can be clearly seen in the simulation.
It can be seen from Figure 5 that the compression set of each part of the kiwifruit gradually increased with the increase in force. At the same time, it can be seen from the figure that the force of kiwifruit was proportional to the strain. At 5 N, the kiwifruit was in the elastic stage, and the flesh and placental strain were much smaller than the peel. With the continuous increase in force, the maximum strain of the peel and its distribution range continued to expand, but the strain and strain range of the flesh part were wider than the deformation range of the peel under the same force. In Figure 6, the model simulates the damage state, and the bruises in the actual test are similar. Especially in the stress state of 180 N, the damaged part of kiwifruit spreads to other parts with the force point. The kiwifruit strain cloud was consistent with the test results. At the same time, the increase in force magnitude made the area of the maximum strain distribution of the kiwifruit flesh move towards the inside of the flesh. The stress situation could also be viewed in Abaqus, which was similar to the strain case, and the stress strain of each part of the kiwifruit was summarized as follows. The stress statistics of each part of the kiwifruit under different forces are shown in Table 2, and the strain statistics are shown in Table 3.
It can be seen from Table 2 that the tissue strain variables of each part of kiwifruit increased with the increase in force. The change in the maximum stress of the flesh of the kiwifruit peel with force (increase–decrease–increase) was different from the change trend of the minimum stress of the peel and flesh, while the maximum and minimum stress of the kiwifruit kernel gradually increased with the force until it gradually flattened. The changes in the maximum and minimum stresses with force in each part of the kiwifruit obtained by the above seven sets of simulation experiments are shown in Figure 7. Through the strain and stress analysis of kiwifruit, combined with the stress–strain distribution in the kiwifruit fruit, when the force reached more than 180 N, the kiwifruit fruit was broken, and the skin and flesh of the kiwifruit were damaged, so the stress showed a downward trend. In the kiwifruit compression test, it was observed that when the kiwifruit had a force above 180 N applied, fine cracks began to appear in the kiwifruit. By 250 N, a crack occurred and the kiwifruit was completely damaged.
Under different compression forces, the individual shape variables for each group of kiwifruits were measured and compared with the deformation in the simulation. Table 4 shows that when the loading force of the pressure plate increased from 0 to 250 N during the simulation, the deformation of kiwifruit increased from 0 to 11.63 mm. When the loading force increased from 0 to 250 N during the test, the deformation of the kiwifruit increased from 0 to 11.25 mm. The relative error between the experimental results and the simulation results was about 6.42%, and the correlation coefficient was 0.99, indicating that the simulation results were highly correlated. The deformation of kiwifruit had a large error within 50 N of force. The reason is that the deformation of kiwifruit was small when the force was small, and the simulation environment parameter setting and meshing led to a small deformation.
After standing for 24 h, the near−infrared spectrum of the kiwifruit was detected, as shown in Figure 8, and there were different degrees of gap in the spectral lines of the kiwifruit fruits above 25 N. The spectral lines at the stressed and non−stressed points had a very obvious shift, and the greater the force, the more obvious the shift. This indicates that invisible damage existed inside the kiwifruit.
As shown in Table 5, the reflectivity difference of the damaged point of the kiwifruit increased with the increase in force. When the force was 150 N, the difference value reached 9.84%, and obvious cracks appeared above 180 N, which were obvious damage. So, there was no point in measuring. The hardness test after 72 h is shown in Table 5. Through data analysis, it was found that the force hardness value of about 5 N did not change much, while the hardness of kiwifruit gradually decreased with the increase in force after 25 N. As the force degree of kiwifruit increased from 5 N to 250 N, the hardness value of kiwifruit decreased from 12.06 to about 5.86 kg / cm 2 . It conformed to the cloud stress and strain distribution of kiwifruit in the kiwifruit compression simulation. The authenticity of the hidden injuries in the kiwifruit test detection was verified.
In summary, the simulation results of the grasping test were similar, and the injured part of the fruit was basically the same. Therefore, the finite element model for grabbing kiwifruit had a high simulation accuracy and could be used for the analysis of subsequent grasping kiwifruit damage.

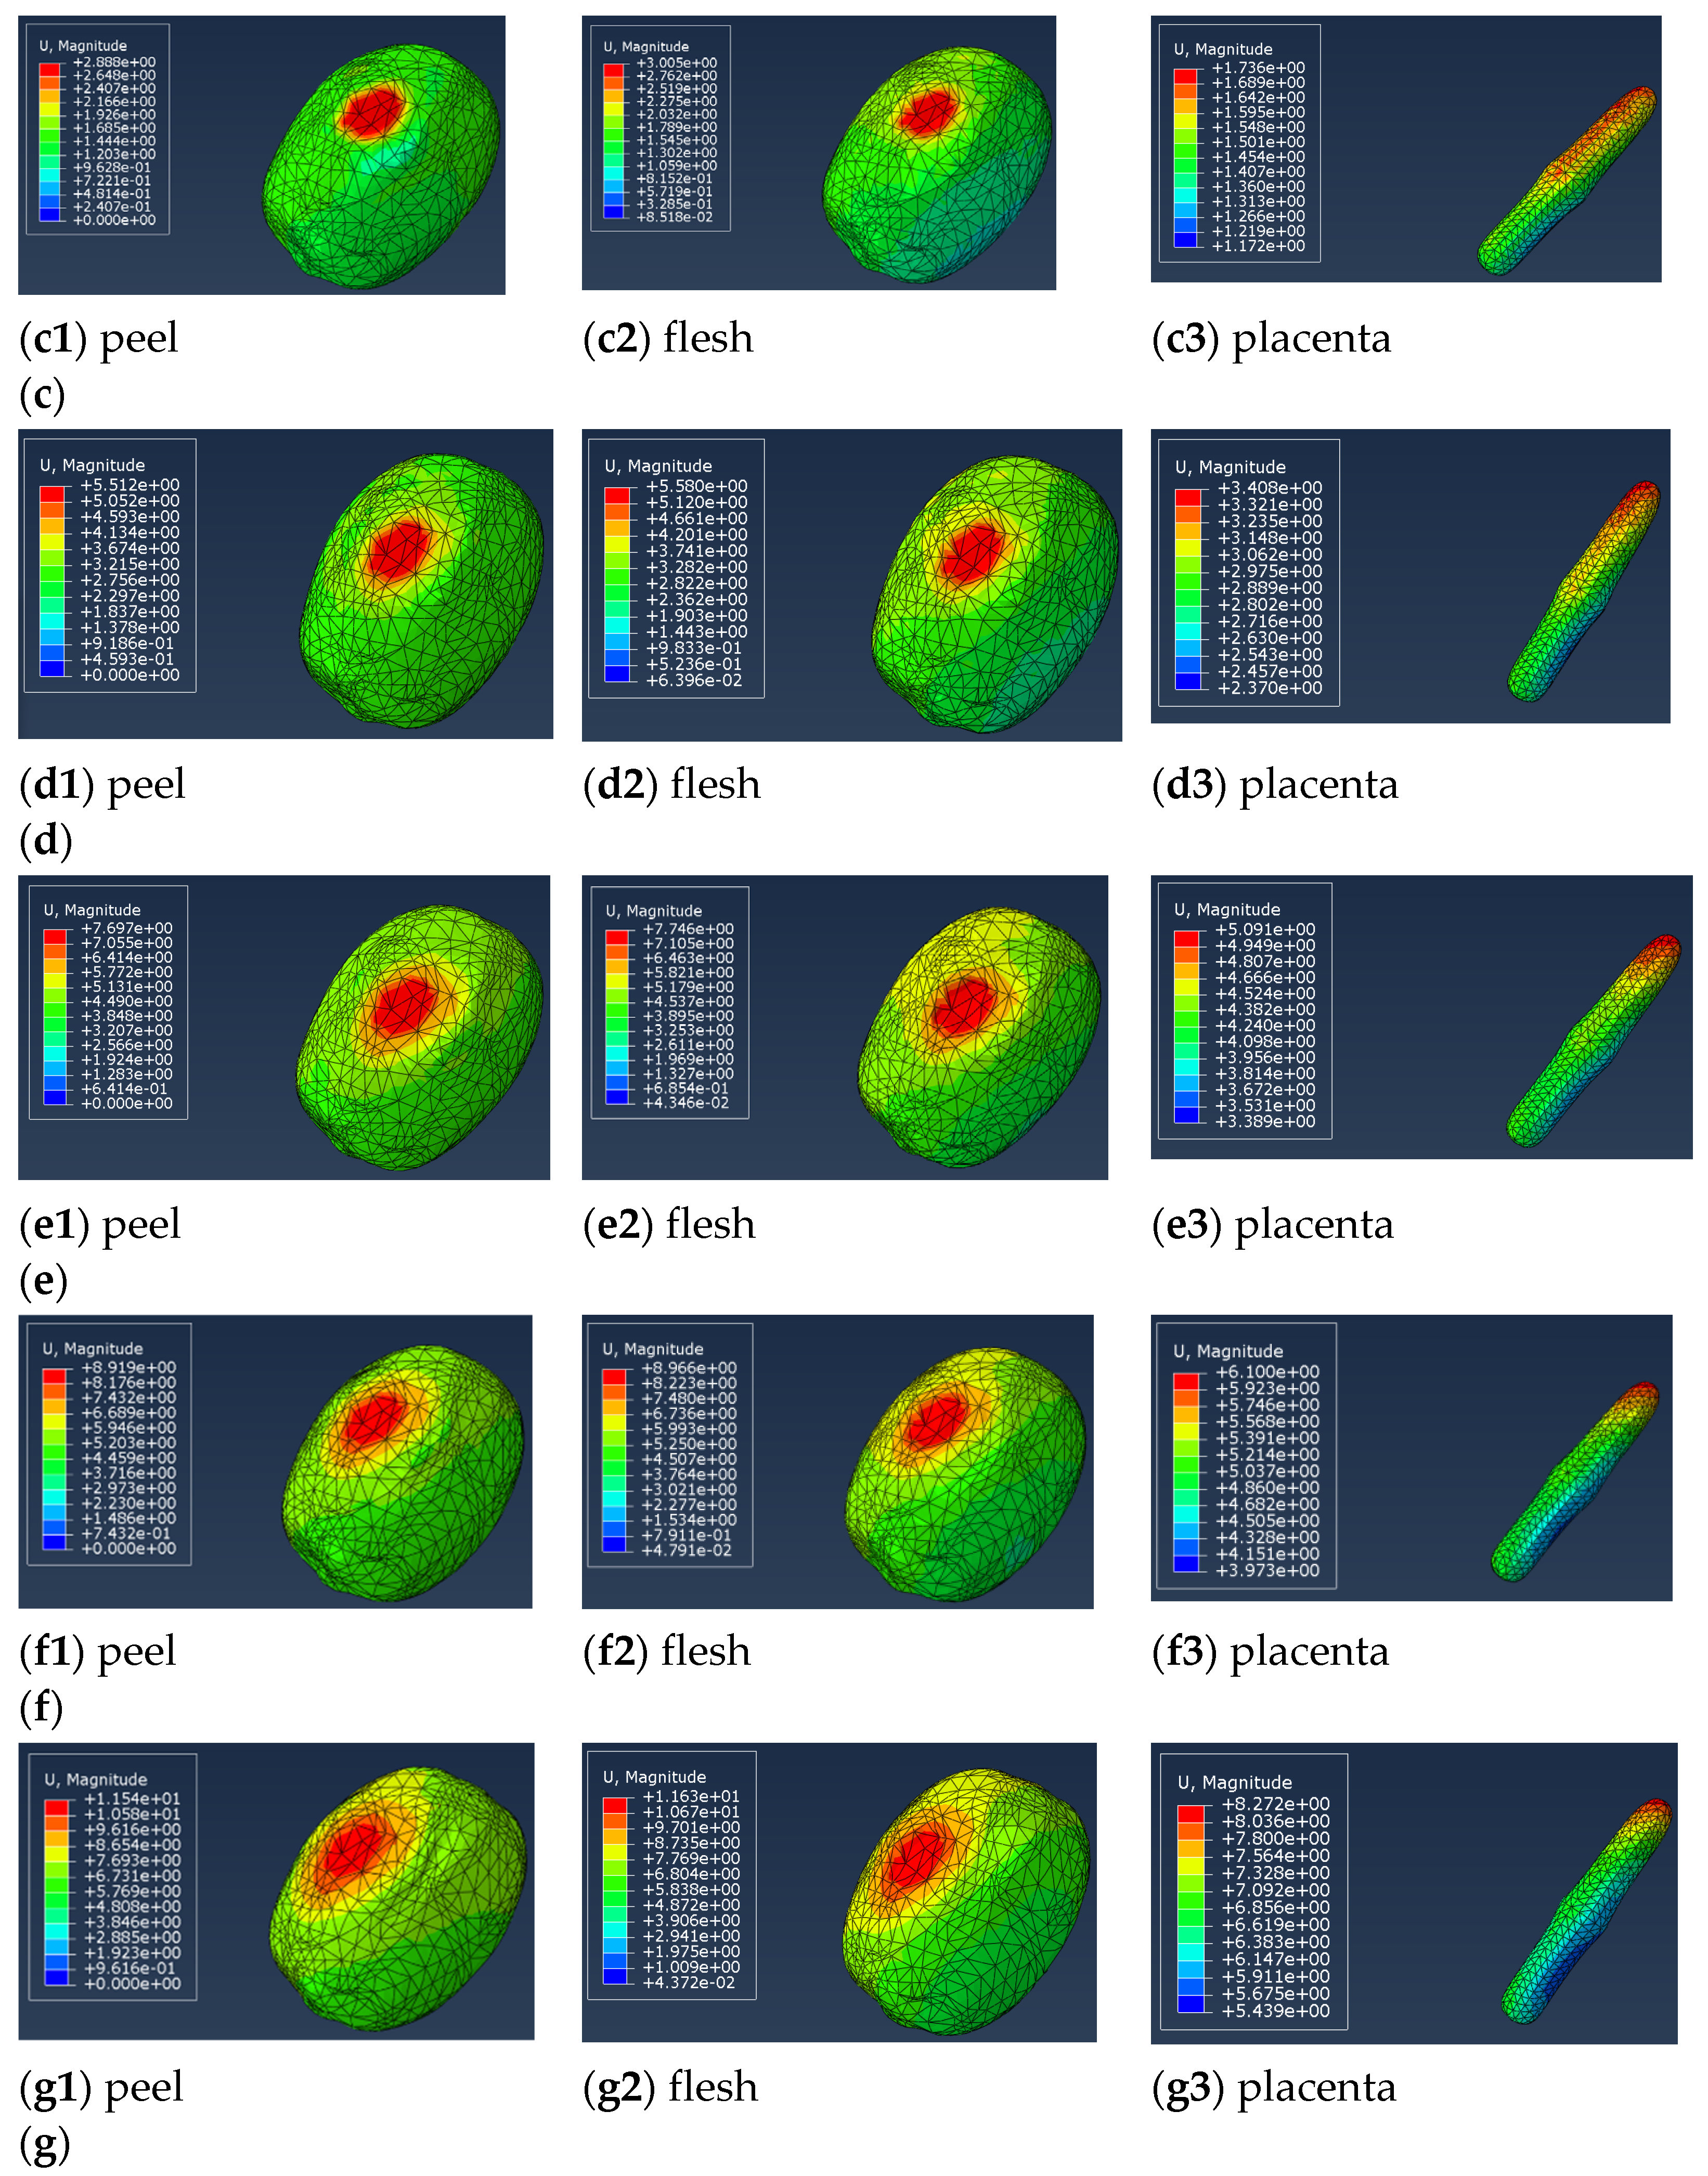
3.2.2. Analysis of Kiwifruit Picking Results

In the kiwifruit picking and packing simulation, the kiwifruit was picked from the branches and dropped through the pipe into the fruit basket on the ground. Figure 9 is a stress–strain cloud plot of kiwifruit.
As can be seen from Figure 9, the top edge of the kiwifruit was hit the most severely when moving from the pipe to the fruit basket, reaching 0.053 MPa. It was equivalent to the force in the compression test of 50 N, and the damage formed was more obvious. In the corresponding verification test, the top of the kiwifruit was also damaged during the entry and receiving process. After removing the peel of the kiwifruit, bruises were found on the tip of the kiwifruit. Figure 10 shows the comparison chart between the simulation and test, and it can be seen that the injured part was consistent.
After the kiwifruit picking test, the kiwifruit in the fruit basket was removed and allowed to stand before near−infrared spectroscopy 24 h later. It can be seen from Figure 10 that the difference between the top of the kiwifruit and the impact point and the non−impact point of the fruit basket was obvious, so there was certain damage to the top of the kiwifruit fruit.
After standing for 24 h, the kiwifruit was detected by near−infrared spectroscopy, as shown in Figure 11. From Figure 11, it can be seen that there were different degrees of gap in the spectral lines of the kiwifruit fruits above 25 N. As the size of the kiwifruit was not exactly the same, the degree of injury caused by the collision between the top of the kiwifruit and the fruit basket would not be exactly the same. The spectral lines at the stressed and non−stressed points had a very obvious shift, and the greater the force, the more obvious the shift. This indicates that invisible damage existed inside the kiwifruit.
As shown in Table 6, the reflectivity difference of the damaged point of kiwifruit had different degrees of shift. In spectral detection, the reflectivity of the damaged points was as small as 3.81% and as high as 12.11%. The average reflectivity of the damage point was 6.18%, which was equivalent to the force of about 100 N in the grasping loss. The hardness test after 72 h is shown in Table 6. Through data analysis, it was found that the hardness of the top of the kiwifruit decreased to varying degrees. From the smallest hardness of 6.37 to the largest of 10.70 kg / cm 2 , the average hardness used the cloud stress distribution of the kiwifruit stress–strain in the simulation to verify that the test conformed to the simulation. It was proven that the kiwifruit was damaged during the picking and packing process.

4. Discussion

In the process of grasping kiwifruit, according to the results of Table 2 and Table 3, it can be seen that the stress–strain situation of each part of the kiwifruit was directly related to the force size, which could provide a reference for the actual situation. However, according to Table 4, there were still certain errors in the test and simulation, and the relative error between the experimental results and the simulation results was 6.42%. The factors that had errors between the experiment and simulation were as follows: there as a gap between the kiwifruit model and the actual sample size parameters of the kiwifruit, and the meshing in the simulation. If the actual sample of kiwifruit was too large and the number of meshes was insufficient, the test deformation could be greater than the simulated quantity. Conversely, if the actual sample of kiwifruit was too small, it could cause the test deformation to be less than the simulated amount. The relative error of experiments and simulations could be reduced by selecting a sample size with a smaller margin of error and dividing by the appropriate number of meshes.
As can be seen from Figure 5, the maximum strain of the kiwifruit peel was concentrated near the contact surface between the pressure plate and the kiwifruit, while the minimum strain was concentrated in the untouched part. With the increase in force, the maximum strain of the peel and its distribution range continued to expand, and at the same time, when the pressure reached 25 N, the flesh of the kiwifruit was in the area where the pressure plate was in contact with the kiwifruit. The strain value of the untouched part began to increase significantly, and at the same time, the increase in force caused the area with the maximum strain distribution of the kiwi flesh to move toward the inside of the flesh. The magnitude of the strain change in the flesh started to be higher than that of the peel. When the force reached 100 N, the maximum strain distribution of the flesh began to diffuse to the non−stressed part. The maximum strain of the kiwi kernel was much smaller than the rest of the kiwifruit, but the minimum strain was the largest of the three parts of the kiwifruit. Similar to Ji [15] in the finite element analysis of apple grabbing, this was due to the limited contact area between the pressure plate and the kiwifruit during the grasping process, the force load applied by the pressure plate was concentrated near the contact surface, the kiwi kernel was located in the load concentration area, and the peel and flesh had parts far from the load concentration area.
According to the results of Table 5, it can be seen that kiwifruit had little influence in hardness value and spectral detection in the range of 0–5 N, and kiwifruit was basically in the elastic stage of the creep characteristics. The results show that the gripping force of the mechanical claw should be about 5 N when the kiwifruit picking robot implements mechanized picking, which lays a foundation for mechanized picking to reduce the damage to kiwifruit. When the force of kiwifruit was more than 25 N, the hardness of kiwifruit began to decrease significantly. In near−infrared spectrum detection, the wavelength difference of the force application point gradually increased. According to Figure 6, after the kiwi was peeled, the internal injury part of the kiwifruit was similar to the simulation results.
Therefore, in the process of grabbing kiwifruit, the force of grabbing kiwifruit should not be too large. Fu et al. [27] concluded in the basic test of kiwifruit that the minimum holding force of kiwifruit was 1 N, and the selection of 5 N could ensure that the grasping kiwifruit would not slip and would not cause excessive damage to the kiwifruit. Furthermore, it increased the fruit yield of kiwifruit.
During the kiwifruit picking process, according to Figure 9, the top of the kiwifruit was seriously injured when it fell into the fruit basket on the ground along the pipe after picking. The peel and pit were less damaged than the flesh tissue. The impact site of kiwifruit flesh was the most serious, with a maximum stress of 0.053 MPa, and this spread to the surrounding non−impact points. According to the simulated stress cloud results, the top of the kiwifruit was equivalent to a force of 50 N in the compression test. After the actual verification test, it could also be clearly observed that the impact site of kiwifruit was softer than the other parts. Unlike the free−fall motion studied by Du et al. [21], follow−up validation tests were added, which increased the reliability of simulation results. In the subsequent hardness value detection and near−infrared spectroscopy detection, the top injury was also confirmed, the hardness value was distributed in 6.37–10.70 kg / cm 2 , and the average reflectance of the damaged point was 6.18%. As shown in the kiwi bruise in Figure 10, it was observed that the bruised part of the kiwi injury point spread around. It shows that the test results were highly correlated with the simulation results, and there was a certain degree of damage in the process of kiwifruit entering the fruit basket along the pipeline. However, different kiwifruit entered the fruit basket at the same height, and the difference in hardness value and reflectance difference in spectral detection was different, which could have been related to the quality of the kiwifruit samples. The greater the mass of the kiwifruit, the greater the gravitational potential energy falling into the fruit basket, resulting in a difference in the degree of injury to the top.
Therefore, during the kiwi picking process, the kiwifruit was damaged in the process of entering the fruit basket along the pipe. This paper provides a reference for how to design fruit baskets for the subsequent picking and packing process, and the same research ideas can be used to verify whether the improved picking process has any damage and thus further improve the fruit quality of kiwifruit.

5. Conclusions

The goal of this study was to reveal the damage mechanism of kiwifruit during picking and harvesting to containers. Firstly, the relevant mechanical parameters of the kiwifruit peel, flesh, and pit were obtained through experiments. Secondly, a three−dimensional model of the fruit was established, and a finite element model of the kiwifruit picking and kiwifruit receiving container was established in Abaqus, and the damage mechanism of kiwifruit in the two processes was obtained by combining the solution results with the failure stress that caused kiwifruit damage. Finally, the corresponding research results were verified through experiments. The results show that the relative error of the simulation and test of simulated grasping of kiwifruit was 6.42%, and the simulation and test of picking to the fruit box confirmed the existence of damage, and the reflectivity of the damaged point in the detection was 6.18% on average, and the hardness value decreased to 8.30 kg / cm 2 on average. The experimental results have proven the accuracy of kiwifruit in the process of picking and collecting in containers, its finite element model, and the feasibility of the finite element method for damage analysis. At the same time, the near−infrared spectroscopy detection of hidden damage of kiwifruit was carried out, and the detection test of kiwifruit hardness was also carried out. We proved the authenticity of damage in the simulation by multiple means.
Through the combination of theory and experiment, this paper provides a certain reference for the design and improvement for the end effector and the improvement to the fruit basket collection device. The test results have proven the accuracy of kiwifruit in the process of picking and collecting containers, the accuracy of its finite element model, and the feasibility of the finite element method for damage analysis, but the designed test was limited by the existing equipment and was not precise and rigorous. From the research point of view, the following three points could be further studied in depth: (1) There are many types of kiwifruits, and different types of kiwifruits correspond to different viscoelastic model parameter values. Therefore, subsequent work can perform compression tests on a variety of kiwifruit. The corresponding mechanical model was obtained, and the damage of different species of kiwifruit was analyzed using the same method. (2) The hierarchical geometric model of kiwifruit was established according to the selected kiwi equal scale. However, the size of kiwifruit is different, the shape is different, and the thickness of the peel is also inconsistent, which is bound to affect the finite element solution results. So, follow−up work needs to establish a more accurate kiwifruit geometric model; establish and solve the finite element model for kiwifruit of different sizes and shapes; and analyze the influence of uncertain factors such as fruit shape, size, and peel thickness on the solution results. (3) Although the designed test simply verified the damage of the simulation model, it was still limited by the test instrument. First of all, only the accuracy of the finite element model for deformation solving was verified, and the maximum stress of each part of the kiwifruit during the gripping process was not verified in this article. The magnitude and distribution of stress need to be measured by special instruments such as pressure−sensitive film. Secondly, the observation of kiwifruit damage after grasping was relatively primitive and inaccurate. A next step could be to study the observation of kiwifruit damage by means of image processing.

Author Contributions

Methodology, Z.L. and Z.H.; resources and investigation, Z.H. and X.D.; data curation, Z.L.; validation, Z.L. and K.L.; review and editing, W.H. and Z.L. project administration, Y.C.; funding acquisition, Y.C. All authors have read and agreed to the published version of the manuscript.

Funding

This research was funded by National Natural Science Foundation of China, grant number 31971805.

Informed Consent Statement

Informed consent was obtained from all subjects involved in the study.

Data Availability Statement

All data are presented in this article in the form of figures and tables.

Acknowledgments

This study was conducted in the College of Mechanical and Electronic Engineering, Northwest A&F University.

Conflicts of Interest

The authors declare no conflict of interest.

References

  1. UN Food & Agriculture Organization. Production of Kiwi (Fruit) by Countries. 2020. Available online: https://www.un.org/en/node/96999 (accessed on 25 June 2020).
  2. FAO. FAOSTAT: Crops and Livestock Products. 2020. Available online: https://www.fao.org/faostat (accessed on 25 June 2020).
  3. Fu, L.; Wang, B.; Cui, Y.; Su, S.; Gejima, Y.; Kobayashi, T. Kiwifruit recognition at nighttime using artificial lighting based on machine vision. Int. J. Agric. Biol. Eng. 2015, 8, 52–59. [Google Scholar]
  4. Zhou, J.; He, L.; Karkee, M.; Zhang, Q. Effect of catching surface and tilt angle on bruise damage of sweet cherry due to mechanical impact. Comput. Electron. Agric. 2016, 121, 282–289. [Google Scholar] [CrossRef] [Green Version]
  5. Barnett, J.; Duke, M.; Au, C.K.; Lim, S.H. Work distribution of multiple Cartesian robot arms for kiwifruit harvesting. Comput. Electron. Agric. 2020, 169, 105202. [Google Scholar] [CrossRef]
  6. Opara, U.L.; Pathare, P.B. Bruise damage measurement and analysis of fresh horticultural produce—A review. Postharvest Biol. Technol. 2014, 91, 9–24. [Google Scholar] [CrossRef]
  7. Satitmunnaithum, J.; Kitazawa, H.; Arofatullah, N.A.; Widiastuti, A.; Kharisma, A.D.; Yamane, K.; Tanabata, S.; Sato, T. Microbial population size and strawberry fruit firmness after drop shock−induced mechanical damage. Postharv. Biol. Technol. 2022, 192, 112008. [Google Scholar] [CrossRef]
  8. An, X.; Liu, H.; Fadiji, T.; Li, Z.; Dimitrovski, D. Prediction of the temperature sensitivity of strawberry drop damage using dynamic finite element method. Postharv. Biol. Technol. 2022, 190, 111939. [Google Scholar] [CrossRef]
  9. Fu, H.; Du, W.; Yang, J.; Wang, W.; Wu, Z.; Yang, Z. Bruise measurement of fresh market apples caused by repeated impacts using a pendulum method. Postharv. Biol. Technol. 2023, 195, 112143. [Google Scholar] [CrossRef]
  10. Guan, X.; Li, T.; Zhou, F. Determination of bruise susceptibility of fresh corn to impact load by means of finite element method simulation. Postharv. Biol. Technol. 2023, 198, 112227. [Google Scholar] [CrossRef]
  11. Lewis, R.; Yoxall, A.; Canty, L.A. Development of engineering design tools to help reduce apple bruising. J. Food Eng. 2007, 83, 356–365. [Google Scholar] [CrossRef] [Green Version]
  12. Hussein, Z.; Fawole, O.A.; Opara, U.L. Bruise damage susceptibility of pomegranates (Punica granatum, L.) and impact on fruit physiological response during short term storage. Sci. Hortic. 2019, 246, 664–674. [Google Scholar] [CrossRef]
  13. Liu, W.; Liu, T.; Zeng, T.; Ma, R.; Cheng, Y.; Zheng, Y.; Qiu, J.; Qi, L. Prediction of internal mechanical damage in pineapple compression using finite element method based on Hooke’s and Hertz’s laws. Sci. Hortic. 2023, 308, 111592. [Google Scholar] [CrossRef]
  14. Ji, W.; Li, J.; Yang, J.; Ding, S.; Zhao, D. Finite element analysis and verification of the grasping damage mechanism of apple picking by robotic hand. Trans. Chin. Soc. Agric. Eng. 2015, 31, 17–22. (In Chinese) [Google Scholar]
  15. Scheffler, O.C.; Coetzee, C.J.; Opara, U.L. A discrete element model (DEM) for predicting apple damage during handling. Biosyst. Eng. 2018, 172, 29–48. [Google Scholar] [CrossRef] [Green Version]
  16. Celik, H.K. Determination of bruise susceptibility of pears (Ankara variety) to impact load by means of FEM−based explicit dynamics simulation. Postharv. Biol. Technol. 2017, 128, 83–97. [Google Scholar] [CrossRef]
  17. Salarikia, A.; Ashtiani, S.-H.M.; Golzarian, M.R. Hamid Mohammadinezhad, Finite element analysis of the dynamic behavior of pear under impact loading. Inf. Process. Agric. 2017, 4, 64–77. [Google Scholar]
  18. Han, X.; Liu, Y.; Tchuenbou−Magaia, F.; Li, Z.; Khojastehpour, M.; Li, B. Analysis of the collision−damage susceptibility of sweet cherry related to environment temperature: A numerical simulating method. J. Food Eng. 2022, 333, 111140. [Google Scholar] [CrossRef]
  19. Liu, H.; Han, X.; Fadiji, T.; Li, Z.; Ni, J. Prediction of the cracking susceptibility of tomato pericarp: Three−point bending simulation using an extended finite element method. Postharv. Biol. Technol. 2022, 187, 111876. [Google Scholar] [CrossRef]
  20. Du, D.; Wang, B.; Wang, J.; Yao, F.; Hong, X. Prediction of bruise susceptibility of harvested kiwifruit (Actinidia chinensis) using finite element method. Postharv. Biol. Technol. 2019, 152, 36–44. [Google Scholar] [CrossRef]
  21. Li, Z.; Wang, Y. A multiscale finite element model for mechanical response of fruits. Postharv. Biol. Technol. 2016, 121, 19–26. [Google Scholar] [CrossRef]
  22. Otero, R.; Lagüela, S.; Cabaleiro, M.; Sousa, H.S.; Arias, P. Semi−automatic 3D frame modelling of wooden trusses using indoorpoint clouds. Structures 2023, 47, 1743–1753. [Google Scholar] [CrossRef]
  23. Uba, F.; Esandoh, E.O.; Zogho, D.; Anokye, E.G. Physical and mechanical properties of locally cultivated tomatoes in Sunyani, Ghana. Sci. Afr. 2020, 10, e00616. [Google Scholar] [CrossRef]
  24. Zhang, Z.; Zhou, J.; Yi, B.; Zhang, B.; Wang, K. A flexible swallowing gripper for harvesting apples and its grasping force sensing model. Comput. Electron. Agric. 2023, 204, 107489. [Google Scholar] [CrossRef]
  25. Polychroniadou, C.; Michailidis, M.; Adamakis, I.-D.S.; Karagiannis, E.; Ganopoulos, I.; Tanou, G.; Bazakos, C.; Molassiotis, A. Mechanical stress elicits kiwifruit ripening changes in gene expression and metabolic status. Postharv. Biol. Technol. 2022, 194, 112102. [Google Scholar] [CrossRef]
  26. Li, H.; Guo, W.; Yue, R. Non−destructive testing of kiwifruit hardness, near−infrared diffuse reflectance spectroscopy. Trans. Chin. Soc. Agric. Mach. 2011, 42, 145–149. (In Chinese) [Google Scholar]
  27. Fu, L.; Zhang, F.; Guidang, F.; Li, Z.; Wang, B.; Cui, Y. Design and test of end effector for kiwifruit picking robot. Trans. Chin. Soc. Agric. Mach. 2015, 46, 1–8. (In Chinese) [Google Scholar]
Figure 1. Schematic diagram of the parameters being obtained.
Processes 11 00598 g001
Figure 2. The kiwifruit three-dimensional model. (a) Model building process; (b) Cross-sectional view of kiwifruit.
Processes 11 00598 g002
Figure 3. Organization of each part of the kiwifruit three-dimensional model. (a) Placenta; (b) Flesh; (c) Peel.
Processes 11 00598 g003
Figure 4. Kiwifruit grabbing and collection test and simulation. (a) Grab Kiwifruit simulation; (b) Container collection simulation; (c) Grab the kiwifruit test; (d) Container collection test.
Processes 11 00598 g004
Figure 5. Kiwifruit deformation diagram under different forces. (a) 5 N Stressed; (b) 25 N Stressed; (c) 50 N Stressed; (d) 100 N Stressed; (e) 150 N Stressed; (f) 180 N Stressed; (g) 250 N Stressed.
Processes 11 00598 g005aProcesses 11 00598 g005b
Figure 6. Kiwifruit bruises from different forces. (a)25 N; (b)180 N. Note: The red circle is the bruise.
Processes 11 00598 g006
Figure 7. Maximum stress fitting curve of the kiwifruit. (a) peel; (b) flesh; (c) placenta. Note: The dark dots represent the stress values of different forces.
Processes 11 00598 g007
Figure 8. Statistics of different stressed kiwi spectrum tests. (a) 5 N; (b) 150 N.
Processes 11 00598 g008
Figure 9. Stress cloud diagram of kiwifruit picking and packing. (a) peel; (b) flesh; (c) placenta.
Processes 11 00598 g009
Figure 10. Kiwifruit fall bruise diagram. (a) Actual fall; (b) Simulated falls. Note: The red circle is the bruise.
Processes 11 00598 g010
Figure 11. Kiwifruit spectrum test statistics.
Processes 11 00598 g011
Table 1. Kiwifruit mechanical parameters.
Density
/ g / c m 3
Elastic Modulus
/(MPa)
Breaking Stress
/(MPa)
Poisson’s Ratio
Peel0.551 ± 0.050 11.20 ± 0.501.51 ± 0.210.30
Flesh1.122 ± 0.020 2.22 ± 0.300.45 ± 0.080.30
Placenta1.063 ± 0.0404.17 ± 0.201.60 ± 0.150.30
Table 2. Stress statistics table for each part of the kiwifruit.
StressedPeel/(MPa)Flesh/(MPa)Placenta/(MPa)
MaxMinMaxMinMaxMin
50.361.86 × 10−37.29 × 10−23.02 × 10−41.36 × 10−21.38 × 10−4
251.727.08 × 10−30.221.65 × 10−39.97 × 10−26.75 × 10−4
503.271.96 × 10−20.569.65 × 10−40.569.65 × 10−4
1004.263.08 × 10−20.894.40 × 10−30.712.04 × 10−3
1504.385.41 × 10−20.696.85 × 10−31.173.39 × 10−3
1804.216.88 × 10−20.921.29 × 10−21.195.24 × 10−3
2504.338.54 × 10−20.931.55 × 10−21.276.80 × 10−2
Table 3. Strain statistics table for each part of the kiwifruit.
StressedPeel/(mm)Flesh/(mm)Placenta/(mm)
MaxMinMaxMinMaxMin
50.310.000.568.22 × 10−30.291.34 × 10−2
251.470.001.624.04 × 10−20.930.54
502.890.003.018.52 × 10−21.741.17
1005.510.005.586.40 × 10−23.412.37
1507.700.007.754.35 × 10−25.093.39
1808.920.008.974.79 × 10−26.103.97
25011.540.0011.634.37 × 10−28.275.44
Table 4. Comparative analysis of the compression test and simulation test.
No.Force
/N
Simulate
Deformation
/mm
Test
Deformation
/mm
Error Rate
/%
Correlation
Coefficient
r
15.000.560.629.68%0.99
225.001.621.45−11.72%
350.003.013.4613.01%
4100.005.585.905.42%
5150.007.757.760.13%
6180.008.978.83−1.59%
7250.0011.6311.25−3.38%
Table 5. Kiwifruit hardness test statistics table.
Force/N052550100150180250
Hardness value
/ kg / cm 2
12.7312.0610.199.558.918.536.375.86
∆x/%/1.802.183.775.489.84//
λ 1 /nm/346.301424.257503.746916.089891.24//
Note: ∆x is the maximum difference of reflectance damage point in the near−infrared spectrum detection of kiwifruit; λ 1 is the wavelength at the maximum difference of the reflectance damage point.
Table 6. Kiwifruit hardness test statistics table.
No.12345678910
Hardness value / kg / cm 2 9.428.666.376.4910.707.568.629.157.888.16
∆x/%4.155.216.7312.113.816.336.124.576.915.88
λ 1 /nm735.59913.90687.42909.52197.72691.29678.35712.45192.81921.67
Note: ∆x is the maximum difference of reflectance damage point in the near−infrared spectrum detection of kiwifruit; λ 1 is the wavelength at the maximum difference of the reflectance damage point.
Disclaimer/Publisher’s Note: The statements, opinions and data contained in all publications are solely those of the individual author(s) and contributor(s) and not of MDPI and/or the editor(s). MDPI and/or the editor(s) disclaim responsibility for any injury to people or property resulting from any ideas, methods, instructions or products referred to in the content.

