Article

Assessing and Improving Biooxidation for Acid Generation and Rare Earth Element Extraction

Department of Materials Science and Engineering, University of Utah, Salt Lake City, UT 84112, USA
*
Author to whom correspondence should be addressed.
Processes 2023, 11(4), 1005; https://doi.org/10.3390/pr11041005
Submission received: 5 January 2023 / Revised: 18 March 2023 / Accepted: 20 March 2023 / Published: 26 March 2023

Abstract

:
Microorganisms (Acidithiobacillus ferrooxidanns) are effective in oxidizing ferrous ions that can be used to oxidize pyrite and produce sulfuric acid. Many coal waste resources contain significant concentrations of rare earth elements (REE) and critical materials (CM) that can be extracted using sulfuric acid. These coal waste resources often contain significant concentrations of pyrite, which if not utilized or removed present a future environmental liability for potential acid mine drainage. Thus, the combination of pyrite and REE/CM in coal waste provides a significant resource opportunity for sulfuric acid generation that can be utilized using biooxidation. In addition, the pyrite concentrate used for acid generation also contains REE/CM content that is released during biooxidation of the pyrite concentrate that augments the REE/CM release from the main ore being leached with the acid generated from the pyrite. Thus, this approach provides a very significant environmental advantage as well as augmented REE/CM recovery. Although there are many studies associated with biooxidation in relation to mineral oxidation, there is a lack of information regarding the effects of operating parameters on biooxidation performance and optimization for practical applications. In this study, findings from research in assessing and improving biooxidation for acid generation for REE/CM extraction are presented. Results show that bacteria can very effectively and efficiently oxidize ferrous ions to ferric ions, which oxidize pyrite to produce acid for REE/CM extraction. The factors that showed significant impact on biooxidation performance include air flow rate, stirring speed, residence time, solids concentration, and temperature. The dominance of Leptospirillum ferriphilum species was noted in the bioreactor after a prolonged period of operation, although Acidithiobacillus ferrooxidanns was used in the beginning.

1. Introduction

Microorganisms have been utilized to assist in metal extraction from minerals and waste for many years [1,2,3,4,5,6]. Through metabolic procedures such as metal ion reduction, acidogenesis, and biotransformation, these bacteria can release metal ions from minerals. Bacteria have been used in connection with mineral oxidation since around 1900 [7]. However, it was not until 1947 when bacteria associated with metal extraction from minerals, were isolated from a coal mine and identified by Colmer and Hinkle [8] as Thiobacillus ferrooxidans, which is now recognized as Acidithiobacillus ferrooxidanns. In order to produce sulfuric acid, Acidithiobacillus bacteria have been used in the mining industry. By oxidizing iron sulfide minerals like pyrite, these acid-producing bacteria create sulfuric acid as a byproduct. It is possible to extract valuable metals from ore by using this acid to dissolve metal sulfides. In order to remove heavy metals from contaminated soils and water, Acidithiobacillus bacteria can also be utilized in bioremediation procedures. They are chemolithotrophic, -proteobacterium microorganisms [9] that obtain their growth energy from the oxidation of minerals that include sulfur and iron. It fixes both nitrogen and carbon from the environment and grows at pH levels as low as 1–2.
It was not until the 1950s that the role of bacteria in dump leaching of some minerals was demonstrated. In 1984, the Fairview plant in South Africa applied biooxidation in a pilot plant with a capacity of ~750 kg/day that was expanded to 10,000 kg/day in 1991 [10]. Most of the bacteria that have been identified for their role in mineral oxidation are acidophilic and need acid to access dissolved ions such as ferrous ions for oxidation. The bacteria are also mesophilic and tend to perform best between 20 and 40 °C. These bacteria are also autotrophic and utilize the carbon from carbon dioxide to supply their carbon needs. Thus, the conditions needed for successful biooxidation for metal extraction from minerals are generally acidic with temperatures controlled between 20 °C and 40 °C, and significant air flow to provide both oxygen and carbon dioxide.
In the context of this research, acid is needed for REE dissolution. The REEs in the ore matrix are released into a solution and become extractable in acidic media. The kind of acid employed is determined by the ore’s mineral makeup and the particular REEs being extracted. Due to its ability to dissolve a variety of minerals containing REEs, sulfuric acid is frequently employed for the leaching of REEs. Depending on the exact mineral and REE being leached, other acids such as nitric acid or hydrochloric acid may also be utilized in some instances. To maximize REE extraction efficiency and reduce environmental effects, leaching conditions such as temperature, duration, and agitation must be properly managed.
Sulfuric acid needed for REE extraction from coal waste can be generated from pyrite found in coal waste using bacteria to facilitate rapid, low-cost acid generation. Furthermore, the use of the coal waste pyrite for acid generation prevents future acid mine drainage from it. Thus, the authors have utilized this biooxidation route for acid production for REE and critical materials (CM) extraction. Some of the recent literature discussed the details about industrial scale production of sulfuric acid using microorganisms as well as work from the authors [11,12], the present manuscript mainly deals with fine tuning of processing parameters.

2. Experimental Procedures

2.1. Size Distribution Analysis

Size analysis experiments were conducted using a set of 6 different United States (US) mesh sieves, and the sequence was maintained by following the USA standard mesh chart. After putting the samples on the top of the sieves, the entire set was vibrated by an automatic sieve vibrator for 20 min.

2.2. SEM Imaging and EDS Mapping Technique

SEM imaging and EDS mapping of different pyrite concentrations have been conducted by “HITACHI S-4800” high-resolution field emission SEM using 1.0 kV for all samples during the imaging. All the images have been collected at the same magnification. The applied voltage was increased to 20 kV during EDS mapping analysis to investigate the particles. EDS mapping was also done at the same magnification.

2.3. XRD Analysis Procedure

XRD analysis has been done using a RIGAKU MINIFLEX 600 XRAY DIFFRACTOMETER (XRD). MATCH 30 has been used to analyze the data collected from the XRD analyzer. The same contact angle and voltage have been maintained.

2.4. ICP-MS Analysis Information

The ICP-MS analysis was performed by American West Analytical Laboratory (AWAL) using standard equipment and procedures.

2.5. Acid Consumption Titration Procedure

Acid titration was conducted to determine the effective CaCO3 concentration in the feed. The procedures include preparation of 20 mL of 0.5 M HCl in a 50 mL beaker, grinding 1 g of sample which is added to the solution for 24 h, followed by titrating with 0.5 M NaOH solution to pH 7.0 and recording the volume of NaOH solution consumed.

2.6. Eh, and pH Measurements

pH and Eh values were measured using Thermo Scientific™ Orion Star™ A211 Benchtop pH Meter, and a Mettler Toledo™ InLab™ Redox ORP Electrode was used to measure the ORP value, and a Thermo Scientific™ Orion™ Triode™ 3-in-1 pH/ATC Probe was used to measure the pH. The acidity of the back titration solution was checked after adding NaOH to the titrate solution based on measured values from the pH electrode/meter. The pH of the ferric sulfate solution was also measured during the experiments to see the changes in acidity. Acidity and ORP data were collected at least two times a day every day at the same time right before feeding was started.

2.7. Bio Reactor Experimental Setup

Two 3-liter Chemglass jacketed bioreactors have been utilized using appropriate safety protocols for the project. The bioreactor was purchased from the Chemglass Lifesciences INC and assembled in the lab. Previously preserved bacterial cultures were used to inoculate the reactors for bioleaching experiments in two different buildings. Reactors were run in separate facilities to avoid discontinuity in case of shutdowns during the COVID-19 response. Necessary installation processes such as cleaning steps, installing all parts, re-filling new solutions, maintaining temperature (inside the reactor ~35 °C), pH control (~maintenance of pH 1.4 using H2SO4 if needed), and providing the supply of 9K medium also has been initiated in the laboratory. The pH of 1.4 was set to keep the pH in range of preferred bacterial activity and performance. The reactors generally operated below this pH, but in cases where there were upsets in flows that caused the pH to rise above 1.7, acid was added to bring the pH to approximately 1.4. Figure 1 shows the experimental setup of one reactor in the lab. The authors have used standard Acidithiobacillus ferrooxidanns strain (ATCC 23,270) as well as the indigenous bacteria in the feed to prepare bioleaching solutions. The microorganisms were grown in updated ATCC 2436 9k medium where iron sulfate was eliminated (~0 g/mL). Later, it was found that and only ammonium sulfate and dipotassium phosphate were needed from the 9 k medium due to the presence of trace amounts of other elements present in the feed. An initial residence time of 8 days was maintained with an air flow rate of 1 L/M. Pyrite concentrate was used as a feedstock with 5% solid feeding.

2.8. Feeding Solution Making and Flow Rate Setup Procedure

The feeding solution was made with 50% DI water and 50% of the 9 k medium without iron sulfate. Then, feed solids were added by following the parameter requirement. The automatic feeding system was activated after every 6 hours to perform the automatic feeding and effluent extraction using a timer. The solution’s flow rate volume has been controlled using two multichannel peristaltic cartridge pumps. The feeding solution was stirred for at least ten minutes before each feeding to make a homogenous feeding solution.

2.9. Ferrous Oxidation Rate Test

The activity of the bacteria has been evaluated by doing a ferrous oxidation test. Every day, this test was performed by adding 1 g of FeSO4·7H2O into the system. Before adding the FeSO4 to reactor, Eh of the solution was measured. After applying 1 g ferrous sulfate, Eh was measured every 30 s to see the changes in Eh until it reached its initial Eh value. Then the data was analyzed using the ferrous oxidation plotter spreadsheet developed in our group to determine the ferrous oxidation rate.
By adding ferrous sulfate to the solution and then monitoring the change in oxidation reduction potential (ORP) as a function of time, it was possible to determine the rate of ferrous ion oxidation by bacteria. The associated Nernst Equation for half animal reaction Fe3+ + e ↔ Fe2+ is [13]:
E = E o + 2.303 R T n F l n γ F e 3 + m F e 3 + γ F e 2 + m F e 2 +
where Eo is the standard potential, E is the electrochemical potential, T is the absolute temperature, R is the gas constant, n is the number of electrons, a is the activity, F is the Faraday constant, and γ is the activity coefficient, which can be calculated using the Davies Equation (13):
l o g γ = A z 2 I 1 + I 0.2 I
If z is the ion’s charge, and I, the ionic strength, can be calculated by [13]:
I = 0.5 i = 1 n m i z i 2
The concentration of ferrous ions initially present can be estimated using the preceding equations by knowing the starting potential from an ORP probe and monitoring the new ORP value after adding a small amount of ferrous or ferric sulfate:
m F e i n i t 2 + = m F e a d d e d 2 + e x p ( E i n i t E a f t e r F e 2 + a d d i t i o n ) n F R T 1
The equation that results from the foregoing calculations can be used to determine the quantity of free (i.e., uncomplexed) ferric ions that were initially present [13]:
m F e i n i t 3 + = e x p ( E i n i t E o ) n F R T m F e i n i t 2 + γ F e 2 + γ F e 3 +
The ferrous ion concentration as a function of time can be calculated using these values as substitutes in the Nernst Equation. Eo is equal to 0.77 V in the ferrous/ferric half-cell reaction. By measuring the rate of ferrous ion oxidation, we can determine important information about the bacterial population and activity.
Assuming that all the basic needs are met, the oxidation rate is associated with ferrous ions. The ferrous biooxidation rate can be determined using traditional Michaelis–Menten or Monod kinetics [14]:
R F e + 2 o x . = C c e l l s μ max C F e + 2 Y c ( C F e + 2 + K m )

2.10. Acid Generation Rate Tracking Procedure

A titration test was conducted to determine the acid concentration in the leaching solution. The test procedures consisted of preparing a 0.1 M NaOH solution by dissolving NaOH pellets into DI water, taking 20 mL of the leaching solution from the bioreactor and filtering it to remove solids particles, preparing a burette filled with the 0.1 M NaOH solution, recording the initial reading on the burette, placing 10 mL of the filtered leaching solution into an Erlenmeyer flask and put it under the burette, titrating until the pH reading is 2.5, and closing the valve, and recording the final reading on the burette.

3. Results and Discussion

3.1. Feed Material Analysis

Inductively coupled plasma-mass spectroscopy (ICP-MS) and X-ray diffraction analysis of typical feed materials result in estimates of 68% pyrite, 16% calcite, and 16% other minerals such as aluminum-bearing silicate minerals. A representative scanning electron microscope (SEM) view of the feed material with corresponding electron dispersive X-ray spectrometer (EDS) mapping for specific elements is shown in Figure S1 (S represents the figures in supporting information section). The d80 size of the feed material is 75 μm. The feed material is a pyrite concentrate produced from coal waste and provided by Rick Honaker’s research group at the University of Kentucky. Figure 2 shows the SEM imaging/EDS mapping of Fine Pyrite at different magnifications. Fine pyrite particles have a uniform and sharp crystal structure and smooth surface. It can be seen that a significant number of FeS2 particles can be observed because Fe and S can be traced in identical points. Silica, clay materials, and calcite can be determined by identifying their positions in the map images. From the point analysis, it can be clearly seen that there are traces for Fe, S, C, Ca, Al, Si, and K.
In this study, key operating parameters that impact key performance indicators for biooxidation, which are acid production and the biooxidation rate, were evaluated. The key parameters that were evaluated are residence time, solids concentration, air flow rate, stirring speed, temperature, and nutrient availability. The evaluations and assessments were performed using bioreactors such as those shown in Figure 1.
As general background information, the bacteria catalyze reactions that can produce acid from sulfide minerals. A simplified set of reactions that describes what can happen generally is given as [12]:
2Fe2+ + 0.5O2 + 2H+ ↔ 2Fe3+ + H2O (Biotic–ferrous ion oxidation)
FeS2 + 2Fe3+ ↔ 3Fe2+ + 2So (Abiotic-indirect bioleaching)
2So + 3O2 + 2H2O ↔ 2SO42− + 4H+ (Biotic-direct bioleaching)
Or
15Fe2+ + 3.75O2 + 15H+ ↔ 15Fe3+ + 7.5H2O (Biotic–ferrous ion oxidation)
FeS2 + 6Fe3+ + 3H2O ↔ 7Fe2+ + 6H+ +S2O42− (Abiotic-indirect)
S2O42− + 9Fe3+ + 5H2O ↔ 8Fe2+ + 9H+ + HSO4 + FeSO4+ (Abiotic-indirect)
Or
15Fe2+ + 3.75O2 + 15H+ ↔ 15Fe3+ + 7.5H2O (Biotic–ferrous ion oxidation)
FeS2 + 15Fe3+ + 8H2O ↔ 15Fe2+ + 15H+ + HSO4 + FeSO4+ (Abiotic-indirect)
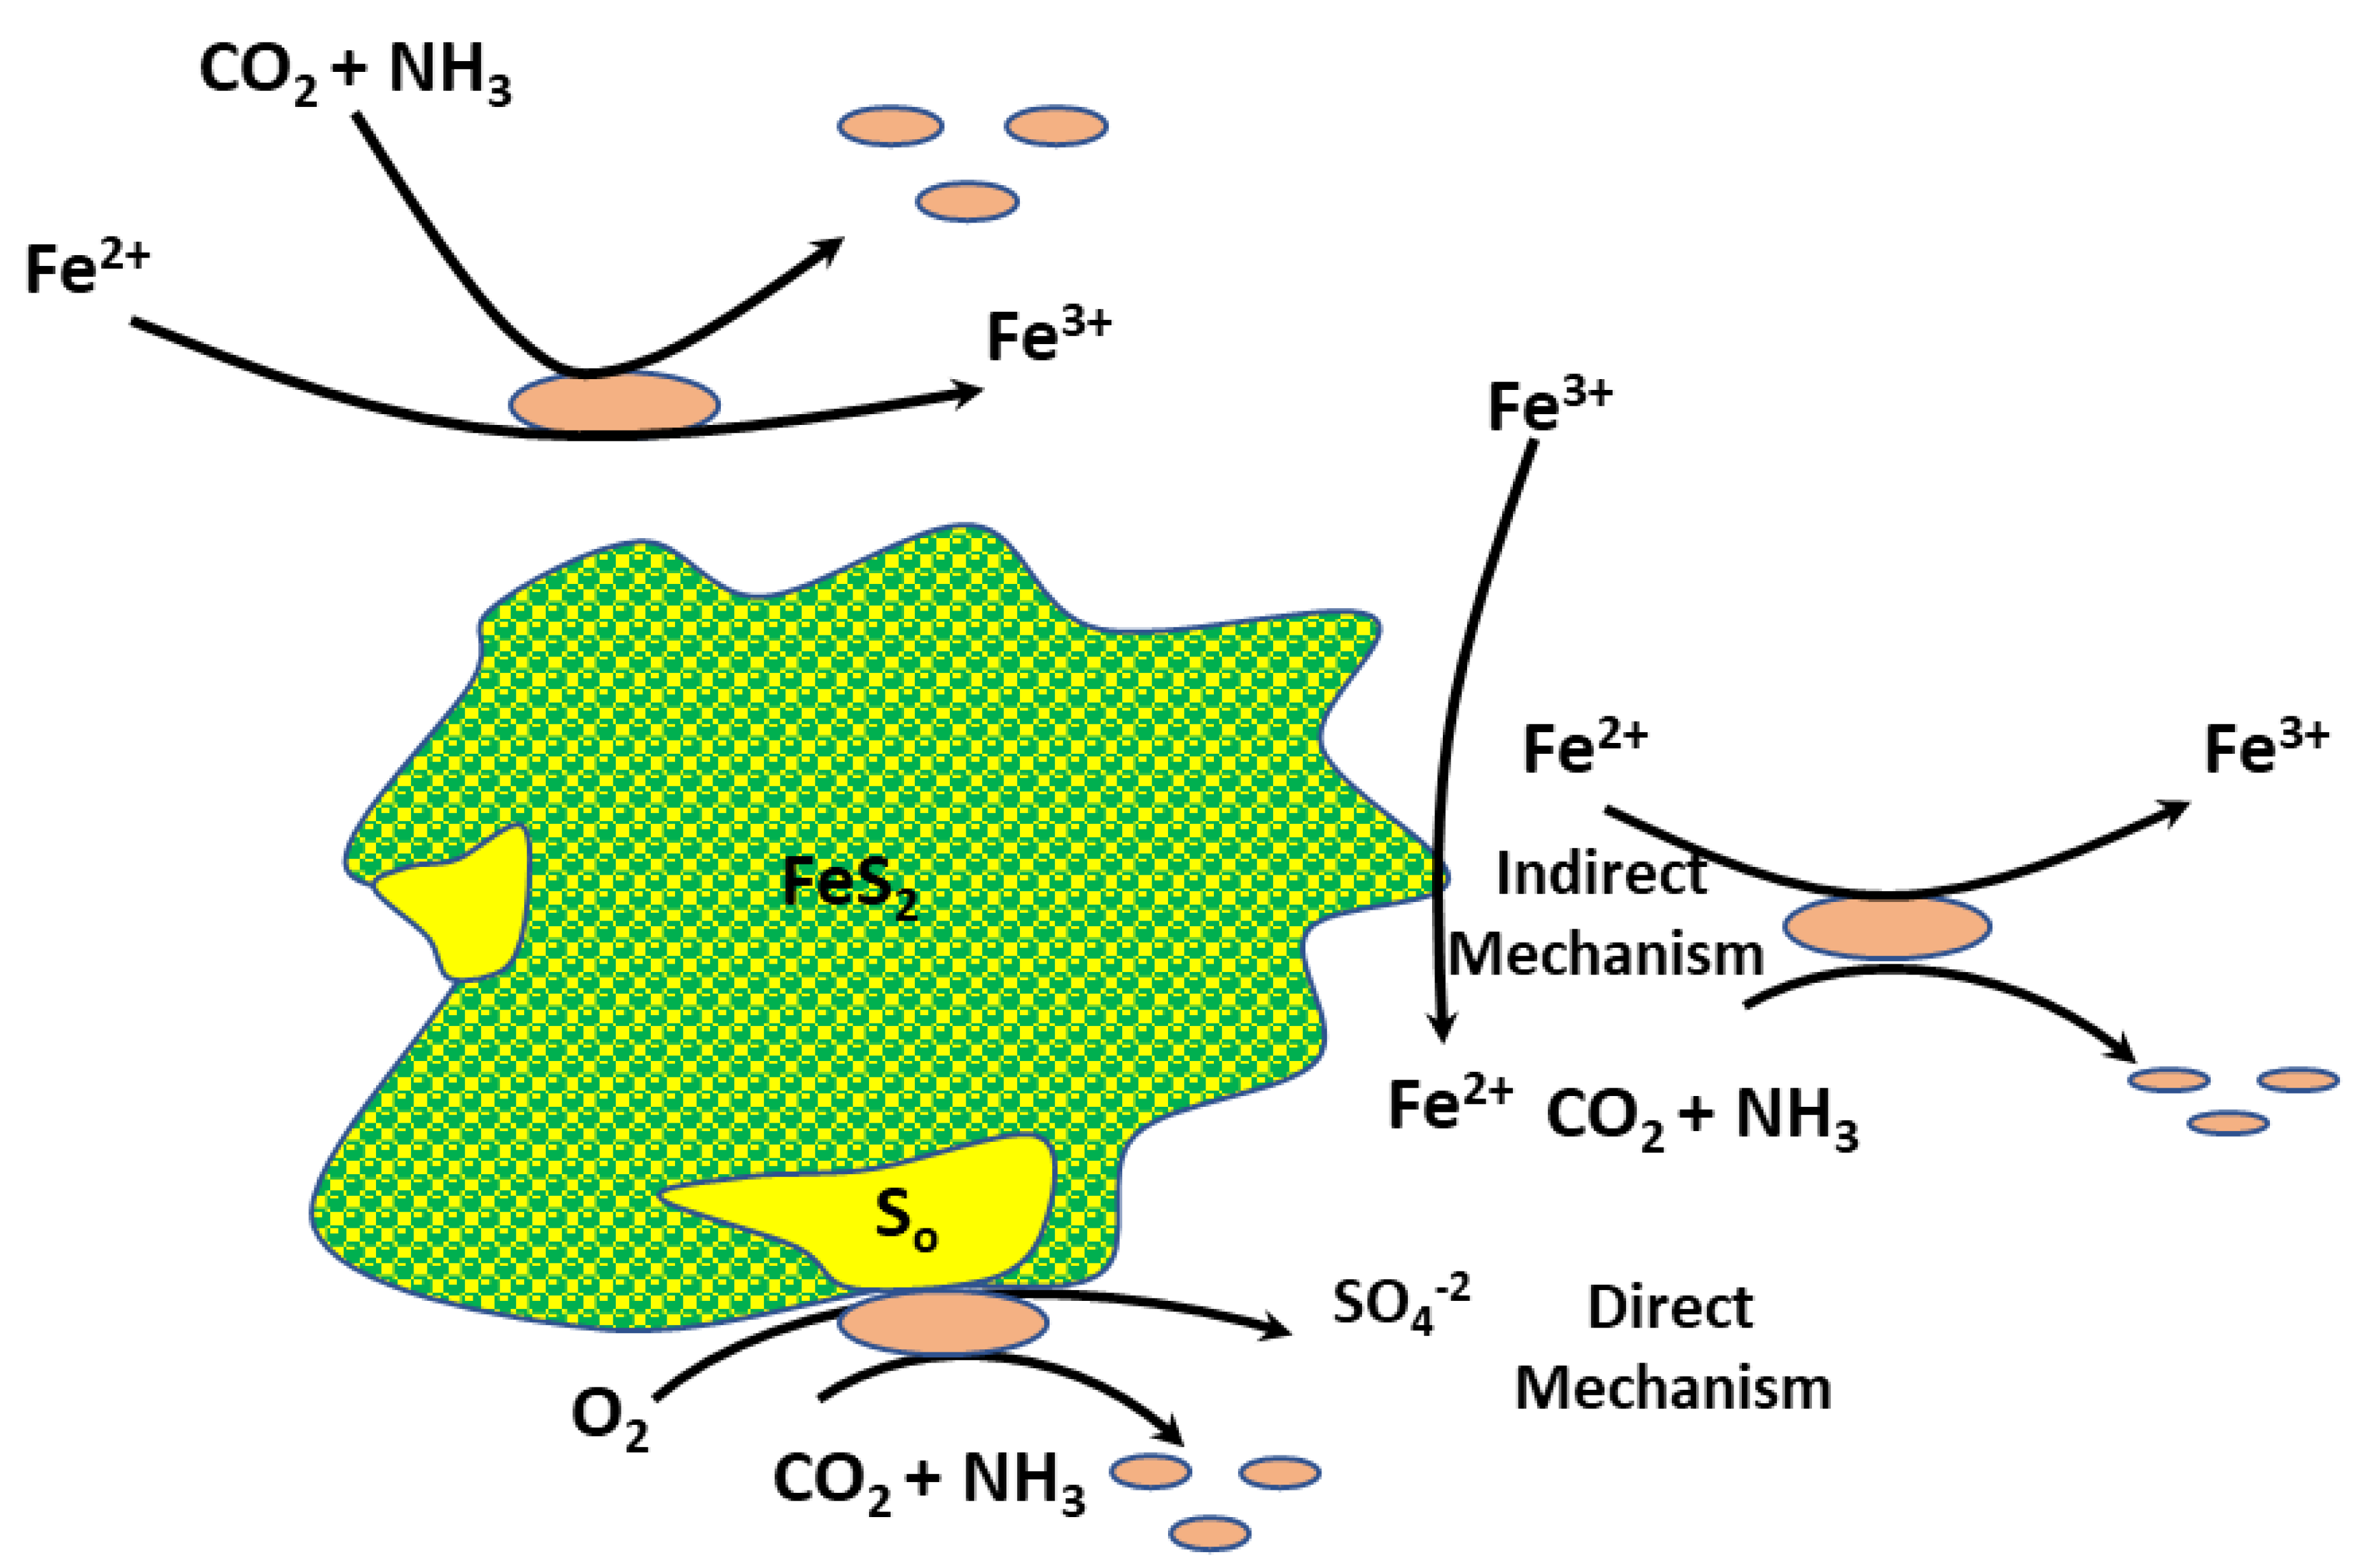
Note that the last two sets of reactions sum up to the same ratio of ferric ions per pyrite (15 to 1) even though one pathway has thiosulfate ions as an intermediate species. The top set of reactions involves some direct leaching in which the bacteria are attached to the elemental sulfur substrate at which the reaction takes place, whereas in the reactions involving ferric ions as the oxidant, the bacteria can facilitate pyrite leaching indirectly through the solution with the need for attachment. In the case of direct leaching, the ratio of ferric ions needed per pyrite molecule is 2 to 1. Correspondingly, the bacteria can cause direct or indirect leaching, and they can produce ferric ions from ferrous ions using oxygen and acid, then produce acid from pyrite [15,16,17,18]. Testing with pure pyrite leaching in ferric sulfate media indicates that the ratio of Fe3+ consumed per FeS2 is 14.8. This indicates the primary chemical oxidation of pyrite results primarily in sulfate production rather than elemental sulfur. This also indicates that the demand for ferric ions in pyrite oxidation is high.
Chemical analyses, performed using carbon disulfide dissolution of the elemental sulfur after heat treating the residual bioleached solids sample at 108 °C, indicated that the residual solids contained only 0.23% elemental sulfur, thereby suggesting that the pyrite dissolution pathway is not dominated by elemental sulfur formation. This provides corroboratory evidence that the main pathway for pyrite dissolution involves indirect leaching with ferric ions providing the primary oxidant. A schematic diagram of biooxidation of pyrite is shown in Figure 3.

3.2. Biooxidation Rates and Data Analysis

The rate of biooxidation was found to be as high as 4 g of ferrous ions oxidized per liter per hour based on testing with additions of ferrous sulfate, followed by corresponding electrochemical potential measurements and conversion to ferrous ion oxidation rate, and example of which is presented in Figure S2. The calculation of the ferrous ion concentration from the Eh measurement is as follows:
Based on a sustained rate of 3.1 g of ferric ions produced/liter/hour. If 15 moles of ferric ions are needed per mole of pyrite, a reactor with a residence time of 96 h would theoretically produce:
[ H + ] = 3.1 g F e 3 + l i t e r h r 55.85 g F e 3 + m o l e F e m o l e   H + 15 m o l e s   F e 3 + 96 h r = 0.35 M H +
A reactor with 6% feed concentrate containing 70% pyrite with enough time to oxidize nearly all it (usually around 96 h) can produce:
[ H + ] = 60   g   c o n c e n t r a t e l 0.70   g   p y r i t e g   c o n c e n t r a t e 1   m o l e   p y r i t e 119.98   g   p y r i t e 1   m o l e   H + m o l e   p y r i t e = 0.35 M H +
This is even matching of bacteria capacity with optimal concentrate feed if no acid consuming minerals are present.
A significant portion of the acid is consumed by the calcite and acid-consuming minerals in the feed concentrate. For the reaction of CaCO3 + 2H+ → Ca2+ + H2O + CO2, the potential consumption of acid is:
[ H + ] = 60   g   c o n c e n t r a t e l 0.17   g   c a l c i t e g   c o n c e n t r a t e 1   m o l e   c a l c i t e 100   g   c a l c i t e 2   m o l e   H + m o l e   c a l c i t e = 0.20   M H +
The observed apparent acid consumption is generally about 0.2 MH+, so about half of the acid the bacteria produce is consumed by calcite and other acid-consuming minerals in the feed. Note that the resulting amount of carbon dioxide released for bacterial use is equivalent to 0.0336 g of carbon dioxide per liter per hour, which is 2.7 times greater than the amount of carbon dioxide supplied by the typical air flow rate of 1 L/min in 2.5 L of reactor solution, thereby providing additional carbon dioxide for enhanced bacterial growth rates.
The corresponding amount of oxygen consumption was determined using an oxygen analyzer (Cerion OA-1 oxygen analyzer with auto ranging facility). The biooxidation consumed approximately 6% of the incoming oxygen (1.2% out of 20.2%) with an air flow rate of 1.5 L/min or 0.005 g O2/L/min.
This is similar to the rate of dissolved oxygen depletion of 0.003 g of O2/L/min measured using a dissolved oxygen (DO) probe and meter under similar conditions. The dissolved oxygen concentration was measured using an Oakton DO Six+ Portable dissolved oxygen meter. The corresponding probe was submerged inside the bioreactor until the reading was stable then the air supply is shut off and a DO value is collected every 30 s until close to complete depletion then the air supply is turned back on until equilibrium was reached again. The amount of acid that can be produced from 0.004 g of O2/L/min is theoretically 0.384 M assuming 3.75 moles of O2 per mole of pyrite and per mole of acid. This is consistent with observations.
Approximately 90% of the feed pyrite was oxidized by the bacteria in most tests. A notable exception was 70% oxidation of pyrite in the 2.5-day residence time test in which there was insufficient time for additional oxidation.
These Figures S3 and S4 show that solids concentration has a significant influence on performance. Although 9 wt% solids had a slight improvement in acid production rate, there is also a decrease in pyrite utilization efficiency and in the biooxidation rate. Previous calculations also suggest that 6 wt% pyrite concentrate in the feed is an appropriate level for the solids concentration that matches the ability of the bacteria to utilize the available pyrite in a typical 4-day residence time.
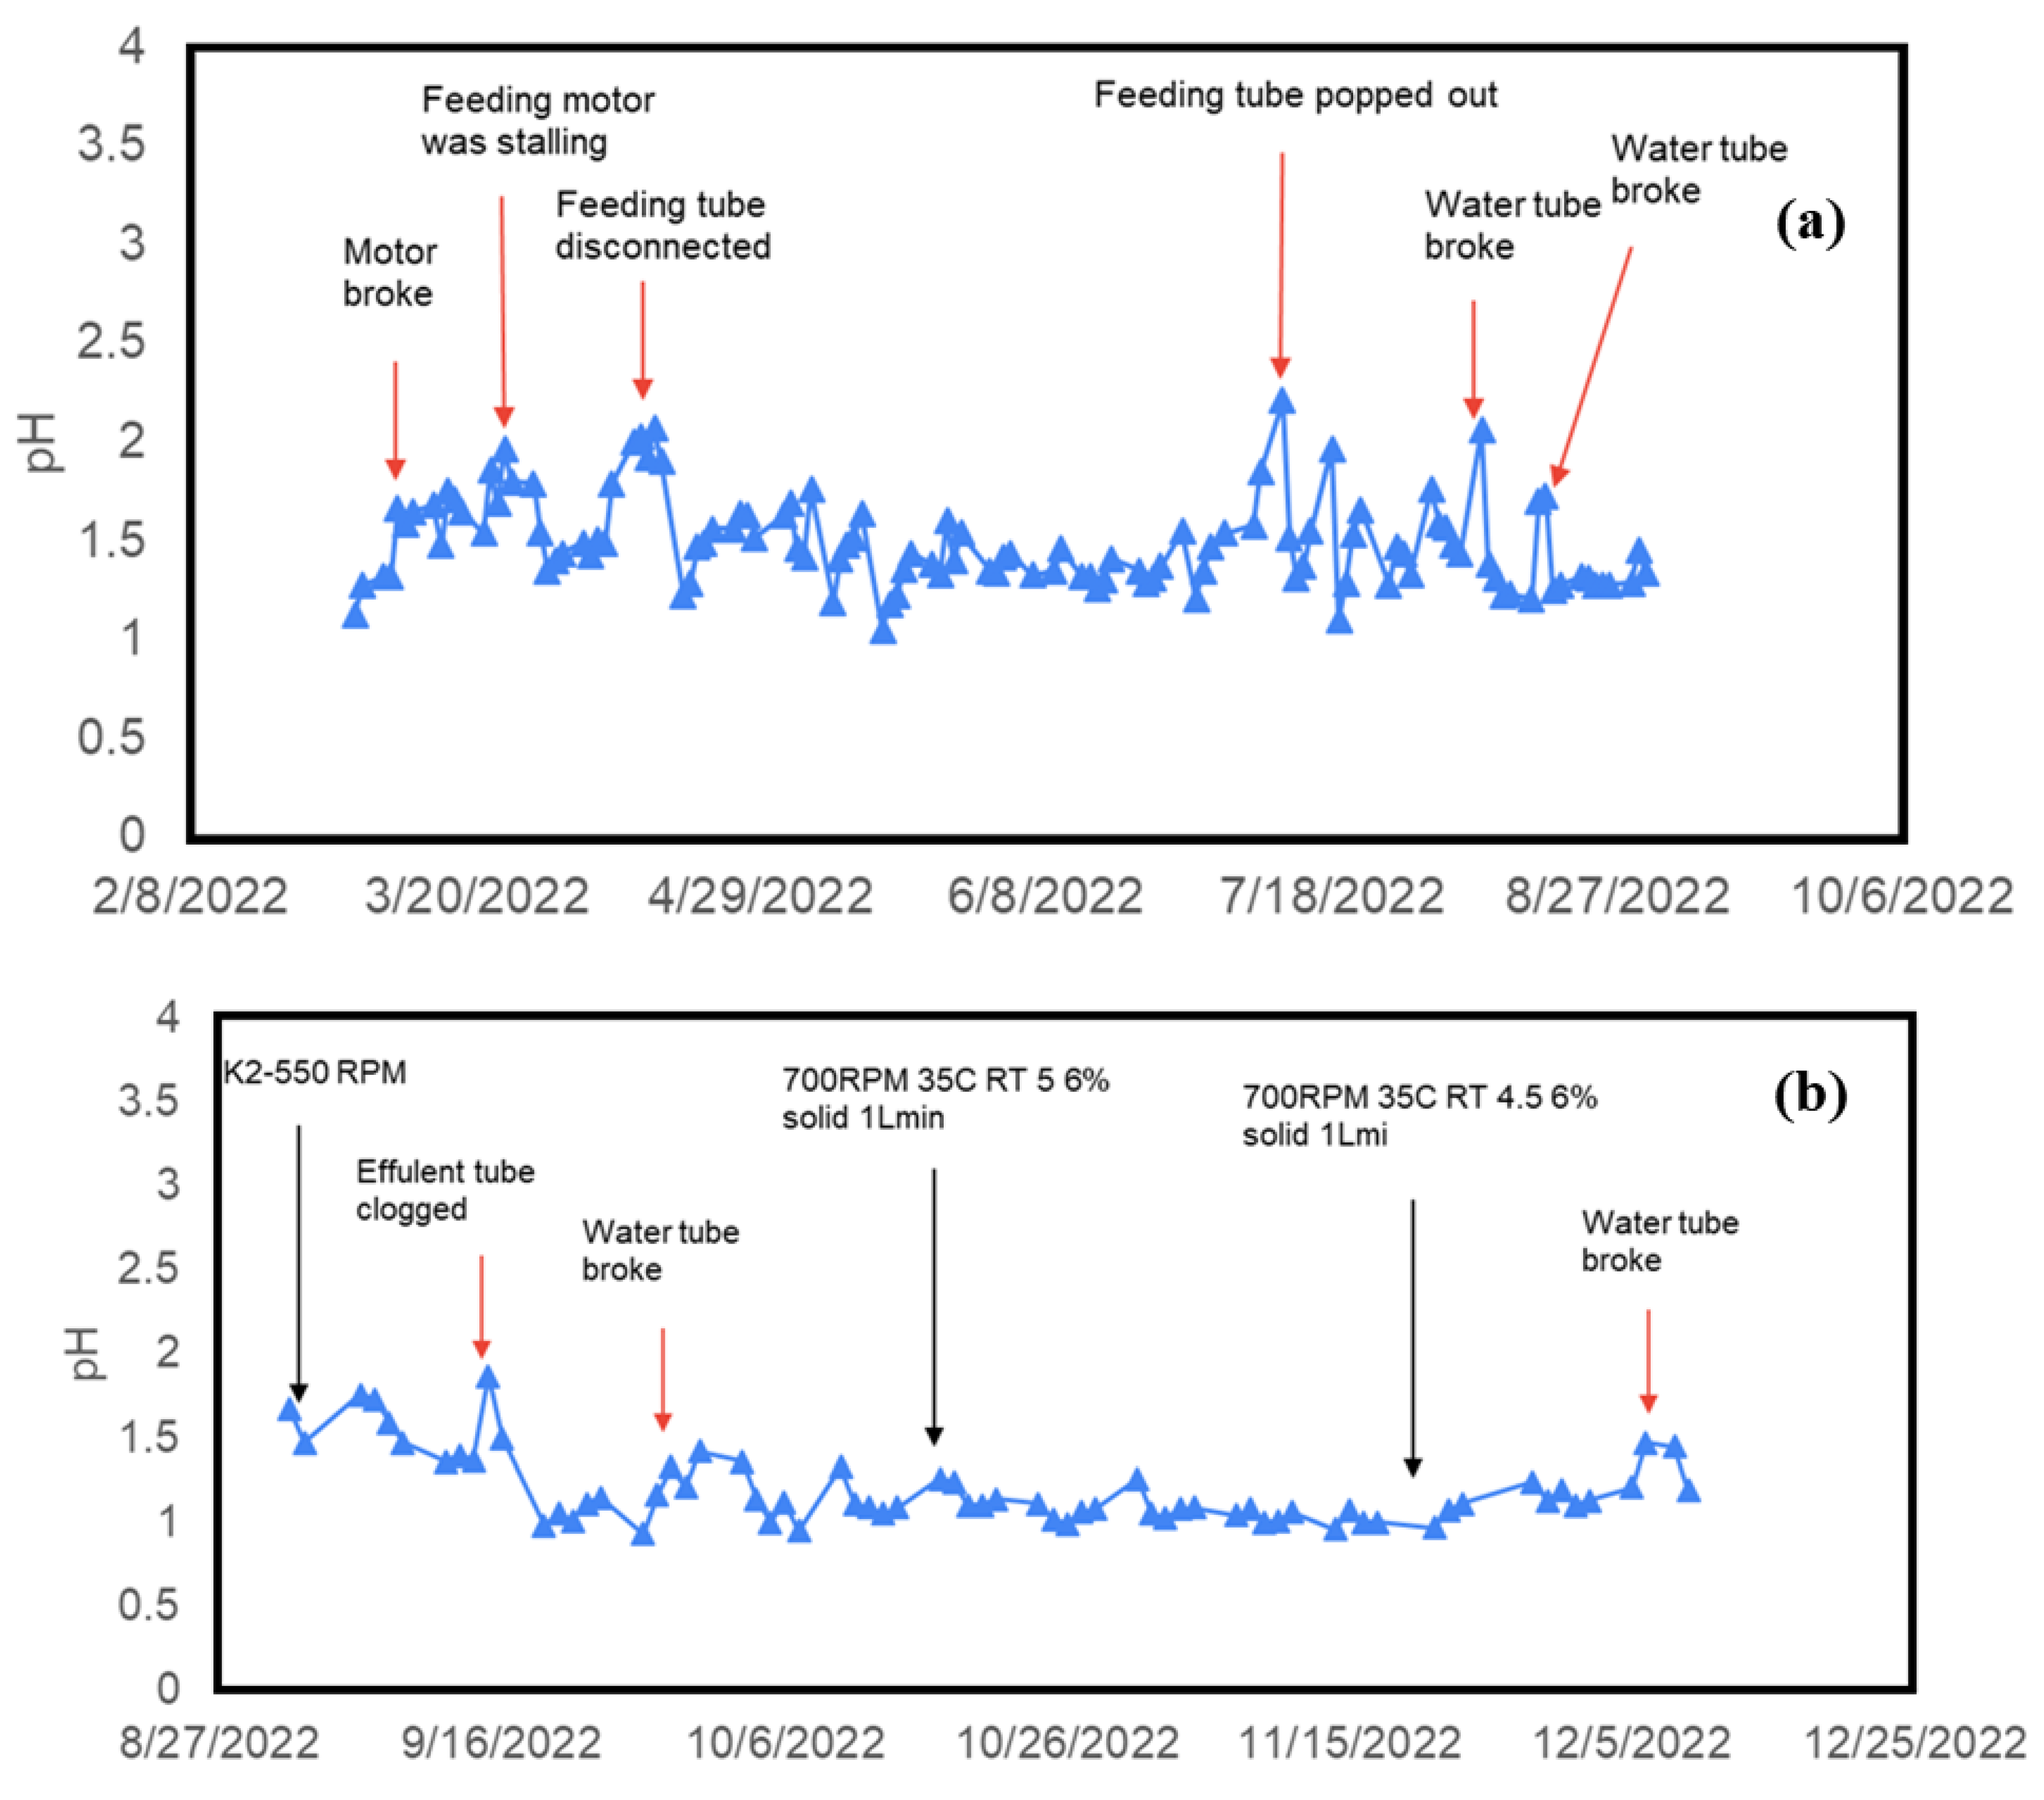
Representative plots of pH data along with operator notes for one of the bioreactors during most of 2022 are presented in Figure 4a,b. Representative plots of Eh data for one of the bioreactors during most of 2022 are presented in Figure 5a,b. Representative plots of ferrous ion oxidation data for one of the bioreactors during most of 2022 are presented in Figure S3a,b.
These bioreactor data plots illustrate the variations associated with parameter changes as well as laboratory-related issues that result while running these reactors 24 h per day, seven days per week. The data also shows that steady-state conditions can be achieved for sustained periods of time, provided that there are no mechanical or laboratory facility related issues that impact the operation of the bioreactors. The effects of changing residence time, solids concentration, air flow, stirring speed, temperature, and nutrient availability on biooxidation performance were assessed. Figure S4a shows the effect of solids concentration on biooxidation rate and Figure S4b shows the related net acid production rate.
The effects of air flow rate on performance are shown in Figure S5a,b. These figures show the related biooxidation rate and acid production rate performance levels, respectively. These result show that a flow rate of 1 L/min is best for the associated rotational speed of 500 rpm.
The effects of changing nutrient concentrations are illustrated in Figure S6. Note that the general nutrient formulation for 9 K medium, which is the general nutrient addition standard is:
9 K Medium (without ferrous sulfate heptahydrate)
  • (NH4)2SO4: 6.0 g/L
  • KCl: 0.2 g/L
  • K2HPO4: 1 g/L
  • MgSO4.7H2O: 1 g/L
  • Ca(NO3)2: 0.02 g/L
Note that because pyrite is FeS2 there is more than enough iron in the feed solids, so the iron is missing from the 9 K medium in this application.
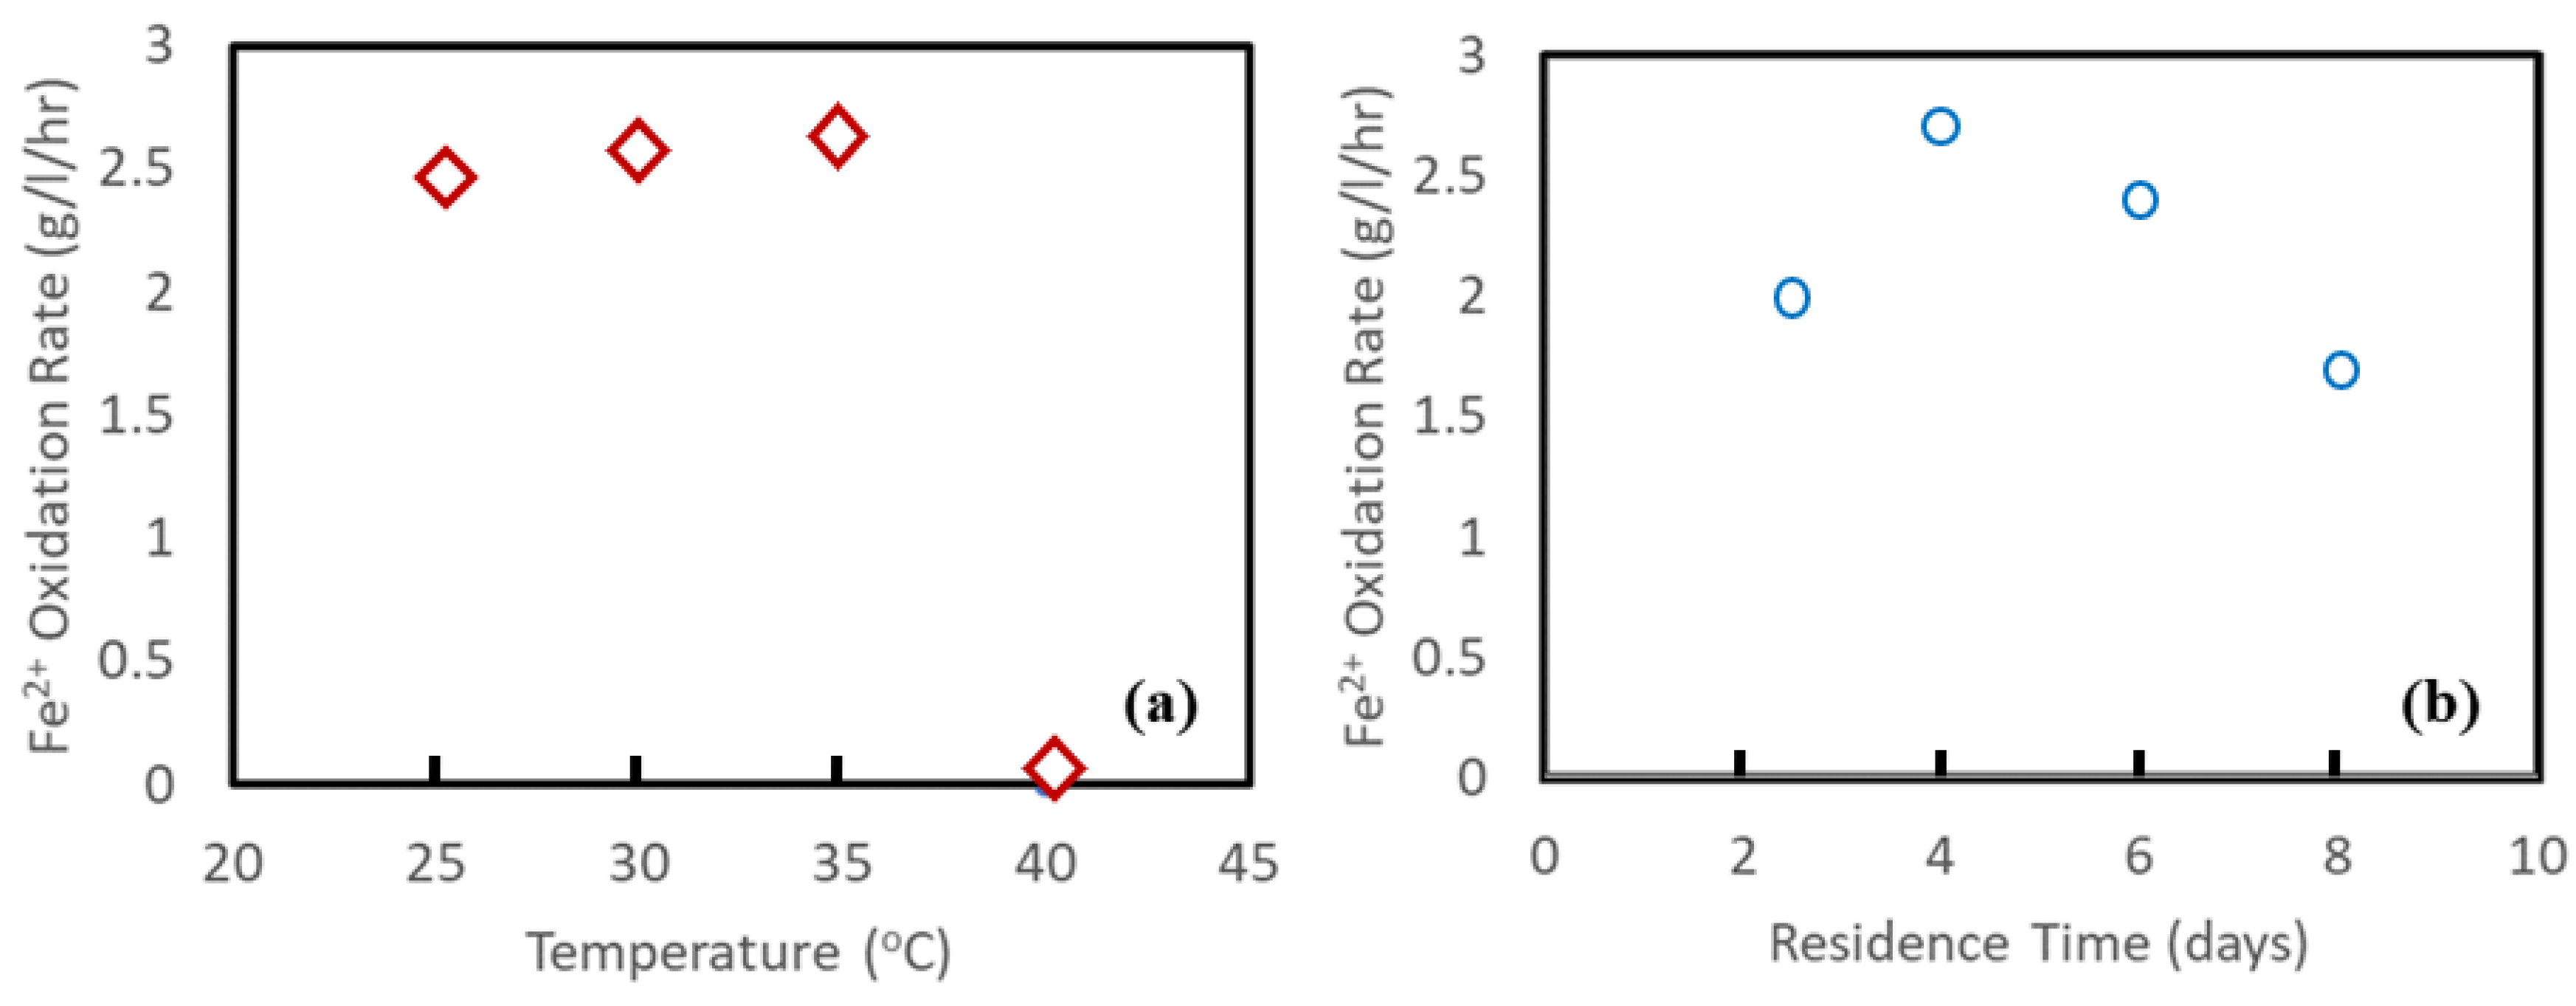
The results of the nutrient evaluation indicate the nutrient addition can be reduced substantially to include only 0.8 g of K2HPO4 per liter and 1.6 g of (NH4)2SO4 per liter. The reduction in the use of nutrients provides a significant cost savings relative to initial projections. The effect of temperature on biooxidation performance is shown in Figure 6a. The data show that increasing temperature is beneficial up to 35 °C. However, the data also show that increasing the temperature to 40 °C is very detrimental to performance. Thus, temperature is a very critical parameter to control well. Note that temperature has a significant impact on how effectively bioleaching occurs. The pace of bacterial metabolic activities and, thus, the rate of metal extraction can both be increased by raising the temperature. High temperatures can, however, potentially harm microorganisms, resulting in diminished viability and diminished effectiveness.
The effects of residence time on biooxidation performance are presented in Figure 6b and Figure 7a. These data show that a residence time of 4 days resulted in the best performance. The lower performance for 2.5 days of residence is attributed to the fast rate of effluent removal of bacteria relative to the time required for the bacteria to reproduce. The short residence time may also have reduced the overall utilization of pyrite, thereby decreasing performance. The longer residence times above 4 days can result in depletion of resources as pyrite is completely dissolved at longer residence times, making the available feed in limited supply as residence times become long, thereby reducing performance. The effect of stirring speed on biooxidation performance is presented in Figure 7b. These data indicate that performance increases as stirring speed increases. In general, stirring encourages close contact between the microorganisms and the substrate by distributing the substrate (ore or waste material) and bacteria throughout the leaching reactor uniformly. This can speed up the extraction of metal and help to guarantee reliable outcomes. The effectiveness of bioleaching, however, might also be negatively impacted by excessive stirring. Very high stirring rates can create high shear forces at impeller tips that can harm the bacteria mechanically and decrease their viability.
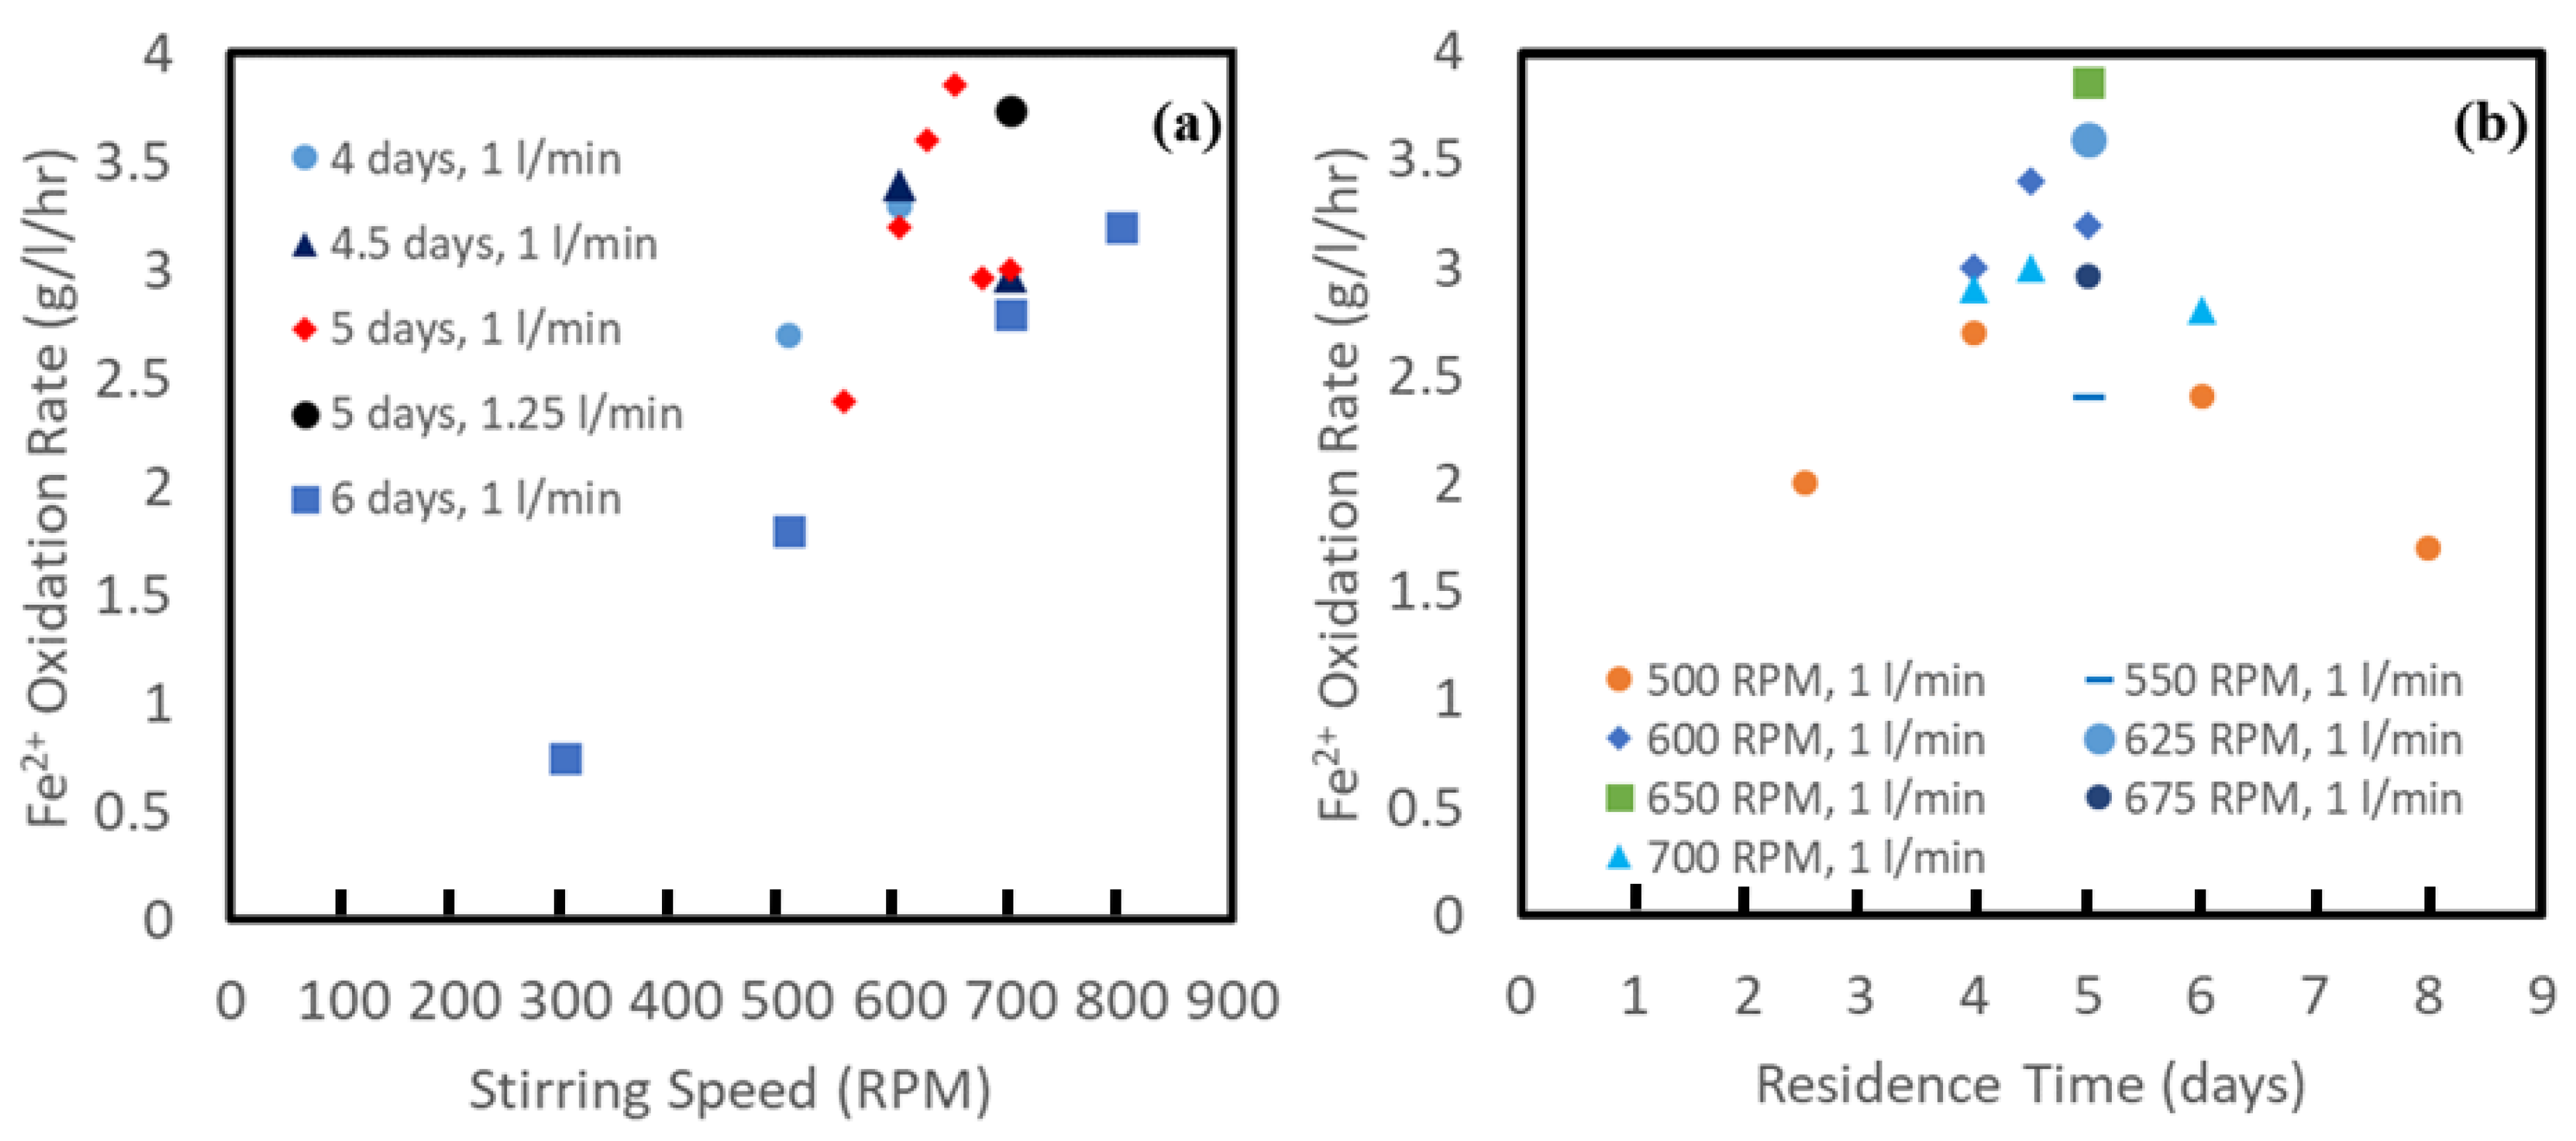
The data from these tests indicated there were some clear optimum levels of performance for parameters such as air flow rate and residence time. The data also showed potential for increasing performance by increasing stirring rate. Therefore, additional testing was performed to determine optimum levels near observed performance peaks presented in previous plots. The optimization testing focused on stirring speed and residence time. The corresponding results are presented in Figure 8a,b. Note that the optimum performance is achieved at a stirring speed of 650 RPM and 5 days of residence time. Apart from those factors, appropriate adaptation conditions are also essential for the health of microorganisms and the associated performance [19]. It was noted in the case of Zn2+, where Acidithiobacillus bacteria used for sphalerite concentrate, leaching was significantly improved when the appropriate protocol was followed [19].

3.3. Analysis of Bacteria

Genome sequencing was performed to understand the species of microorganisms present in different operating conditions. Bacterial concentrations were also analyzed through these sequencing methods. An HPC test was conducted to see how the bacterial colonies can be formed under other conditions. Figure 9 shows the presence of Acidithiobacillus, Leptospirillum, and Sulfolobacillus bacteria.
The dominance of Leptospirillum ferriphilum in the reactors is consistent with the related literature [20,21]. Gram-negative, vibrio- or spiral-shaped, and obligately chemolithotrophic Leptospirillum species are connected to the deep branching class Nitrospira phylogenetically [22].
They are widely known to be the crucial biological catalysts in various metal sulfide biooxidation processes and can be found in a wide range of acidophilic microbial communities [22]. Leptospirillum species play important roles in the biogeochemical cycle of iron, as they are the most common iron-oxidizing bacteria in metal-tolerant, acidophilic microbial consortia that cause ferric iron [Fe(III)]-mediated oxidative dissolution of sulfide minerals. Leptospirilla have been identified to be the main contributors [22] responsible for the development of acid mine drainage under the environmental circumstances characterized by temperature above 40 °C and pH value below 1.0. Apart from genome sequencing, oxidized pyrite solids were investigated through a high magnification SEM imaging system to view potential bacterial attachment to the pyrite surface. These SEM images are presented in Figure 10a–f. More detailed analyses have been presented in previous report [12].

3.4. Assessment of Leaching of REE/CM from Pyrite Concentrate

The pyrite feed concentrate contains some REE/CM content that is extracted during the pyrite biooxidation. Table 1 provides the feed concentration of selected REE/CM for which significant extraction occurs during the pyrite concentrate biooxidation. The data show that although the concentrations are not high; the extraction for many of these elements is significant and would augment the subsequent REE/CM extraction from the coal waste ore for which the acid is generated.

4. Conclusions

Overall, microorganism-assisted sulfuric acid production processing parameters were assessed in this research. The acid produced from biooxidation of pyrite can be utilized for REE dissolution from the ore matrix as well as from the pyrite as shown in this paper. The bacteria are adapted to the bioleaching solution containing pyrite concentrate, with a ferrous oxidation rate of up to 4 g/L/h. Pyrite utilization was nearly complete based on analyses of residual solids as well as general mass balancing. The elemental sulfur analysis confirmed that most of the sulfur was converted to sulfate for acid generation. Air flow rate, stirring speed, residence time, feed solids concentration, and temperature were all shown to have significant effects on biooxidation performance. It was observed that a typical residence time of 4–5 days is most effective for biooxidation performance. Genome sequencing tests confirm the dominance of Leptospirillum species.

Supplementary Materials

The following supporting information can be downloaded at: https://www.mdpi.com/article/10.3390/pr11041005/s1.

Author Contributions

Conceptualization, M.L.F. and P.K.S.; methodology, P.K.S.; software, P.P. and P.K.S.; validation, P.P., J.K.I. and M.L.F.; formal analysis, P.P. and J.K.I.; investigation, M.L.F. and P.K.S.; resources, M.L.F.; data curation, J.K.I. and P.P.; writing—original draft preparation, M.L.F.; writing—review and editing, P.K.S.; visualization, M.L.F.; supervision, M.L.F. and P.K.S.; project administration, M.L.F. and P.K.S.; funding acquisition, M.L.F. All authors have read and agreed to the published version of the manuscript.

Funding

This research was funded by the U.S. Department of Energy, grant number DE-FE0031827. This report was prepared as an account of work sponsored by an agency of the United States government. Neither the United States government nor any agency thereof, nor any of their employees, make any warranty, express or implied, or assumes any legal liability or responsibility for the accuracy, completeness, or usefulness of any information, apparatus, product, or process disclosed, or represents that its use would not infringe privately owned rights. Reference to any specific commercial product, process, or service by trade name, trademark, manufacturer, or otherwise does not necessarily constitute or imply its endorsement, recommendation, or favoring by the United States government or any agency there. The views and opinions of author’s expressed herein do not necessarily state or knows of the United States government or any agency thereof.

Data Availability Statement

The data presented in this study are available on request from the authors.

Acknowledgments

The pyrite concentrate feed material used in this study was provided by the research group of Rick Honaker at the University of Kentucky.

Conflicts of Interest

The authors declare no conflict of interest.

References

  1. Vera, M.; Schippers, A.; Sand, W. Progress in bioleaching: Fundamentals and mechanisms of bacterial metal sulfide oxidation—Part A. Appl. Microbiol. Biotechnol. 2013, 97, 7529–7541. [Google Scholar] [CrossRef]
  2. Rawlings, D.E. Heavy metal mining using microbes. Annu. Rev. Microbiol. 2002, 56, 65–91. [Google Scholar] [CrossRef]
  3. Rawlings, D.E.; Dew, D.; du Plessis, C. Biomineralization of metal-containing ores and concentrates. TRENDS Biotechnol. 2003, 21, 38–44. [Google Scholar] [CrossRef]
  4. Olson, G.; Brierley, J.; Brierley, C. Bioleaching review part B. Appl. Microbiol. Biotechnol. 2003, 63, 249–257. [Google Scholar] [CrossRef] [PubMed]
  5. Brierley, J.A. A perspective on developments in biohydrometallurgy. Hydrometallurgy 2008, 94, 2–7. [Google Scholar] [CrossRef]
  6. Johnson, D.B. Development and application of biotechnologies in the metal mining industry. Environ. Sci. Pollut. Res. 2013, 20, 7768–7776. [Google Scholar] [CrossRef]
  7. Brierley, C.L.; Le Roux, N.W. Bacterial leaching. CRC Crit. Rev. Microbiol. 1978, 6, 207–262. [Google Scholar] [CrossRef] [PubMed]
  8. Colmer, A.R.; Hinkle, M. The role of microorganisms in acid mine drainage: A preliminary report. Science 1947, 106, 253–256. [Google Scholar] [CrossRef]
  9. Valdés, J.; Pedroso, I.; Quatrini, R.; Dodson, R.J.; Tettelin, H.; Blake, R.; Eisen, J.A.; Holmes, D.S. Acidithiobacillus ferrooxidans metabolism: From genome sequence to industrial applications. BMC Genom. 2008, 9, 597. [Google Scholar] [CrossRef] [Green Version]
  10. Van Aswegen, P.; Godfrey, M.; Miller, D.; Haines, A. Developments and innovations in bacterial oxidation of refractory ores. Min. Metall. Explor. 1991, 8, 188–191. [Google Scholar] [CrossRef]
  11. Yang, Y.; Qian, C.; Shi, X.; Tian, B.; Chu, H.; Wang, J.; Xin, B. Efficient and industrial production of H2SO4 from sulfur sludge by acidophilic cells in a membrane bioreactor via optimizing process. J. Clean. Prod. 2020, 250, 119444. [Google Scholar] [CrossRef]
  12. Sarswat, P.K.; Podder, P.; Zhang, Z.; Free, M.L. Autogenous acid production using a regulated bio-oxidation method for economical recovery of REEs and critical metals from coal-based resources. Appl. Surf. Sci. Adv. 2022, 11, 100283. [Google Scholar] [CrossRef]
  13. Sarswat, P.K.; Leake, M.; Allen, L.; Free, M.L.; Hu, X.; Kim, D.; Noble, A.; Luttrell, G.H. Efficient recovery of rare earth elements from coal based resources: A bioleaching approach. Mater. Today Chem. 2020, 16, 100246. [Google Scholar] [CrossRef]
  14. Bailey, J.; Ollis, D. Applied enzyme catalysis. Biochem. Eng. Fundam. 1986, 2, 157–227. [Google Scholar]
  15. Podder, P.; Free, M.L.; Sarswat, P.K. Extraction and Recovery of Rare-Earth Elements and Critical Materials from Coal Waste Using Low Cost Processing Methods: Acid Generation Using Acidithiobacillus Ferrooxidans Mediated Bio-Oxidation of Pyrite. In Rare Metal Technology; Ouchi, T., Azimi, G., Forsberg, K., Kim, H., Alam, S., Neelameggham, N.R., Baba, A.A., Peng, H., Eds.; Springer International Publishing: Cham, Switzerland, 2022; pp. 51–62. [Google Scholar]
  16. Podder, P.; Zhang, Z.; Honaker, R.Q.; Free, M.L.; Sarswat, P.K. Evaluating and Enhancing Iron Removal via Filterable Iron Precipitates Formation during Coal-Waste Bioleaching. Eng 2021, 2, 632–642. [Google Scholar] [CrossRef]
  17. Zhang, Z.; Allen, L.; Podder, P.; Free, M.L.; Sarswat, P.K. Recovery and Enhanced Upgrading of Rare Earth Elements from Coal-Based Resources: Bioleaching and Precipitation. Minerals 2021, 11, 484. [Google Scholar] [CrossRef]
  18. Murali, A.; Plummer, M.J.; Shine, A.E.; Free, M.L.; Sarswat, P.K. Optimized bioengineered copper recovery from electronic wastes to increase recycling and reduce environmental impact. J. Hazard. Mater. Adv. 2022, 5, 100031. [Google Scholar] [CrossRef]
  19. Haghshenas, D.F.; Alamdari, E.K.; Torkmahalleh, M.A.; Bonakdarpour, B.; Nasernejad, B. Adaptation of Acidithiobacillus ferrooxidans to high grade sphalerite concentrate. Miner. Eng. 2009, 22, 1299–1306. [Google Scholar] [CrossRef]
  20. Rawlings, D.E.; Johnson, D.B. The microbiology of biomining: Development and optimization of mineral-oxidizing microbial consortia. Microbiology 2007, 153, 315–324. [Google Scholar] [CrossRef] [Green Version]
  21. Johnson, D.B. Biomining—Biotechnologies for extracting and recovering metals from ores and waste materials. Curr. Opin. Biotechnol. 2014, 30, 24–31. [Google Scholar] [CrossRef]
  22. Zhang, X.; Liu, X.; Yang, F.; Chen, L. Pan-Genome Analysis Links the Hereditary Variation of Leptospirillum ferriphilum With Its Evolutionary Adaptation. Front. Microbiol. 2018, 9, 577. [Google Scholar] [CrossRef] [PubMed] [Green Version]
Figure 1. (a) A digital photograph of bioreactor/related support equipment and tubing. (b) a schematic diagram of bioreactor setup. The red line is the heated water, the green line is the effluent, the yellow line is the air input, and the blue line is the feed solution.
Processes 11 01005 g001
Figure 2. SEM imaging and EDS mapping of fine pyrite.
Processes 11 01005 g002
Figure 3. Schematic diagram of biooxidation of pyrite.
Processes 11 01005 g003
Figure 4. (a) Comparison of pH data in the WBB 419 bioreactor from 3 March 2022 to 31 August 2022. (b) Comparison of pH data in the WBB 419 bioreactor from 9 January 2022 to 12 September 2022.
Processes 11 01005 g004
Figure 5. Comparison of Eh data in the WBB 419 bioreactor: (a) from 3 March 2022 to 31 August 2022. (b) from 9 January 2022 to 12 September 2022.
Processes 11 01005 g005
Figure 6. (a) Effect of temperature on ferrous ion production rate. (b) Comparison of residence time and ferrous ion oxidation rate.
Processes 11 01005 g006
Figure 7. (a) Comparison of residence time and acid production rate. (b) Initial comparison of stirring speed and ferrous ion oxidation rate.
Processes 11 01005 g007
Figure 8. Detailed, more comprehensive comparison of: (a) stirring speed and ferrous ion oxidation rate; (b) residence time and ferrous ion oxidation rate.
Processes 11 01005 g008
Figure 9. Genome sequencing data from samples originating from bioreactor solutions from 2.5- and 8-days residence time tests at 500 RPM, 1 L/min air flow, 35 °C, and 6 wt% solids conditions showing the relative fraction of species that are generally identified with biooxidation of pyrite.
Processes 11 01005 g009
Figure 10. (af). View of magnified pyrite surface from samples originating from bioreactor solutions from 2.5- and 8-days residence time tests at 500 RPM, 1 L/min air flow, 35 °C, and 6 wt% solids conditions showing the relative fraction of species that are generally identified with biooxidation of pyrite.
Processes 11 01005 g010
Table 1. Pyrite concentrate feed material REE/CM content for selected elements for which the extraction exceeds 10% during biooxidation.
ElementFeed (ppm)Extraction (%)
Al138314.71
Co32.8676.11
Dy1.9141.36
Er0.9856.12
Gd6.6520.75
Ho0.356.67
Lu0.1450.00
Mg199130.84
Sc3.8647.67
Tb0.3138.71
Tm0.0955.56
Y7.3153.63
Yb1.9430.41
Zn148211.76
Disclaimer/Publisher’s Note: The statements, opinions and data contained in all publications are solely those of the individual author(s) and contributor(s) and not of MDPI and/or the editor(s). MDPI and/or the editor(s) disclaim responsibility for any injury to people or property resulting from any ideas, methods, instructions or products referred to in the content.