Abstract
A methodology such as near-infrared (NIR) spectroscopy, which enables in situ and in real-time analysis, is crucial to perform quality control of biodiesel, since it is blended into diesel fuel and the presence of contaminants can hinder its performance. This work aimed to compare the performance of a benchtop Fourier Transform (FT) NIR spectrometer with a prototype of a portable, miniaturized near-infrared spectrometer (miniNIR) to detect and quantify contaminants in biodiesel and biodiesel in diesel. In general, good models based on principal component analysis-linear discriminant analysis (PCA-LDA) of FT-NIR spectra were obtained, predicting with high accuracies biodiesel contaminants and biodiesel in diesel (between 75% to 95%), as well as good partial least square (PLS) regression models to predict contaminants concentration in biodiesel and biodiesel concentration in diesel/biodiesel blends, with high coefficients of determination (between 0.83 and 0.99) and low prediction errors. The miniNIR prototype’s PCA-LDA models enabled the prediction of target contaminants with good accuracies (between 66% and 86%), and a PLS model enabled the prediction of biodiesel concentration in diesel with a reasonable coefficient of determination (0.68), pointing to the device’s potential for preliminary analysis of biodiesel which, associated with its potential low cost and portability, could increase biodiesel quality control.
1. Introduction
Every passing year registers significant growth in energy consumption, with 80% of the global energy consumption coming from fossil fuels, aggravating pollution levels and thus contributing to the environmental and energy crises [1]. Recently, energy policies have focused on diversifying primary energy sources and efficient use of resources to reduce greenhouse gases’ emissions, without compromising the economic aspect of their commercialization or the quality of citizens’ lives [2]. Such is the case of biofuels, fuels produced from biomass and that, in global balance, have lower exhaust emissions than fossil fuels [3]. Biodiesel is a biofuel made up of fatty acid alkyl esters resulting from the transesterification of triglycerides found in oils with alcohols in the presence of a catalyst, with glycerol as a by-product [4]. Its self-lubricant [1], devoid of sulfur and aromatic compounds (making emissions associated with engine wear very low) and the presence of oxygen in the ester molecules make for a combustion that emits significantly fewer particulates, hydrocarbons, CO, and CO2 than fossil diesel [5]. It offers a similar performance to fossil diesel, with which it shares similarities in terms of cetane number, viscosity, and calorific value [1]. Since it has a higher flash point than fossil diesel, it is also safer to handle, transport, and store [6,7].
Given their similarities, biodiesel can also be blended with fossil diesel. Diesel/biodiesel blends are designated “B”, followed by a number indicating the percentage of volume biodiesel mixed in the diesel. When blended with diesel, biodiesel increases the lubricity and the cetane number of the overall fuel, reducing ignition delay [8]. Currently, B7 is the maximum blend permitted by the Fuel Quality Directive for sale across the EU, and the legislation does not require a minimum biodiesel percentage [5]. In the USA, B20 is a commonly used blend, balanced in terms of cost, emissions, and cold flow properties.
Like all fossil fuels, biodiesel is subjected to quality controls to ensure it is safe to use in engines, whether by itself or in diesel/biodiesel blends. Crude biodiesel may have some residual methanol and glycerol after the reaction is concluded, which is removed through washing procedures so that the biodiesel can comply with the concentration limit for methanol and glycerol, for example, imposed by the European Standard EN 14214, both of which is 0.2%(w/w) [9]. Diesel/biodiesel blends can sometimes display a high raw fatty oil content, either due to incomplete transesterification of the biodiesel or to adulteration with cheaper supplies such as vegetable oil (VO) or used cooking oil (UCO) to profit from subsidies involved in biodiesel production [1,2]. These VOs are viscous and less volatile than biodiesel, causing carbon deposits, injection blocking, and incomplete combustion of the fuel [10], which have negative consequences on engine start-up control, acceleration, and emission of gases [11]. Therefore, the rising demand for biodiesel has induced a rise in demand for analytical procedures that quickly and effectively detect anomalies during synthesis, contaminants, and blend adulteration.
While adequate, the use of chromatographic techniques for biodiesel quality control has some drawbacks, as they involve sample destruction, generate large amounts of toxic waste, require off-line sample preparation, and are often time-consuming [2]. In later years, the industry has strived for the implementation of quick, non-destructive, in- and online monitoring methods that do not require sample preprocessing [4]. For example, when applied to in situ monitoring of transesterification reactions, these control methodologies could detect any deviation of the process, allowing its mitigation, without compromising the outcome of the reaction [12]. Such is the case with near-infrared (NIR) spectroscopy, which reflects a combination of tones and overtones of fundamental vibrations of functional groups (e.g., NH, OH, and CH groups) [6]. For an in situ and in real-time analysis, an optical fiber associated with a transflectance probe is typically used, which combines transmittance and reflectance operation modes [13]. In the case of spectrometers, the Fourier Transform (FT) NIR spectrometer is usually preferred to dispersive equipment, due to its greater wavelength accuracy, spectral quality, and reproducibility [14], covering regions between 12,820 and 4000 cm−1 (780–2500 nm). NIR spectroscopy has been successfully implemented in the biodiesel industry in reaction monitoring [4,12], quality assessment (methyl ester content and properties) [15,16,17,18], contaminant detection (water, methanol, and glycerol) [15,19,20], VO detection [21], and to determine biodiesel content in biodiesel/diesel blends [14,22,23,24,25,26,27], as described in Table 1.

Table 1.
Predictability of spectra partial least square (PLS) regression models of biodiesel contaminants, biodiesel content in diesel blends, biodiesel parameters of the biodiesel synthesis, and ester content. By default, except when stated otherwise, all analyses were made with a dispersive NIR benchtop spectrometer using a transflectance probe coupled to a fiber optic cable enabling in situ analysis.
Recently, portable and some even miniaturized NIR (miniNIR) spectrometers, working mostly in at-line formats, i.e., rapid off-line, have been developed for the quality control of fuels [35]. Their ergonomic design (small size that allows its implementation in portable, pocket-size devices [36]), easy operation, and compliance with the principles of green chemistry [22] significantly reduce time and cost of analysis, which ultimately will increase biofuel monitoring at all stakeholders, including distributors and final consumers, which can increase trust and consequently biodiesel utilization. However, to achieve this, miniaturized equipment must have acceptable monitoring quality characteristics in relation to the non-miniaturized equipment, such as the more sophisticated ones based on FT-NIR spectroscopy. Some examples of applications of miniaturized NIR spectrometers in recent years are in the detection of counterfeit drugs, the assessment of wood properties, and the examination of contaminated soil for remediation application [37]. These devices have become especially prevalent in the agri-food sector, in the determination of quality parameters of final food products, detection of adulteration of meat and dairy, prediction of nutritional values (protein, lipids, and moisture), discrimination between sources of the food products, and much more [38]. Their application for fuel analysis is not as widespread, but portable and miniaturized spectrometers have been used to quantify ethanol in gasoline [39], biodiesel in diesel/biodiesel blends [22,23,30], VO content in diesel [23], determine gasoline properties [30], and transesterification reaction monitoring [31,32,33,34] (Table 1).
The present work aims to evaluate the simultaneous in situ analysis of all the following variables: vegetable oil, used cooking oil, methanol, and glycerol in biodiesel and of biodiesel in diesel, based on a benchtop FT-NIR spectrometer with a transflectance probe. These analyses will be compared with the ones obtained with a prototype of a portable miniaturized NIR spectrometer, based on spectral regions focusing on part of the vibration combination and the first overtone regions, usually not explored in this type of equipment, such as the ones presented in Table 1. The higher absorptivity and less broad bands associated with these regions in relation to second and third overtone could theoretically lead to better predicting models. Therefore, it is also aimed to compare the models’ output obtained with the benchtop FT-NIR spectrometer with the prototype of a miniaturized NIR spectrometer.
2. Materials and Methods
2.1. Sample Preparation for the Detection and Quantification of Contaminants in Biodiesel and of Biodiesel in Diesel/Biodiesel Blends
Biodiesel blends with one contaminant each (the BX blends) and a blend of diesel with biodiesel were prepared: five sets consisted of biodiesel with 1.25, 2.5, 5.0, 10.0, and 50.0% (m/m) of rapeseed oil (RSO), two different types of UCO, methanol, and glycerol; two sets consisted of biodiesel with 0.08, 0.16, 0.313, and 0.625% (m/m) of methanol and glycerol; the eighth consisted of diesel 2.5, 5.0, 10, 12.5, and 15.0% (v/v) of biodiesel (DPB), which is in a similar range to the maximum limit for diesel/biodiesel blends stipulated by the law (Table 2).

Table 2.
Sets of blends prepared and their respective samples’ concentrations.
2.2. Infrared Spectroscopy
The benchtop FT-NIR spectroscopic analysis was conducted as described by Sales et al. [13]. Spectra were acquired using a NIR transflection fiber optic probe IN-271P (Bruker Optics, Ettlingen, Germany), with a path length of 2 mm, coupled to a Vertex-70 spectrometer (Bruker Optics, Ettlingen, Germany). A reference atmospheric air spectrum was acquired before the probe insertion in the samples. NIR spectra were collected the 9000–4000 cm−1 (1111–2500 nm) range, consisting of 32 co-added scans with 8 cm−1 resolution. The scanner velocity was set to 20 kHz and the aperture setting defined was 6 mm.
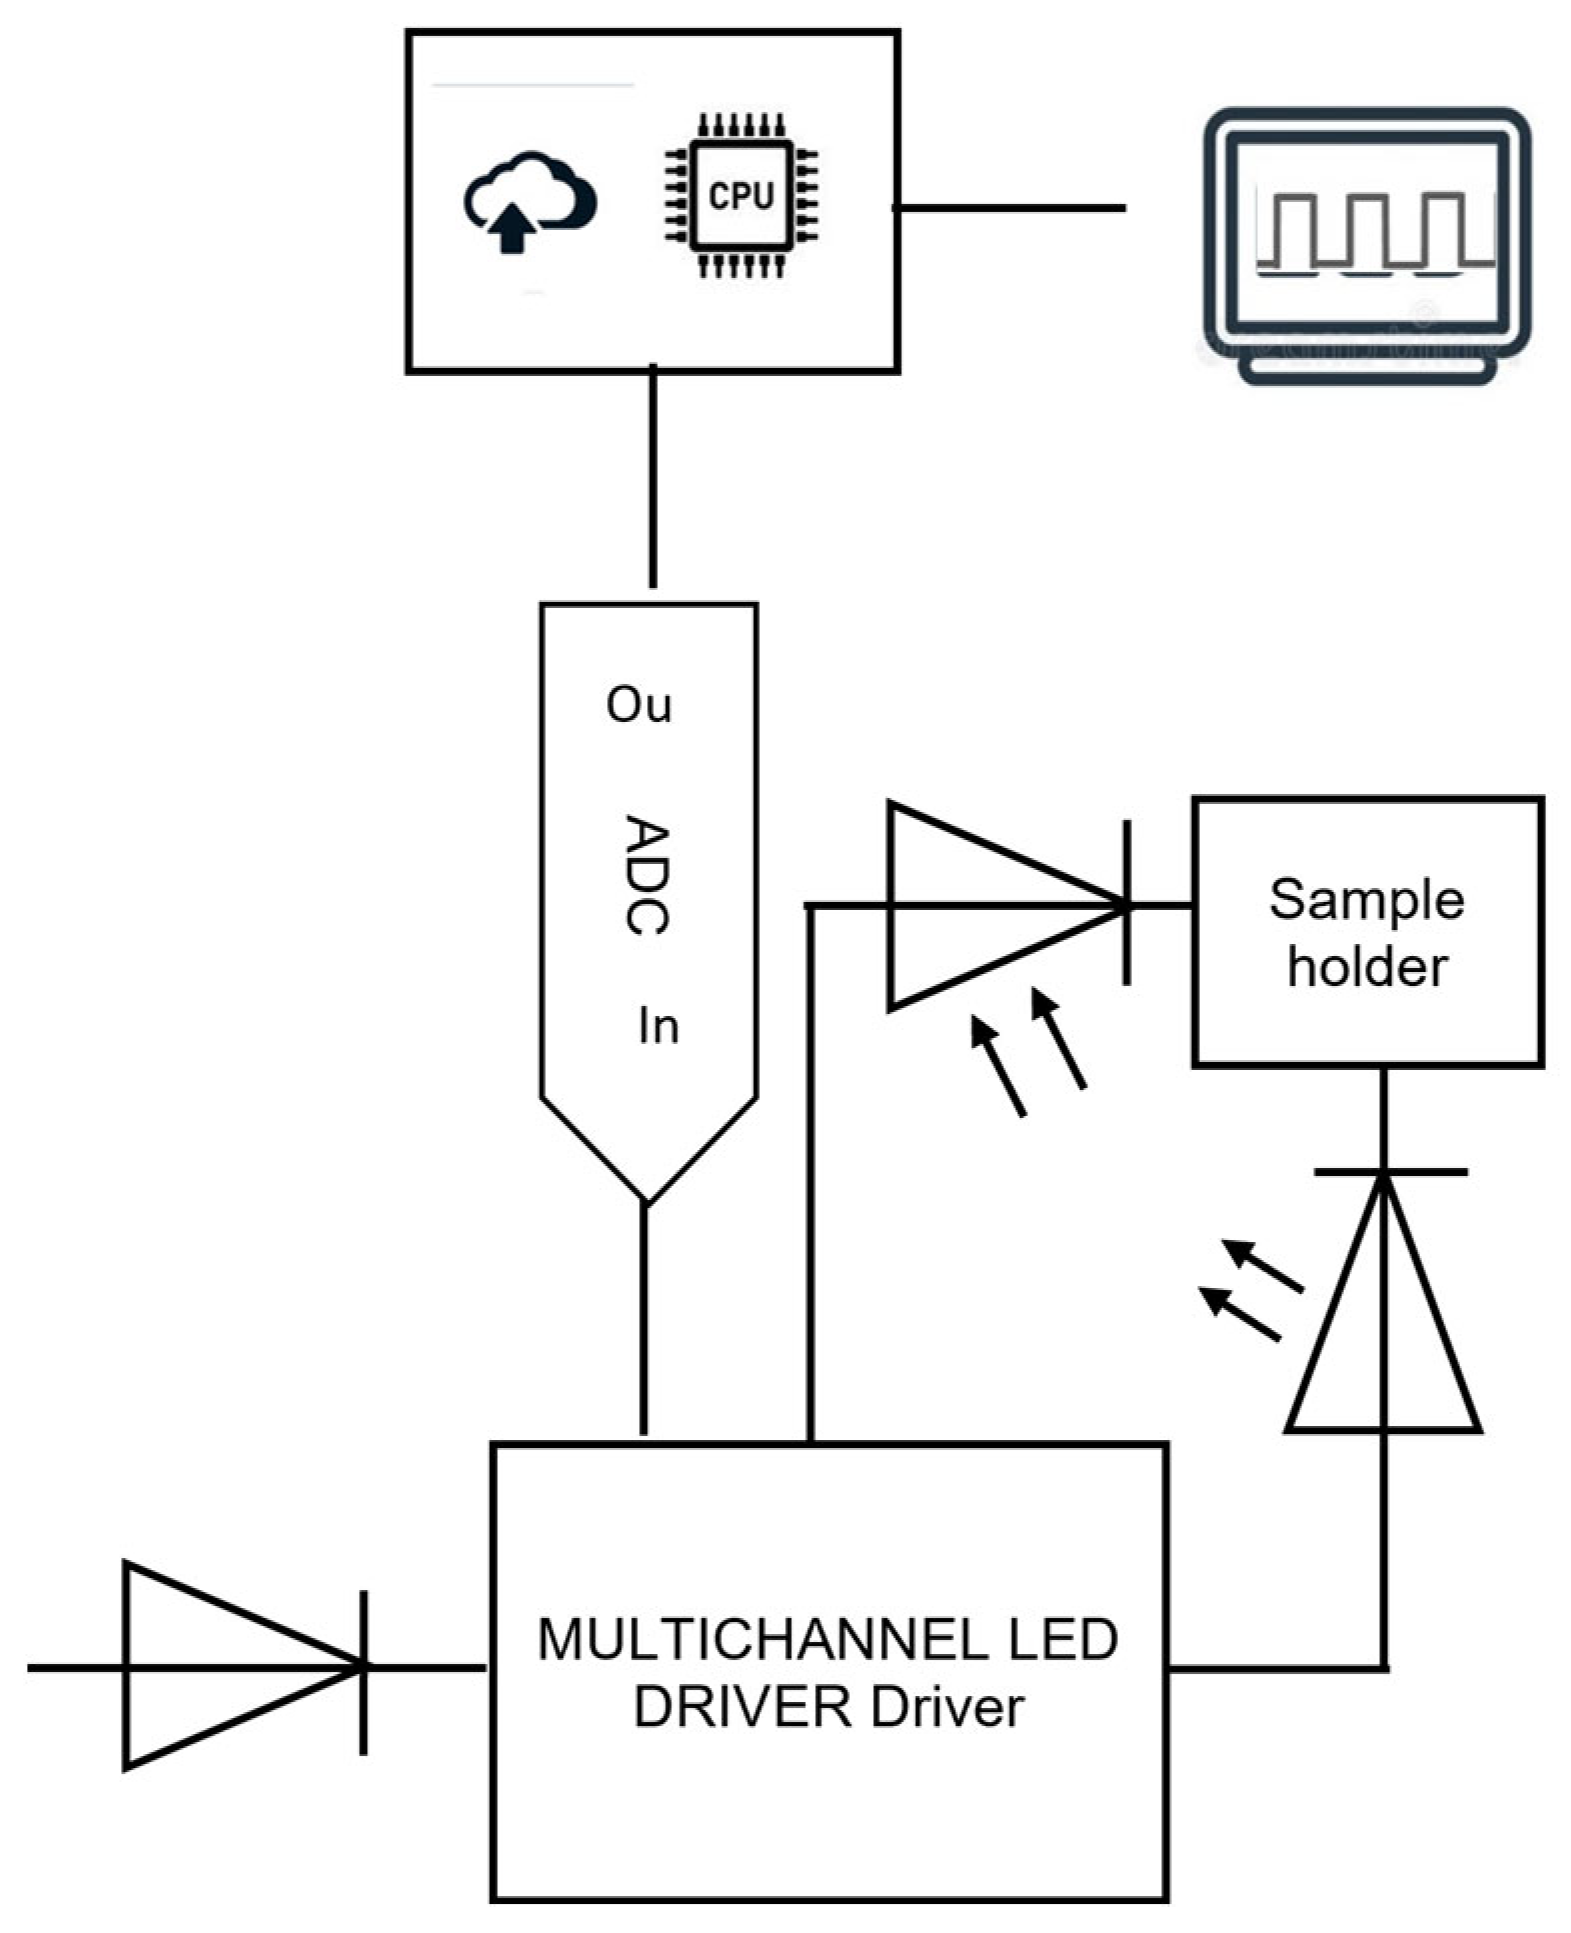
A prototype of a portable miniaturized NIR spectrometer, called nirU, operating in the spectral region between 1300–2100 nm (7692–4762 cm−1), was used (Figure 1). This in-shop assembled instrument, powered (5 V) and controlled via USB port of a computer, originally employs a matrix of six independent LED working in the following wavenumbers: 1300 nm (7692 cm−1), 1400 nm (7143 cm−1), 1600 nm (6250 cm−1), 1700 nm (5882 cm−1), 1900 nm (5263 cm−1), and 2100 nm (4762 cm−1). The nirU resolution is 133 nm at 1000 nm. The LED matrix is synchronized with a built-in preamplifier detector (InGaAs) with internal cooling (both provided by LED Microsensor NT, represented by MicroTech BG Ltd., formerly based in Saint-Petersburg, Russia). The sample solution (16 μL) was pipetted into the demountable cuvette (optical length, 0.5 mm), placed on the fixed holder between the LED array and the detector. Spectra bands were obtained by averaging 1000 scans with an integration time of 2.4 ms resulting in a total measurement time of 2.4 s per sample.
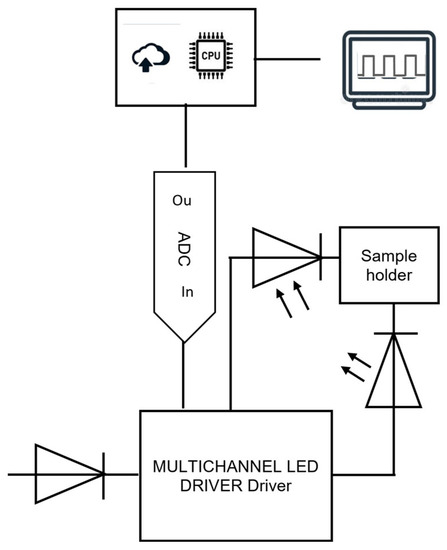
Figure 1.
Schematic representation of the nirU, a prototype of a portable miniaturized NIR spectrometer.
2.3. Spectra Preprocessing and Processing Methods
Several spectra preprocessing methods, such as atmospheric compensation, baseline correction, mean centering, area normalization, maximum normalization, multiple scattering correction (MSC) and 2nd order Savitsky-Golay derivative based on 2nd degree polynomial with a 15-point window were used. Spectral principal component analysis (PCA) was applied to discover data patterns, to individual BX blends, to mixtures of the BX blends, and to the DPB blend. A PCA-linear discriminant analysis (PCA-LDA) was also conducted.
Diverse PLS regression models were developed for each of the BX blends to predict contaminant concentration, according to Table 2. The models were built after outlier removal, identified based on the hoteling T2 analysis conducted on PCA at a 95% confidence interval. Spectral data were randomly partitioned into the calibration (Cal) and validation (Val) sets, containing 70% and 30% of spectral data, respectively. The models’ performance was evaluated by the root mean square error of prediction (RMSEP), the coefficient of determination of validation (prediction R-squared), and the number of latent variables (LVs).
Spectra atmospheric compensation and baseline correction were conducted with OPUS® software, version 6.5 (Bruker, Germany), while remaining spectra preprocessing and processing methods were conducted with Unscrambler ® X 10.4 software (CAMO software AD, Oslo, Norway).
3. Results and Discussion
3.1. FT-NIR Spectroscopy of Biodiesel Contaminants
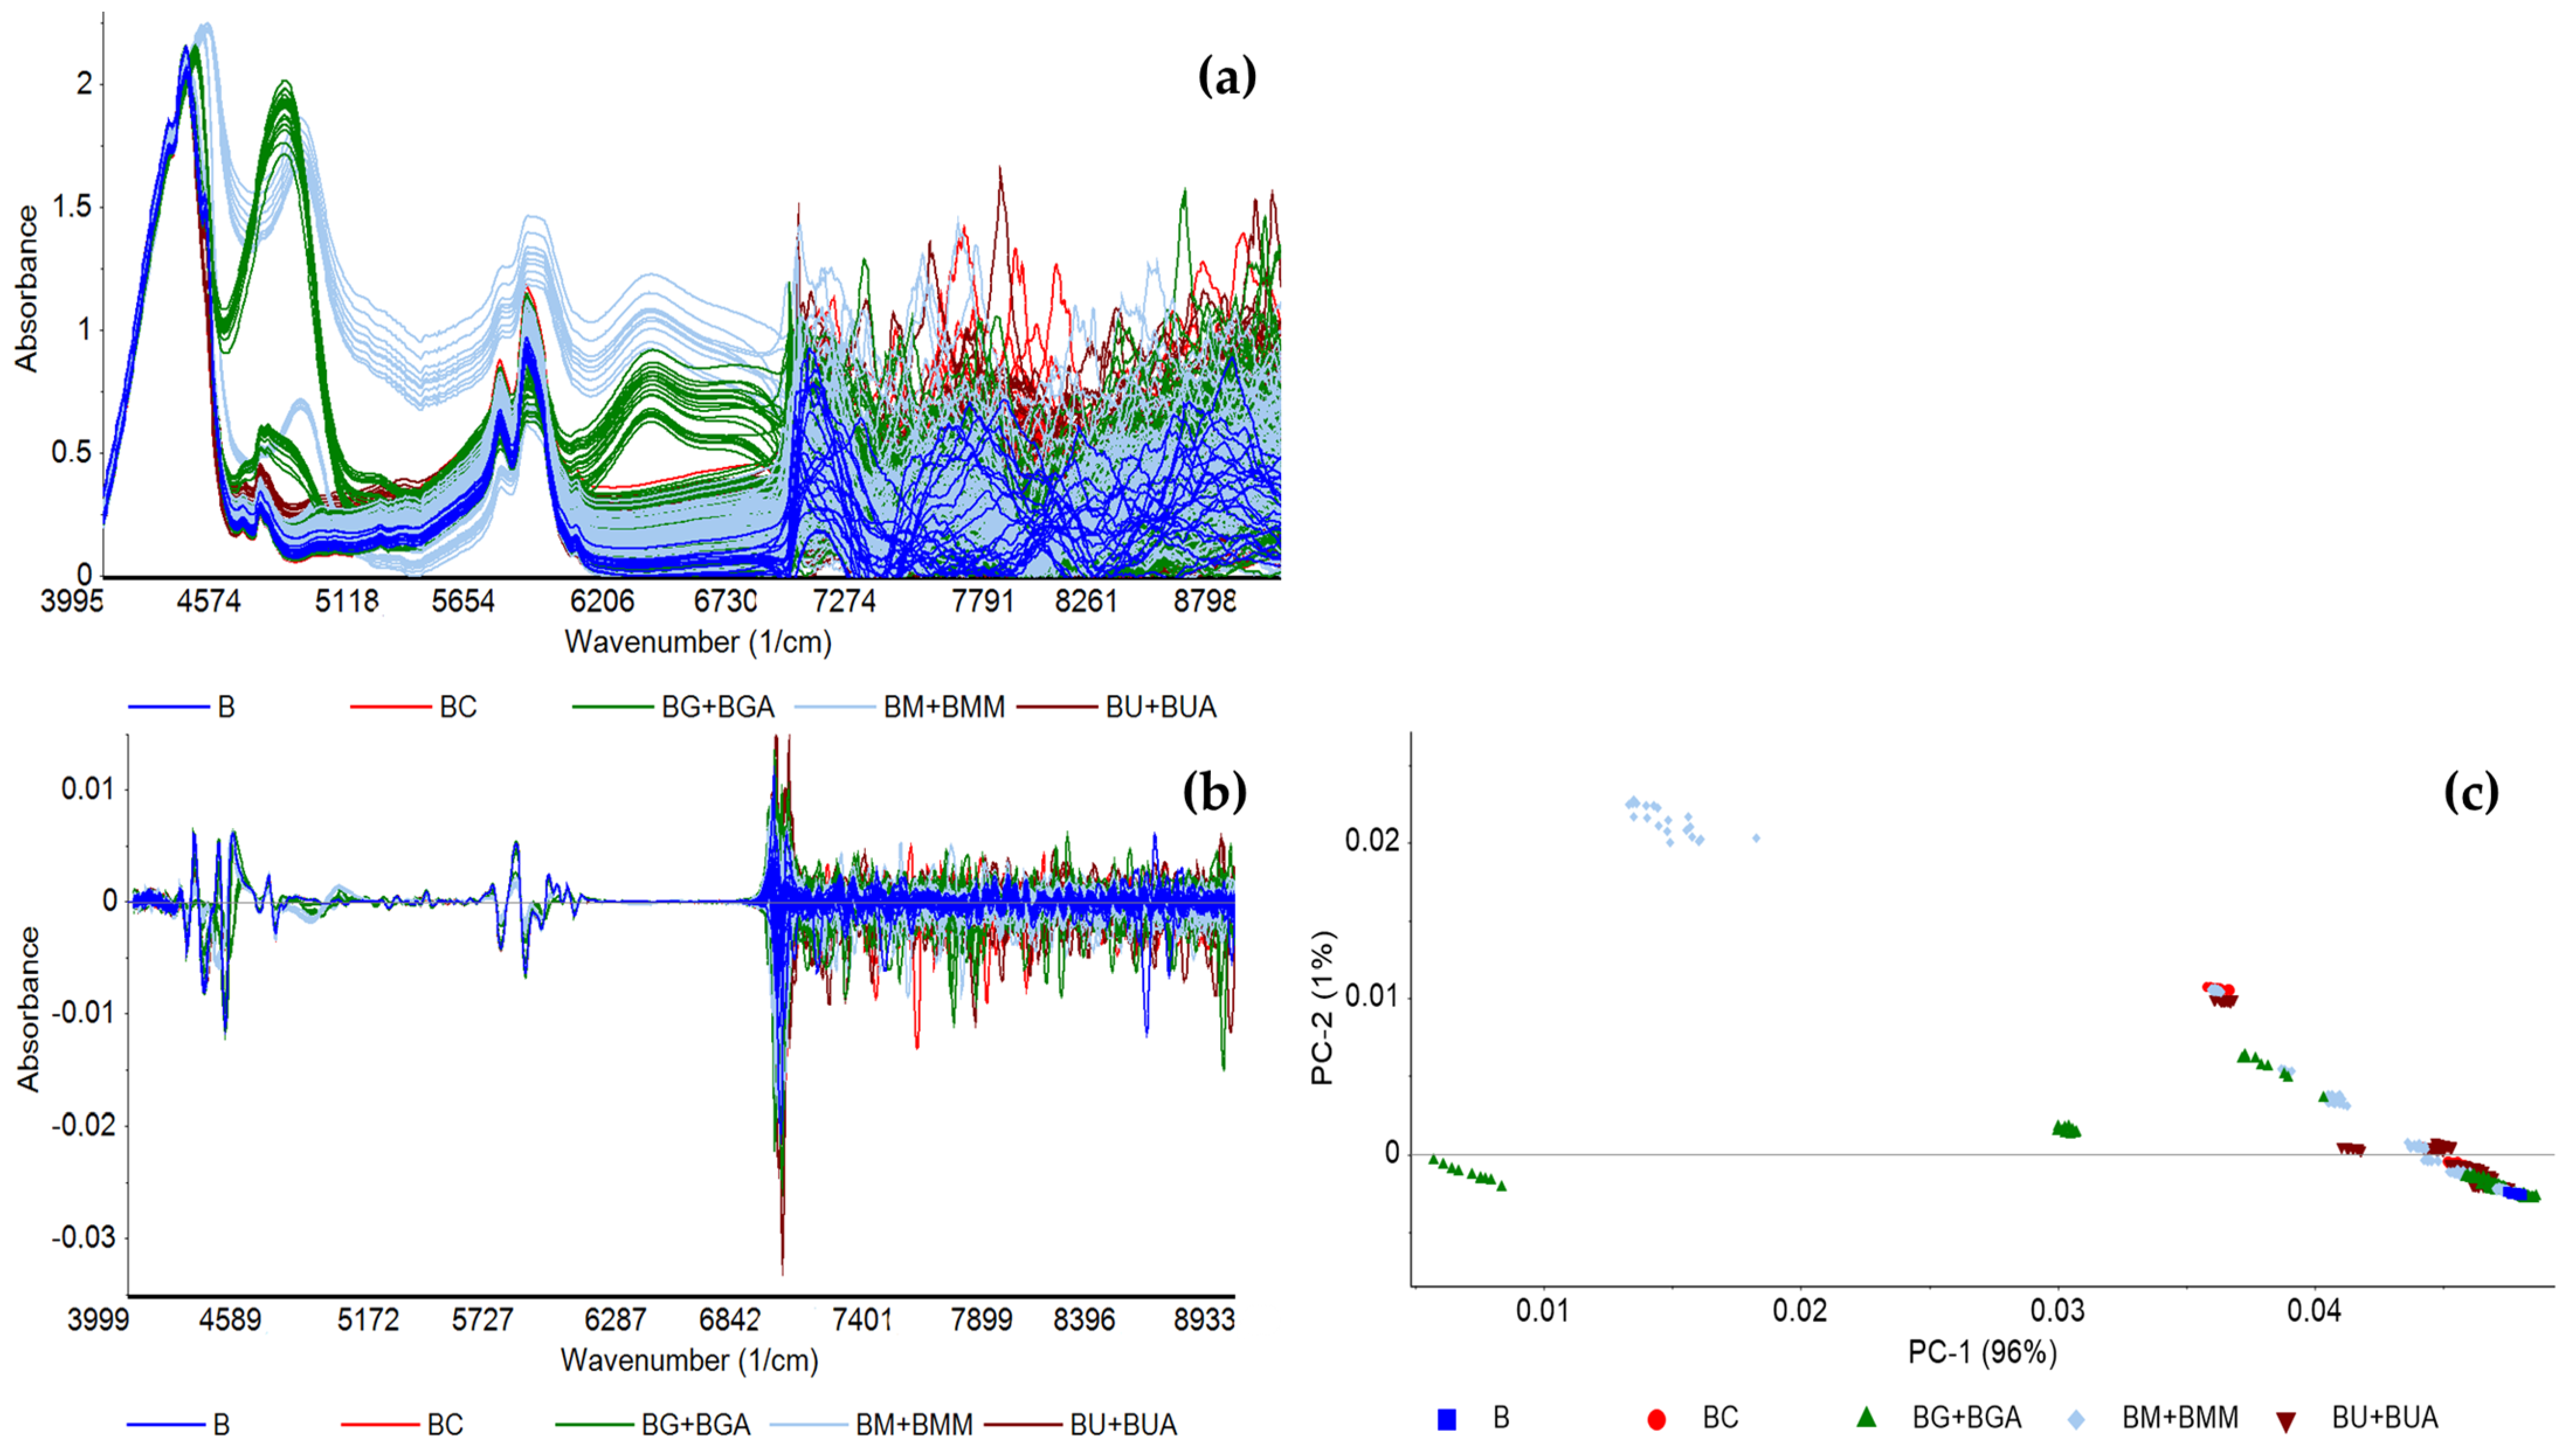
The in situ FT-NIR spectroscopic analysis was conducted with a benchtop spectrometer using a transflectance probe associated to a fiber optic cable. Figure 2 depicts the FT-NIR spectra of the BX blends (detailed in Table 2) based on baseline correction (Figure 2a) and 2nd order derivative (Figure 2b). The bands in the combination region from 4000 to 5300 cm−1 and in the first overtone region from 5000 to 6700 cm−1 belong to vibrations mainly from CHX bonds. PCA based on baseline correction (data not shown) and 2nd order derivative were conducted (Figure 2c), using the whole spectra (data not shown) and the 4000 to 6800 cm−1 sub-region, which presents less noise and showed the best data patterns according to target contaminant.
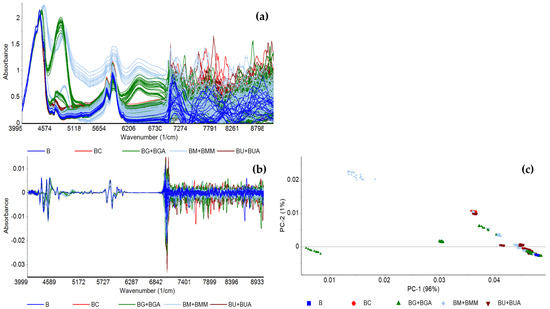
Figure 2.
FT-NIR spectra of the BX blends preprocessed with (a) baseline correction; (b) 2nd order derivative, and (c) the corresponding PCA of 2nd order derivative, conducted between 4000 and 6800 cm−1, of pure biodiesel (B) and biodiesel with varying concentrations of rapeseed oil (BC), UCO (BU and BUA), methanol (BM and BMM), and glycerol (BG and BGA).
Since PCA is an unsupervised algorithm that finds directions of maximum variance regardless of labels, supervised PCA-LDA were conducted to determine the presence of each target contaminant, among a pool of spectra representing pure biodiesel and biodiesel with a high diversity of contaminant types.
This analysis was conducted between 4000 and 6800 cm−1, based on 2nd order derivative (SV2), area normalization (AN), and 2nd derivative coupled with area normalization (SV2 + AN) (Table 3). The 2nd order derivative was chosen to resolve superimposed bands, consequently highlighting the characteristics of chemical analyte signals [40], while area normalization was used to correct differences in the global intensity of the signals, giving each signal the same weight [41] and reducing the concentration effect.

Table 3.
Accuracy (%) of PCA-LDA analysis based on FT-NIR spectra preprocessed by second derivative (SV2), area normalization (AN), and second derivative and area normalization (SV2 + AN), to predict if biodiesel is contaminated, if it is contaminated with VOs (BC + BU + BUA), RSO (BC), UCO (BU + BUA), methanol (BM + BMM), or glycerol (BG + BGA).
In general, the PCA-LDA models accurately predicted the presence of contaminants among a library of spectra of biodiesel with different contaminants, with accuracy values ranging between 71% and 95%. The models built to detect contaminants in biodiesel displayed the lowest accuracies, with the highest one being 75%, most likely due to the diversity of contaminants included. The models developed to predict what type of contaminant is present, following contaminant detection, showed higher accuracy. It was possible to build PCA-LDA models with the following accuracies: VOs at 95%, RSO at 84%, UCO at 79%, methanol at 91%, and glycerol at 78% (Table 3). The models based on normalized spectral data often showed the highest accuracy values, likely because any spectral differences caused by contaminant concentration are eliminated, thus allowing the analysis to focus on differences between molecular structure.
The PCA of non-normalized, 2nd order derivative spectra of individual contaminants (Figure A1) shows data patterns formed according to the target contaminant’s concentration, with PC2 often separating different clusters. To further explore this, diverse partial least square regression (PLS) models were built, for contaminant concentrations ranging from 0 to 10% (w/w), for the blends BC, BU, BUA, BM, and BG, and from 0 to 0.625% (w/w), for the blends BMM and BGA, based on the whole spectra (data not shown) and between 4000 and 6800 cm−1 (Table 4), and based on the following spectra preprocessing: unprocessed (None), mean centering (MC), baseline correction (Base corr), and 2nd order derivative (SV2).

Table 4.
PLS models based on FT-NIR spectra per BX blend, according to the concentration range of each contaminant and preprocessing method.
Overall, the developed PLS models showed very good predictive ability, even for contaminants present in low concentrations (BMM and BGA), as based on a low number of LVs, presented for both the calibration and validation datasets high R-squared values and low RMSE values.
The performance of the models developed to quantify the amount of RSO in biodiesel (BC blend) is comparable to the performance of the model developed by Oliveira et al. [42] (Table 1) to quantify VO in biodiesel in a 0–5% (w/w) range, with an RMSEP value of 0.238% (w/w), a prediction R-squared of 0.97, based on 10 LVs. The models obtained for the BMM blend are comparable to the ones obtained by Felizardo et al. [28] (Table 1), which were built using the 9000–4500 cm−1 region from spectra of biodiesel samples contaminated with methanol in a 0.002–0.286% (w/w) range and obtained RMSEP values lower than 0.02% (w/w) and prediction R-squared values of over 0.97.
Although several preprocessing methods were used, the models derived from the unprocessed spectral data show results just as good as the ones from the models derived from the preprocessed data, which show that NIR spectroscopy is a robust technique for contaminant quantification.
3.2. FT-NIR Spectroscopy of Biodiesel in Diesel (DPB)
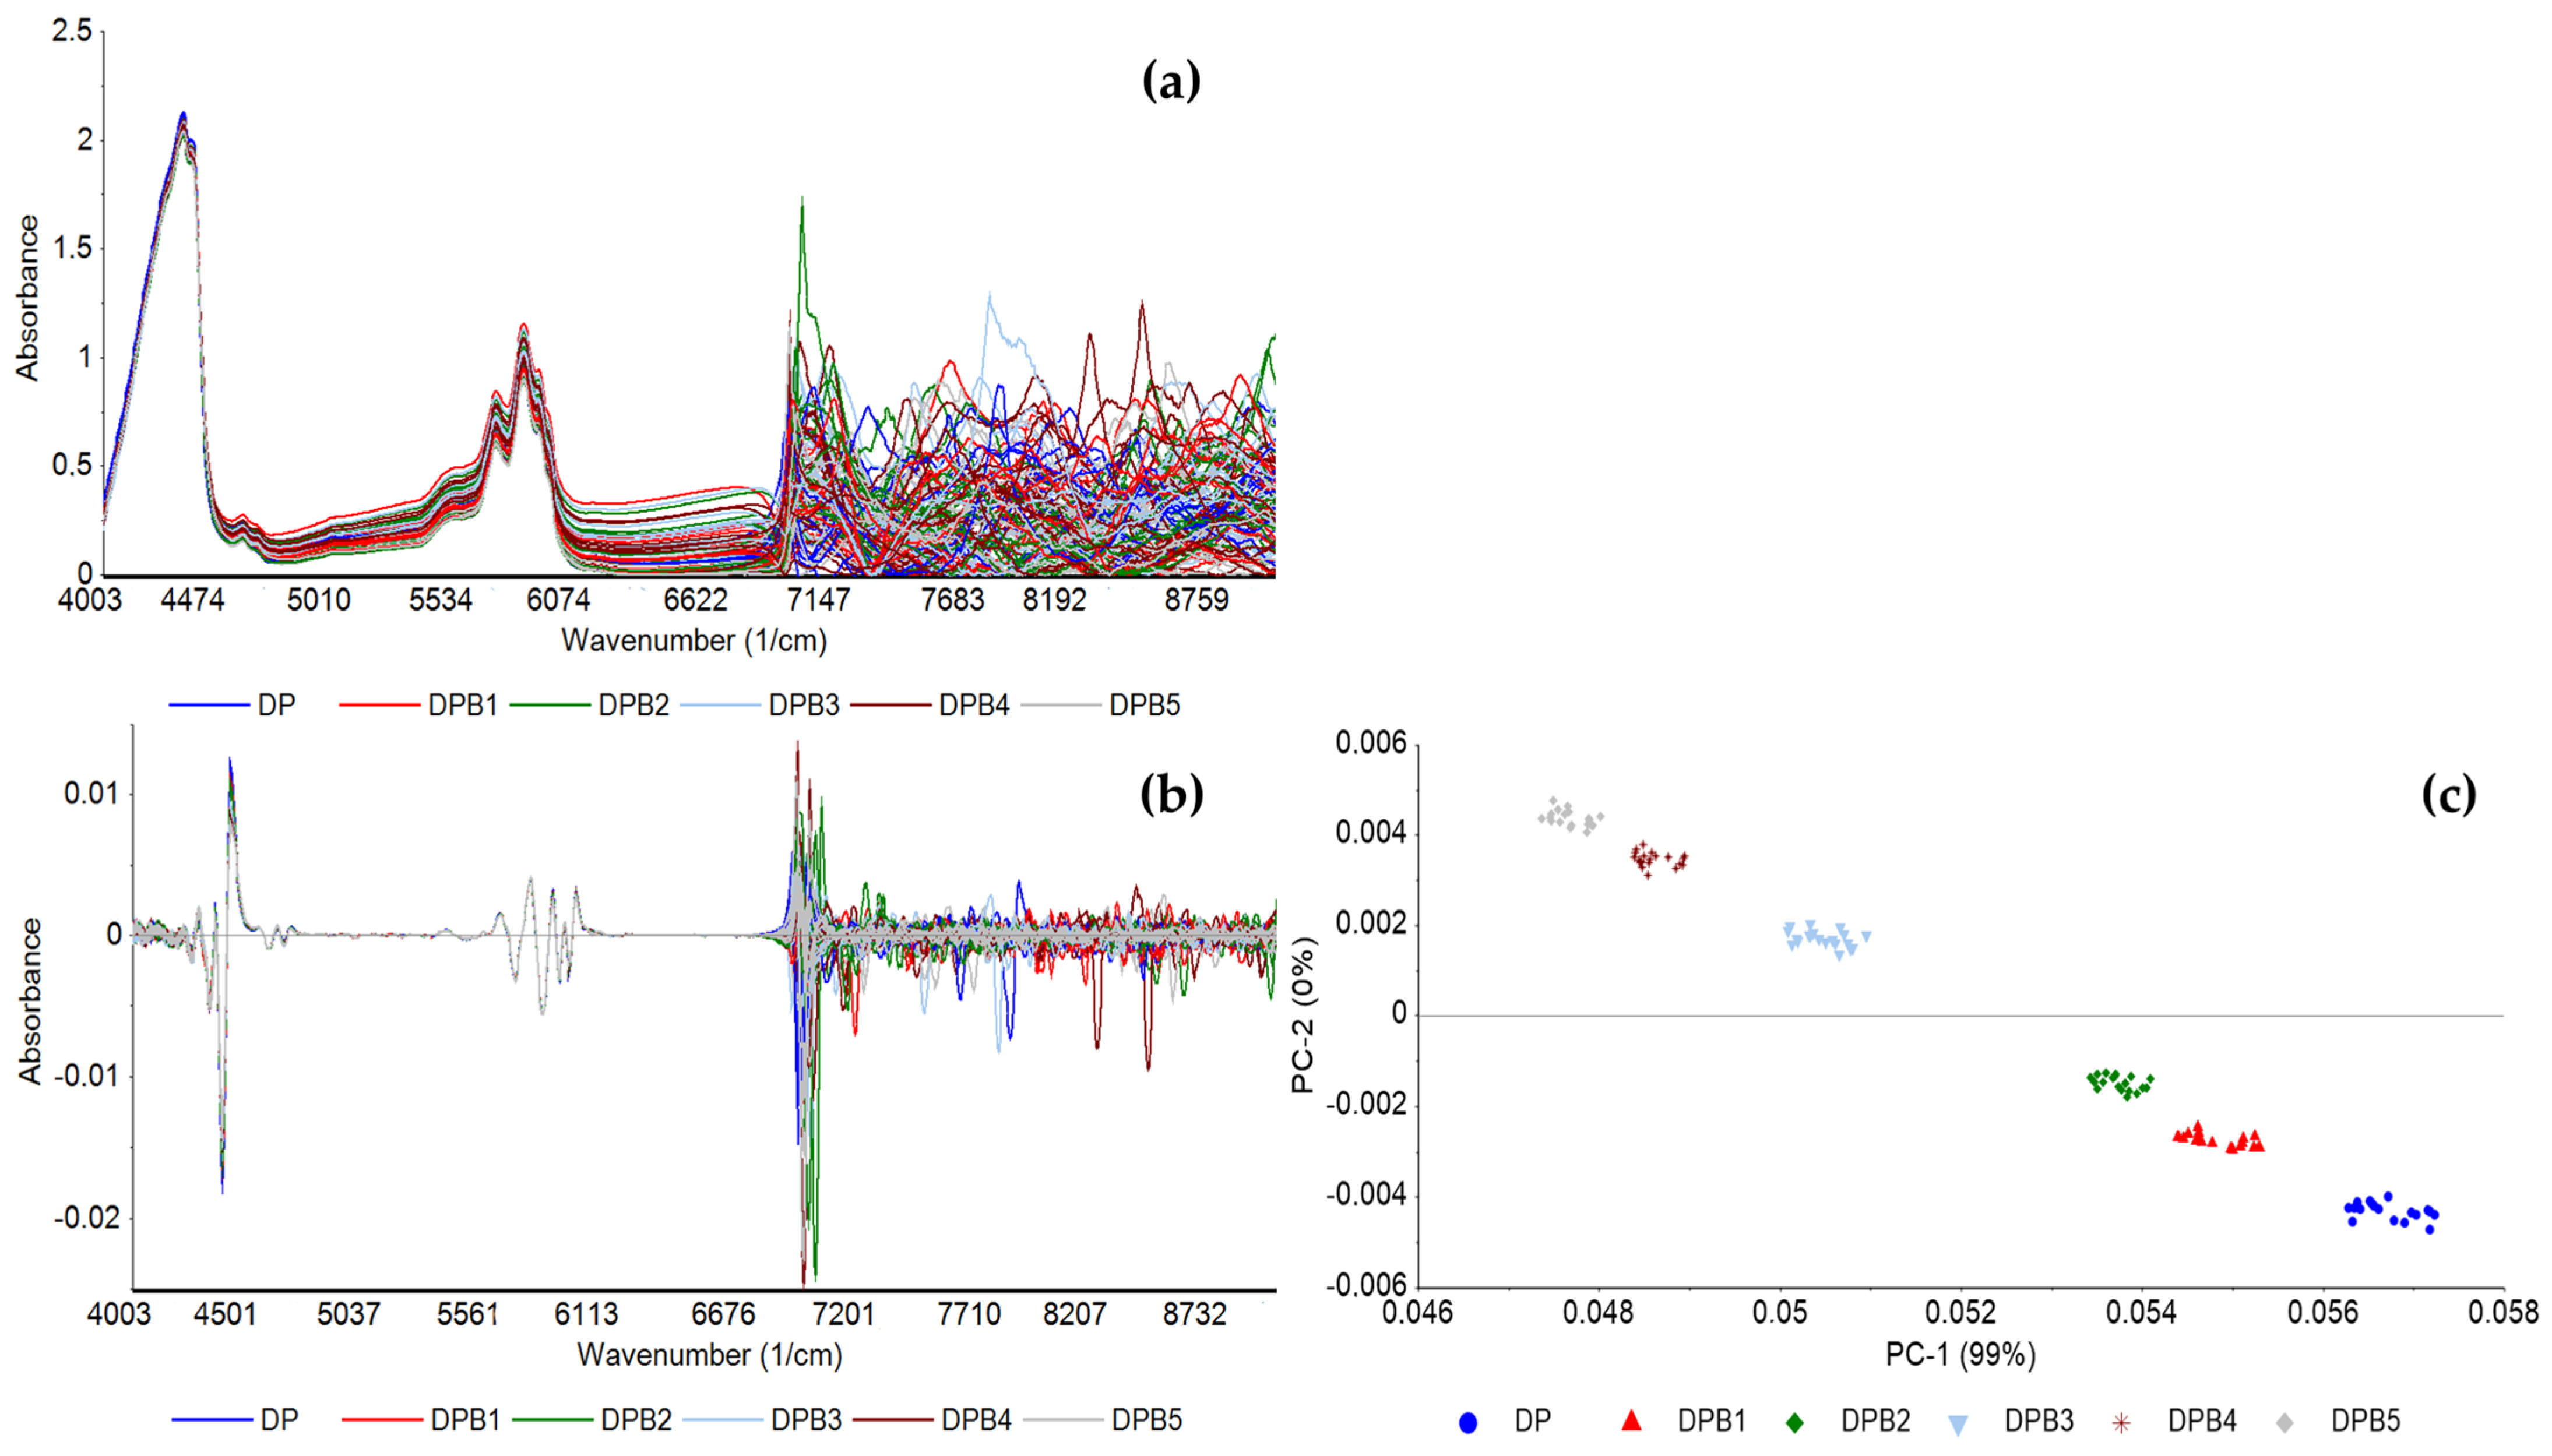
Figure 3 shows the FT-NIR spectra of the DPB blend based on baseline correction (Figure 3a) and 2nd order derivative (Figure 3b), and PCA based on 2nd order derivative between 4000 and 6800 cm−1 (Figure 3c), with concentrations of biodiesel according to Table 2. The PCA reveals the grouping of replicas of samples according to biodiesel concentration, with PC1 capturing the concentration differences and PC2 distinguishing between the lower and higher biodiesel concentrations.
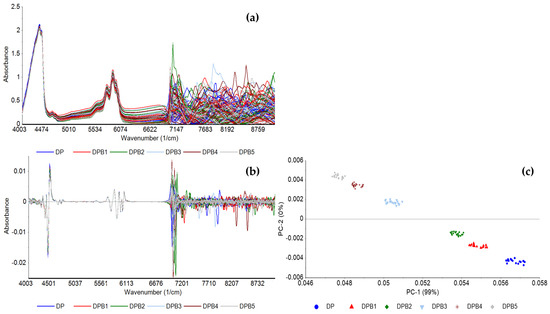
Figure 3.
FT-NIR spectra of pure diesel and the DPB blend preprocessed with (a) baseline correction; (b) 2nd order derivative, and (c) the corresponding PCA of 2nd order derivative, between 4000 and 6800 cm−1, of pure diesel (DP) and diesel with varying concentrations of biodiesel.
A PCA-LDA based on spectra normalized to the area and between 4000 and 6800 cm−1 was also conducted, which enabled the prediction of biodiesel in diesel with a 97% accuracy with 5 components (data not shown). Furthermore, the PLS models built to quantify the biodiesel concentration in the DPB blend, based on different preprocessing methods, conducted between 4000 and 6800 cm−1, similar to the region used by Alves et al. [26] in the same type of analysis (between 4400 and 6200 cm−1), showed excellent predictive ability, with calibration and validation R-squared values of 0.99 and low RMSE values (0.10% (v/v)), based on 3 LVs (Table 5). The performance of these models can be compared to ones previously developed by Fernandes et al. [24] and Pimentel et al. [27] (Table 1) to predict biodiesel content in diesel/biodiesel blends from NIR spectral data preprocessed with second derivative. Similar values of calibration and prediction R-squared and LVs were obtained, and RSMEP values around 0.70% (v/v) [24] or below 0.30% (v/v) [27] were reported.

Table 5.
PLS models based on FT-NIR spectra between 6800 and 4000 cm−1, with diverse preprocessing methods to determine biodiesel content in the DPB blend (0 to 15% (v/v)).
3.3. nirU of Biodiesel Contaminants
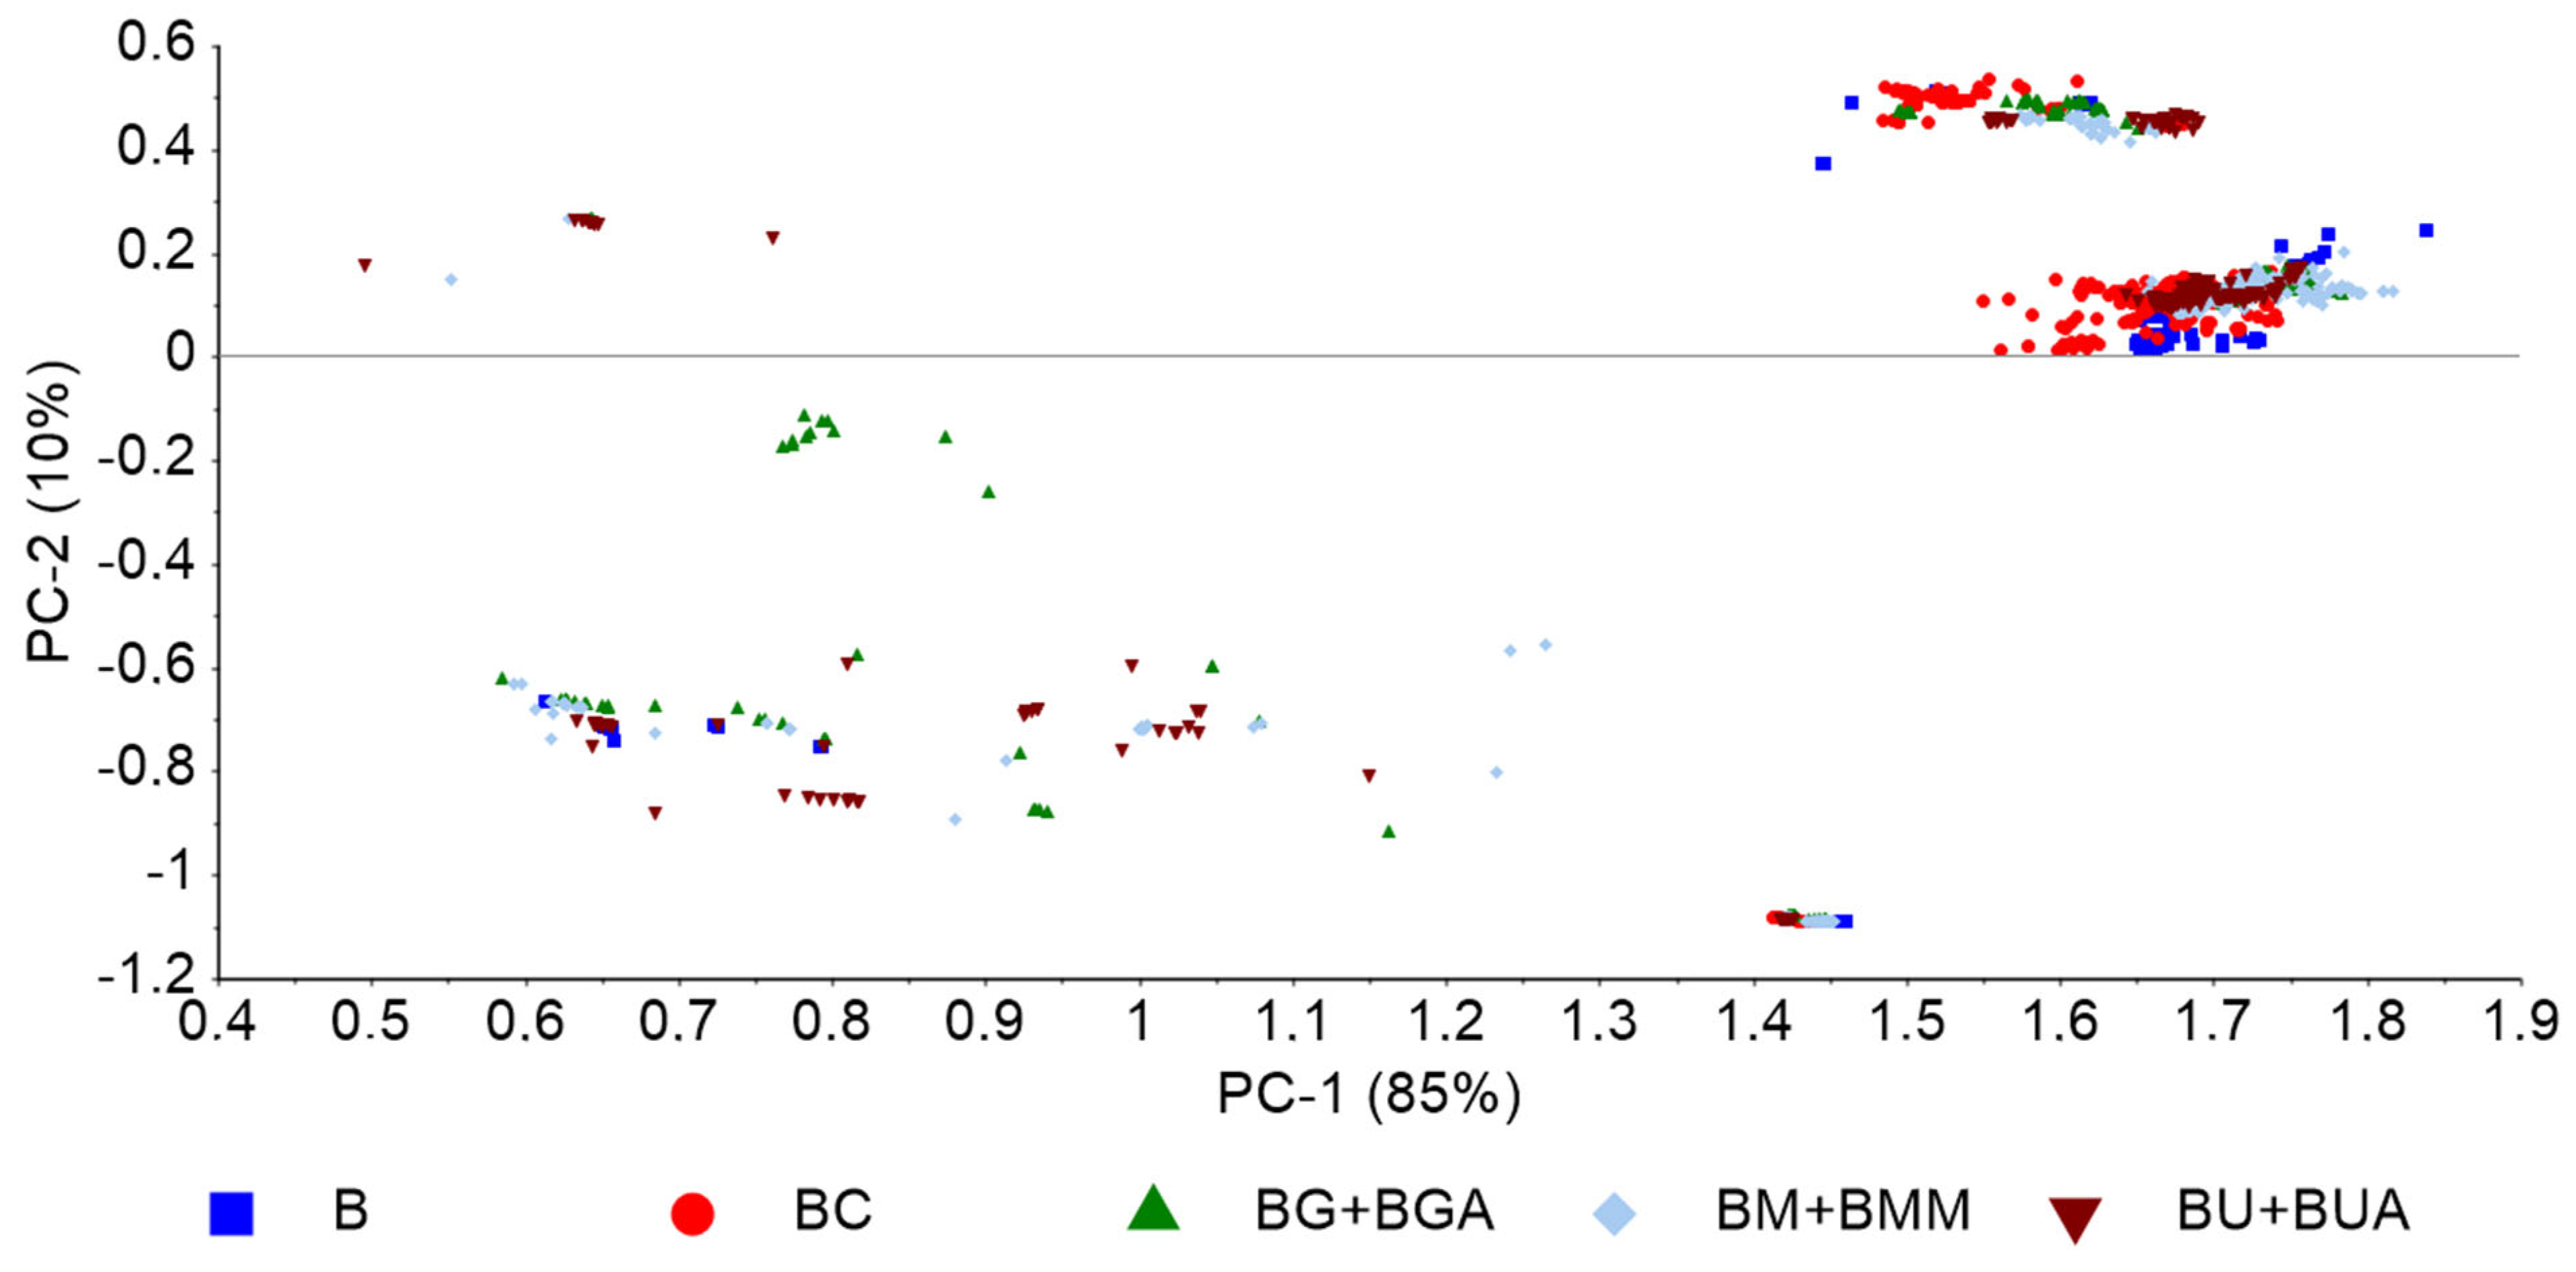
Figure 4 depicts a PCA based on nirU analysis of the BX blends exhibiting a data pattern formed according to the target contaminant. Several preprocessing methods were evaluated, including diverse normalization, and multiple scattering correction. The best data pattern was obtained with baseline correction coupled with maximum normalization. The PCA-LDA models (Table 6) showed a reasonable predictive power of contaminant presence, with accuracy values ranging from 68% to 86%. The best model to predict presence of contaminants (without targeting any specific contaminant) showed a reasonable accuracy (i.e., 78%), especially considering the high diversity of possible contaminants. As previously observed with FT-NIR spectral data (Table 3), the models based on normalized data, in general, showed the highest accuracies.
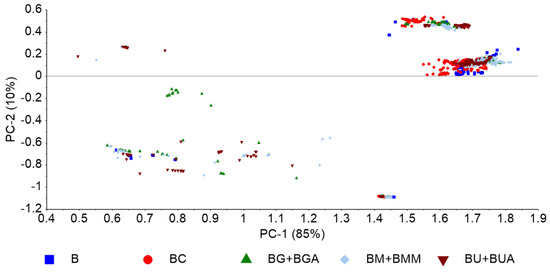
Figure 4.
PCA based on nirU data, preprocessed with baseline correction and maximum normalization, of pure biodiesel (B) and biodiesel with varying concentrations of rapeseed oil (BC), UCO (BU and BUA), methanol (BM and BMM), and glycerol (BG and BGA).

Table 6.
Accuracy (%) of PCA-LDA analysis based on nirU data with diverse preprocesseing methods to predict if biodiesel is contaminated, if is contaminated with vegetable oils (BC + BU + BUA), rapeseed oil (BC), UCO (BU + BUA), methanol (BM + BMM), or glycerol (BG + BGA).
The PLS models based on nirU data (Table A1), with unprocessed data (None), baseline correction (Base corr), or baseline correction and maximum normalization (Base corr + Max norm) performed poorly, presenting low R-squared values and high RMSE. Of exception are the models built from unprocessed data of the BUA and BGA blends, with validation R-squared values of 0.81 and low RMSEP values, and the model built from data of the BG blend preprocessed with baseline correction and maximum normalization, which showed a validation R-squared value of 0.70. These results could result from the LEDs used associated with the low resolution, which, however, contributes to the low-cost of the device. Even so, the nirU spectrometer could potentially be used to perform preliminary analysis of biodiesel, which could then be validated by FT-NIR spectroscopy.
3.4. nirU Spectroscopy of Biodiesel in Diesel (DPB)
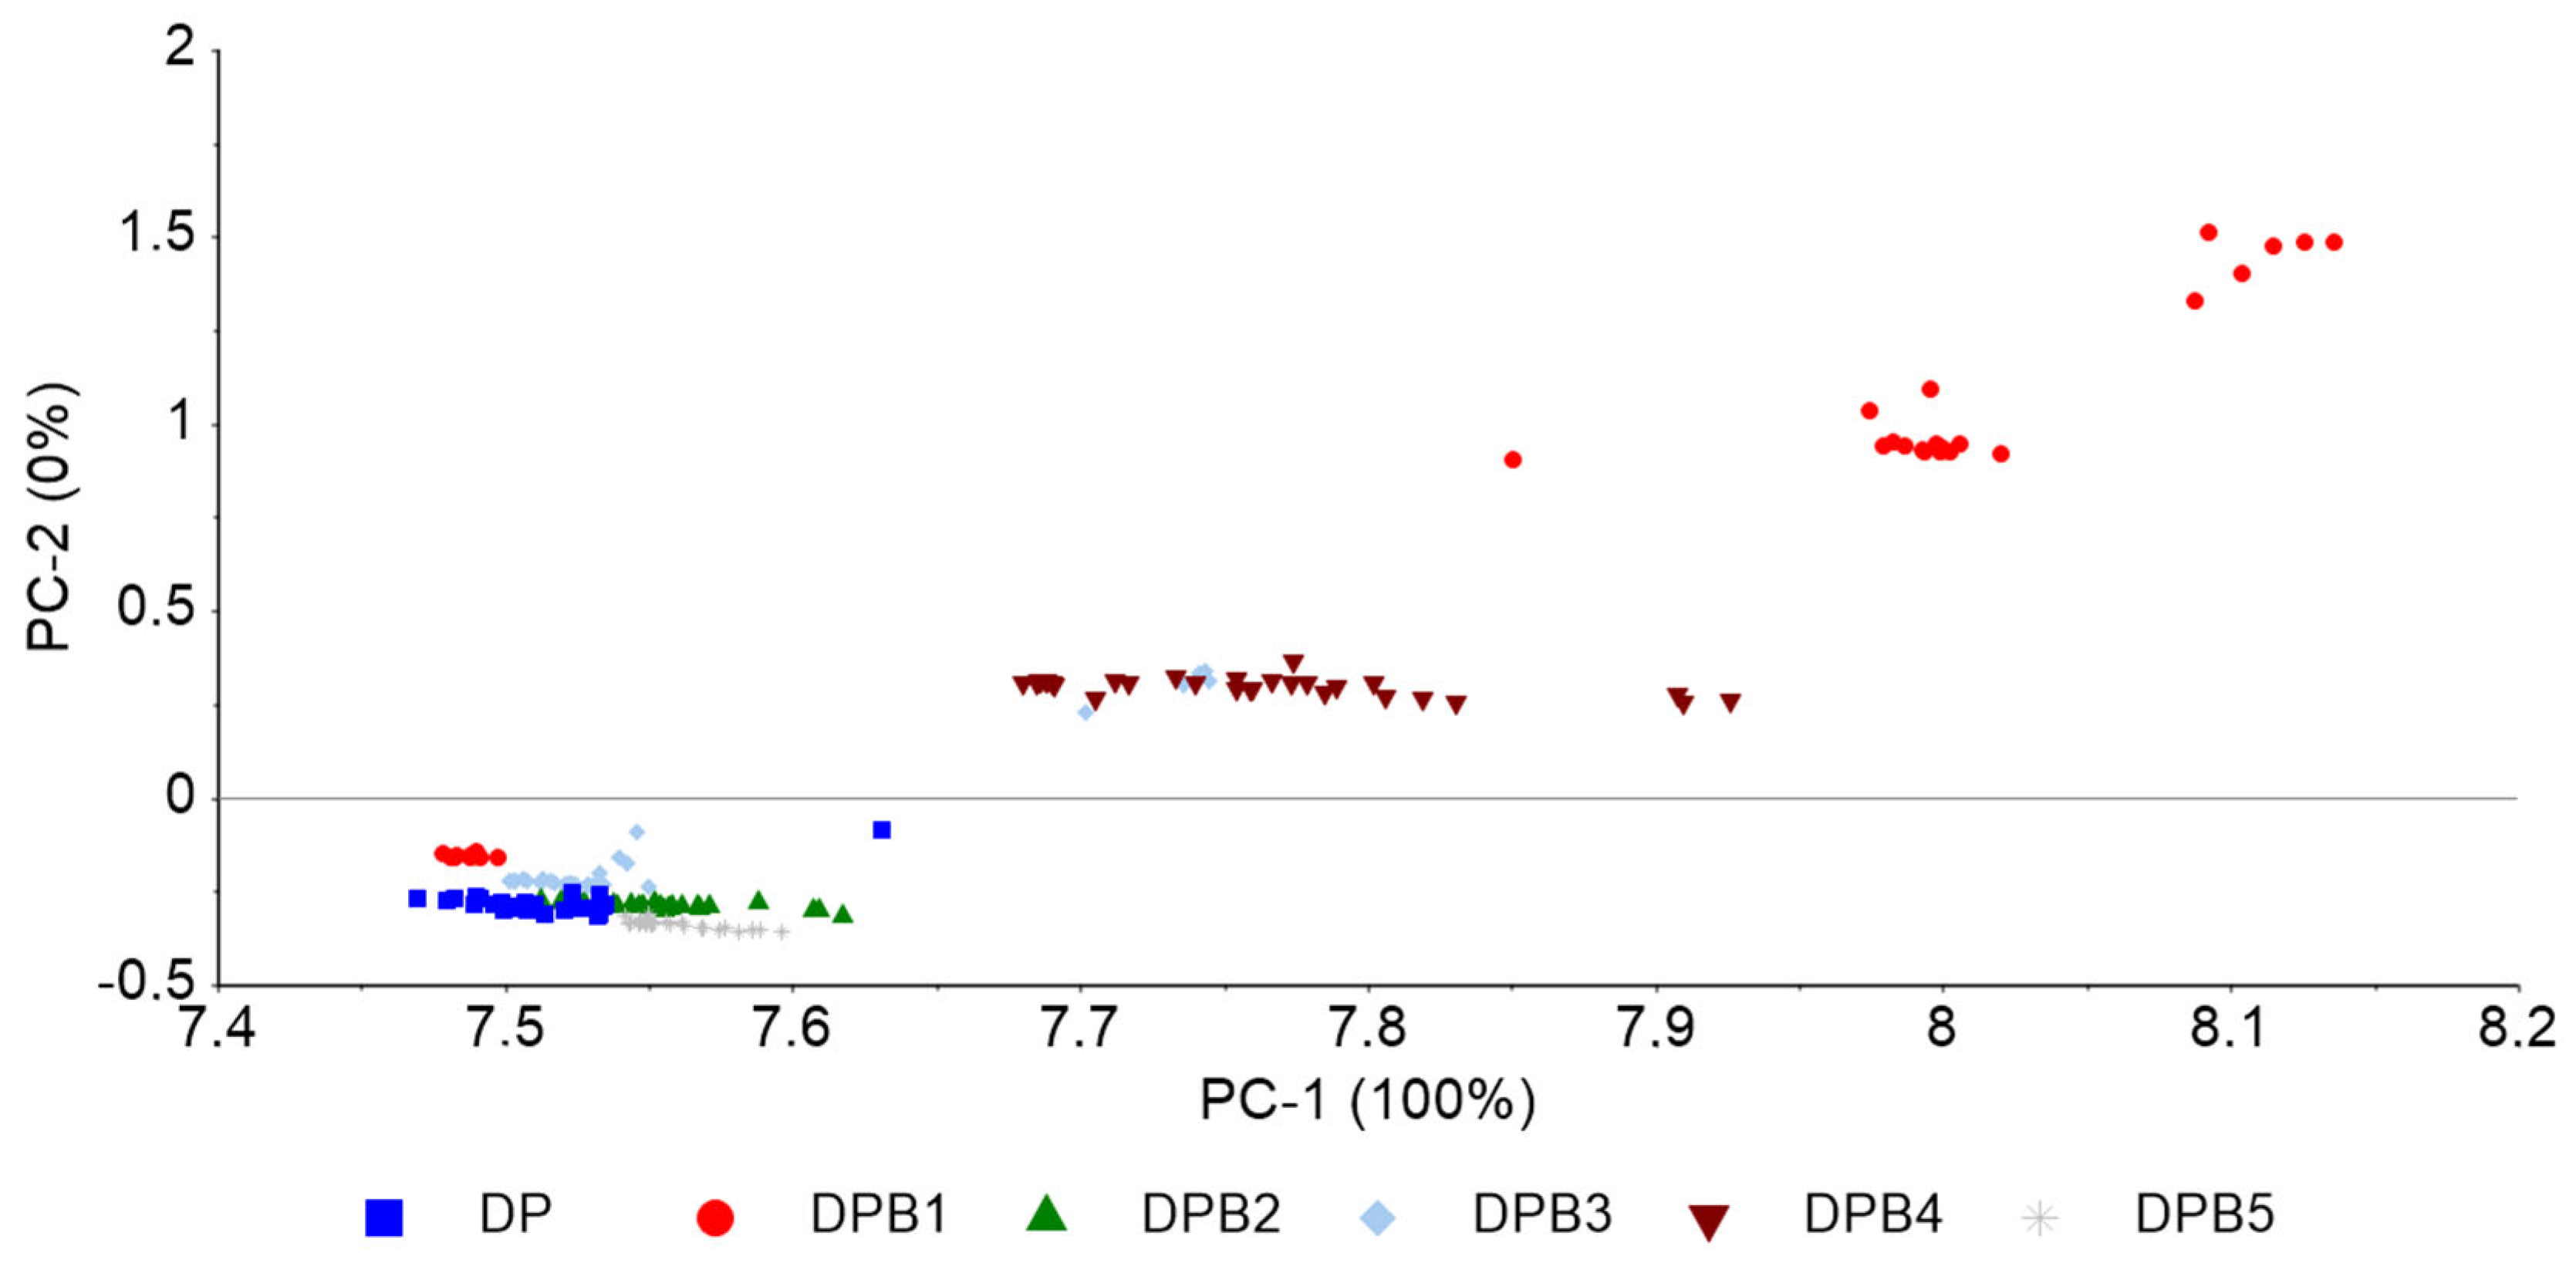
The PCA of nirU data based on the baseline correction of the DPB blends (Figure 5) reveals data clustering according to biodiesel concentration, with PC1 capturing the concentration effect of biodiesel and PC2 distinguishing between lower and higher biodiesel concentrations. Of the evaluated preprocessing methods, baseline correction provided the best separation between sample groups. A PCA-LDA predicted the presence of biodiesel in diesel with an 80% accuracy with 5 components (data not shown).
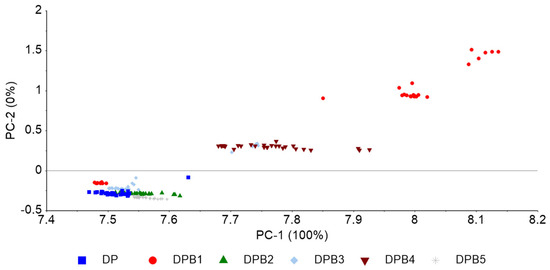
Figure 5.
nirU data PCA based on baseline correction, conducted on the whole spectra, of pure diesel (DP) and diesel with varying concentrations of biodiesel.
A PLS models built to quantify the biodiesel concentration in the DPB blend (Table 7) based on data preprocessed with baseline correction and maximum normalization showed a validation R-squared value of 0.71 and a 5.19% (v/v) RMSEP.

Table 7.
PLS models based on nirU data, with diverse preprocessing methods to determine biodiesel content in the DPB blend (0 to 15% (v/v)).
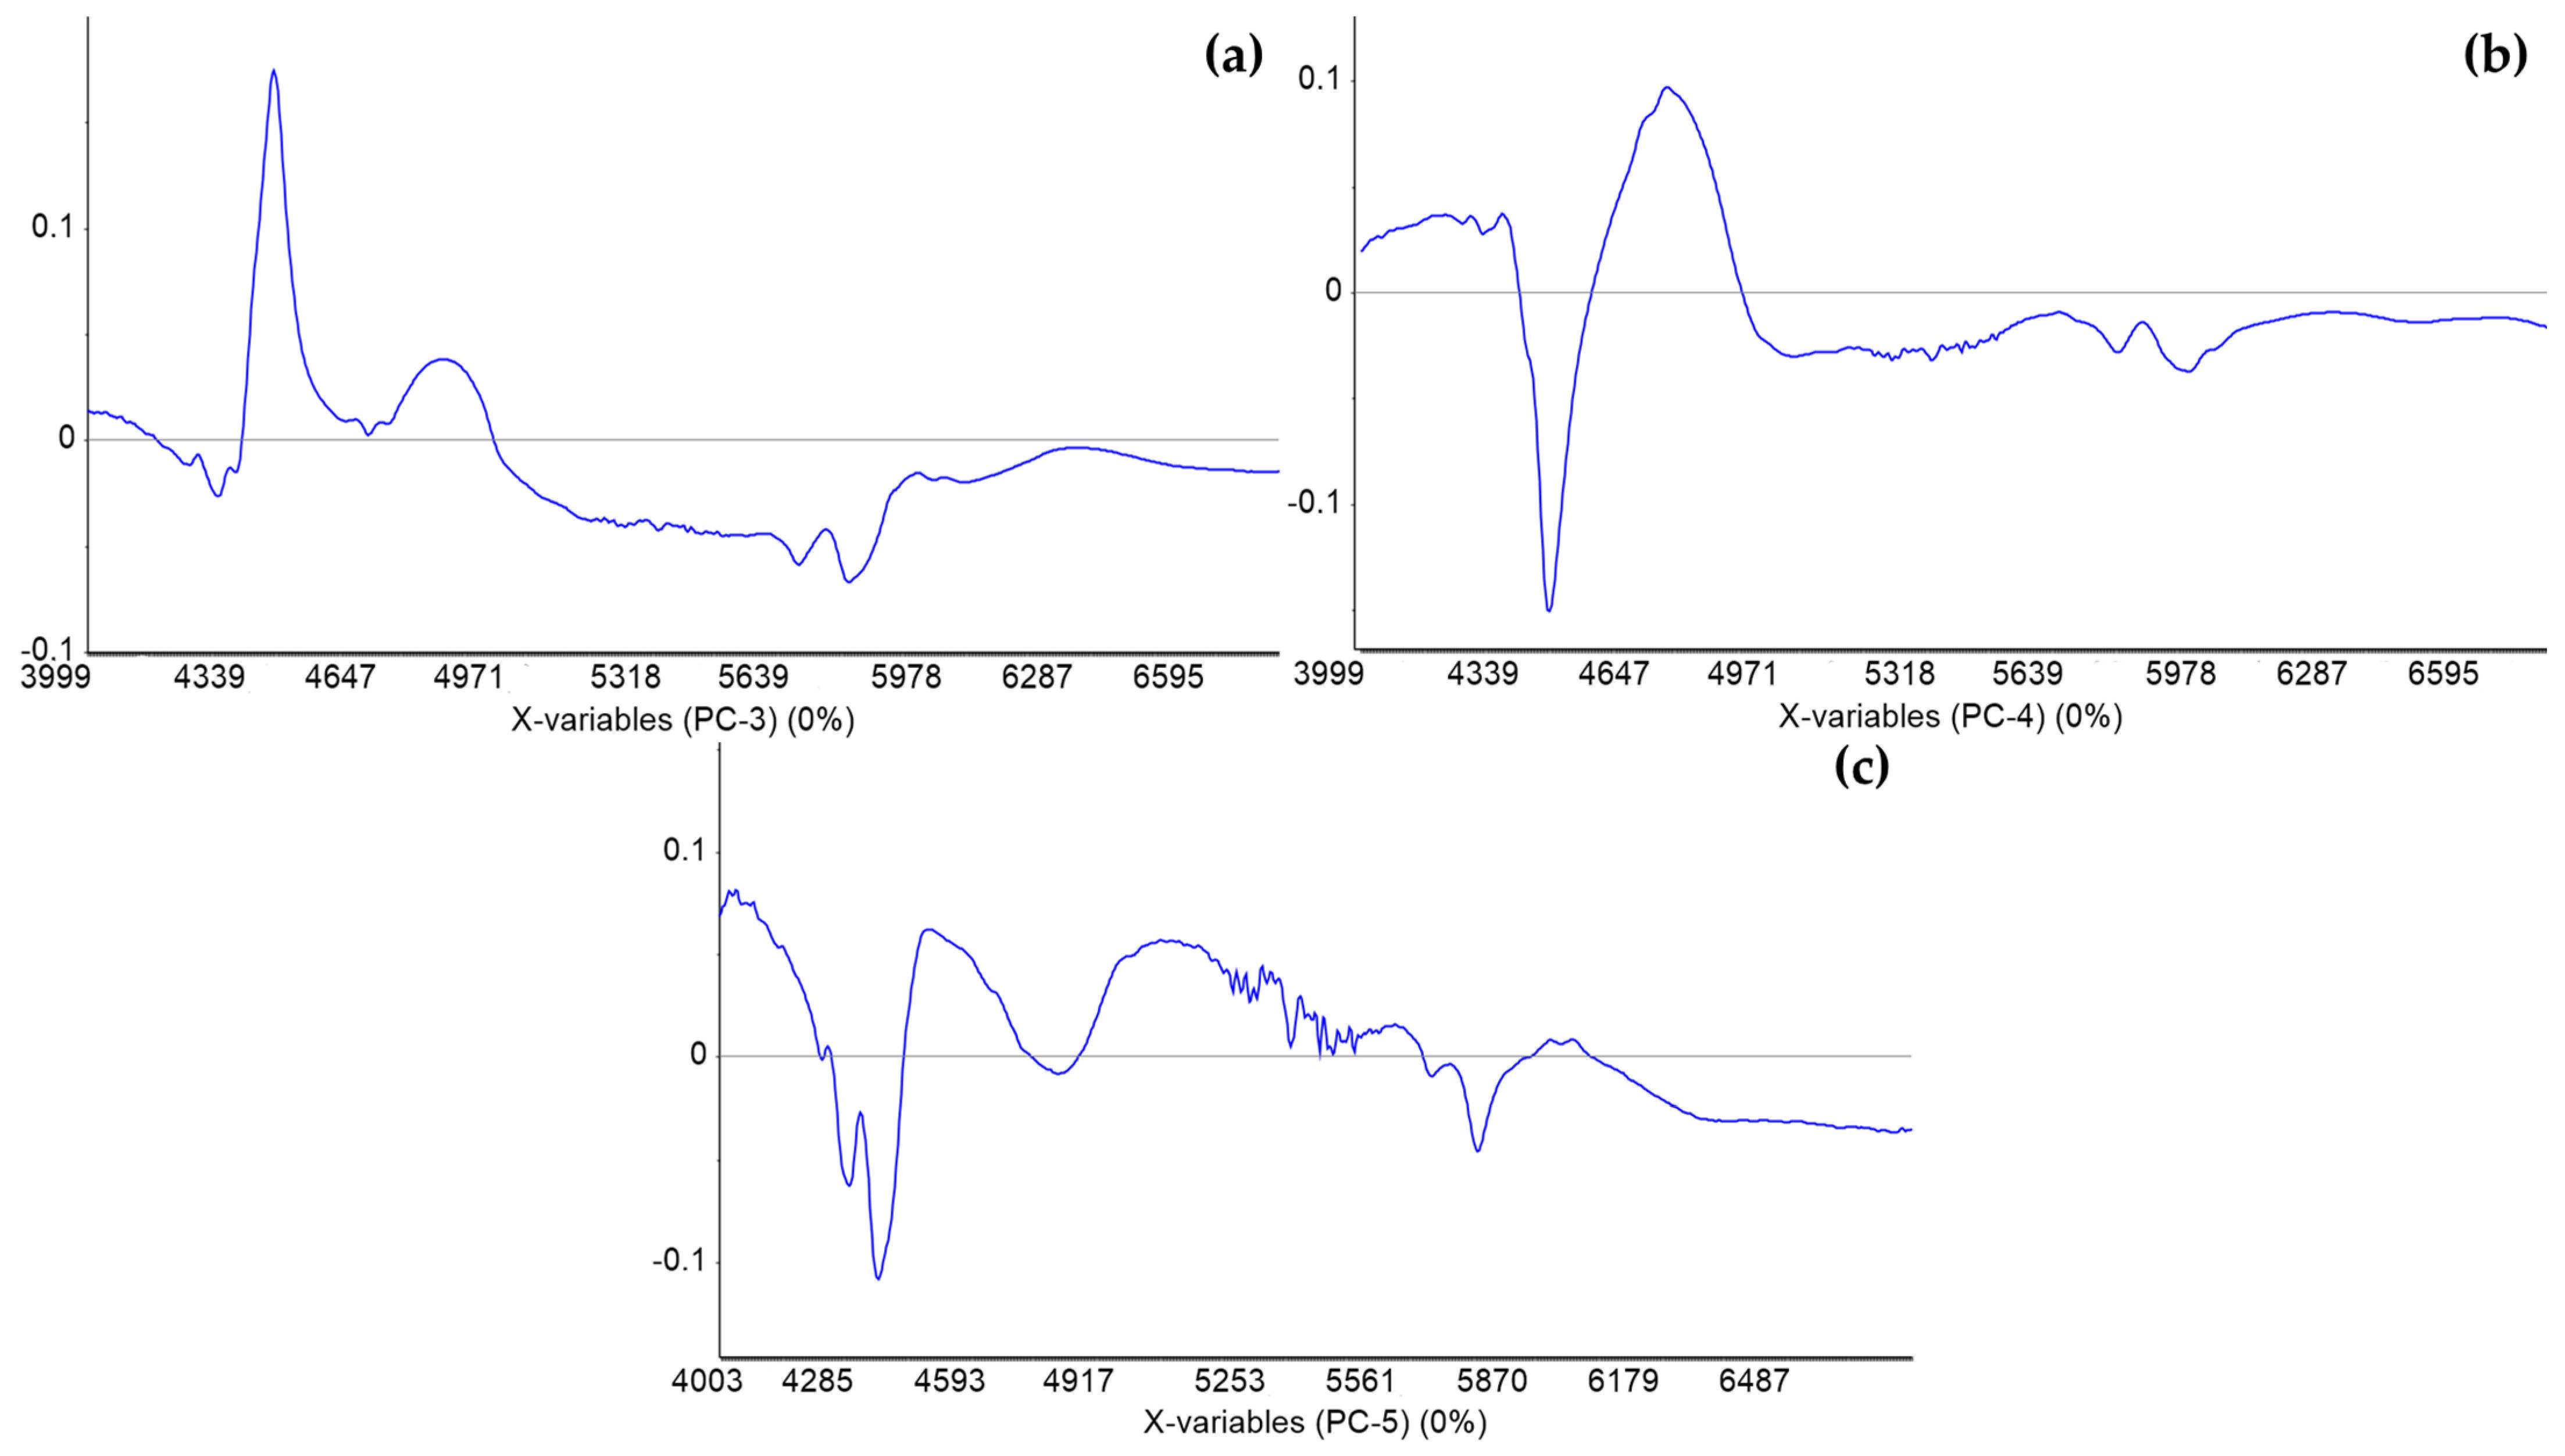
The loadings of PC3, PC4, and PC5 of PCA-LDA of FT-NIR spectra normalized to the area of all the BX blends reveals the bands at 4435, 4840, and 5790 cm−1 (Figure A2) as relevant to predict the presence of contaminants in biodiesel, while the equivalent analysis of the DPB blend (data not shown) also pointed to the band at 4435 cm−1 as relevant to the prediction of biodiesel content in diesel. Despite these bands being near the LEDs at 4760, 5260 and 5880 cm−1, especially considering the LEDs’ low resolution, other sets of LEDs could be evaluated in the future. It is worth highlighting that the low cost of the device depends on the LEDs utilization.
4. Conclusions
The development of methodologies to enable in situ in the real-time detection of biodiesel contaminants or to predict biodiesel content in diesel blends, as based on FT-NIR spectrometry, is crucial to increasing the quality control of the product and the biodiesel synthesis process. This is further strengthened by the development of portable equipment and miniaturized equipment, based on in situ or at-line analysis, by enabling a very economic, rapid and in loco analysis, which will increase the biodiesel monitoring at all stakeholders, as distributors and final consumers. This eventually increases quality control, promotes trust, and consequently promotes biodiesel use.
In the present work, a benchtop FT-NIR spectroscopic analysis, based on a transflectance probe with a fiber optic cable enabled to predict in-situ the presence of target contaminants, such as VO, methanol, and glycerol, based on the PCA-LDA models with accuracies between 75% and 95%. It was also possible to develop regression models to predict the contaminant concentration, with R-squared for the independent validation dataset between 0.83 and 0.99, and low RMSEP. Moreover, based on in situ FT-NIR spectroscopy, it was possible to predict the biodiesel concentration in diesel, for the validation dataset, with R-squared of 0.99 and an RMSEP of 0.10%(v/v).
Compared to the benchtop FT-NIR spectrometer, the nirU prototype presented reasonable models that could predict the target contaminant, with slight lower accuracies (between 68% and 86%), while the presence of biodiesel in diesel was predicted with an 80% accuracy. The present nirU prototype setup did not enable the development of reasonable PLS models to predict the target contaminant concentration, except for UCO and glycerol concentrations, and biodiesel concentration in diesel. In the near future, the LEDs’ optimization should be conducted to improve the predictive power of the models. Due to potential low costs and dimension of the current device, the equipment would potentially be use for a first screen of contaminants and blends of biodiesel in diesel, and performing a second round of analysis, if necessary, with more sophisticated equipment to predict the contaminant concentration or the biodiesel content in diesel.
Author Contributions
Conceptualization of the nirU device, P.Z. and B.B.C.; conception of blends and blend concentration to analyze: L.L.M., P.Z. and L.P.F.; multivariate data analysis: L.L.M., P.Z. and C.R.C.C.; original draft preparation: L.L.M. and C.R.C.C. All authors have read and agreed to the published version of the manuscript.
Funding
This research was funded by Fundação para a Ciência e a Tecnologia projects DSAIPA/DS/0117/2020, UIDB/04565/2020 and UIDP/04565/2020, by the Associate Laboratory Institute for Health and Bioeconomy—i4HB project LA/P/0140/2020, and by the Instituto Politécnico de Lisboa project NeproMD/ISEL/2020. The present work was partially conducted in the Engineering and Health Laboratory, which resulted from a collaboration protocol established between the Universidade Católica Portuguesa and the Instituto Politécnico de Lisboa.
Data Availability Statement
The data presented in this study are available on request from the corresponding author.
Conflicts of Interest
The authors declare no conflict of interest.
Appendix A
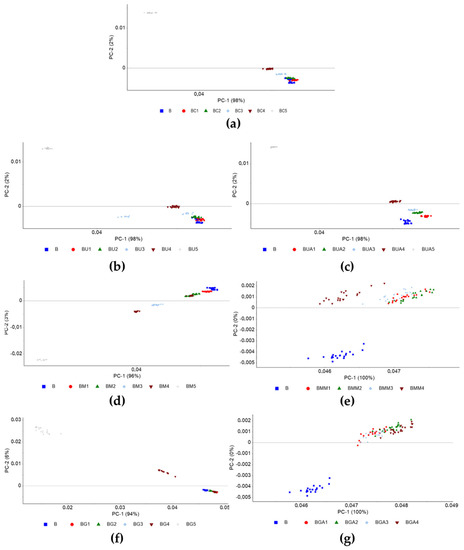
Figure A1.
PCA based on the 2nd order derivative FT-NIR spectra between 4000 and 6800 cm−1 of pure biodiesel (B) and blends (a) BC; (b) BU; (c) BUA; (d) BM; (e) BMM; (f) BG; (g) BGA.
Figure A1.
PCA based on the 2nd order derivative FT-NIR spectra between 4000 and 6800 cm−1 of pure biodiesel (B) and blends (a) BC; (b) BU; (c) BUA; (d) BM; (e) BMM; (f) BG; (g) BGA.
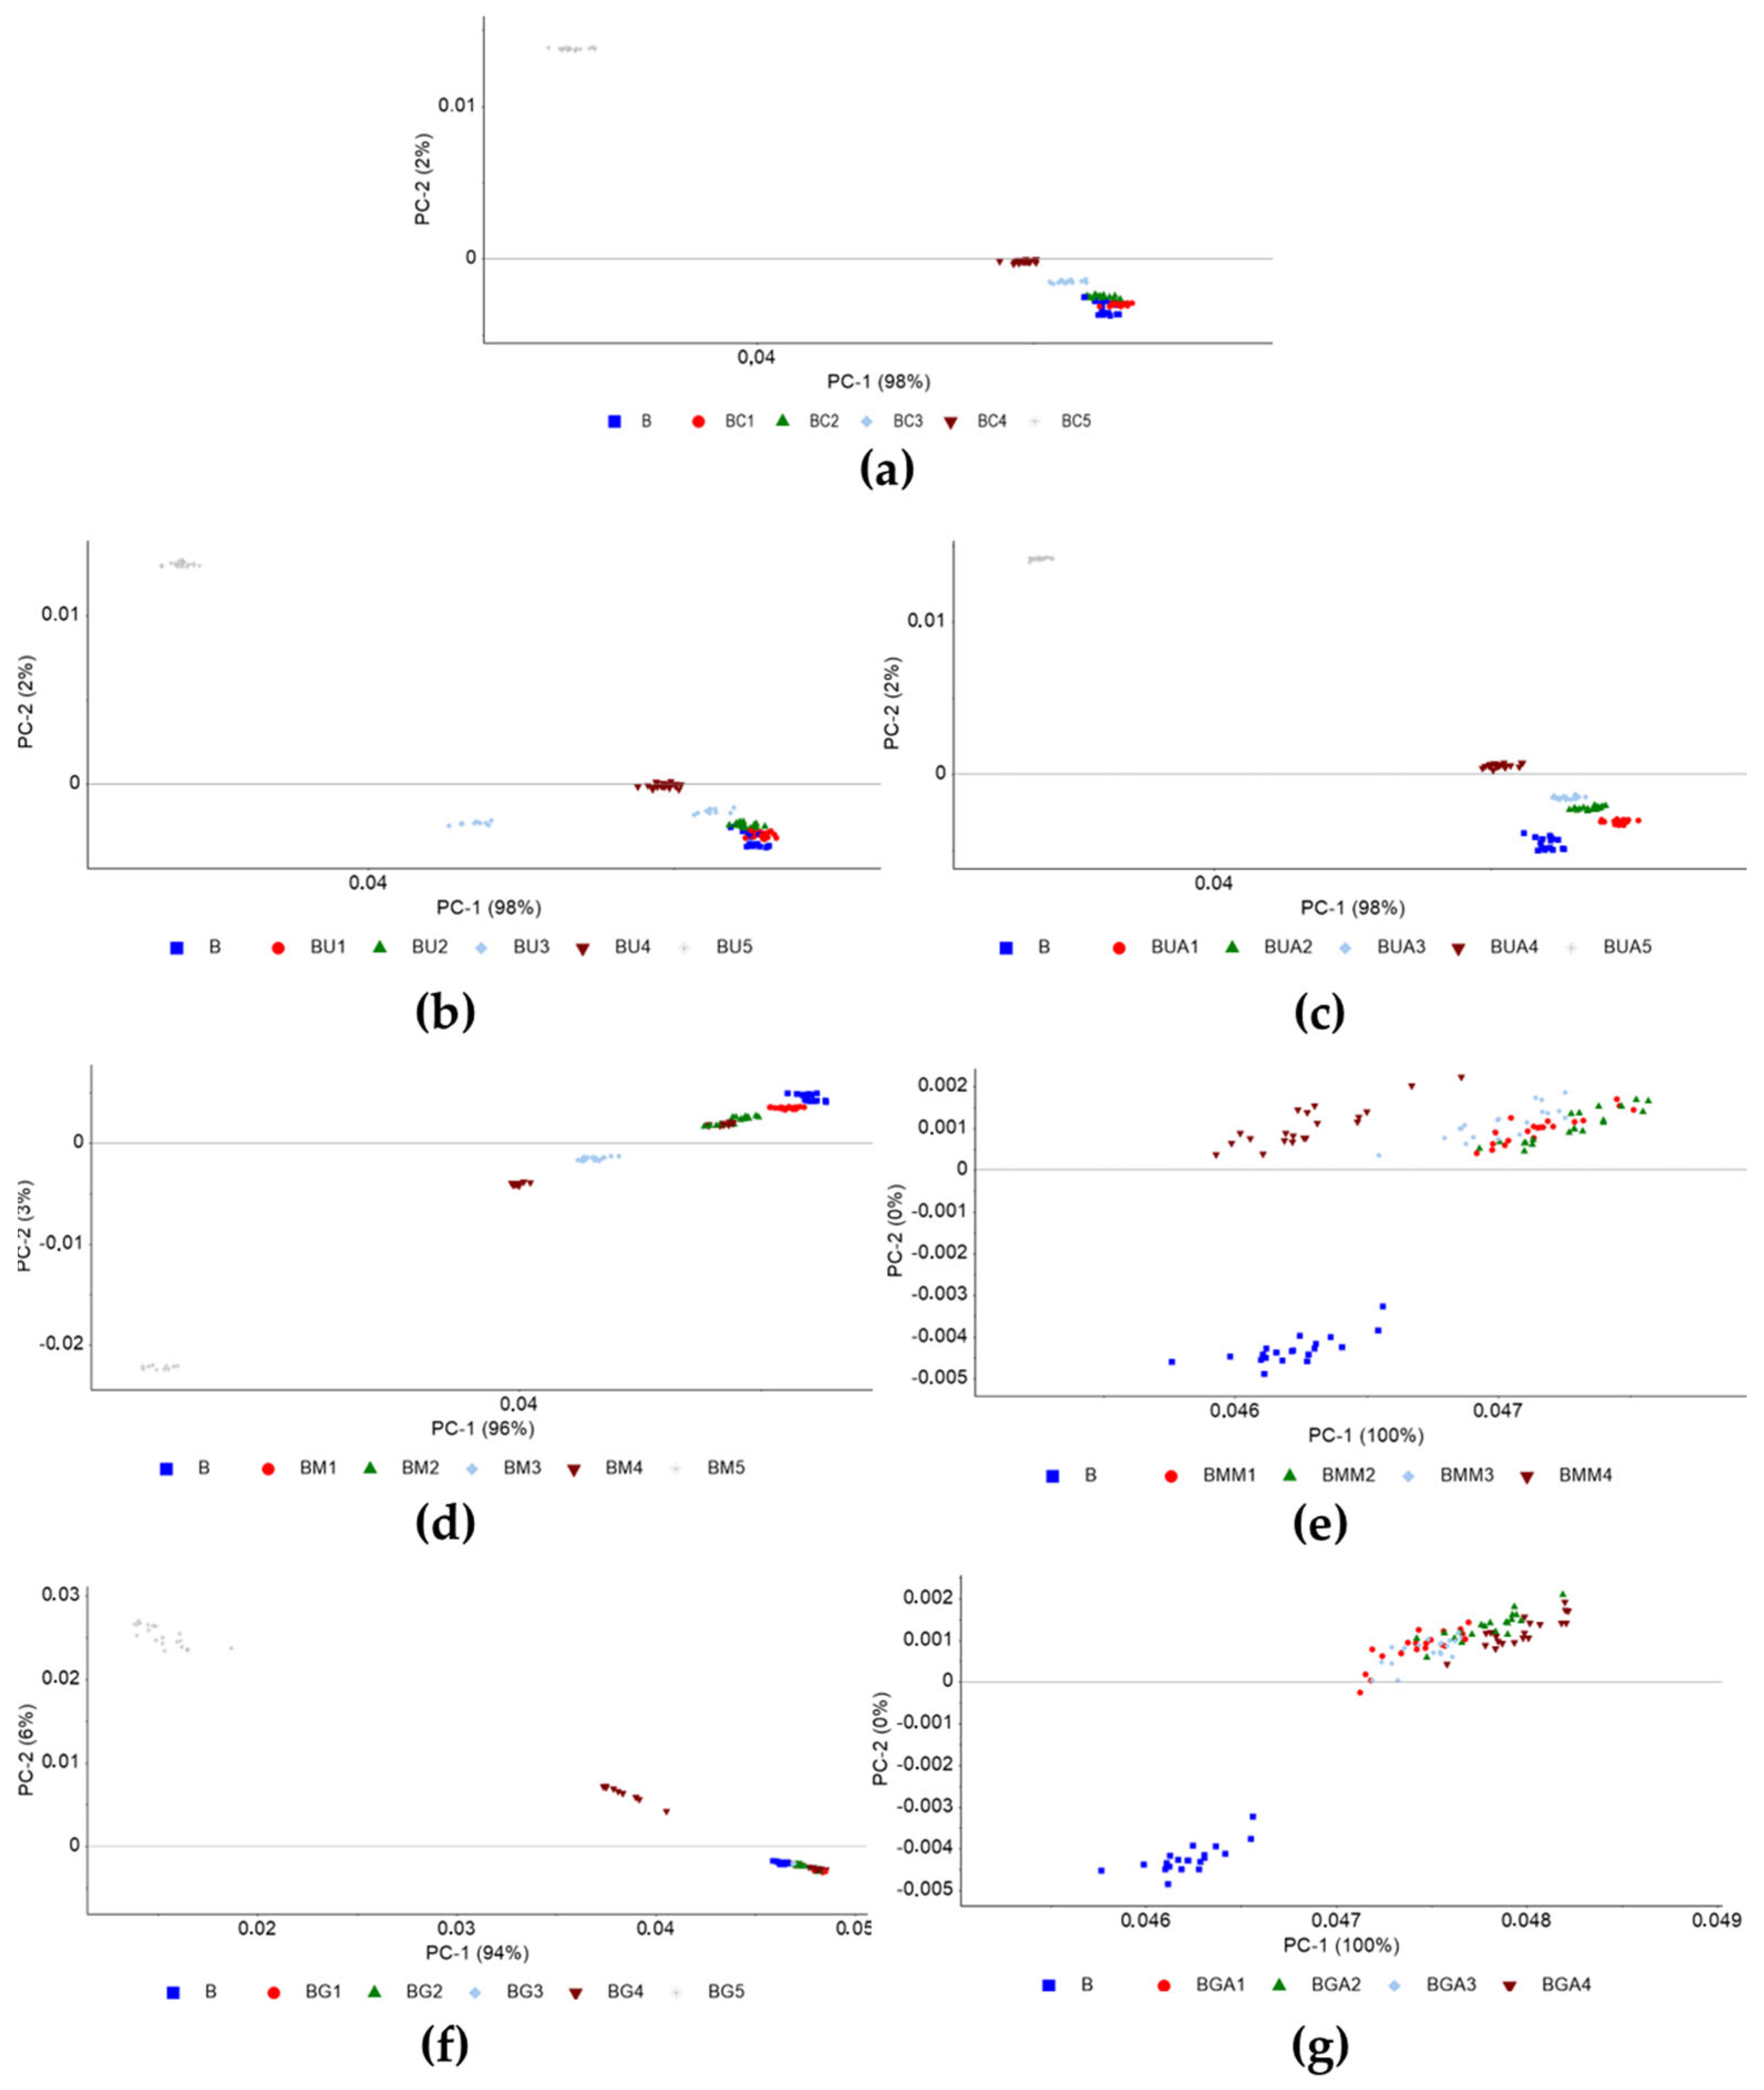

Table A1.
PLS regression models per blend based on nirU datal data according to the concentration range of each contaminant and the preprocessing method.
Table A1.
PLS regression models per blend based on nirU datal data according to the concentration range of each contaminant and the preprocessing method.
| Blend | Preprocessing Method | None | Base Corr | Base Corr + Max Norm |
|---|---|---|---|---|
| BC | Latent variables | 4 | 5 | 2 |
| R2 calibration | 0.62 | 0.61 | 0.58 | |
| R2 external validation | 0.56 | 0.57 | 0.59 | |
| RMSEC/% (w/w) | 3.57 | 3.62 | 3.73 | |
| RMSEP/% (w/w) | 3.67 | 3.64 | 3.57 | |
| BU | Latent variables | 6 | 5 | 5 |
| R2 calibration | 0.56 | 0.56 | 0.56 | |
| R2 external validation | 0.59 | 0.58 | 0.58 | |
| RMSEC/% (w/w) | 3.27 | 3.27 | 3.27 | |
| RMSEP/% (w/w) | 3.25 | 3.27 | 3.30 | |
| BUA | Latent variables | 4 | 4 | 5 |
| R2 calibration | 0.71 | 0.69 | 0.74 | |
| R2 external validation | 0.81 | 0.74 | 0.67 | |
| RMSEC/% (w/w) | 0.11 | 0.11 | 2.45 | |
| RMSEP/% (w/w) | 0.09 | 0.11 | 3.04 | |
| BM | Latent variables | 6 | 6 | 5 |
| R2 calibration | 0.61 | 0.62 | 0.61 | |
| R2 external validation | 0.57 | 0.58 | 0.57 | |
| RMSEC/% (w/w) | 3.08 | 3.04 | 3.07 | |
| RMSEP/% (w/w) | 3.02 | 2.97 | 3.02 | |
| BMM | Latent variables | 2 | 2 | 4 |
| R2 calibration | 0.53 | 0.50 | 0.54 | |
| R2 external validation | 0.36 | 0.36 | 0.28 | |
| RMSEC/% (w/w) | 2.45 × 10⁻³ | 2.51 × 10⁻³ | 0.24 | |
| RMSEP/% (w/w) | 2.30 × 10⁻³ | 2.30 × 10⁻³ | 0.24 | |
| BG | Latent variables | 6 | 6 | 4 |
| R2 calibration | 0.69 | 0.71 | 0.72 | |
| R2 external validation | 0.66 | 0.68 | 0.70 | |
| RMSEC/% (w/w) | 2.59 | 2.52 | 2.47 | |
| RMSEP/% (w/w) | 3.28 | 3.19 | 3.11 | |
| BGA | Latent variables | 4 | 4 | 3 |
| R2 calibration | 0.80 | 0.83 | 0.83 | |
| R2 external validation | 0.82 | 0.79 | 0.81 | |
| RMSEC/% (w/w) | 1.49 × 10⁻³ | 1.41 × 10⁻³ | 0.14 | |
| RMSEP/% (w/w) | 1.33 × 10⁻³ | 1.43 × 10⁻³ | 0.13 |
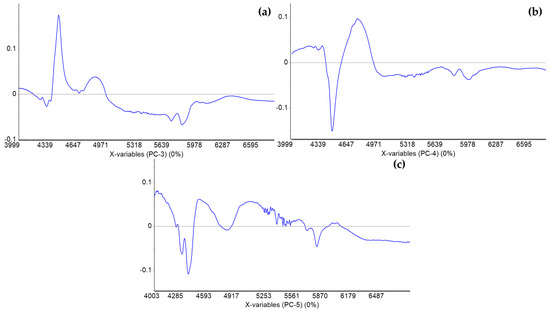
Figure A2.
Loadings of (a) PC3, (b) PC4, and (c) PC5 of FT-NIR spectra PCA of the BX blends based on area normalization between 4000 and 6800 cm−1.
Figure A2.
Loadings of (a) PC3, (b) PC4, and (c) PC5 of FT-NIR spectra PCA of the BX blends based on area normalization between 4000 and 6800 cm−1.
References
- Bozbas, K. Biodiesel as an alternative motor fuel: Production and policies in the European Union. Renew. Sustain. Energy Rev. 2005, 12, 542–552. [Google Scholar] [CrossRef]
- Ferrero, G.O.; Faba, E.M.S.; Rickert, A.A.; Eimer, G.A. Alternatives to rethink tomorrow: Biodiesel production from residual and non-edible oils using biocatalyst technology. Renew. Sustain. Energy Rev. 2019, 150, 128–135. [Google Scholar] [CrossRef]
- Verma, P.; Sharma, M.; Dwivedi, G. Impact of alcohol on biodiesel production and properties. Renew. Sustain. Energy Rev. 2016, 56, 319–333. [Google Scholar] [CrossRef]
- Gelinski, E.K.; Hamerski, F.; Corazza, M.L.; Santos, A.F. Biodiesel Synthesis Monitoring using Near Infrared Spectroscopy. Open Chem. Eng. J. 2018, 12, 95–110. [Google Scholar] [CrossRef]
- European Biodiesel Board (EBB), about Biodiesel. European Union. Available online: https://ebb-eu.org/about-biodiesel/ (accessed on 11 August 2022).
- Zhang, W.-B. Review on analysis of biodiesel with infrared spectroscopy. Renew. Sustain. Energy Rev. 2012, 16, 6048–6058. [Google Scholar] [CrossRef]
- Christopher, L.P.; Kumar, H.; Zambare, V.P. Enzymatic biodiesel: Challenges and opportunities. Appl. Energy 2014, 119, 497–520. [Google Scholar] [CrossRef]
- Alternative Fuels Data Center, Diesel Vehicles Using Biodiesel. U.S. Department of Energy. Available online: https://afdc.energy.gov/vehicles/diesel.html (accessed on 11 August 2022).
- European Standard EN 14214; CEN—European Committee for Standardization: Brussels, Belgium, 2003.
- Pontes, M.J.C.; Pereira, C.F.; Pimentel, M.F.; Vasconcelos, F.V.C.; Silva, A.G.B. Screening analysis to detect adulteration in diesel/biodiesel blends using near-infrared spectrometry and multivariate classification. Talanta 2011, 85, 2159–2165. [Google Scholar] [CrossRef]
- Corgozinho, C.N.; Pasa, V.M.; Barbeira, P.J. Determination of residual oil in diesel oil by spectrofluorimetric and chemometric analysis. Talanta 2008, 76, 479–484. [Google Scholar] [CrossRef]
- López-Fernández, J.; Moya, D.; Benaiges, M.D.; Valero, F.; Alcalà, M. Near Infrared Spectroscopy: A useful technique for inline monitoring of the enzyme catalyzed biosynthesis of third-generation biodiesel from waste cooking oil. Fuel 2022, 319, Article 123794. [Google Scholar] [CrossRef]
- Sales, K.C.; Rosa, F.; Sampaio, P.N.; Fonseca, L.P.; Lopes, M.B.; Calado, C.R. In Situ Near-Infrared (NIR) Versus High-Throughput Mid-Infrared (MIR) Spectroscopy to Monitor Biopharmaceutical Production. Appl. Spectrosc. 2014, 69, 760–772. [Google Scholar] [CrossRef]
- Mazivila, S.J. Trends of non-destructive analytical methods for identification of biodiesel feedstock in diesel-biodiesel blend according to European Commission Directive 2012/0288/EC and detecting diesel-biodiesel blend adulteration: A brief review. Talanta 2018, 180, 239–247. [Google Scholar] [CrossRef] [PubMed]
- Baptista, P.; Felizardo, P.; Menezes, J.C.; Correia, M.J.N. Multivariate near infrared spectroscopy models for predicting the methyl esters content in biodiesel. Anal. Chim. Acta 2008, 607, 153–159. [Google Scholar] [CrossRef]
- Lira, L.F.B.; Vasconcelos, F.V.C.; Pereira, C.F.; Paim, A.P.S.; Stragevitch, L.; Pimentel, M.F. Prediction of properties of diesel/biodiesel blends by infrared spectroscopy and multivariate calibration. Fuel 2010, 89, 405–409. [Google Scholar] [CrossRef]
- Canha, N.; Felizardo, P.; Menezes, J.C.; Correia, M.J.N. Multivariate near infrared spectroscopy models for predicting the oxidative stability of biodiesel: Effect of antioxidants addition. Fuel 2012, 97, 352–357. [Google Scholar] [CrossRef]
- Canha, N.; Felizardo, P.; Correia, M.J.N. Controlling the Oxidative Stability of Biodiesel Using Oils or Biodiesel Blending or Antioxidants Addition. Environ. Prog. Sustain. Energy 2017, 37, 1031–1040. [Google Scholar] [CrossRef]
- Baptista, P.; Felizardo, P.; Menezes, J.C.; Correia, M.J.N. Monitoring the quality of oils for biodiesel production using multivariate near infrared spectroscopy models. J. Near Infrared Spectrosc. 2008, 16, 445–454. [Google Scholar] [CrossRef]
- Felizardo, P.; Baptista, P.; Uva, M.S.; Menezes, J.C.; Correia, M.J.N. Monitoring biodiesel fuel quality by near infrared spectroscopy. J. Near Infrared Spectrosc. 2007, 15, 97–105. [Google Scholar] [CrossRef]
- Du, Q.; Zhu, M.; Shi, T.; Luo, X.; Gan, B.; Tang, L.; Chen, Y. Adulteration detection of corn oil, rapeseed oil and sunflower oil in camellia oil by in situ diffuse reflectance near-infrared spectroscopy and chemometrics. Food Control 2021, 121, Article 107577. [Google Scholar] [CrossRef]
- Correia, R.M.; Domingos, E.; Cáo, V.M.; Araujo, B.R.; Sena, S.; Pinheiro, L.U.; Fontes, A.M.; Aquino, L.F.M.; Ferreira, E.C.; Filgueiras, P.R.; et al. Portable near infrared spectroscopy applied to fuel quality control. Talanta 2018, 176, 26–33. [Google Scholar] [CrossRef]
- Paiva, E.M.; Rohwedder, J.J.R.; Pasquini, C.; Pimentel, M.F.; Pereira, C.F. Quantification of biodiesel and adulteration with vegetable oils in diesel/biodiesel blends using portable near-infrared spectrometer. Fuel 2015, 160, 57–63. [Google Scholar] [CrossRef]
- Fernandes, D.D.S.; Gomes, A.A.; Costa, G.B.; Silva, G.W.B.; Véras, G. Determination of biodiesel content in biodiesel/diesel blends using NIR and visible spectroscopy with variable selection. Talanta 2011, 87, 30–34. [Google Scholar] [CrossRef] [PubMed]
- Silva, G.W.B.; Gomes, A.A.; Silva, P.; Costa, G.B.; Fernandes, D.D.S.; Fontes, M.M.; Veras, G. Biodiesel/Diesel Blends Classification with Respect to Base Oil Using NIR Spectrometry and Chemometrics Tools. J. Am. Oil Chem. Soc. 2012, 89, 1165–1171. [Google Scholar] [CrossRef]
- Alves, J.C.L.; Poppi, R.J. Biodiesel content determination in diesel fuel blends using near infrared (NIR) spectroscopy and support vector machines (SVM). Talanta 2012, 104, 155–161. [Google Scholar] [CrossRef]
- Pimentel, M.F.; Ribeiro, G.M.; Cruz, R.S.; Stragevitch, L.; Filho, J.G.A.P.; Teixeira, L.S. Determination of biodiesel content when blended with mineral diesel fuel using infrared spectroscopy and multivariate calibration. Microchem. J. 2006, 82, 201–206. [Google Scholar] [CrossRef]
- Felizardo, P.; Baptista, P.; Menezes, J.C.; Correia, M.J.N. Multivariate near infrared spectroscopy models for predicting methanol and water content in biodiesel. Anal. Chim. Acta 2007, 595, 107–113. [Google Scholar] [CrossRef] [PubMed]
- Alves, J.C.L.; Poppi, R.J. Quantification of conventional and advanced biofuels contents in diesel fuel blends using near-infrared spectroscopy and multivariate calibration. Fuel 2016, 165, 379–388. [Google Scholar] [CrossRef]
- Silva, N.C.; Cavalcanti, C.J.; Honorato, F.A.; Amigo, J.M.; Pimentel, M.F. Standardization from a benchtop to a handheld NIR spectrometer using mathematically mixed NIR spectra to determine fuel quality parameters. Anal. Chim. Acta 2017, 954, 32–42. [Google Scholar] [CrossRef]
- Richard, R.; Dubreuil, B.; Thiebaud-Roux, S.; Prat, L. On-line monitoring of the transesterification reaction carried out in microreactors using near infrared spectroscopy. Fuel 2013, 104, 318–325. [Google Scholar] [CrossRef]
- Killner, M.H.; Rohwedder, J.J.; Pasquini, C. A PLS regression model using NIR spectroscopy for on-line monitoring of the biodiesel production reaction. Fuel 2011, 90, 3268–3273. [Google Scholar] [CrossRef]
- Sales, R.; Silva, N.C.; Silva, J.P.; França, H.H.; Pimentel, M.F.; Stragevitch, L. Handheld near-infrared spectrometer for on-line monitoring of biodiesel production in a continuous process. Fuel 2019, 254, Article 115680. [Google Scholar] [CrossRef]
- Lima, S.M.; Silva, B.F.A.; Pontes, D.V.; Pereira, C.F.; Stragevitch, L.; Pimentel, M.F. In-line monitoring of the transesterification reactions for biodiesel production using NIR spectroscopy. Fuel 2014, 115, 46–53. [Google Scholar] [CrossRef]
- Alcalà, M.; Blanco, M.; Moyano, D.; Broad, N.W.; O’Brien, N.; Friedrich, D.; Pfeiffer, F.; Siesler, H.W. Qualitative and quantitative pharmaceutical analysis with a novel hand-held miniature near infrared spectrometer. J. Near Infrared Spectrosc. 2014, 21, 445–457. [Google Scholar] [CrossRef]
- Kranenburg, R.F.; Weesepoel, Y.; Alewijn, M.; Sap, S.; Arisz, P.W.; Esch, A.; Keizers, P.H.; Asten, A.C. The importance of wavelength selection in on-scene identification of drugs of abuse with portable near-infrared spectroscopy. Forensic Chem. 2022, 30, Article 100437. [Google Scholar] [CrossRef]
- Beć, D.K.B.; Grabska, D.J.; Huck, P.C.W. Principles and Applications of Miniaturized Near-Infrared (NIR) Spectrometers. Chemistry 2021, 27, 1514–1532. [Google Scholar] [CrossRef] [PubMed]
- Beć, K.B.; Grabska, J.; Huck, C.W. Miniaturized NIR Spectroscopy in Food Analysis and Quality Control: Promises, Challenges, and Perspectives. Foods 2022, 11, 1465. [Google Scholar] [CrossRef]
- Lutz, O.; Bonn, G.; Rode, B.; Huck, C. Reproducible quantification of ethanol in gasoline via a costumized near-infrared spectrometer. Anal. Chim. Acta 2014, 826, 61–68. [Google Scholar] [CrossRef] [PubMed]
- Zimmermann, B.; Kohler, A. Optimizing Savitzky–Golay Parameters for Improving Spectral Resolution and Quantification in Infrared Spectroscopy. Appl. Spectrosc. 2013, 67, 892–902. [Google Scholar] [CrossRef]
- Zeaiter, M.; Rutledge, D. 3.04—Preprocessing Methods. In Comprehensive Chemometrics; Brown, S.D., Tauler, R., Walczak, B., Eds.; Elsevier: Amsterdam, The Netherlands, 2009; Volume 3, pp. 121–231. [Google Scholar]
- Oliveira, F.C.; Brandão, C.R.; Ramalho, H.F.; Costa, L.A.; Suarez, P.A.; Rubim, J.C. Adulteration of diesel/biodiesel blends by vegetable oil as determined by Fourier transform (FT) near infrared spectrometry and FT-Raman spectroscopy. Anal. Chim. Acta 2007, 587, 194–199. [Google Scholar] [CrossRef]
Disclaimer/Publisher’s Note: The statements, opinions and data contained in all publications are solely those of the individual author(s) and contributor(s) and not of MDPI and/or the editor(s). MDPI and/or the editor(s) disclaim responsibility for any injury to people or property resulting from any ideas, methods, instructions or products referred to in the content. |
© 2023 by the authors. Licensee MDPI, Basel, Switzerland. This article is an open access article distributed under the terms and conditions of the Creative Commons Attribution (CC BY) license (https://creativecommons.org/licenses/by/4.0/).

