Article

Gas Formation of Cobalt and Copper in the Application of Unconstrained Co-Cr-Al-Cu Metal Powders in Submerged Arc Welding: Gas Phase Thermodynamics and 3D Slag SEM Evidence

Department of Materials Science and Metallurgical Engineering, University of Pretoria, Pretoria 0002, South Africa
*
Author to whom correspondence should be addressed.
Processes 2023, 11(4), 1116; https://doi.org/10.3390/pr11041116
Submission received: 7 March 2023 / Revised: 22 March 2023 / Accepted: 30 March 2023 / Published: 5 April 2023
(This article belongs to the Section Manufacturing Processes and Systems)

Abstract

:
Aluminium metal is not typically added to the submerged arc welding (SAW) process because it is easily oxidised to form unwanted slag in the weld pool. The successful application of aluminium as a de-oxidiser is illustrated in this study by preventing oxidation of Cr and Co to their oxides, thereby preventing element loss to the slag. Unconstrained pure metals of Al, Cr, Co and Cu were applied to investigate the gas formation behaviour of these elements in the SAW arc cavity. Of interest is the effect of copper in the arc cavity in terms of its possible substitution for aluminium. The results confirmed that the Al-Cr-Co-Cu alloyed weld metal total oxygen content was lowered to 176 ppm O, in comparison to 499 ppm O in the weld metal formed from welding with the original flux, which excluded metal powder additions. This lower ppm O value of 176 ppm O confirms that the added aluminium powder effectively lowered the original flux-induced partial oxygen pressure in the arc cavity, and at the molten flux–weld pool interface. Carbon steel was alloyed to 5.3% Co, 5.5% Cr, 5.3% Cu and 4.5% Al at 78% Co yield, 82% Cr yield, 78% Cu yield and 66% Al yield. Thermochemical equilibrium calculations confirm the partial oxygen pressure-lowering effect of aluminium when considering the gas–slag–alloy equilibrium. BSE (backscattered electron) images of the three-dimensional (3D) post-weld slag sample show dome structures which contain features of vapour formation and re-condensation. SEM-EDX (scanning electron microscope-energy dispersive X-ray) maps show that the dome surface matrix phase consists of Al-Mg-Ca-Si-Na-K-Ti-Fe-Mn oxy-fluoride. The spherical 3D structures of 10–40 µm in diameter consist of Fe-Mn-Si fluorides with some Cr, Cu and Co contained in some of the spheres. Cr and Co were observed in distinctive porous structures of approximately 10 µm in size, consisting partly of Cr oxy-fluoride and partly of Co oxy-fluoride. Nano-sized oxy-fluoride strands and spheres in the dome structures confirm vaporisation and re-condensation of oxy-fluorides. Cu and Na formed a distinct condensation pattern on the surface of the Si-Cu-Na-Mn-Fe-Co oxy-fluoride sphere. The results confirm the importance of including gas phase reactions in the interpretation of SAW process metallurgy.

1. Introduction

Submerged arc welding (SAW) is used to join thick steel plates at high deposition rates [1]. The SAW process is also used to deposit overlay layers in cladding and in hard facing operations made to protect the underlying weaker substrate materials [2]. The fundamental aspects of the SAW process remain the same, despite these different SAW process applications.
Previous studies by Coetsee and De Bruin [3,4,5,6,7,8,9,10,11,12] illustrated the application of unconstrained pure metal powders in different combinations with aluminium as a de-oxidiser. Addition of Al metal to the SAW process is typically avoided because aluminium is easily oxidised and can form unwanted slag in the weld pool. This novel application of aluminium metal powder in SAW demonstrates the modification of flux oxygen behaviour to control the weld metal total ppm O. The weld metal total ppm O should be controlled within specific limits to ensure high impact toughness, typically at 200–500 ppm O in carbon steel [13]. The purpose of applying aluminium to lower the oxygen potential at the molten flux–weld pool interface and in the arc cavity is to improve the element yield from the metal powder to the weld metal by preventing oxidation of the metal powders. This is particularly the case for high oxygen affinity metals such as Cr and Ti, which are not easily transferred across the arc because these elements are easily oxidised in the arc [14]. Chromium is easily added to the weld pool from the weld wire, for example, in cladding applications [14,15]. However, the limitation of this is that only a small number of weld wire formulations are available, and these weld wires cannot closely match all desired alloy compositions. It has been demonstrated that modification of the SAW process by applying pre-alloyed metal powders with one solid arching weld wire can better match the weld metal chemistry to the base plate material chemistry [16].
The link between oxygen potential in the SAW process and weld metal total ppm O is set by the flux chemistry, because the oxides in the flux form the main source of oxygen in the SAW process [17,18]. This effect is illustrated by the empirical relationship of flux basicity vs. weld metal total ppm, as developed by Tulinai et al. [19]. The flux basicity (BI) is calculated according to the mass ratios in Equation (1). At flux BI values in excess of 1.5, the weld metal total ppm O is constant, at 250 ppm O [19].
BI = % CaF 2 + % CaO + % MgO + % BaO + % SrO + % Na 2 O + % K 2 O + % Li 2 O + 0.5 % MnO + % FeO % SiO 2 + 0.5 % Al 2 O 3 + % TiO 2 + % ZrO 2
The value of 250 ppm O may seem trivial, since it is such a small quantity. However, experimental works have shown that the initial oxygen quantity in the weld pool is much higher, at 2000–3000 ppm O [20,21]. The implication is that the high initial quantity of 2000–3000 ppm O in the weld pool must to be lowered to 200–500 ppm to ensure acceptable weld metal materials properties, such as high enough impact toughness values. It is accepted that slag–metal equilibrium is not attained in the SAW process [22].
However, the gas phase is mostly ignored in SAW process metallurgy, because it is not easily analysed. Flux chemistry sets the gas phase speciation in the arc cavity. Recent studies have applied sophisticated real-time analyses techniques of high-speed imaging and gas phase spectroscopy to research the complex details of arc cavity phenomena in SAW [23]. The gas phase analyses confirmed that the specific flux formulation sets the dominant elements in the arc cavity [1,23]. For example, Ca, Mg, Na, Fe and K were analysed in the arc cavity gas phase, with the elements Cl, F, H, Mn and O also analysed [1,23]. The flux chemistry also influences the arc physical phenomena, as discussed in detail by the authors [1,23,24]. For example, increasing CaF2 additions to the flux decreases the arc length by decreasing plasma conductivity via changes in the proportions of fluorine to oxygen in the gas phase [24]. The flux CaF2 content influences the slag electrical conductivity, as excessive CaF2 additions may cause current loss to the slag shell [1]. Therefore, the flux chemical formulation not only drives the process metallurgy of SAW, but also determines the arc plasma phenomena, which are important in arc energy generation and metal transfer to the weld pool [1,23,24].
It was illustrated that gas–slag–metal equilibrium calculations are required instead of only slag–metal equilibrium calculations, in order to accurately calculate the weld metal total ppm O quantity for a flux formulation [25,26]. This approach was also followed in the modelling of the effect of Al as a de-oxidiser in SAW to better explain the effect of added Al in gas phase reactions [4,11,12].
Cobalt has a relatively low affinity for oxygen and is therefore typically added to the weld pool from the alloyed weld wire. Cobalt is used as the matrix phase, with carbides of chromium for hard-facing, in the well-known cobalt–chromium-based alloy, Stellite [2]. Cobalt is used to improve the creep resistance in newly developed steel grades applied in ultra-supercritical (USC) power generation plant applications, with up to 3% Co contained in 9% Cr high-temperature steel [27,28]. Pre-alloyed metal powders can also be used for alloying in hard-facing applications with the SAW process [16]. Iron-based pre-alloyed powder of 40% Co has been applied in SAW hard-facing applications, but no cobalt yield number was reported [16].
Copper additions are made to carbon steel and stainless steel to enhance both the mechanical and corrosion properties of steel [29]. An example is the addition of copper to 4% in chrome-manganese stainless steels to improve corrosion resistance whilst maintaining good weldability of this steel grade [29]. The addition of copper to the weld metal via the weld wire creates materials handling difficulties. Higher copper content weld wire work hardens, and is not easily formed into wire product; such wire is also not easily passed through the roller guide system of the SAW equipment [30]. The addition of copper to the weld metal in SAW from metal powder offers a solution to the practical material problem of feeding work hardening copper-containing wire. Copper, together with aluminium, functions as a stabiliser in the SAW process, because it forms a low liquidus temperature alloy melt, which facilitates the melting of high-melting point metals such as Ti and Cr into the weld pool [7,8,9].
New steel formulations are developed with large quantities of aluminium required as a necessary building block element in the steel’s formulation, specifically in the development of low-density/high-entropy steels and low-density stainless steels [31,32]. Therefore, aluminium as an alloying element in combination with other alloying elements will become increasingly important in the future application of these steel grades. Development of the SAW process to accommodate large aluminium additions will ensure that the high-productivity welding of thick sections with SAW is also applied to low-density/high-entropy steels and low-density stainless steels.
Previous studies on aluminium-assisted weld metal alloying in SAW included Co with other elements in various combinations such as Co-Cr-Al and Co-Al [4,10]. The Cu-Cr-Co-Al metal powder combination has not been studied in this SAW application format. Therefore, the objective of this study is to clarify the gas formation behaviour of Co and Cu when applied as unconstrained metal powders with Al and Cr in SAW. Three-dimensional (3D) post-weld slag sample phase chemistry analyses by SEM-EDX (scanning electron microscope-energy dispersive X-ray) were used to investigate the speciation and element distribution of Cu in the slag. Thermodynamic modelling is used in the form of gas–slag–metal powder reaction equilibrium calculations to investigate the gas formation behaviour of Co and Cu due to the chemical interaction between welding flux and Al, Cr, Co and Cu metal powders in SAW.
This paper contains a short section on materials and methods (Section 2). The results section (Section 3) contains the weld metal chemistry measurements (Section 3.1); metal powder yield percentages calculated from the mass balance (Section 3.2); the quantification of the exothermic effect of aluminium additions (Section 3.3) and the 3D slag sample element speciation and distribution measurements (Section 3.4). The discussion covers the thermodynamics of simple chemical interactions (Section 4.1); thermochemical equilibrium calculations (Section 4.2) and the SAW process flow diagram (Section 4.3). Section 5 contains the conclusions.

2. Materials and Methods

Welding test conditions are described in brief in Section 2.1, since the detailed description of the welding tests and the sampling and analyses methods are already available [10,33]. Section 2.2 describes the details of the thermochemical calculations made to model the gas phase reactions in SAW, with metal powder additions included.

2.1. Welding Tests

Welding tests were performed as bead-on-plate weld runs, typically of 260 mm length, onto a 350 mm long carbon steel plate. The plate thickness was 12 mm, and the plate width was 300 mm. The welding parameters were 500 A and 28 V at 42 cm/min travel speed to provide a heat input value of 2.0 kJ/mm. Welding was carried out DCEP (direct current electrode positive) with a weld wire of 3.2 mm diameter [10,33].
The weld metal cross section photographs in Figure 1 display the base case (BC) weld made without any metal powders added, in comparison with the MP11 weld metal cross section made with the addition of metal powders, namely 7 g each of Al, Cr, Co and Cu. Metal powders were sourced from the following chemicals suppliers: Al (99.7% Al) and Co (99.9% Co) from Sigma-Aldrich (St. Louis, MI, USA), Cu (99.8% Cu) from GoodFellow, and Cr (99.0% Cr) from Alfa Aesar, Ward Hill, MA, USA. The welding parameters applied in all welding tests were the same. The analysis methods applied to the input materials, namely the base plate steel, steel weld wire and the flux, were described previously [5].

2.2. Thermochemical Calculations for Gas Phase Reactions

Previous studies by Coetsee and De Bruin illustrated the application of aluminium powder as de-oxidiser in SAW to control the weld metal total ppm O in the alloying of the weld metal with chromium-containing powders [4,6,8,9,11,12] and with titanium-containing powders [5,7,9]. The added aluminium lowers the partial oxygen pressure at the molten flux-weld pool interface. In addition, aluminium in the arc cavity lowers the oxygen partial pressure in the arc cavity [3,4,11,12,34]. The latter effect was confirmed from thermochemical calculations [4,10,11,12]. FactSage 7.3 thermochemical software was used to calculate the gas–slag–powder alloy equilibrium. This gas–slag–metal equilibrium model is similar to the simulation model previously successfully applied to calculate the carbon steel weld metal total ppm O in SAW for different flux formulations [25]. The gas–slag–powder alloy equilibrium calculation results were used to compare the likely end state gas composition for different proportions of aluminium, specified as input for the equilibrium calculation. The FToxid, FSstel and FactPS databases were selected for use in the equilibrium calculation in the Equilib module. Plasma species were included in the equilibrium calculation as part of the gas phase stream [35]. The calculation results are discussed in Section 4.2.

3. Results

3.1. Weld Metal Chemistry

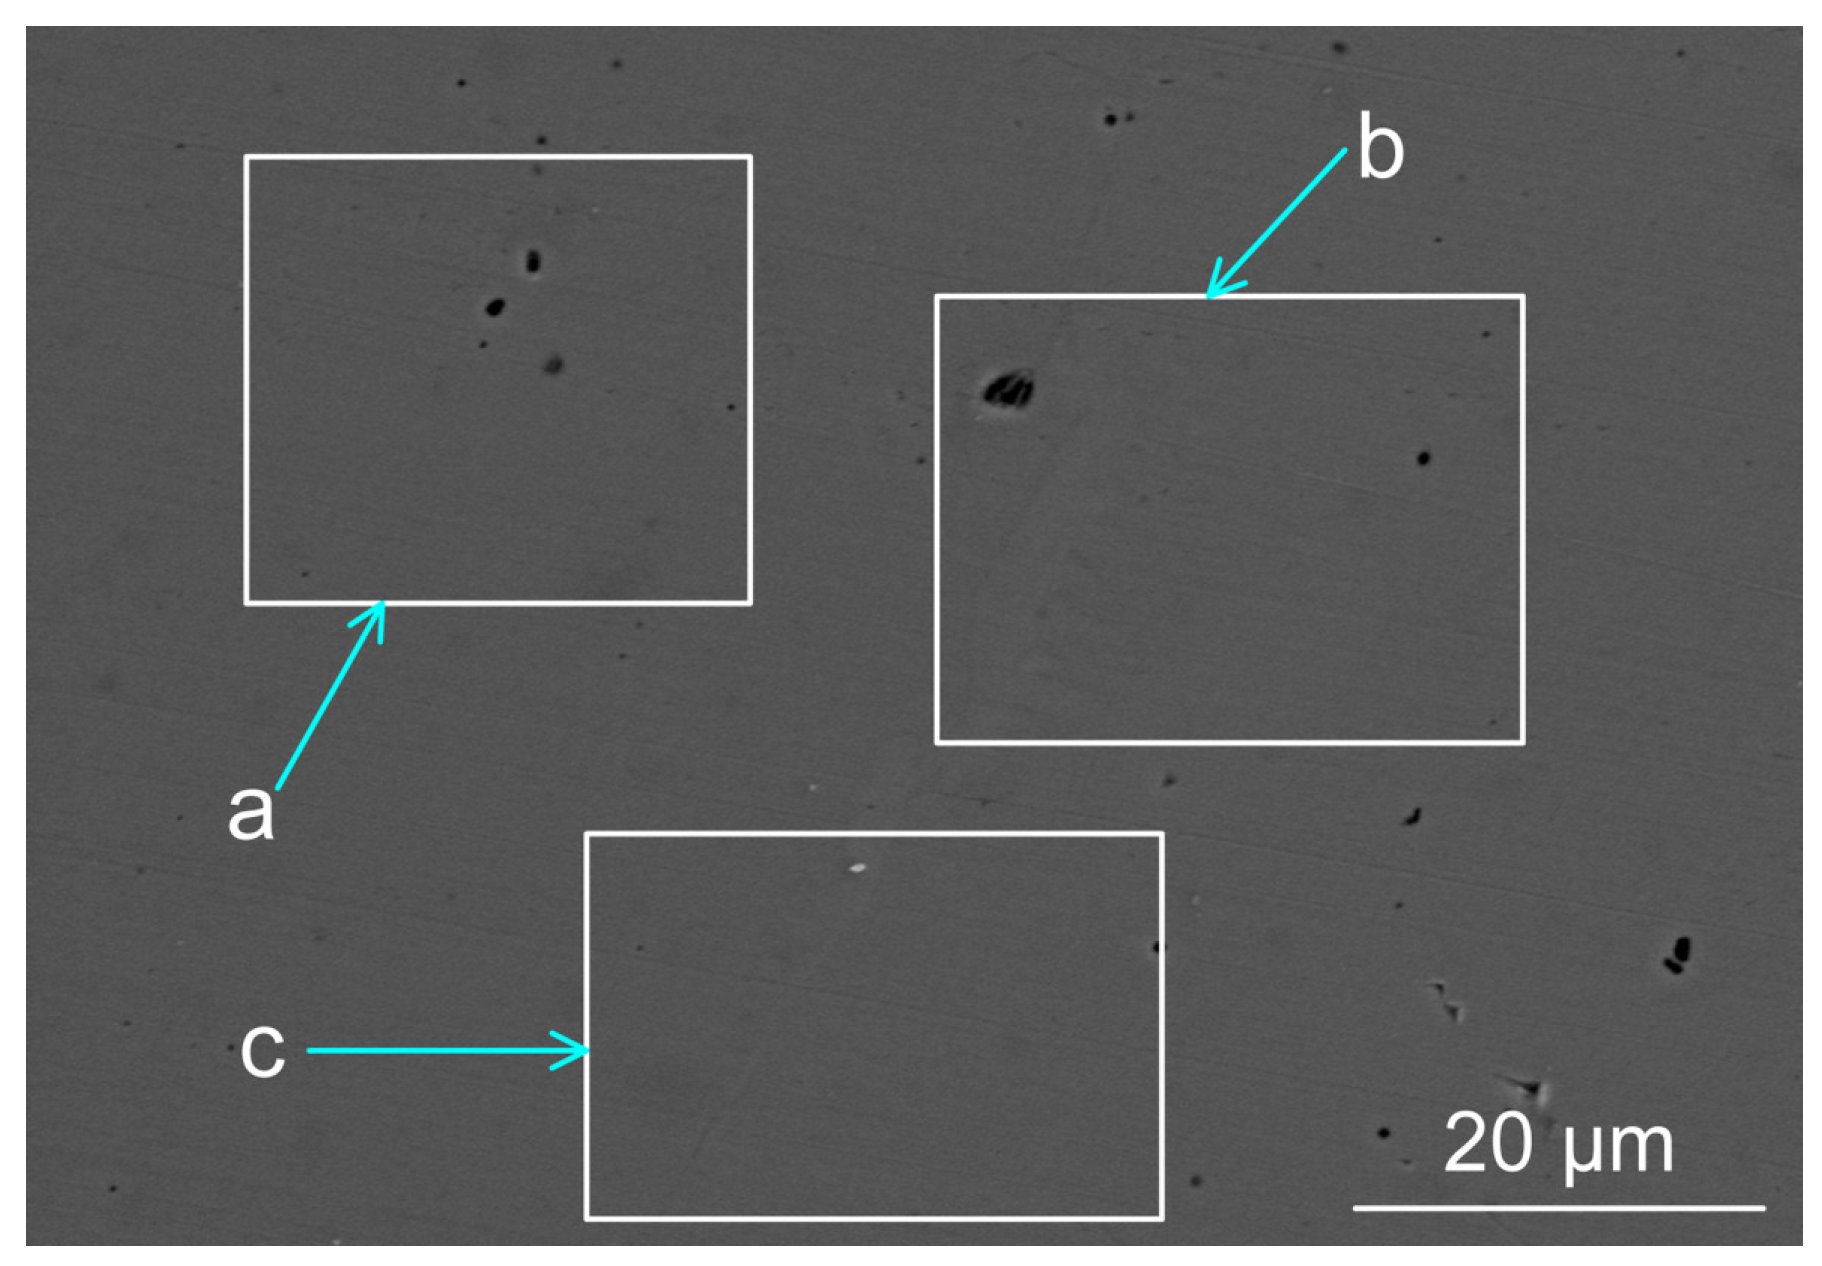
The bulk weld metal compositions of the BC and MP11 weld metals are summarised in Table 1. The methods applied to cut the weld metal samples and the chemical analyses methods used are described in detail elsewhere [10]. For comparison purposes, the weld metal analyses by EDX at the centre of the weld geometry are summarised in Table 2 for the areas as marked in Figure 2. The analyses in Table 1 and Table 2 confirm that alloying of the weld metal by Al, Cr, Cu, and Co occurred. Details of the SEM equipment used In the EDX analyses were described previously [10].
The results in Table 1 show that the application of Al as a de-oxidiser element also reduced some of the MnO and SiO2 from the flux to add Mn and Si to the weld metal. The aluminothermic reduction of MnO and SiO2 released additional heat into the weld pool, as indicated by the exothermic reaction enthalpy values next to Equations of reactions (2) and (3). This effect was also identified in the previously reported work by Coetsee and De Bruin on aluminium-assisted alloying of the SAW weld metal with chromium-containing powders [4,6,8,9,11,12] and titanium-containing powders [5,7,9].
Since reactions (2) and (3) occurred in the SAW process due to Al powder addition, the aluminothermic reduction of FeO and CrO should also be considered, see reactions in Equations (4) and (5). The aluminothermic reduction of FeO was confirmed in previous similar works [36,37]. The aluminothermic reduction of FeO via reaction (4) indicates control of the oxygen potential at the weld pool–slag interface. In the same way, chromium oxide can be reduced by aluminium via Equation (5) [6].
3 SiO 2 + 4 Al = 3 Si + 2 Al 2 O 3 Δ H 2000   ° C   ° = 82.1   kJ / mol   Al
3 MnO + 2 Al = 3 Mn + Al 2 O 3 Δ H 2000   ° C ° = 248.4   kJ / mol   Al
3 FeO + 2 Al = 3 Fe + Al 2 O 3 Δ H 2000   ° C ° = 416.5   kJ / mol   Al
3 CrO + 2 Al = 3 Cr + Al 2 O 3 Δ H 2000   ° C ° = 326.6   kJ / mol   Al
( ): liquid.
Comparison of the weld metal total ppm O in Table 1 for the BC and the MP11 weld metals indicates the extent of the de-oxidising effect of Al. The BC weld metal total ppm O is 499 ppm O, compared to the much lower MP11 weld metal total oxygen content of 176 ppm O.

3.2. Mass Balance

A mass balance was carried out to quantify the yield of Al, Cr, Co, and Cu from the added metal powders to the weld metal. The mass balance measurements and calculations procedure are the same as described in detail in previous works [3,7,8,9,10,11,12]. These values are displayed in Table 3. The %yield is calculated as a percentage of the 7 g of Al or Cr or Co or Cu added to the weld run. Table 3 shows that the MP11 yield values were calculated as 66% Al yield, 82% Cr yield, 78% Co yield and 78% Cu yield.

3.3. Heating Effect Quantification from Exothermic Reactions with Aluminium

Alumina is formed as product in the reactions displayed as Equations (2) and (3), and was shown to be easily absorbed into the molten flux because the reactions occurred at the molten flux–weld pool interface [5,6,37]. The exothermic reaction heat contributions from reactions (2) and (3) were quantified by the calculation methods, as reported previously [7,8,9,10,11,12]. The calculation results in Table 4 show that the exothermic reactions (2) and (3) released sufficient energy to increase the weld metal temperature by 68 °C.
The weld metal total ppm O content in Table 1 is a function of the chemical reactions and physical effects that influence the rate at which oxide inclusions float out to the molten slag–weld pool interface, at which point the inclusions are chemically absorbed into the slag phase. Therefore, the time available for oxide inclusions to float from the weld pool to the molten slag–weld pool interface is set by the weld pool solidification time [38]. The weld pool chemistry sets the melting temperature range of the weld pool and therefore the solidification time from a fully liquid to a fully solid weld pool for the same weld pool mass. The cooling curves for the BC and MP11 weld metal compositions are shown in Figure 3.
The weld metal solidus temperature is much lower for the MP11 weld metal compared to the BC weld metal, even though the liquidus temperatures are similar, with a difference of only 29 °C. Therefore, the expectation is that the MP11 weld pool will take more time to solidify than the BC weld pool, providing more time for oxide inclusions to float to the weld pool–slag interface and absorb into the slag layer. This difference in weld pool solidification time will contribute to the lower total weld metal oxygen content analysed in the MP11 weld metal, as compared to the BC weld metal, see Table 3.

3.4. Speciation and Distribution of Cr, Co and Cu in the Slag

The methods of SEM (scanning electron microscope) images and EDX (energy dispersive X-ray) analyses were applied recently to investigate the speciation and distribution of the elements in post-weld slags [4,12,37]. These studies clearly showed the presence of three-dimensional (3D) structures which formed from vaporisation and re-condensation of oxy-fluorides. In this study, the combination of Al, Cr, Co and Cu metal powders was applied in SAW, and therefore the behaviour of these metallic elements in the gas phase is of interest. Dome structures were also observed in this work, similar to the dome structures in the previous studies [4,12,37]. Somewhat different 3D structures were observed in the current work as discussed in the following sections.
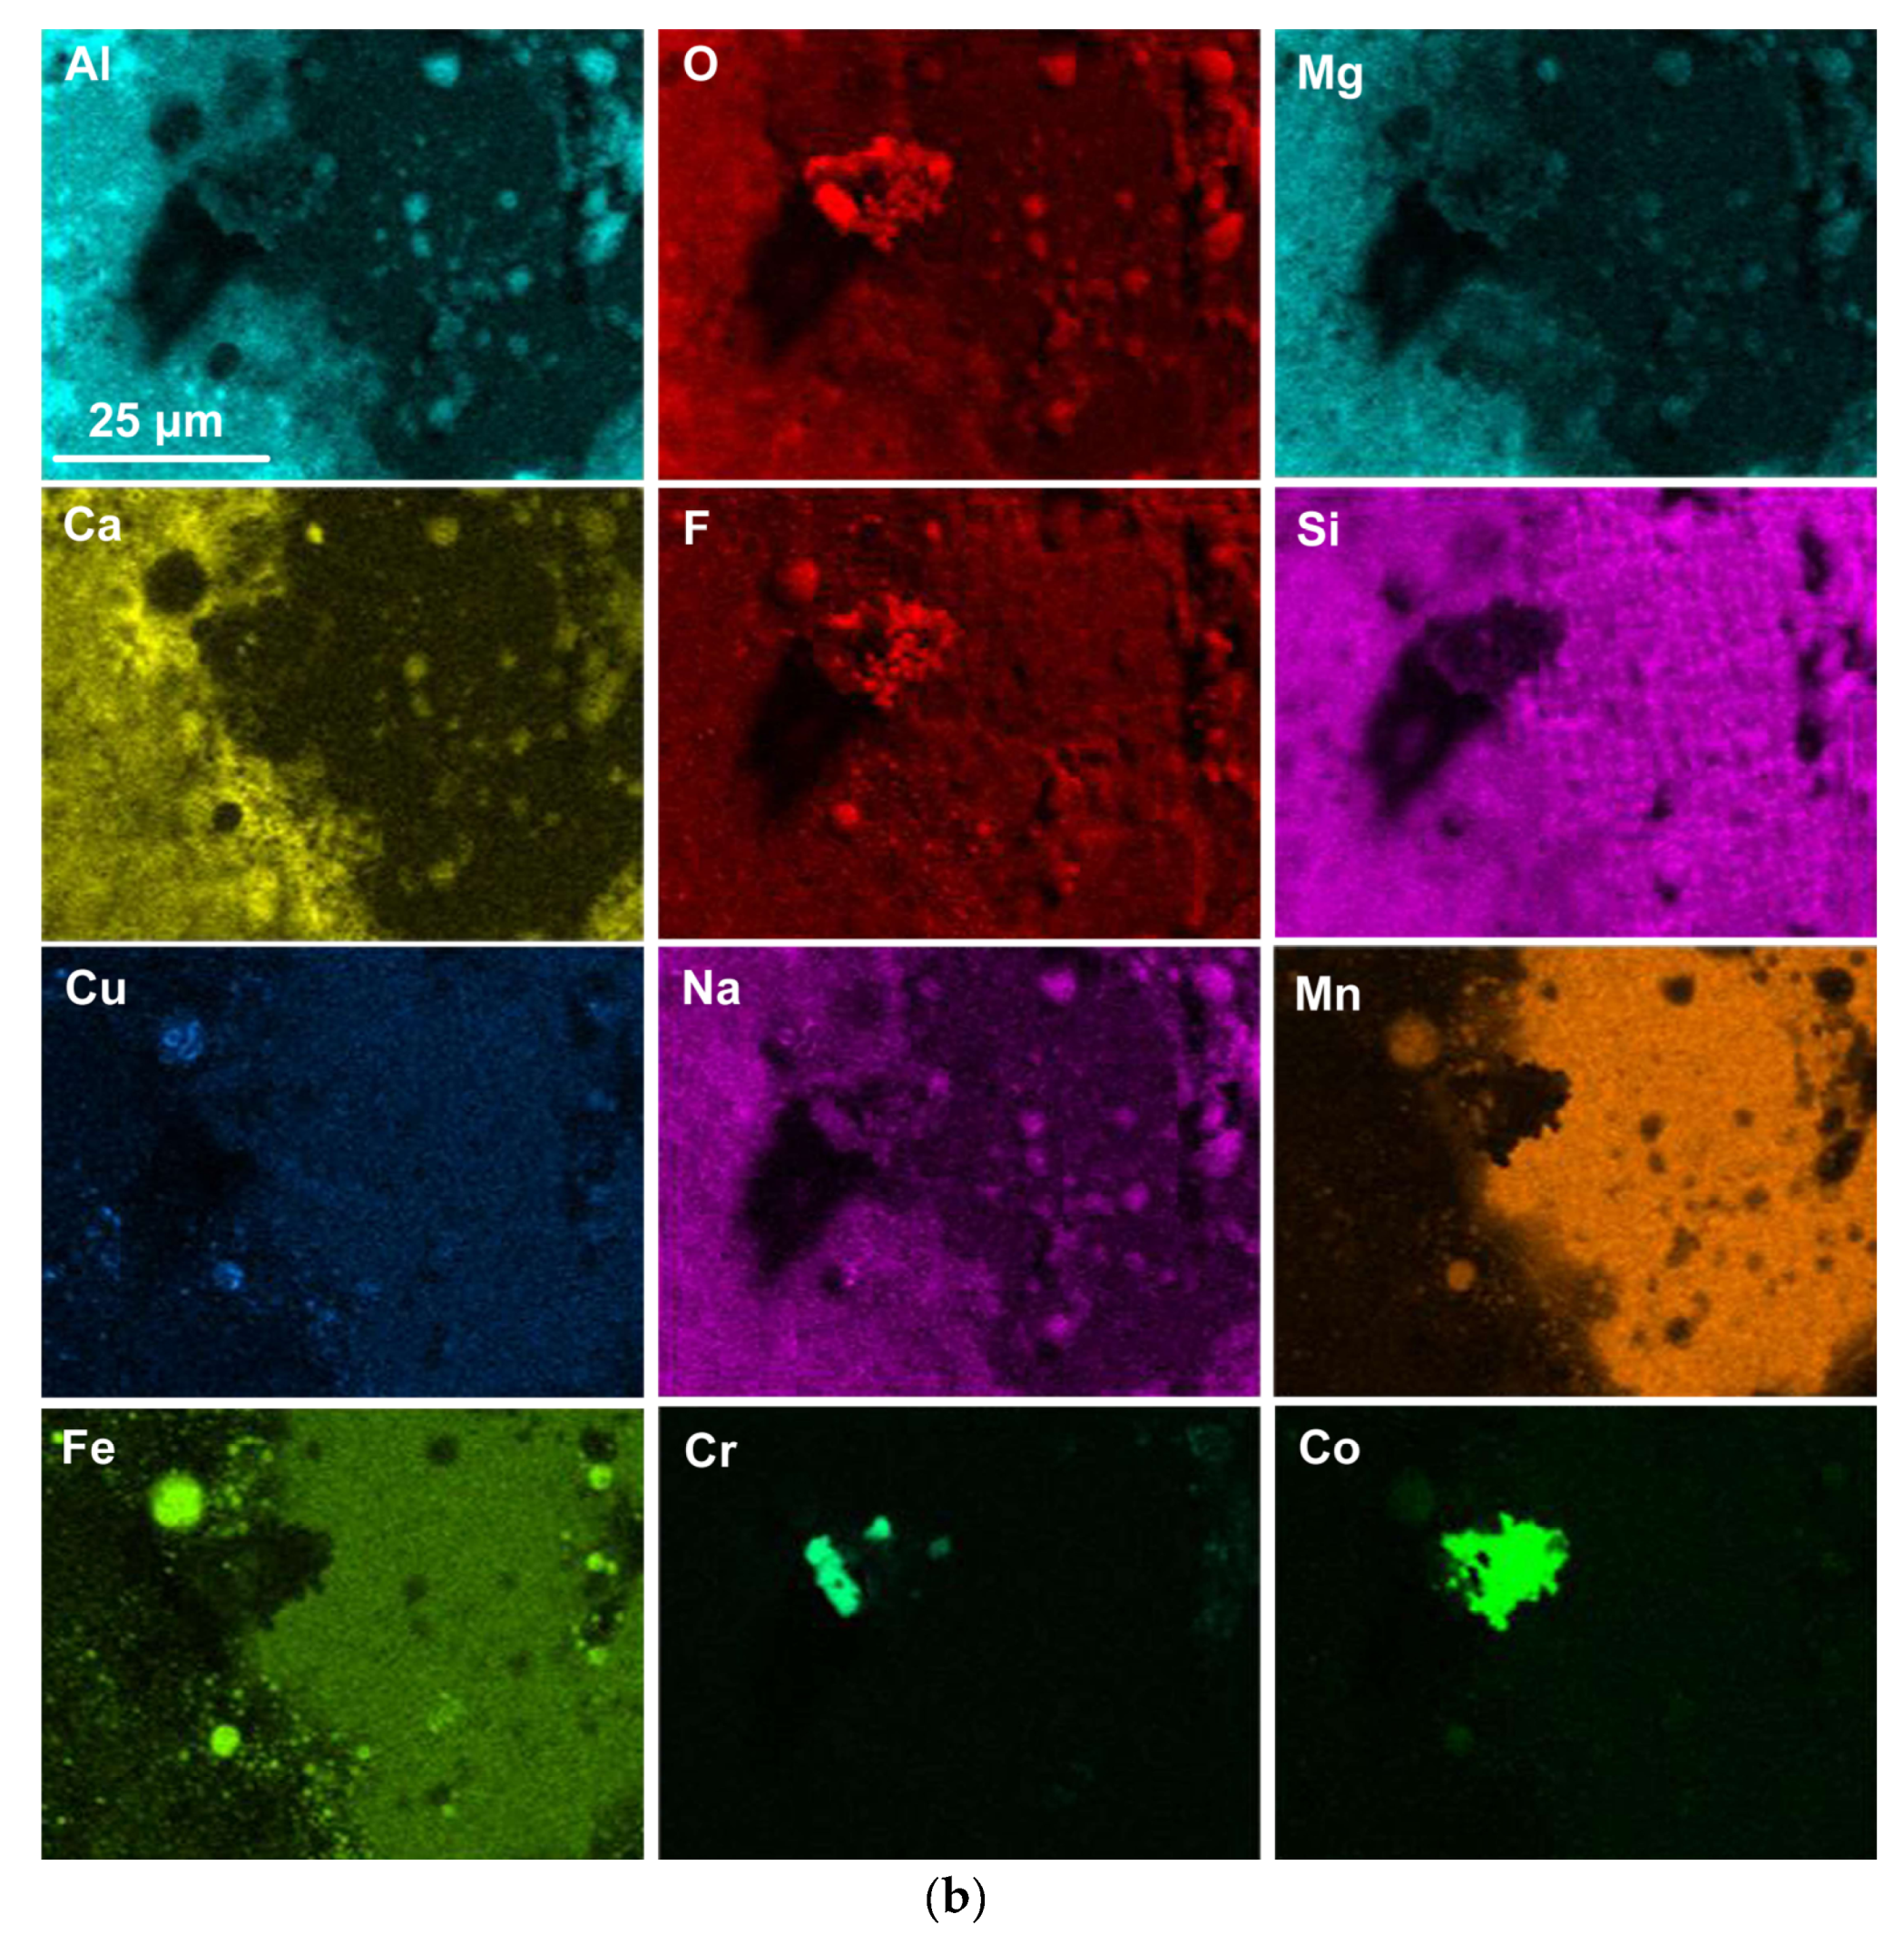
A typical dome structure inside the post-weld slag is displayed at low magnification (605×) in Figure 4a, as the BSE (backscattered electron image) image. Within this slag dome, several 3D structures are seen, such as smaller and larger spheres and irregular porous shapes in the framed area marked in Figure 4a. The EDX maps of the field of view (FOV) in Figure 4a can be seen in Figure 4b. The EDX analyses indicate that the dome surface matrix phase consists of Al-Mg-Ca-Si-Na-K-Ti-Fe-Mn oxy-fluoride. The EDX maps for K and Ti are not shown, because these elements appear throughout the phase areas in an averaged fashion. The spherical 3D structures of 10–40 µm in diameter consist of Fe-Mn-Si fluorides with some Cr, Cu and Co contained in some of the spheres. The average EDX analysis of the FOV in Figure 4a is shown in Table 5, and confirms that Cr, Cu and Co are present in the dome structure. The importance of this observation is that it confirms the vaporisation of Cr, Cu and Co added as metal powders, which is in agreement with previous studies on different alloy powder combinations applied in SAW [4,12,37].
The framed area in Figure 4a is shown in Figure 5a at a magnification of 3930× to better view the 3D structures in this area. The EDX maps of the FOV, as displayed in Figure 5b, confirm that the dome surface matrix phase at the left-hand boundary of the image consists of Al-Mg-Ca-Si-Na-K-Ti-Fe-Mn oxy-fluoride, with embedded spheres of Fe-Mn-Na-Cu oxy-fluoride. Interestingly the separate presentation of Cr and Co is observed in the porous structure of about 10 µm as adjacent parts of Cr oxy-fluoride and Co oxy-fluoride. To the right side of the porous 3D structure, the round structure embedded in the dome surface matrix phase appears; it contains Si-Cu-Na-Mn-Fe oxy-fluoride, although the copper EDX map is faint in this area. The average EDX analysis of the FOV in Figure 5a, as shown in Table 5, confirms that less of the dome surface matrix phase is contained in Figure 5a, since less Al and Mg are present in this analysis when compared to that of Figure 4a.
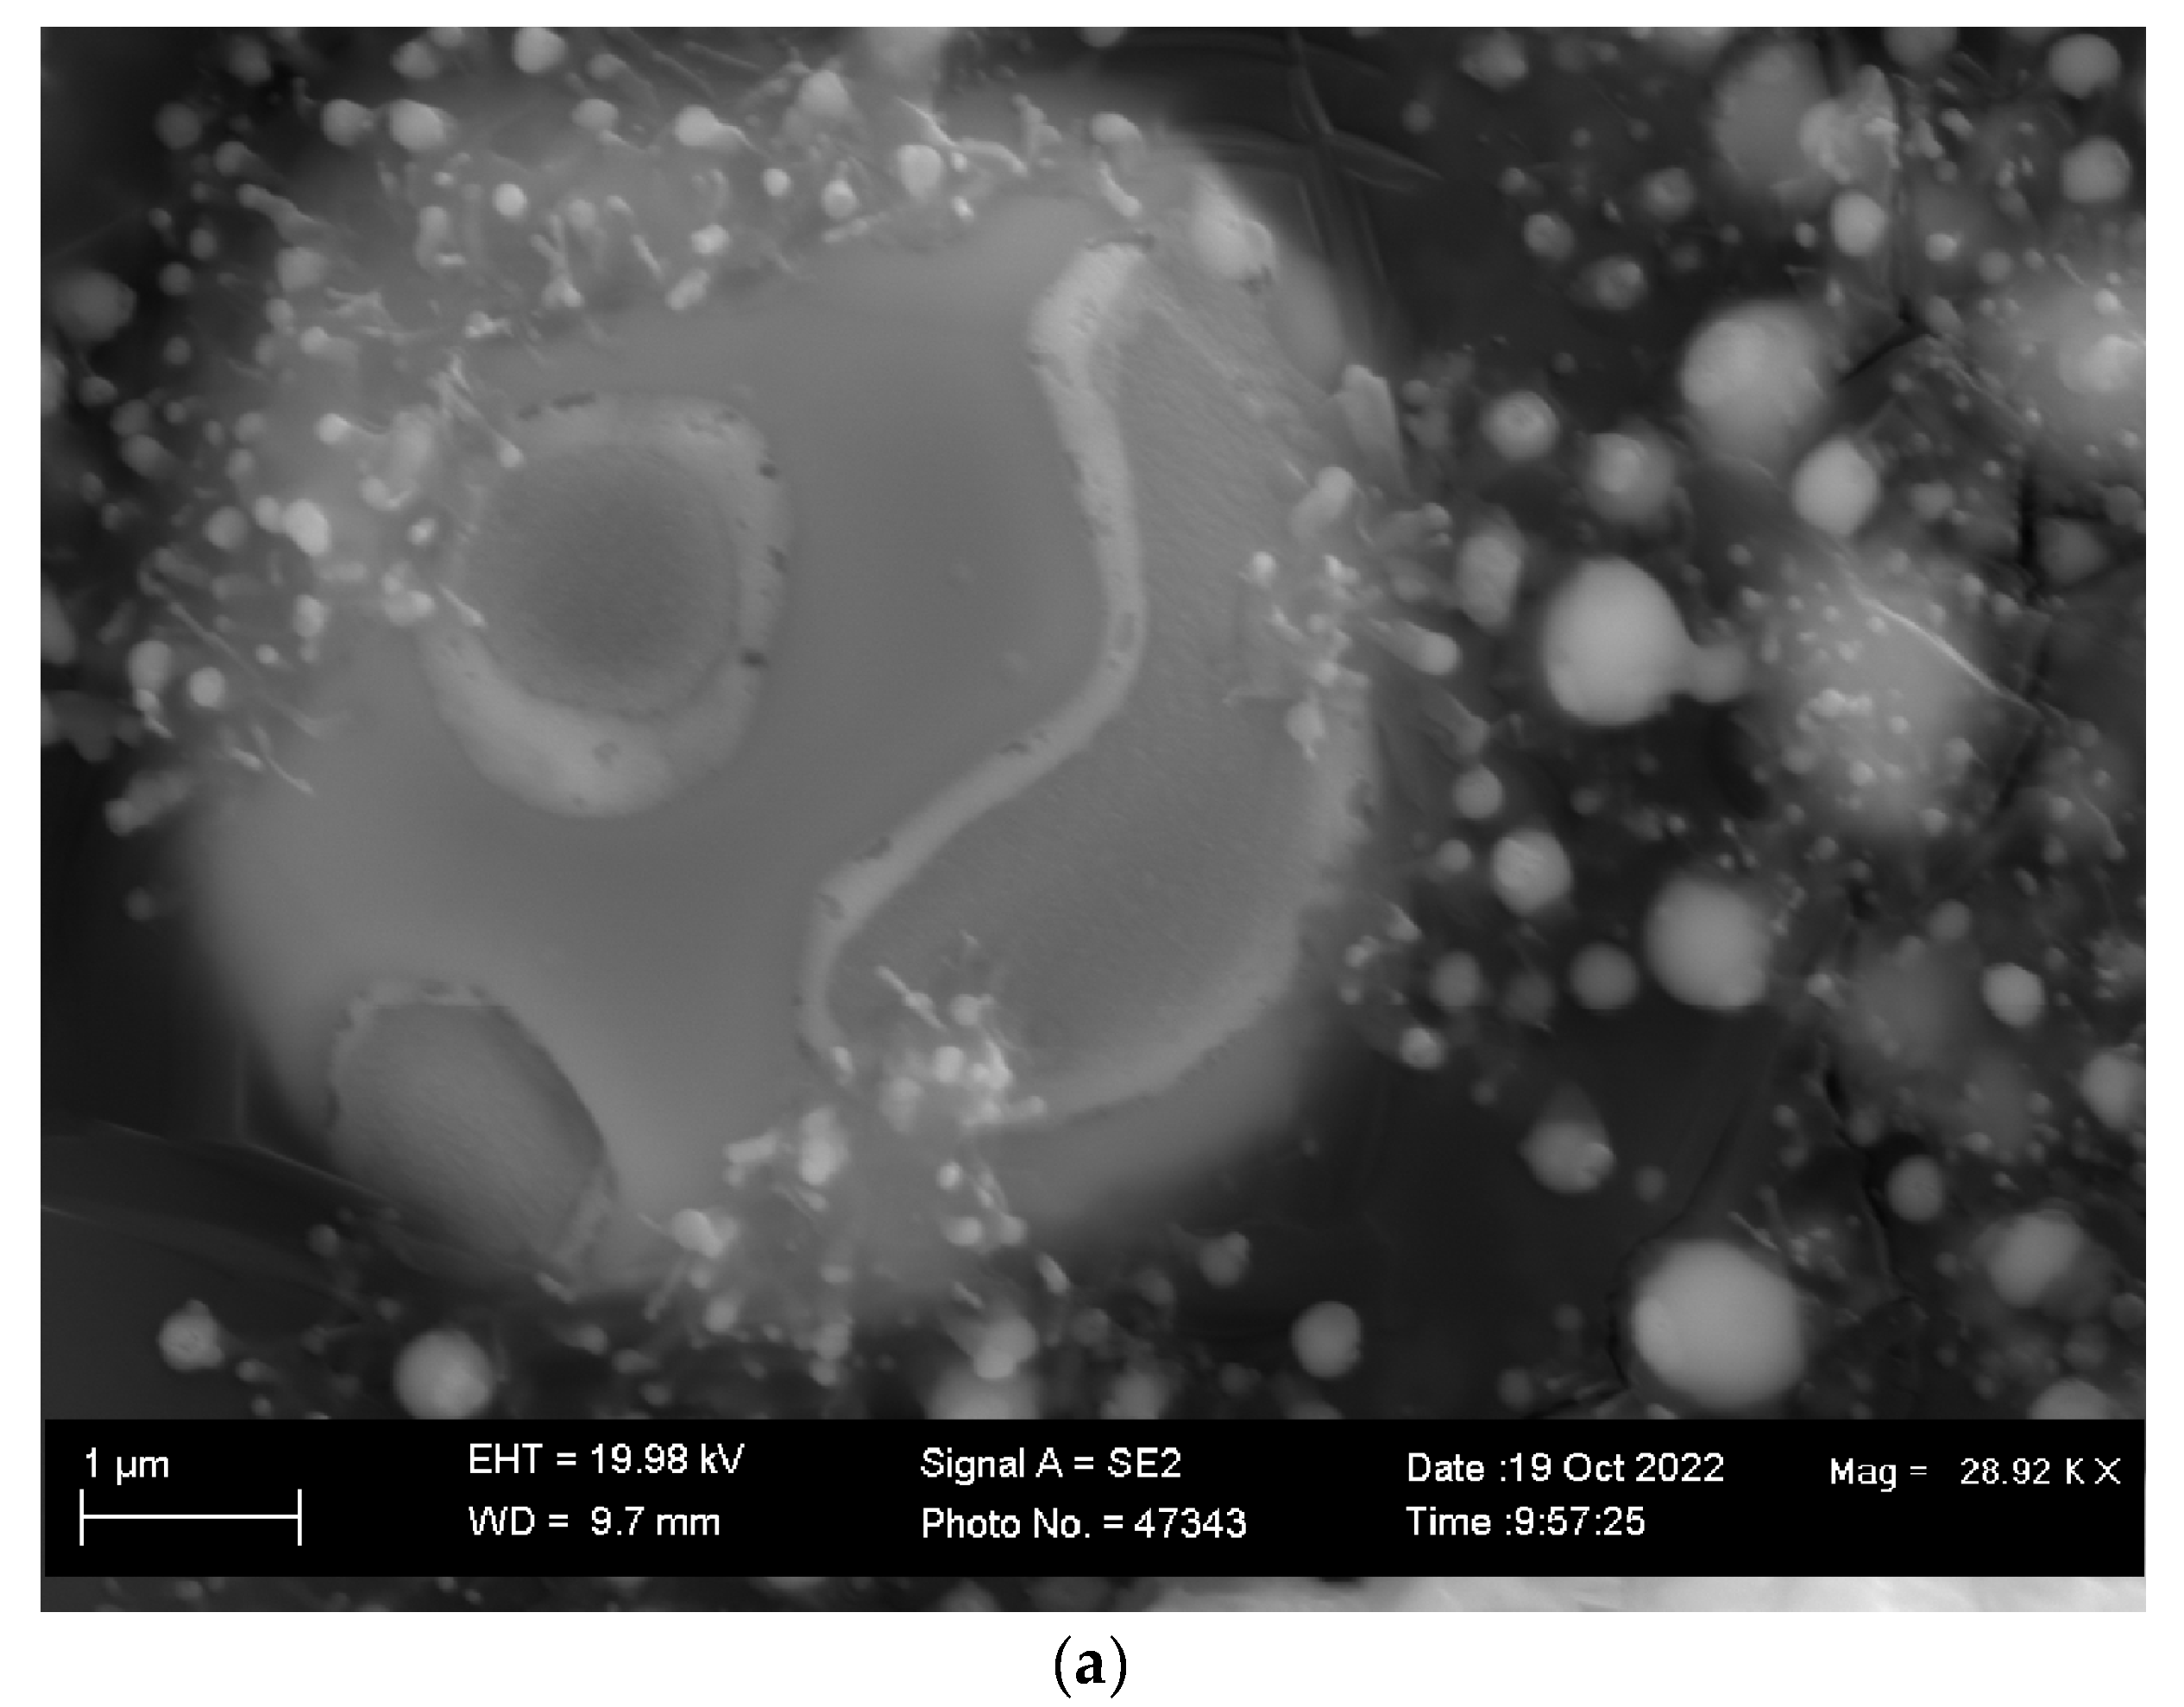
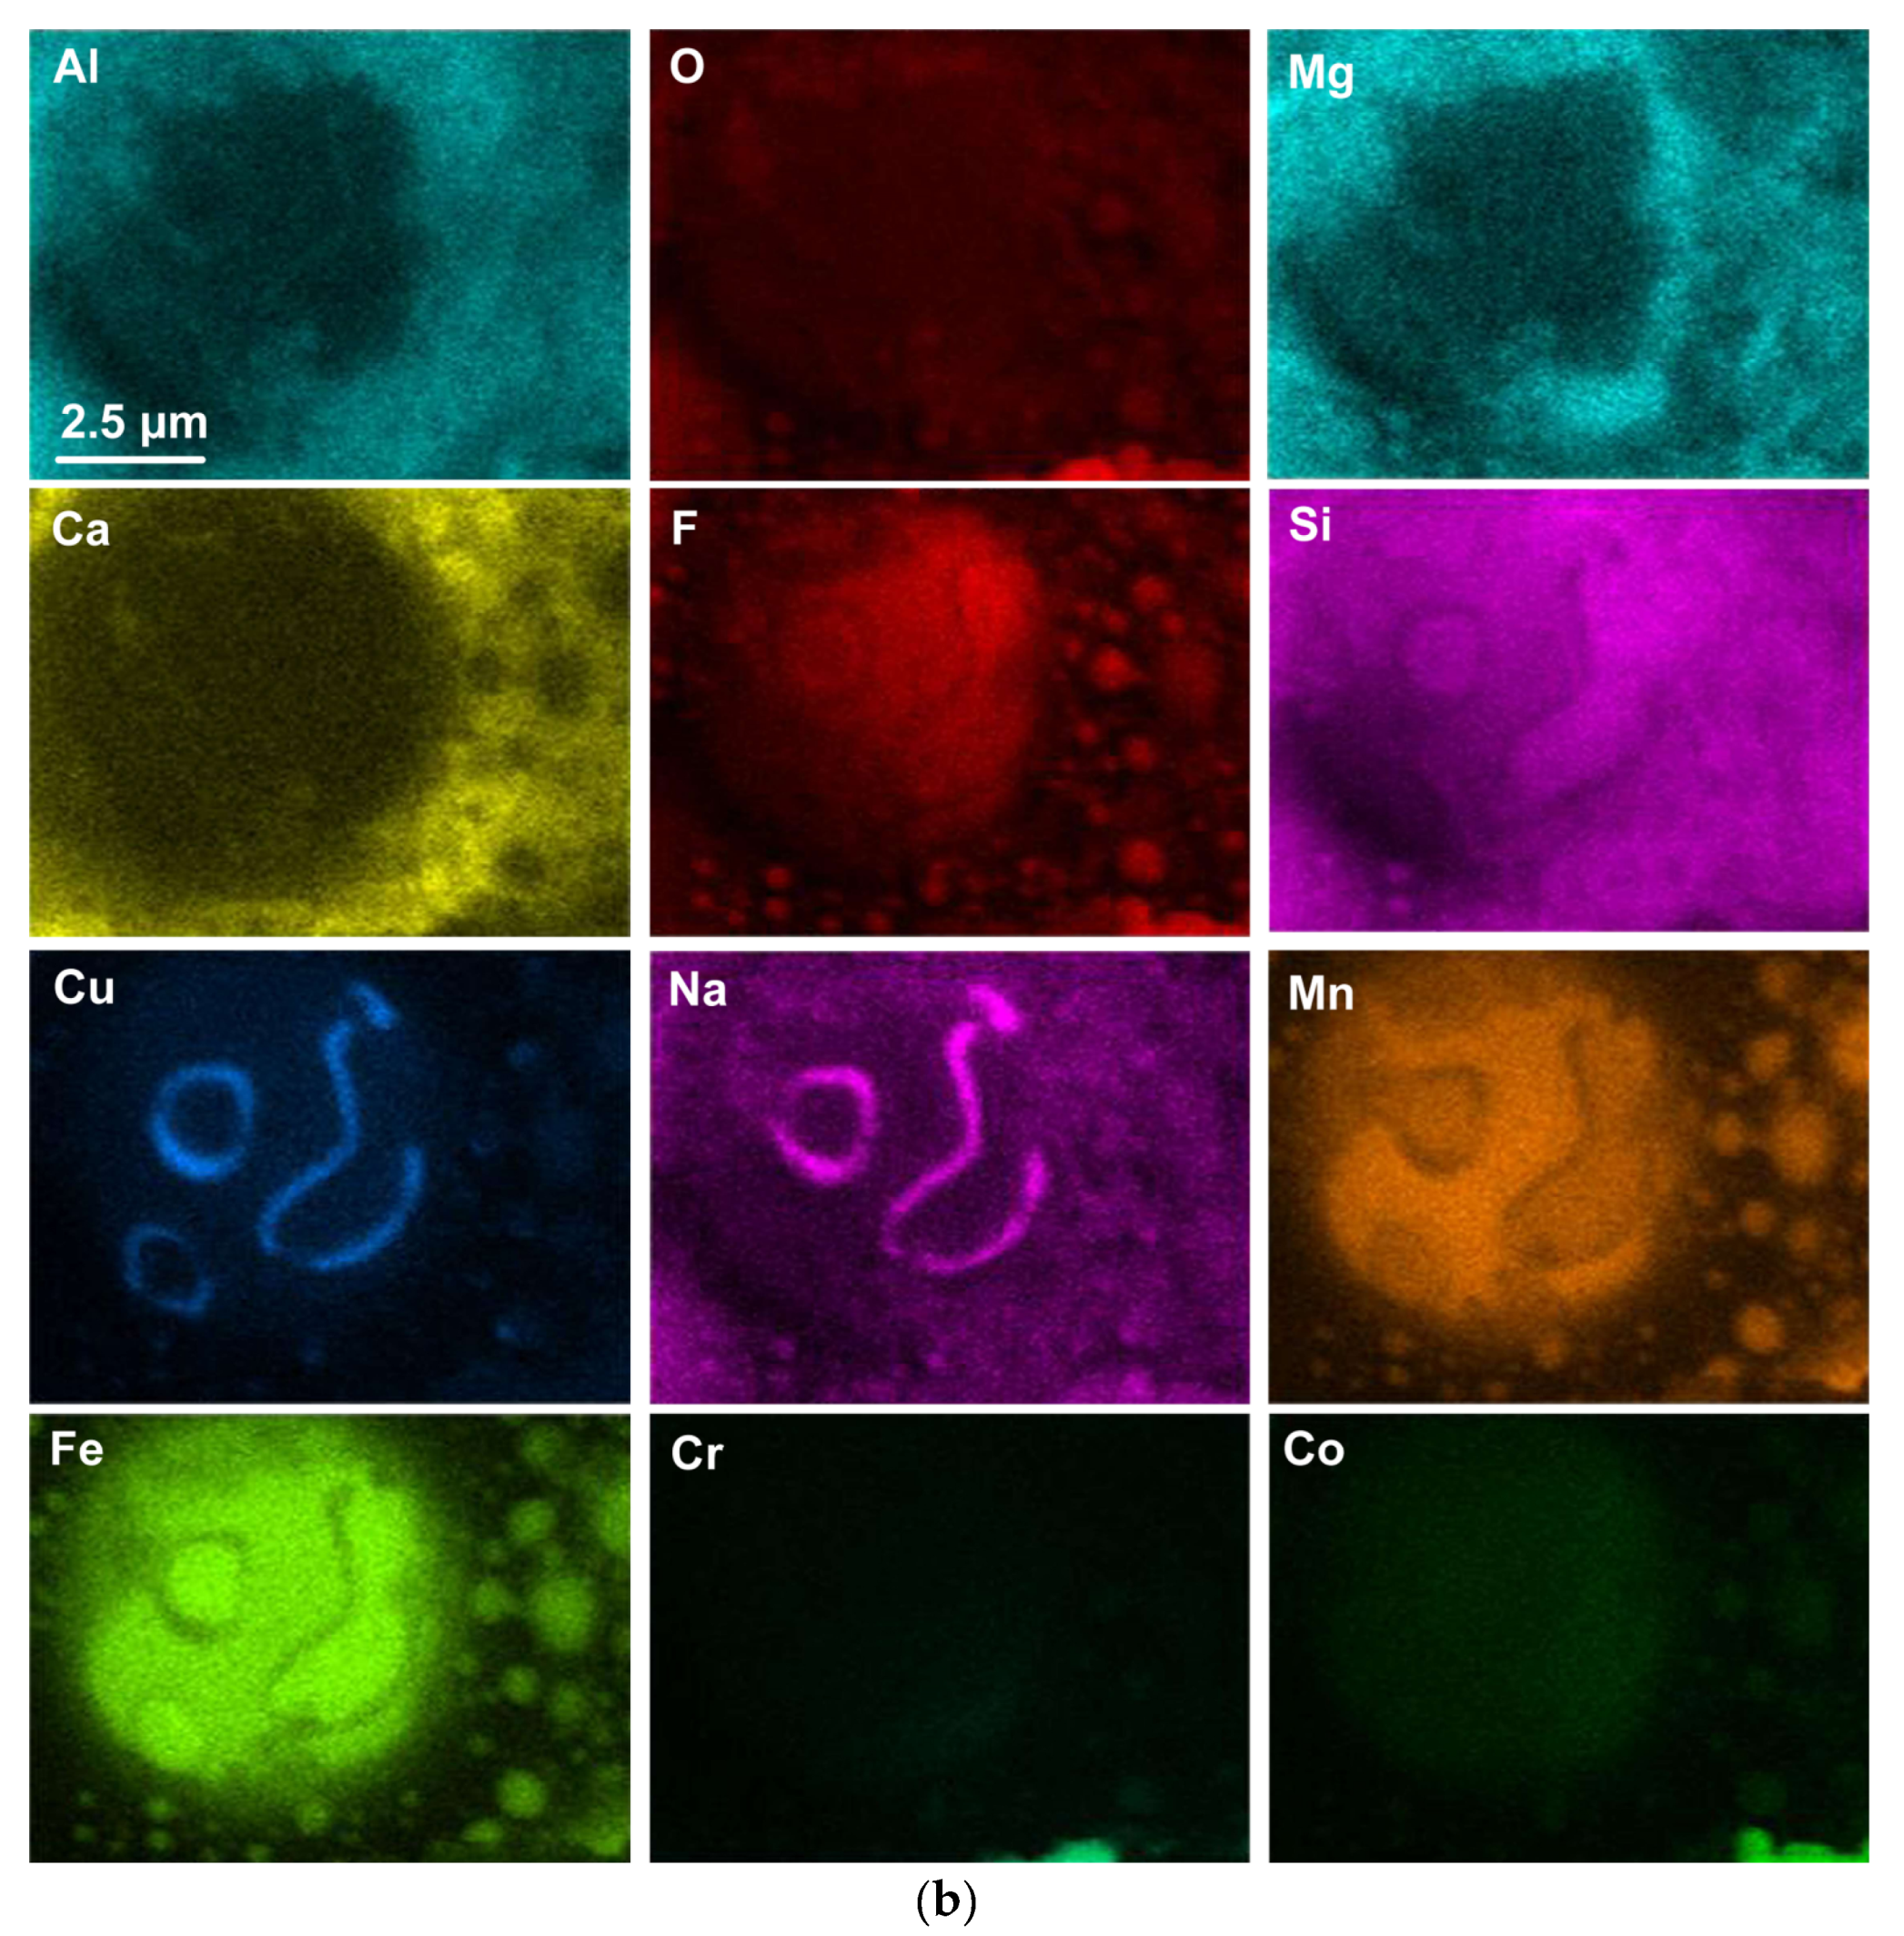
The blocked area in Figure 5a is shown enlarged at 28,290× in Figure 6a. Nano-sized oxy-fluoride strands and spheres are seen at the edges of this image, similar to those identified previously [37]. In agreement with the previous conclusions of Coetsee and De Bruin, these structures confirm the vaporisation and re-condensation of oxy-fluorides within the slag dome structures [4,37]. The EDX maps show that Cu and Na formed a distinct condensation pattern on the surface of the Si-Cu-Na-Mn-Fe-Co oxy-fluoride sphere. The Co content in the sphere is very faint in Figure 6b. The average EDX analysis of the FOV in Figure 6a is similar to that of Figure 5a, with less Mn and more Fe contained, and an increased Cu content confirmed, see Table 5.
The significance of the above results on the slag dome element speciation and distribution is that these results are in agreement with previous similar studies, confirming the vaporisation of the added metal powder elements of Cr, Cu and Co applied in different combinations. The re-condensation of the vaporised metals as oxy-fluoride 3D structures within the welding slag dome structures is observed in this work, and is in agreement with previous similar observations [4,12,37].

4. Discussion

Previous works by Coetsee and De Bruin on unconstrained metal powder additions in SAW with aluminium as a de-oxidiser have confirmed that aluminium controls the weld metal total ppm O. The action of the aluminium de-oxidiser is to lower the partial oxygen pressure at the molten flux–weld pool interface [3,4,5,6,7,8,9,10,11,12]. In some of these previous studies, thermochemical calculations of the gas–slag–metal powder equilibrium were made, and these calculations confirm that aluminium is also present in the arc cavity, and can therefore also lower the oxygen partial pressure in the arc cavity [4,10,11,12]. This agrees with conclusive previous work that evidenced the transfer of Al from the flux via the gas phase in the arc cavity [34]. In this study the unique combination of unconstrained metal powders of Cu, Cr, Co and Al added to the SAW process is illustrated. The addition of Cu metal powder in this combination may modify the behaviour of the other elements in the arc cavity. This is particularly true of Al, because both Al and Cu metals have similar high vapour pressures [12]. Thermochemical calculations in both simplified single reaction calculations and complex gas–slag–metal powder equilibrium calculations were used to investigate the likely gas phase reaction changes due to added Cu, Cr, Co and Al unconstrained powders in the SAW process.

4.1. Simplified Chemical Interactions

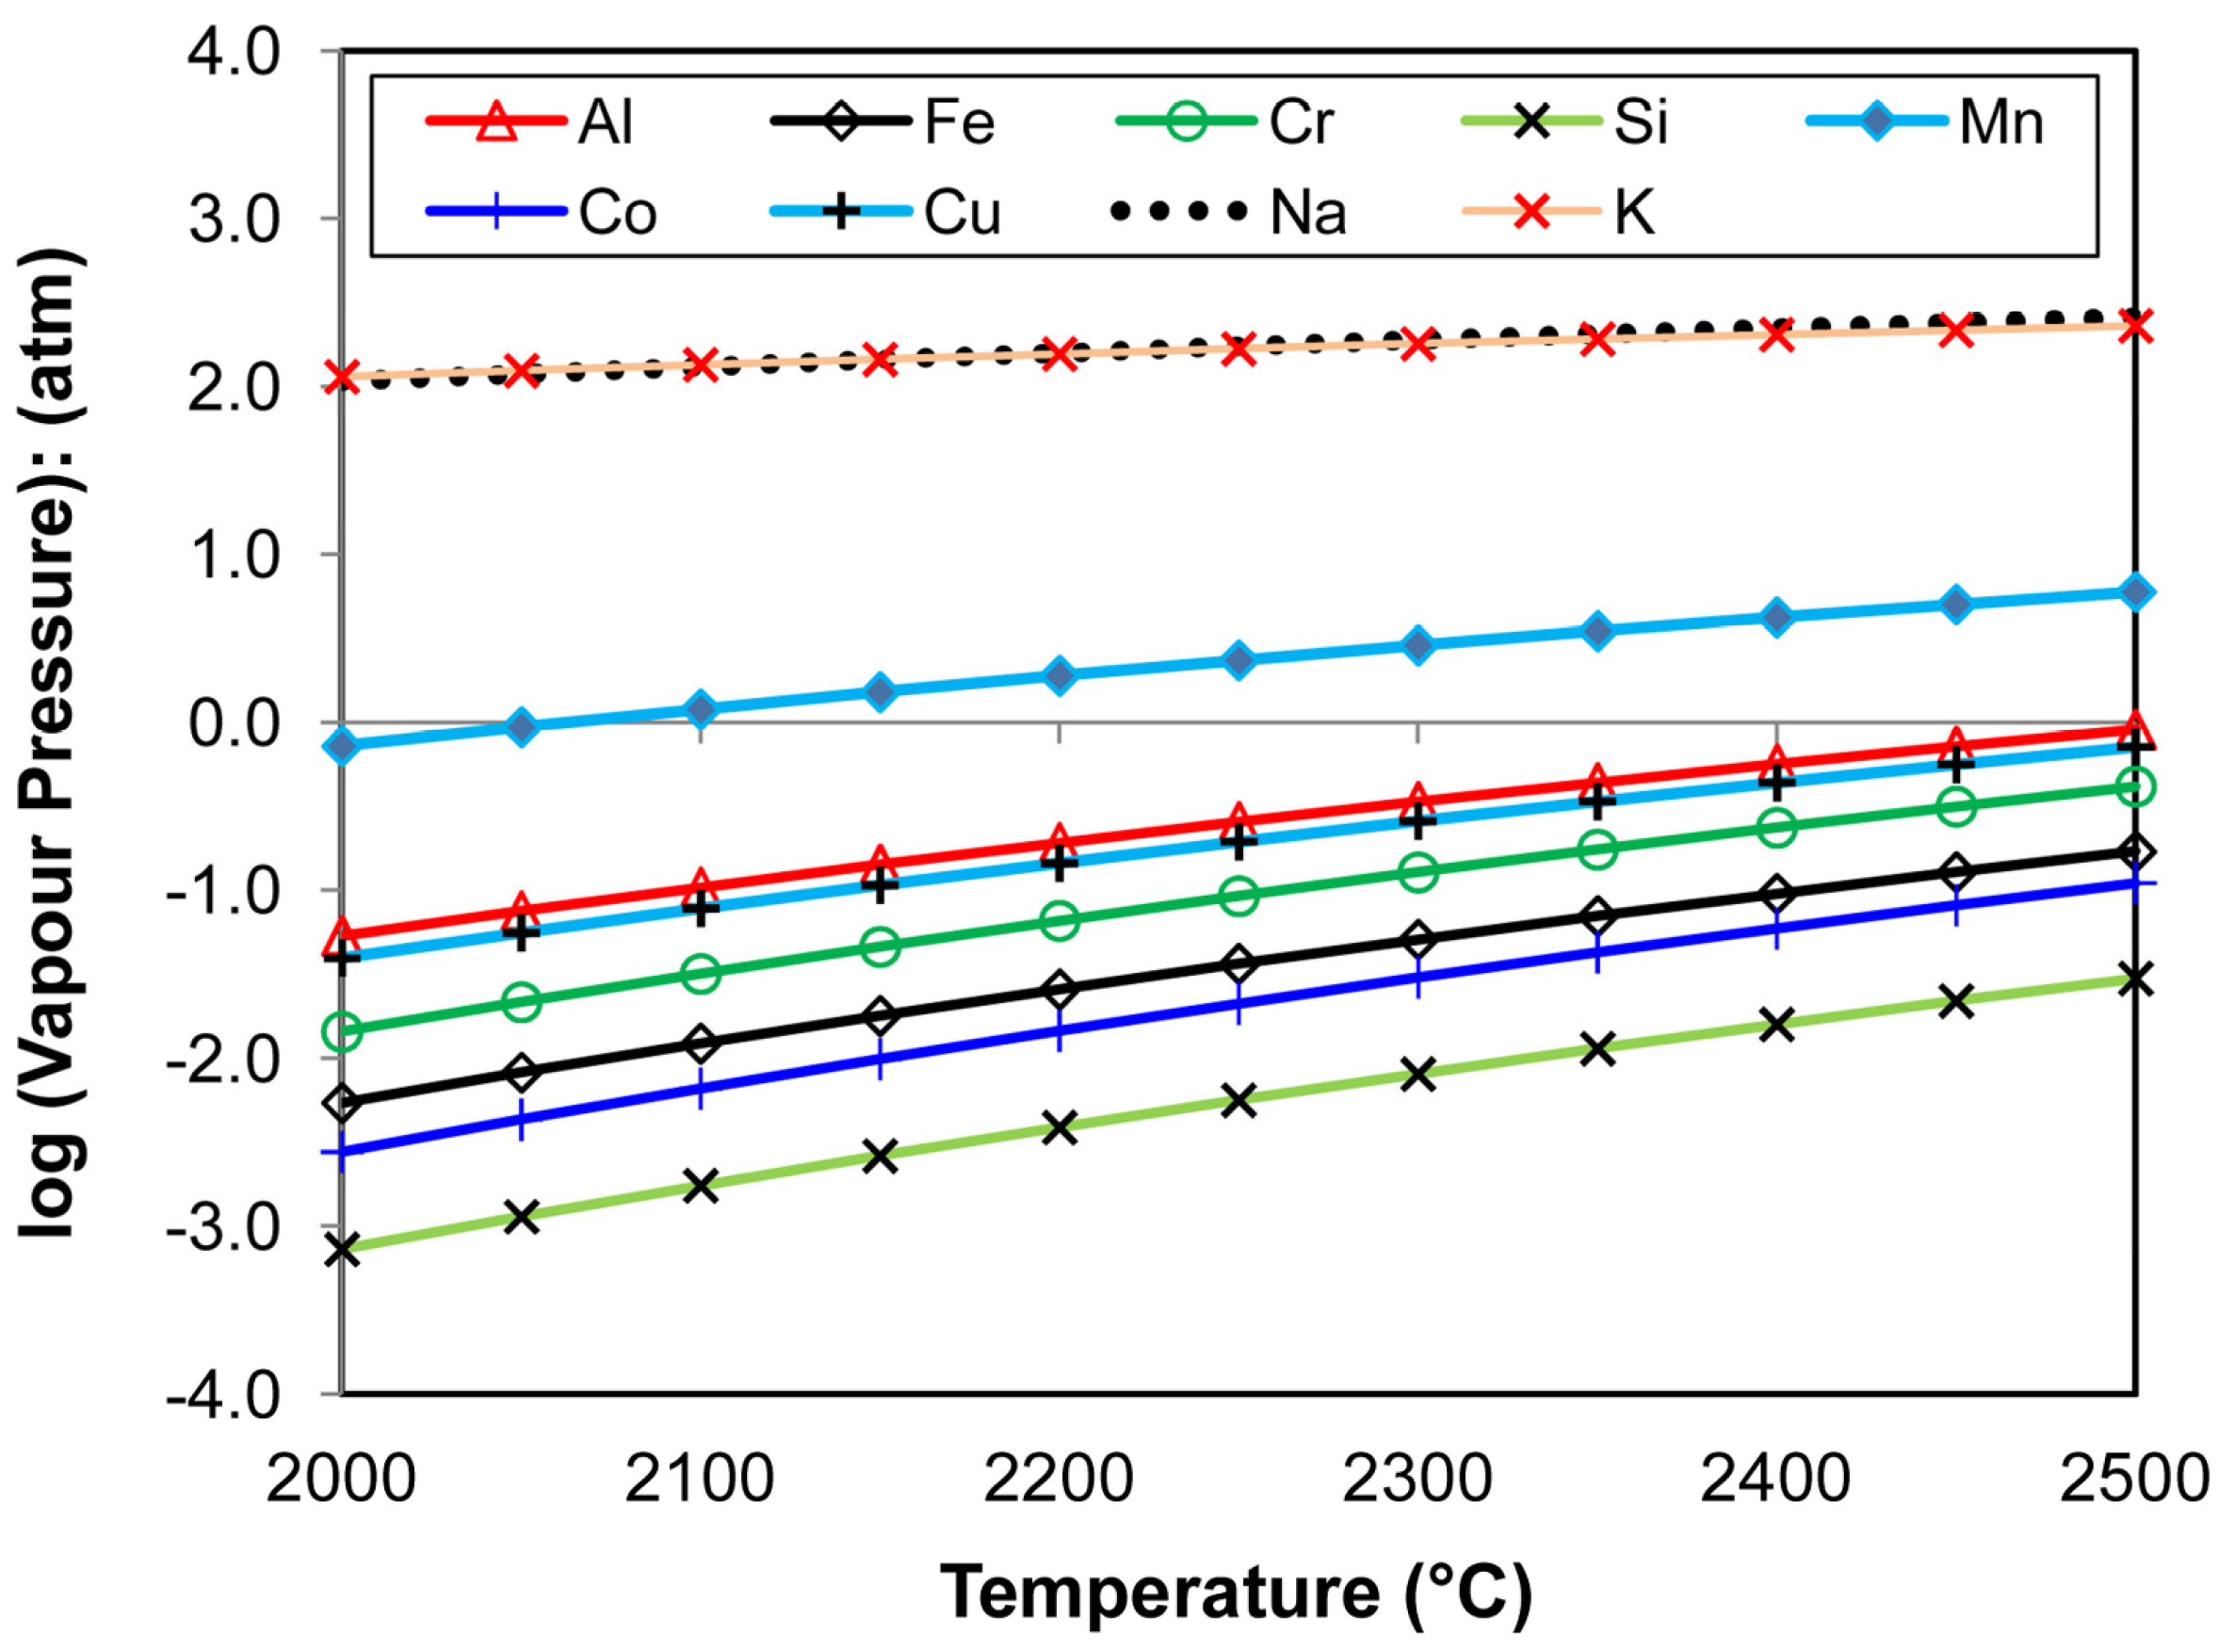
Given the close association of Cu and Na observed in the condensation pattern on the surface of the sphere in Figure 6b, it is of importance to consider the natural tendencies of the elements to vaporise at the temperatures relevant to the SAW process. The vapour pressure of the pure metallic elements as a function of temperature is shown Figure 7. The order of the lines in Figure 7 indicates that ease of vaporisation ranges from highest to lowest in the following order: Na and K, overlapping, then Mn, Al, Cu, Cr, Fe, Co and lastly, Si. The vapour pressure curves in Figure 7 were calculated in FactSage 7.3 thermochemical software using the ELEM database in the Reaction module [35]. The lines for Al and Cu in Figure 7 are very close to each other, indicating that aluminium and copper are expected to be vaporised to an equal extent at the high temperatures prevailing in the arc cavity, namely 2000 to 2500 °C [39,40]. K and Na are added in SAW flux as oxides, so that the K and Na ions in the arc cavity may stabilise the arc [41]. Therefore, based on the chemical behaviour of the elements as displayed in Figure 7, it is possible that Na and Cu interact as vapours to form the condensation patterns in Figure 6b.
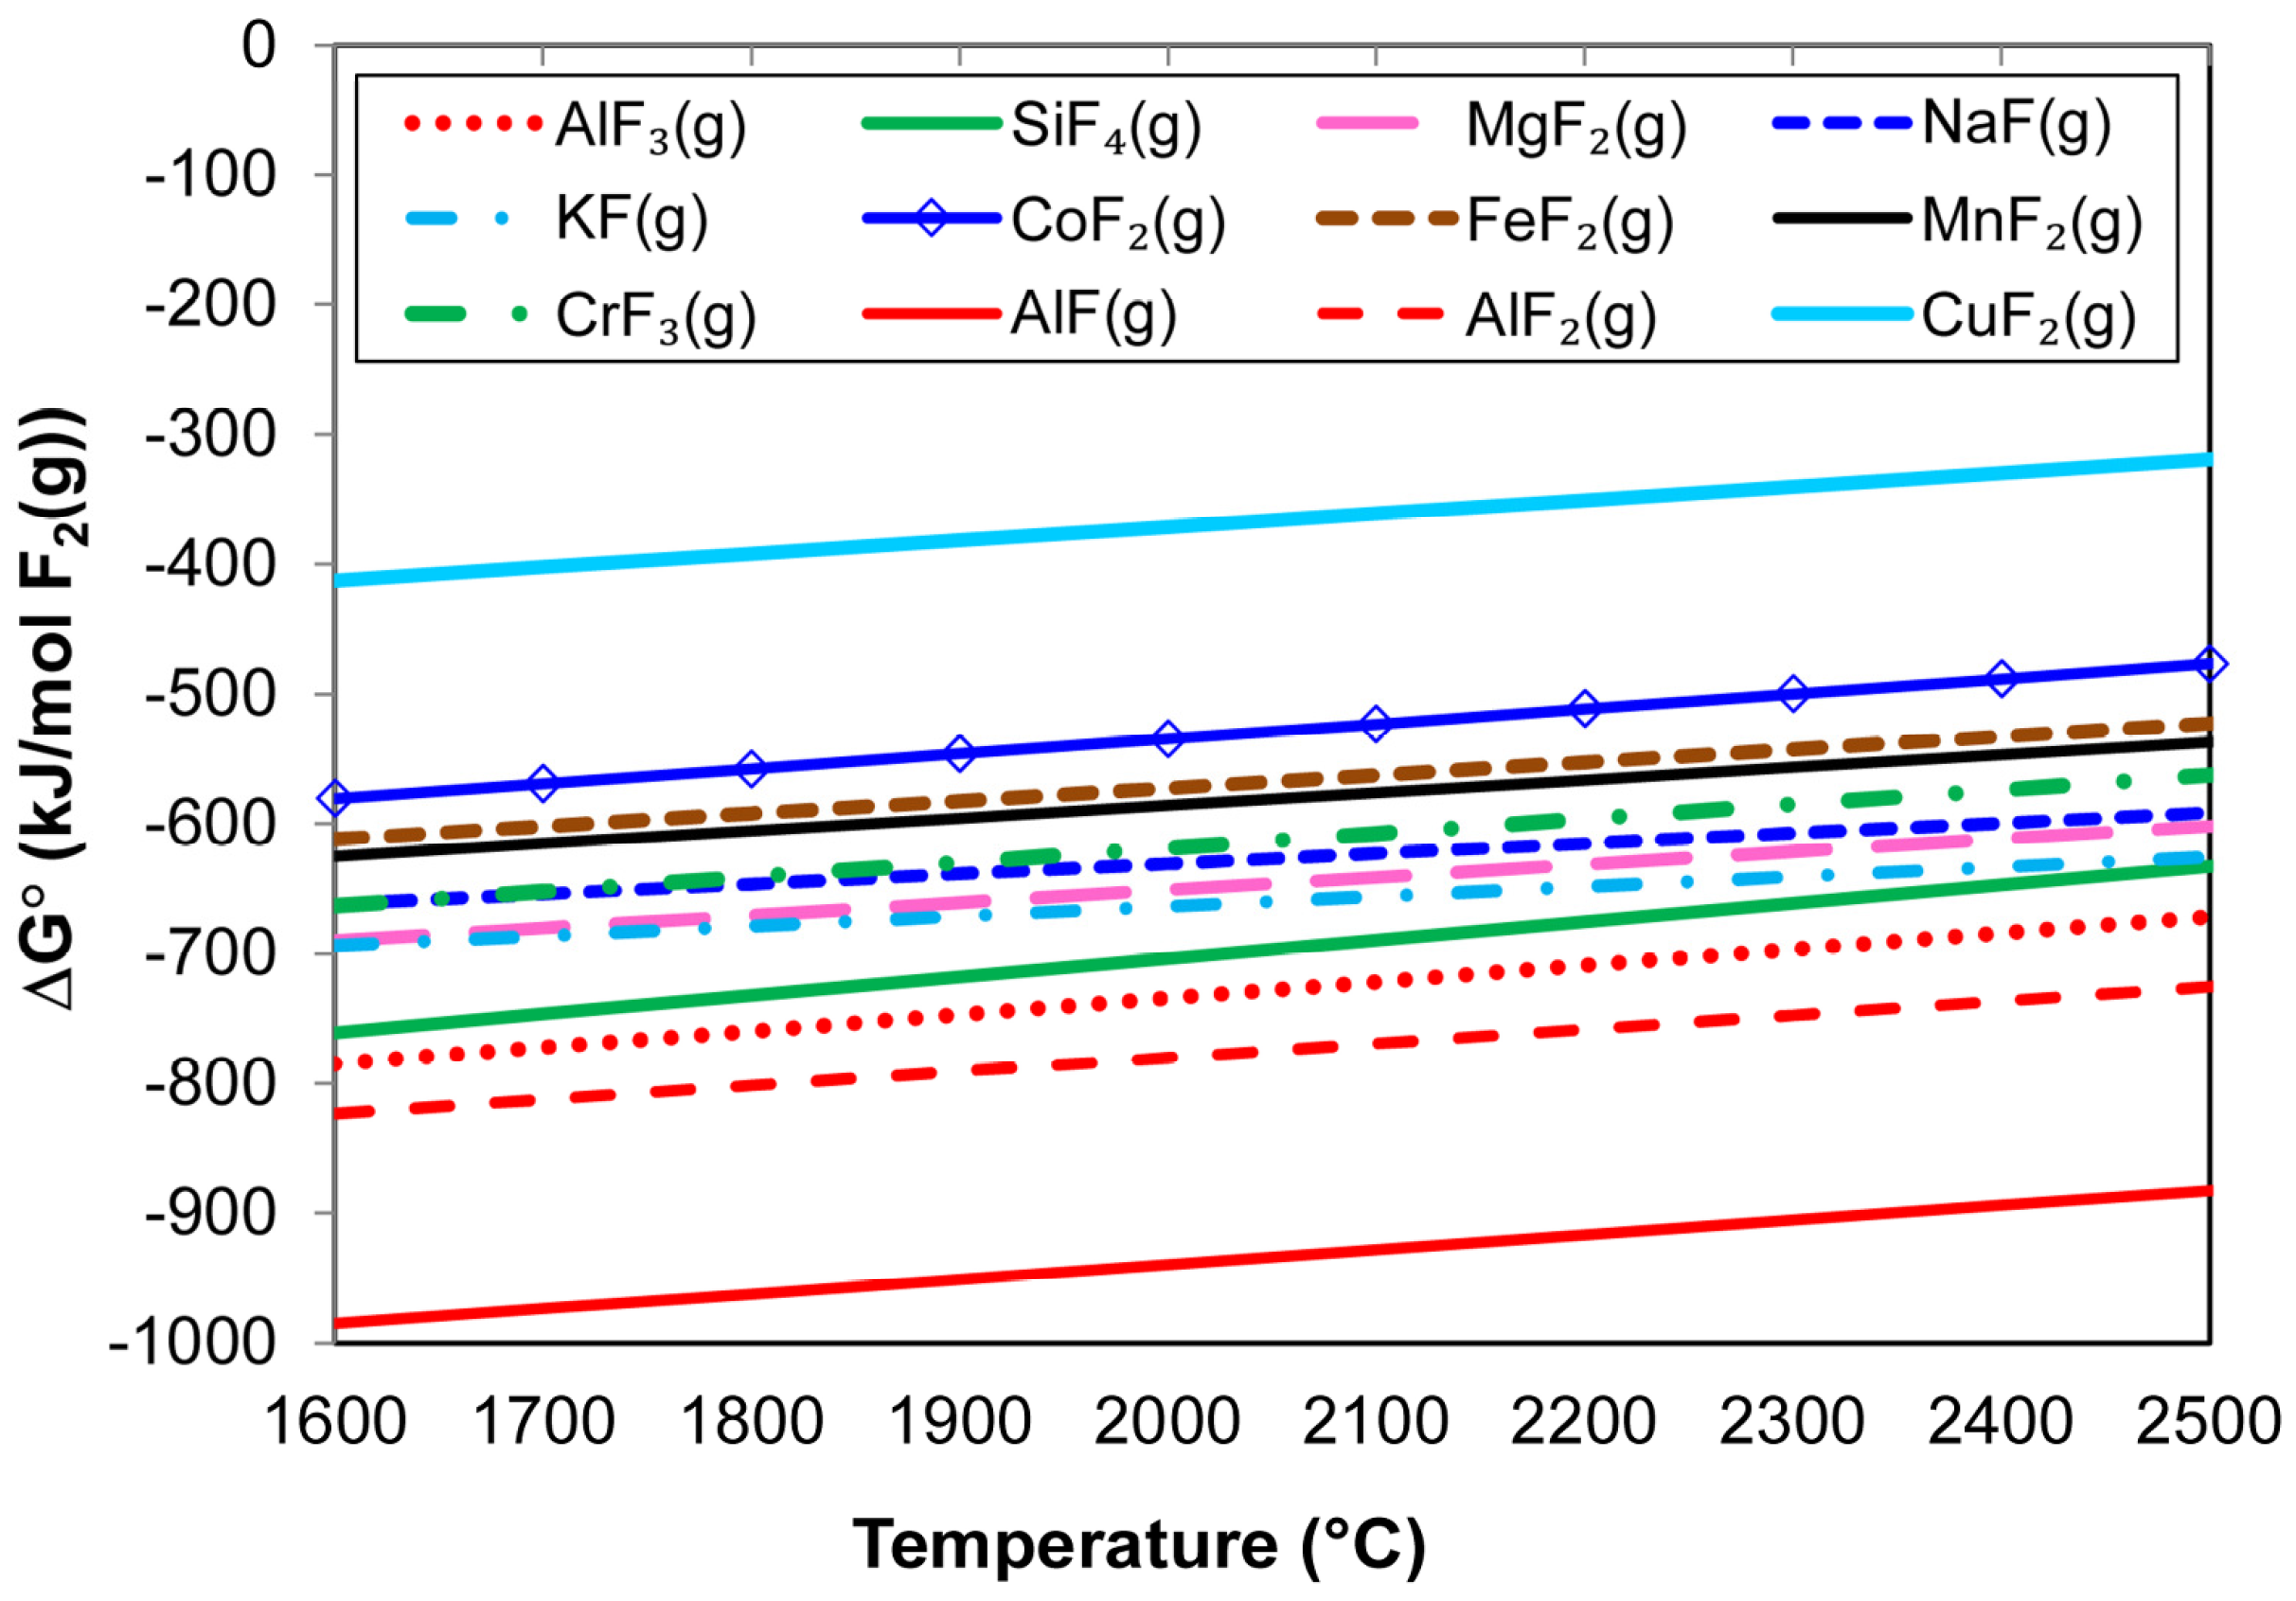
Previous Gibbs free energy calculations confirmed that NaF(g) and KF(g) are most easily formed from reaction of Na2O and K2O with CaF2 in reactions of the type displayed in Equation (11) [3,10,11]. The relative position of the lines in Figure 8 indicates that the fluorides of the main elements in the SAW reaction system considered here may all be transformed by reaction with Al(g) to release metal vapour in reactions similar to the reaction in Equation (10). Particularly, copper and cobalt may be transformed in this way, as the lines in Figure 8 for CuF2(g), as per Equation (6), and CoF2(g), as per Equation (8), have the larger difference from the Al-fluoride formation lines, such as seen in Equation (9).
Cu + F 2 = CuF 2
2 Cr + 3 F 2 = 2 CrF 3
Co + F 2 = { CoF 2 }
2 Al + 3 F 2 = 2 AlF 3
2 Al + 3 CuF 2 = 2 AlF 3 + 3 Cu
CuO + CaF 2 = CuF 2 + CaO
( ): liquid; { }: gas; < >: solid.
Previous works on the application of Cu-Ti-Al and Cu-Cr-Al metal powders in SAW have confirmed the stabilising effect of copper in combination with aluminium [7,8]. This effect is due to the formation of an initial melt of low liquidus temperature, into which the high-melting point metals such as Ti and Cr are easily dissolved before mixing into the weld pool [7,8]. The same effect is illustrated in the liquidus projection diagram Figure 9. The proportion of Cr to Co is the same as in the added metal powders, and in the weld metal analysis in Table 1. The composition point in Figure 9 (filled circle) is the equivalent composition point for the Cr-Co-Cu-Al ratios in the MP11 weld metal composition in Table 1. Figure 9 indicates that this mixture of metal powders was completely liquid at 1250 °C. This temperature is much lower than the liquidus temperature of the base case weld metal at 1516 °C, see Figure 3. This stabiliser effect of copper in the alloy and steel phases only considers the alloying effect in the weld pool, and does not take the gas phase reaction behaviour of copper into consideration. Although copper is less easily oxidised to its oxide when compared to easily oxidised elements such as Cr and Al, the interaction of copper with other elements in the arc cavity should be considered.

4.2. Thermochemical Equilibrium Calculations

The above simplified gas phase reaction considerations do provide some insights into the general chemical trends of likely gas phase reactions in the SAW arc cavity. However, it has been shown that gas–slag–metal powder equilibrium calculations in FactSage 7.3 thermochemical software may provide additional insights [4,10,11,12]. Therefore, more realistic thermochemical calculations were made to investigate the probability of species formation, especially in the gas phase, as described in Section 2.2.
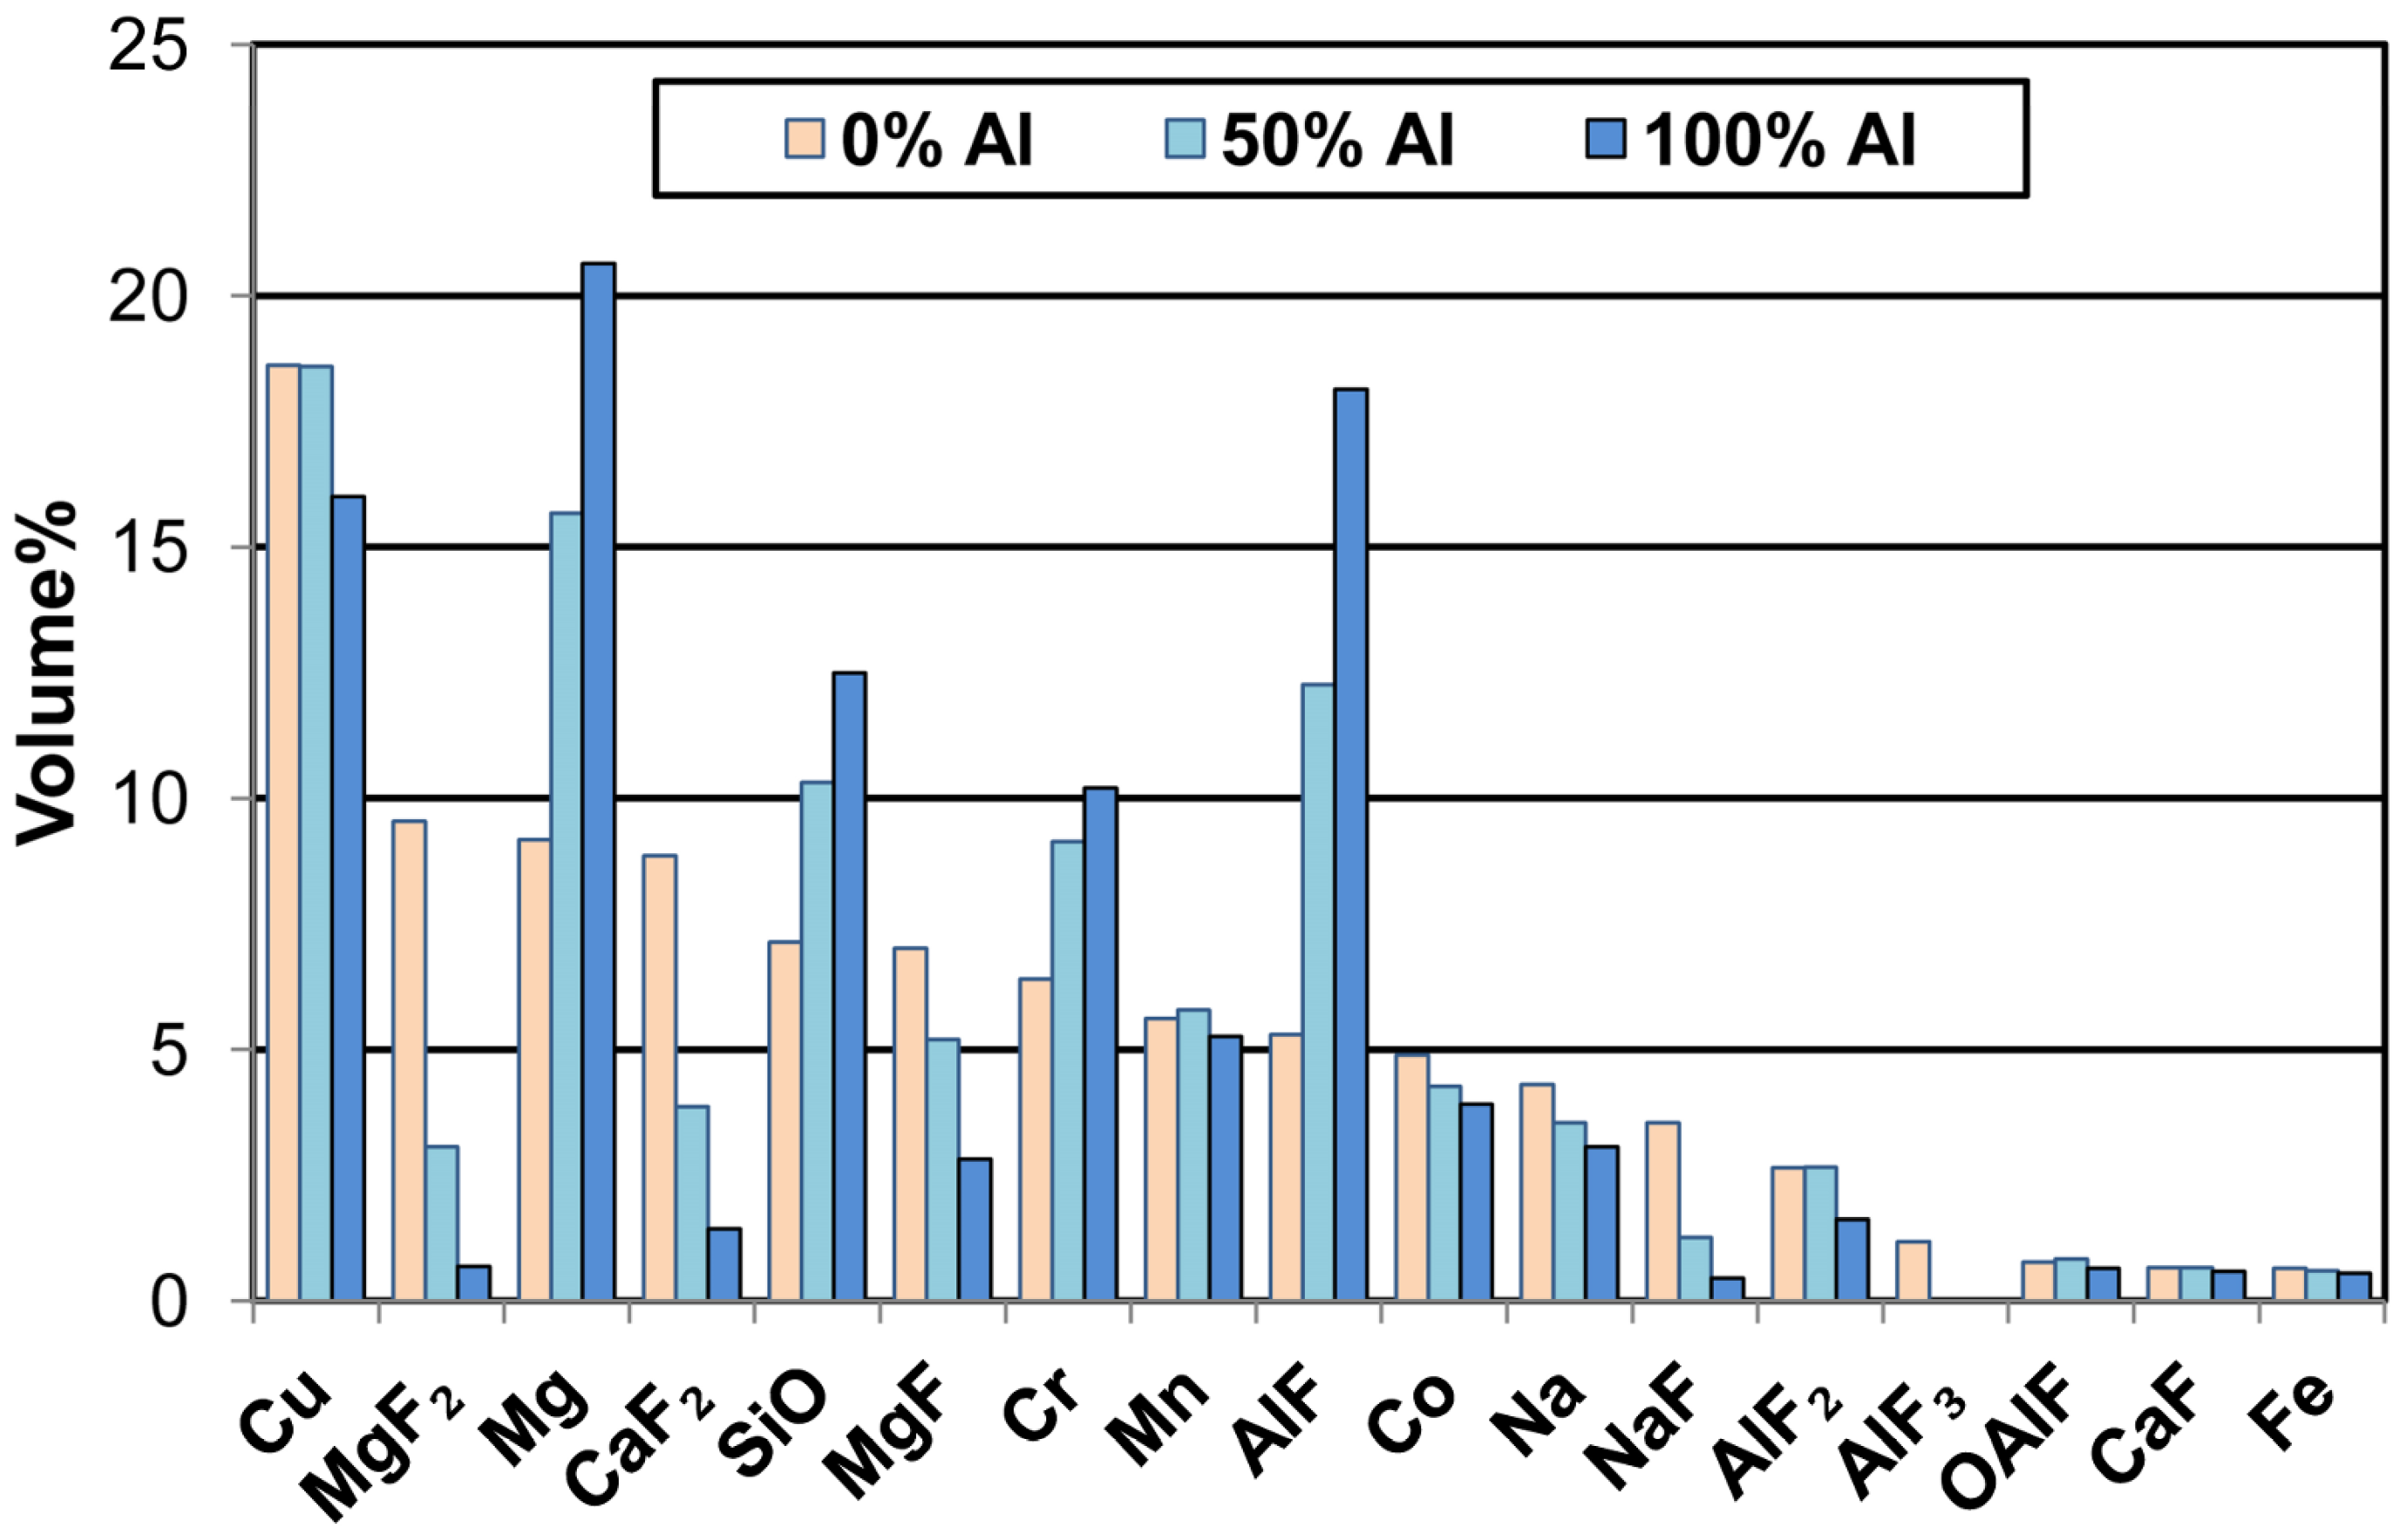
The metal powder input masses of 7 g each of Cr, Co and Cu were specified as inputs to the calculation. The Al input mass in the calculation was varied between zero, 50% and 100% of the maximum of 6.1 g Al. The calculation in Section 3.3 shows that 0.90 g Al of the input value of 7 g Al was used in the aluminothermic reduction reactions, Equations (2) and (3). Therefore, the input of Al at 100% Al usage for the gas phase reactions was set as 6.1 g Al. The major compounds in the calculated gas compositions are displayed in Figure 10 at the different levels of aluminium added. Table 6 displays the calculated loss percentages of Cr, Co, Cu and Al to the gas phase, the gas phase partial oxygen pressure (PO2) values, and the calculated free electron concentration in the plasma, as calculated in FactSage 7.3. Although arc cavity temperatures for SAW are much lower than in other open arc-welding techniques, the formation of arc plasma is still relevant. The free electron concentration in the gas phase is an indication of the level of arc stability due to plasma formation [42]. The first ionization potential of the elements is typically quoted in welding research as an indication of the likely importance of an element in arc plasma stability reactions by releasing electrons upon ionization [1,23,24,43]. Because metals have lower ionization potentials as compared to non-metals, the metals are ionized preferentially [43]. The metals of Al, Cu, Cr and Co all have similar ionization potentials of 5.986, 7.726, 6.767 and 7.881, with that of Al at the lower level among these elements [44]. Therefore, all of the metals may be ionized, but Al, at the comparatively lower value of 5.986, should be ionized more readily. The relative change in free electron concentration at equilibrium as shown in Table 6 indicates that Al(g) plays a role in this effect. In comparison, no such effect was observed in changing the copper addition level in the calculations. In contrast, the lower ionization potentials of K and Na at 4.341 and 5.139 are in agreement with the reason for adding these elements to the welding flux to stabilise the arc [41,44].
Figure 10 confirms that it is likely that significant quantities of Na and Cu are formed in the gas phase, even in the absence of Al. Therefore, the condensation association of Na and Cu in Figure 6b as Si-Cu-Na-Mn-Fe-Co oxy-fluoride is possible. The equilibrium calculation results in Figure 10 and Table 6 indicate that more Cu is vaporised with increased Al added into the gas-slag-metal powder system. Very little of any other copper gas phase species was calculated, less than 1 volume percent, compared to the large quantities of copper metal vapour, as shown in Figure 10. Because of the similar tendency of pure aluminium and pure copper to vaporise, as shown in Figure 7, the expectation is that vaporised copper may substitute for aluminium vaporisation. However, the more complex thermochemical calculation results in Figure 10 and Table 6 do not support this simplified consideration of the vaporisation behaviour of Al and Cu. As discussed previously, a possible reason for the lesser vaporisation of copper is that copper vaporisation is reaction-controlled, and is therefore dependent on the number of reaction sites available at the melt–gas interface [45]. Both sulphur and oxygen are surface-active elements and are present in the SAW process, especially oxygen, and can fill surface active sites, thereby limiting copper vaporisation. Therefore, this kinetic effect of filled reaction sites can explain the lower extent of copper vaporisation in the SAW process, as compared the thermochemically predicted extent of copper vaporisation from the gas–slag–metal powder equilibrium. Another possible explanation for the discrepancy in the copper vaporisation extent values as experimentally observed vs. from the equilibrium calculations is that the equilibrium calculation is carried out for a set temperature, and therefore the calculation does not simulate the re-condensation effects that occur as the gas phase cools.

4.3. SAW Reaction Flow Diagram with Al, Cr, Co and Cu Metal Powder Additions

The SAW reaction flow diagram in Figure 11 is slightly modified from the previously reported diagram for Al, Cr, Co powders applied in SAW [4]. Flow diagram additions were made to account for Cu vaporisation, as indicated by the light blue lines, and for the stabiliser effect of Cu via initial low liquidus temperature alloy melt formation, as shown by the reaction O in Figure 11. In the following section, only the main reactions are highlighted, since a detailed description of the reaction flow diagram is available elsewhere [4].
Reaction steps A to E are as presented from previous works, and represent the transfer of oxygen from the molten flux (slag) to the weld pool [17,20,21,22,25,46].
Reaction E presents the reaction of the excess oxygen with molten steel at the arc plasma–weld pool interface to form FeO. The trend of increased FeO in the molten flux (slag) with increased weld metal total ppm O is well established [22,37]. Therefore, the slag FeO content serves as an indicator of the oxygen potential prevailing at the molten flux–weld pool interface [22,37]. The application of aluminium powder to the SAW process to lower the oxygen potential prevailing at the molten flux–weld pool interface is well illustrated in the series of reported studies by Coetsee and De Bruin, for both chromium-[4,6,8,9,11,12,37] and titanium-containing metal powder combinations [5,7,9]. Therefore, similar to reaction G for the reduction of MnO from the molten flux, FeO may also be reduced by aluminium, see Equation (4) in the text.
The reduced oxygen potential at the molten flux–weld pool interface prevents oxidation of chromium powder to CrO and Cr2O3, and also prevents oxidation of Co to CoO to prevent chromium and cobalt loss to the slag. Since Cr has a high affinity for oxygen, the formation of CrO may occur at the arc plasma–weld pool interface, i.e., reaction E2 in Figure 11. The CrO may be reduced at the slag–weld pool interface by aluminium via Equation (5) in the text in Section 3.1 [6,8]. The effective action of aluminium de-oxidiser in lowering the partial pressure at the slag–weld pool interface ensures that Co and Cr metal powders remain in the metallic state to be melted into the initial alloy pool, (reactions I and M). Since there is an excess of Al added, some of the Al also dissolves directly into the weld pool, see reaction H. The initial alloy pool formed from the melting of the added metal powders is represented as reaction step O in Figure 11. This initial alloy melt is formed due to the stabiliser effect of Cu, in combination with Al, in forming a low liquidus temperature alloy melt which easily dissolves high-melting point Cr, as identified previously in the application of Cu-Cr-Al metal powders in SAW [8].
Previous thermodynamic analysis of simplified single gas phase reactions confirmed that the loss of Cr and Co in SAW from added metal powders is due to Cr and Co vaporisation and/or the subsequent reaction of chromium and cobalt vapour with F2 gas to form CrF3(g) and CoF2(g) [4,10]. These reactions are represented as green text for Cr reactions and dark blue text for Co reactions in Figure 11. The source of F2 gas is the dissociation of CaF2(g), according to reaction L. Formation of F2 gas in the arc cavity from the dissociation of CaF2(g) in the arc plasma appears possible, since the Ca and F were analysed in the arc cavity gas phase, when a CaF2 based flux was used in SAW test runs [1,23].
The reactions of Cu are marked as light blue text and lines in Figure 11. Copper can also be vaporised at the arc plasma–weld pool interface, as indicated in reaction J3. The thermodynamic analysis in Section 4.1 indicates that metallic copper is the likely copper species in the SAW process, and that copper does not readily react with F2 gas.
Reactions M1 and M2 in Figure 11 indicate the reaction of aluminium vapour with the fluorides of chromium and cobalt, CrF3(g) and CoF2(g), to transform these fluorides to Cr and Co vapour. Chromium, cobalt and copper can be vaporised from various reaction sites. These sites include the weld pool surface at the arc plasma–weld pool interface, as well as the unconstrained molten metal powder surfaces before the metal powders are dissolved into the alloy pool or the weld pool. The results presented here are in agreement with previous similar work on the SAW process, in which different metal powder combinations with aluminium and copper were applied [7,8,9,11].
In conclusion, from the results presented in this study, it is confirmed that copper may be added with Al, Cr and Co metal powders without changing the oxygen control reactions in SAW. The role of Cu as a stabiliser compound, in combination with Al, is likely via formation of an initial low liquidus temperature alloy melt, which allows high melting point metals such as Cr to be melted more efficiently into the weld pool. The gas phase behaviour of Cu and Co in the arc cavity is to be vaporised as metal and form part of 3D phase structures consisting of Si-Cu-Na-Mn-Fe-Co oxy-fluoride. Copper vaporisation does not appear to substitute for vapour losses from the Cr, Co and Al powders.

5. Conclusions

This study illustrates the effective application of Al as a de-oxidiser element in SAW to control the weld metal total ppm O within acceptable levels. The added Al controls the system oxygen potential at lowered levels to limit element loss to the slag, especially for expensive elements such as Co and Cr. The successful application of Al in SAW opens the SAW process to application in advanced steel formulations of high Al content, such as low density/high-entropy steels and low-density stainless steels. The application of unconstrained metal powders can improve the overall SAW process productivity because it removes the need to manufacture alloyed wire and pre-alloyed powder, since these are expensive and time-consuming steps. The specific conclusions drawn from the Al-Cr-Co-Cu metal powder combination applied in this work are as follows:
  • Al, Cr, Co and Cu unconstrained metal powders were successfully applied in SAW to alloy carbon steel weld metal whilst controlling the total weld metal ppm O at an acceptable level.
  • The added copper metal powder vaporised as metallic copper in the arc cavity, and was incorporated into the Si-Cu-Na-Mn-Fe-Co oxy-fluoride upon re-condensation from the gas phase.
  • Thermochemical calculations indicate that copper vaporisation does not substitute for aluminium vaporisation, even though both elements have similar vapour pressures at specific temperatures.
  • Copper, in combination with aluminium, has a stabiliser effect in SAW due to its formation of an initial alloy melt of low liquidus temperature. This initial alloy melt lowers the temperature required to melt high-melting point metals such as Cr into the weld pool.
  • Nano-sized oxy-fluoride strands and spheres in the dome structures of the 3D slag sample indicate that vaporisation and re-condensation of oxy-fluorides occurred.

Author Contributions

F.D.B. as inventor conceptualised the work; F.D.B. and T.C. executed the experiments together, and interpreted the data together, and prepared the manuscript together. All authors have read and agreed to the published version of the manuscript.

Funding

This research was funded in part by the University of Pretoria.

Data Availability Statement

The data sets presented in this study are available upon reasonable request to the corresponding author, as indicated on the first page.

Conflicts of Interest

The authors declare no conflict of interest. The funders had no role in the design of the study; in the collection, analyses, or interpretation of data; in the writing of the manuscript, or in the decision to publish the results.

References

  1. Sengupta, V.; Havrylov, D.; Mendex, P.F. Physical phenomena in the weld zone of submerged arc welding—A Review. Weld. J. 2019, 98, 283–313. [Google Scholar]
  2. O’Brien, A. Welding Handbook—Materials and Applications, Part 1, 9th ed.; American Welding Society (AWS): Miami, FL, USA, 2011; Volume 4. [Google Scholar]
  3. Coetsee, T.; De Bruin, F. Aluminium Assisted Nickel Alloying in Submerged Arc Welding of Carbon Steel: Application of Unconstrained Metal Powders. Appl. Sci. 2022, 12, 5392. [Google Scholar] [CrossRef]
  4. Coetsee, T.; De Bruin, F. Modification of Flux Oxygen Behaviour via Co-Cr-Al Unconstrained Metal Powder Additions in Submerged Arc Welding: Gas Phase Thermodynamics and 3D Slag SEM Evidence. Processes 2022, 10, 2452. [Google Scholar] [CrossRef]
  5. Coetsee, T.; De Bruin, F.J. Improved titanium transfer in Submerged Arc Welding of carbon steel through aluminium addition. Miner. Process. Extr. Metall. Rev. 2021, 43, 771–774. [Google Scholar] [CrossRef]
  6. Coetsee, T.; De Bruin, F.J. Reactions at the molten flux-weld pool interface in submerged arc welding. High Temp. Mater. Process. 2021, 40, 421–427. [Google Scholar] [CrossRef]
  7. Coetsee, T.; De Bruin, F. Application of Copper as Stabiliser in Aluminium Assisted Transfer of Titanium in Submerged Arc Welding of Carbon Steel. Processes 2021, 9, 1763. [Google Scholar] [CrossRef]
  8. Coetsee, T.; De Bruin, F. Chemical Interaction of Cr-Al-Cu Metal Powders in Aluminum-Assisted Transfer of Chromium in Submerged Arc Welding of Carbon Steel. Processes 2022, 10, 296. [Google Scholar] [CrossRef]
  9. Coetsee, T.; De Bruin, F. Aluminium-Assisted Alloying of Carbon Steel in Submerged Arc Welding: Application of Al-Cr-Ti-Cu Unconstrained Metal Powders. Processes 2022, 10, 452. [Google Scholar] [CrossRef]
  10. Coetsee, T.; De Bruin, F. Application of Unconstrained Cobalt and Aluminium Metal Powders in the Alloying of Carbon Steel in Submerged Arc Welding: Thermodynamic Analysis of Gas Reactions. Appl. Sci. 2022, 12, 8472. [Google Scholar] [CrossRef]
  11. Coetsee, T.; De Bruin, F. Aluminium-Assisted Alloying of Carbon Steel in Submerged Arc Welding with Al-Cr-Ni Unconstrained Metal Powders: Thermodynamic Interpretation of Gas Reactions. Processes 2022, 10, 2265. [Google Scholar] [CrossRef]
  12. Coetsee, T.; De Bruin, F. Chemical Behaviour of Copper in the Application of Unconstrained Cr-Ni-Al-Cu Metal Powders in Submerged Arc Welding: Gas Phase Thermodynamics and 3D Slag SEM Evidence. Processes 2023, 11, 351. [Google Scholar] [CrossRef]
  13. Dallam, C.B.; Liu, S.; Olson, D.L. Flux composition dependence of microstructure and toughness of submerged arc HSLA weldments. Weld. J. 1985, 64, 140–152. [Google Scholar]
  14. O’Brien, A. Welding Handbook—Welding Processes, Part 1, 9th ed.; American Welding Society (AWS): Miami, FL, USA, 1994; Volume 2. [Google Scholar]
  15. Di Schino, A. Heat treatment effect on interface microstructure and hardness of a medium carbon steel cladded by AISI 316 stainless steel. Acta Metall. Slovaca 2020, 26, 111–115. [Google Scholar] [CrossRef]
  16. Hallén, H.; Johansson, K.-E. Use of a Metal Powder for Surface Coating by Submerged Arc Welding. U.S. Patent 6331688 B1, 18 December 2001. [Google Scholar]
  17. Eagar, T.W. Sources of weld metal oxygen contamination during submerged arc welding. Weld. J. 1978, 57, 76–80. [Google Scholar]
  18. Chai, C.S.; Eagar, T.W. Slag metal reactions in binary CaF2-metal oxide welding fluxes. Weld. J. 1982, 61, 229–232. [Google Scholar]
  19. Tuliani, S.S.; Boniszewski, T.; Eaton, N.F. Notch toughness of commercial submerged arc weld metal. Weld. Met. Fabr. 1969, 37, 327–339. [Google Scholar]
  20. Polar, A.; Indacochea, J.E.; Blander, M. Electrochemically generated oxygen contamination in submerged arc welding. Weld. J. 1990, 69, 68–74. [Google Scholar]
  21. Lau, T.; Weatherly, G.C.; Mc Lean, A. The sources of oxygen and nitrogen contamination in submerged arc welding using CaO-Al2O3 based fluxes. Weld. J. 1985, 64, 343–347. [Google Scholar]
  22. Mitra, U.; Eagar, T.W. Slag metal reactions during submerged arc welding of alloy steels. Metall. Trans. B 1984, 15, 217–227. [Google Scholar] [CrossRef]
  23. Gött, G.; Gericke, A.; Henkel, K.-M.; Uhrlandt, D. Optical and spectroscopic study of a submerged arc welding cavern. Weld. J. 2016, 95, 491–499. [Google Scholar]
  24. Sengupta, V.; Mendez, P.F. Effect of fluxes on metal transfer and arc length in SAW. Weld. J. 2017, 96, 334–353. [Google Scholar]
  25. Coetsee, T.; Mostert, R.J.; Pistorius, P.G.H.; Pistorius, P.C. The effect of flux chemistry on element transfer in Submerged Arc Welding: Application of thermochemical modelling. Mater. Res. Technol. 2021, 11, 2021–2036. [Google Scholar] [CrossRef]
  26. Coetsee, T.; De Bruin, F. A Review of the Thermochemical Behaviour of Fluxes in Submerged Arc Welding: Modelling of Gas Phase Reactions. Processes 2023, 11, 658. [Google Scholar] [CrossRef]
  27. Helis, L.; Toda, Y.; Hara, T.; Miyazaki, H.; Abe, F. Effect of cobalt on the microstructure of tempered martensitic 9Cr steel for ultra-supercritical power plants. Mater. Sci. Eng. A 2009, 510–511, 88–94. [Google Scholar] [CrossRef]
  28. Jing, H.; Luo, Z.; Xu, L.; Zhao, L.; Han, Y. Low cycle fatigue behavior and microstructure of a novel 9Cr-3W-3Co tempered martensitic steel at 650 °C. Mater. Sci. Eng. A 2018, 731, 394–402. [Google Scholar] [CrossRef]
  29. De, S.K.; Srikanth, S.; Saxena, A.K.; Jha, B.K. Copper bearing steels from SAIL and its application. Int. J. Metall. Eng. 2016, 5, 1–8. [Google Scholar]
  30. Patel, D.; Soman, S.N. Develop a flux cored wire for submerged arc welding of Ni-Mo low alloy steel. Sadhana 2020, 45, 127. [Google Scholar] [CrossRef]
  31. Raabe, D.; Tasan, C.C.; Springer, H.; Bausch, M. From high-entropy alloys to high-entropy steels. Steel Res. Int. 2015, 86, 1127–1138. [Google Scholar] [CrossRef]
  32. Moon, J.; Ha, H.-Y.; Kim, K.-W.; Park, S.-J.; Lee, T.-H.; Kim, S.-D.; Jang, J.H.; Jo, H.-H.; Hong, H.-U.; Lee, B.H.; et al. A new class of lightweight, stainless steels with ultra-high strength and large ductility. Sci. Rep. 2020, 10, 12140. [Google Scholar] [CrossRef]
  33. Coetsee, T. Phase chemistry of Submerged Arc Welding (SAW) fluoride based slags. Mater. Res. Technol. 2020, 9, 9766–9776. [Google Scholar] [CrossRef]
  34. Lau, T.; Weatherly, G.C.; Mc Lean, A. Gas/Metal/Slag reactions in Submerged Arc Welding using CaO-Al2O3 based fluxes. Weld. J. 1986, 65, 31–38. [Google Scholar]
  35. Bale, C.W.; Bélisle, E.; Chartrand, P.; Decterov, S.; Eriksson, G.; Gheribi, A.E.; Hack, K.; Jung, I.-H.; Kang, Y.-B.; Melançon, J.; et al. Reprint of: FactSage thermochemical software and databases, 2010–2016. Calphad 2016, 55, 1–19. [Google Scholar] [CrossRef]
  36. Coetsee, T.; De Bruin, F. In Situ Modification of CaF2-SiO2-Al2O3-MgO Flux Applied in the Aluminium-Assisted Transfer of Titanium in the Submerged Arc Welding of Carbon Steel: Process Mineralogy and Thermochemical Analysis. Minerals 2022, 12, 604. [Google Scholar] [CrossRef]
  37. Coetsee, T.; De Bruin, F. Insight into the Chemical Behaviour of Chromium in CaF2-SiO2-Al2O3-MgO Flux Applied in Aluminium-Assisted Alloying of Carbon Steel in Submerged Arc Welding. Minerals 2022, 12, 1397. [Google Scholar] [CrossRef]
  38. Kluken, A.O.; Grong, Ø. Mechanisms of inclusion formation in Al-Ti-Si-Mn deoxidized steel weld metals. Metall. Trans. B 1989, 20, 1335–1349. [Google Scholar] [CrossRef]
  39. Chai, C.S.; Eagar, T.W. Slag-metal equilibrium during submerged arc welding. Metall. Trans. B 1981, 12, 539–547. [Google Scholar] [CrossRef]
  40. Mitra, U.; Eagar, T.W. Slag-metal reactions during welding: Part I. Evaluation and reassessment of existing theories. Metall. Trans. B 1991, 22, 65–71. [Google Scholar] [CrossRef]
  41. Kohno, R.; Takamo, T.; Mori, N.; Nagano, K. New fluxes of improved weld metal toughness for HSLA steels. Weld. J. 1982, 61, 373–380. [Google Scholar]
  42. Zarl, M.A.; Farkas, M.A.; Schenk, J. A Study on the Stability Fields of Arc Plasma in the HPSR Process. Metals 2020, 10, 1394. [Google Scholar] [CrossRef]
  43. Kim, J.H.; Frost, R.H.; Olsen, D.J. Electrochemical oxygen transfer during direct current arc welding. Weld. J. 1998, 77, 488–494. [Google Scholar]
  44. Haynes, W.M.; Lide, D.R.; Bruno, T.J. CRC Handbook of Chemistry and Physics, 97th ed.; CRC Press Taylor & Francis Group: Boca Raton, FL, USA, 2016. [Google Scholar]
  45. Collur, M.M.; Paul, A.; Debroy, T. Mechanism of alloying element vaporization during laser welding. Metall. Trans. B 1987, 18, 733–740. [Google Scholar] [CrossRef]
  46. Mitra, U.; Eagar, T.W. Slag-metal reactions during welding: Part II. Theory. Metall. Trans. B 1991, 22, 73–81. [Google Scholar] [CrossRef]
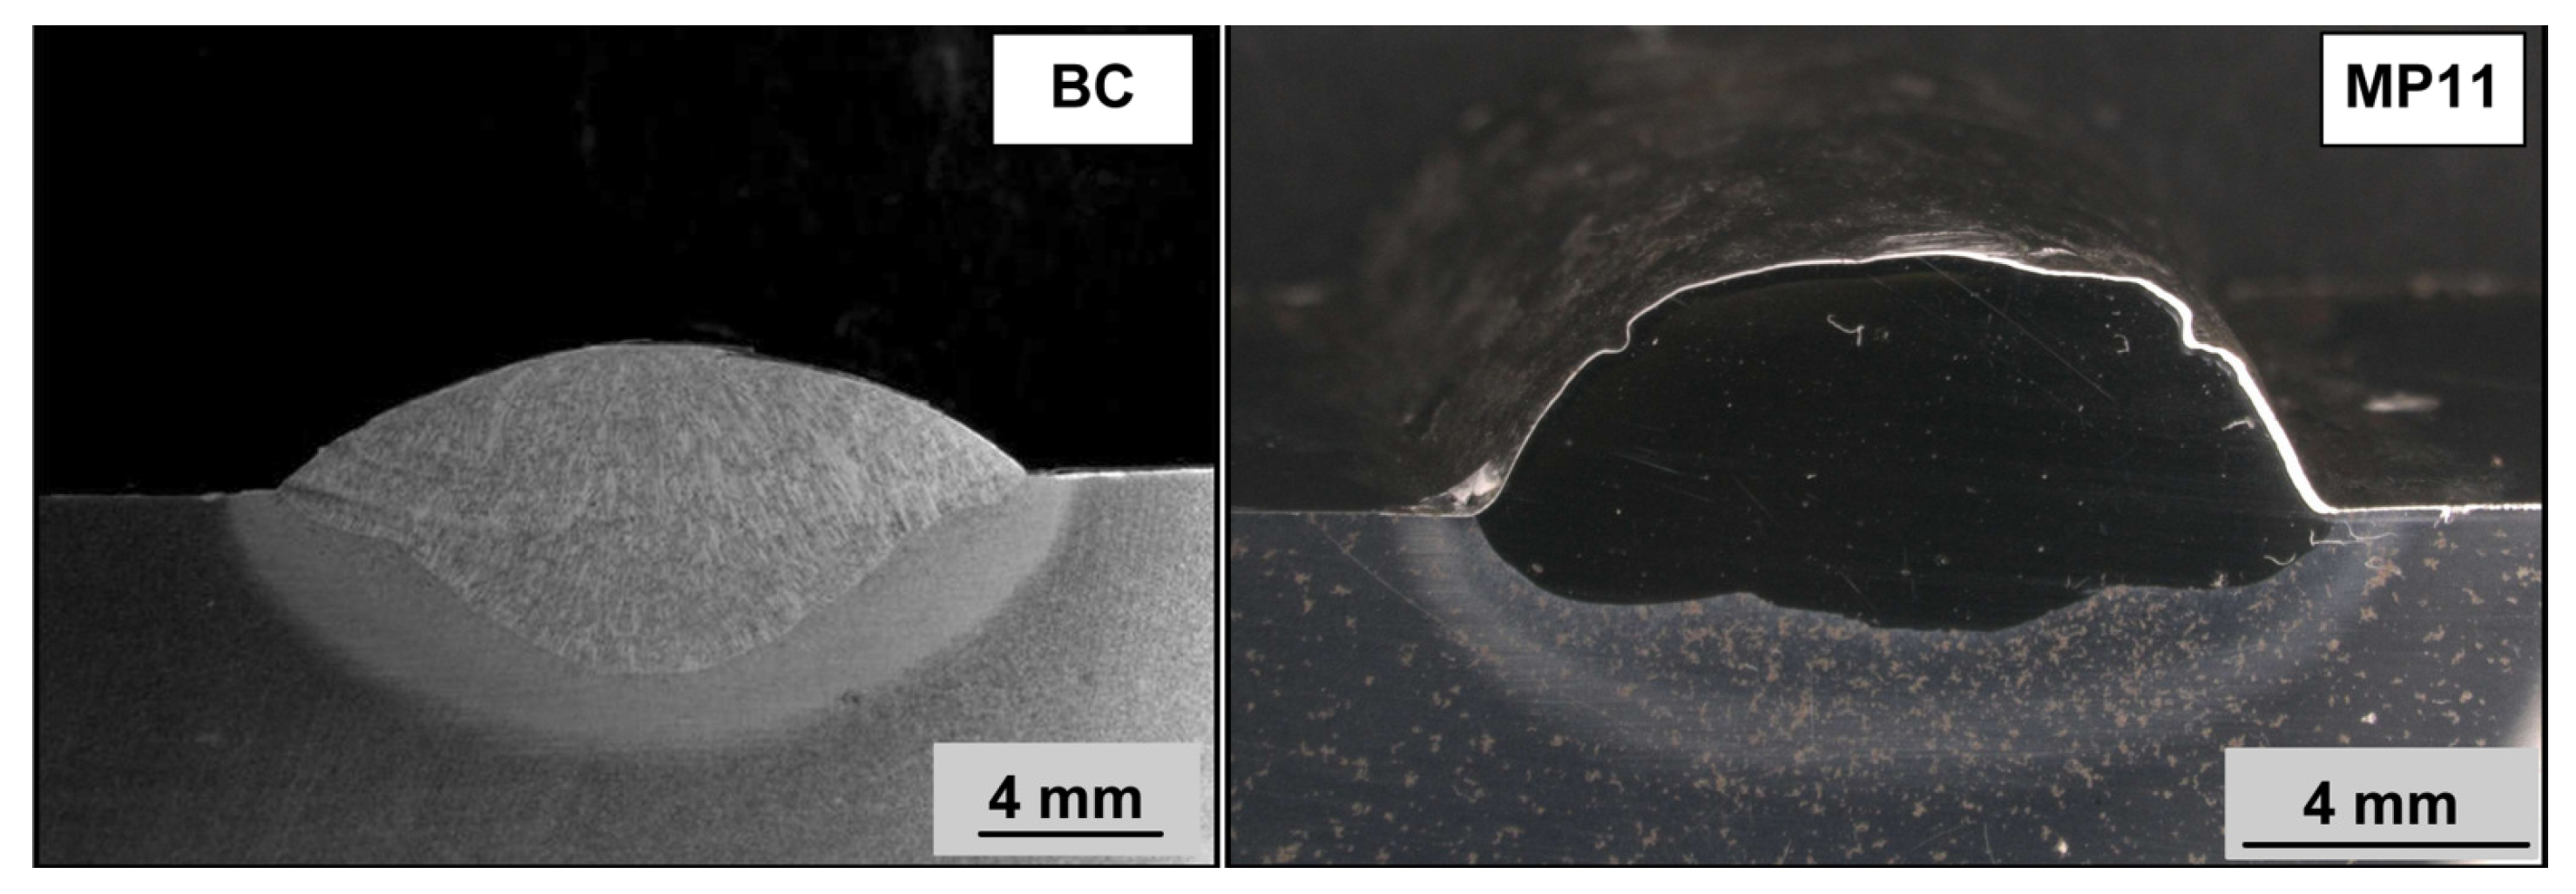
Figure 1. Photograph of BC and MP11 weld metal cross-sections.
Processes 11 01116 g001
Figure 2. Scanning electron microscope micrograph of weld metal areas, marked a, b, and c (see Table 2 for the analyses per marked phase areas a, b, and c) (×3290).
Processes 11 01116 g002
Figure 3. Solidification curves for MP11 and BC weld metal compositions from Table 3 (mass% proportion liquid phase in steel).
Processes 11 01116 g003
Figure 4. (a) BSE image at 605× magnification showing a slag dome with 3D structures in the MP11 post-weld slag; (b) EDX maps of the FOV (field of view) in Figure 4a.
Processes 11 01116 g004aProcesses 11 01116 g004b
Figure 5. (a) BSE image at 3930× magnification showing 3D structures in slag dome in the MP11 post-weld slag, as shown in Figure 4a’s blocked area; (b) EDX maps of the FOV (field of view) in Figure 5a.
Processes 11 01116 g005aProcesses 11 01116 g005b
Figure 6. (a) BSE image at 28,920× magnification showing 3D sphere in slag dome in the MP11 post-weld slag, as shown in Figure 5a’s blocked area; (b) EDX maps of the FOV (field of view) in Figure 6a.
Processes 11 01116 g006aProcesses 11 01116 g006b
Figure 7. Vapour pressure of pure metals Na, K, Mn, Al, Cr, Fe, Co, Si, Cu vs. temperature.
Processes 11 01116 g007
Figure 8. Standard Gibbs free energy values of reactions similar to Equations (6)–(9).
Processes 11 01116 g008
Figure 9. Cr-Cu-Co-22% Al liquidus projection diagram calculated in FactSage 7.3 [35].
Processes 11 01116 g009
Figure 10. MP11 weld gas composition (volume%) output from gas–slag–metal powder equilibrium at 2500 °C, calculated in FactSage 7.3 thermochemical software (Equilib module) [35].
Processes 11 01116 g010
Figure 11. SAW reaction flow diagram with Al, Cr, Co and Cu powder additions.
Processes 11 01116 g011
Table 1. Bulk chemical composition of weld metals (mass%).
%C%Si%Mn%O%Al%P%S%Ni%Cr%Cu%Co%Fe
Base Case0.1100.2601.3000.04990.0320.0220.0110.0050.1100.1100.00398.03
MP110.0970.7571.4170.01764.4630.0230.0060.0435.5005.2605.30777.05
Table 2. SEM-EDX analyses of marked areas (a, b and c) in the MP11 weld metal, as indicated in Figure 2 (mass%).
%Si%Mn%Al%Cr%Cu%Co%Fe
a0.701.504.105.815.615.9176.4
b0.701.404.105.815.515.9176.6
c0.721.544.005.755.445.9576.6
Table 3. Mass balance numbers and percentage yield calculation results for Al, Co, Cr and Cu.
Al
(g)
Cr
(g)
Co
(g)
Cu
(g)
Powder
(g)
Wire (g)Base Plate
(g)
Weld Metal
(g)
%DR(wire + MP)%Al
Yield
%Cr
Yield
%Co
Yield
%Cu
Yield
MP114.75.75.55.521.451.131.9104.46966827878
Table 4. Exothermic heat added to the weld pool from reactions (2) and (3).
SiO2
(g)
MnO
(g)
Al
(g)
Reaction (2) (kJ)Reaction (3) (kJ)Reactions (2)
& (3)
(kJ)
Weld Metal ΔT (°C)
MP111.360.340.90−2.49−0.79−3.2868
Table 5. Average EDX analyses of 3D slag in Figure 4, Figure 5 and Figure 6.
Figure%F%O%Al%Si%Mg%Ca%Mn%Fe%Cu%Na%K%Ti%Cr%Co
421.825.89.49.66.95.78.05.70.63.50.31.50.40.5
519.412.05.010.84.03.230.55.20.42.40.23.60.92.2
617.610.74.410.04.23.620.317.21.82.80.43.81.21.5
Table 6. MP11 expected metal loss to gas according to gas–slag–metal powder equilibrium at 2500 °C, calculated in FactSage 7.3 thermochemical software (Equilib module) [35].
GramAlMass% Cr
to Gas
Mass% Co
to Gas
Mass% Cu
to Gas
Mass% Al
to Gas
P O 2   ( atm ) Free Electron Volume Fraction in Gas Phase: e[−]
zero13104201.4 × 10−62.8 × 10⁻⁵
3.00271468573.1 × 10−74.0 × 10⁻⁵
6.10411880508.5 × 10−85.4 × 10⁻⁵
Disclaimer/Publisher’s Note: The statements, opinions and data contained in all publications are solely those of the individual author(s) and contributor(s) and not of MDPI and/or the editor(s). MDPI and/or the editor(s) disclaim responsibility for any injury to people or property resulting from any ideas, methods, instructions or products referred to in the content.