Article

Research on Adaptive Distribution Control Strategy of Braking Force for Pure Electric Vehicles

1
School of Mechanical Engineering and Mechanics, Xiangtan University, Xiangtan 411105, China
2
Key Laboratory of Automotive Power and Transmission System of Hunan Province, Xiangtan 411100, China
3
Zhuzhou Gear Co., Ltd., Zhuzhou 412000, China
4
Guangdong Shunde Weasi Robot Co., Ltd., Foshan 528000, China
*
Author to whom correspondence should be addressed.
Processes 2023, 11(4), 1152; https://doi.org/10.3390/pr11041152
Submission received: 18 March 2023 / Revised: 5 April 2023 / Accepted: 6 April 2023 / Published: 9 April 2023
(This article belongs to the Section Energy Systems)

Abstract

:
The actual driving conditions of electric vehicles (EVs) are complex and changeable. Limited by road adhesion conditions, it is necessary to give priority to ensuring safety, taking into account the energy recovery ratio of the vehicle during braking to obtain better braking quality. In this work, an electric vehicle with an EHB (electro-hydraulic braking) system whose braking force adaptive distribution control strategy is studied. Firstly, the vehicle dynamics model, including seven degrees of freedom, tire, drive motor, main reducer, battery pack, and braking system, was constructed, which is attributed to the vehicle configuration and braking system scheme. Second, based on curve I and ECE regulations, the adaptive braking force distribution control strategy was formulated by taking the maximum regenerative braking torque as the inflection point, the synchronous adhesion coefficient as the desired point, and the battery SOC, road adhesion coefficient, and braking strength as the threshold. Finally, the vehicle dynamics simulation model was built on the Matlab/Simulink platform, and the simulation results verified the feasibility of the proposed braking force adaptive allocation control strategy. The research shows that the adaptive distribution control strategy can better adapt to the complex and variable driving conditions of the vehicle by combining the inflection point and the desired point. The braking energy recovery ratios of the vehicle under the NEDC and NYCC cycle conditions on a high adhesion road are 52.62% and 47.45%. The braking force distribution curve is close to curve I under the low adhesion extreme road.

1. Introduction

The electric powertrain system with low emission and high efficiency is one of the effective ways to alleviate the energy crisis and environmental pollution in the long term [1,2]. Although there have been significant developments in motor control strategy and energy density management, there are still some problems, such as low battery utilization efficiency, limited driving mileage, and relatively long charging speed, which prevent the large-scale commercialization of battery-based EVs [3,4].
Research shows that 25% of the total driving energy of EVs is lost by friction braking into heat energy [5]. Regenerative braking is an effective method to convert braking energy into electric energy, which can effectively improve the driving range of EVs, especially for pure EVs and hybrid EVs that mainly drive in urban conditions [6,7]. However, some factors will affect the use of the regenerative braking effect, such as driving intention, braking intensity, vehicle speed, and battery charging state. Therefore, the research on regenerative braking of EVs cannot be ignored, and it is necessary to conduct relevant research.
Nowadays, the main research on regenerative braking is to rationally distribute the braking force of the front and rear wheels of EVs, and to dynamically coordinate energy recovery power and mechanical braking power. Regenerative braking performance of automobiles can be brought to the limit under the premise of ensuring braking safety, so as to maximize braking energy recovery. In practical applications, the braking force distribution method of the traditional automobile’s front and rear wheels is mostly distributed by a fixed ratio approaching the ideal braking force distribution curve (curve I). The braking energy recovery is limited, and the automobile only realizes the ideal state of the front and rear wheels becoming locked at the point of synchronous adhesion coefficient [8].
In recent years, a large number of commercial passenger vehicles have been loaded with proportional valves, high-speed on–off valves, and other braking force regulation devices. These valves can achieve variable ratio braking force distribution through the design of turning points to achieve the best braking quality while leaving space for braking stability [9,10]. Xu, G. et al. developed a control strategy based on fuzzy rule for a regenerative braking system. By using the proposed control strategy, the ideal braking force distribution of the front and rear wheels can be obtained to improve the braking energy recovery efficiency [11]. Ma, Z. et al. proposed a regenerative braking system for small four-wheel drive electric vehicles, which improved the braking energy recovery strategy based on curve I. This strategy covers a wider range of vehicle braking situations while prioritizing braking stability [12]. Kumar, C.N. et al. proposed a new synergistic control of regenerative and friction braking together in hybrid EVs, which makes the braking force distribution curves of the front and rear wheels close to the ideal distribution curve and facilitates stable braking [13]. Li, S. et al., based on curve ECE regulation and curve I, proposed a ratio of regenerative braking force to the front axle braking force, which was designed according to different braking intensities. A braking energy recovery control strategy was developed, which effectively improved the proportion of recovered braking energy [14]. Some studies have focused on braking force distribution strategies by considering algorithms, the hardware arrangement of braking schemes, attached ground, and other situations. Ouyang et al. found that the braking force distribution scheme with tandem braking can effectively and maximally achieve braking energy recovery and reduce the energy consumption of the whole vehicle by comparing and analyzing three braking force distribution control strategies [15]. Ko, J. et al. integrated a regenerative braking cooperative control algorithm based on the whole vehicle braking force distribution strategy to improve the braking energy recovery ratio by increasing the gradient of the change of the target braking force relative to the pedal stroke [16]. Wei, Z. et al. developed a braking force coordination control strategy to effectively utilize the front axle regenerative braking force while the braking performance of the vehicle is guaranteed under low adhesion road surfaces [17]. Zhang, L. et al. proposed a regenerative braking control strategy for all braking conditions based on a new braking strength definition method, which can effectively improve the braking performance [18]. The above braking force distribution control strategies are formulated by dividing braking demand according to braking intensity under specific working conditions, and then combining braking regulations with motor and battery constraints. However, the actual working conditions of EVs are complex, and the road adhesion conditions are different. It is difficult to realize the maximum recovery of braking energy and take into account the braking safety at the same time when the braking force distribution is mainly based on the braking strength.
Therefore, this paper proposed an adaptive comprehensive control strategy. The bases of this article are curve I and ECE regulations. The strategy is to maximize the regenerative braking torque as the turning point and the synchronous adhesion coefficient for expectations. Moreover, it considered a comprehensive consideration of the motor regenerative braking torque limit, the battery SOC, the road adhesion coefficient, and the braking strength to adapt to the car’s complicated working condition. In this way, the energy recovery ratio of the vehicle can be taken into account while the braking safety is guaranteed.
The rest of this paper is organized as follows: Section 2 introduces the configuration of the electric vehicles and its braking system. Section 3 realizes the modelling of the vehicle dynamic model. In Section 4, the adaptive control strategy of the braking force distribution is introduced and the model is built. In Section 5, the adaptive distribution control strategy of braking force is simulated and analyzed. Finally, the conclusion is summarized in Section 6.

2. Vehicle Configuration and Braking System

The adopted vehicle configuration scheme is shown in Figure 1. The model is a pure, front-drive electric vehicle, and the driving system adopts the current mainstream transmission scheme, that is, a single motor drive and a single stage reducer. The braking system abandons the traditional vacuum booster device, electric vacuum pump, and P-EHB scheme, and adopts the electric servo booster and the hydraulic regulating unit, which belong to the two-box scheme.
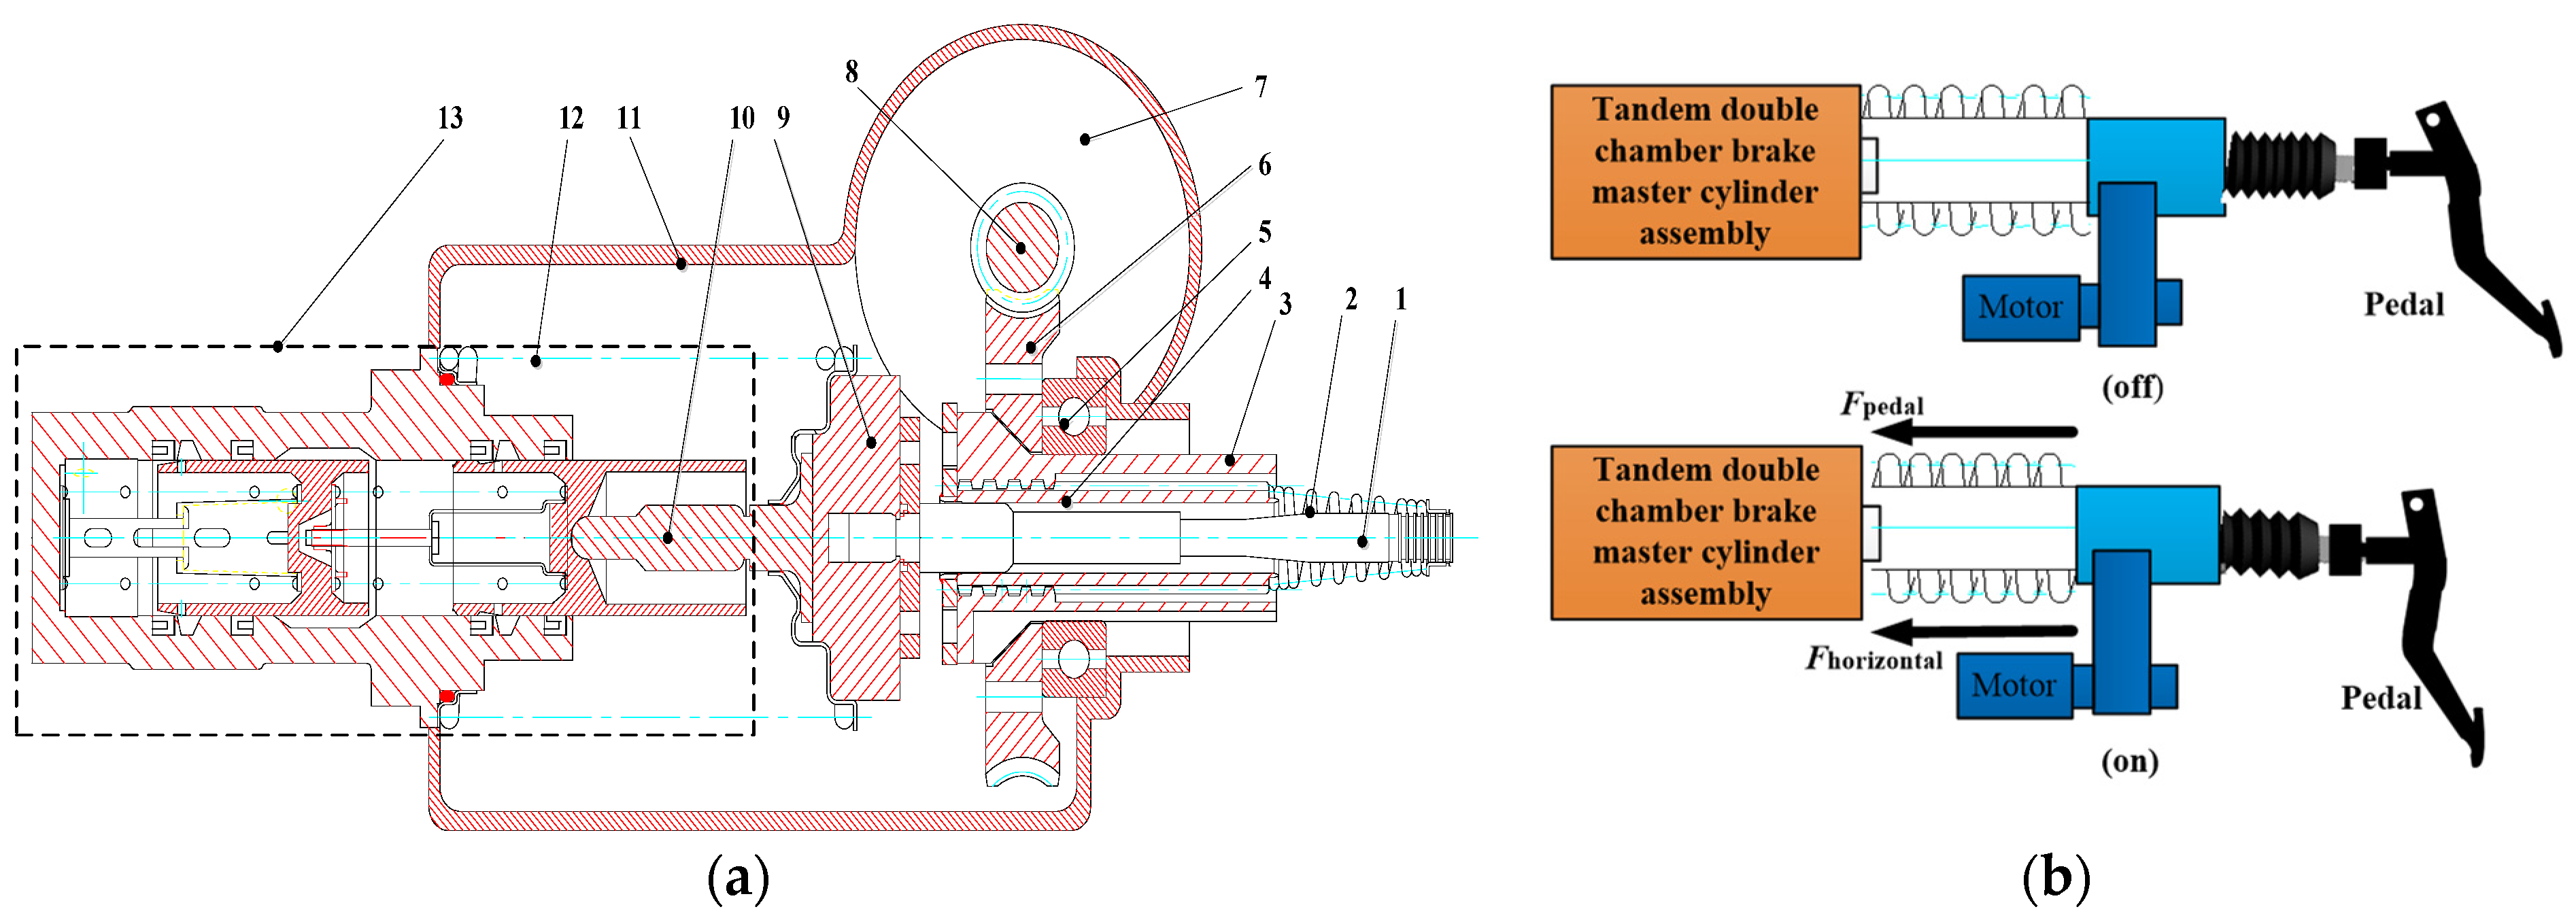
The structure of the adopted electric servo booster is shown in Figure 2a. The working states are shown in Figure 2b. The booster is mainly composed of an input push rod, turbo worm, screw, return spring, tandem double chamber brake master cylinder, and other parts.
Its working principle is as follows: when the booster is normal, the booster motor runs quickly to the specified position, the blocking torque acts upon the screw by the worm gear and the worm, and horizontal thrust is generated. The thrust and pedal forces are coupled to the master cylinder piston. When the brake pedal is released, the power motor reverses to the specified position, and the return spring ensures that the brake pedal returns to the initial position. During booster failure, that is, when the booster motor does not work because there is a slide between the screw and the turbine, the pedal force is directed directly through the cone spring and the screw, together, to squeeze the feedback disk so that the pedal force is transformed into the pressure of the master cylinder.
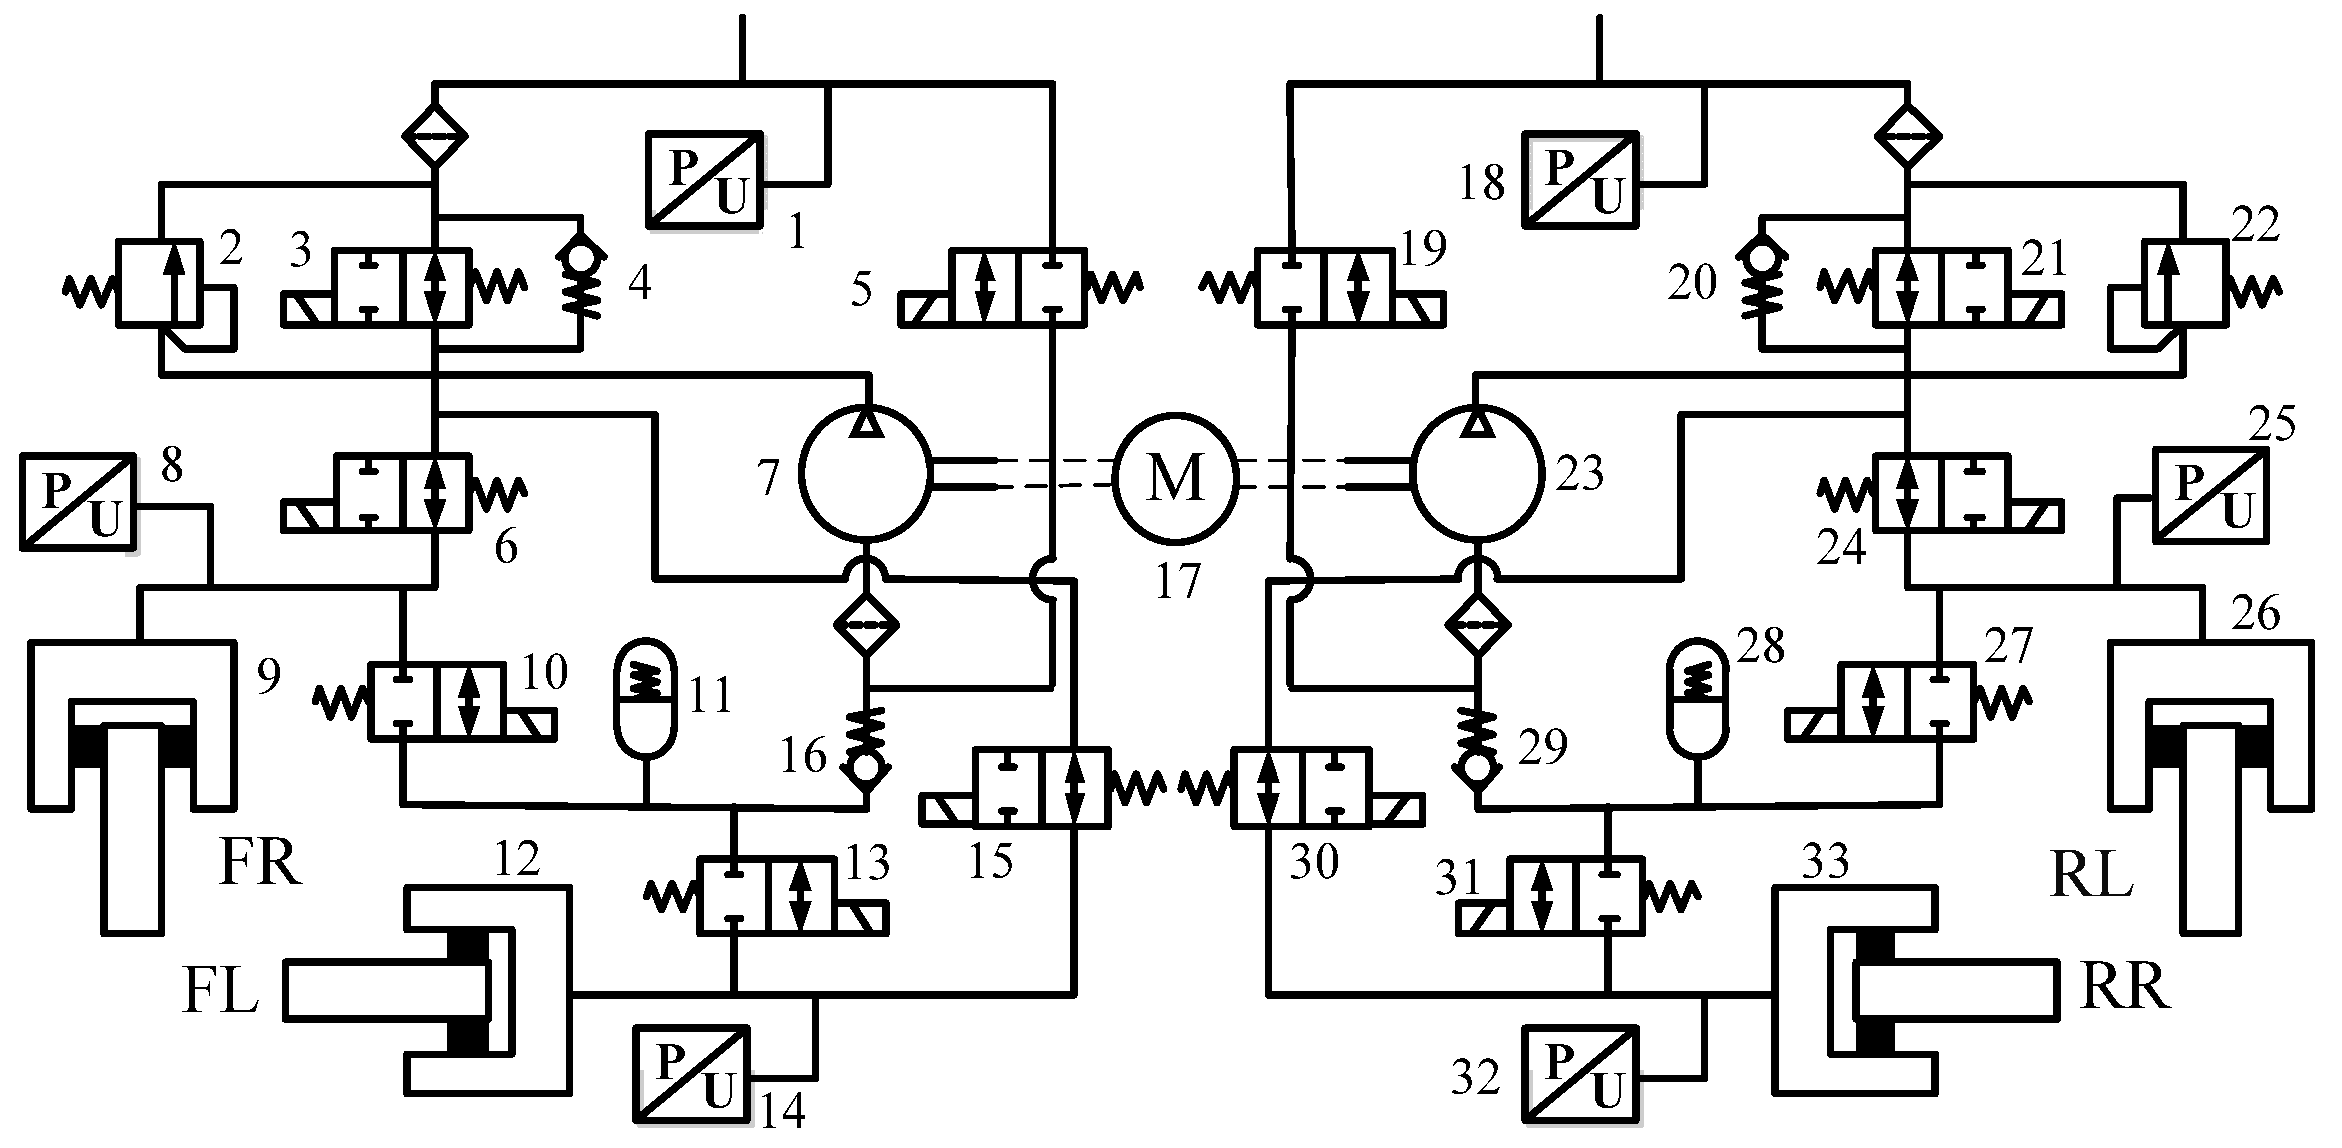
The hydraulic regulating unit is the current mainstream DSC/ESP scheme. The front braking and rear braking of the disc braking hydraulic regulating unit adopt an H-type double circuit, and its specific structure schematic diagram is shown in Figure 3.

3. Vehicle Dynamics Modeling

3.1. Vehicle 7-DOF Model

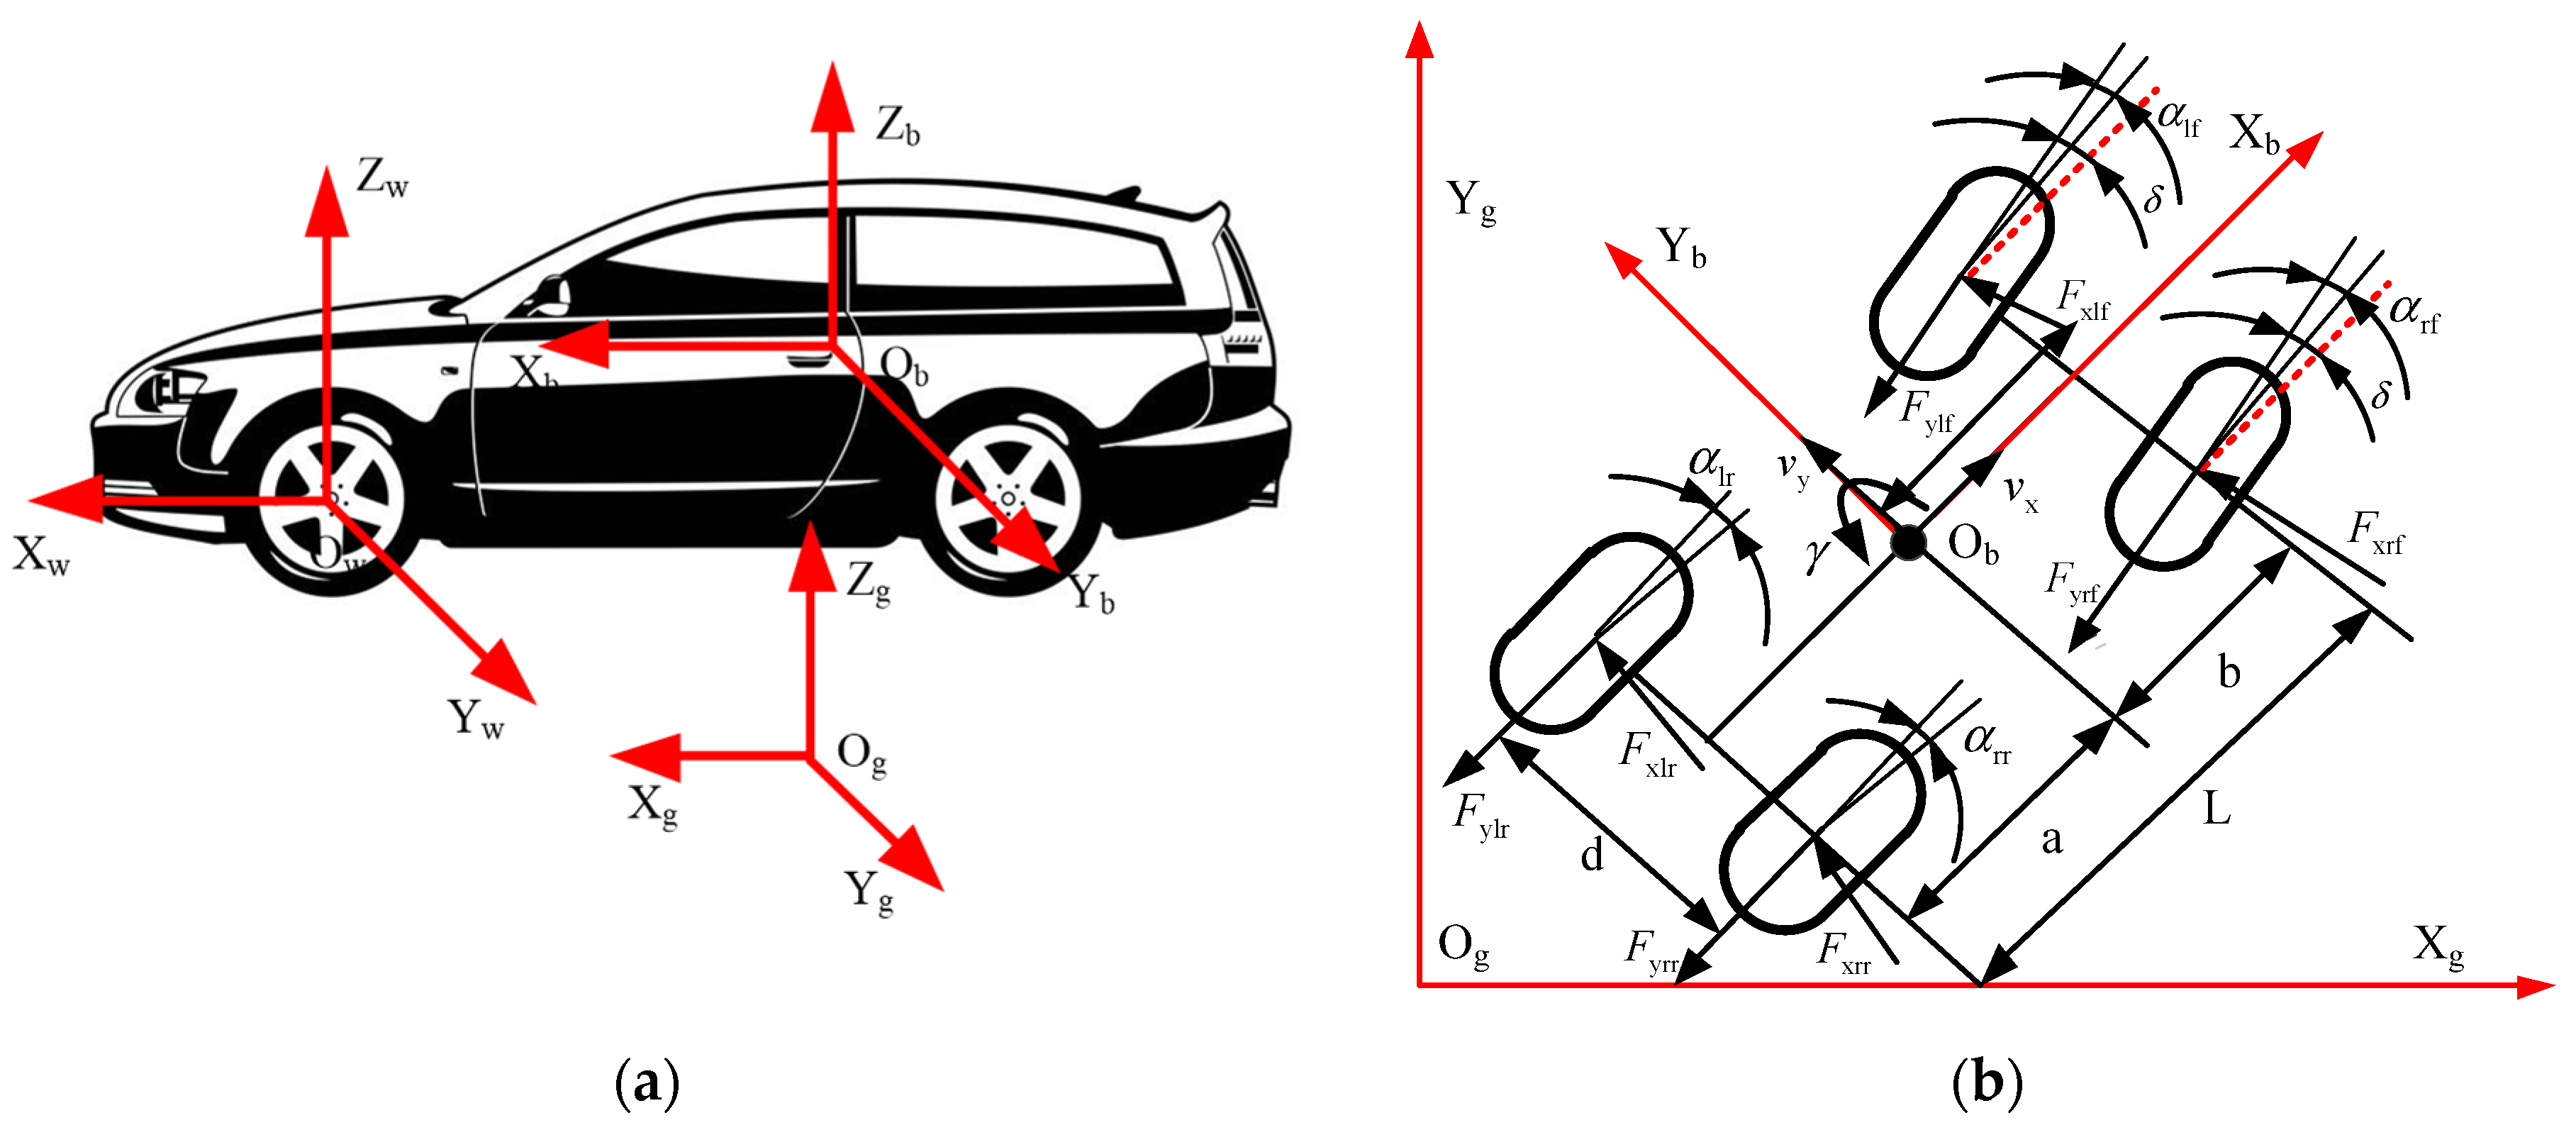
As shown in Figure 4, the full vehicle 7-degrees-of-freedom model includes yaw, longitudinal movement, lateral movement, and four-wheel rotation. The coordinate systems O g - X g Y g Z g , O w - X w Y w Z w , and O b - X b Y b Z b are established with the ground, wheel center, and vehicle centroid, respectively, to describe the actual motion state of the vehicle. When braking, the differential equations of the longitudinal, transverse, and yaw motions along the longitudinal and transverse directions of the Xb axis and Yb axis and the normal directions around the Zb axis are as follows:
m ( v x v y γ ) = ( F xlf + F xrf ) cos δ ( F ylf + F yrf ) sin δ F xlr F xrr
m ( v y + v x γ ) = ( F xlf + F xrf ) sin δ + ( F ylf + F yrf ) cos δ + F ylr + F yrr
I z b γ = a ( F xlf + F xrf ) sin δ 1 2 d ( F xrf F xlf ) cos δ + a ( F ylf + F yrf ) cos δ + 1 2 d ( F ylf F yrf ) sin δ b ( F ylr + F yrr ) + 1 2 d ( F xlr F xrr )
The side-deviation Angle α i ( i = lf , rf , lr , rr ) is:
{ α lf = arctan v y + a γ v x 0.5 d γ δ α rf = arctan v y + a γ v x + 0.5 d γ δ α lr = arctan v y b γ v x 0.5 d γ α rr = v y + b γ v x + 0.5 d γ
The vertical load of each wheel, F z i ( i = lf , rf , lr , rr ) , is:
{ F zlf = m [ g b 2 L v x h 2 L v y h b d L F g h 2 m L ] F zrf = m [ g b 2 L v x h 2 L + v y h b d L F g h 2 m L ] F zlr = m [ g a 2 L + v x h 2 L v y h a d L + F g h 2 m L ] F zrr = m [ g a 2 L + v x h 2 L + v y h a d L + F g h 2 m L ]
The center speed of each wheel, v i ( i = lf , rf , lr , rr ) , is:
{ v lf = ( v x 0.5 d γ ) cos δ + ( v y + a γ ) sin δ v rf = ( v x + 0.5 d γ ) cos δ + ( v y + a γ ) sin δ v lr = v x 0.5 d γ v rr = v x + 0.5 d γ
The rotation dynamics equation of each wheel is:
J w i w i = F x i R T b i
Each wheel slip rate, λ i ( i = lf , rf , lr , rr ) , is:
λ i = R ω i v i v i × 100 %
where v x is the longitudinal velocity of the vehicle; v y is vehicle lateral speed; F x i ( i = lf , rf , lr , rr ) (lf stands for left front wheel; rf stands for right front wheel; lr stands for left rear wheel; rr stands for right rear wheel, and the subsequent meanings of the same angle mark are uniform) is the longitudinal force of each wheel; F y i ( i = lf , rf , lr , rr ) is the lateral force of each wheel; F z i ( i = lf , rf , lr , rr ) is the vertical load of each wheel; γ is vehicle yaw angle velocity; δ is the angle of the left front wheel and the right front wheel; α i ( i = lf , rf , lr , rr ) is the lateral deviation angle of each wheel tire; m is vehicle mass; a, b, are the distances from the center of mass Ob of the vehicle along the longitudinal direction of the Xb axis to the front and rear wheel rotating shafts, respectively; L = a + b is the wheelbase of the vehicle along the transverse direction of Yb axis; Izb is the moment of inertia of the vehicle about the Zb axis; Fg is vehicle air resistance; h is the height of vehicle center of mass above the ground; R is the wheel radius; w i ( i = lf , rf , lr , rr ) is the rotational angular velocity of each wheel; J w i ( i = lf , rf , lr , rr ) is the moment of inertia of each wheel; and T b i ( i = lf , rf , lr , rr ) denotes the braking torque of each wheel.

3.2. Tire Model

The tire model is expressed by the MF tire formula, which can be expressed as [19]:
F ( x ) = D sin { C arctan [ B ( x + S h ) ( 1 E ) + E arctan ( B X ) ] } + S v
When calculating the longitudinal force, the expression of the relevant variables is:
{ D = b 1 F z 2 + b 2 F z C = b 0 B = ( b 3 F z 2 + b 4 F ) / [ C D exp ( b 5 F z ) ] S h = b 9 F z + b 10 S v = 0 E = b 6 F z 2 + b 7 F z + b 8
When calculating the transverse force, the expression of the relevant variable is:
{ D = a 1 F z 2 + a 2 F z C = a 0 B = [ a 3 sin ( 2 arctan ( F z / a 4 ) ) × ( 1 a 5 | φ | ) ] / ( C D ) S h = a 8 φ + a 9 F z + a 10 S v = a 11 φ F z + a 12 F z + a 13 E = a 6 F z + a 7
where a i , b j ( i = 1 ~ 13 , j = 1 ~ 10 ) are the corresponding tire intrinsic coefficients.

3.3. Battery Model

The internal resistance model is adopted for the battery model [20]. According to Kirchhoff’s law, the voltage balance equation can be expressed as follows:
U b = E b I b R b
Battery SOC value is the ratio of the remaining battery capacity to the total battery capacity, which can be expressed as follows:
S O C = ( A h max A h used ) /   A h max
where E b is the terminal voltage of the battery pack; I b is the battery string curve current; R b is the internal resistance of battery pack; U b is the open-circuit voltage of the battery string; A h max is the total battery capacity; and A h used is the battery capacity consumption.

3.4. Powertrain Model

Motor torque response usually has a hysteresis phenomenon. When the target motor torque T mc is known, the actual output torque T m of the motor can be expressed as follows:
T m · = T mc T m τ
The power demand of the driving motor can be expressed as follows:
P m = T m · w m · η m sgn ( T m · w m )
The maximum regenerative braking torque T reg provided by the motor can be shown as follows [21]:
T reg = { 9549 P e / n e ; n n e 9549 P e / n ; n > n e
The deceleration and torsional increase characteristics of the single speed ratio main reducer can be expressed as follows:
{ w g - out = w m i T g - out = T m i μ 1
where τ is the motor torque lag time; w m is the speed of the driving motor; η m is the driving motor assembly efficiency; sgn is a sign function, with the value of ± 1 , indicating that the driving motor is in the driving state or the braking state; n e is the rated speed of the motor; P e is the rated power of the motor; n is the actual speed of the motor; i is speed ratio of reducer; μ 1 is the reducer efficiency; w g - out is the output speed of the reducer; and T g - out is the output torque of the reducer.

3.5. Braking System Model

According to the ideal curve of pedal displacement and brake master cylinder oil pressure of an electric booster, the relationship between brake master cylinder oil pressure P c and brake pedal displacement X can be fitted as follows [22]:
P c = { 0.0237 x 2 0.0335 x 0.0957 0 x > 2.8 x 2.8
The increasing/decreasing/retaining pressure characteristics P w of the brake wheel cylinder are as follows:
d P w d t = 1 C e 1 R e 1 ( P c - P w ) k 1
d P w d t = 1 C e 2 R e 2 ( P w - P r ) k 2
d P w d t = 0
where Pr is the accumulator pressure, which can be neglected. The values of Ce1, Re1, Ce2, Re2, k1, k2, and other parameters [23] are shown in Table 1 below:
The braking torque of the brake wheel cylinder is:
T b = μ b r b 4 π ( d w ) 2 ( P w P 0 ) ( t τ )
where μ b is the efficiency factor; r b is the effective radius of braking wheel action; d w is the effective radius of piston of brake wheel cylinder; P 0 is prepressure of the brake wheel cylinder; and τ is the braking torque output lag time.

4. Adaptive Distribution Control Strategy of Braking Force

In order to take into account the higher energy recovery ratio, superior braking safety, and better road adhesion utilization rate, the following braking force distribution rules should be combined in the formulation of the vehicle braking force distribution strategy.
The relevant formula of curve f group with front wheel locked and rear wheel not locked is:
{ F μ 1 = ϕ G L ( b + z h ) F μ 2 = G z F μ 1
The relevant formula of curve r group whose front wheel is not locked and rear wheel is:
{ F μ 1 = G z F μ 2 F μ 2 = ϕ G L ( a z h )
The relevant formula for the curve I where the front and rear wheels are locked simultaneously is:
F μ 2 = 1 2 [ G h b 2 + 4 h L G F μ 1 ( G b h + 2 F μ 1 ) ]
The relevant formula for curve ECE where front wheel is locked and rear wheel is not locked is:
{ F μ 1 = z + 0.07 0.85 G L ( b + z h ) F μ 2 = G z F μ 1
The relevant formula for curve ECE where the front wheel is not locked and the back wheel is locked is:
{ F μ 1 = G z F μ 2 F μ 2 = z + 0.07 0.85 G L ( a z h )
where Fμ1 is the front wheel braking force; Fμ2 is the braking force of the rear wheel; G is the weight of the vehicle; z is braking strength; and ϕ is the road adhesion coefficient.
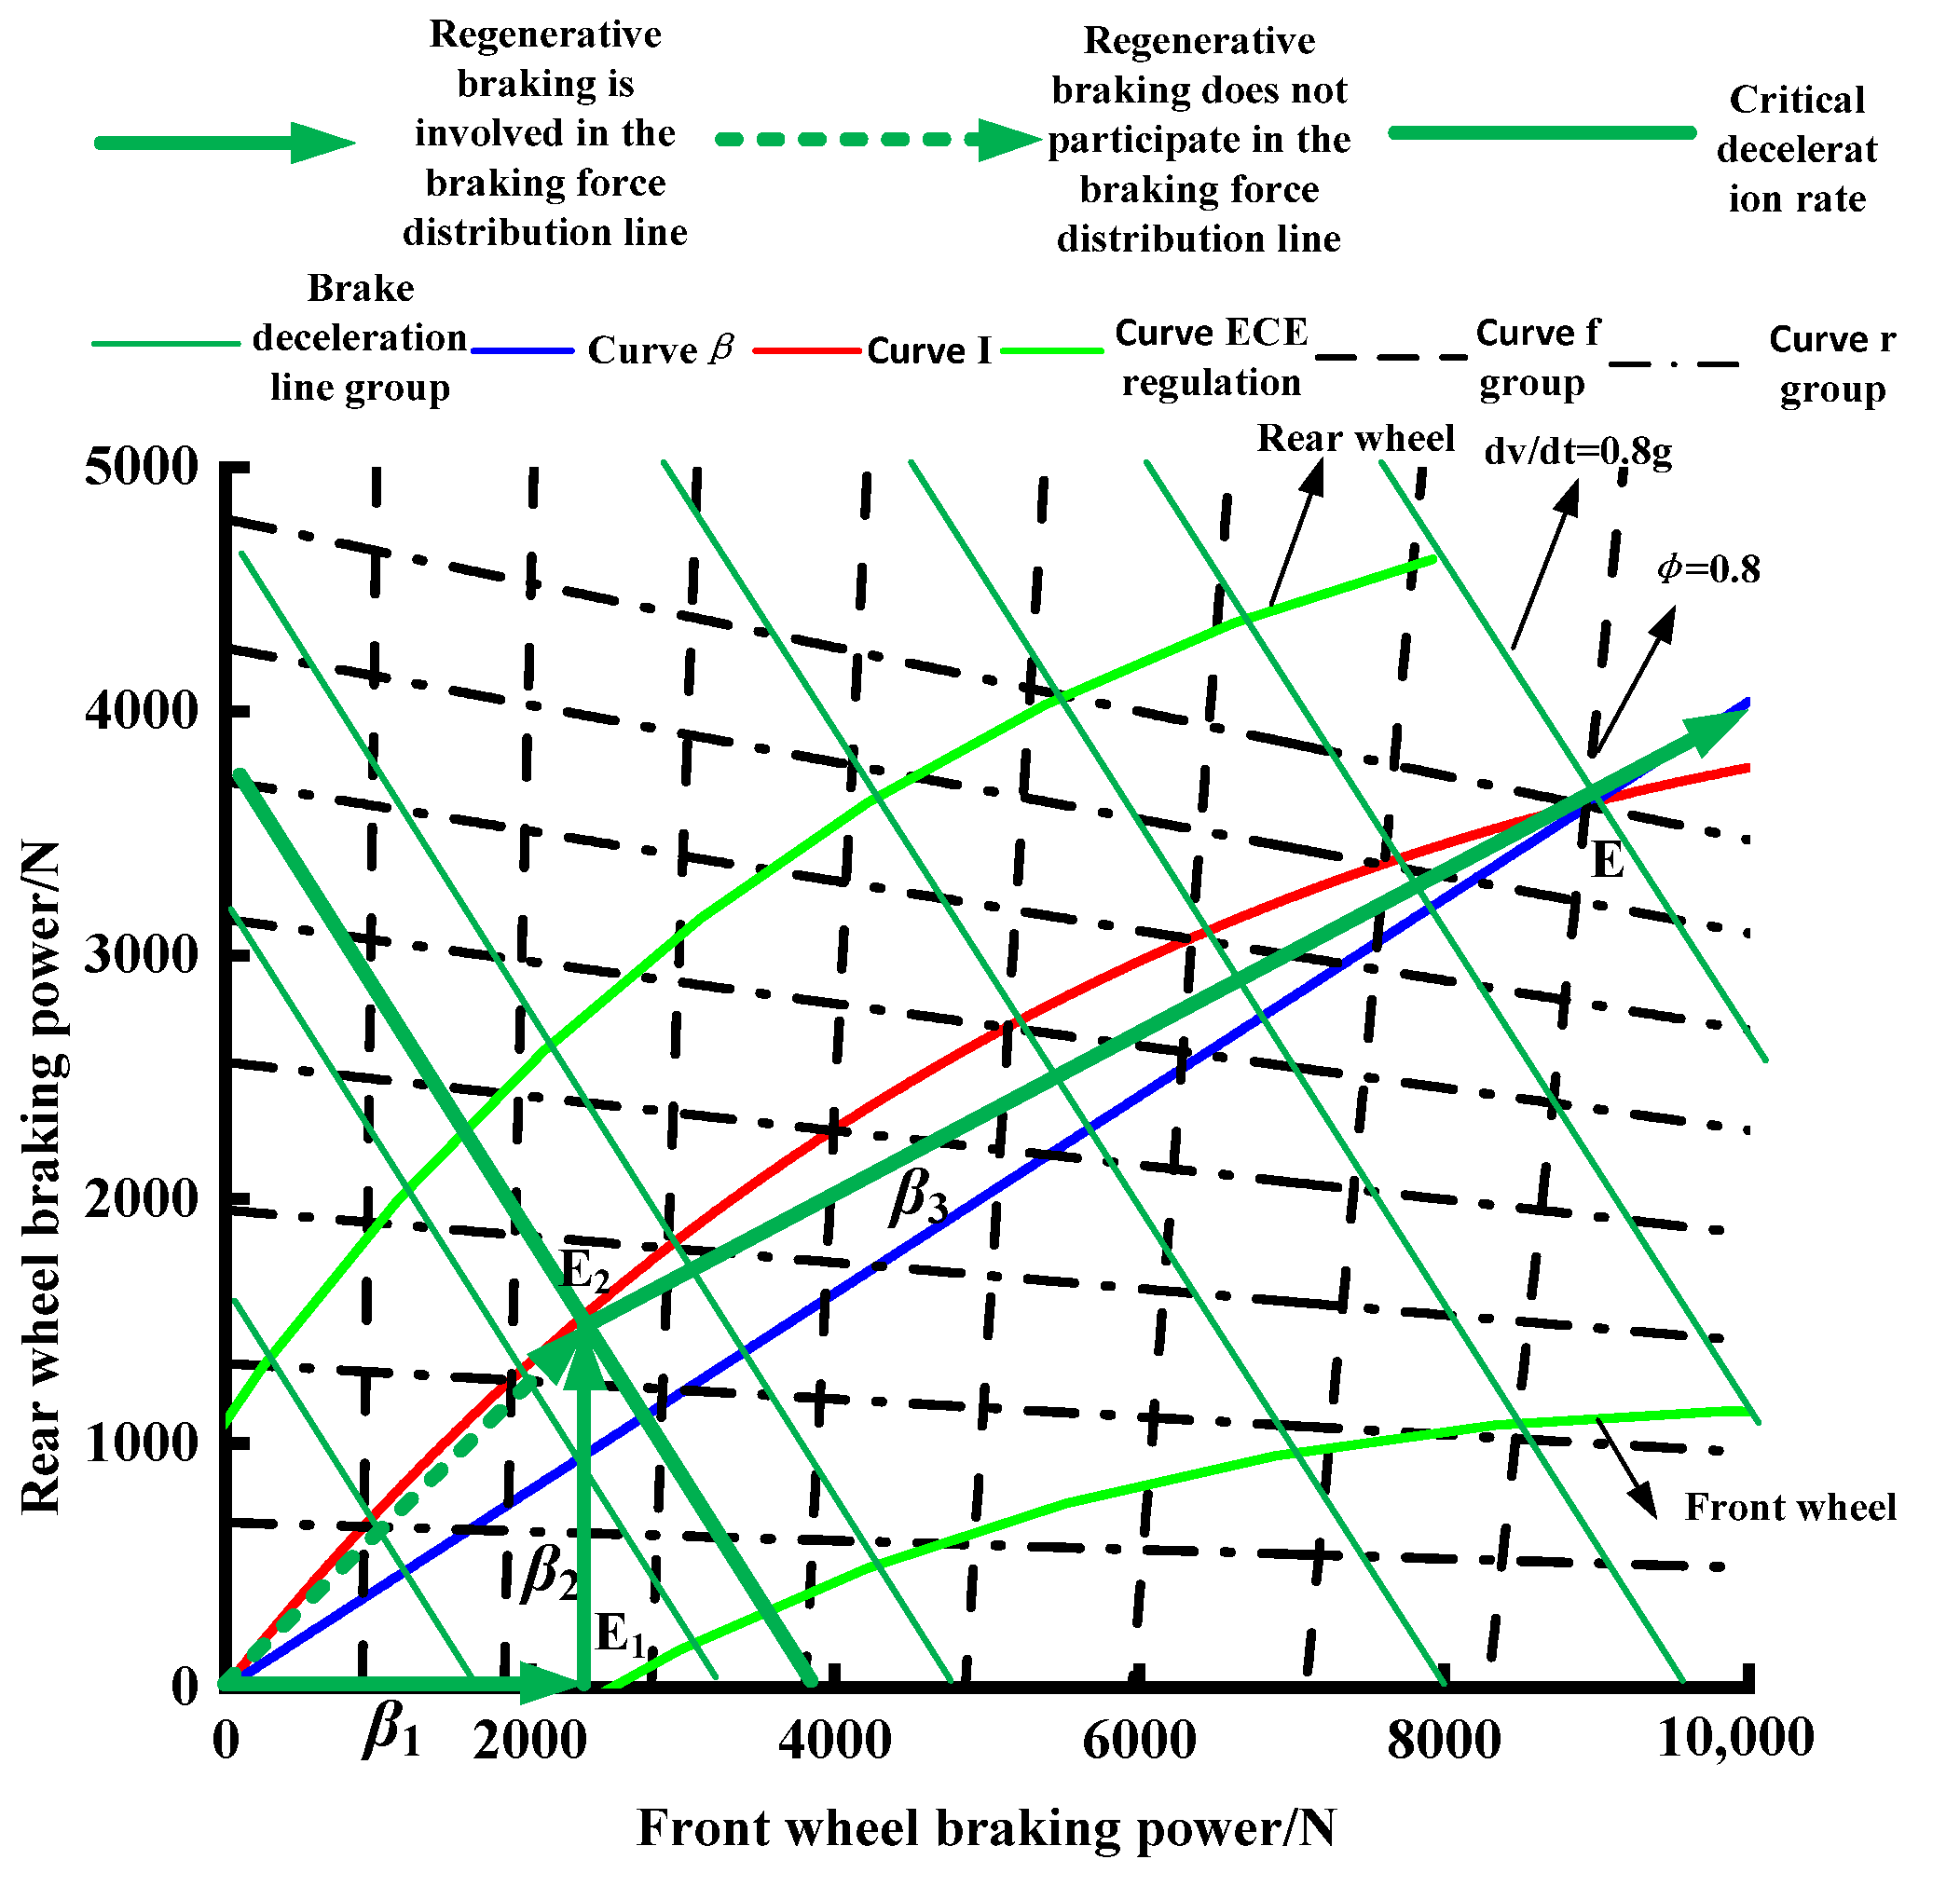
The braking force distribution of the vehicle under a fixed load of 1.6 T of the vehicle’s curb mass is shown in Figure 5 below.
Under different road adhesion coefficients and braking strengths, the curve β will deviate from the curve I greatly, and it is difficult to take into account the higher energy recovery ratio, superior braking safety, and better road adhesion utilization. Considering the control cost, difficulty, and other factors, and based on the characteristics of variable ratio braking force distribution, the key difficulty lies in how to choose the turning point with a higher degree of adaptation to achieve the vehicle braking force distribution curve approximating curve I under a certain fixed load. Therefore, this paper proposes to design a front and rear wheel braking force distribution curve by using the intersection point of curve β and curve I (expected point E), namely, the synchronous adhesion coefficient point, combining with the maximum regenerative braking force point of the driving motor and the mapping of point of E1 on curve I, as well as point E2, as shown in Figure 5.
The braking force distribution mode is selected according to the maximum road adhesion coefficient, which is OE1E2E orientation or OE2E orientation. On medium or high adhesion roads, when the braking force distribution curve is close to curve I, a high energy recovery ratio should be taken into account. The braking force distribution ratio is OE1E2E orientation: when braking deceleration is located in OE1, the corresponding braking force is provided by the front wheel. When the braking deceleration is located in E1E2, the rear wheel braking force is distributed according to the second fixed distribution coefficient β2. When the braking deceleration is located within E2E, the front and rear wheel braking forces are distributed according to the first fixed distribution coefficient β1. For low adhesion road surfaces or extreme road surfaces, the braking force distribution curve should be infinitely close to the curve I, and the braking force distribution ratio should be the OE2 orientation; when the braking deceleration is located in OE2, the front and rear braking forces are distributed according to the third fixed distribution coefficient β3.
Among them, the first fixed distribution coefficient β1, the second fixed distribution coefficient β2, and the third fixed distribution coefficient β3 are determined by the following formulas:
β 1 = y E y E 2 x E + y E x E 2 y E 2
β 2 = y E 2 y E 1 x E 2 + y E 2 x E 1 y E 1
β 3 = y E 2 x E 2 + y E 2
where x E , y E are the coordinates of point E; x E 1 , y E 1 is the coordinate of E1 point; and x E 2 , y E 2 are the coordinates of E2.
The braking deceleration corresponding to the E1 point was defined as the critical point of mild braking (0.152 g). Point E2 was used as a parallel curve to the braking deceleration curve group, and this parallel curve was defined as the moderate braking critical point (0.245 g). This is performed by making a curve parallel to the braking deceleration curve group through the E2 point, and defining the parallel curve as the critical point of medium braking (0.245 g). Therefore, the deceleration area of the vehicle where the light braking is located can be 0 < du/dt ≤ 0.152 g, the moderate braking can be 0.152 g < du/dt ≤ 0.245 g, and the high-intensity braking can be du/dt > 0.245 g. Combined with the SOC value of the vehicle, the corresponding front and rear wheel braking force distribution principle is shown in Figure 6.
The front wheel braking force is the sum of the motor regenerative braking force and the front wheel hydraulic braking force. When the vehicle speed is low, the speed correction factor is generally used to describe the process in which the front wheel hydraulic braking force gradually replaces the motor regenerative braking force. The speed correction factor k 1 can be expressed as:
k 1 = { 0 ; w m 38.5   rad / s w m 38.5 76.5 ; 38.5   rad / s < w m 115   rad / s 1 ; w m > 115   rad / s
When the SOC value of the automobile battery is high, the SOC correction factor can be used to describe whether the SOC value of the vehicle reaches the upper limit, which can be used as a sign to enable the regenerative braking function of the motor. The speed correction factor k 2 can be expressed as:
k 2 = { 1 ; S O C 0.88 50 ( 0.9 S O C ) ; 0.88 < S O C 0.9 0 ; S O C > 0.9
Therefore, under the regenerative braking torque T reg of the motor, the regenerative braking force provided to the wheel can be modified as follows:
F reg = T reg i η 1 k 1 k 2 R
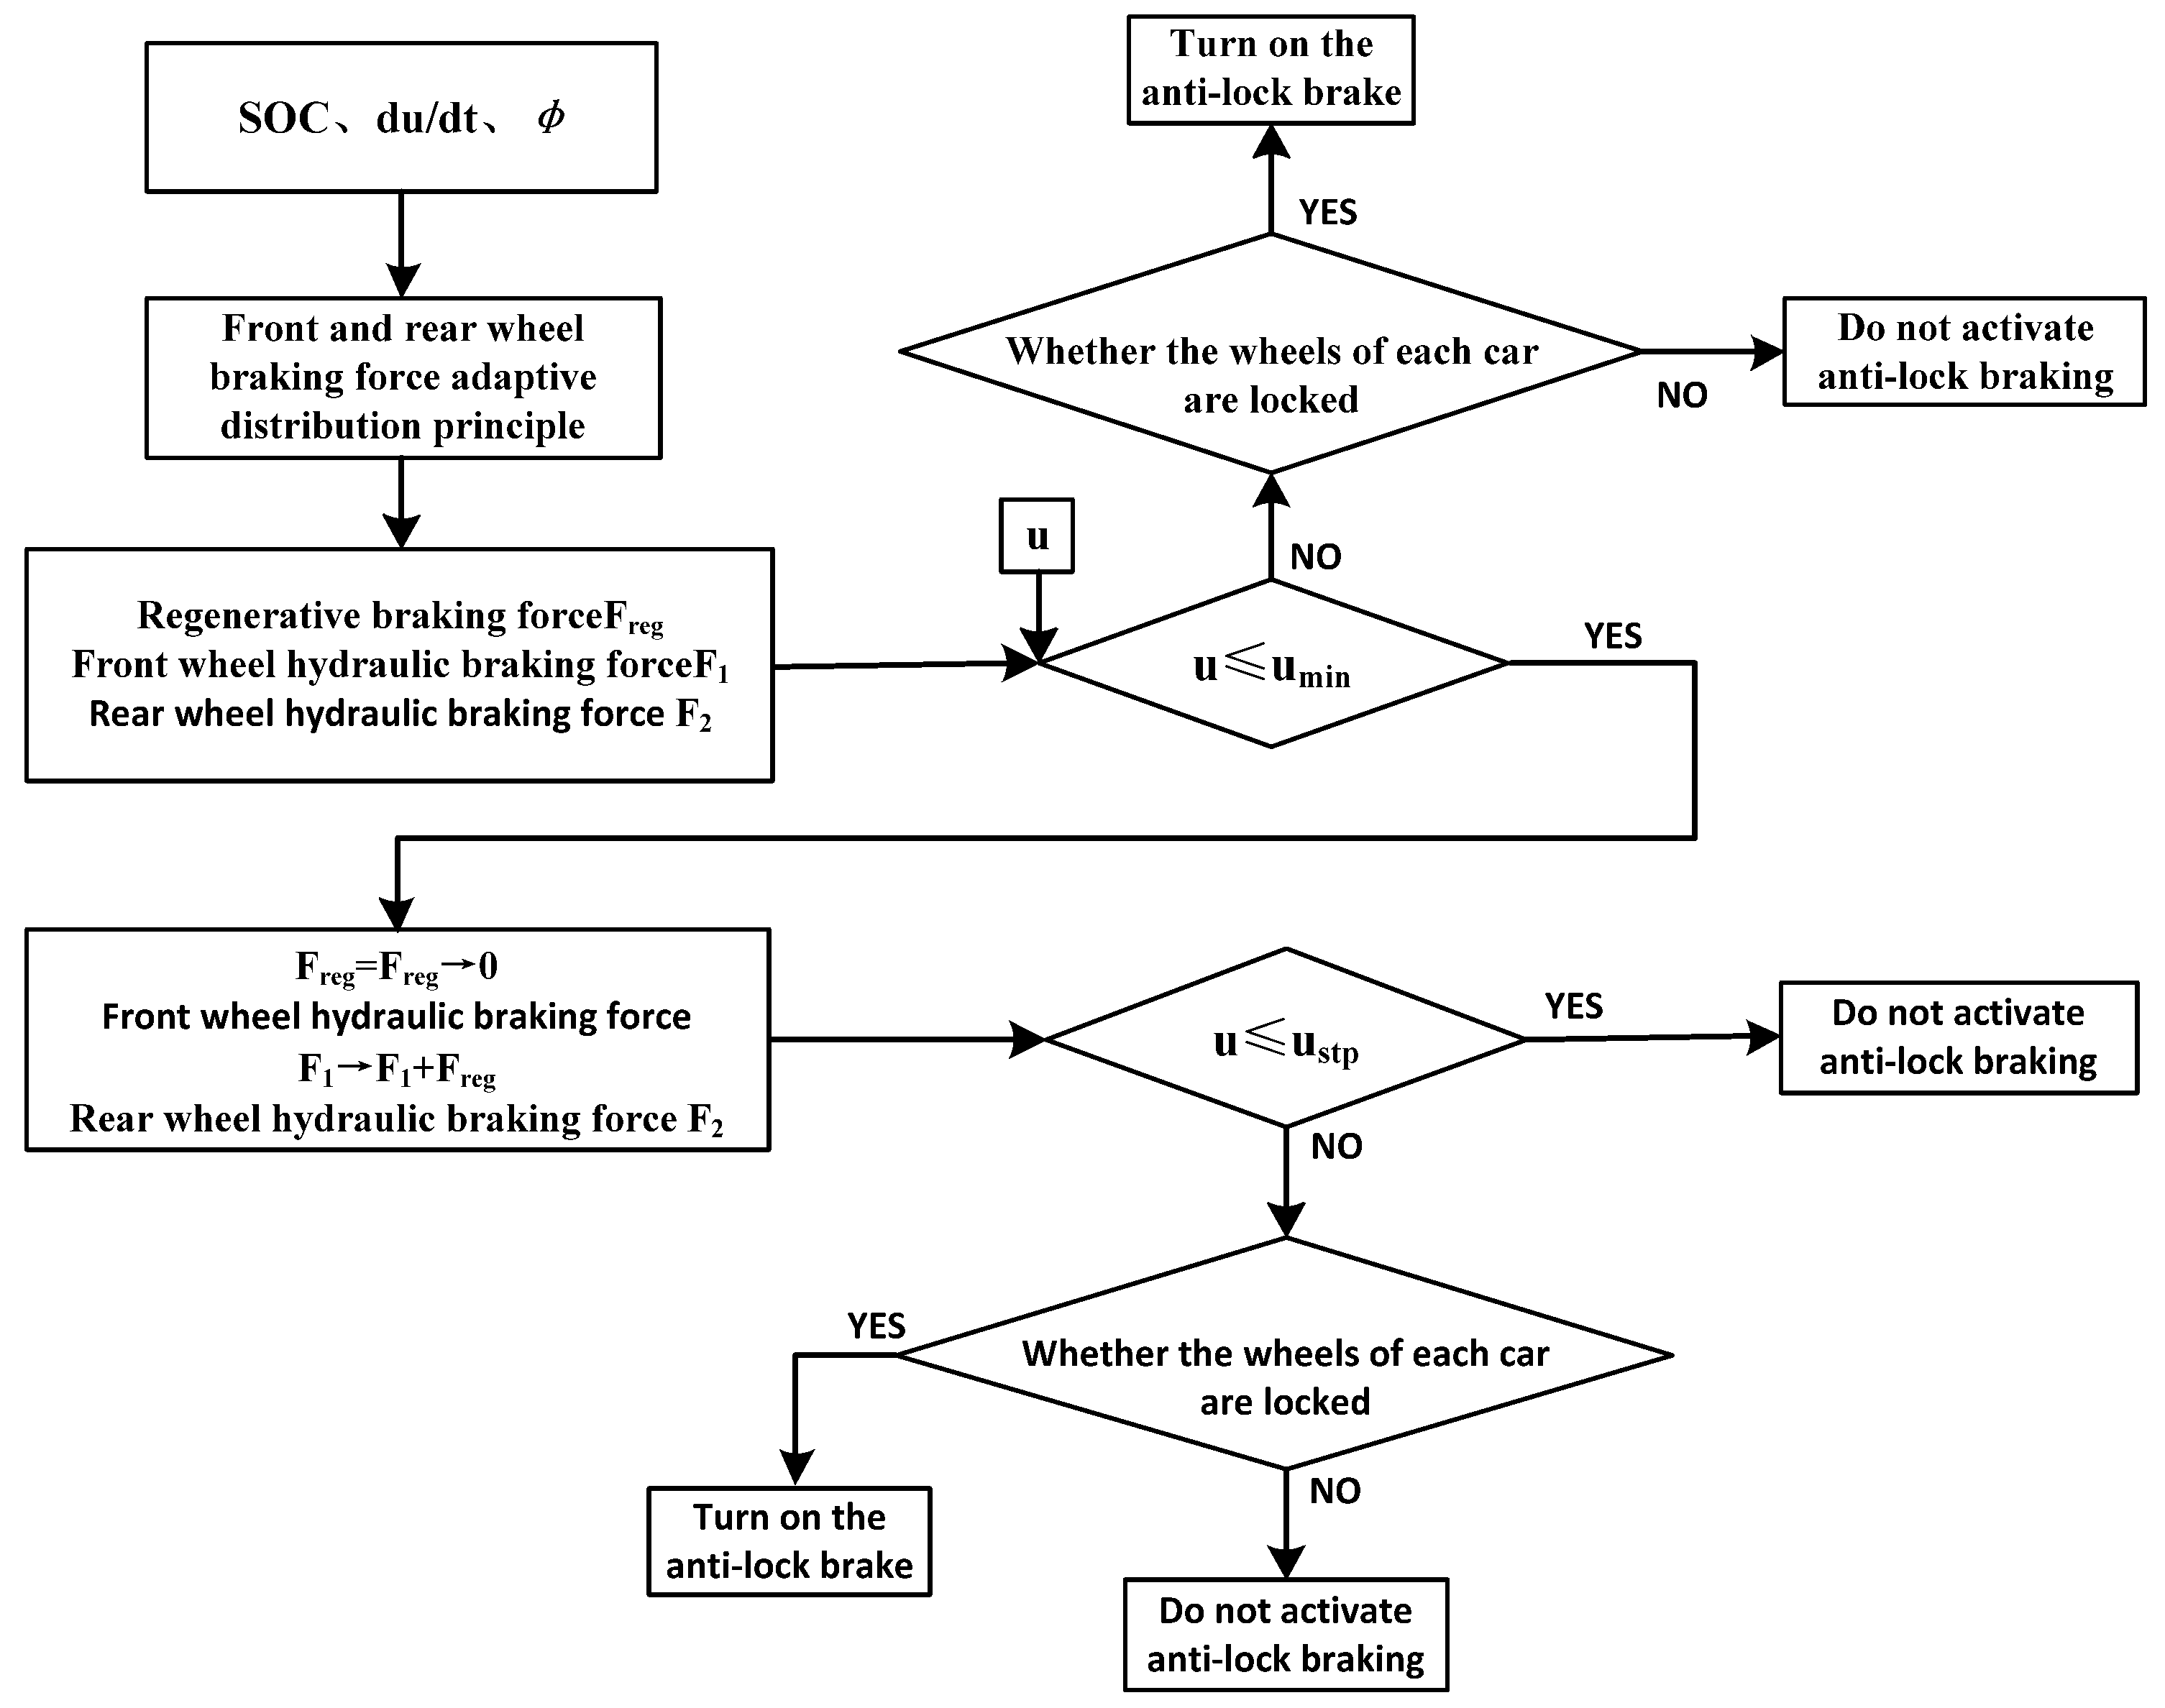
Therefore, based on the above adaptive braking force distribution principle of the front and rear wheels, combined with the vehicle speed and anti-lock requirements of each wheel, the adaptive braking force distribution control strategy is formulated.
As shown in Figure 7, u is vehicle speed and umin and ustp are critical regeneration speed (15 km/h) and critical stopping speed (5 km/h). These are used to determine whether the wheel is locked is based on the optimal slip rate under the corresponding working conditions.

5. Simulation Analysis

5.1. Vehicle Parameters

Based on the above vehicle dynamics model, in order to verify the proposed braking force adaptive allocation control strategy, this paper established its simulation model on the MATLAB/Simulink platform, and the basic parameters of the vehicle simulation adopted are shown in Table 2.

5.2. Simulation Results of NEDC and NYCC Cycle Conditions with High Attachment

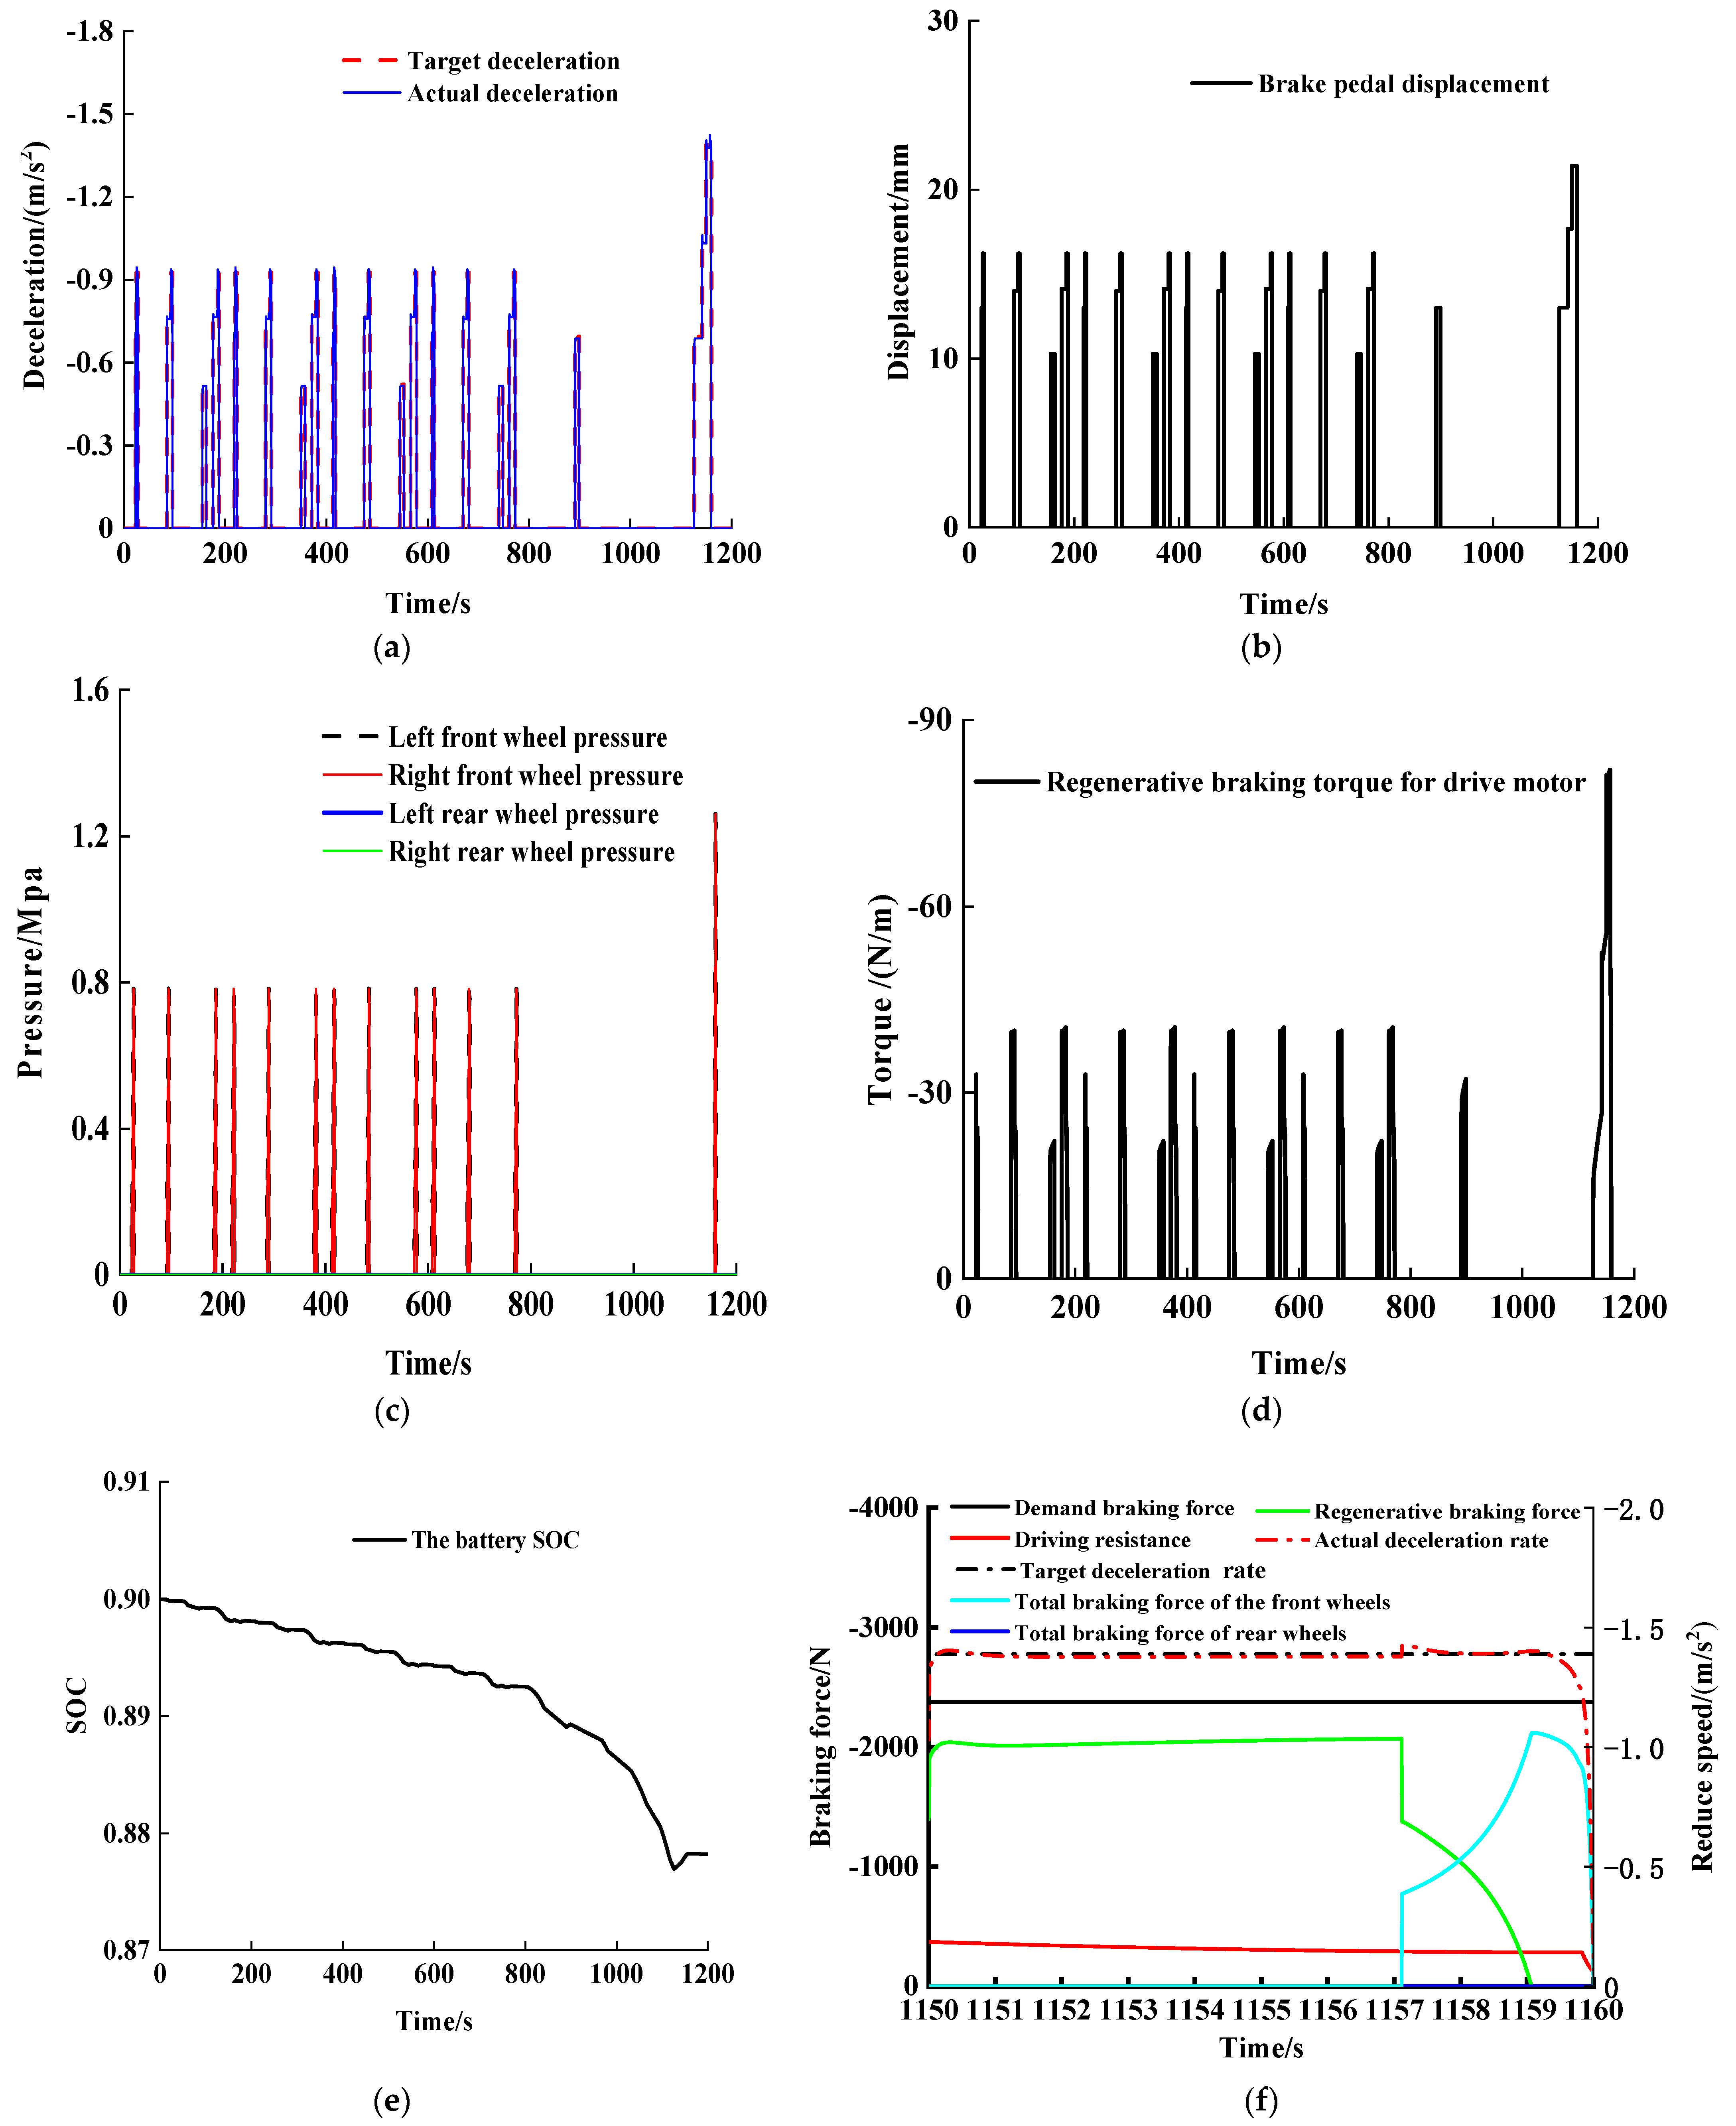
The NEDC and NYCC cycle conditions of high adhesion road surface (with regenerative braking function involved in light braking and moderate braking) were respectively simulated and analyzed, and the results are shown in Figure 8 and Figure 9, below. In the NEDC cycle condition, the initial SOC of the battery is 0.9. The braking behavior of the vehicle is light braking, and the corresponding brake pedal displacement is shown in Figure 8a. The maximum brake pedal displacement is 21.4 mm. The braking deceleration is less than or equal to 0.152 g. The regenerative braking torque of the driving motor is sufficient for service braking, and the maximum regenerative braking torque is 82 N·m, which is less than the maximum regenerative braking torque of the driving motor. The deceleration of the whole vehicle can track the target value well and meet the target braking demand of the vehicle driver. A typical braking process period of 1150 s to 1160 s is selected, as shown in Figure 8f. The regenerative braking torque of the driving motor can meet the braking requirements in the early stage of braking. However, since the vehicle needs to slow down to stop, the vehicle braking recovery function at the speed of 15 km/h requires the whole vehicle friction torque to gradually replace the regenerative braking torque, and the front wheel generates braking pressure to gradually replace regenerative braking torque.
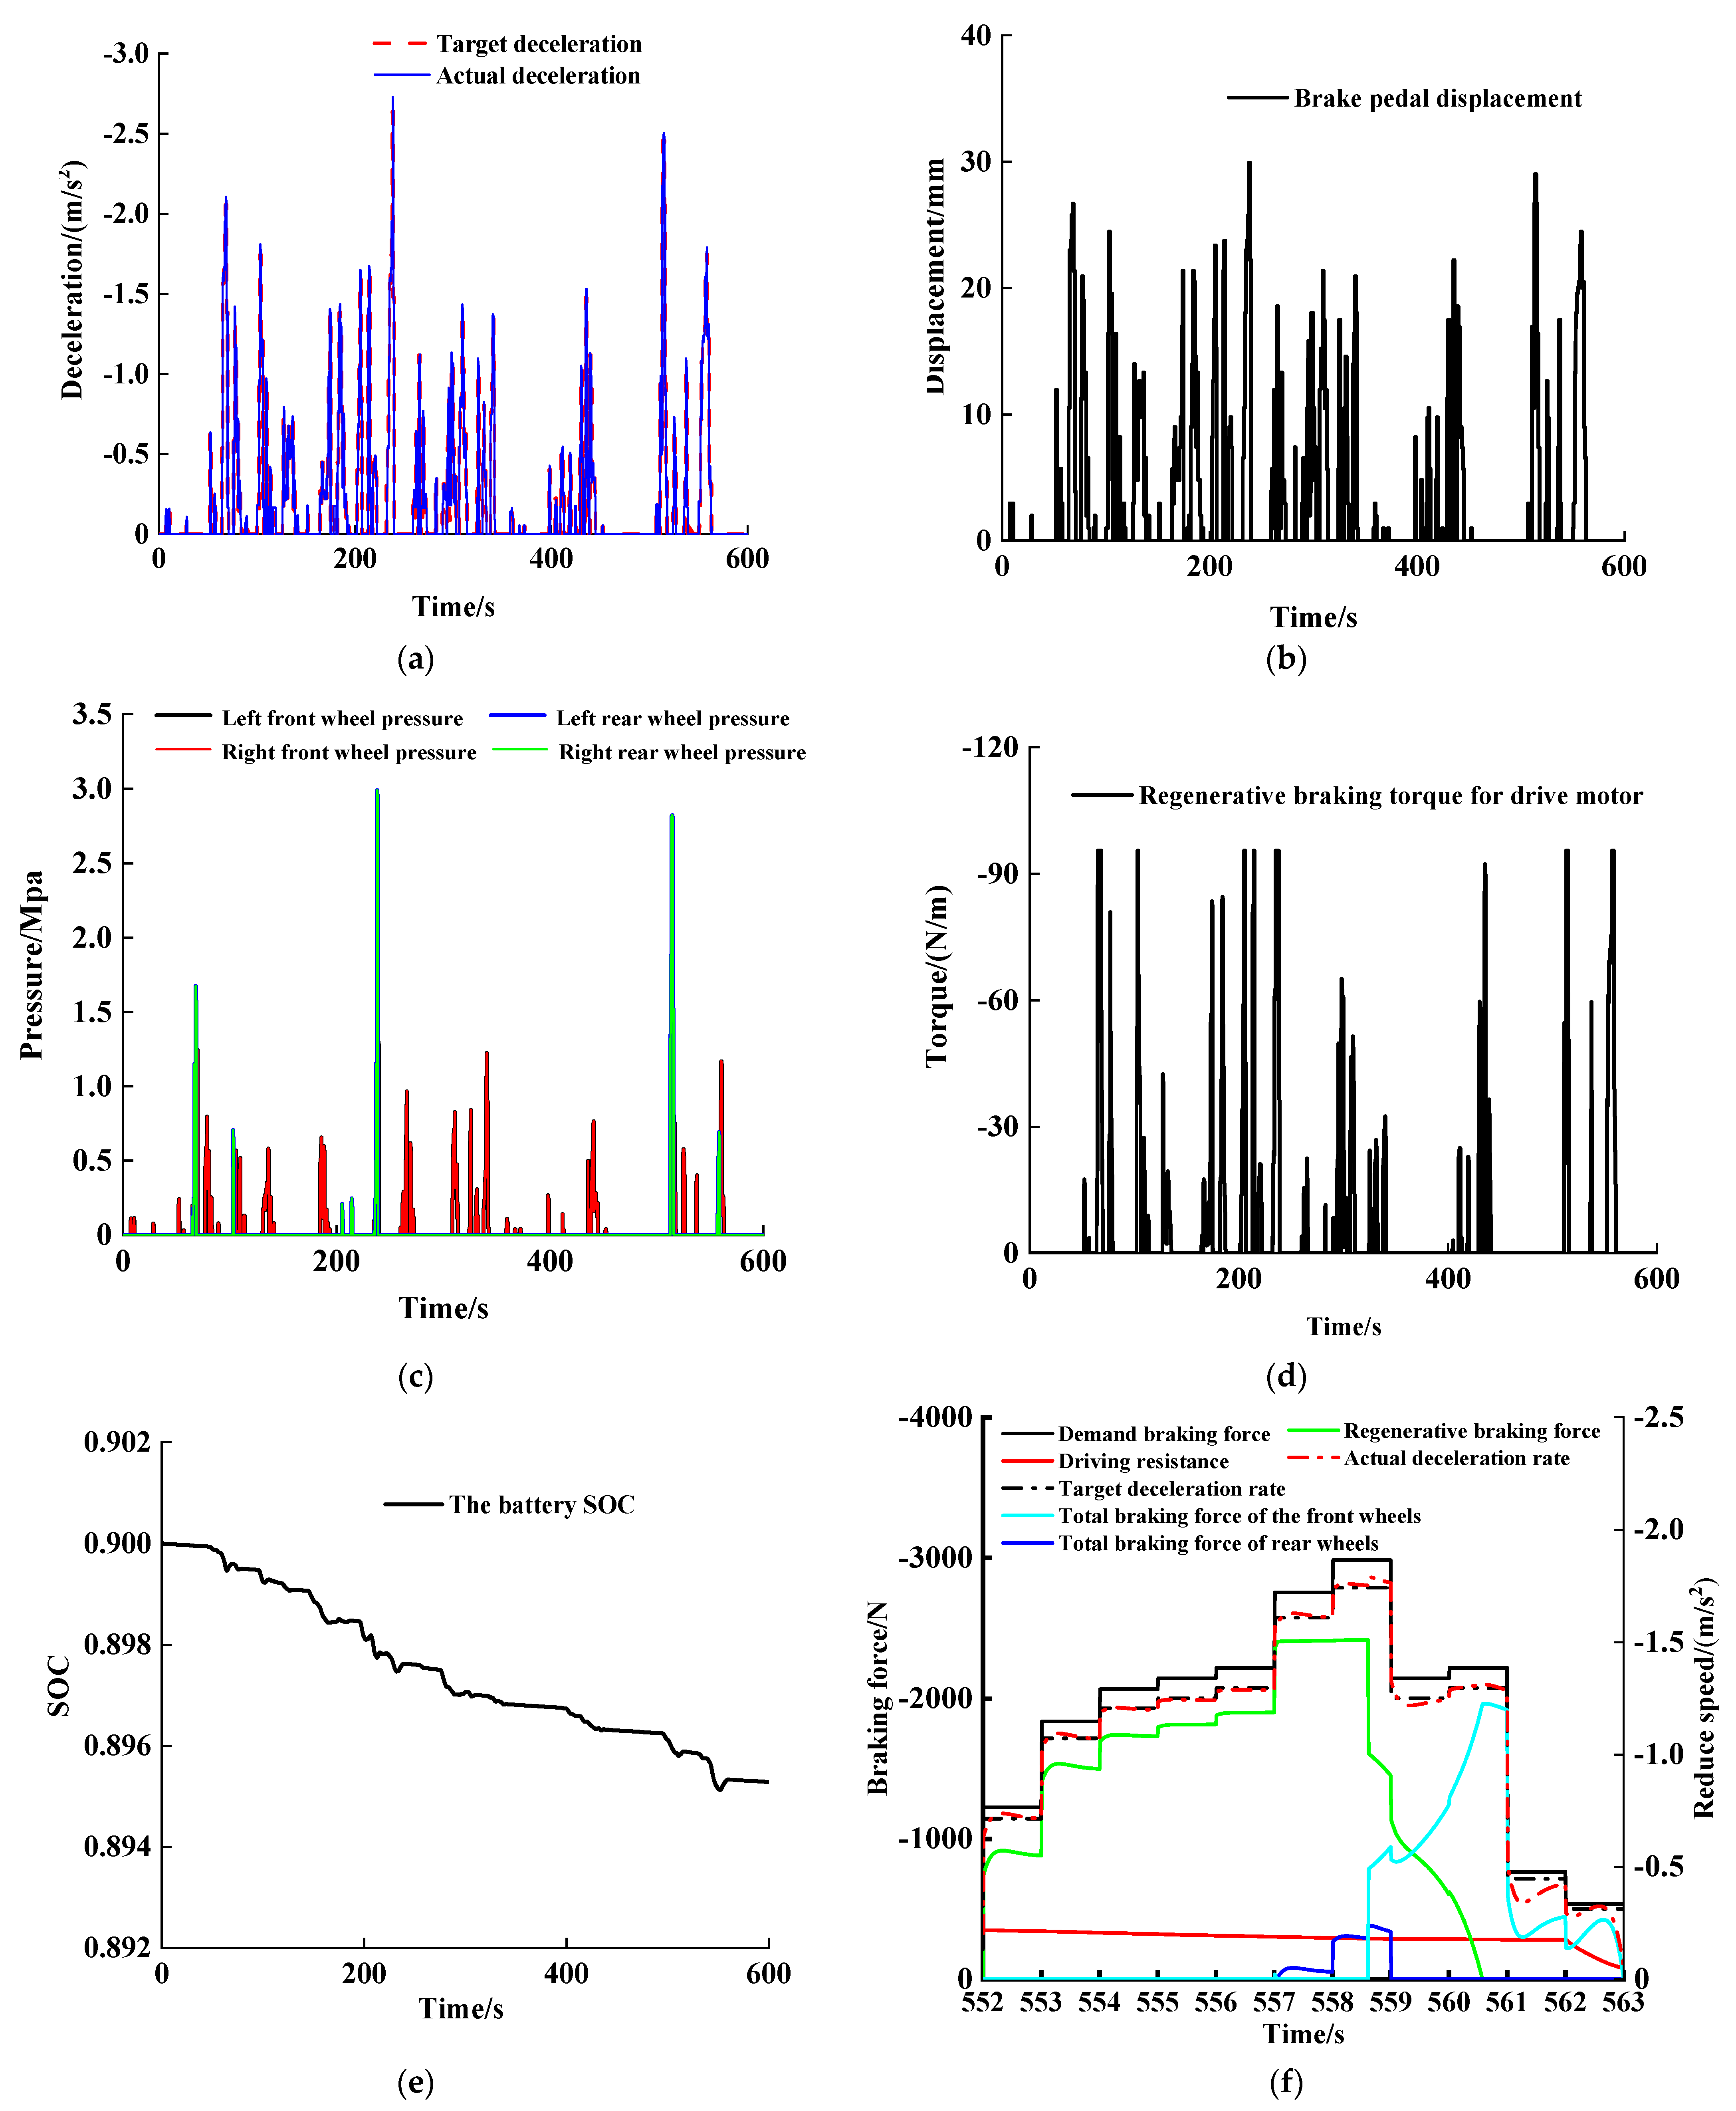
In NYCC cycle conditions, the braking behavior of the vehicle involves light braking, medium braking, and high-intensity braking. The corresponding brake pedal displacement is shown in Figure 9a, and the maximum brake pedal displacement is 30 mm. The maximum braking deceleration is 2.64 m/s2, and about 3.96% of braking conditions have braking deceleration greater than 0.152 g, which is the threshold of mild braking. In these conditions, the regenerative braking torque of the driving motor is not enough to maintain the service braking. The period of continuous braking to stopping within 552~563 s is selected for analysis, as shown in Figure 9f. The system before 557 s is mild, and the regenerative braking torque of the driving motor can provide all braking torque. After that, it is medium braking; the vehicle speed will be lower than 15 km/h at 558.5 s, and the front wheel friction braking torque will gradually replace the regenerative braking torque of the driving motor until the vehicle speed is reduced to 5 km/h, when the regenerative braking function is completely withdrawn.
In order to further quantify the specific situation of regenerative braking energy recovery of the vehicle regenerative braking and anti-lock braking integrated control strategy proposed in this paper, the kinetic energy of the vehicle braking is calculated and compared with the electric energy stored by the battery. The calculation formula is as follows:
E 1 = 1 2 m ( v 1 2 v 0 2 )
E 2 = 0 t U b f I bf d t
where E 1 is the total braking energy under a certain braking demand; E 2 is the braking energy actually recovered by the battery under a certain braking demand; v 1 is the final velocity under a certain braking demand; v 0 is the initial speed under a certain braking demand; and U bf is the open circuit voltage when a certain braking demand is delegated. I bf is the discharge current under a certain braking demand.
The results of vehicle braking energy recovery are shown in Table 3, below.

5.3. Simulation Results of Extremely Low Adhesion Road Surface

An extreme ice-covered pavement with an adhesion coefficient of 0.1 is simulated. According to analysis, the control interval of the slip rate is 0.01–0.05, and the optimal slip rate is 0.03 [24]. The vehicle speed is 30 km/h, and the braking deceleration speed is 0.12 g. The results are shown in Figure 10.
Under the condition of road adhesion, the front and rear wheels of the vehicle have the risk of locking. To ensure the braking safety, the regenerative braking function is closed. This strategy can adjust the pressure according to the optimal slip rate control interval of 0.15~0.19 to ensure that the four wheels of the vehicle at a speed above 5 km/h will not be locked, so that the vehicle can maximize the use of road adhesion for braking, greatly improve the braking safety of the vehicle, and prevent the wheel and tire from sliding when driving.

5.4. Braking Force Distribution Results

Through the analysis of other braking deceleration conditions, combined with the above NEDC, NYCC, and extreme low adhesion road conditions of front and rear wheel braking force distribution, the corresponding vehicle braking force distribution is shown in Figure 11, below.
It can be seen from Figure 11 that the braking force distribution of the vehicle can be reasonably distributed according to the expected distribution mode. The braking force distribution point of the vehicle is closer to curve I under the extremely low adhesion road surface, and the braking safety is also taken into account while the braking energy is recovered to the maximum extent under other working conditions.

6. Conclusions

(1) Based on the configuration scheme of a pure electric vehicle, the vehicle dynamics model is established. On the basis of curve I and ECE regulations, combined with the driver’s total braking demand, road adhesion coefficient, battery SOC, and other constraints, the adaptive distribution control strategy of braking force is formulated using the maximum regenerative braking torque and synchronous adhesion coefficient.
(2) The simulation analysis of NEDC and NYCC cycle conditions under a high adhesion road surface shows that the braking energy recovery ratios of the vehicle reach 52.62% and 47.45%, respectively. Under the premise of brake safety, the braking energy recovery of the vehicle is maximized.
(3) The simulation results under an extreme low adhesion road and high braking strength show that the braking force distribution points of the front and rear wheels of the vehicle can be effectively switched according to the adhesion coefficient of the road, which is basically consistent with curve I, ensuring the safety priority principle of vehicle braking and greatly improving the braking quality of the vehicle under extremely poor working conditions.

Author Contributions

Software, L.B.; validation, J.L. and L.B.; formal analysis, J.L. and B.F.; investigation, J.L. and B.F.; resources, J.L. and L.B.; Data curation, J.L. and L.B.; methodology, J.L., L.B. and L.H.; resources, J.L. and L.B.; supervision, J.L. and B.F.; visualization, L.B. and G.W.; writing—original draft, L.B.; writing—review and editing, Y.H. and J.Z. All authors have read and agreed to the published version of the manuscript.

Funding

The research was funded by the National Natural Science Foundation of China: 52075465; The science and technology innovation Program of Hunan Province: 2020RC4038; the National Natural Science Foundation of China: 52105069; the China Postdoctoral Science Foundation: 2021M703787; the Outstanding Youth Fund of Hunan Provincial Department of Education: 21B0106.

Institutional Review Board Statement

No applicable.

Informed Consent Statement

Not applicable.

Data Availability Statement

The data are available from the authors upon reasonable request.

Conflicts of Interest

The authors declare no conflict of interest.

References

  1. Kwon, K.; Minsik, S.; Seungjae, M. Efficient multi-objective optimization of gear ratios and motor torque distribution for electric vehicles with two-motor and two-speed powertrain system. Appl. Energy 2020, 259, 114190. [Google Scholar] [CrossRef]
  2. Wang, F.; Zhang, J.; Xu, X.; Cai, Y.; Zhou, Z.; Sun, X. A comprehensive dynamic efficiency-enhanced energy management strategy for plug-in hybrid electric vehicles. Appl. Energy 2019, 247, 657–669. [Google Scholar] [CrossRef]
  3. Xu, X.; Zhao, J.; Zhao, J.; Shi, K.; Dong, P.; Wang, S.; Liu, Y.; Guo, W.; Liu, X. Comparative study on fuel saving potential of series-parallel hybrid transmission and series hybrid transmission. Energy Convers. Manag. 2022, 252, 114970. [Google Scholar] [CrossRef]
  4. Xiao, B.; Lu, H.; Wang, H.; Ruan, J.; Zhang, N. Enhanced Regenerative Braking Strategies for Electric Vehicles: Dynamic Performance and Potential Analysis. Energies 2017, 10, 1875. [Google Scholar] [CrossRef] [Green Version]
  5. Ruan, J.; Walker, P.; Watterson, P.; Zhang, N. The dynamic performance and economic benefit of a blended braking system in a multi-speed battery electric vehicle. Appl. Energy 2016, 183, 1240–1258. [Google Scholar] [CrossRef]
  6. Geraee, S.; Mohammadbagherpoor, M.; Shafiei, M.; Valizadeh, M.; Montazeri, F.; Feyzi, M.R. Regenerative braking of electric vehicle using a modified direct torque control and adaptive control theory. Comput. Electr. Eng. 2018, 69, 85–97. [Google Scholar] [CrossRef]
  7. Qin, Y.; Tang, X.; Jia, T.; Duan, Z.; Zhang, J.; Li, Y.; Zheng, L. Noise and vibration suppression in hybrid electric vehicles: State of the art and challenges. Renew. Sustain. Energy Rev. 2020, 124, 109782. [Google Scholar] [CrossRef]
  8. Yu, Z. Automobile Theory; Mechanical Industry Press: Beijing, China, 2018; pp. 134–142. [Google Scholar]
  9. Lian, Y.; Zhao, Y.; Hu, L.; Tian, Y. Longitudinal collision avoidance control of electric vehicles based on a new safety distance model and constrained-regenerative-braking-strength-continuity braking force distribution strategy. IEEE Trans. Veh. Technol. 2015, 65, 4079–4094. [Google Scholar] [CrossRef]
  10. Wang, C.; Zhao, W.; Li, W. Braking sense consistency strategy of electro-hydraulic composite braking system. Mech. Syst. Signal Process. 2018, 109, 196–219. [Google Scholar] [CrossRef]
  11. Xu, G.; Li, W.; Xu, K.; Song, Z. An Intelligent Regenerative Braking Strategy for Electric Vehicles. Energies 2011, 4, 1461–1477. [Google Scholar] [CrossRef] [Green Version]
  12. Ma, Z.; Sun, D. Energy recovery strategy based on ideal braking force distribution for regenerative braking system of a four-wheel drive electric vehicle. IEEE Access 2020, 8, 136234–136242. [Google Scholar] [CrossRef]
  13. Kumar, C.N.; Subramanian, S.C. Cooperative control of regenerative braking and friction braking for a hybrid electric vehicle. Proceedings of the Institution of Mechanical Engineers. J. Automob. Eng. 2016, 230, 103–116. [Google Scholar] [CrossRef]
  14. Li, S.; Yu, B.; Feng, X. Research on braking energy recovery strategy of electric vehicle based on ECE regulation and I curve. Sci. Prog. 2020, 103, 0036850419877762. [Google Scholar] [CrossRef] [PubMed]
  15. Lu, D.; Ouyang, M.; Gu, J. Optimal Regenerative Braking Control for Permanent Magnet Synchronous Motors in Electric Vehicles. Proc. CSEE 2013, 33, 83–91. [Google Scholar]
  16. Ko, J.; Ko, S.; Son, H.; Yoo, B.; Cheon, J.; Kim, H. Development of brake system and regenerative braking cooperative control algorithm for automatic-transmission-based hybrid electric vehicles. IEEE Trans. Veh. Technol. 2014, 64, 431–440. [Google Scholar] [CrossRef]
  17. Wei, Z.; Xu, J.; Halim, D. Braking force control strategy for electric vehicles with load variation and wheel slip considerations. IET Electr. Syst. Transp. 2017, 7, 41–47. [Google Scholar] [CrossRef]
  18. Zhang, L.; Cai, X. Control strategy of regenerative braking system in electric vehicles. Energy Procedia 2018, 152, 496–501. [Google Scholar] [CrossRef]
  19. Liang, L.I.; Gang, J.I.A.; Jian, S.O.N.G. Progress on Vehicle Dynamics Stability Control System. J. Mech. Eng. 2013, 49, 95–107. [Google Scholar]
  20. Johnson, V.H. Battery performance models in ADVISOR. J. Power Sources 2022, 110, 321–329. [Google Scholar] [CrossRef]
  21. Li, G.; Lin, Y.; He, H. Regenerative Braking Control Strategy for Electric Vehicle. Trans. Beijing Inst. Technol. 2009, 29, 520–524. [Google Scholar]
  22. Yong, J.; Gao, F.; Ding, N. Design and Validation of an Electro-Hydraulic Brake System Using Hardware-in-the-loop Real-time Simulation. Int. J. Automot. Technol. 2017, 18, 603–612. [Google Scholar] [CrossRef]
  23. Zhao, Z.; Peng, Y. Simulation on Series Electro-hydraulic Combined Braking for 4WD Hybrid Electric Car. J. Syst. Simul. 2012, 24, 208–215. [Google Scholar]
  24. Ma, Y.; Zhao, J.; Zhao, H.; Lu, C.; Chen, H. MPC-based slip ratio control for electric vehicle considering road roughness. IEEE Access 2019, 7, 52405–52413. [Google Scholar] [CrossRef]
Figure 1. The vehicle configuration scheme.
Processes 11 01152 g001
Figure 2. The electric servo booster structure. (a) Mechanical structure of electric servo booster. (b) The working states.1—input push rod; 2—cone spring; 3—nut; 4—lead rod; 5—deep groove ball bearing; 6—turbowheel; 7—power motor mounting hole; 8—worm; 9—feedback disk; 10—master cylinder push rod; 11—housing assembly; 12—return spring; 13—tandem double chamber brake master cylinder assembly.
Processes 11 01152 g002
Figure 3. The schematic diagram of hydraulic regulating unit. 1, 8, 14, 18, 25, 32—pressure sensor; 4, 16, 20, 29—one-way valve; 2, 22—relief valve; 3, 21—isolation solenoid valve; 5, 19—adjusting unit inlet solenoid valve; 7, 17, 23—electric pump; 6, 15, 24, 30—wheel cylinder inlet solenoid valve; 10, 13, 27, 31—wheel cylinder outflow solenoid valve; 11, 28—low pressure accumulator; 9, 12, 26, 33—wheel cylinder assembly.
Processes 11 01152 g003
Figure 4. Schematic diagram of seven-degree-of-freedom vehicle model of four-wheel vehicle. (a) Seven degrees of freedom vehicle model. (b) Seven degrees of freedom plane motion.
Processes 11 01152 g004
Figure 5. The braking force distribution basis diagram.
Processes 11 01152 g005
Figure 6. The adaptive distribution principle of braking force in front and rear wheels.
Processes 11 01152 g006
Figure 7. The control strategy of vehicle braking force adaptive distribution.
Processes 11 01152 g007
Figure 8. The simulation results of high adhesion NEDC cycle conditions. (a) Brake deceleration. (b) Brake pedal displacement. (c) Brake pressure. (d) Regenerative braking torque for drive motor. (e) The battery SOC. (f) Braking force distribution in 1150~1160 s.
Processes 11 01152 g008
Figure 9. The simulation results of high adhesion NYCC cycle conditions. (a) Brake deceleration. (b) Brake pedal displacement. (c) Brake pressure. (d) Regenerative braking torque for drive motor. (e) The battery SOC. (f) Braking force distribution in 552~563 s.
Processes 11 01152 g009
Figure 10. The simulation results of low adhesion road surface. (a) Speed. (b) Slip rate. (c) Braking force distribution.
Processes 11 01152 g010
Figure 11. The distribution situation of braking force distribution.
Processes 11 01152 g011
Table 1. The parameter selection of braking system.
ParameterThe NumericalParameterThe Numerical
1/(Ce1Re1)37.53421/(Ce2Re2)38.3128
k10.589k20.936
Table 2. The basic parameters of vehicle.
The Basic ParametersThe NumericalThe Basic ParametersThe Numerical
Curb weight1600 kgMaximum motor power135 Kw
Windward area2.58 m2Maximum motor speed12,000 rpm
Total battery capacity259 AhMaximum motor torque 300 N·m
Speed ratio of reducer8.55The wheel radius0.307 m
Front/rear wheel radius0.307 mEffective radius of rear wheel
action
0.11 m
Effective radius of front
wheel action
0.122 mHeight of vehicle center of mass above ground0.52 m
Distance from center of mass
to front axle
1.208 mDistance from center of mass
to rear axle
1.542 m
Table 3. The results of finite element analysis.
Comparing the ResultsDriving Cycles
NEDCNYCC
Total braking energy/kj1962.72936.99
Recoverable energy/kj1032.75444.56
Recovery of energy/%52.6247.45
Disclaimer/Publisher’s Note: The statements, opinions and data contained in all publications are solely those of the individual author(s) and contributor(s) and not of MDPI and/or the editor(s). MDPI and/or the editor(s) disclaim responsibility for any injury to people or property resulting from any ideas, methods, instructions or products referred to in the content.