Review

A Review on Observer Assistance Systems for Harvested and Protected Fish Species

1
Chief Executive Officer, Suncom Co., Ltd., Busan 46508, Republic of Korea
2
Department of Computer Software Engineering, Silla University, Busan 46958, Republic of Korea
*
Author to whom correspondence should be addressed.
Processes 2023, 11(4), 1261; https://doi.org/10.3390/pr11041261
Submission received: 13 February 2023 / Revised: 6 April 2023 / Accepted: 12 April 2023 / Published: 19 April 2023
(This article belongs to the Special Issue Big Data in Manufacturing, Biology, Healthcare and Life Sciences)

Abstract

:
Restrictions on competitive fishing activities due to the depletion of living marine resources and the monitoring of fish resources for the purpose of marine ecosystem research are supported by statistics on the protection of fish resources and ecosystem research, which are gathered through existing observer monitoring systems. However, in the case of deep-sea fishing vessels and special-purpose fishing vessels, some matters, such as collusive transactions with shipping companies and shipowners and threats toward the observer, are problematic, as observers are always active on board. Therefore, through the present study we would like to discuss the methodology and directions for research on the independent role of the observer and the methods for improving the reliability of data through systems that automate the monitoring of the acquisition of fish resources, which is expected to be a continuing problem. After an analysis of research trends for each issue related to the electronic monitoring system, future research directions are suggested on the basis of the findings, and for the research currently in progress, this paper presents the results from a prediction server and client and an image collector. In order to use these in the field in the future, as the detection method and reliability of the electronic monitoring system that can automate self-learning should be improved, we describe the image transmission technology, the image recognition technology for studying fish, and the methodology for calculating the yield.

1. Introduction

The problem of depleting living marine resources intensifies as each country develops competitive fishing activities with larger fishing boats, in addition to the rapid development of fishing technology and large-scale investments in the industry. The burden of responsibility to comply with the resource conservation and management measures of regional fisheries’ organizations has been left to the deep-sea fishing countries participating in high-seas fisheries.
The Western and Central Pacific Highly Migratory Fish Resources Conservation and Management Convention (WCPFC Convention) takes effect as a multilateral resource conservation and management system, in which the coastal countries alongside the exclusive economic zone and the deep-sea fishing countries whose nationals engage in fishing activities in the specified area of water participate. Consequently, international cooperation on conservation and the management of fish stocks across the entire migratory range has become possible. This Convention and the associated processes are based on the 1995 Agreement for the Implementation of the Provisions of the United Nations Convention on the Law of the Sea of 10 December 1982 Relating to the Conservation and Management of Straddling Fish Stock and Highly Migratory Fish Stocks (UNFSA).
Since 2007, the Western and Central Pacific Fisheries Commission (WCPFC Convention) has implemented a number of specific conservation and management measures for highly migratory fish stocks, starting with a regional observer program. In addition, procedural rules have been adopted that allow inspectors of non-shipping countries to exercise the right to inspect high-seas fishing vessels suspected of violating the fishing regulations of regional fisheries organizations under certain conditions. Such measures were adopted in accordance with the provisions of the 1995 UN Convention on the Implementation of the Regulations on the Conservation and Management of Fish Resources in the High Seas [1,2].
As a member of the WCPFC, there may be cases where Korea has to conduct on-board inspections for high-seas fishing vessels from tertiary countries, and there may also be cases where fishing vessels of Korean nationality are required to undergo on-board inspections by inspectors from tertiary countries. In carrying out boarding inspections of high-seas fishing vessels, it is necessary to comply with the requested international cooperation measures, as a member of the WCPFC, by identifying relevant matters and reviewing the agreed upon procedural rules. The management system for fisheries on the high seas is based on Article 116 of the United Nations Convention on the Law of the Sea, and Articles 63, Paragraph 2 and Articles 64 through 67 of the Convention are the relevant provisions.
In addition, specific regulations required by the WCPFC require major regional fisheries organizations to prevent and eradicate the Illegal, Unreported, and Unregulated (IUU) fishing for the purpose of conservation and management of living marine resources.
Therefore, the implementation system of Monitoring, Control, and Surveillance (MCS) includes the installation and operation of vessel monitoring systems (VMSs) for fishing vessels on the high seas, the operation of regional observer programs, the operation of port state inspection systems, and the operation of boarding inspection systems for fishing vessels on the high seas. These include the surveillance of trans-shipments at sea, preparation of harvest statistics, registration of fishing vessels, and preparation of the Illegal, Unreported, and Unregulated (IUU) fishing vessel list.
Table 1 shows the operational status of the MCS system of major regional fisheries organizations related to highly migratory fish stocks [3,4,5].
With the current WCPFC Convention having come into effect on 19 June 2004, in accordance with Article 26 (Boarding and Inspection) of the Convention, the Commission has implemented Boarding and Inspection Procedures for fishing boats operating in the high seas of the Convention area to ensure compliance with conservation and management measures.
In addition, by having signed the WCPFC Boarding and Inspection Procedures in September 2006, the agreeing parties must allow their national fishing vessel to be boarded by an observer authorized according to the procedure, and inspectors assigned to the inspection must comply with the boarding inspection procedures.
The international observer program can be divided into cases where Korean observers board foreign fishing boats and perform duties and cases where foreign observers perform duties on-board Korean fishing boats. Currently, the CCSBT, IATTC, ICCAT, etc [6,7]., are implementing observer programs, and the WCPFC has recognized the national observer program and sub-regional observer program since 2008 as part of the WCPFC regional observer program and has agreed to achieve an observer occupancy rate of up to 5%.
Korea’s coastal waters observer system has certified embarkation observers and port observers, which allows them to board fishing vessels or work at ports of landing to monitor the exhaustion of Total Allowable Catch (TAC) and the fishing status for resource management. It is a system that identifies and reports fishery resources and collects the basic data necessary for evaluating fishery resources and identifying fishing characteristics. According to their function, the observer can be classified as a science observer for the purpose of collecting scientific information, a fishery (surveillance) observer whose main purpose is to collect scientific information, but also has a monitoring purpose, and an inspector or controller that collects minimal scientific information while focusing on monitoring [8,9].
Depending on the observer duties, the types of observers in the TAC observer system include embarkation observers and port observers; however, the term ‘observers’ generally refers to the embarkation observers. The TAC observer system implemented by Korea involves having an observer at the port of landing. The port of landing observer performs observer duties such as grasping catches and collecting other scientific data at the port of landing. In 2012, the boarding request rate, which was between 5% and 200% for each flag country, increased to at least 50% and up to 200% in 2016, and the number of observers required in Korea increased rapidly from 41 in 2012 to 115 in 2016.
In addition, in the case of the Commission for the Conservation of Antarctic Marine Living Resources (CCAMLR), one international and one domestic observer are required to board the vessel during the entire fishing season, and in the Western and Central Pacific Fisheries Commission (WCPFC), where Korean tuna fishing boats operate the most, the observer boarding rate is required to achieve 5%. If observers do not comply with the required boarding rate, it is regarded as illegal fishing, making it difficult to secure quotas and raising concerns about blocking exports of catches [6].
As such, the importance and role of the observer are increasing day by day, and due to the strengthening of fishing regulations in the high seas, the demand for mandatory international observer boarding, and the appropriate boarding rate, is continuously increasing, and is centered on regional fisheries organizations.
However, there are continuous departures due to the occurrence of fatal accidents due to poor working conditions and the avoidance of activities due to the unstable contract period that prevents boarding throughout the year. The United States, Japan, and Taiwan have been nurtured by the state and have switched to private company management under state support.
The observer’s independent activities are limited due to the system in which the shipping company pays the observer’s expenses directly. Therefore, discrepancies can result. For example, in the Antarctic waters, three Korean-flagged ships were suspected of negotiating false reports and of illegal transportation, which was four to five times higher than the average level in a specific sea area, and an investigation was initiated. Although a program to comply with the correct rules is operational, the considerable efforts needed for solving problems related to the TAC investigations are limited to the observer’s uncomfortable working environment and independent activities [9].
Therefore, there is an urgent need for research on the development of a surveillance system that can remove the minimum intrusive elements from the pure scientific research aspect of the observer by satisfying the observer requirements for the TAC as directly related to the ship station.
In this paper, research on the assistance available for the observer is explained in Section 2; the methodology and design of the related systems are discussed in Section 3; the experiment and evaluation are described in Section 4; and the conclusions are given in Section 5.

2. Related Research

The systems that can assist the observer can be divided into harvest estimation and fish species estimation. The method of analyzing the degree of integration of objects among the object detection systems is representative of harvest estimation research, and the fish species estimation is performed by the ‘you only look once’ (YOLO) and single-shot detector (SSD) systems. This research is used to identify protected fish and estimate their numbers.

2.1. Harvest Estimation

Although there is no study that exactly matches the harvest estimation, similar or representative studies include the crowdsourcing paradigm [10] and the image stitching studies. The crowdsourcing paradigm makes it faster, cheaper, and easier for researchers to gather the data they need for deep learning.
Crowdsourcing can provide tremendous benefits with vast amounts of data; however, it requires specific strategies to validate the quality of the data collected. Manual data validation is not an option in this case, as it requires a lengthy process and painstaking work on huge amounts of data. To date, most validation strategies for crowdsourcing are used for categorical data [11,12,13,14,15].
In particular, validation strategies for crowdsourcing in computer vision can only be found in image classification cases [16] and object detection [17,18]. Unlike the object counting case, the currently available datasets are not constructed using a crowdsourcing paradigm. For example, the datasets of UCF CC 50 [19] and TRANCOS [20] are created by hand. As a consequence, the data collected for both datasets are not enough to train a deep learning algorithm (50 images for UCF CC 50 and 1244 images for TRANCOS).
Additionally, with respect to studies aimed at directly weighing fish, the most commonly used approach to weight estimation uses fish length as a predictor. For example, there is a study using a method of estimating this length from the contour line of a fish (Orechromis niloticus) and then treating the fish mass as a response variable [21]. Here, the body surface area of the fish (with or without fins) and the height of the fish were measured and tested on 64 images that were not used in the model fitting process, and the fish contours with and without fins reached a high mean absolute percentage error (MAPE) of 5%. A performance model is proposed, which is a similar model [22] using only length as a characteristic variable; the only comparative model achieved an MAPE = 10%, resulting in excellent results in the validation curve model. In the comparison of the contour without a fin and the case with a fin, the MAPE = 12% is highly evaluated, but there seems to be difficulty in setting the parameters. As a result, there is a 2% difference in performance improvement between the two models. Another study reported in [22] used surface area only, with an MAPE = 5–6%, and [23] applied several mathematical models to harvested Asian sea bass to improve performance.
Here, the mass is measured in grams, and the fish surface area is studied by calculating the units of cm2 on an image with a size of 1 mm per image pixel. MAPE values are 5.1% and 4.5%, respectively, when fitted to two different fish images of 1072 Asian perch [24]. In general, fitting parameters are studied by applying them differently depending on the species [25,26].
The focus of this study was to continue developing a method for automatic estimation of harvested fish weight from images. Several conditions were presented to derive the experimental results. The condition is to assume that a model excluding fins and tails will be more accurate compared to a model using full-fish silhouettes [23]. It is obviously much easier to extract the total fish surface area than to exclude fins that are not precisely defined [22,27]. Therefore, using the additional formula of using Deep Convolutional Neural Networks (CNN) [23,28], we present results that achieved an MAPE of 3.6% and an MAPE = 11.2% in length estimation.

2.2. Fish Species Estimation

The estimation of fish species can be carried out using the automatic identification of fish species from images or videos combined with electronic monitoring systems [29]. Therefore, the labor force for reporting catch statistics can be reduced and the accuracy of reporting can be increased. Image analysis approaches are increasingly being used to gather fish species information. These approaches have the advantage of automation, efficiency, veracity, and accuracy as opposed to the traditional manual methods. Previous studies have addressed how image analysis can be used to identify marine fish types.
A research paper [30] developed a nearest-neighbor classifier for identifying nine species of fish using shape and color features and directed an acyclic graph multiplexing for distinguishing six species of fish using wavelet-based texture features as inputs. In some cases, class-supported vector machine classifiers [31] have been developed. In one study [32], a method using image processing and statistical analysis was developed to recognize 4 species of fish by color, shape, and texture characteristics, and the morphological characteristics of 27 fish species were evaluated, resulting in three types that were significantly different from each other. Automated morphological recognition has been successful on different fish species [33]. In addition, a study [34,35] succeeded in recognizing 15 fish species in underwater videos by combining hierarchical trees and Gaussian mixture models. Representatively, the YOLO [36,37,38] and SSD [39,40] methods have been used to estimate fish abundance using autonomous imaging devices and genetic programming-based classifiers.
Regarding model and harvest estimation, there are no distinctive studies, but the representative studies include the crowdsourcing paradigm and image stitching studies described in Section 2.1. It is expected that these techniques can also be used to estimate harvest. The crowdsourcing paradigm makes it faster, cheaper, and easier to collect the data needed for deep learning [23]. One problem, however, is that while crowdsourcing can provide tremendous benefits with vast amounts of data, it requires a specific strategy to verify the quality of the data collected.
This verification must take place by the use of pre-trained CNNs and fast region-based CNNs to detect fish and recognize fish species in images from the ImageCLEF dataset [32], or by using pre-trained CNNs as in [41] to video underwater. There is also a method for recognizing fish species from images with random noise using CNNs and transfer learning, such as in [42], and there is also a study [43] that automatically identified species of tuna and billfish. However, in most studies, there is a part that requires learning through labeling. A deep dependence can therefore be expected from the data used in the study.

2.3. Electric Monitoring System

Electronic monitoring (EM) began to be installed on ships for the purpose of preventing safety accidents, but it has recently been used as a tool to collect information on the fishing process and the numbers of fish caught [44,45,46,47]. However, there is no direct, real-time analysis in these systems; they are manually screened and analyzed in marine data centers. This enables the recording of harvested fish statistics; however, manual screening of EMS images and videos is time consuming and labor intensive [46,48].
Therefore, an effective method is to use conventional image processing and machine learning techniques to automatically perform the aforementioned tasks. In this regard, a study [49] was conducted using a conveyor-belt-based machine vision system to detect fish and determine their length and species. In addition, a further study identified three types of fish [50] from images acquired under controlled lighting using manually annotated shape and texture features and linear discriminant analysis.
Subsequent research [51] has used image processing techniques to evaluate the BL of fish in images acquired with a white background, and [52] used machine vision techniques to track fish and study their counts in laboratory-acquired underwater images. In [53], moving averages and feature-matching algorithms were used to detect, track, and count fish in coral reef videos collected with high-contrast backgrounds. A study has also been conducted to detect feeder fish in static containers using image processing techniques [54].
Recently, Convolutional Neural Networks (CNNs) have been applied to solve complex machine vision problems [55,56,57,58]. CNNs utilize spatial convolution operations in networks. Once trained, CNNs can extract features from input images with few pre-processing requirements [59] and can achieve remarkable performance in machine vision tasks. Perhaps we could use a CNN approach to solve the fish detection and recognition problem.
In [60], CNN and the nearest-neighbor algorithm were used to detect and count discarded harvested fish in fishing trawler videos. The study [61] used a faster Region-based Convolutional Neural Network (R-CNN) [62] to detect fish and identify fish species in underwater videos. In another study [63], fish were recognized in underwater videos through a CNN matrix decomposition and support vector machine. In [64], three fish recognition tasks were completed in coral reef videos using a CNN with single-shot multibox detector architecture. There is also a study using CNNs with VGG architecture to identify eight common species and types of harvested tuna and billfish [65].
Research in papers [66,67] succeeded in detecting fish in unconstrained underwater videos using a CNN with a one-time architecture [68]. Studies in [69] used a two-step graph-based approach and a CNN model to track the movements of several fish in a stream in an underwater video. Further research in [70] also used a region-based modeling approach and deep CNN to detect fish from images acquired from ships and to recognize species of fish. In [71], we measured fish BL using a CNN on images acquired from ships. Another paper [72] detected fish images and estimated the length of the fish using three R-CNNs.
However, it is true that EMS images or videos acquired from ships have many problems, such as image quality and obscuration of angles due to moisture; consequently, accurate recognition is still a challenge.

3. Proposed Electronic Monitoring System

The focus of EM is to be able to collect a high-quality image and to be able to transmit these data in real time from the ship. Due to the long voyage time of ordinary deep-sea fishing vessels and national flag vessels, data collection, learning, and estimation may not be smooth. Therefore, the system presented in this study transmits a 4 k video over land in real time, it learns based on the transmitted data, and finally, it performs the estimation. In addition, the currently required conditions are the presence or absence of illegal catches and the total amount of the catch in the video taken during operation.

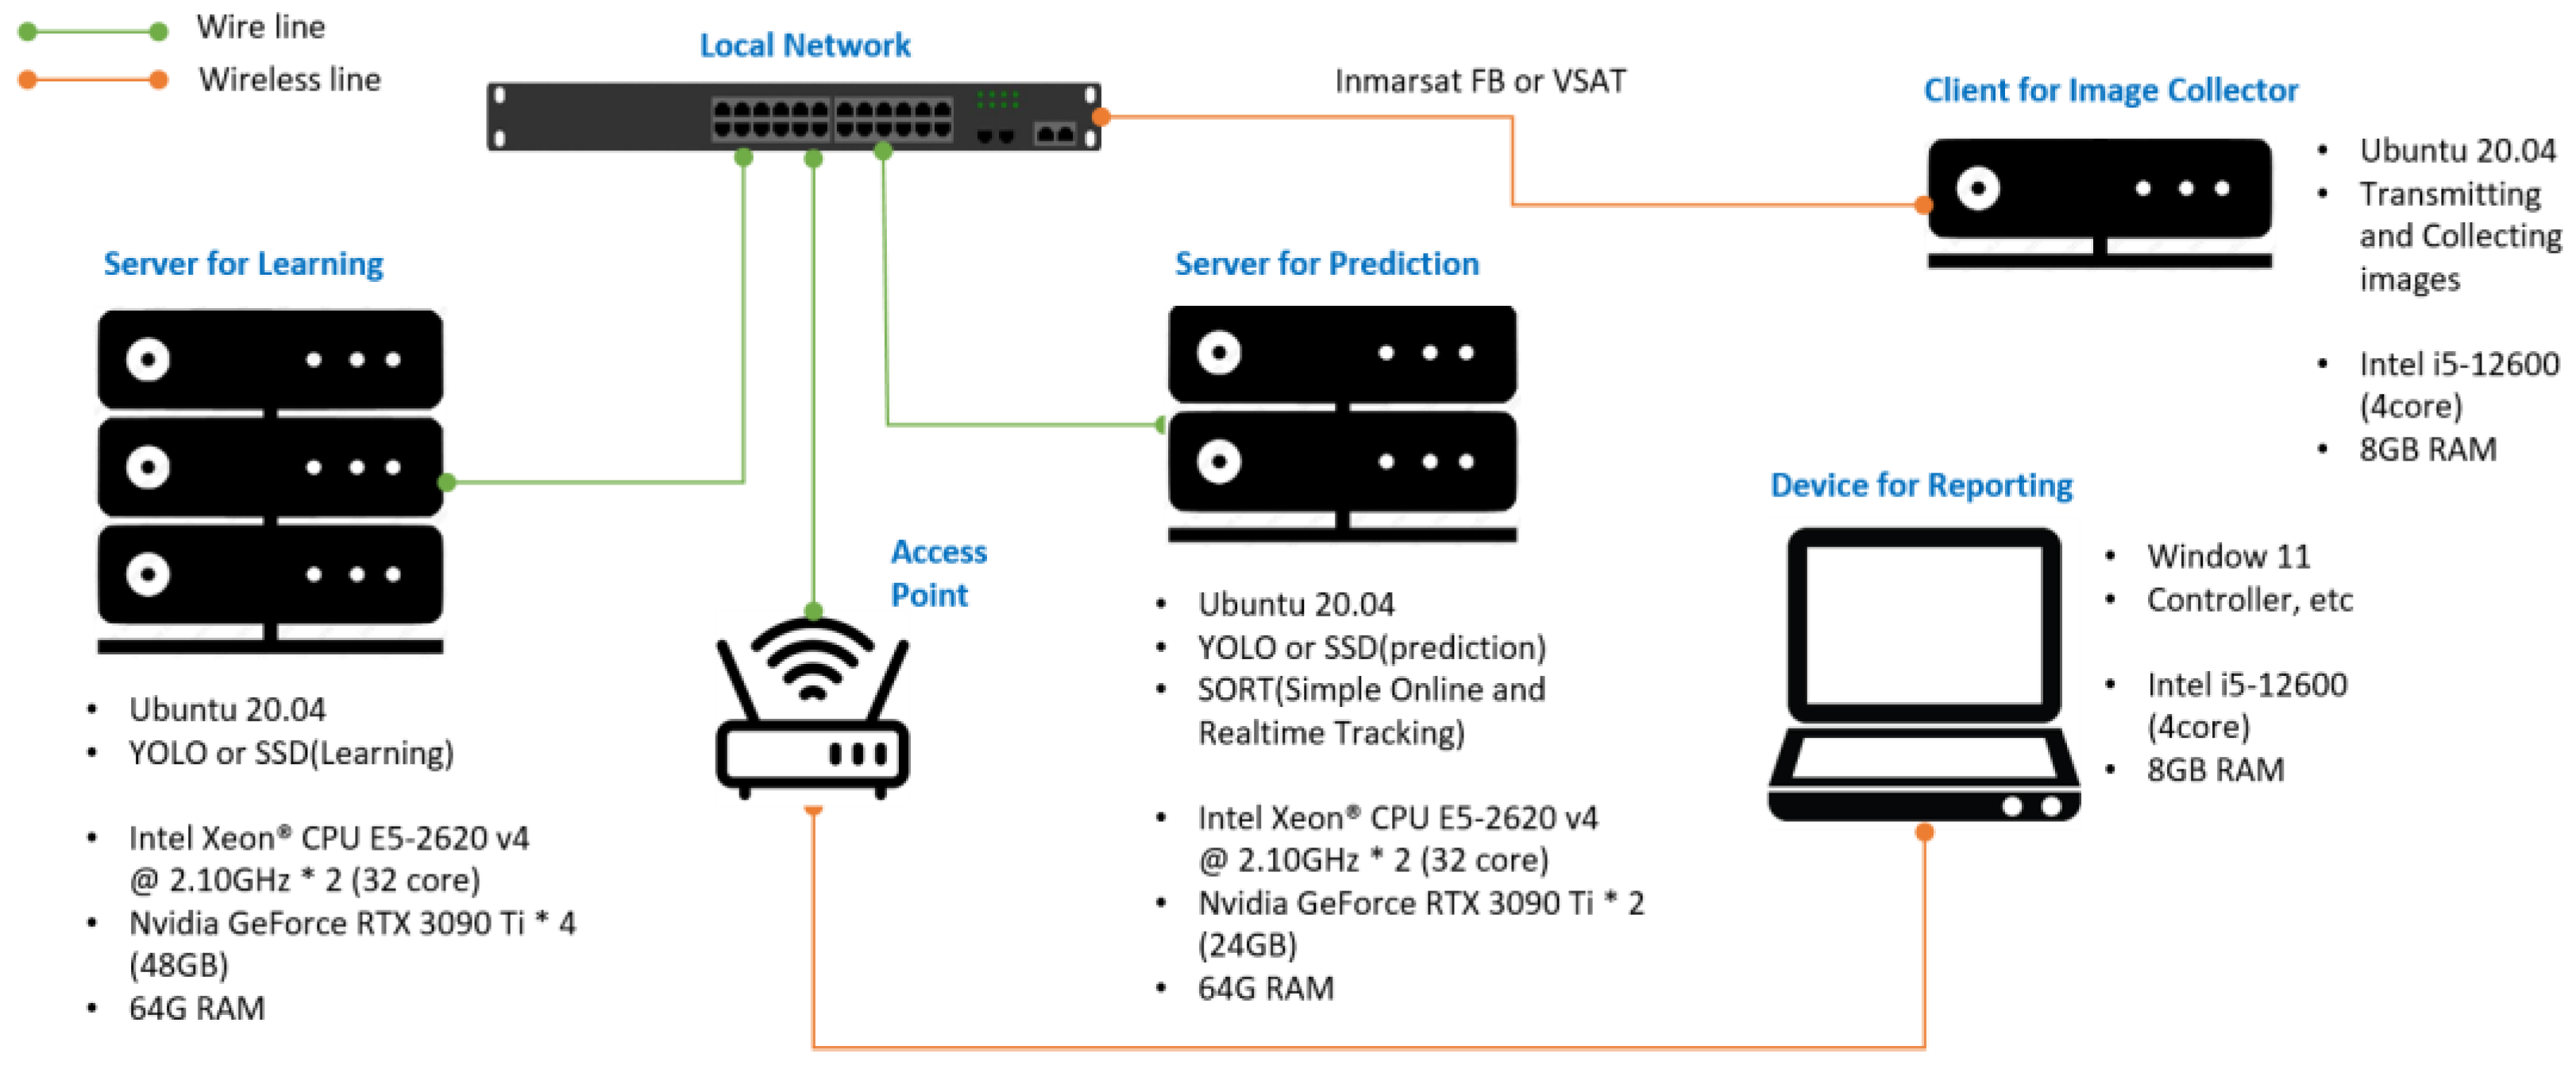
3.1. An Overview of Hardware System

The hardware structure is shown in Figure 1.
In Figure 1, the learning server, prediction server, network, and reporting device are operated on land, and the image collector client is installed on the ship. Images are recorded in the image collector client and transmitted to the land in units of 1000 frames. A real-time video is produced, but limitations in the satellite communication environment cannot be avoided. Therefore, transmission is limited to 5 to 10 FPS. The learning server extracts images from collected images and uses them as data for learning. The prediction server identifies illegal catches from the collected images, estimates and calculates the total number of catches, and creates and provides a report for each ship.

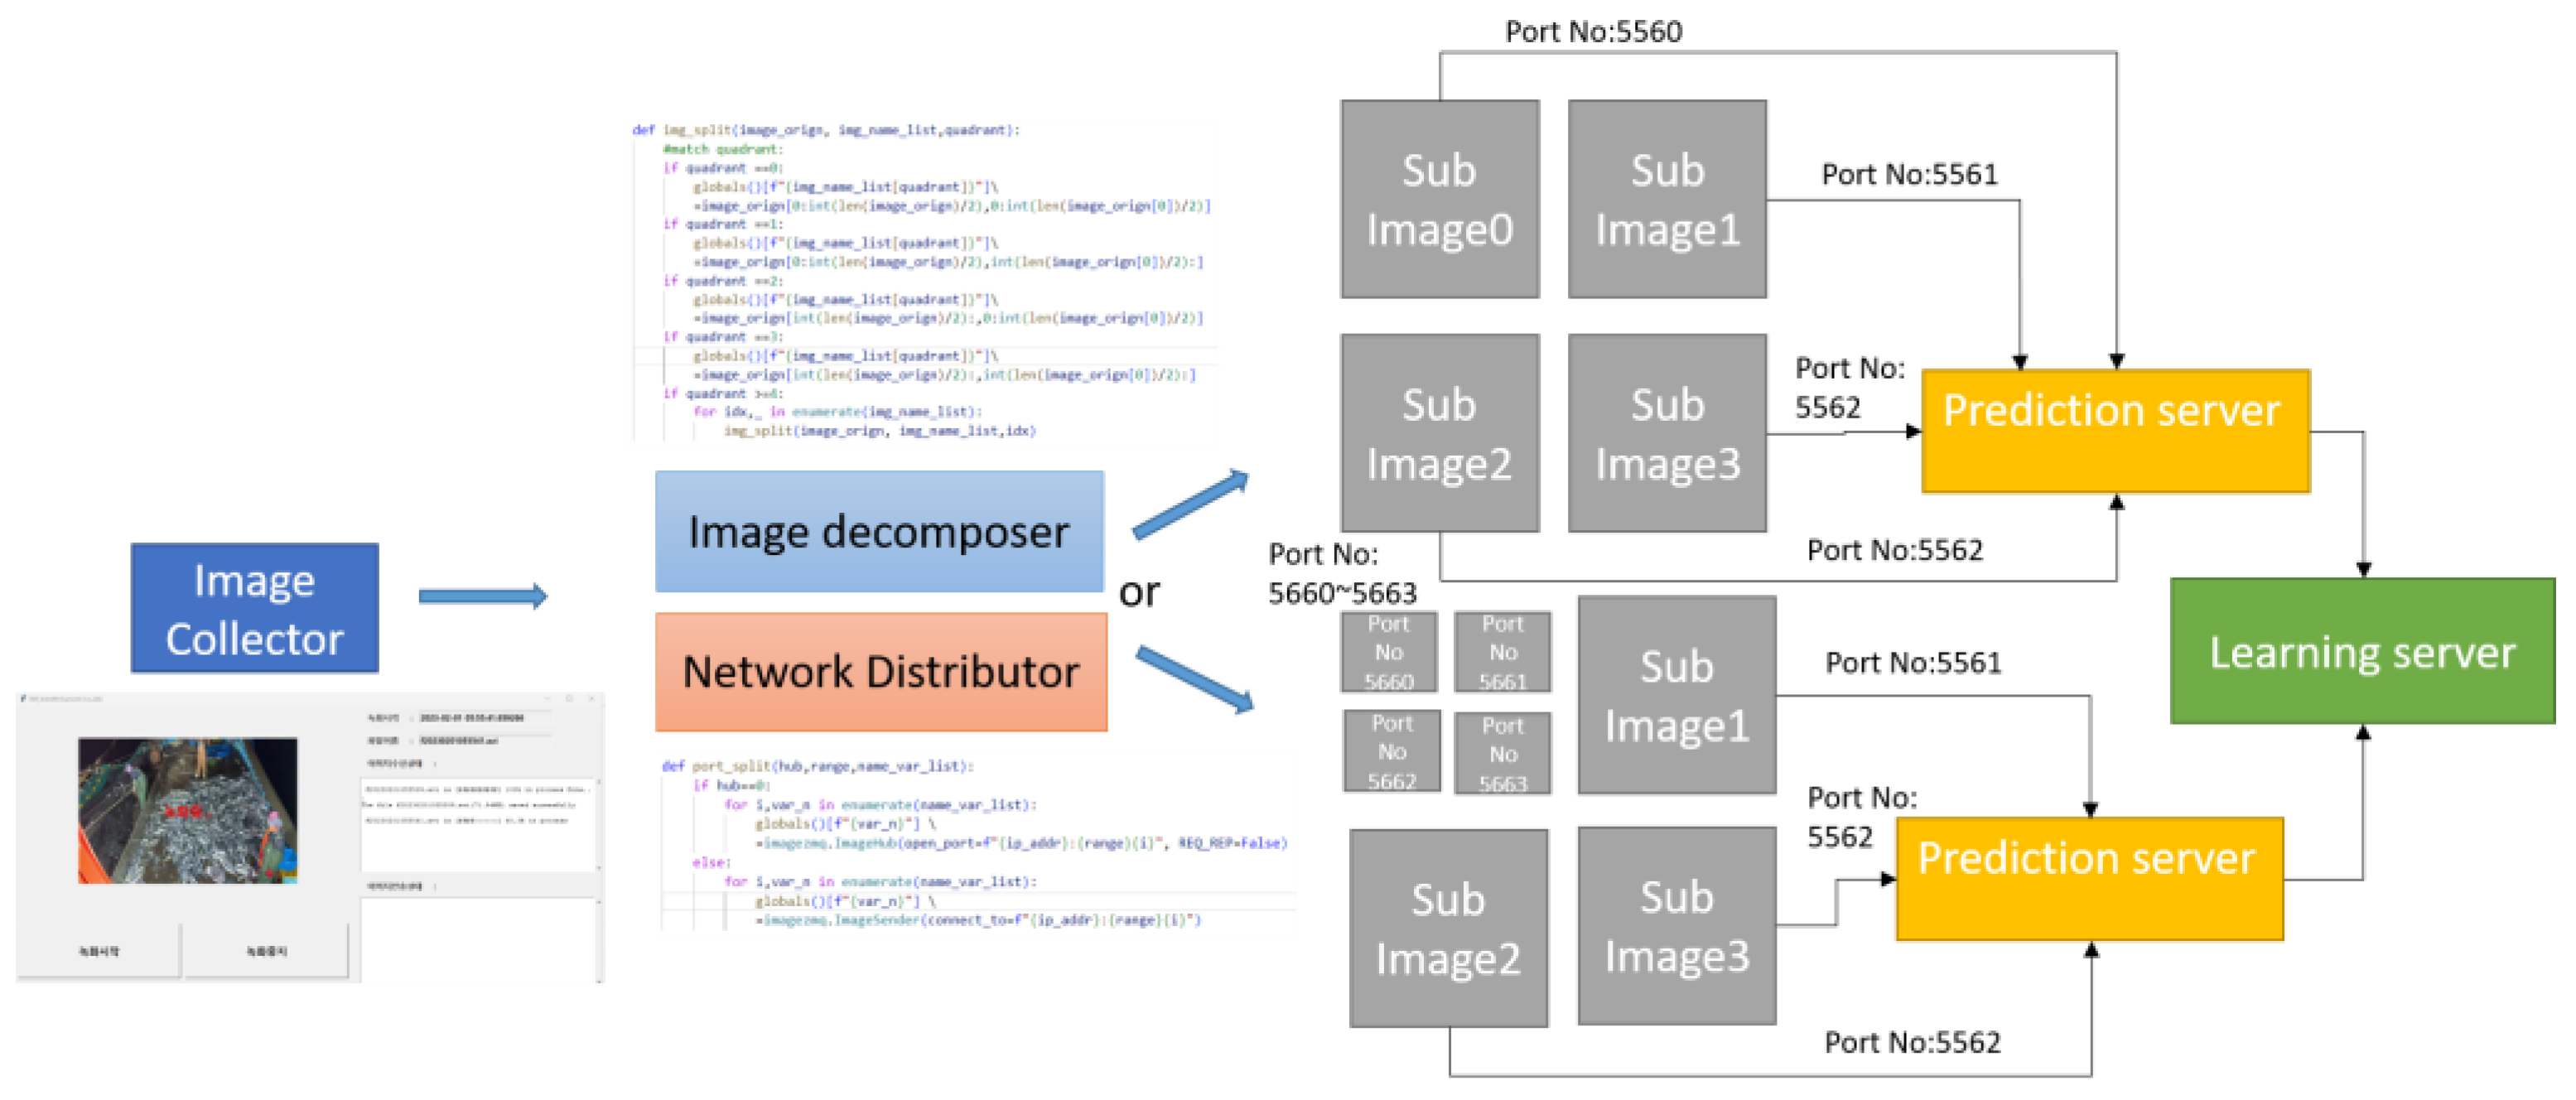
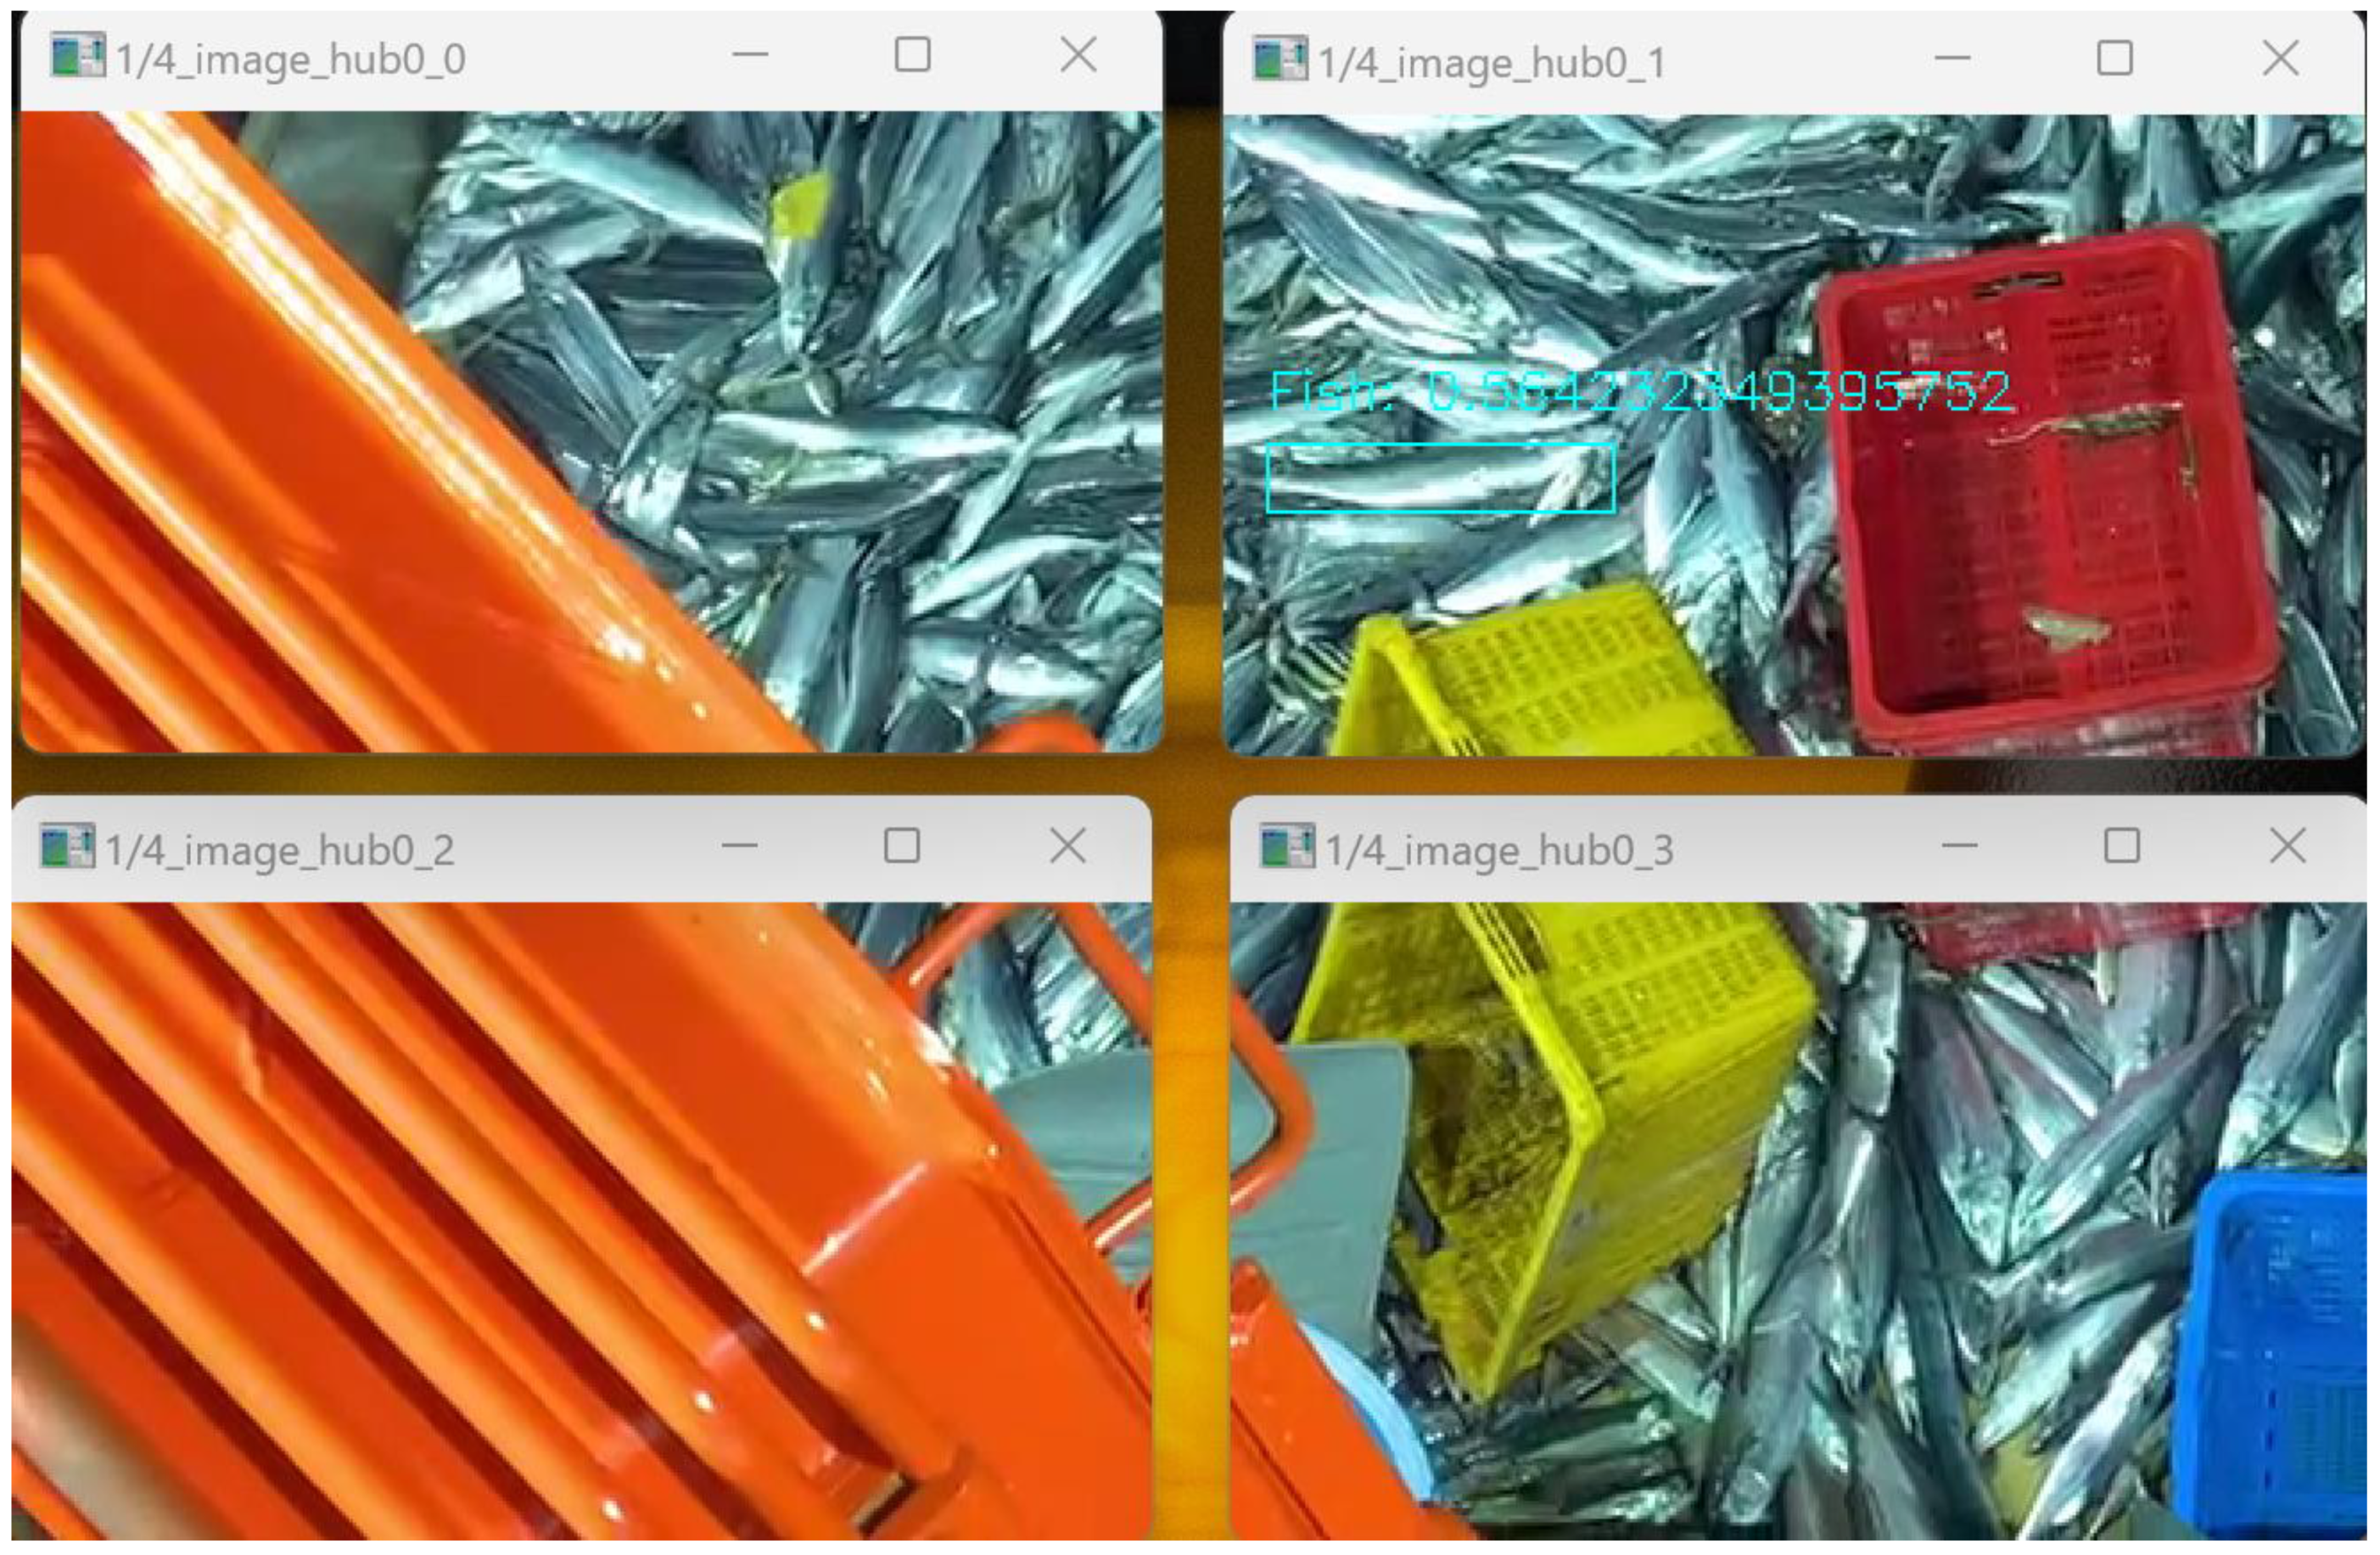
3.2. Software Structure

The learning server and prediction server must have analysis and estimation functions, and they are configured with YOLO4. The image collector client transmits the collected images to the ftp server, and the ftp server is built on the prediction server. The overall configuration is shown in Figure 2.
Figure 2 shows the design details for each piece of equipment shown in the overview. The image collector collects images from ships and transmits the collected data to the prediction server. The prediction server uses a blob determinant to determine the size of the image. Here, the meaning of determining an image is to solve problems in the existing studies, as well as being a key element in this study. When learning in most image detection systems, labeling must be performed in advance to build the training data. However, labeling requires a person to mark the object directly, and thus has the problem of not being able to detect when a large number of objects appear in one image. This part is explained in more detail in Section 4 below. When the size of the image is determined, the yield is estimated using the image, and the estimation of the fish species is performed. The resulting values and labeling information are delivered to the learning server. Based on the delivered learning data, the learning server proceeds with learning, and if there is a change, it delivers weights to the prediction server.

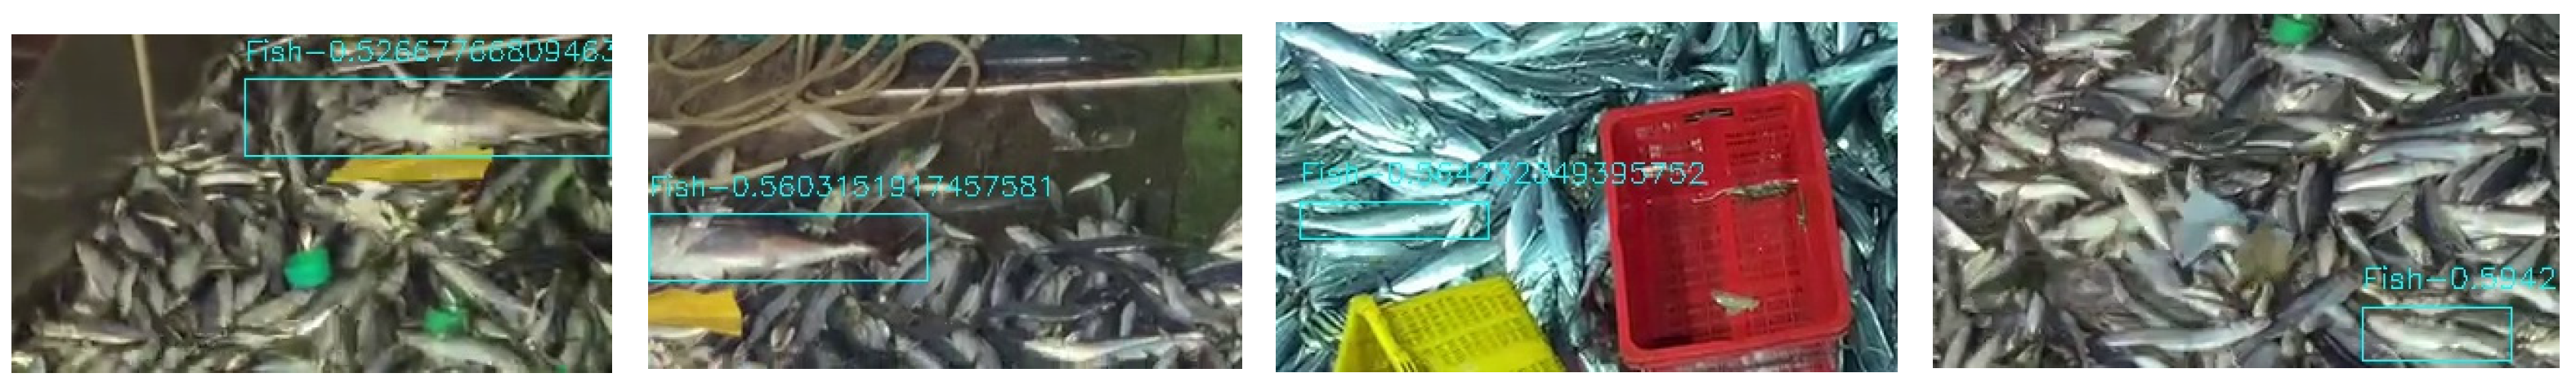
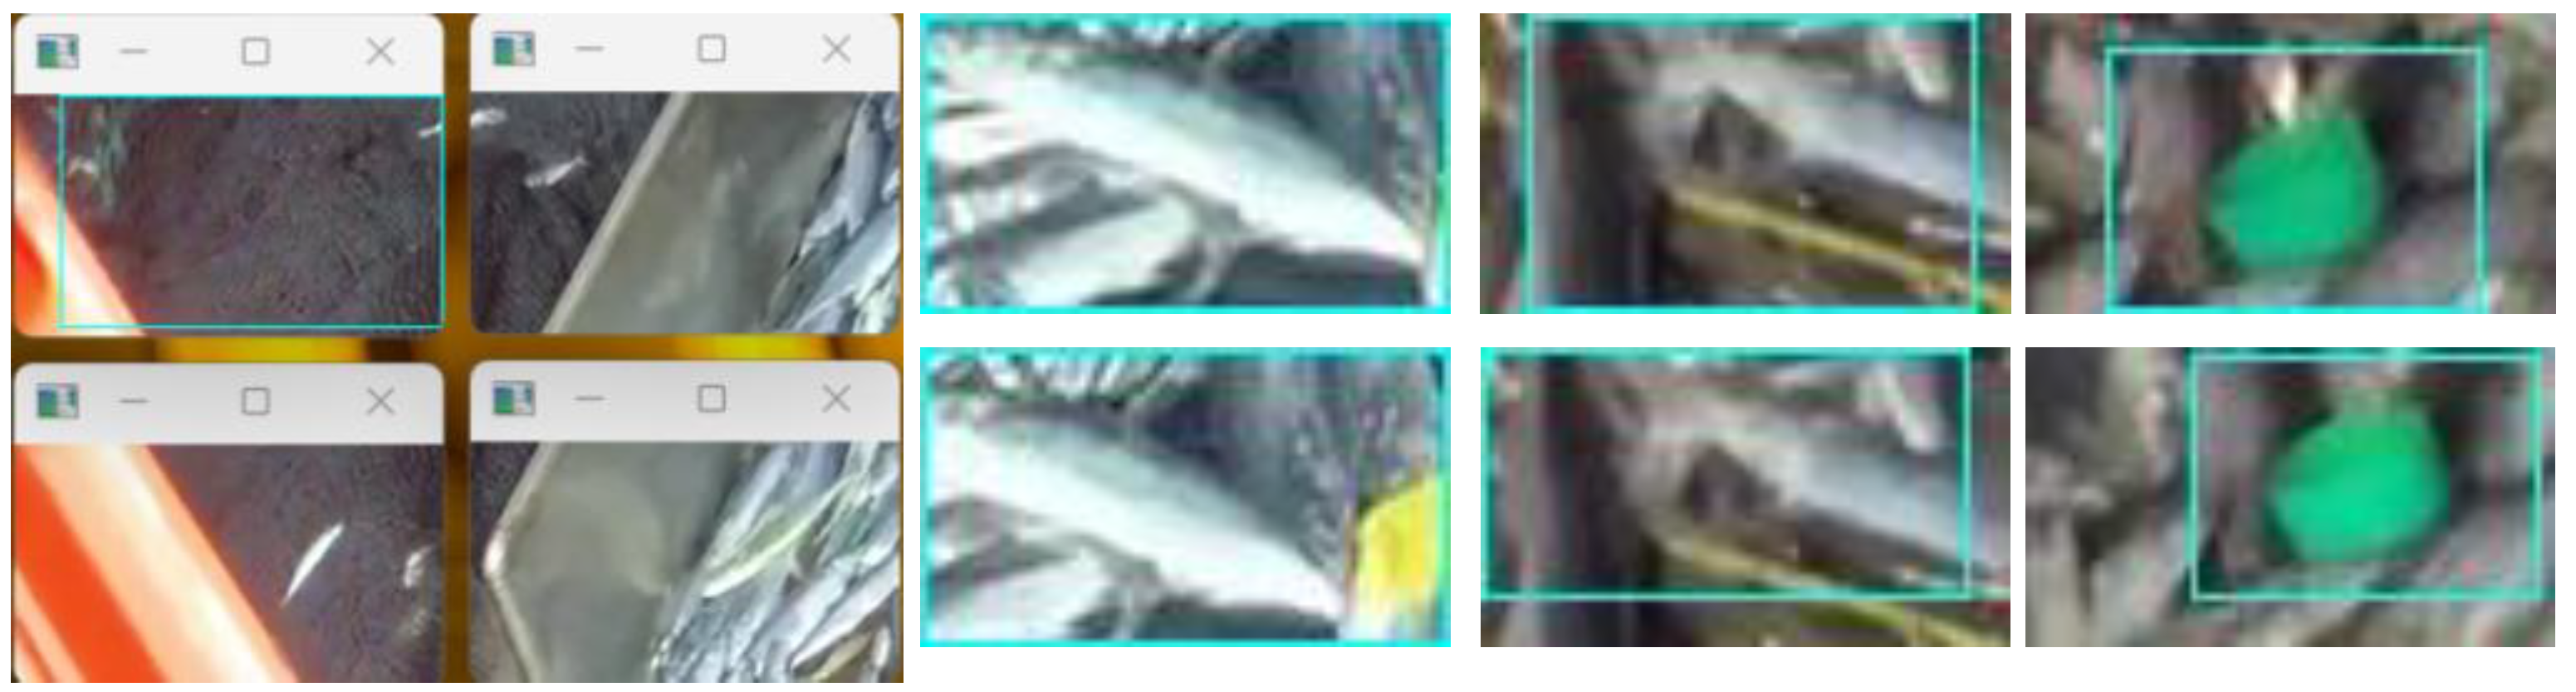
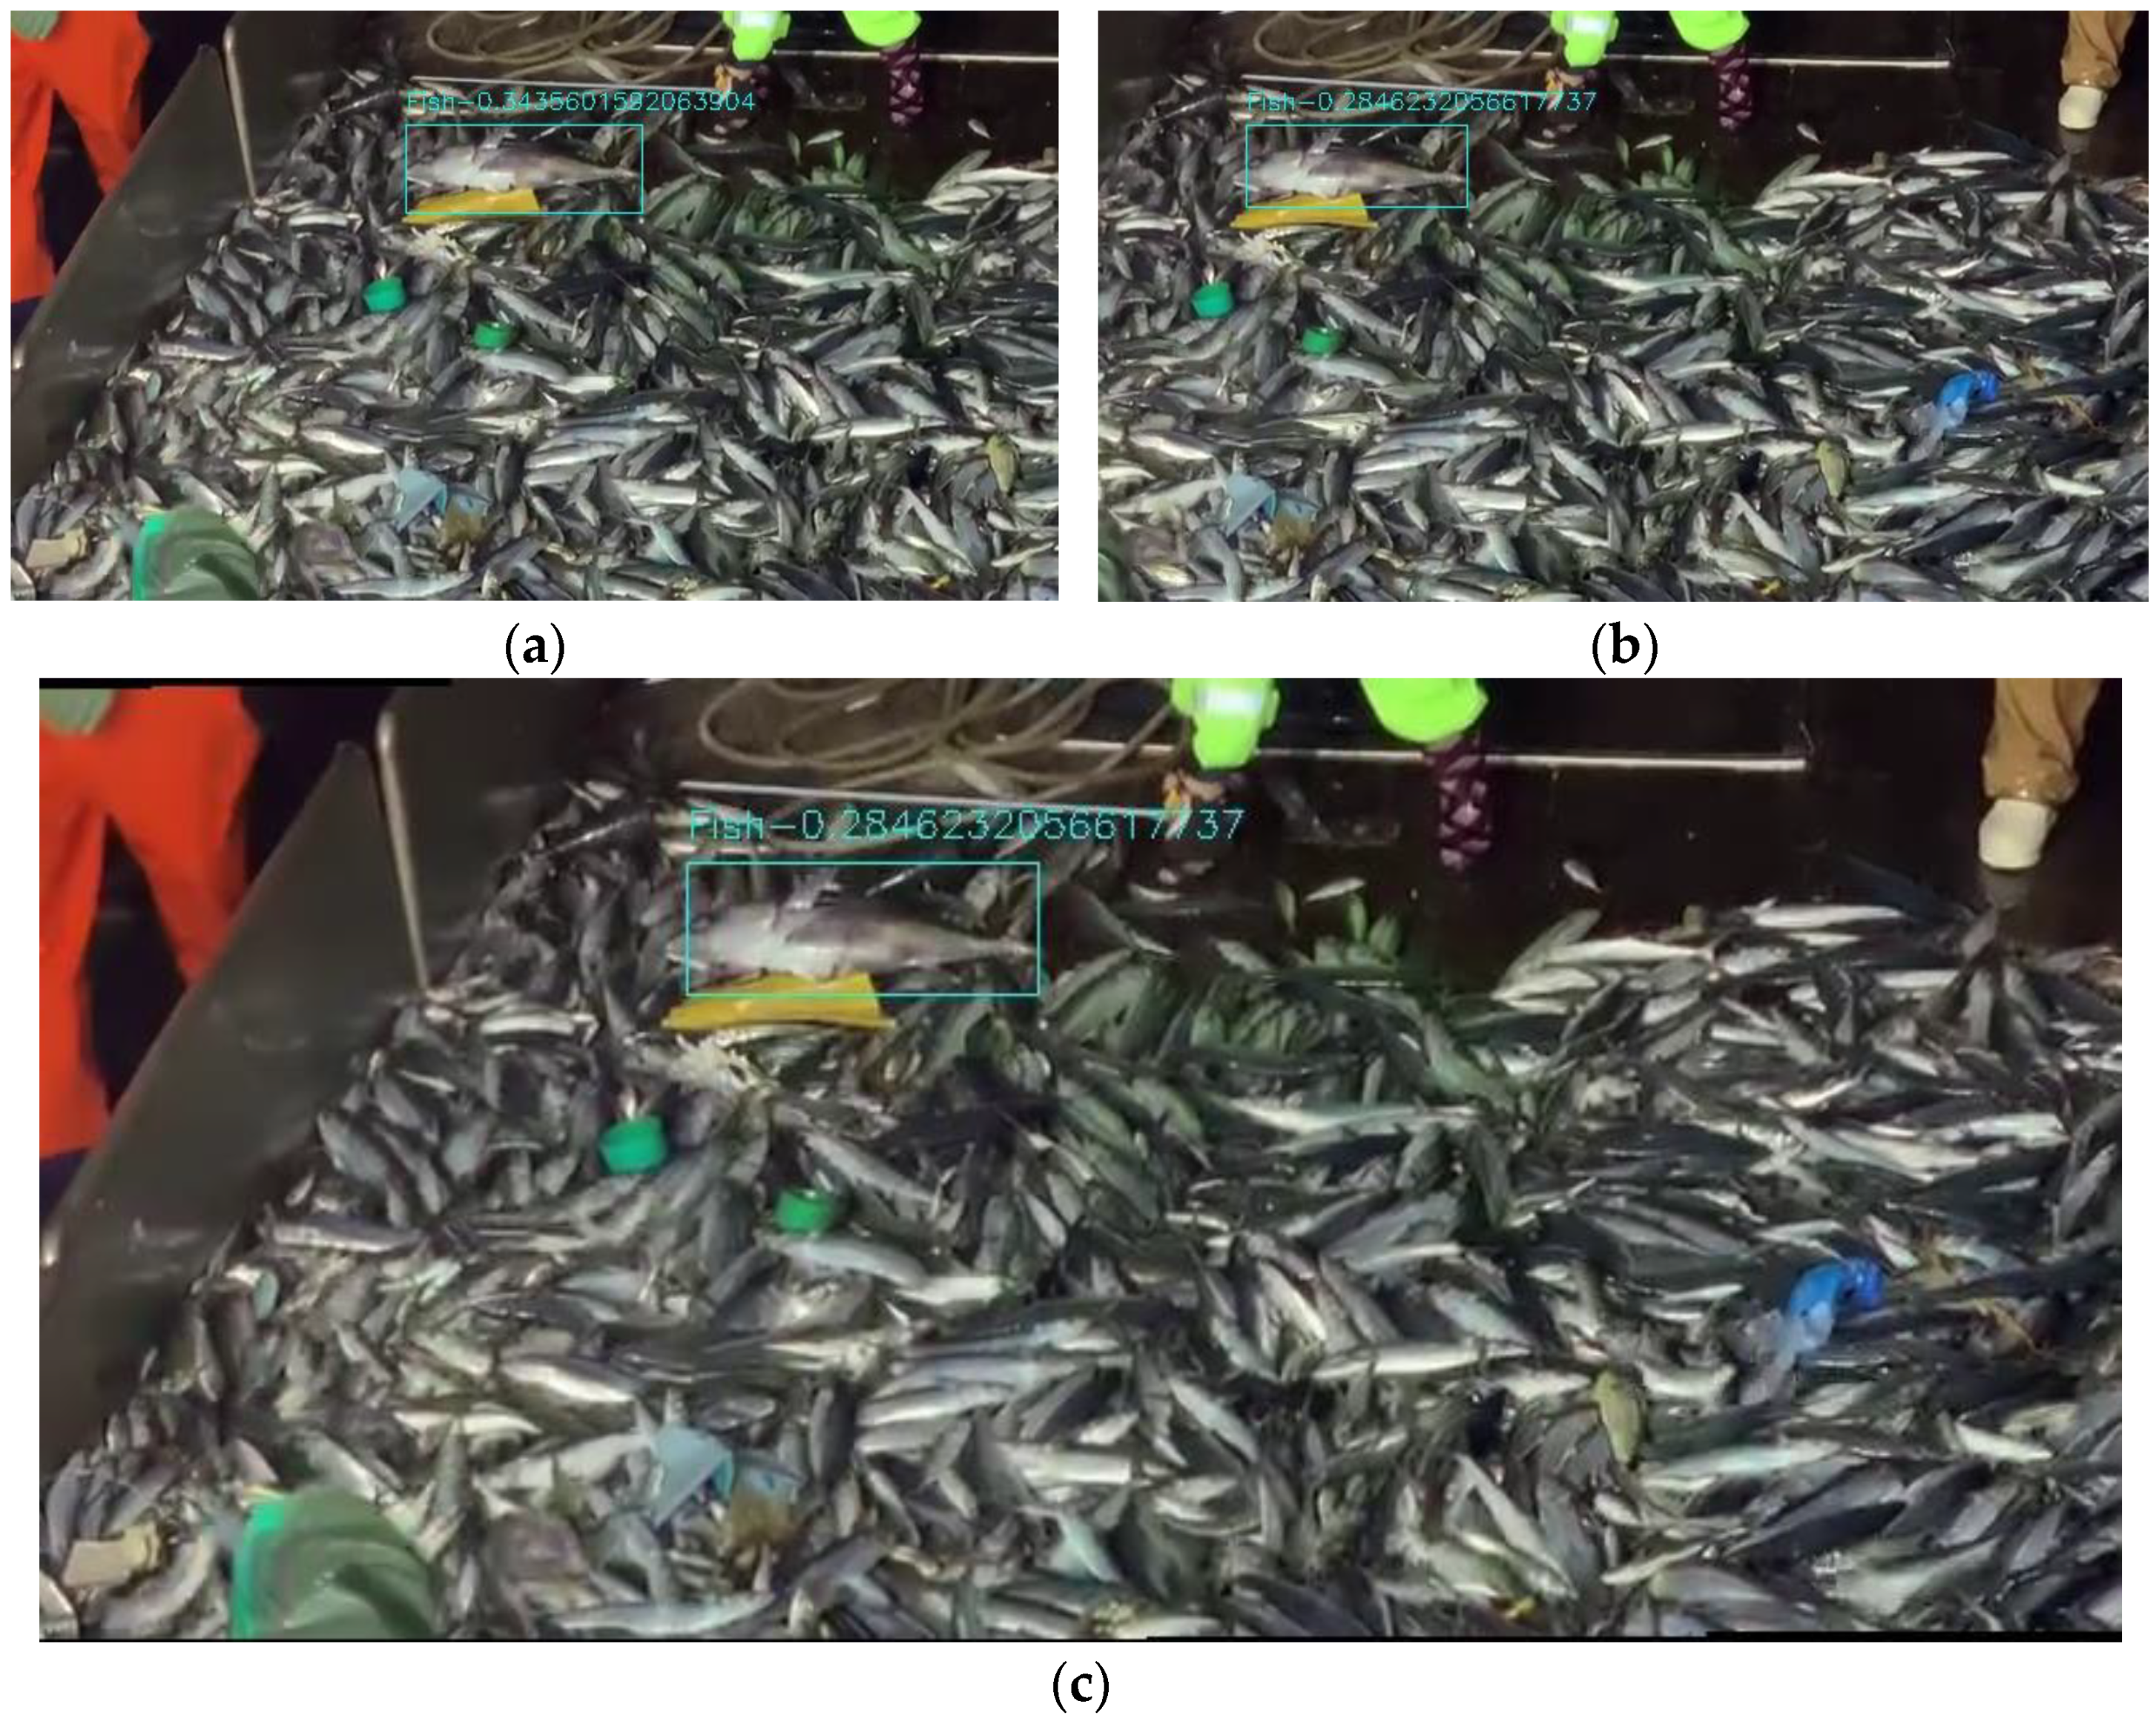
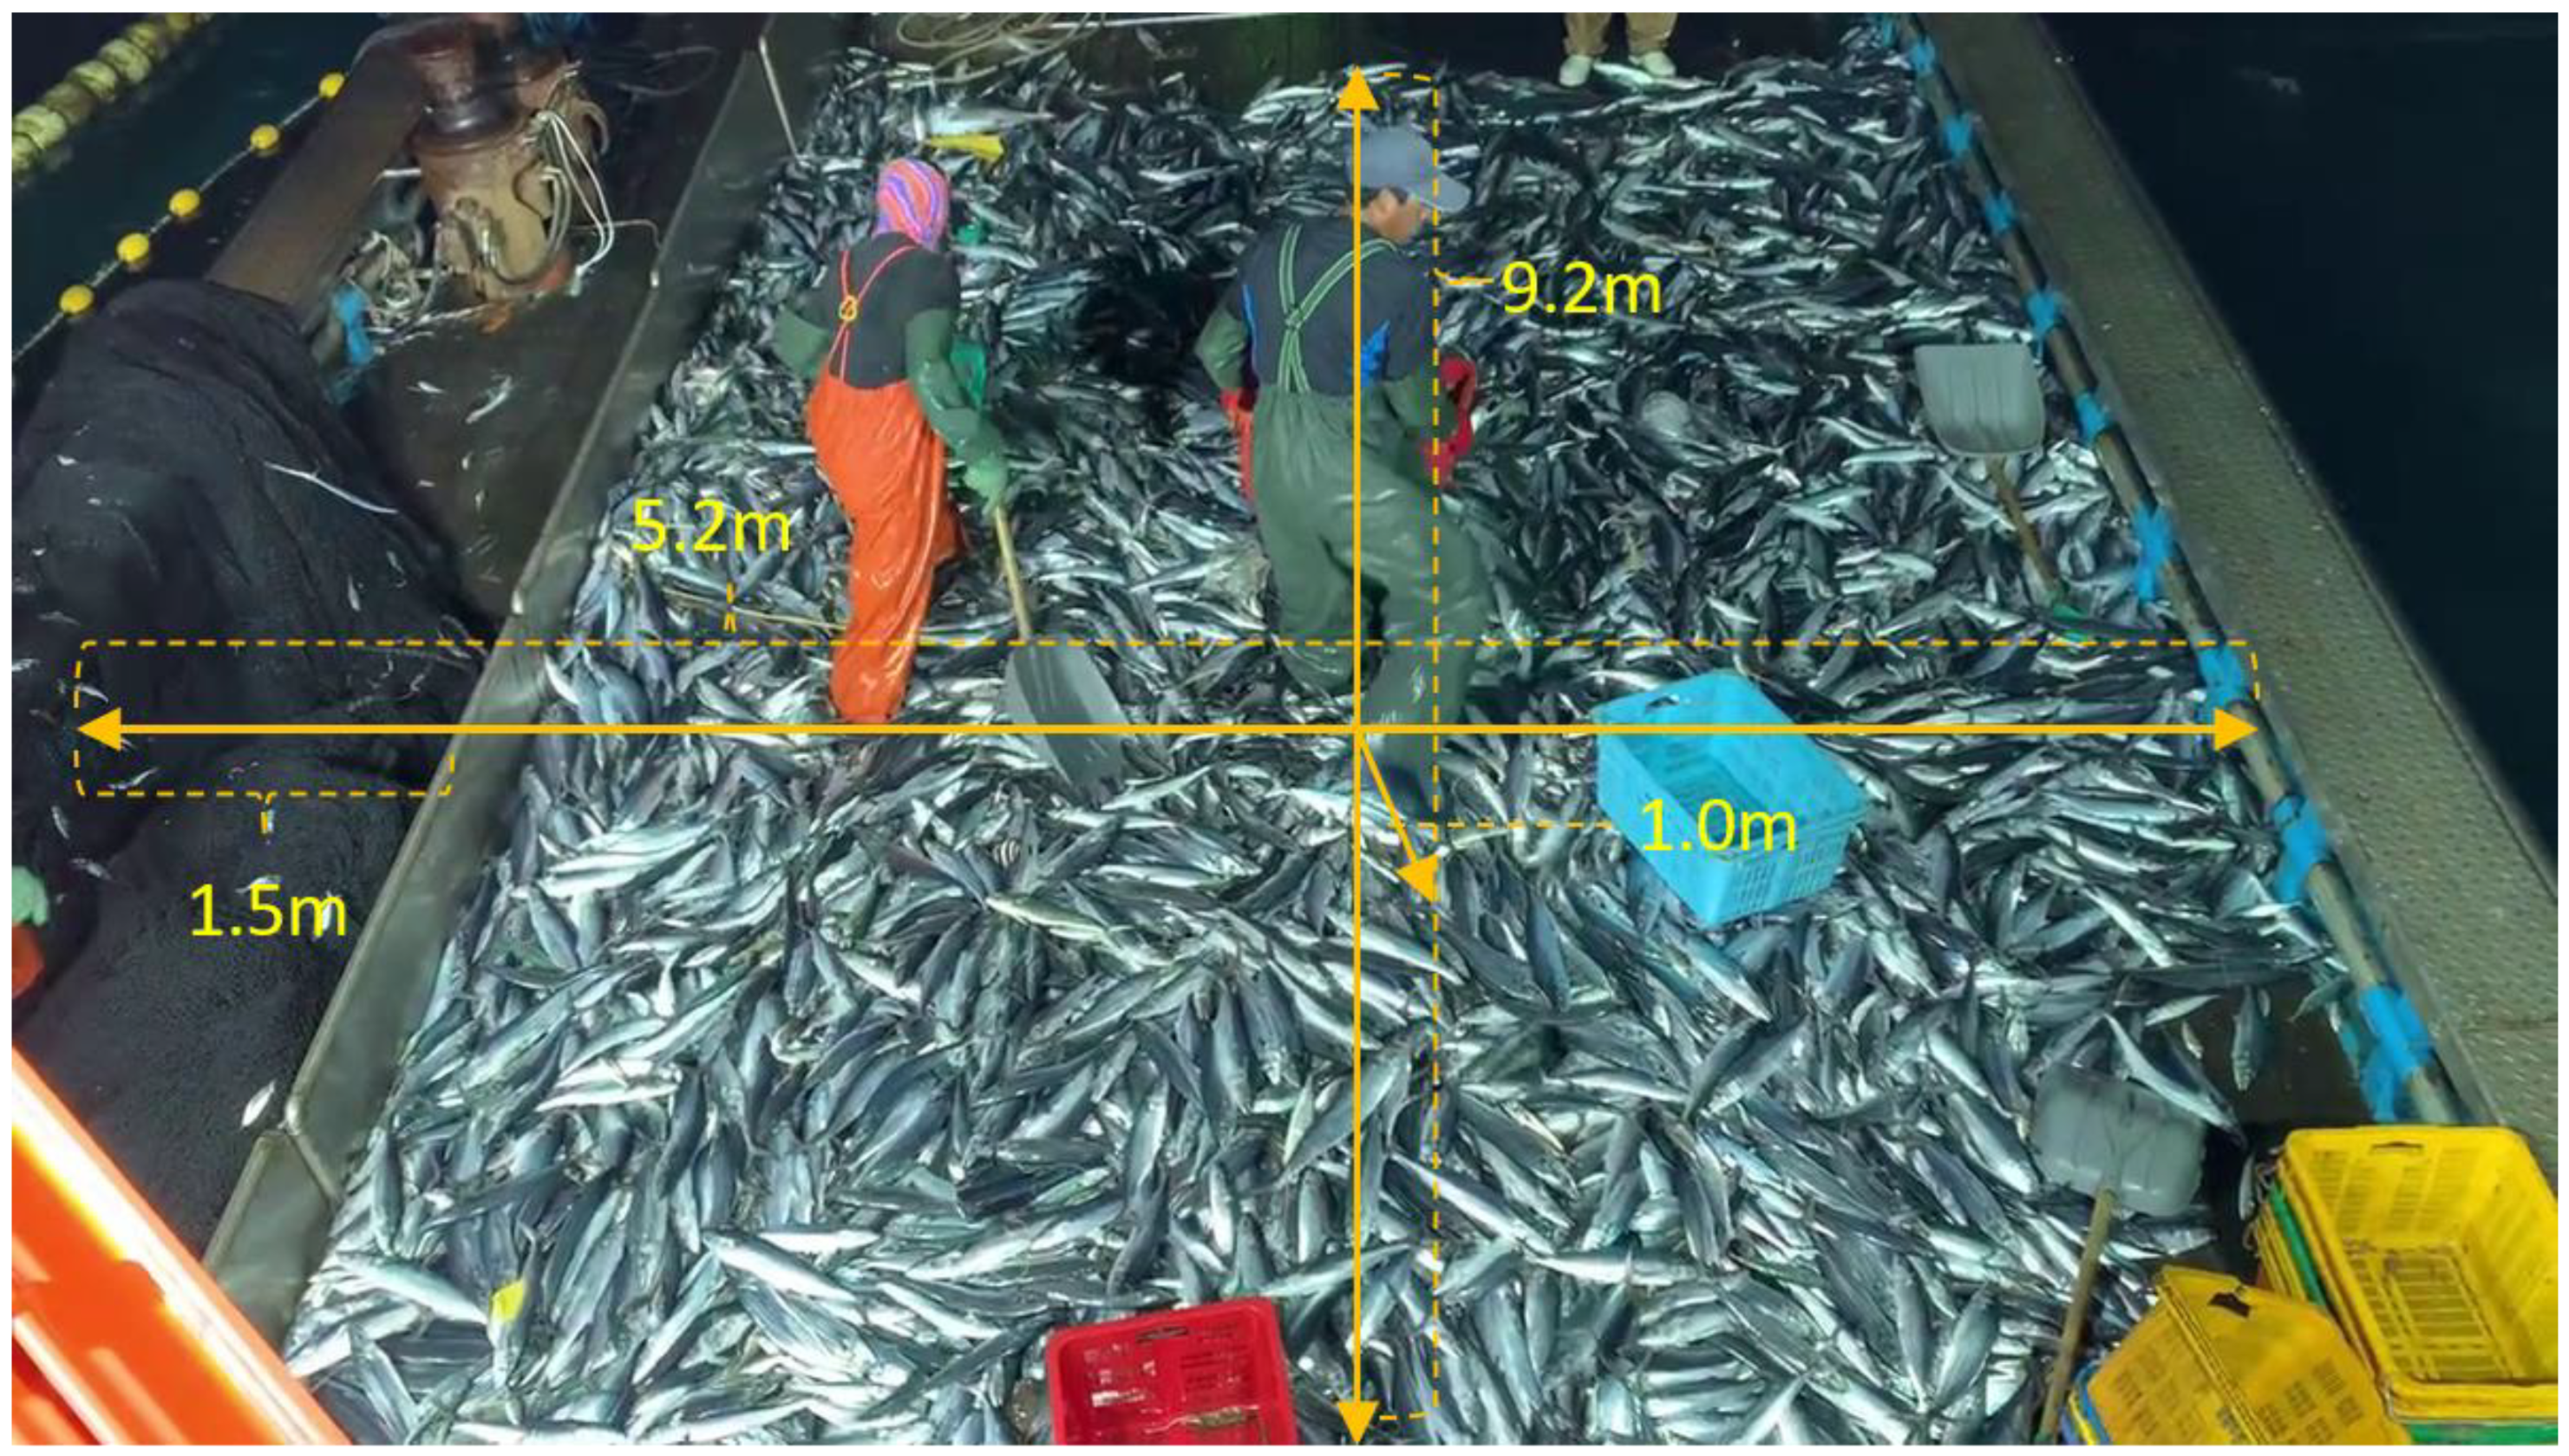
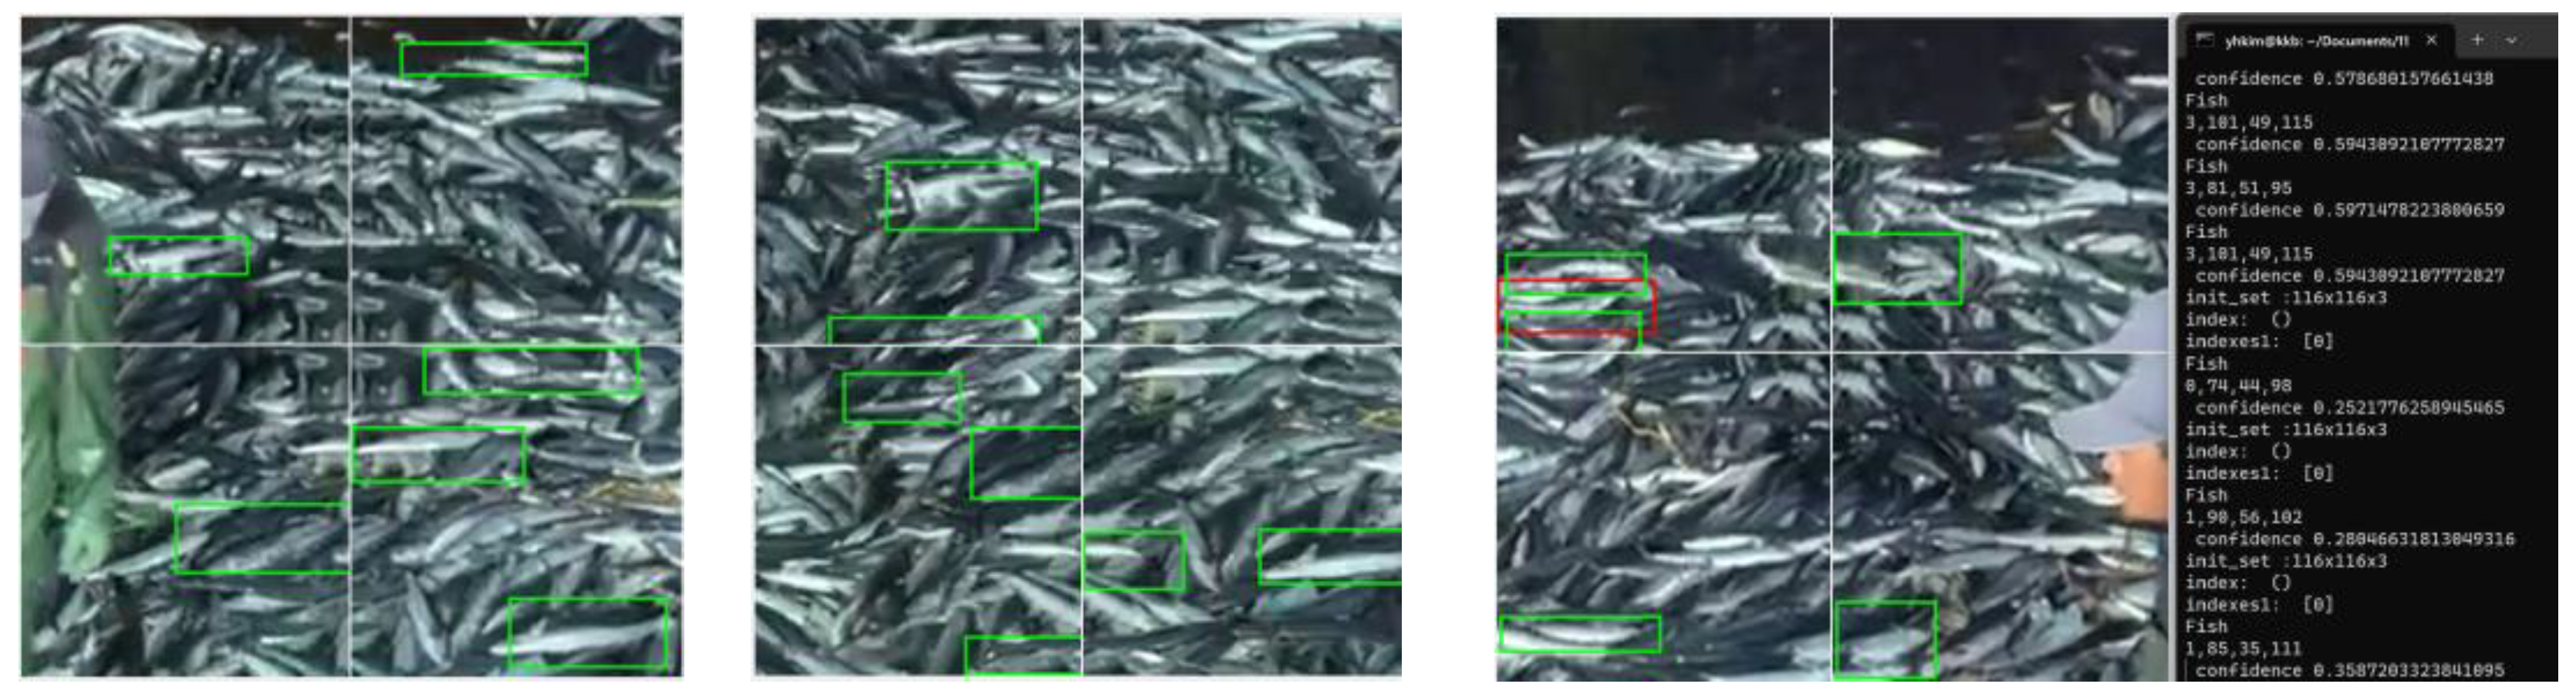
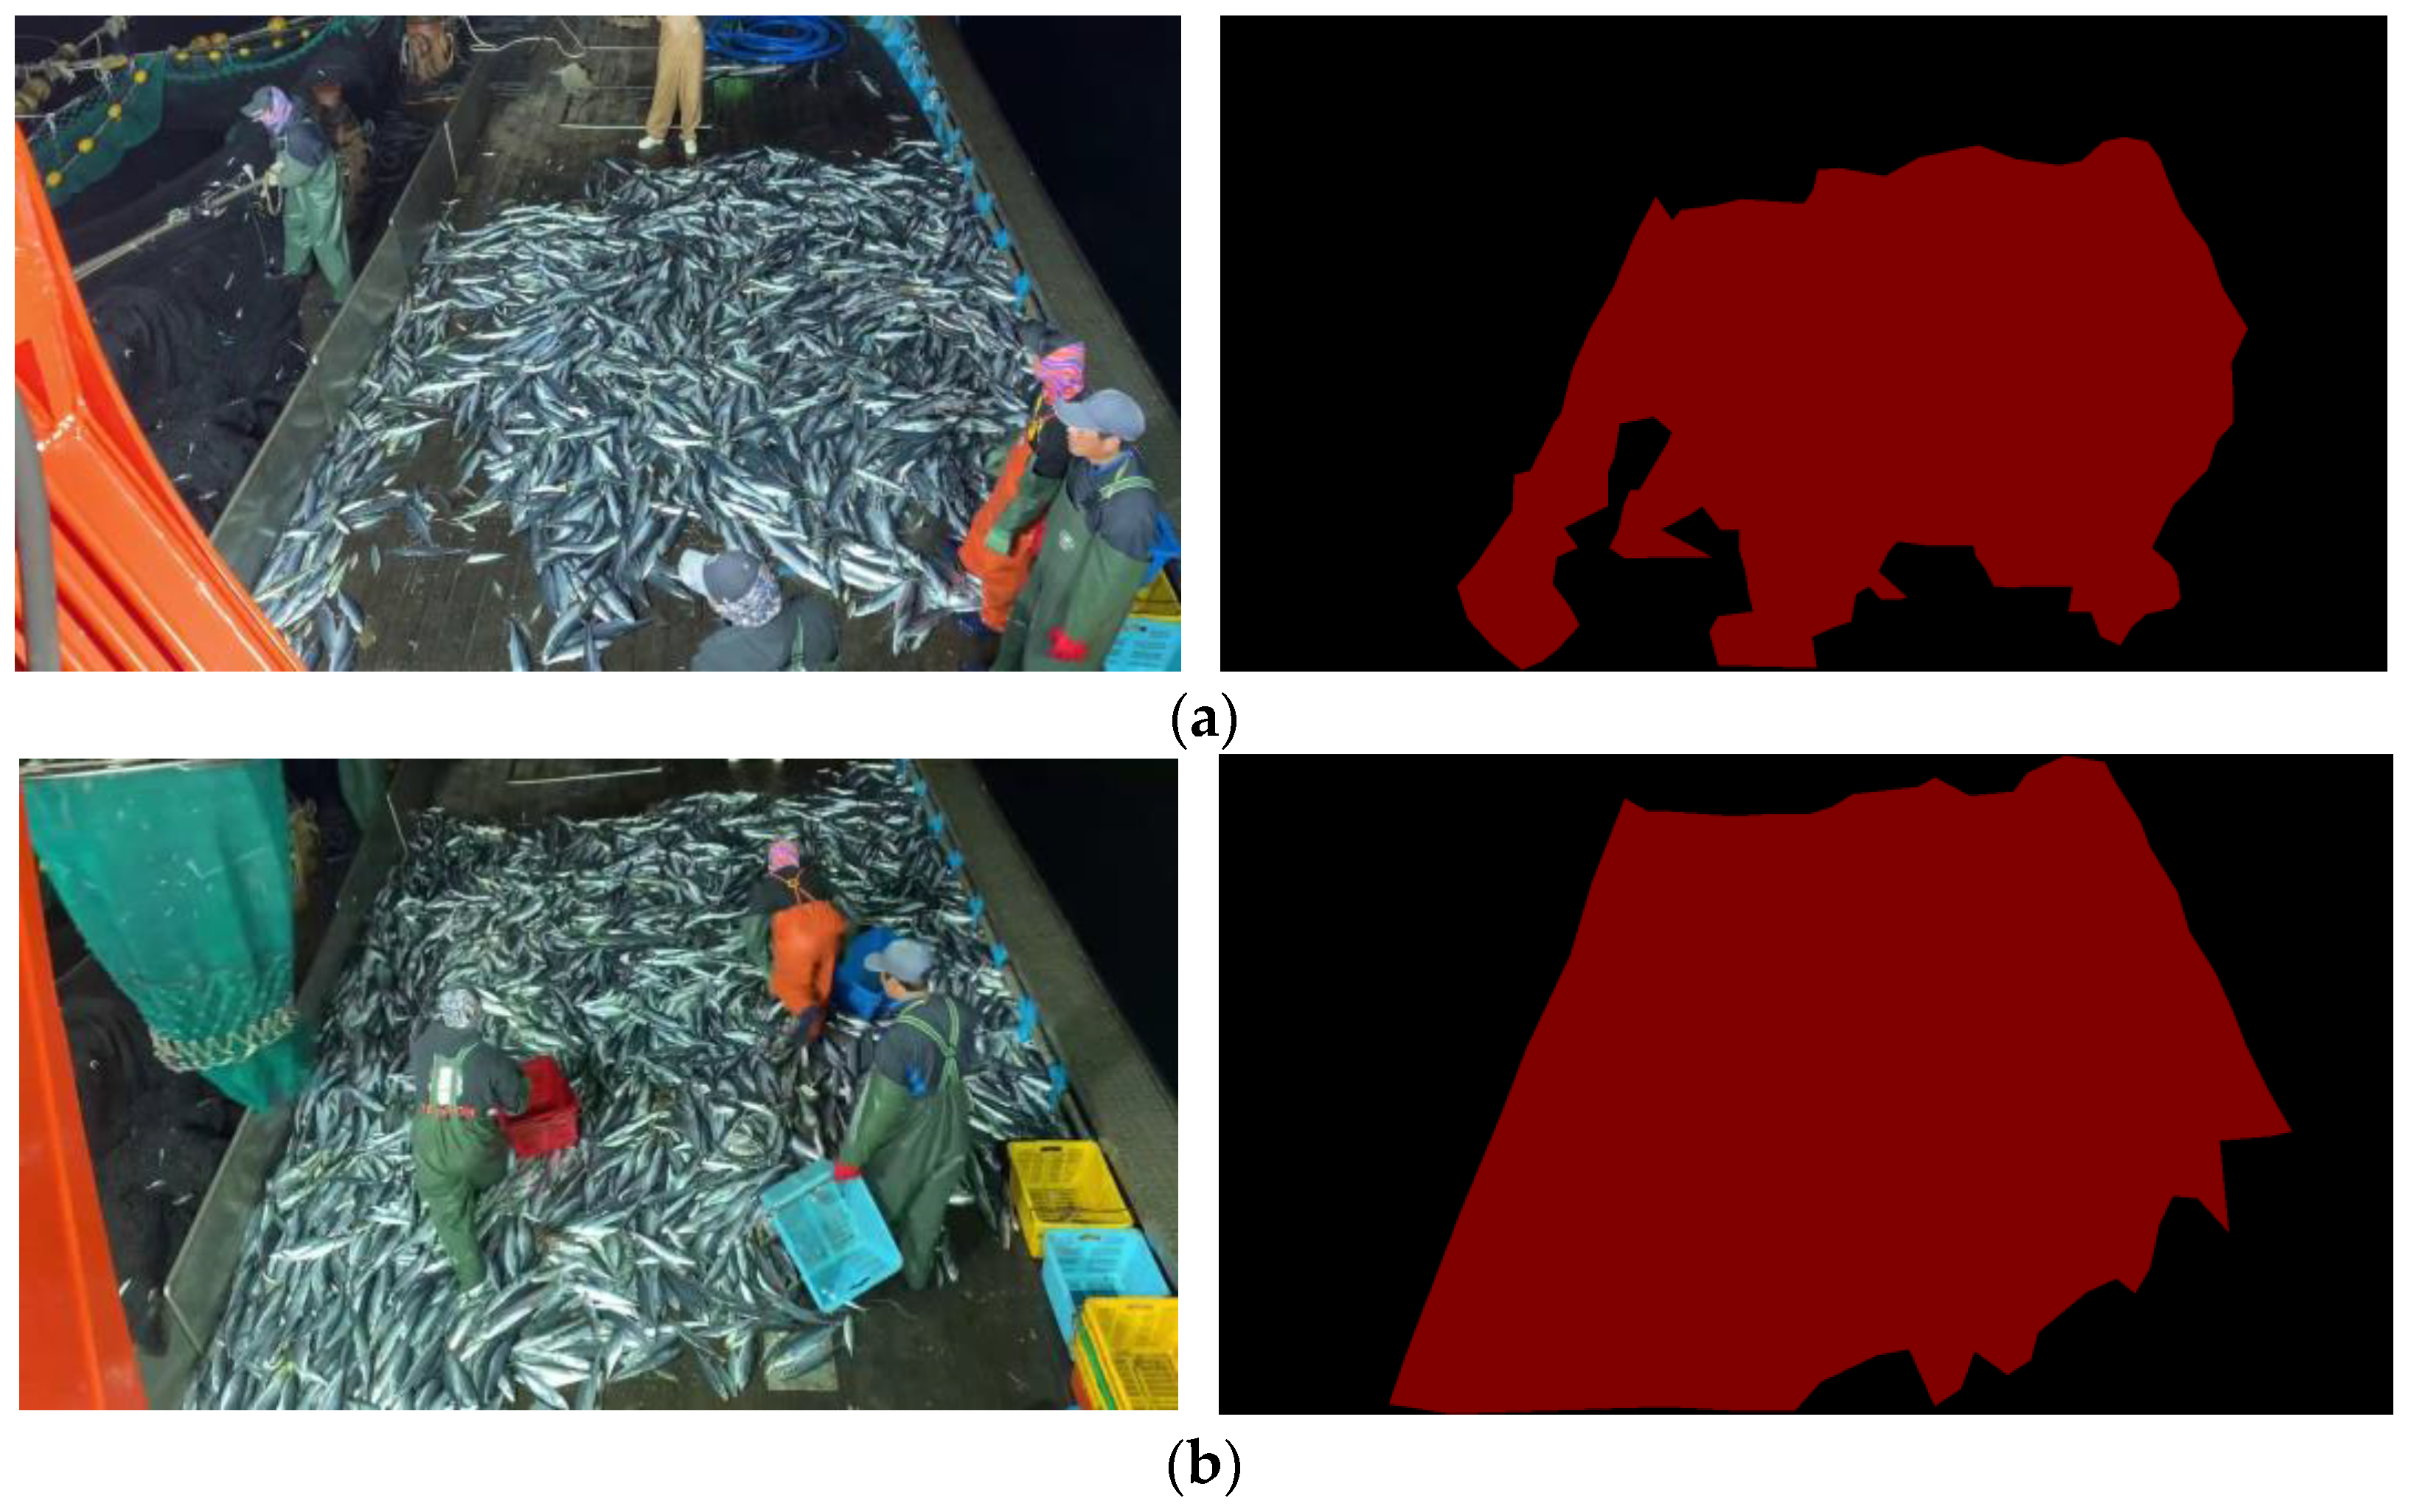
4. Experiments on Electronic Monitoring Systems

This section provides an explanation of the proposed system and the simple experimental contents of the transmission module, as well as the experimental contents of the Image Segmentation Manager. The reason why the Image Segmentation Manager was applied to this study is the same as the problem of determining the limited size of blobs mentioned in Section 3. As for the limited size of the blob, there is no problem when the size of the image to be estimated matches the width and height, such as the existing 320 × 320, 412 × 412, and 832 × 832 images. However, image sensors in real environments are diverse, and thus the size is delivered in various ways. That is, the aspect ratio of the image received from the image sensor is generally 4:3; therefore, the horizontal and vertical sizes are not the same. However, most of the images used in the object detection have the same horizontal and vertical images.
Learning is also undertaken in the same situation as the horizontal and vertical, and the blob size is fixed. Figure 3 shows the state in which the blob is cropped and the state in which it is not. In other words, cropped means that other images around it are lost. However, if it remains uncropped, it is evident that the aspect ratio is estimated at 1:1. Figure 4a shows the estimation of a person in a cropped state, and Figure 4b shows the estimation of a person in an uncropped state. Figure 4c,d show cropped and uncropped images for a fish, respectively.
There is a problem of showing errors in estimation, but there is also a problem that the box does not accurately represent the object. In particular, when estimating in (c) and (d), the weights [73] provided by previous studies were used. It is evident that most of the weights are trained appropriately for the image or video presented in each study. Additionally, a merged weight that combines the weights of deepfish and ozfish [73] is proposed, but if the environment does not match, it is evident that there is an error in the estimation.
Figure 5 is a conceptual diagram of the image segmentation estimation technique. In the image collector, a real-time video is continuously recorded and transmitted in units of 1000. The network distributor and image decomposer in the prediction server proceed when the image arrives.
The network distributor opens as many port numbers as the number of images. The image decomposer divides the image by the size confirmed in the decision and performs object detection through each communication port. The reason why ports are used is to classify and manage image information by port number without losing image information in the process of delivering images of various sizes.
Therefore, in a method to solve this problem, an image segmentation estimation technique is proposed. The image segmentation estimation technique is shown in Figure 5 and Figure 6.
As shown in Figure 6, the image collected in real time is divided into four parts to perform object detection. It can be seen that an object that was not previously detected is detected. Additional results are shown in Figure 7.
Figure 8 is the result of four divisions once more. However, there is a problem that the pixel resolution is lowered, and boxing does not accurately mark the object. In addition, the overall selection problem and object recognition accuracy are low.
If it results in added learning about the object, an estimation suitable for the current situation will be possible. However, in the situation at the ship site, there are problems such as angle position and shaking of the camera, and the influence of the weather is also considered to act as an obstacle to the accurate identification of fish species.
The final image is completed by stitching 80% of the 1/4 quadrant and 80% of the 2/4 quadrant to obtain the final result for user efficiency. Figure 9 shows the result of this, and it was found that it was impossible to estimate the result for the exact image from the existing image. Therefore, it was confirmed that the entire image can be estimated by segmenting and estimating the original image and finally stitching [74,75,76,77] it again using the stitching technique.

Experiments for Inferencing Harvest

Regarding the harvesting of fish species, this can be divided into the long-line fishing method and the purse-seine fishing method. In the case of the long-line method, various studies [61,62,63,64,65] have been conducted, but discussion on the fishing net method is insufficient. The experiment in this study was carried out on the yield in the purse-seine fishing method. The test vessel was a 22-ton class vessel, and the specifications related to the study are shown in Table 2.
Based on the ship specifications, the area where the catch is placed can be calculated, as shown in Figure 10.
Therefore, it can be seen that the area where the fish is placed in the vessel is 47.84 (5.2 m × 9.2 m) m2. If segmentation [78,79,80] is performed, as shown in (a) in Figure 11, the area may be excluded by a person, and the entire segmentation will be performed, as shown in (b).
a = 1 n i = 1 n p i p t × a t
A simple average formula can be calculated, as shown in Equation (1), where n is the number of frames, pt is the total number of pixels in the frame, pi is the number of pixels for which the fishing range is designated, and at is the area where the actual catch is expected to be placed on the ship. However, the index dependent on the actual pixel value is strenuous to use as a standard index for various ships. Therefore, it is described as a random sampling probability model defined in inferential statistics. This is because, in general, a sample obtained through random sampling can be regarded as a random variable that follows the probability distribution of the population, as shown in Figure 12.
In Figure 12, (a) shows the distribution of the actual number of pixels calculated in 8691 frames via Equation (1), and (b) shows the interval distribution for 100,000 values obtained by randomly extracting 10,000 pixels from the actual number of pixels and obtaining the average. Calculations related to catches are shown in Table 3.
In Table 3, the calculation was carried out with reference to Equation (1), and the length per fish was estimated and calculated by applying only weights of crane movement value and weights of catch value for the last 5 year. The fostering port performs sampling on TAC-applied fish species, and at this time, the length of the sampled fish species is reported. By comparing the difference between the reported length and the estimated calculated length, it is possible to estimate whether more than the catch amount was harvested. That is, as shown in Table 3, the estimated calculation is 27.4 cm, and if the inspector reports more than 27.4 cm, it can be determined that more than the yield has been caught.

5. Discussion

In this review, based on the contents currently being studied, we discussed whether these can be applied at sea, and a review was conducted on whether they can be learned while minimizing indiscriminate labeling.
Regarding species identification, automatic labeling was performed by applying existing weights, and images and location information necessary for additional learning were collected from a total of 8691 frames. Using the collected learning images and location information, additional learning was conducted, and manual labeling was not performed. As shown in Figure 13, the picture due to misrecognition was deleted.
The overall learning result is shown in Figure 14, and the maximum learning effect was observed to be 0.157193; the average accuracy was low at 73.68%, considering the accuracy of the experimental image for the boxed image in the existing weight, but it showed a significantly improved recognition rate, as shown in Figure 15. The fact that some errors are shown in species recognition, such as the red box mark, is also a problem and needs to be improved.
In addition, the results related to segmentation are shown in Figure 16. In the case of (a), the number of red pixels is 320,617, and the calculation result of (b) is 475,977. Based on this, the size per fish was calculated to estimate the catch.

6. Conclusions

There are numerous ships in the sea, and it is inevitable that resource depletion will occur, which must be prepared for. Continuing on the current path and deferring to observers without aid will not be enough to ensure the future of the ocean. With the introduction of EM to support observers on ships, many studies are being conducted on analyzing images.
In particular, YOLO and SSD are represented in relation to learning and estimation centered on object detection, and various networks for image learning, such as Mask R-CNN, CNN, and R-CNN, are applied.
However, for direct applications in industry, many difficult challenges must be solved. Directly introducing and using the weight produced by existing learning will bring about many unexpected situations in detection. As most studies learn and make inferences based on related images, good results will not be obtained as expected if the same data are not used. Therefore, an image segmentation estimation technique was introduced here as a method for maximizing estimation while reducing the intensity of learning. Although the same weight is used, the image transmitted in real time is divided into four parts to enable estimation, and estimation is attempted in each image. It was confirmed that fish that were not detected before division were detected after division. However, an unclear phenomenon in which the accuracy of object recognition is reduced was also found. The current image was extracted from a 1024 × 720 30 FPS image, and as a result of the experiment, up to four divisions three times, the size of the image fell to 45 × 80, and detection was not performed at the expected level by estimation. However, if the technique presented in the video is applied, such as a 3840 × 2160 4 k image and a 7680 × 4320 8 k image, it is expected to show high estimation accuracy while minimizing manual labeling work. However, there is a limit where a high-specification system is required in such an experiment.
Using image detection, segmentation, and stitching, which are representative of the current study, we conceived an EM system that can be supported by ships, and we reviewed the problems in implementation through experiments. In particular, we reviewed the parts that can be automated regarding image quality, which is closely related to the accuracy of detecting and the part that utilizes the weights learned in the existing detection. The part that uses the segmentation technique to perform this was explained. In this review, it was found that weights are learned differently depending on the environment, and as a result, it was found that there are many problems in the actual use of the technique. A method for conducting learning was presented, and in the case of measuring the total catch in a purse-seine fishing boat, there is a problem in that it is difficult to estimate the exact catch. Although the technique for estimating the amount of catch was explained, it is thought that consultation with the institution should be prioritized in actual application.
In future research, we intend to increase the recognition rate through image segmentation detection and additional learning targeting 4 k images; additionally, we plan to conduct research on a large number of clustered objects.

Author Contributions

Conceptualization, T.K. and Y.K.; methodology, T.K.; software, Y.K.; validation, T.K. and Y.K.; formal analysis, T.K. and Y.K.; investigation, Y.K.; resources, T.K.; data curation, T.K.; writing—original draft preparation, Y.K.; writing—review and editing, T.K. and Y.K.; visualization, T.K.; supervision, T.K. and Y.K.; project administration, T.K. and Y.K.; funding acquisition, T.K. All authors have read and agreed to the published version of the manuscript.

Funding

This research was funded by a study on the “Leaders in INdustry-university Cooperation 3.0” Project, supported by the Ministry of Education and National Research Foundation of Korea.

Acknowledgments

The program links in this paper are as follows. Prediction server and client: https://pypi.org/project/EMS-analyzer/ (accessed on 13 February 2023). Image collector: https://pypi.org/project/emtransmission/ (accessed on 20 January 2023).

Conflicts of Interest

The authors declare no conflict of interest.

References

  1. Choi, J.H. A Study on Conservation and Management Implementation System of WCPFC for Marine Living Resources; The Korea Institute of Marine Law: Busan, Republic of Korea, 2008; Volume 20, pp. 1–26. [Google Scholar]
  2. Ministry of Oceans and Fisheries. Research on Ways to Strengthen the Competitiveness of the Ocean Industry; Ministry of Oceans and Fisheries: Sejong, Republic of Korea, 2017. [Google Scholar]
  3. Son, J.H. A Study on the Conservation and Management of Marine Living Resources and Countermeasure against IUU Fishing. Ph.D. Thesis, Pukyong National University, Busan, Republic of Korea, 2011. [Google Scholar]
  4. Choi, J.H. Measures to Vitalize Bilateral International Cooperation in the Fisheries Filed; Ministry of Agriculture, Food and Rural Affairs: Sejong, Republic of Korea, 2010. [Google Scholar]
  5. Choi, J.S. Climate Change Response Research—Global Maritime Strategy Establishment Research; Ministry of Oceans and Fisheries: Sejong, Republic of Korea, 2006. [Google Scholar]
  6. Hong, H.P. A Study on the 2nd Comprehensive Plan for Ocean Industry Development; Ministry of Oceans and Fisheries: Sejong, Republic of Korea, 2014. [Google Scholar]
  7. Ministry of Oceans and Fisheries. Study on Detailed Action Plan for Seabirds and Shark International Action Plan; Ministry of Oceans and Fisheries: Sejong, Republic of Korea, 2006. [Google Scholar]
  8. Do, Y.J. Measures to Create International Observer Jobs in Deep Sea Fisheries; Ministry of Oceans and Fisheries: Sejong, Republic of Korea, 2017. [Google Scholar]
  9. Go, K.M. Ecosystem-Based Fishery Resource Evaluation and Management System Research; Ministry of Oceans and Fisheries: Sejong, Republic of Korea, 2010. [Google Scholar]
  10. Snow, R.; O’Connor, B.; Jurafsky, D.; Ng, A.Y. Proceedings of the Conference on Empirical Methods in Natural Language Processing—EMNLP’08, Honolulu, HI, USA, 25–27 October 2008; Association for Computational Linguistics: Morristown, NJ, USA, 2008; pp. 254p. Available online: http://portal.acm.org/citation.cfm?doid=1613715.1613751 (accessed on 25 October 2008).
  11. Whitehill, J.; Ruvolo, P.; Wu, T.; Bergsma, J.; Movellan, J. Whose vote should count more: Optimal integration of labels from labelers of unknown expertise. Adv. Neural Inf. Process. Syst. 2009, 22, 1–9. [Google Scholar]
  12. Liu, Q.; Peng, J.; Ihler, A. Variational inference for crowdsourcing. Adv. Neural Inf. Process. Syst. 2012, 25, 1–9. [Google Scholar]
  13. Hong, C. Generative Models for Learning from Crowds. arXiv 2017, arXiv:1706.03930. [Google Scholar]
  14. Raykar, V.C.; Yu, S. Eliminating spammers and ranking annotators for crowdsourced labeling tasks. J. Mach. Learn. Res. 2012, 13, 491–518. [Google Scholar]
  15. Khan Khattak, F.; Salleb-Aouissi, A. Crowdsourcing learning as domain adaptation. In Proceedings of the Second Workshop on Computational Social Science and the Wisdom of Crowds (NIPS 2011), Sierra Nevada, Spain, 7 December 2011; pp. 1–5. [Google Scholar]
  16. Russakovsky, O.; Deng, J.; Su, H.; Krause, J.; Satheesh, S.; Ma, S.; Huang, Z.; Karpathy, A.; Khosla, A.; Bernstein, M.; et al. ImageNet Large Scale Visual Recognition Challenge. Int. J. Comput. Vis. 2015, 115, 211–252. [Google Scholar] [CrossRef]
  17. Lin, T.-Y.; Maire, M.; Belongie, S.; Bourdev, L.; Girshick, R.; Hays, J.; Perona, P.; Ramanan, D.; Zitnick, C.L.; Dollár, P. Microsoft COCO: Common Objects in Context. arXiv 2014, arXiv:1405.0312. [Google Scholar]
  18. Su, H.; Deng, J.; Fei-fei, L. Crowdsourcing annotations for visual object detection. In Proceedings of the 2012 Twenty-Sixth AAAI Conference on Artificial Intelligence, Toronto, ON, Canada, 22–26 July 2012; pp. 40–46. [Google Scholar]
  19. Idrees, H.; Saleemi, I.; Seibert, C.; Shah, M. Multi-source Multi-scale Counting in Extremely Dense Crowd Images. In Proceedings of the 2013 IEEE Conference on Computer Vision and Pattern Recognition (IEEE), Portland, OR, USA, 23–28 June 2013; pp. 2547–2554. Available online: http://ieeexplore.ieee.org/document/6619173/ (accessed on 23 June 2013).
  20. Guerrero-Gomez-Olmedo, R.; Torre-Jimenez, B.; Lopez-Sastre, R.; Maldonado-Bascon, S.; Onoro-Rubio, D. Extremely overlapping vehicle counting. In Proceedings of the 2015 Iberian Conference on Pattern Recognition and Image Analysis, Santiago de Compostela, Spain, 17–19 June 2015; 2, pp. 423–431. [Google Scholar]
  21. Sanchez-Torres, G.; Ceballos-Arroyo, A.; Robles-Serrano, S. Automatic measurement of fish weight and size by processing underwater hatchery images. Eng. Lett. 2018, 26, 461–471. [Google Scholar]
  22. Viazzi, S.; Van Hoestenberghe, S.; Goddeeris, B.; Berckmans, D. Automatic mass estimation of jade perch scortum barcoo by computer vision. Aquac. Eng. 2015, 64, 42–48. [Google Scholar] [CrossRef]
  23. Konovalov, D.A.; Saleh, A.; Domingos, J.A.; White, R.D.; Jerry, D.R. Estimating mass of harvested asian seabass lates calcarifer from images. World J. Eng. Technol. 2018, 6, 15. [Google Scholar] [CrossRef]
  24. Domingos, J.A.; Smith-Keune, C.; Jerry, D.R. Fate of genetic diversity within and between generations and implications for dna parentage analysis in selective breeding of mass spawners: A case study of commercially farmed barramundi, lates calcarifer. Aquaculture 2014, 424, 174–182. [Google Scholar] [CrossRef]
  25. Huxley, J.S. Constant differential growth-ratios and their significance. Nature 1924, 114, 895–896. [Google Scholar] [CrossRef]
  26. Zion, B. The use of computer vision technologies in aquaculture a review. Comput. Electron. Agric. 2012, 88, 125–132. [Google Scholar] [CrossRef]
  27. MBalaban, O.; Chombeau, M.; Cırban, D.; Gumus, B. Prediction of the weight of alaskan pollock using image analysis. J. Food Sci. 2010, 75, E552–E556. [Google Scholar] [CrossRef]
  28. LeCun, Y.; Bengio, Y.; Hinton, G. Deep learning. Nature 2015, 521, 436. [Google Scholar] [CrossRef] [PubMed]
  29. Monteagudo, J.P.; Legorburu, G.; Justel-Rubio, A.; Restrepo, V. Preliminary study about the suitability of an electronic monitoring system to record scientific and other information from the tropical tuna purse seine fishery. Collect. Vol. Sci. Pap. ICCAT 2015, 71, 440–459. [Google Scholar]
  30. Rodrigues, M.T.; Padua, F.L.; Gomes, R.M.; Soares, G.E. Automatic fish species classification based on robust feature extraction techniques and artificial immune systems. In Proceedings of the 2010 IEEE Fifth International Conference on Bio-Inspired Computing: Theories and Applications (BIC-TA), Changsha, China, 23–26 September 2010; pp. 1518–1525. [Google Scholar]
  31. Hu, J.; Li, D.; Duan, Q.; Han, Y.; Chen, G.; Si, X. Fish species classification by color, texture and multi-class support vector machine using computer vision. Comput. Electron. Agric. 2012, 88, 133–140. [Google Scholar] [CrossRef]
  32. Li, X.; Shang, M.; Qin, H.; Chen, L. Fast accurate fish detection and recognition of underwater images with fast R-CNN. In Proceedings of the OCEANS’15 MTS/IEEE, Washington, DC, USA, 19–22 October 2015; pp. 1–5. [Google Scholar]
  33. Navarro, A.; Lee-Montero, I.; Santana, D.; Henríquez, P.; Ferrer, M.A.; Morales, A.; Soula, M.; Badilla, R.; Negrín-Báez, D.; Zamorano, M.J.; et al. IMAFISH_ML: A fully-automated image analysis software for assessing fish morphometric traits on gilthead seabream (Sparus aurata L.), meagre (Argyrosomus regius) and red porgy (Pagrus pagrus). Comput. Electron. Agric. 2016, 121, 66–73. [Google Scholar] [CrossRef]
  34. Huang, P.X.; Boom, B.J.; Fisher, R.B. Hierarchical classification with reject option for live fish recognition. Mach. Vis. Appl. 2015, 26, 89–102. [Google Scholar] [CrossRef]
  35. Marini, S.; Corgnati, L.; Mantovani, C.; Bastianini, M.; Ottaviani, E.; Fanelli, E.; Aguzzi, J.; Griffa, A.; Poulain, P.M. Automated estimate of fish abundance through the autonomous imaging device GUARD1. Measurement 2018, 126, 72–75. [Google Scholar] [CrossRef]
  36. Redmon, J.; Ali, F. YOLO9000: Better, faster, stronger. In Proceedings of the IEEE Conference on Computer Vision and Pattern Recognition, Honolulu, HI, USA, 21–26 July 2017. [Google Scholar]
  37. Redmon, J.; Farhadi, A. Yolov3: An incremental improvement. arXiv 2018, arXiv:1804.02767. [Google Scholar]
  38. Pham, T.N.; Nguyen, V.H.; Huh, J.H. Integration of improved YOLOv5 for face mask detector and auto-labeling to generate dataset for fighting against COVID-19. J. Supercomput. 2023, 79, 8966–8992. [Google Scholar] [CrossRef] [PubMed]
  39. Liu, W.; Anguelov, D.; Erhan, D.; Szegedy, C.; Reed, S.; Fu, C.Y.; Berg, A.C. Ssd: Single shot multibox detector. In Proceedings of the Computer Vision–ECCV 2016: 14th European Conference, Amsterdam, The Netherlands, 11–14 October 2016; Proceedings, Part 1–14; Springer International Publishing: Cham, Switzerland, 2016. [Google Scholar]
  40. Li, Z.; Zhou, F. FSSD. Feature fusion single shot multibox detector. arXiv 2017, arXiv:1712.00960. [Google Scholar]
  41. Siddiqui, S.A.; Salman, A.; Malik, M.I.; Shafait, F.; Mian, A.; Shortis, M.R.; Harvey, E.S. Automatic fish species classification in underwater videos: Exploiting pre-trained deep neural network models to compensate for limited labelled data. ICES J. Mar. Sci. 2017, 75, 374–389. [Google Scholar] [CrossRef]
  42. Ali-Gombe, A.; Elyan, E.; Jayne, C. August. Fish classification in context of noisy images. In Proceedings of the International Conference on Engineering Applications of Neural Networks, Athens, Greece, 25–27 August 2017; Springer: Cham, Switzerland, 2017; pp. 216–226. [Google Scholar]
  43. Lu, Y.-C.; Chen, T.; Kuo, Y.F. Identifying the species of harvested tuna and billfish using deep convolutional neural networks. ICES J. Mar. Sci. 2020, 77, 1318–1329. [Google Scholar] [CrossRef]
  44. Ames, R.T.; Leaman, B.M.; Ames, K.L. Evaluation of video technology for monitoring of multispecies longline catches. N. Am. J. Fish. Manag. 2007, 27, 955–964. [Google Scholar] [CrossRef]
  45. Kindt-Larsen, L.; Kirkegaard, E.; Dalskov, J. Fully documented fishery: A tool to support a catch quota management system. ICES J. Mar. Sci. 2011, 68, 1606–1610. [Google Scholar] [CrossRef]
  46. Needle, C.L.; Dinsdale, R.; Buch, T.B.; Catarino, R.M.; Drewery, J.; Butler, N. Scottish science applications of remote electronic monitoring. ICES J. Mar. Sci. 2015, 72, 1214–1229. [Google Scholar] [CrossRef]
  47. Bartholomew, D.C.; Mangel, J.C.; Alfaro-Shigueto, J.; Pingo, S.; Jimenez, A.; Godley, B.J. Remote electronic monitoring as a potential alternative to on-board observers in small-scale fisheries. Biol. Conserv. 2018, 219, 35–45. [Google Scholar] [CrossRef]
  48. Van Helmond, A.T.; Chen, C.; Poos, J.J. Using electronic monitoring to record catches of sole (Solea solea) in a bottom trawl fishery. ICES J. Mar. Sci. 2017, 74, 1421–1427. [Google Scholar] [CrossRef]
  49. White, D.J.; Svellingen, C.; Strachan, N.J. Automated measurement of species and length of fish by computer vision. Fish. Res. 2006, 80, 203–210. [Google Scholar] [CrossRef]
  50. Larsen, R.; Olafsdottir, H.; Ersbøll, B.K. Shape and texture based classification of fish species. In Proceedings of the Scandinavian Conference on Image Analysis, Oslo, Norway, 15–18 June 2009; Springer: Berlin/Heidelberg, Germany, 2009; pp. 745–749. [Google Scholar]
  51. Shafry MR, M.; Rehman, A.; Kumoi, R.; Abdullah, N.; Saba, T. FiLeDI framework for measuring fish length from digital images. Int. J. Phys. Sci. 2012, 7, 607–618. [Google Scholar]
  52. Morais, E.F.; Campos MF, M.; Padua, F.L.; Carceroni, R.L. Particle filter-based predictive tracking for robust fish counting. In Proceedings of the XVIII Brazilian Symposium on Computer Graphics and Image Processing (SIBGRAPI’05), Rio Grande do Norte, Brazil, 9–12 October 2005; pp. 367–374. [Google Scholar]
  53. Spampinato, C.; Chen-Burger, Y.H.; Nadarajan, G.; Fisher, R.B. Detecting, tracking and counting fish in low quality unconstrained underwater videos. VISAPP 2008, 1, 514–519. [Google Scholar]
  54. Toh, Y.H.; Ng, T.M.; Liew, B.K. Automated fish counting using image processing. In Proceedings of the 2009 International Conference on Computational Intelligence and Software Engineering, Wuhan, China, 11–13 December 2009; pp. 1–5. [Google Scholar]
  55. LeCun, Y.; Bottou, L.; Bengio, Y.; Haffner, P. Gradient-based learning applied to document recognition. Proc. IEEE 1998, 86, 2278–2324. [Google Scholar] [CrossRef]
  56. Krizhevsky, A.; Sutskever, I.; Hinton, G.E. Imagenet classification with deep convolutional neural networks. Adv. Neural Inf. Process. Syst. 2012, 2, 1097–1105. [Google Scholar] [CrossRef]
  57. Tran, D.T.; Huh, J.-H. New machine learning model based on the time factor for e-commerce recommendation systems. J. Supercomput. 2022, 79, 6756–6801. [Google Scholar] [CrossRef]
  58. Huh, J.-H.; Seo, K. Artificial intelligence shoe cabinet using deep learning for smart home. In Advanced Multimedia and Ubiquitous Engineering; MUE/FutureTech 2018; Springer: Singapore, 2019. [Google Scholar]
  59. Lim, S.C.; Huh, J.H.; Hong, S.H.; Park, C.Y.; Kim, J.C. Solar Power Forecasting Using CNN-LSTM Hybrid Model. Energies 2022, 15, 8233. [Google Scholar] [CrossRef]
  60. French, G.; Fisher, M.H.; Mackiewicz, M.; Needle, C. Convolutional neural networks for counting fish in fisheries surveillance video. In Proceedings of the Machine Vision of Animals and their Behaviour (MVAB), Swansea, UK, 10 September 2015; pp. 7.1–7.10. [Google Scholar]
  61. Li, X.; Shang, M.; Hao, J.; Yang, Z. Accelerating fish detection and recognition by sharing CNNs with objectness learning. In Proceedings of the OCEANS 2016-Shanghai, Shanghai, China, 10–13 April 2016; pp. 1–5. [Google Scholar]
  62. Ren, S.; He, K.; Girshick, R.; Sun, J. Faster R-CNN: Towards real-time object detection with region proposal networks. Adv. Neural Inf. Process. Syst. 2015, 28, 91–99. [Google Scholar] [CrossRef] [PubMed]
  63. Qin, H.; Li, X.; Liang, J.; Peng, Y.; Zhang, C. DeepFish: Accurate underwater live fish recognition with a deep architecture. Neurocomputing 2016, 187, 49–58. [Google Scholar] [CrossRef]
  64. Zhuang, P.; Xing, L.; Liu, Y.; Guo, S.; Qiao, Y. Marine animal detection and recognition with advanced deep learning models. In Proceedings of the CLEF (Working Notes), Dublin, Ireland, September 2017; pp. 11–14. [Google Scholar]
  65. Liu, W.; Anguelov, D.; Erhan, D.; Szegedy, C.; Reed, S.; Fu, C.Y.; Berg, A.C. Ssd: Single shot multibox detector. In Proceedings of the European Conference on Computer Vision, Amsterdam, The Netherlands, 11–14 October 2016; Springer: Cham, Switzerland, 2016; pp. 21–37. [Google Scholar]
  66. Simonyan, K.; Zisserman, A. Very deep convolutional networks for large-scale image recognition. arXiv 2014, arXiv:1409.1556. [Google Scholar]
  67. Sung, M.; Yu, S.C.; Girdhar, Y. Vision based real-time fish detection using convolutional neural network. In Proceedings of the OCEANS 2017-Aberdeen, Aberdeen, UK, 19–22 June 2017; pp. 1–6. [Google Scholar]
  68. Redmon, J.; Divvala, S.; Girshick, R.; Farhadi, A. You only look once: Unified, real-time object detection. In Proceedings of the IEEE Conference on Computer Vision and Pattern Recognition, Las Vegas, NV, USA, 26 June–1 July 2016; pp. 779–788. [Google Scholar]
  69. Jäger, J.; Wolff, V.; Fricke-Neuderth, K.; Mothes, O.; Denzler, J. Visual fish tracking: Combining a two-stage graph approach with CNN-features. In Proceedings of the OCEANS 2017-Aberdeen, Aberdeen, UK, 19–22 June 2017; pp. 1–6. [Google Scholar]
  70. Zheng, Z.; Guo, C.; Zheng, X.; Yu, Z.; Wang, W.; Zheng, H.; Fu, M.; Zheng, B. Fish recognition from a vessel camera using deep convolutional neural network and data augmentation. In Proceedings of the 2018 OCEANS-MTS/IEEE Kobe Techno-Oceans (OTO), Kobe, Japan, 28–31 May 2018; pp. 1–5. [Google Scholar]
  71. Tseng, C.H.; Hsieh, C.L.; Kuo, Y.F. Automatic measurement of the body length of harvested fish using convolutional neural networks. Biosyst. Eng. 2020, 189, 36–47. [Google Scholar] [CrossRef]
  72. Monkman, G.G.; Hyder, K.; Kaiser, M.J.; Vidal, F.P. Using machine vision to estimate fish length from images using regional convolutional neural networks. Methods Ecol. Evol. 2019, 10, 2045–2056. [Google Scholar] [CrossRef]
  73. Al Muksit, A.; Hasan, F.; Emon MF, H.B.; Haque, M.R.; Anwary, A.R.; Shatabda, S. YOLO-Fish: A robust fish detection model to detect fish in realistic underwater environment. Ecol. Inform. 2022, 72, 101847. [Google Scholar] [CrossRef]
  74. Chen, Y.-S.; Chuang, Y.-Y. Natural image stitching with the global similarity prior. In Proceedings of the 14th European Conference Computer Vision—ECCV 2016, Amsterdam, The Netherlands, 11–14 October 2016; pp. 186–201. [Google Scholar]
  75. Zhang, G.; He, Y.; Chen, W.; Jia, J.; Bao, H. Multi-viewpoint panorama construction with wide-baseline images. IEEE Trans. Image Process. 2016, 25, 3099–3111. [Google Scholar] [CrossRef] [PubMed]
  76. Li, S.; Yuan, L.; Sun, J.; Quan, L. Dual-feature warping-based motion model estimation. In Proceedings of the 2015 IEEE International Conference on Computer Vision Workshop (ICCVW), Washington, DC, USA, 7–13 December 2015; pp. 4283–4291. [Google Scholar]
  77. Hartley, R.; Zisserman, A. Multiple View Geometry in Computer Vision; Cambridge University Press: Cambridge, UK, 2003. [Google Scholar]
  78. Minaee, S.; Boykov, Y.; Porikli, F.; Plaza, A.; Kehtarnavaz, N.; Terzopoulos, D. Image segmentation using deep learning: A survey. IEEE Trans. Pattern Anal. Mach. Intell. 2021, 44, 3523–3542. [Google Scholar] [CrossRef] [PubMed]
  79. Ghosh, S.; Das, N.; Das, I.; Maulik, U. Understanding deep learning techniques for image segmentation. ACM Comput. Surv. (CSUR) 2019, 52, 1–35. [Google Scholar] [CrossRef]
  80. Jone, A.; Friston, K.J. Unified segmentation. Neuroimage 2005, 26, 839–851. [Google Scholar]
Figure 1. An overview of the proposed EM system.
Processes 11 01261 g001
Figure 2. The EM system structure.
Processes 11 01261 g002
Figure 3. A comparison of cropped and uncropped images.
Processes 11 01261 g003
Figure 4. A comparison of predicted images after setting up the cropped and uncropped images: (a) cropped image for a person; (b) uncropped image for a person; (c) cropped image for a fish; (d) uncropped image for a fish.
Processes 11 01261 g004
Figure 5. A conceptual diagram of the image segmentation estimation technique.
Processes 11 01261 g005
Figure 6. Prediction results for the first quadrant image.
Processes 11 01261 g006
Figure 7. Details of prediction results for the first quadrant image.
Processes 11 01261 g007
Figure 8. Prediction results and details for the second quadrant image.
Processes 11 01261 g008
Figure 9. An example of combining image collections using stitching: (a) 80% of the 1/4 quadrant; (b) 80% of the 2/4 quadrant; and (c) results of the stitching technique.
Processes 11 01261 g009
Figure 10. Representation for the size of the place where the caught fish are located.
Processes 11 01261 g010
Figure 11. Labeling regarding segmentation: (a) is considering the person and others in labeling; (b) is not considering other objects.
Processes 11 01261 g011
Figure 12. Mean distribution estimation through interval distribution: (a) interval distribution of all pixel values; (b) mean distribution through sampling average (100,000 samples performed 100,000 times).
Processes 11 01261 g012
Figure 13. Example of automatic labeling using existing weights: (a) image with box recorded for review; (b) images and location information documents without box marks for learning.
Processes 11 01261 g013
Figure 14. Loss average result over 3000 units.
Processes 11 01261 g014
Figure 15. Example of detection result through additional learning.
Processes 11 01261 g015
Figure 16. Example of pixel calculation for fish: (a) area—320617, total—921600, fish_area (%)—34.789171006944447; (b) area—475977, total—921600, fish_area (%)—51.64680989583333.
Processes 11 01261 g016
Table 1. The current status of MCS operation system of local fisheries organizations related to highly migratory fish resources [4].
MCS elements 1CCSBTFFAIATTCICCATIOTCWCPFC
VMS 2:o 3ooooo
-Operating entityShipperSecretariatShipperShipperShipperShipper
-Target boatOver 24 mOver 24 mOver 24 mOver 24 mOver 24 mOver 24 m
-Reporting interval6 h6 h6 h6 h6 h6 h
Observer system:ooo (Surrounding net)ox 4o
-TaskScientific researchScientific research,
surveillance
SurveillanceScientific research-Scientific research,
surveillance
-Operating entityShipperNearshoreShipper
Secretariat
Shipper-Shipper,
secretariat
-Boarding ratio10%Bilateral agreement100%10%-10%
-Bear costsxVessel,
shipowner
Shipper
Secretariat
x-Shipowner,
shipper
Monitoring port statexoxooo
Monitoring boarding in High seaxXxxxo
Surveilling the entry of goods into shipxo(Prohibition)xoxo
Statistical document preparationo-oooo
List of IUU fishing vessel nameoxoooo
Fishing vessel registrationoooooo
MCS elements 1: Commission for the Conservation of Southern Bluefin Tuna (CCSBT), Forum Fisheries Agency Convention (FFA), Inter-American Tropical Tuna Commission (IATTC), The International Commission for the Conservation of Atlantic Tunas (ICCAT), Indian Ocean Tuna Commission (IOTC), The Western and Central Pacific Fisheries Commission (WCPFC); VMS 2: vessel monitoring system; 3: adopted; × 4: not adopted.
Table 2. A specification of the test ship.
ClassificationShip Specification
Ship nameSeonrin
Gross tonnage22 ton
Length over all18.6 m
Beam5.2 m
Table 3. Example of calculating estimated size per fish.
CategoryPixel (Mean)Area (m2)After Applying Weights 1After Applying Weights 2Length (m)
(Piece of Fish)
Real data445,93822.62942452.58840.0754310.274648
Inferential Statistics424,72122.04715440.9430.073490.271091
Weights 1: crane movement index; weights 2: catch index for the last 5 years.
Disclaimer/Publisher’s Note: The statements, opinions and data contained in all publications are solely those of the individual author(s) and contributor(s) and not of MDPI and/or the editor(s). MDPI and/or the editor(s) disclaim responsibility for any injury to people or property resulting from any ideas, methods, instructions or products referred to in the content.

