
Assessing the Impact of Ethanol/Biodiesel/Diesel Blends and Nanoparticle Fuel Additives on Performance and Emissions in a DI Diesel Engine with EGR Integration: An Experimental Study
 ,
,
Abstract
:1. Introduction
2. Materials and Methods
2.1. Fuel
2.2. Preparation of Fuel Blends with TiO2 Additive
2.3. Exhaust Gas Recirculation (EGR)
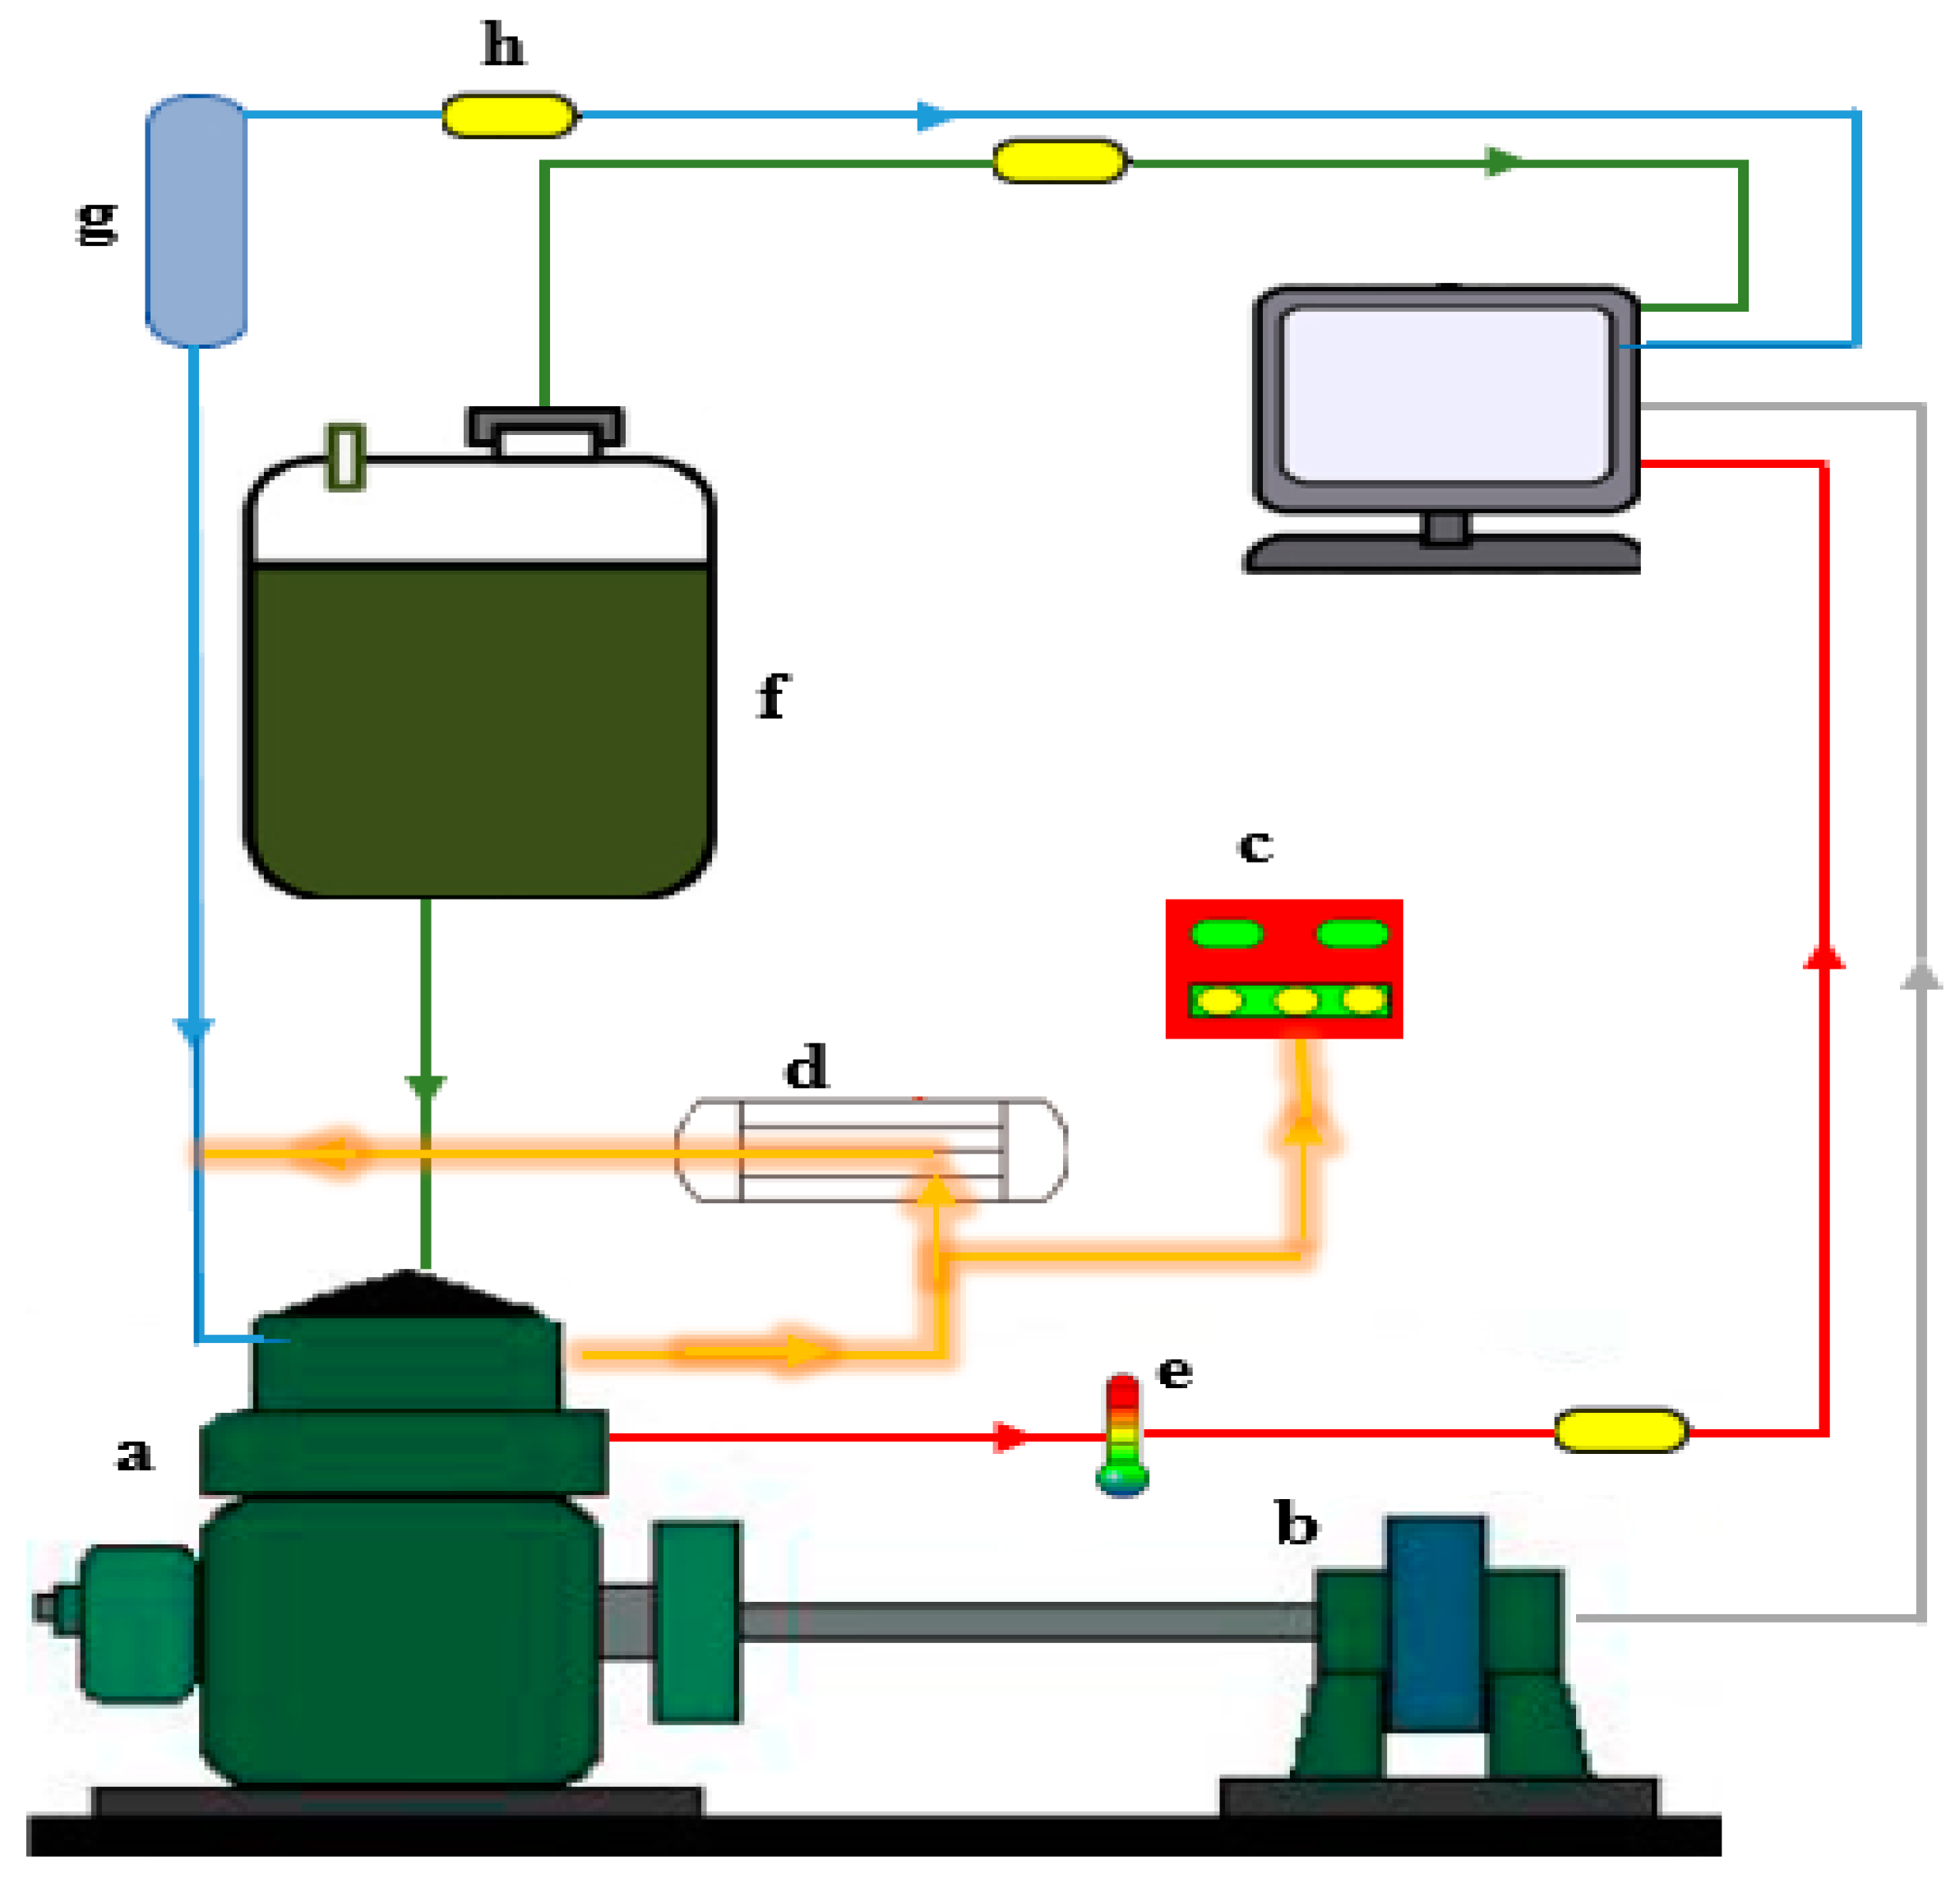
2.4. Experimental Setup
2.5. Uncertainty Analysis
3. Discussion on Results
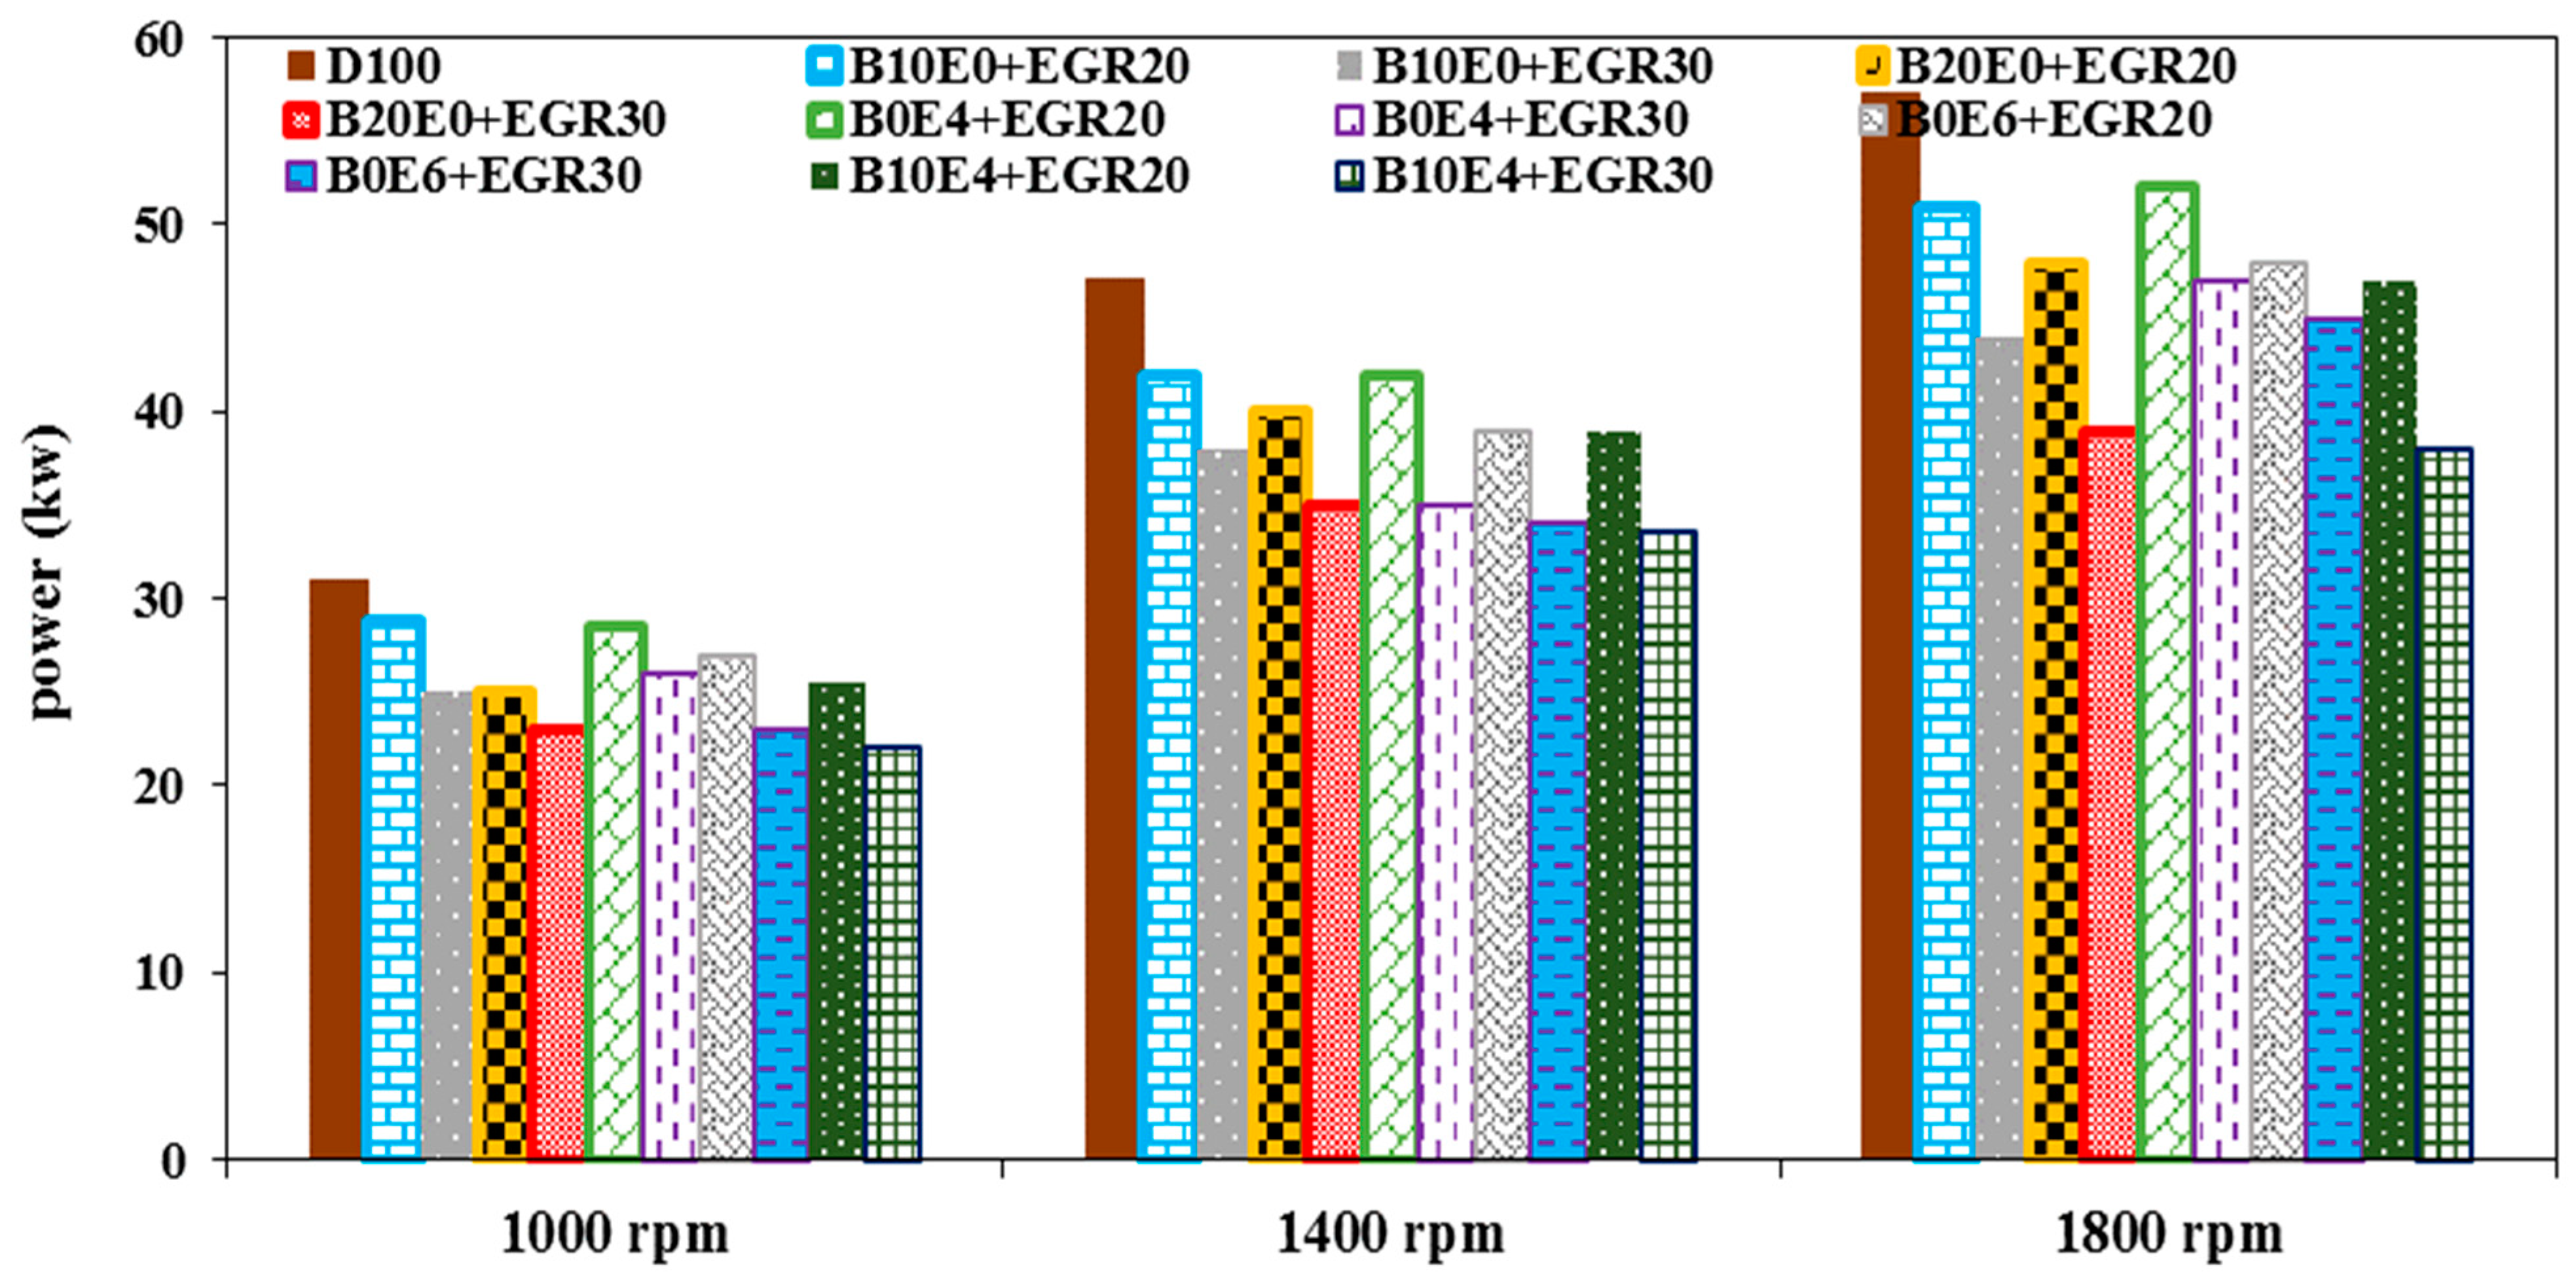
3.1. Brake Power
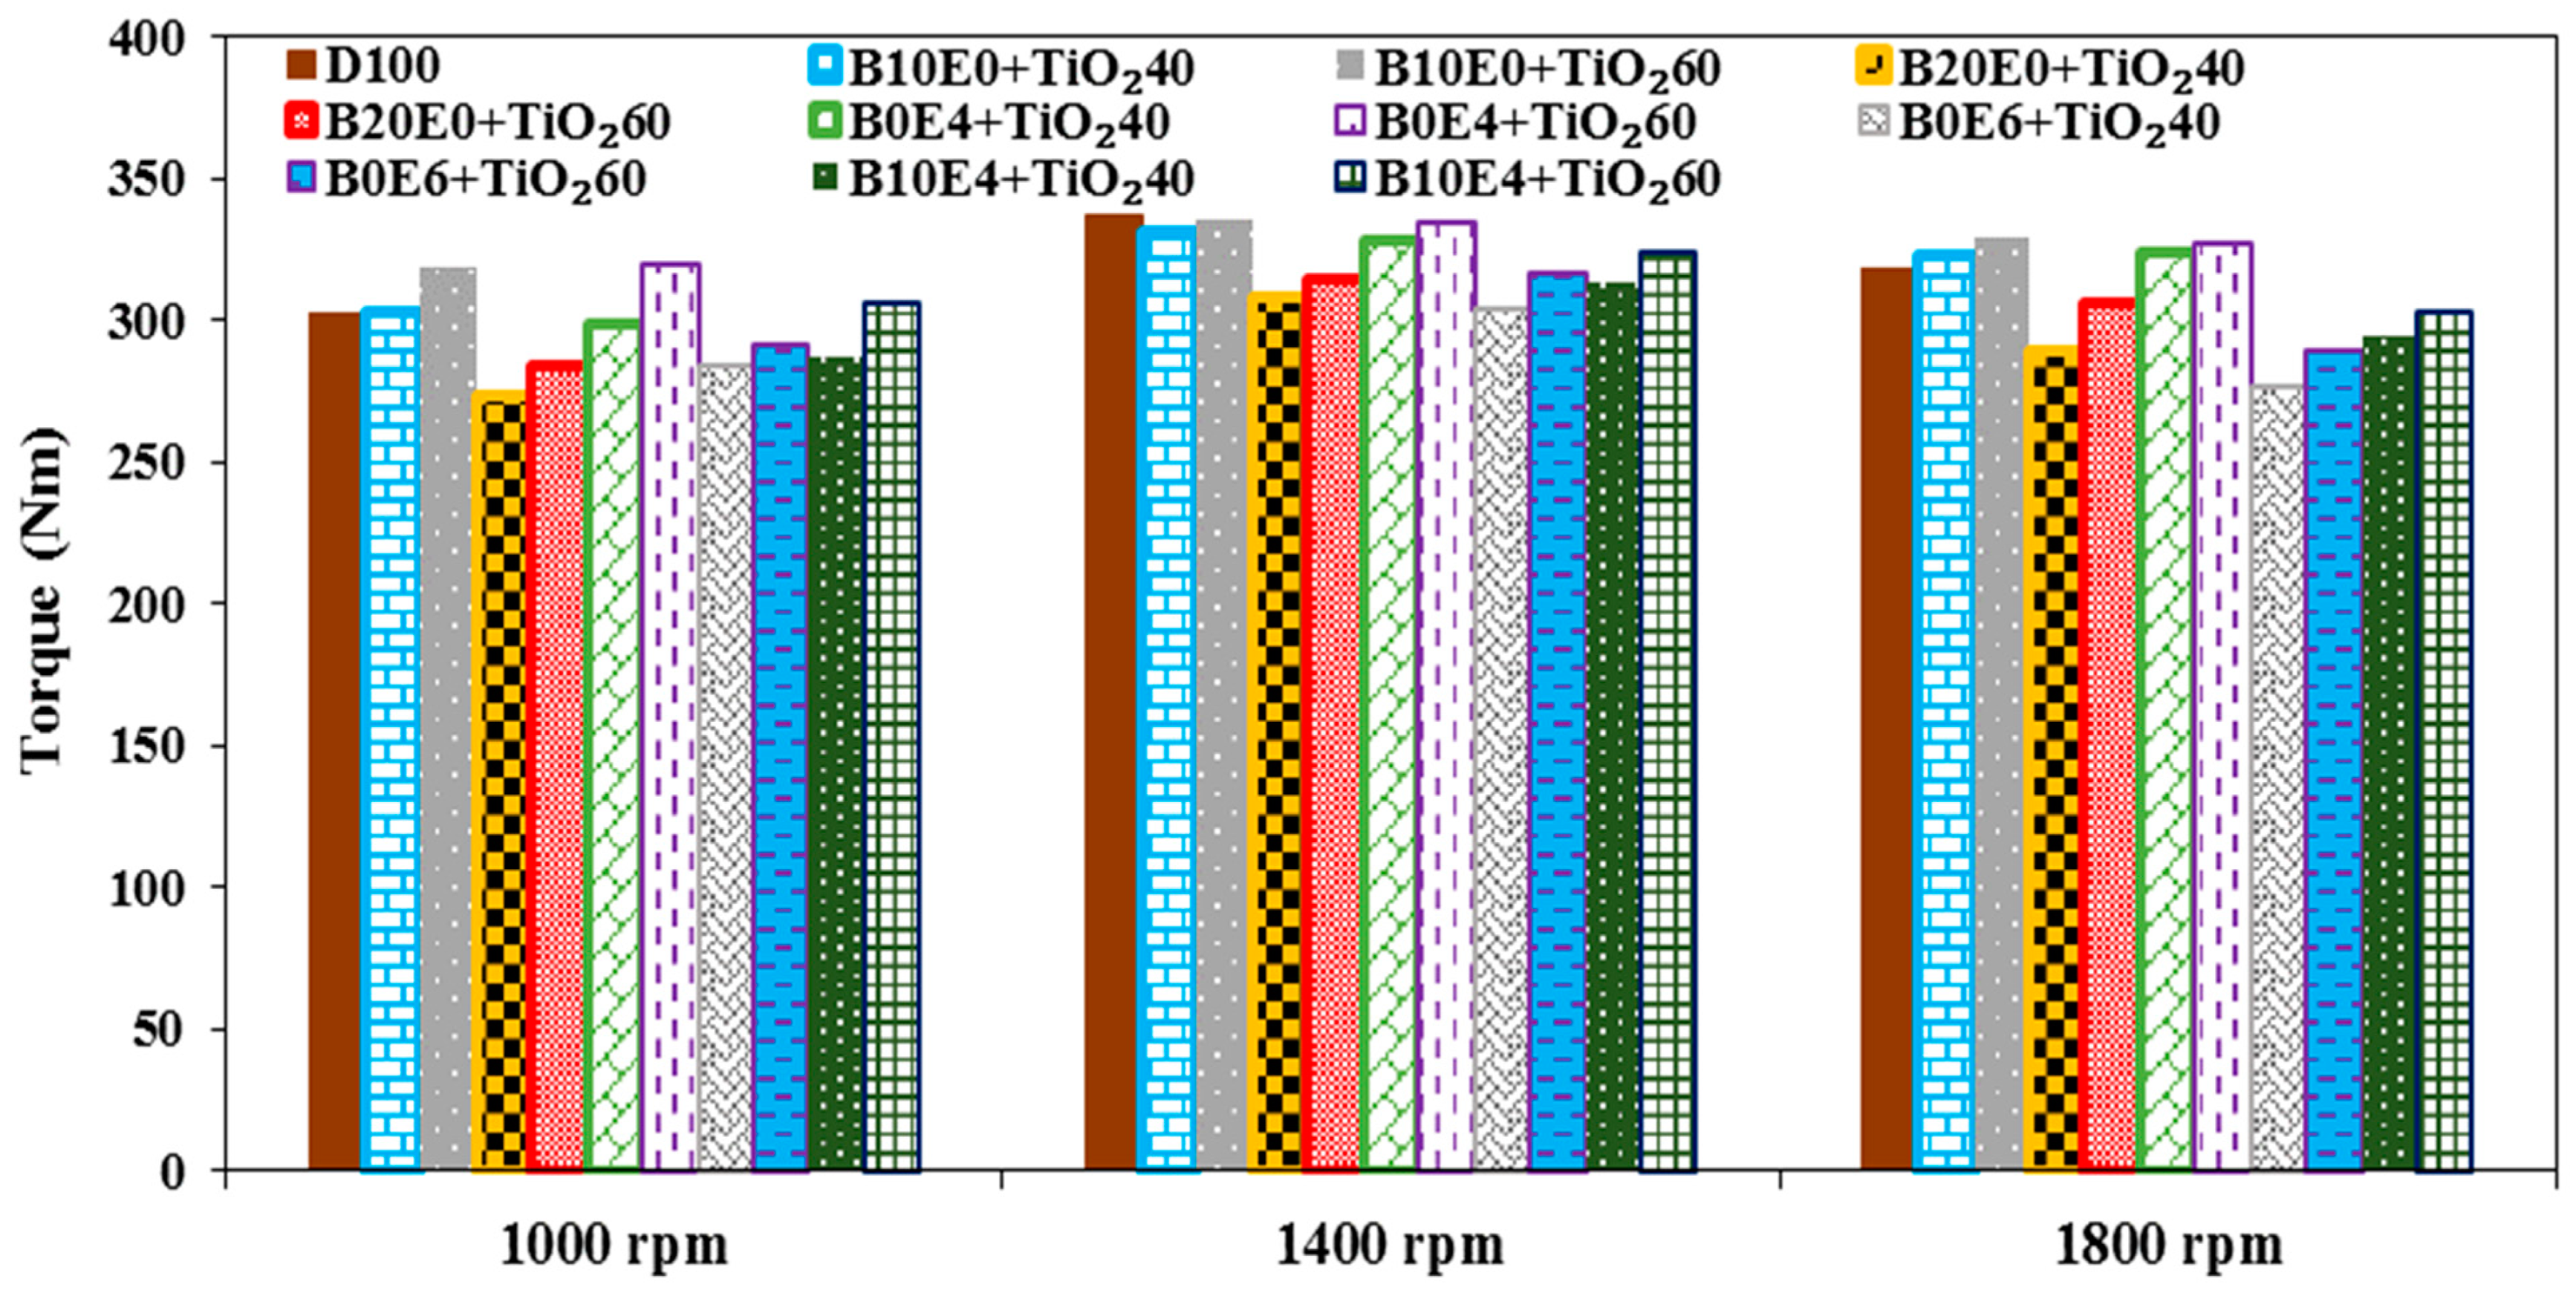
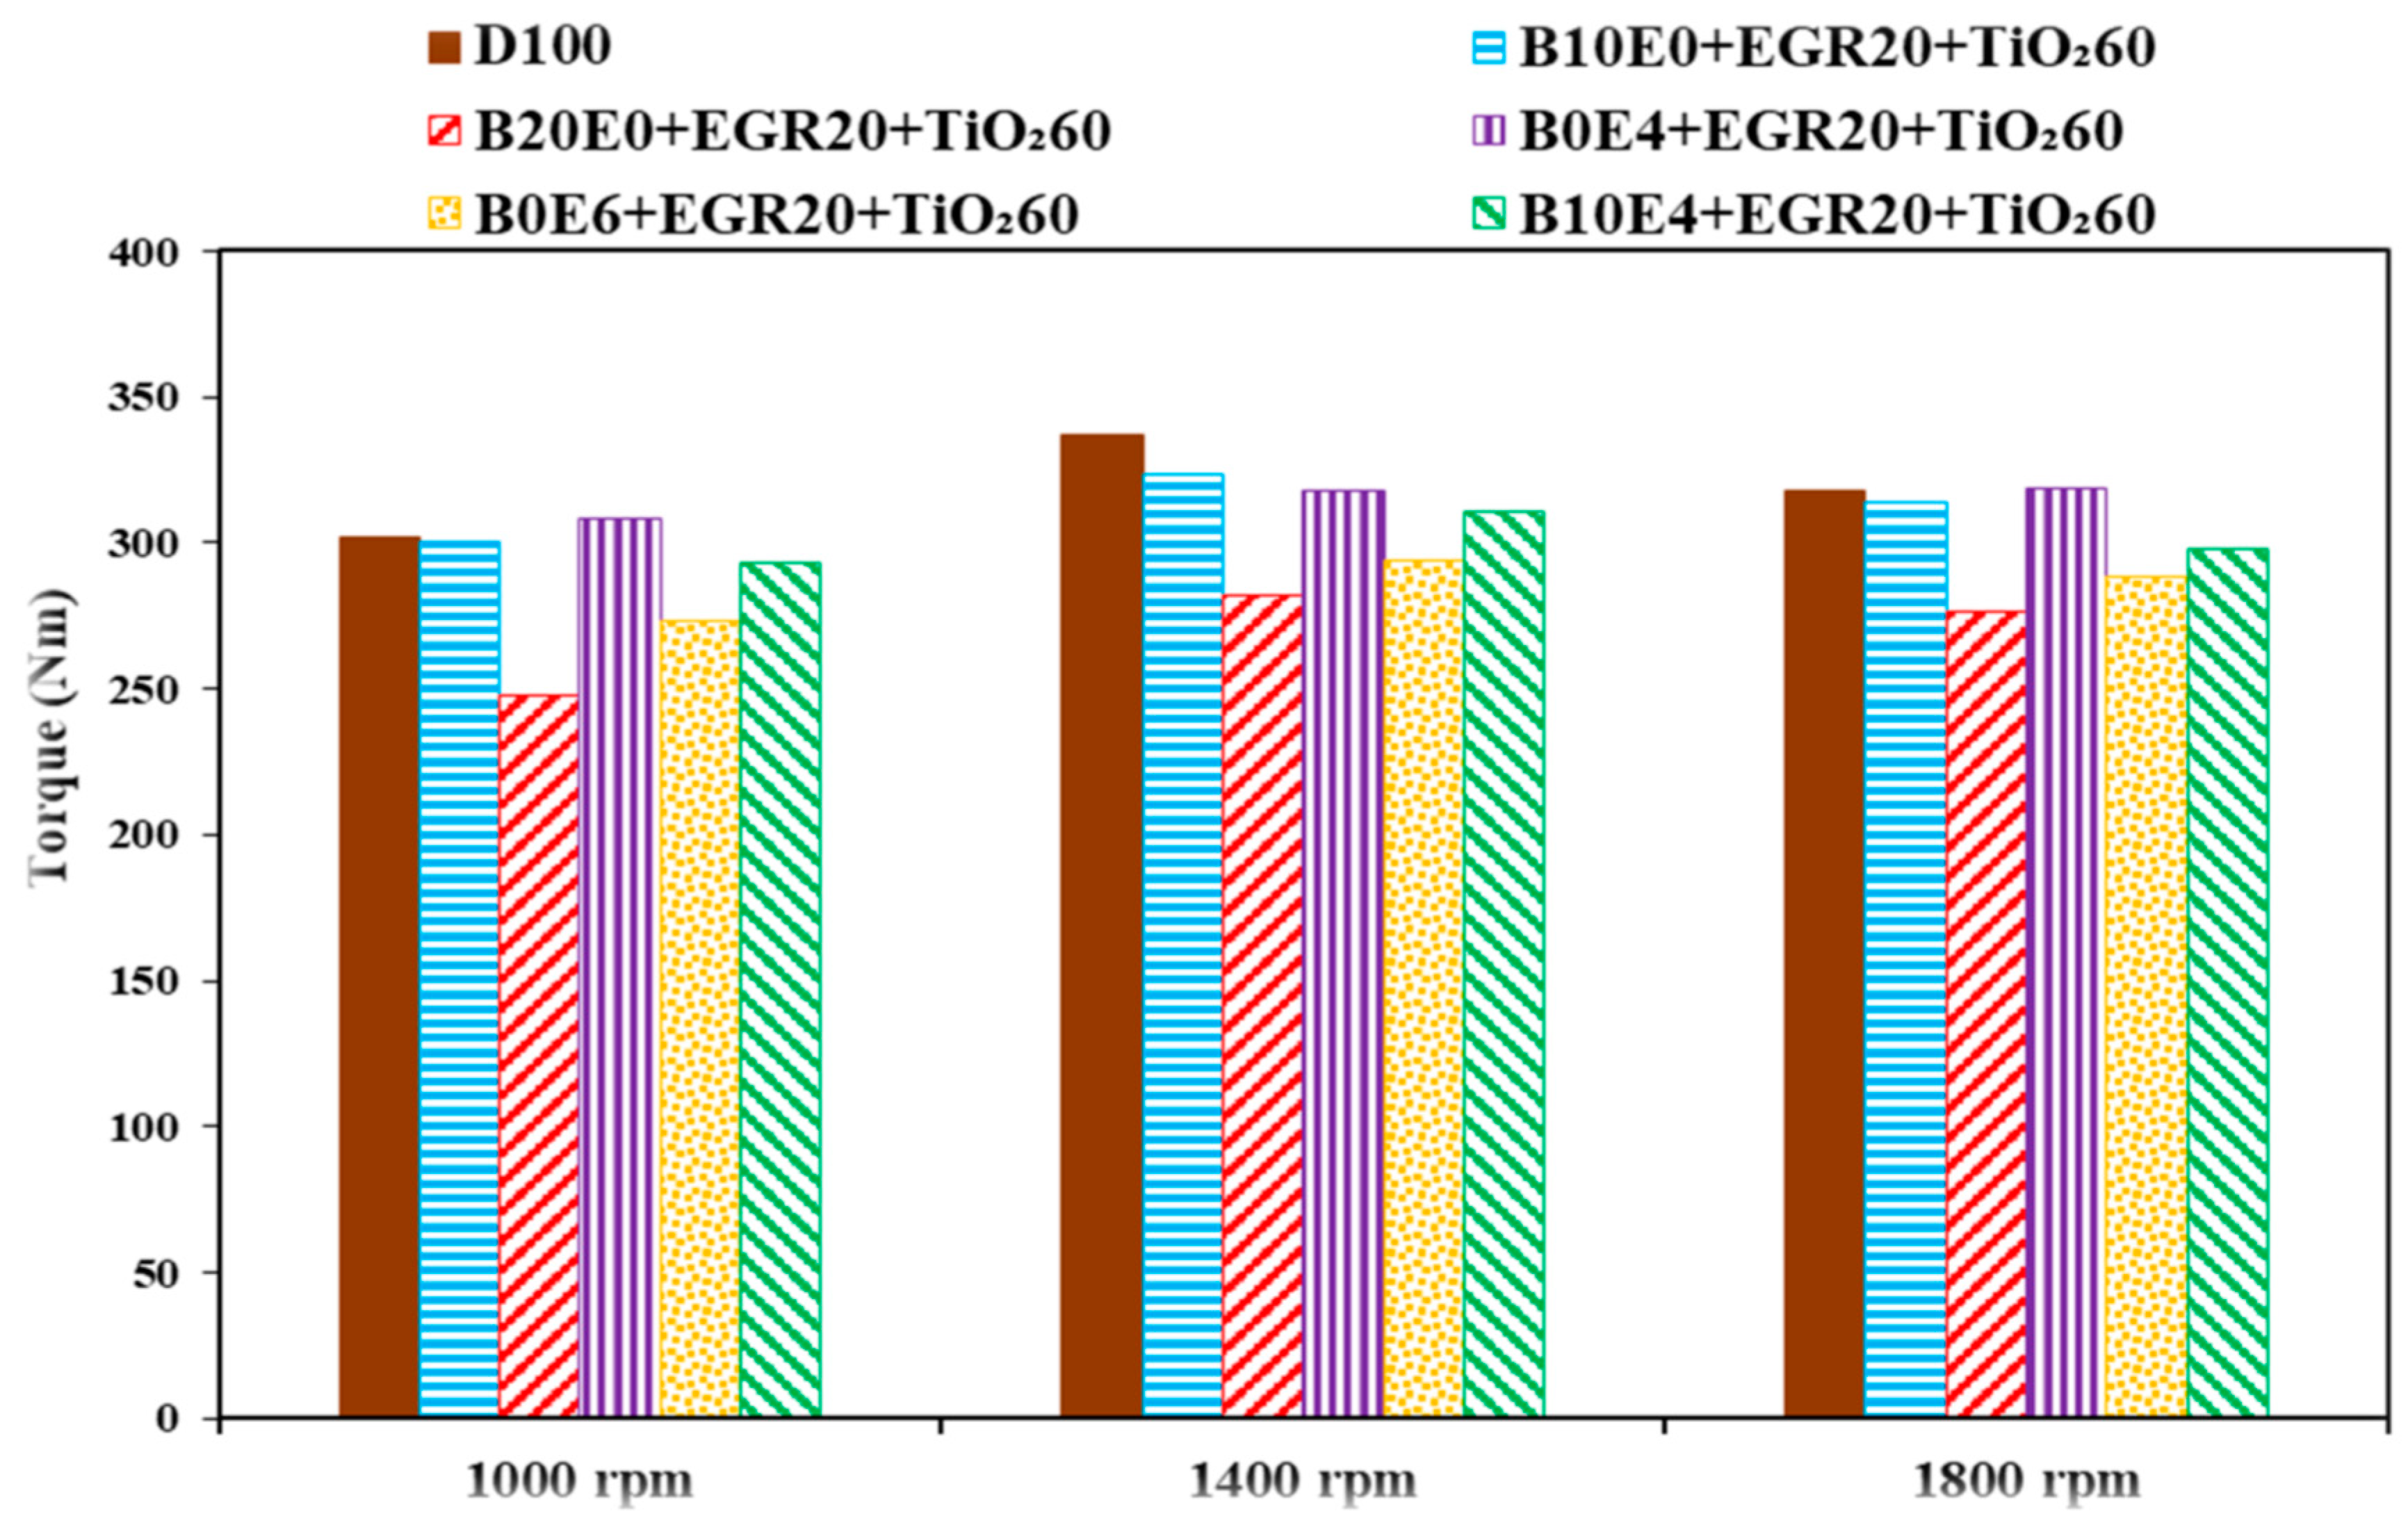
3.2. Torque
3.3. BSFC
3.4. Exhaust Gas Temperature
3.5. NOx
3.6. CO Emission
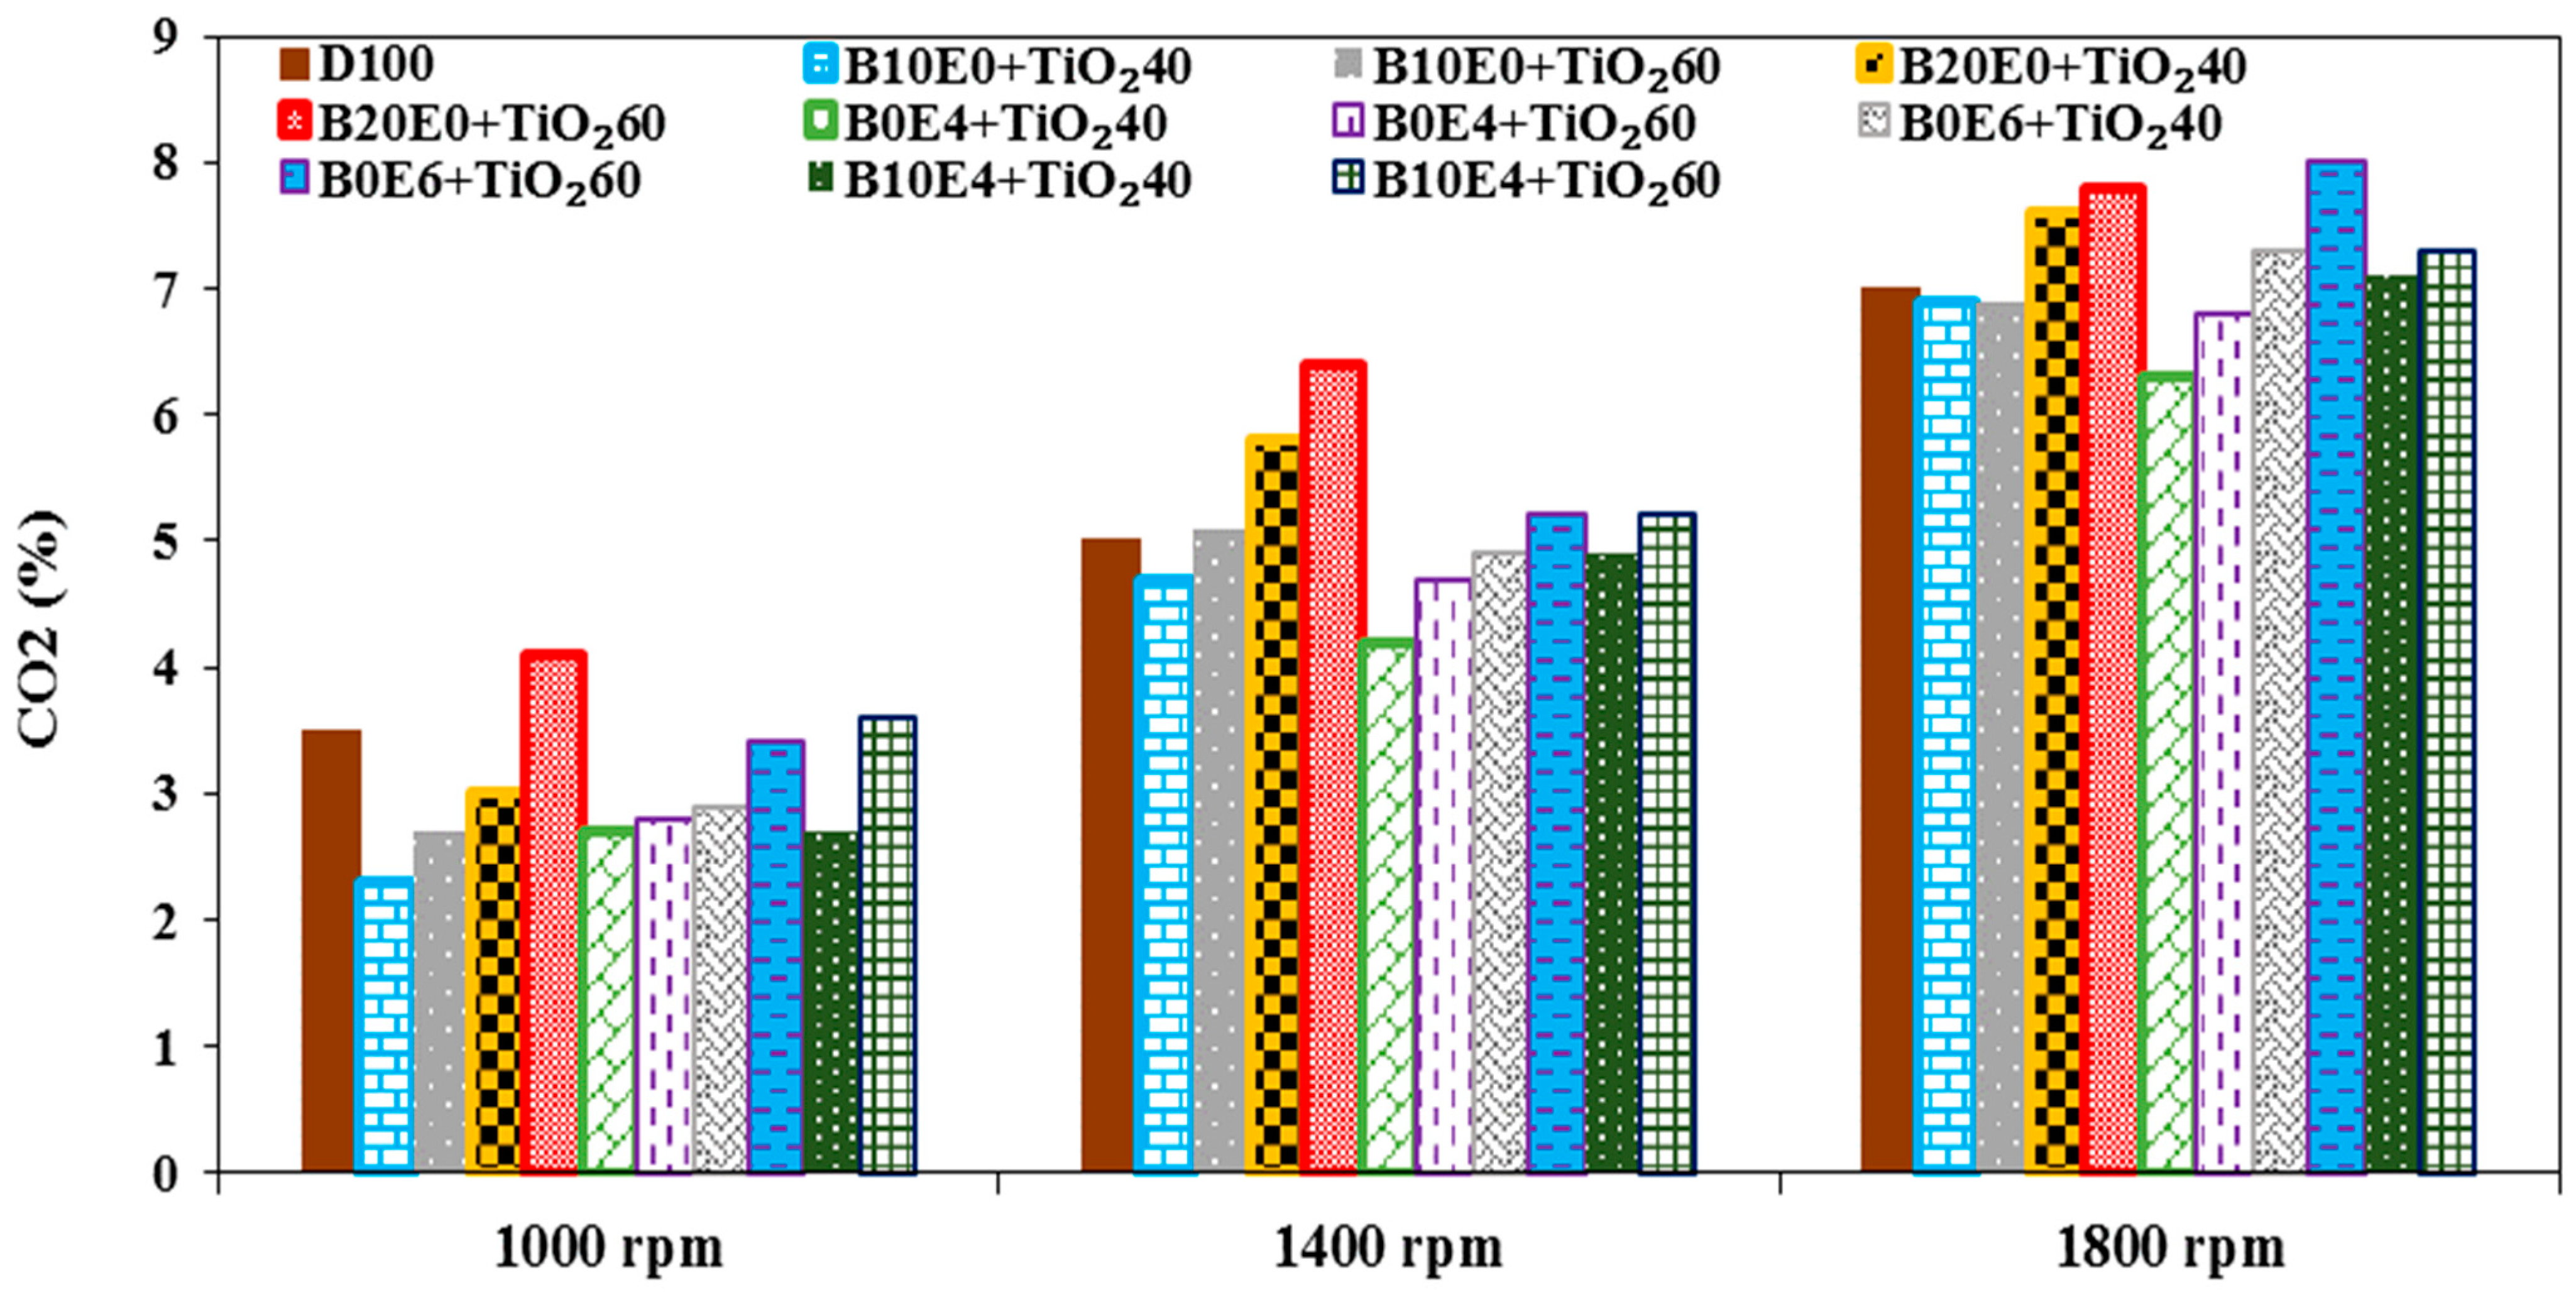
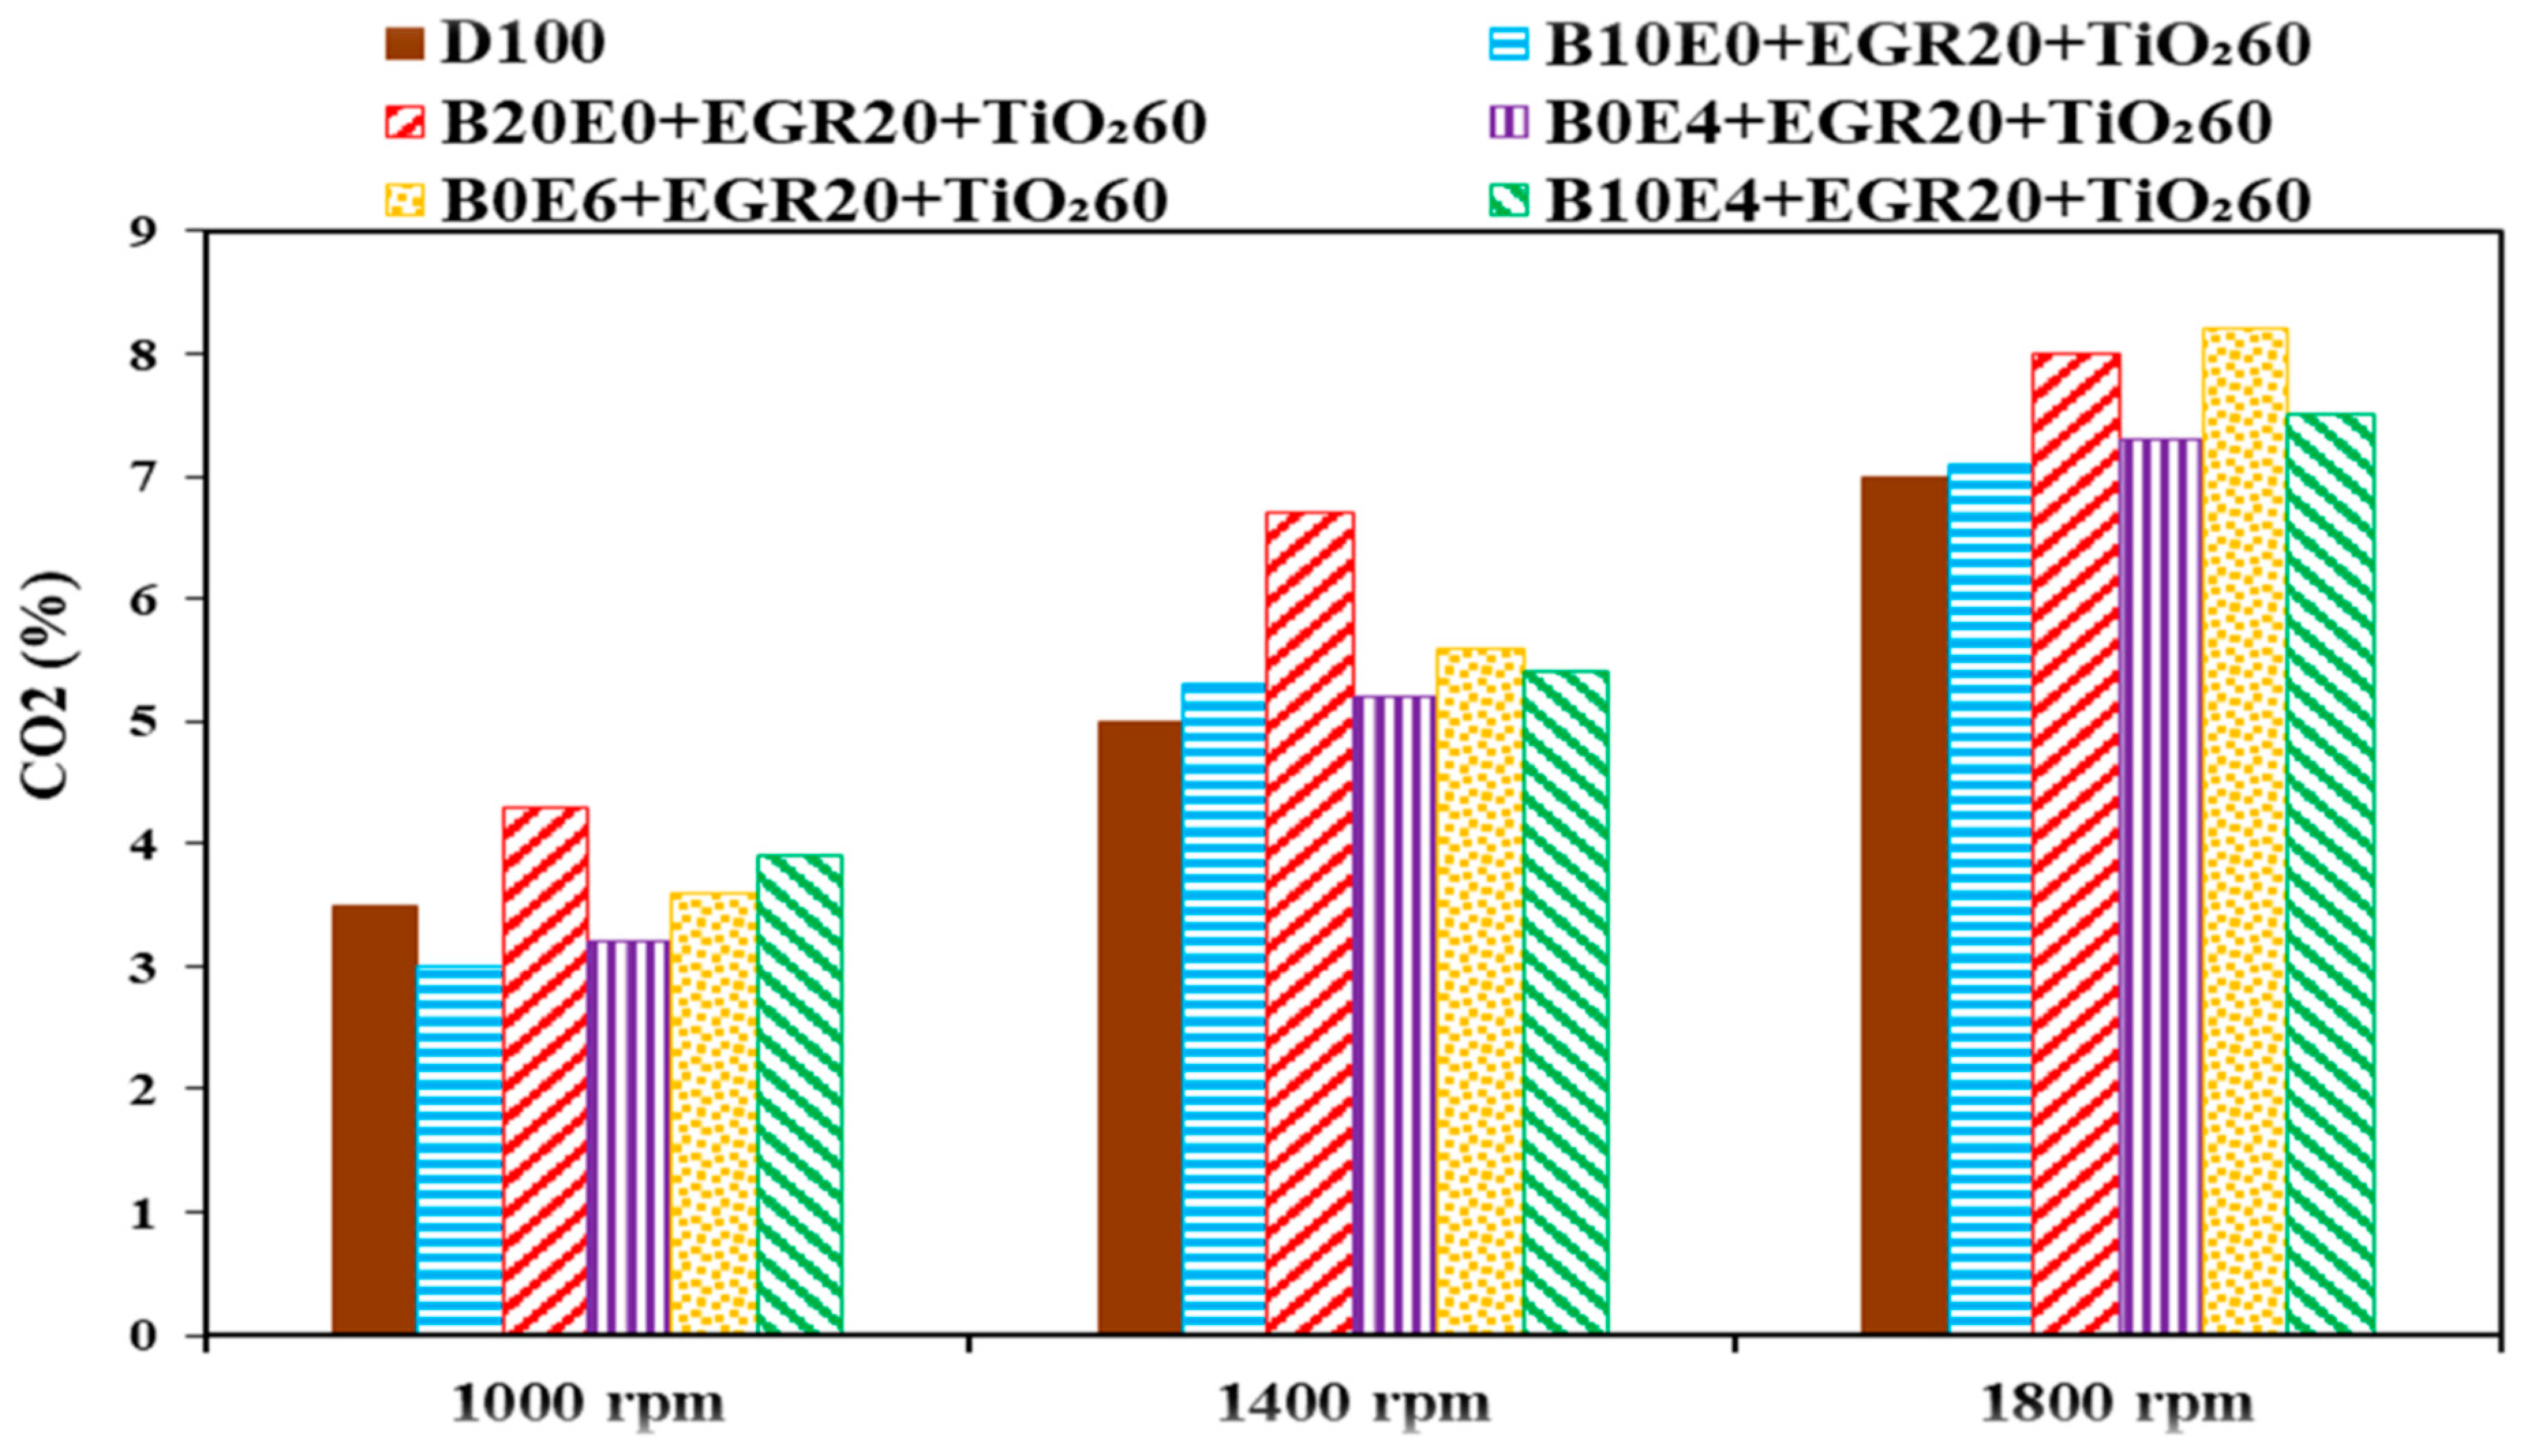
3.7. CO2 Emission
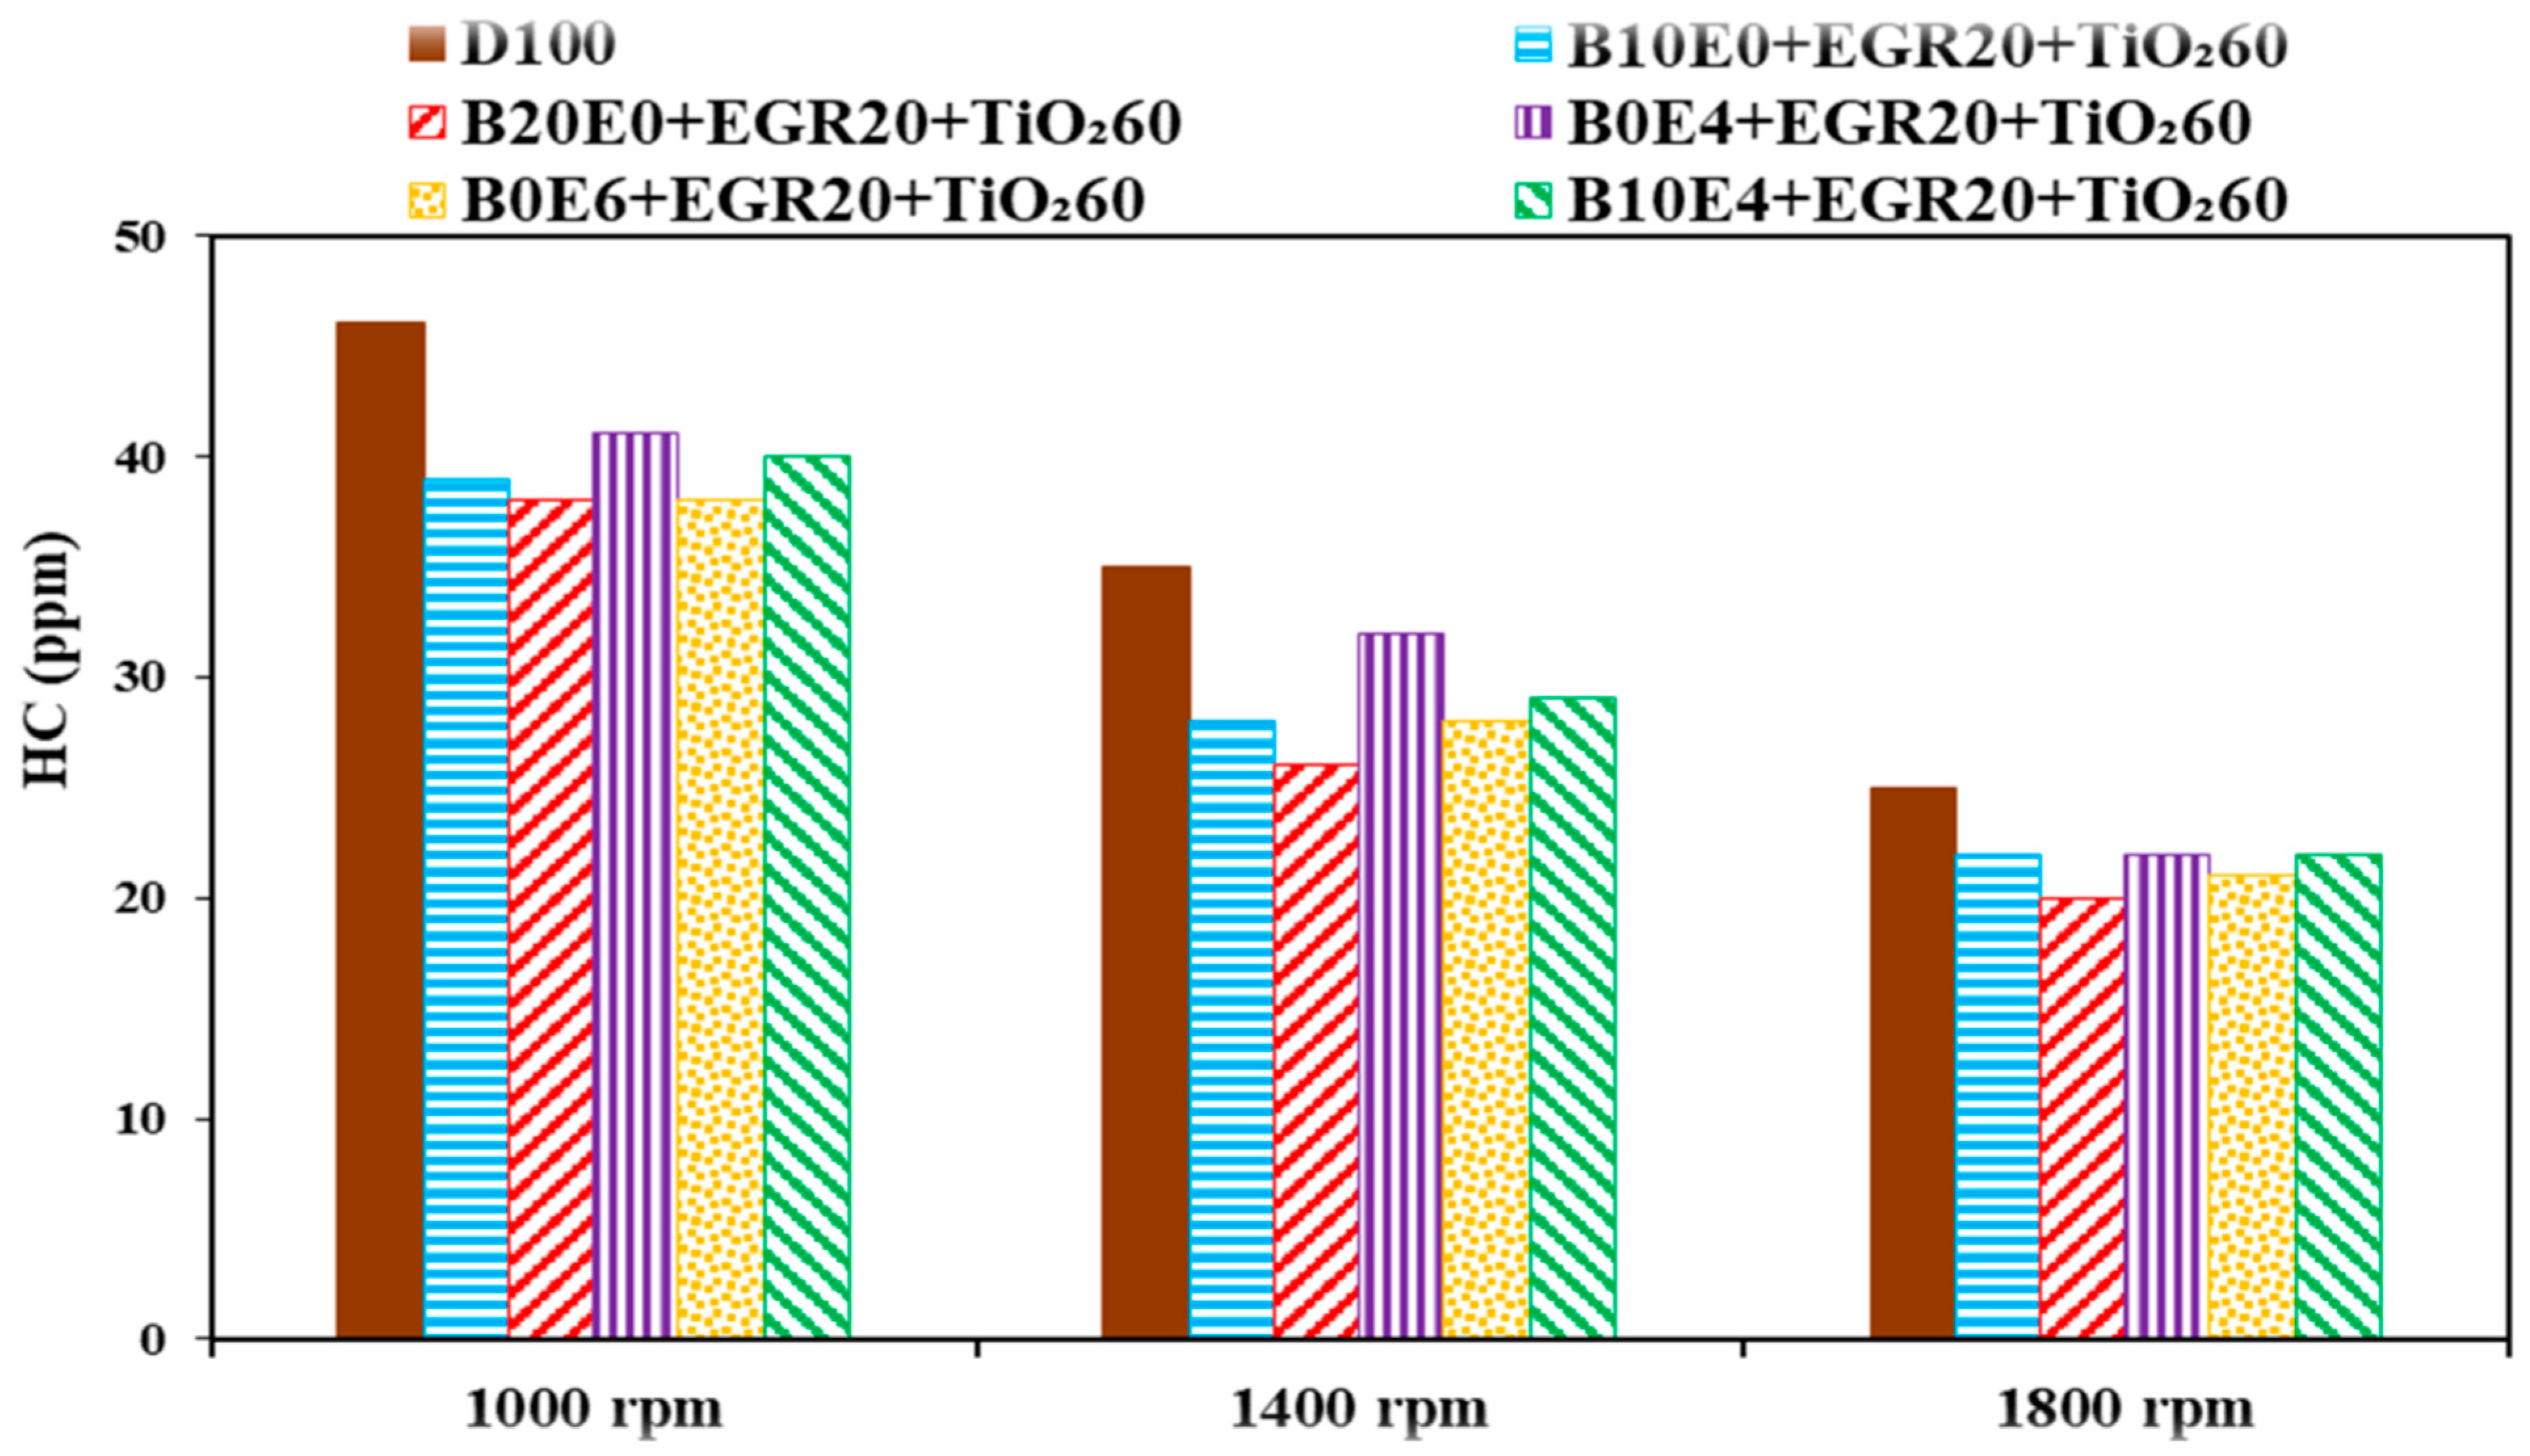
3.8. HC Emission
4. Conclusions
- The minimum power was observed in B20E0 + EGR30, which reduced the power by an average of 27.8% at different speeds.
- With increasing of the EGR rate as well as increasing the percentage of ethanol and biodiesel in the mixture, the brake power and engine torque decreased. While increasing the percentage of TiO2 in the mixture, the amount of power and torque increased.
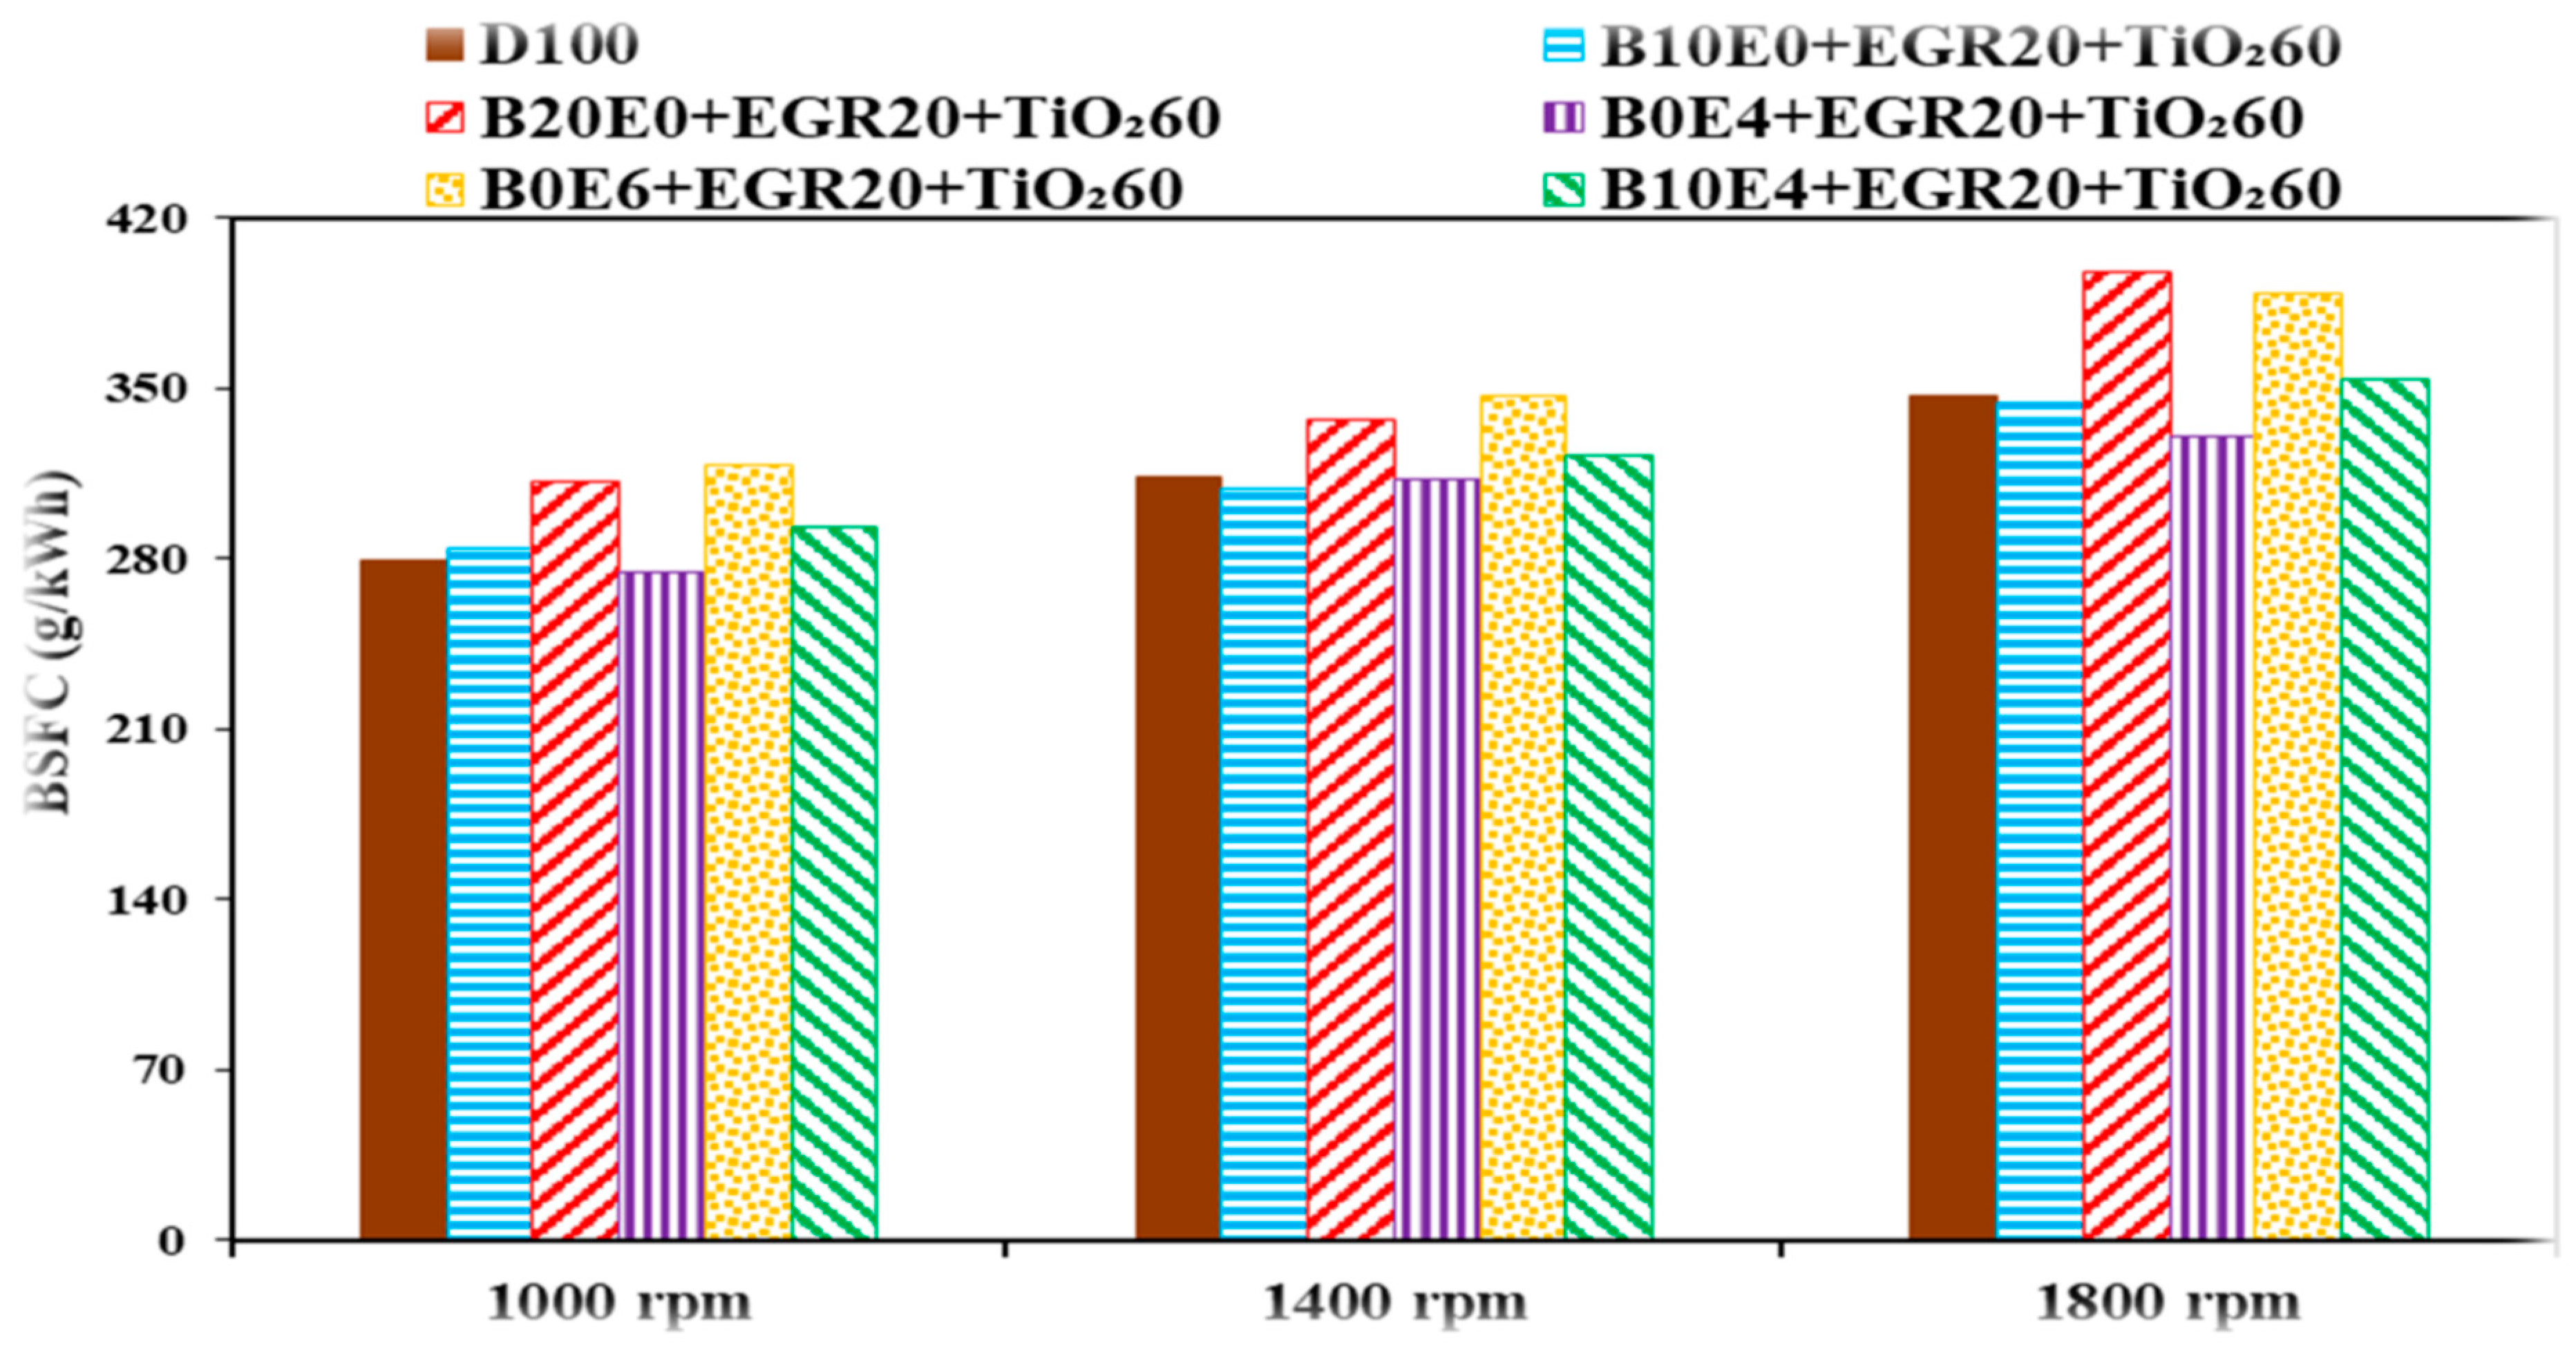
- BSFC increased with increasing the EGR rate, as well as increasing the percentage of ethanol and biodiesel in the mixture. However, with increasing the percentage of TiO2 in the mixture, the amount of BSFC decreased.
- The B10E4 + EGR20 + TiO260 at 1000, 1400, and 1800 rpm increased BSFC by 4.7, 2.5, and 2% compared to pure diesel.
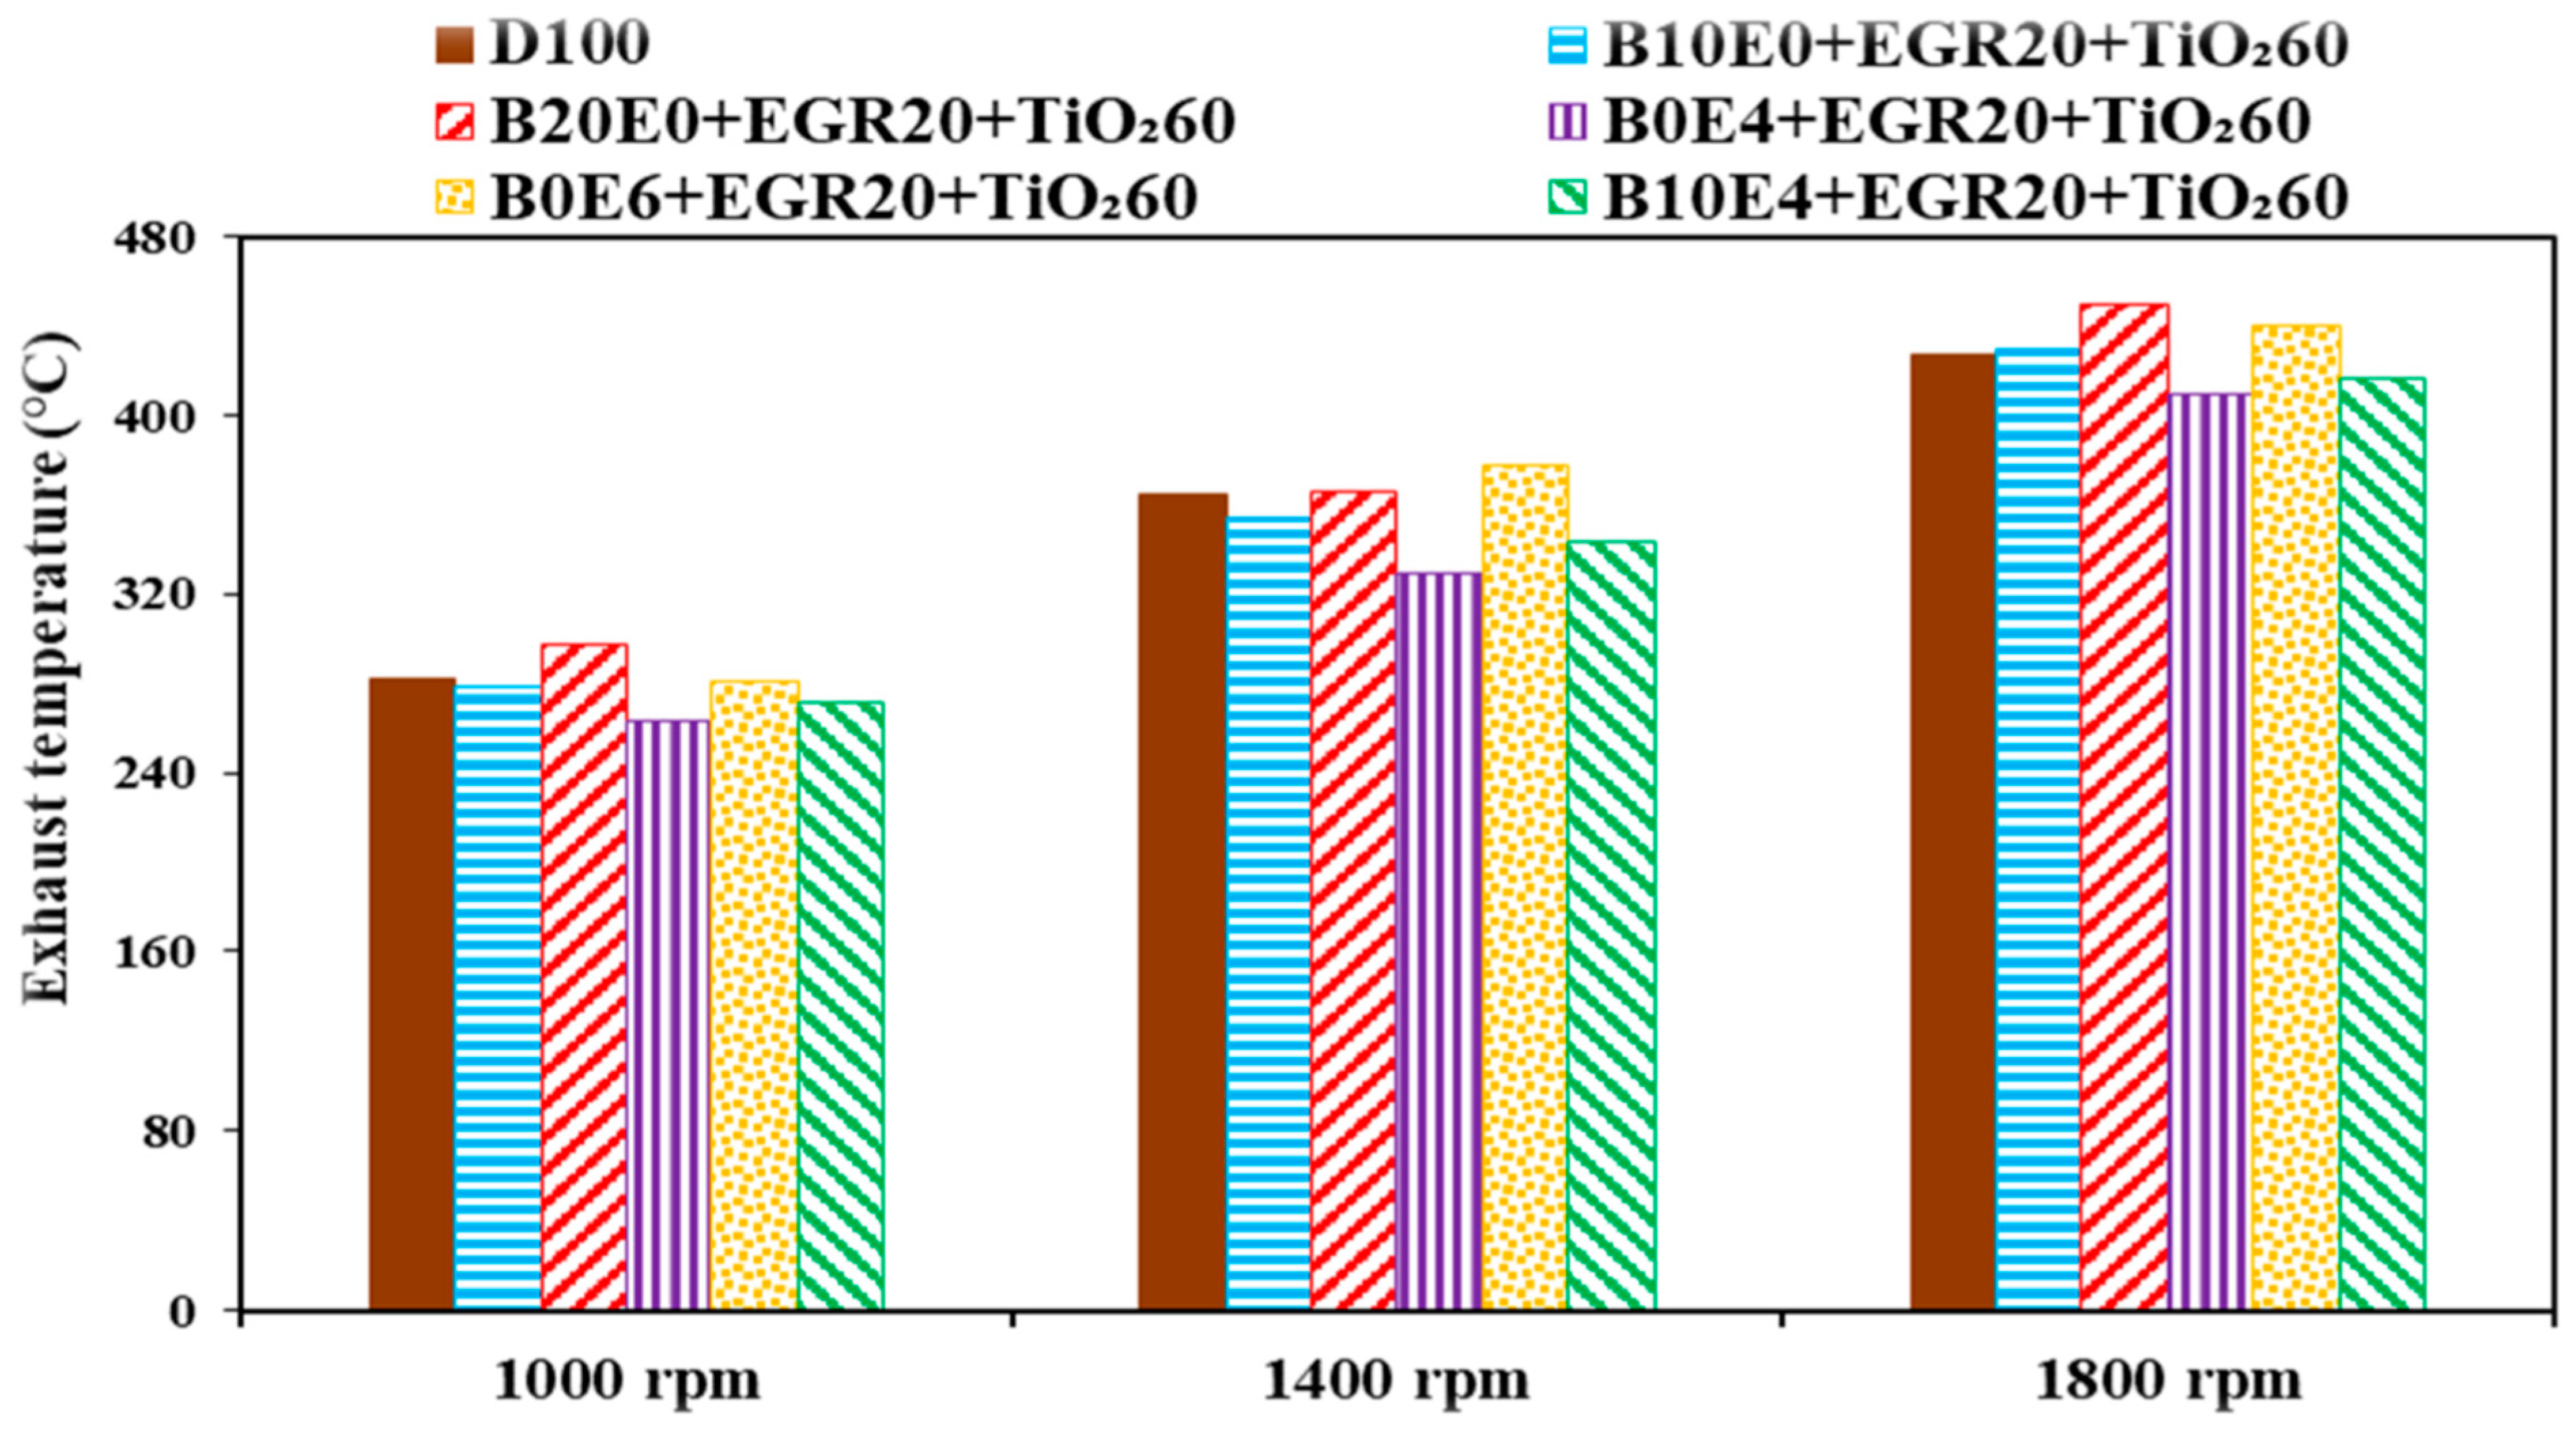
- Increasing the EGR rate reduced the exhaust gas temperature. While an increase in the percentage of biodiesel, ethanol, and TiO2 in the mixture increased the exhaust gas temperature.
- The minimum exhaust temperature was recorded for B0E4 + EGR20 + TiO260, which showed an average reduction of 7% in the exhaust gas temperature compared to D100 at different speeds.
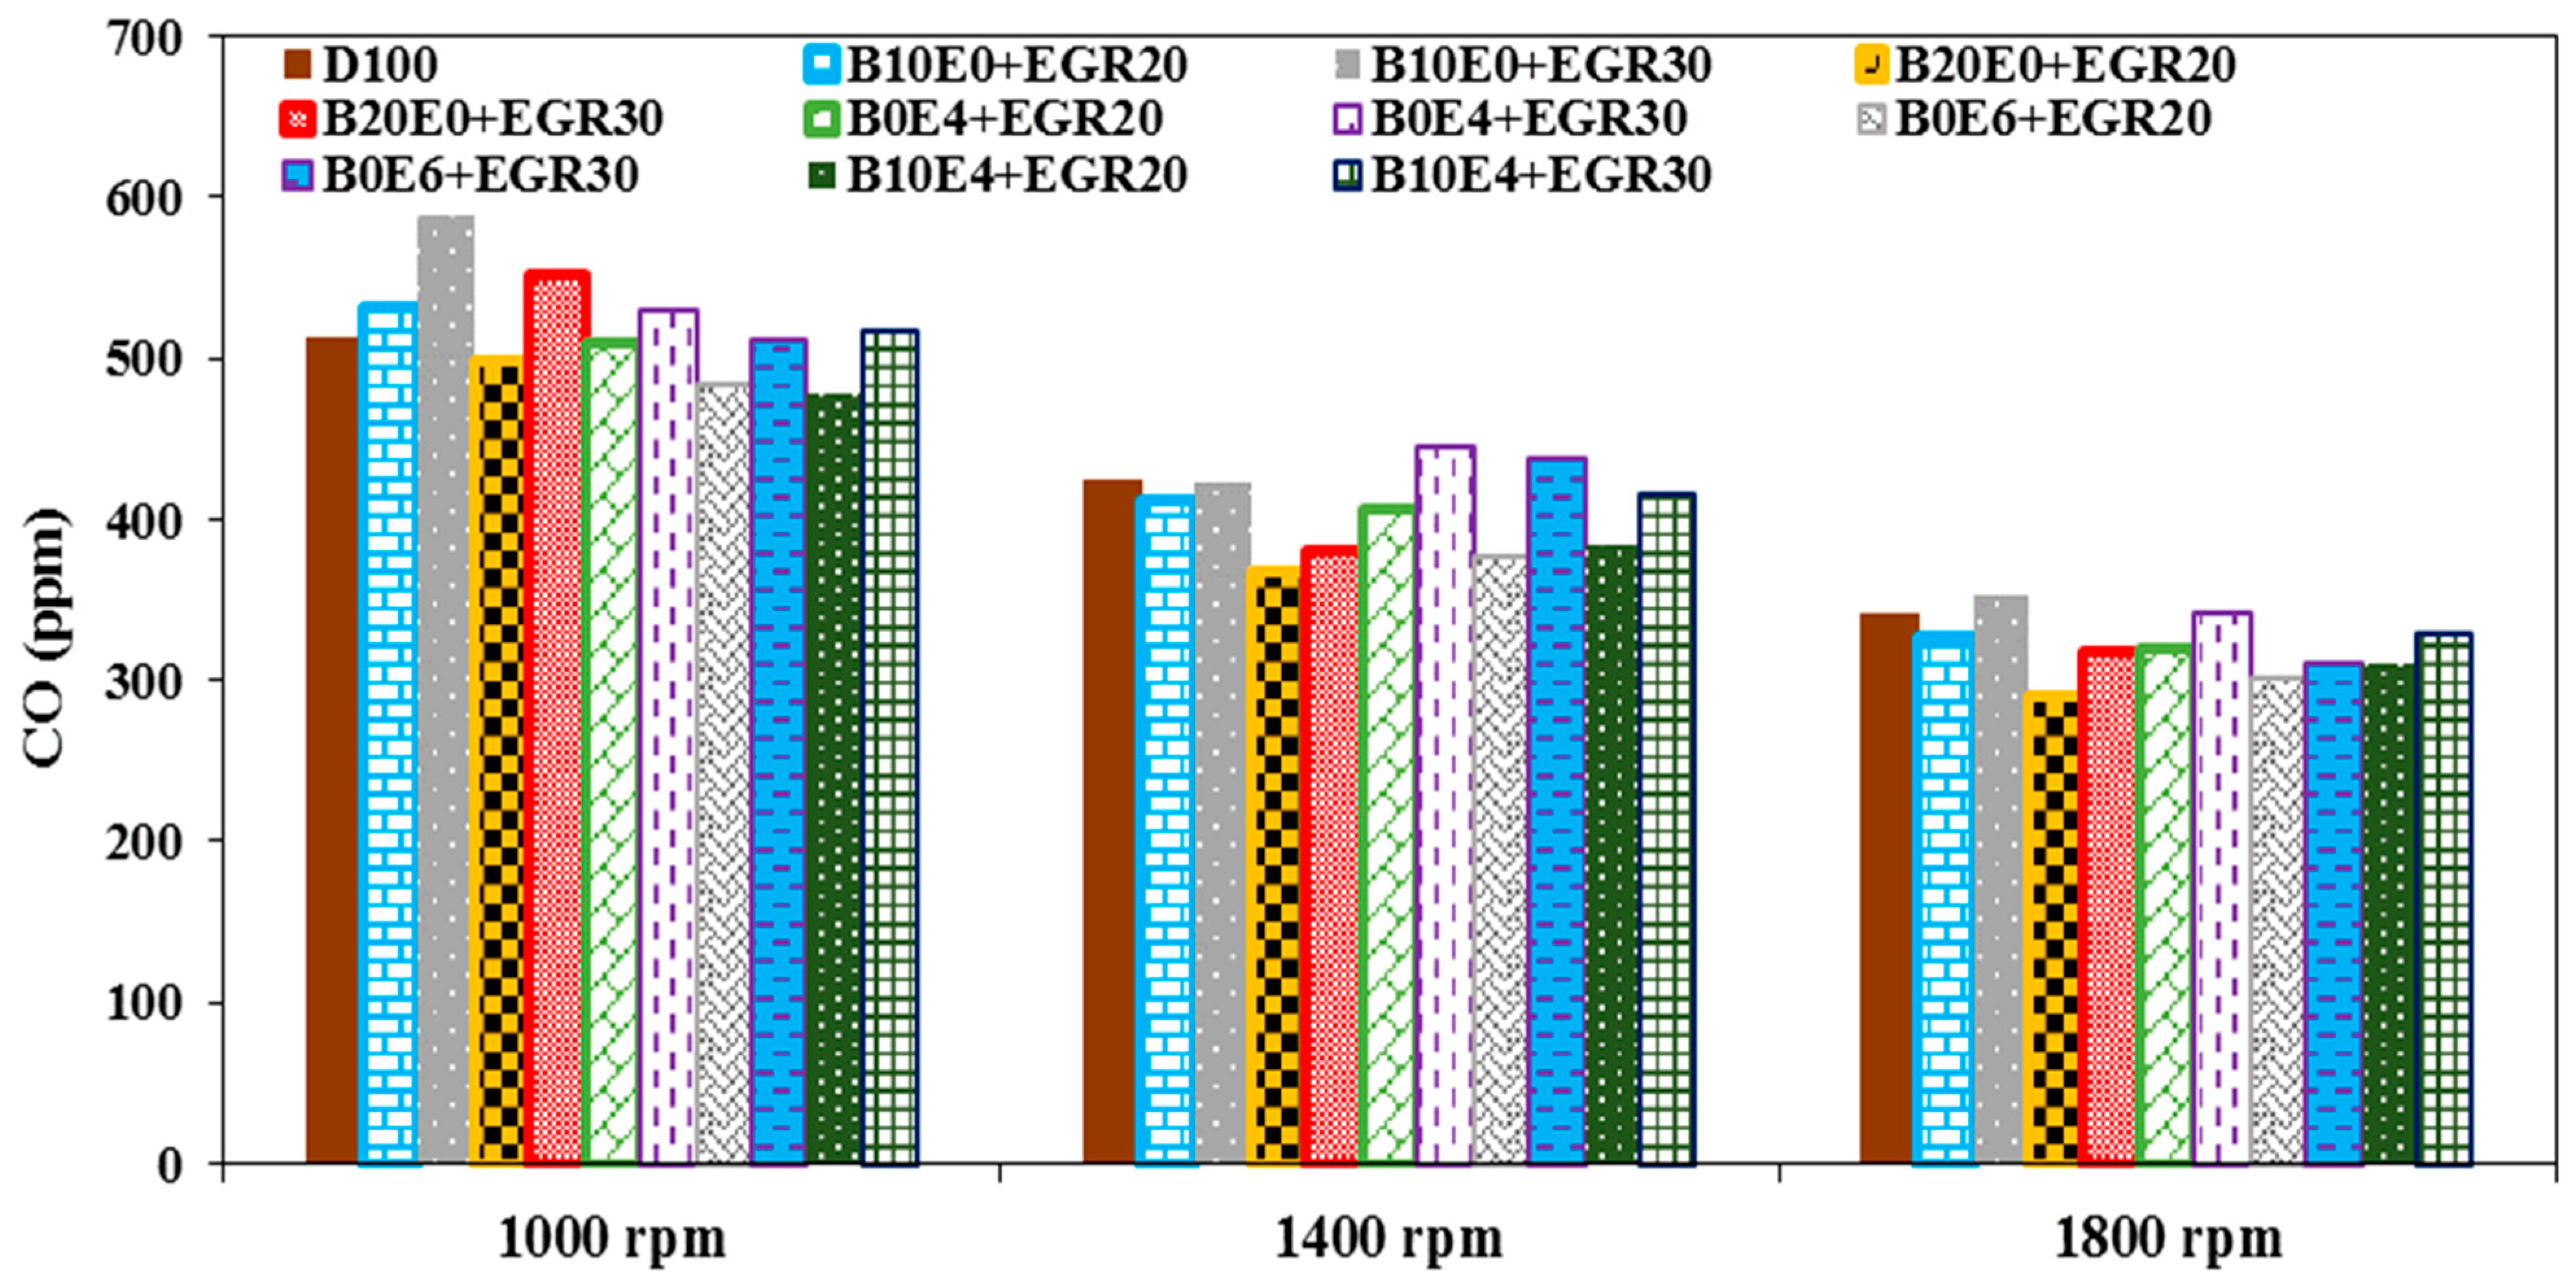
- The amounts of HC and CO emissions increased with increasing of the EGR rate, while the addition of TiO2, as well as increasing the percentage of biodiesel and ethanol in the mixture, reduced the amounts of these emissions.
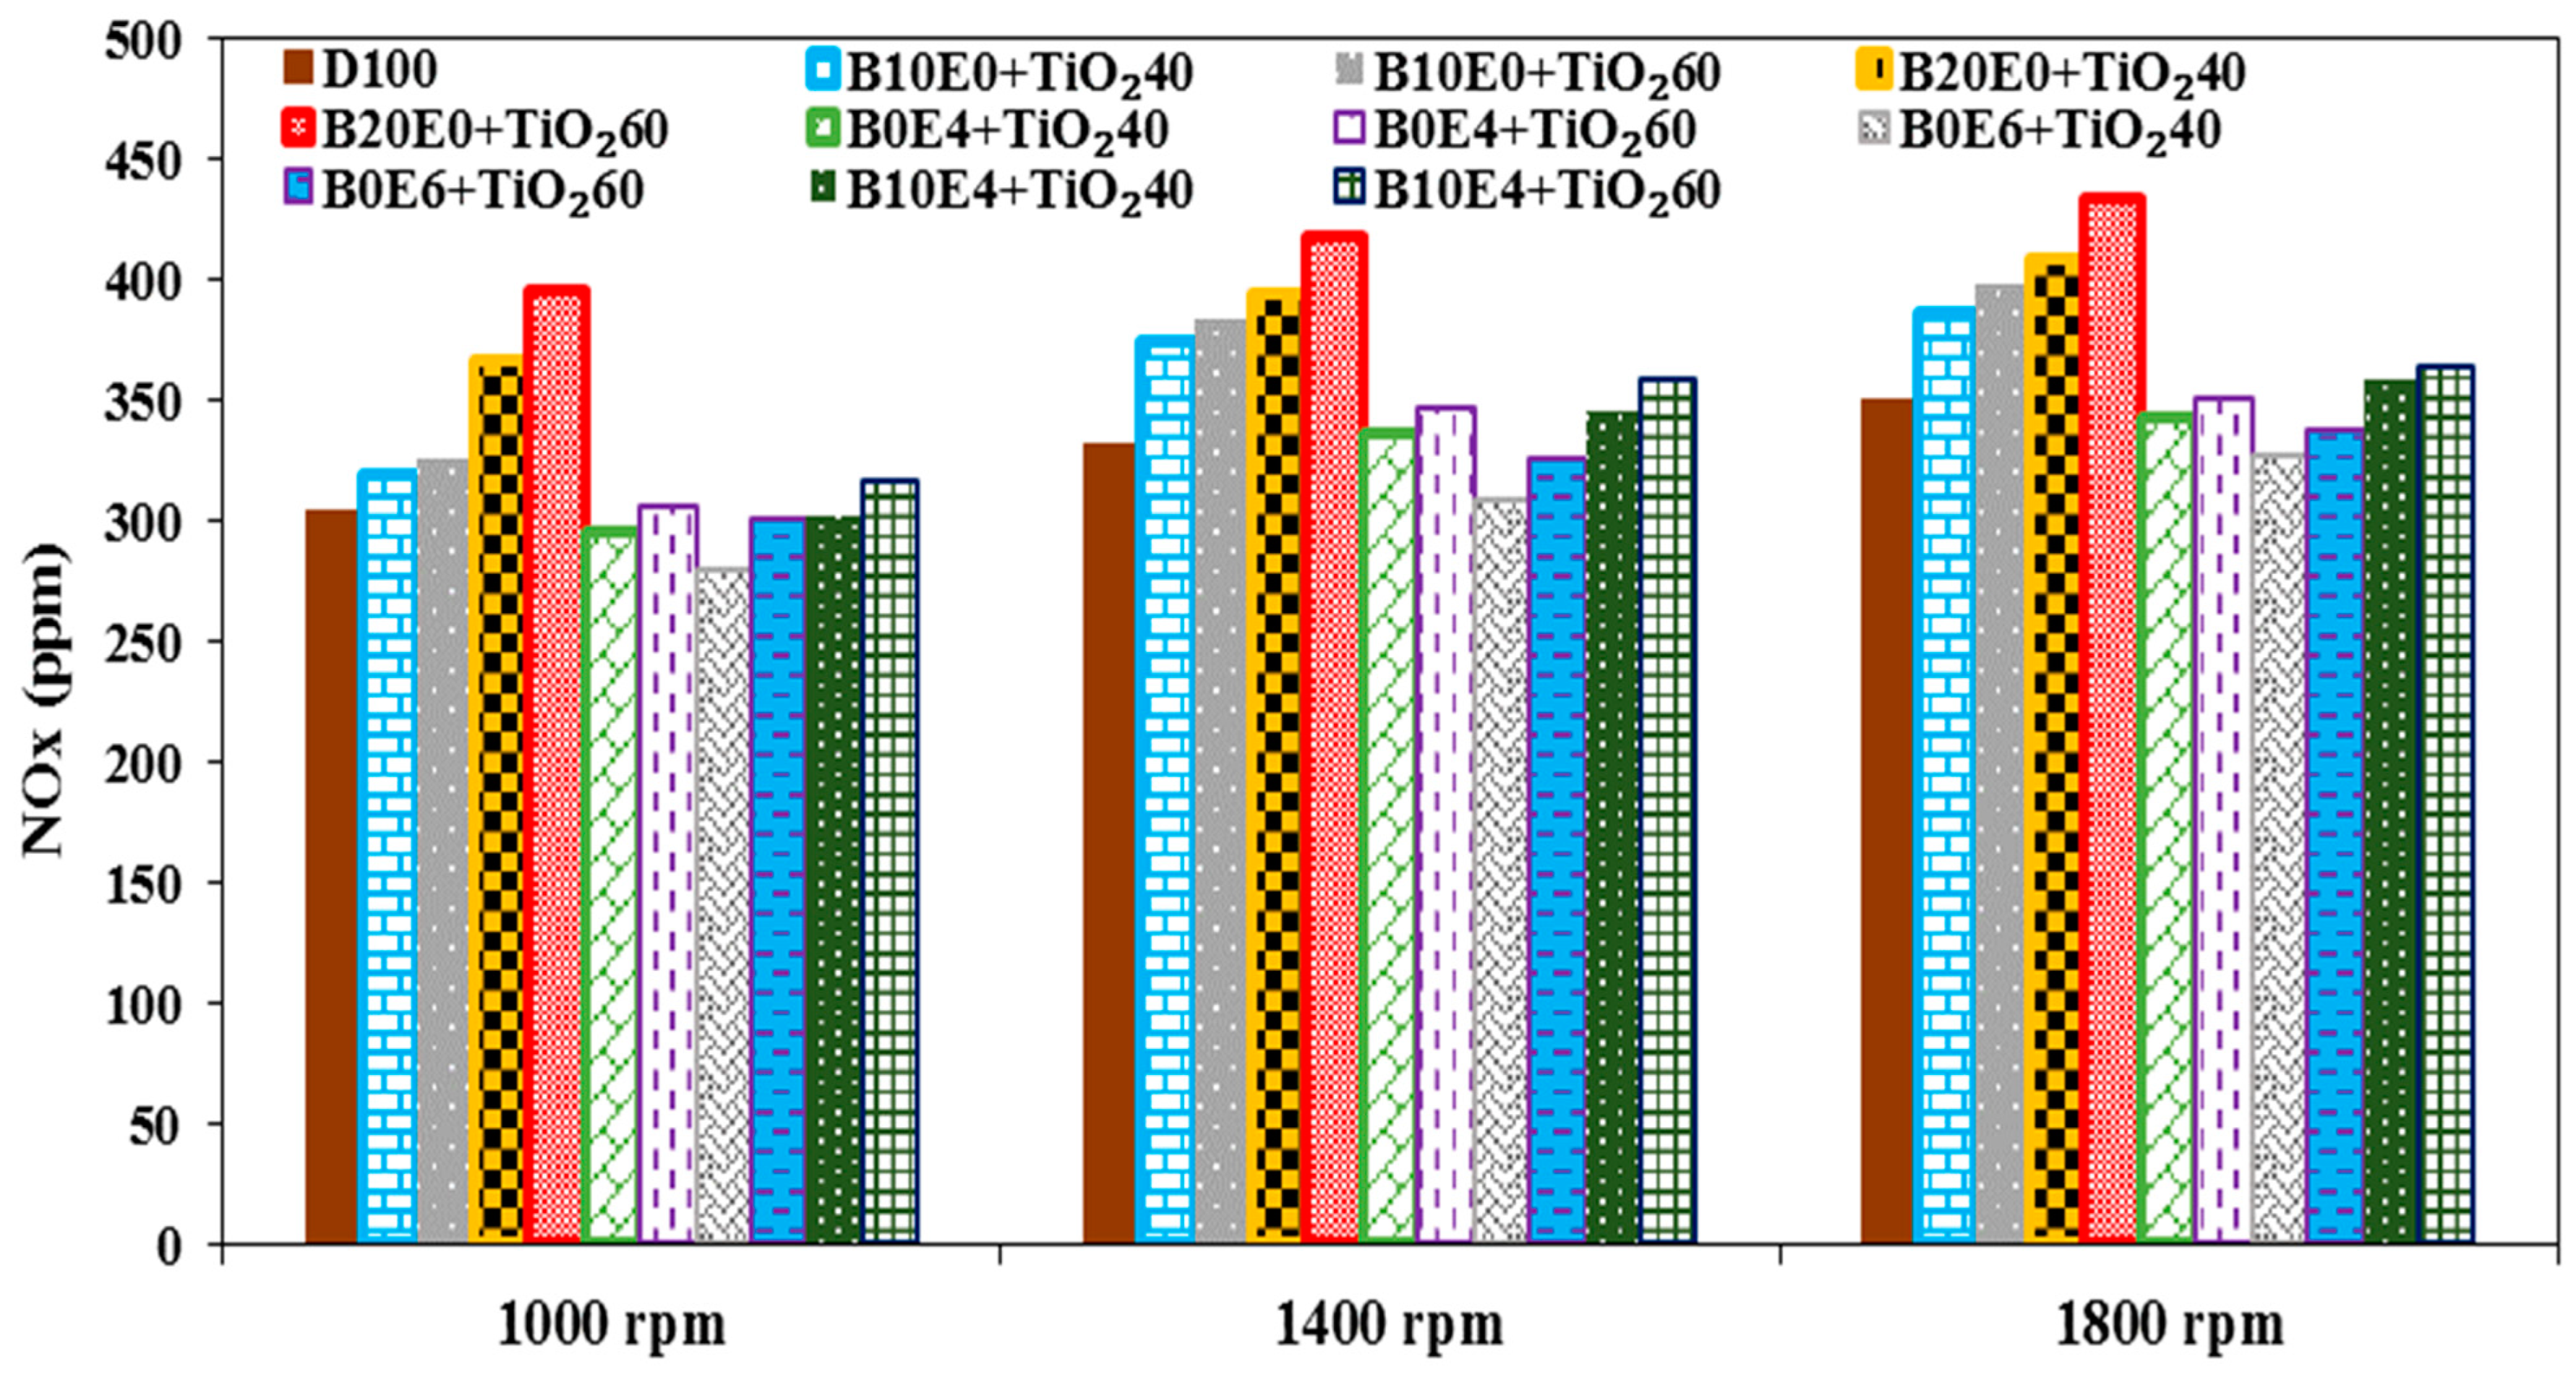
- NOx emissions increased with an increase in the percentage of biodiesel, ethanol, and TiO2. While increasing the EGR rate reduced NOx emissions. The minimum amount of NOx was recorded for B0E4 + EGR20 + TiO260 with a 13% reduction compared to D100.
- The B10E4 + EGR20 + TiO260 reduced the emissions of HC, CO, and NOx by 17, 12.4, and 10% compared to D100. The amounts of brake power and torque were also generated near to pure diesel, while BSFC values increased by an average of 3%.
Author Contributions
Funding
Data Availability Statement
Conflicts of Interest
Nomenclature
| BSFC = Break Specific Fuel Consumption | CO = Carbon Monoxide |
| CO2 = Carbon Dioxide | °C = degrees Celsius |
| DI = Direct Injection | EGR = Exhaust Gas Recirculation |
| g/kW-hr = gram per kilowatt hour | g/mol = grams per mole |
| HC = Hydro Carbon | Kg m−3 = Kilogram per cubic meter |
| kW = Kilo Watt | MJ kg−1 = Megajoules per kilogram |
| mm = millimeter | mm2 s−1 = square millimetre per second |
| Nm = Newton meter | nm = nanometer |
| NOx = Nitrogen Oxides | PM = Particulate Matter |
| ppm = parts per million | rpm = revolutions per minute |
| vol% = Volume percent | wt.% = percentage by weight |
References
- Han, J.; Somers, L.; Cracknell, R.; Joedicke, A.; Wardle, R.; Mohan, V.R.R. Experimental investigation of ethanol/diesel dual-fuel combustion in a heavy-duty diesel engine. Fuel 2020, 275, 117867. [Google Scholar] [CrossRef]
- Wu, Y.; Zhang, X.; Zhang, Z.; Wang, X.; Geng, Z.; Jin, C.; Liu, H.; Yao, M. Effects of diesel-ethanol-THF blend fuel on the performance and exhaust emissions on a heavy-duty diesel engine. Fuel 2020, 271, 117633. [Google Scholar] [CrossRef]
- Yesilyurt, M.K. The effects of the fuel injection pressure on the performance and emission characteristics of a diesel engine fuelled with waste cooking oil biodiesel-diesel blends. Renew. Energy 2019, 132, 649–666. [Google Scholar] [CrossRef]
- Rajasekar, E.; Selvi, S. Review of combustion characteristics of CI engines fueled with biodiesel. Renew. Sustain. Energy Rev. 2014, 35, 390–399. [Google Scholar] [CrossRef]
- Suh, H.K.; Lee, C.S. A review on atomization and exhaust emissions of a biodiesel-fueled compression ignition engine. Renew. Sustain. Energy Rev. 2016, 58, 1601–1620. [Google Scholar] [CrossRef]
- Hoekman, S.K.; Broch, A.; Robbins, C.; Ceniceros, E.; Natarajan, M. Review of biodiesel composition, properties, and specifications. Renew. Sustain. Energy Rev. 2012, 16, 143–169. [Google Scholar] [CrossRef]
- Renewable Fuels Association (RFA). Ethanol Industry Outlook; Renewable Fuels Association (RFA): St. Louis, MO, USA, 2010; pp. 1–32. [Google Scholar]
- Çelebi, Y.; Aydın, H. An overview on the light alcohol fuels in diesel engines. Fuel 2019, 236, 890–911. [Google Scholar] [CrossRef]
- Kim, H.; Choi, B.; Park, S.; Kim, Y. Engine performance and emission characteristics of CRDI diesel engine equipped with WCC and DOC using ethanol blended diesel fuel. In Proceedings of the International Symposium on Alcohol Fuels, San Diego, CA, USA, 26–28 September 2005. [Google Scholar]
- Yang, W.M.; An, H.; Chou, S.K.; Chua, K.J.; Mohan, B.; Sivasankaralingam, V.; Raman, V.; Maghbouli, A.; Li, J. Impact of emulsion fuel with nano-organic additives on the performance of diesel engine. Appl. Energy 2013, 112, 1206–1212. [Google Scholar] [CrossRef]
- Nye, M.; Southwell, P. Conversion of rapeseed oil to esters for use as diesel fuel. In Proceedings of the 5th Canadian Bioenergy Research and Development Seminar, Ottawa, ON, Canada, 26–28 March 1984; pp. 487–490. [Google Scholar]
- Dorado, M.P.; Ballesteros, E.; Arnal, J.M.; Gomez, J.; Lopez, F.J. Exhaust emissions from a diesel engine fueled with transesterified waste olive oil. Fuel 2003, 82, 1311–1315. [Google Scholar] [CrossRef]
- Karthikeyan, S.; Elango, A.; Prathima, A. Diesel engine performance and emission analysis using canola oil methyl ester with the nano sized zinc oxide particles. Indian J. Eng. Mater. Sci. 2014, 21, 83–87. [Google Scholar]
- Rajesh kumar, B.; Saravanan, S. Effect of exhaust gas recirculation (EGR) on performance and emissions of a constant speed DI diesel engine fueled with pentanol/diesel blends. Fuel 2015, 160, 217–226. [Google Scholar] [CrossRef]
- Yilmaz, N.; Atmanli, A. Experimental assessment of a diesel engine fueled with diesel-biodiesel-1-pentanol blends. Fuel 2017, 191, 190–197. [Google Scholar] [CrossRef]
- Devarajan, Y.; Munuswamy, D.B.; Mahalingam, A. Investigation on behavior of diesel engine performance, emission, and combustion characteristics using nano-additive in neat biodiesel. Heat Mass. Transf. 2019, 55, 1641–1650. [Google Scholar] [CrossRef]
- Uyumaz, A. Experimental evaluation of linseed oil biodiesel/diesel fuel blends on combustion, performance and emission characteristics in a DI diesel engine. Fuel 2020, 267, 117150. [Google Scholar] [CrossRef]
- Uyumaz, A. Combustion, performance and emission characteristics of a DI diesel engine fueled with mustard oil biodiesel fuel blends at different engine loads. Fuel 2018, 212, 256–267. [Google Scholar] [CrossRef]
- Kim, H.Y.; Ge, J.C.; Choi, N.J. Effects of ethanol–diesel on the combustion and emissions from a diesel engine at a low idle speed. Appl. Sci. 2020, 10, 4153. [Google Scholar] [CrossRef]
- Wu, Q.; Xie, X.; Wang, Y.; Roskilly, T. Effect of carbon coated aluminum nanoparticles as additive to biodiesel-diesel blends on performance and emission characteristics of diesel engine. Appl. Energy 2018, 221, 597–604. [Google Scholar] [CrossRef]
- Ahmed, A.; Shah, A.N.; Azam, A.; Uddin, G.M.; Ali, M.S.; Hassan, S.; Ahmed, H.; Aslam, T. Environment-friendly novel fuel additives: Investigation of the effects of graphite nanoparticles on performance and regulated gaseous emissions of CI engine. Energy Convers. Manag. 2020, 211, 112748. [Google Scholar] [CrossRef]
- Aldhaidhawi, M.; Chiriac, R.; Bădescu, V.; Descombes, G.; Podevin, P. Investigation on the mixture formation, combustion characteristics and performance of a Diesel engine fueled with Diesel, Biodiesel B20 and hydrogen addition. Int. J. Hydrogen Energy 2017, 42, 16793–16807. [Google Scholar] [CrossRef]
- Arul Mozhi Selvan, V.; Anand, R.B.; Udayakumar, M. Effect of cerium oxide nanoparticles and carbon nanotubes as fuel-borne additives in diesterol blends on the performance, combustion and emission characteristics of a variable compression ratio engine. Fuel 2014, 130, 160–167. [Google Scholar] [CrossRef]
- Wu, H.W.; Hsu, T.T.; Fan, C.M.; He, P.H. Reduction of smoke, PM 2.5, and NOx of a diesel engine integrated with methanol steam reformer recovering waste heat and cooled EGR. Energy Convers. Manag. 2018, 172, 567–578. [Google Scholar] [CrossRef]
- Pan, M.; Zheng, Z.; Huang, R.; Zhou, X.; Huang, H.; Pan, J.; Chen, Z. Reduction in PM and NOx of a diesel engine integrated with n-octanol fuel addition and exhaust gas recirculation. Energy 2019, 187, 115946. [Google Scholar] [CrossRef]
- Lapuerta, M.; Armas, O.; Garcia-Contreras, R.G. Stability of diesel–bioethanol blends for use in diesel engines. Fuel 2007, 86, 1351–1357. [Google Scholar] [CrossRef]
- Hansen, A.C.; Zhang, Q.; Lyne, P.W.L. Ethanol–diesel fuel blends––A review. Bioresour. Technol. 2005, 96, 277–285. [Google Scholar] [CrossRef] [PubMed]
- Arcoumanis, C.; Bae, C.; Crookes, R.; Kinoshita, E. The potential of di-methyl ether (DME) as an alternative fuel for compression-ignition engines: A review. Fuel 2008, 87, 1014–1030. [Google Scholar] [CrossRef]
- Baert, R.S.; Beckman, D.E.; Veen, A. Efficient EGR Technology for Future HD Diesel Engine Emission Targets; SAE Technical Paper 1999-01-0837; SAE International: Warrendale, PA, USA, 1999. [Google Scholar] [CrossRef]
- Mobasheri, R.; Khabbaz, S. Modeling the Effects of High EGR Rates in Conjunction with Optimum Multiple Injection Techniques in a Heavy Duty DI Diesel Engine; SAE Technical Paper 2014-01-1124; SAE International: Warrendale, PA, USA, 2014. [Google Scholar] [CrossRef]
- Kökkülünk, G.; Parlak, A.; Ayhan, V.; Cesur, I.; Gonca, G.; Boru, B. Theoretical and experimental investigation of steam injected diesel engine with EGR. Energy 2014, 74, 331–339. [Google Scholar] [CrossRef]
- Pirouzpanah, V.; Khoshbakhti Sarai, R. Reduction of emissions in an automotive direct injection diesel engine dual-fuelled with natural gas by using variable exhaust gas recirculation. Proc. Inst. Mech. Eng. 2003, 217, 719–725. [Google Scholar] [CrossRef]
- Örs, I.; Sarıkoç, S.; Atabani, A.E.; Ünalan, S.; Akansu, S.O. The effects on performance, combustion and emission characteristics of DICI engine fuelled with TiO2 nanoparticles addition in diesel/biodiesel/n-butanol blends. Fuel 2018, 234, 177–188. [Google Scholar] [CrossRef]
- Saxena, V.; Kumar, N.; Kumar Saxena, V. A comprehensive review on combustion and stability aspects of metal nanoparticles and its additive effect on diesel and biodiesel fuelled CI engine. Renew. Sustain. Energy Rev. 2017, 70, 563–588. [Google Scholar] [CrossRef]
- D’Silva, R.; Binu, K.; Bhat, T. Performance and emission characteristics of a CI engine fuelled with diesel and TiO2 nanoparticles as fuel additive. Mater. Today Proc. 2015, 2, 3728–3735. [Google Scholar] [CrossRef]
- Fangsuwannarak, K.; Triratanasirichai, K. Effect of metalloid compound and bio-solution additives on biodiesel engine performance and exhaust emissions. Am. J. Appl. Sci. 2013, 10, 1201–1213. [Google Scholar] [CrossRef]
- SinghYadav, V.; Soni, S.L.; Sharma, D. Performance and emission studies of direct injection CI engine in duel fuel mode (hydrogen-diesel) with EGR. Int. J. Hydrogen Energy 2012, 37, 3807–3817. [Google Scholar] [CrossRef]
- Selvan, T.; Nagarajan, G. Combustion and emission characteristics of a diesel engine fuelled with biodiesel having varying saturated fatty acid composition. Int. J. Green Energy 2013, 10, 952–965. [Google Scholar] [CrossRef]
- Egnell, R. The Influence of EGR on Heat Release Rate and NO Formation in a DI Diesel Engine; SAE Technical Paper 2000-01-1807; SAE International: Warrendale, PA, USA, 2000. [Google Scholar] [CrossRef]
- Agarwal, D.; Kumar Singh, S.; Kumar Agarwal, A. Effect of exhaust gas recirculation (EGR) on performance, emissions, deposits and durability of a constant speed compression ignition engine. Appl. Energy 2011, 88, 2900–2907. [Google Scholar] [CrossRef]
- Sadhik Basha, J.; Anand, R. An experimental study in a CI engine using nanoadditive blended water–diesel emulsion fuel. Int. J. Green Energy 2011, 8, 3332–3348. [Google Scholar]
- Wang, W.G.; Lyons, D.W.; Clark, N.N.; Gautam, M.; Norton, P.M. Emissions from nine heavy trucks fueled by diesel and biodiesel blend without engine modification. Environ. Sci. Technol. 2000, 34, 933–939. [Google Scholar] [CrossRef]


| Fuel Property | Units | Diesel | Biodiesel | Ethanol | Method |
|---|---|---|---|---|---|
| Oxygen content | wt.% | 0 | 11 | 35 | D5293 |
| Carbon content | wt.% | 87 | 78 | 51 | D5291 |
| Hydrogen content | wt.% | 13 | 11 | 14 | D5292 |
| Cetane number | - | 55 | 62 | 7 | D6890 |
| Calorific value | MJ kg−1 | 43.37 | 34.35 | 27.52 | D240 |
| Flash point | °C | 69.8 | 110.15 | 13 | D93 |
| Kinematic viscosity @ 40 °C | mm2 s−1 | 3.42 | 4.19 | 1.13 | D445 |
| Density @ 15 °C | kg m−3 | 847.7 | 887.3 | 794.9 | D127 |
| Chemical Name | Titanium Dioxide |
|---|---|
| Purity | >99% |
| Form | Powder |
| Color | White |
| Average particle size | 20 nm |
| Molecular weight | 82.3 g/mol |
| Chemical abstract service (CAS) number | 12188-41-9 |
| Manufacturer and Model | LOVOL 1006TG1A |
|---|---|
| Engine type | Six-cylinder, four-stroke, direct injection, turbocharged |
| Number of cylinders | 6 |
| Cylinder volume | 5.99 lit |
| Bore and stroke | 100 * 127 (mm) |
| Compression ratio | 17.5:1 |
| Maximum torque | 337 Nm@1400 rpm |
| Maximum power | 62 kW@2000 rpm |
| Number of holes in the nozzle | 5 |
| Resolution | Range | Parameter |
|---|---|---|
| 1 ppm | 0–3000 ppm | NOx |
| 1 ppm | 0–5000 ppm | CO |
| 0.1 vol% | 0–50 vol% | CO2 |
| 1 ppm | 0–40,000 ppm | HC |
Disclaimer/Publisher’s Note: The statements, opinions and data contained in all publications are solely those of the individual author(s) and contributor(s) and not of MDPI and/or the editor(s). MDPI and/or the editor(s) disclaim responsibility for any injury to people or property resulting from any ideas, methods, instructions or products referred to in the content. |
© 2023 by the authors. Licensee MDPI, Basel, Switzerland. This article is an open access article distributed under the terms and conditions of the Creative Commons Attribution (CC BY) license (https://creativecommons.org/licenses/by/4.0/).
Share and Cite
Mobasheri, R.; Aitouche, A.; Pourtaghi Yousefdeh, S.; Zarenezhad Ashkezari, A. Assessing the Impact of Ethanol/Biodiesel/Diesel Blends and Nanoparticle Fuel Additives on Performance and Emissions in a DI Diesel Engine with EGR Integration: An Experimental Study. Processes 2023, 11, 1266. https://doi.org/10.3390/pr11041266
Mobasheri R, Aitouche A, Pourtaghi Yousefdeh S, Zarenezhad Ashkezari A. Assessing the Impact of Ethanol/Biodiesel/Diesel Blends and Nanoparticle Fuel Additives on Performance and Emissions in a DI Diesel Engine with EGR Integration: An Experimental Study. Processes. 2023; 11(4):1266. https://doi.org/10.3390/pr11041266
Chicago/Turabian StyleMobasheri, Raouf, Abdel Aitouche, Sadegh Pourtaghi Yousefdeh, and Abbas Zarenezhad Ashkezari. 2023. "Assessing the Impact of Ethanol/Biodiesel/Diesel Blends and Nanoparticle Fuel Additives on Performance and Emissions in a DI Diesel Engine with EGR Integration: An Experimental Study" Processes 11, no. 4: 1266. https://doi.org/10.3390/pr11041266