
Lipophilicity Study of Fumaric and Maleic Acids


Department of Analytical Chemistry, Faculty of Pharmaceutical Sciences in Sosnowiec, Medical University of Silesia in Katowice, Jagiellońska 4, 41-200 Sosnowiec, Poland
*
Author to whom correspondence should be addressed.
Processes 2023, 11(4), 993; https://doi.org/10.3390/pr11040993
Submission received: 27 February 2023
/
Revised: 20 March 2023
/
Accepted: 22 March 2023
/
Published: 24 March 2023
(This article belongs to the Special Issue 10th Anniversary of Processes: Women's Special Issue Series)
Abstract
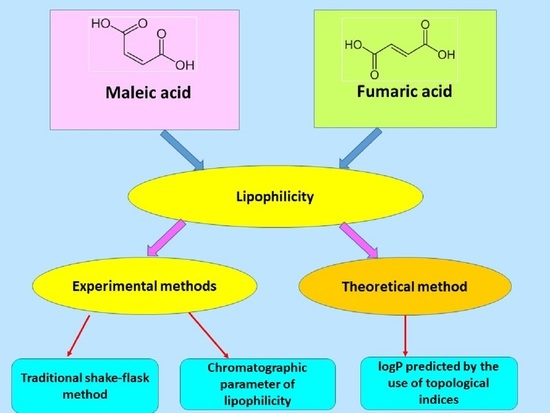
:The experimental lipophilicity of fumaric acid (FA) and maleic acid (MA) using the traditional shake-flask method in an n-octanol–water system using reversed-phase thin-layer chromatography (RP-TLC) was determined. Experimental partition coefficients (logPexp) were equal to −0.65 and 0.63 for MA and FA, respectively. The chromatographic lipophilicity (RMW) of the FA and MA was evaluated using reversed-phase thin-layer chromatography on RP8F254s, RP18WF254, and CNF254s plates with a mixture of an organic solvent (methanol or dioxane) and water as the mobile phase. All applied chromatographic conditions were appropriate to determine the lipophilicity of the tested MA and FA. Topological indices derived from distance matrices allowed for the development of a new method for the evaluation of the lipophilicity of MA and FA. All methods applied in this work indicate that MA is less lipophilic than FA. The methods used in this work to determine lipophilicity are of particular importance in the aspect of studying cis- and trans-configuration compounds, because generally available computer programs based on various algorithms (Virtual Computational Chemistry Laboratory and Molinspiration Cheminformatics) indicate that fumaric acid and maleic acid have identical logP values.
1. Introduction
Lipophilicity affects the bioavailability, degree of biodegradation, and chemical activity of chemical compounds, including drugs. The action of the drug can be divided into three main stages, which include: pharmaceutical, pharmacokinetic, and pharmacodynamic phases. Lipophilicity plays a role in each of these steps [1,2,3,4]. Drug design is an important field of science that is experiencing a renaissance. Knowledge of intermolecular interactions, which are the basis for the development of diseases, has enabled the development of new drug structures and the planning of innovative treatments. Designing drugs is a long-term process and requires extensive knowledge in the field of chemistry, pharmacology, and related fields. The improvement of the therapeutic index of a drug is achieved by increasing the solubility and ability to penetrate biological membranes. When designing new drugs, these parameters are modified by differentiating the hydrophilic–lipophilic balance [1,4]. In practice, optimal lipophilicity values are sought, as a significant increase in fat solubility leads to excessive interaction of subsequent analogs with lipids, which results in their irreversible retention in the lipid layer of the cell membrane [1,2,4]. For these reasons, the study of lipophilicity is of great practical importance. The measure of the lipophilicity of a chemical compound is the partition coefficient P, expressed as logP, and defined as the ratio of the equilibrium concentrations of the dissolved substance in the system of two phases: n-octanol (Co) and water (Cw) [3,5]:
logP = log (Co/Cw)
The logP value allows us to understand the hydrophilic or hydrophobic (lipophilic) nature of a molecule. Indeed, if logP is positive, it means that the molecule under consideration is more soluble in n-octanol than in water, reflecting its lipophilic nature. Conversely, if the logP is negative, the molecule is hydrophilic. A logP of zero means that the molecule is as soluble in one solvent as it is in the other. Compounds with 0 < logP < 1 are characterized by poor lipophilicity. On the other hand, compounds for which −1 < logP < 0 are characterized by weak hydrophilicity.
Lipophilicity can be determined experimentally: using the classic extraction method in the n-octanol–water system (shake-flask), reversed-phase thin-layer chromatography (RP-TLC), and reversed-phase high-performance liquid chromatography (RP-HPLC) [3,6]. The measurements of the partition coefficients by equilibration methods are frequently difficult to take, or even impossible due to the impurity or instability of the compounds, a strong preference of compounds for one of the two phases of the system, or the formation of stable emulsions after shaking. However, due to these limitations, the procedure is very often replaced by chromatographic techniques.
Fumaric acid (FA) and maleic acid (MA) belong to the α-hydroxy acids. FA is trans-butenedioic acid, whereas MA is cis-isomer of fumaric acid (Figure 1).
Fumaric acid (FA) appears in many plants, including mosses and mushrooms [7]. In recent years it has been proven that FA is useful in cancer research, cardiology, neurology, and immunology. It has also been used as an element in the design of certain drug carriers and scaffolds that are based on biomaterials [8,9,10,11,12]. It has a sour taste similar to grapes [13]. It serves a role as a gustatory, oxyntic, and antioxidant substance. MA is mostly used in cosmetology and stomatology. It has an exfoliating function in scrubs. In recent years it has been implied that maleic acid could be used in stomatology as a smear layer, removing disinfectant for the rinsing of root canals. The use of a MA solution for irrigation changes the wettability of the root canal’s dentin, which has an impact on bacterial adhesion, as well as the interaction between the root canal’s dentin and the filling material [14,15,16]. MA is also being used in stomatology, in combination with triclosan and PVM/MA copolymer [17,18,19].
A different configuration (cis/trans) within the double bond causes differences in the physicochemical properties of FA and MA that have been defined experimentally [7,13,20,21,22,23,24,25]. Table 1 presents basic experimental [7,13,20,21,22,23,24,25] and theoretical [26,27] physicochemical properties of fumaric and maleic acids.
The different values of logPexp in the n-octanol–water system were obtained for MA and FA (Table 1). The logPexp values were equal from −1.30 to −0.48 [20,22,24] and from 0.33 to 0.46 [21,23,25] for MA and FA, respectively. Whereas, the theoretical logP, predicted by using Virtual Computational Chemistry Laboratory (xlogP3, AlogPs, AlogP, AClogP, mlogP, xlogP2) and Molinspiration Cheminformatics (milogP), have identical values for MA and FA. For example, the theoretical AlogPs is 0.21 for both fumaric acid and maleic acid. To our knowledge, the lipophilicity of maleic and fumaric acids has not yet been investigated by the TLC technique. Therefore, in this work, the lipophilicity of fumaric and maleic acids was determined by use of the classical shake-flask method in the n-octanol–water system, the RP-TLC method, and new methods of calculation of the partition coefficient on the basis of the topological indices derived from the distance matrix.
2. Materials and Methods
2.1. Chemicals and Reference Standards
Fumaric acid (Sigma-Aldrich, St. Louis, MO, USA) and maleic acid (Fluka Chemie GmbH, Buchs, Switzerland) both had a degree of purity ≥ 99.0%. Methanol, dioxane, ammonia (25%), ethanol (POCh, Gliwice, Poland), and n-octanol (Sigma-Aldrich, St. Louis, MO, USA) were analytical grade. Distilled water at pH = 7.00 (Department of Analytical Chemistry, Sosnowiec, Poland) was also used. Chromatographic plates (E. Merck, Darmstadt, Germany): silica gel 60F254 (#1.05554), TLC RP8F254s (#1.15424), HPTLC RP18WF254 (#1.13124), and HPTLC CNF254s (#1.12571) were used in the thin-layer chromatography analysis.
2.2. Determining the Experimental Partition Coefficient (LogPexp) Using the Shake-Flask Method
2.2.1. Preparation of Samples
Water (pH = 7.00) saturated with n-octanol, and n-octanol saturated with water (pH = 7.00) were used in the study. A volume of 25 mL of n-octanol saturated with water, and 25 mL of water saturated with n-octanol were poured into the separatory funnel, and 100 mg of FA or MA was added. The extraction was carried out for 60 min at 20 °C. The extracted mixtures were left for 24 h to establish thermodynamic equilibrium. After this time, the aqueous phases were taken for quantitative analysis of FA and MA.
2.2.2. Normal-Phase Thin-Layer Chromatography (NP-TLC)
NP-TLC combined with densitometry on silica gel 60F254 plates (#1.05554, E. Merck, Darmstadt, Germany) was used to determinate FA and MA. The water fraction, after extraction of FA and MA, was spotted on the chromatographic plate. A mixture of ethanol, ammonia 25%, and water in a volume composition of 6:1:1 was used as the mobile phase [28]. Methyl red (100 mg in 100 mL of methanol) [28] was used as the visualizing reagent of FA and MA. A Camag densitometer was used for the quantitative analysis of FA and MA. Scanning parameters were: speed 20 mm/s, resolution 100 µm/step, and slit size 12 × 0.4 mm. Spectrodensitometric analysis was carried out in the wavelength range of 200–800 nm (Figure S1), and densitometry scanning was performed at λmax = 215 nm. Each track was scanned five times. The content of FA and MA in the aqueous phase was calculated from the appropriate calibration curves. Standard solutions of FA and MA in water saturated with n-octanol were used to construct the calibration equations. FA and MA were applied to the plates at 4, 8, 12, 16, 20, 24, 28, 32, 36, and 40 µg. Next, logPexp for FA and MA was calculated using Equation (1). The analyzes were repeated six times.
2.2.3. Validation of the Normal-Phase Thin-Layer Chromatography Method for Determination of Experimental Partition Coefficient (LogPexp)
The NP-TLC method was validated according to the ICH guidelines [29].
Linearity of Detector Response and Range
The linearity of the TLC method was evaluated by the analysis series of the standard solutions (in water saturated with n-octanol) of FA and MA at the following concentrations 0.80, 1.60, 2.40, 3.20, 4.00, 4.80, 5.60, 6.40, 7.20, and 8.00 mg mL−1. The solutions (5 μL) were applied to the same plate. The calibration plots were developed by plotting peak area versus concentration of FA and MA (Table S1, Figures S2 and S3, respectively).
The experiments were performed in five different analyses.
Accuracy
The accuracy of the TLC method was determined by investigating the recovery percentage of the studied FA and MA at three concentration levels covering the low, medium, and high regions of the calibration plot by spotting on a chromatographic plate (n = 5 for each concentration level, where n represent the number of analyses). The resulting spots were analyzed by the use of the TLC procedure described above.
Precision
The precision was evaluated in terms of the repeatability (intraday) and interday precision. The repeatability of the proposed method was determined by the analysis of three replicates of the sample solutions at three concentration levels under the same operating conditions over a short interval of time (the same day). The intermediate (interday) precision was determined for three sample solutions at three concentration levels by an analyst who performed the analysis over a period of one week. To determine the precision of the procedure, the concentrations were prepared independently, and experiments were performed in three different analyses. The precision was evaluated as the coefficient of variation, CV [%]. The obtained peak areas were used to calculate the mean value and the CV [%].
Limit of Detection (LOD) and Limit of Quantification (LOQ) Based on the Specific Calibration Curve
Specific calibration curves were prepared using samples containing FA and MA in the low range of their concentrations. The limit of detection and limit of quantification were calculated from the equation of the graph of the area obtained by the spots of FA and MA versus the concentration. The LOD and LOQ were calculated using the equations:
where: σ is the standard deviation (standard deviation of the intercept σa and residual standard deviation σxy of the calibration curve), and S is the slope of the calibration curve.
Next, the mean values of LOD and LOQ were calculated for FA and MA.
The experiments were performed in six different analyses.
2.3. Use of RP-TLC for the Evaluation of Chromatographic Parameters of the Lipophilicity
The methanolic solutions of FA and MA were spotted on RP8F254s, RP18WF254, and CNF254s chromatographic plates. The plates were developed by using two mobile phases, namely, using a mixture of methanol and water, as well as a mixture of dioxane and water, in different volume compositions. After drying the chromatographic plates, FA and MA were detected with methyl red (100 mg in 100 mL methanol) as a visualizing reagent. The analyses were repeated three times. The obtained RF values were converted to RM values. Next, from the RM values (Tables S2–S5) and the content of the organic component in the mobile phase, the RMW chromatographic parameter of lipophilicity was calculated using the Soczewinski–Wachtmeister equation [3]:
where: RM is the value of the examined substance by content φ of the volume fraction of the methanol or dioxane in the mobile phase; RMW is the theoretical value of the RM of the analyte extrapolated to zero concentration of the methanol or dioxane in the mobile phase; S is the slope of the regression curve; φ is the volume fraction of the methanol or dioxane in the mobile phase.
RM = RMW − S·φ
2.4. New Ways of Calculation of the logP for the FA and the MA
New ways of calculating the logP value were suggested for fumaric acid and maleic acid using Equations (5)–(8):
where: 0B, 3Bq, χ012, A, and W are the topological indices; and the RM values are of MA and FA analyzed on RP8F254s, RP18WF254, and CNF254s plates with the mixtures of methanol and water, as well as dioxane and water in a volume composition of 2:8 (v/v).
2.5. Statistical Analysis
The computer software Statistica 13.0 (Statsoft, Kraków, Poland) was used for all calculations.
3. Results and Discussion
3.1. Determination of LogPexp Using the Shake-Flask Method
3.1.1. NP-TLC Method Validation for Determination of Experimental Partition Coefficient (logPexp)
Specificity
To date, fumaric and maleic acids have only been studied qualitatively by TLC. This was due to the difficulty of their identification enabling further densitometric analysis. However, Pyka-Pająk [28] has developed chromatographic conditions that allow separation by the NP-TLC technique, and identification of these two acids soluted in methanol. These chromatographic conditions were used to separate FA and MA in the aqueous phase after their extraction in the n-octanol–water system. The separation of FA and MA in the aqueous phase after extraction in the n-octanol–water system is shown in Figure 2. The obtained Rf values of the standard fumaric acid and the FA after extraction in the n-octanol-water system tested by the NP-TLC method are consistent, and equal to 0.67 ± 0.04. For maleic acid, the Rf is 0.37 ± 0.04. The presently used chromatographic conditions allow for the separation of MA and FA. Therefore, it should be considered that the applied normal-phase thin-layer chromatography is specific.
Range
Linearity was determined by using the measurements of the area of densitometric bands (Table S1) for standard solutions of fumaric and maleic acids in the determined range of concentrations for tests carried out using the thin-layer adsorption chromatography technique. The rectilinear range for fumaric acid is 4–40 µg/spot (Table 2, Figure S2), and for maleic acid it is 8–40 µg/spot (Table 2, Figure S3).
Accuracy
The accuracy of the method was evaluated by the measurement of the recovery. Maleic acid and fumaric acid content quantitative recoveries of 98.6% ÷ 101.4% and 98.7% ÷ 102.4%, respectively, were obtained (Table 2). The low coefficient of variation values (CV < 2%) are indicative of the accuracy of the method.
Precision
The precision of the method was determined as the repeatability and intermediate of the system at three different concentrations of FA and MA. The results from these experiments, expressed as the coefficients of variation (CV, %) of the respective response factors (a relationship between the peak area and concentration of FA and MA), are presented in Table 2. Since the CV for the repeatability and intermediate were < 3%, the method was precise.
Limit of Detection (LOD) and Limit of Quantification (LOQ) Based on the Calibration Curve
The limit of detection and limit of quantification of fumaric acid were determined by using the standard deviation (standard deviation of the intercept σa and residual standard deviation σxy) of the obtained calibration curve, and were calculated according to Equations (2) and (3). Under the presently used experimental conditions, the lowest amounts of MA and FA that could be detected as the average LOD were 1.97 and 1.32 μg·spot−1 (Table 2), respectively. The average limits of quantification (LOQ) of MA and FA were 5.97 and 4.00 µg·spot−1, respectively (Table 2). This indicates that the developed method is sensitive.
3.1.2. Calculation of the Content of FA and MA in the Aqueous Phase after Extraction in the n-Octanol–Water System and Determination of Experimental Partition Coefficient
The agreement of the RF values of the standard FA and MA with the FA and MA from the aqueous phase, after the extraction in the system of n-octanol and water, analyzed by the NP-TLC technique, was found. The RF values are 0.37 ± 0.04 and 0.67 ± 0.04 for MA and FA, respectively. In addition, very good agreement was found between the MA and the FA spectrodensitograms from the standard solutions and from the water phase after the extraction in the system of n-octanol and water. Agreement of the spectra was assessed by a correlation coefficient, which was greater than 0.99, and was calculated using the WinCats 1.4.2 computer program.
The average value of the experimental partition coefficient (logPexp) in the n-octanol–water system was found to be −0.65 ± 0.02 and 0.63 ± 0.02 for MA and FA, respectively. The statistical evaluation of the obtained logPexp of MA and FA determined in the n-octanol–water system is presented in Table 3. The presented results indicate that the obtained values are characterized by low scatter. The standard deviation is 0.015, and the coefficient of variation is 2.31% and 2.38% for MA and FA, respectively. The coefficients of variation are small values, which means that the obtained results are characterized by a small dispersion.
3.2. Use of Reversed-Phase Thin-Layer Chromatography for the Lipophilicity Chromatographic Parameters Evaluation
Reversed-phase thin-layer chromatography on three kinds of chromatographic plates (RP18WF254s, RP8F254s, and CNF254s) and with two mobile phases, namely, mixtures of methanol and water, as well as dioxane and water in different volume compositions, was used for the determination of the lipophilicity of FA and MA. The lipophilicity of FA and MA was expressed using the Soczewiński–Wachtmeister equation as the lipophilic chromatographic parameter RMW. In all of the chromatographic conditions, FA had a higher RMW value than MA (Table 4). The received RMW values were equal from −1.81 to −0.50 and from 0.12 to 1.05 for MA and FA, respectively. The average RMW values for maleic acid were equal to −0.81 and −1.36 using methanol-water and dioxane-water as the mobile phase, respectively. The average RMW values for fumaric acid were equal to 0.82 and 0.49 using the mixture of methanol and water, as well as the mixure of dioxane and water as the mobile phases, respectively. Including the analyses using both mobile phases, the average RMW values were equal to −1.08 and 0.66 for MA and FA, respectively.
3.3. New Ways of Computation of the logP for FA and MA
The topological indices, based on the distance matrix, distinguish between cis/trans isomers [32]. Therefore, the values of the indices based on the distance matrix are different for MA and FA. The calculated topological indices based on the adjacency and distance matrices for FA and MA are presented in Table 5.
New methods of the logP calculation for FA and MA using the topological indices derived from the distance matrix (0B, 3Bq, A, W) and adjacency matrix (χ012) were proposed. Lipophilicity parameters (logP1, logP2, logP3, and logP4), calculated by the use of Equations (5)–(8), are presented in Table 6.
The average logPavg(m) values using a mixture of methanol and water as the mobile phase were equal to −0.767 and 0.119 for MA and FA, respectively. The average logPavg(d) values using dioxane–water as the mobile phase were equal to −1.017 and −0.136 for MA and FA, respectively. It has been found that the new method of calculating the partition coefficient always yields higher values of FA than MA.
Topological indices 0B, 3Bq, A, and W have important encoded information regarding the structure of fumaric acid and maleic acid that other topological indices do not have. The scientific literature indicates that the topological indices oB and 3Bq have been used earlier to evaluate a wide variety of physicochemical properties of different classes of compounds [34,35,36,37,38].
3.4. Comparison of Lipophilicity of Fumaric Acid and Maleic Acid Obtained in This Paper and by Different Methods within the Literature Data
The lipophilicity of FA and MA obtained in this work by different methods within the literature data were compared (Figure 3).
The literature data [20,21,22,23,24,25] indicate that the values of partition coefficients in the n-octanol-water system are higher for FA than MA. Similarly, the logPexp values obtained in this work in the n-octanol–water system and by the Soczewiński method, and by the new methods using topological indices, also have higher values for FA than MA. However, the use of topological indices in combination with the RM values obtained using the dioxane–water mobile phase should not be recommended to determine the lipophilicity of the tested acids, because, under these conditions the logP for FA has a negative value, i.e., −0.136.
The solubility of maleic acid in water is higher than fumaric acid [20,21]. FA and MA have two carboxyl groups. FA is a trans acid, so the carboxyl groups are on opposite sides of the double bond. MA is a cis acid and, therefore, the carboxyl groups are on the same side of the double bond. FA has no dipole moment, while MA has a dipole moment. Therefore, MA is a polar molecule and FA is nonpolar. This is why the logP of MA must be less than the logP of FA. It shows that the experimental lipophilicity obtained in this work is correct, i.e., the lipophilicity of MA is always lower than that of FA.
4. Conclusions
So far, the RP-TLC technique has not been used to study the lipophilicity of fumaric acid and maleic acid. Another novelty is the use of the NP-TLC technique for the quantitative determination of fumaric and maleic acids in the aqueous phase after their extraction in the n-octanol–water system. All the methods used in this work, i.e., the classic shake-flask method, the RP-TLC method in combination with the Soczewiński equation, and the new methods using topological indices, determining the lipophilicity of fumaric acid and maleic acid are useful and yield consistent results. The logPexp values obtained in this work in the n-octanol–water system and by the Soczewiński method, and by the new methods using topological indices, have higher values for FA than MA. Under most methodological conditions, maleic acid showed a higher affinity to the water phase, while fumaric acid showed a higher affinity to the lipid phase. The methods employed to determine lipophilicity are of particular importance in the aspect of studying cis- and trans-configuration compounds, because generally available computer programs based on various algorithms (Virtual Computational Chemistry Laboratory and Molinspiration Cheminformatics) indicate that fumaric acid and maleic acid have identical logP values. The new theoretical calculations of the logP values, based on topological indices, and also the chromatographic determination of the lipophilicity of the examined compounds, complement well-established methods and applications, such as the traditional shake-flask method. Because of the experimental difficulties, including the solubility limits, chemical instability, formation of emulsions, or impurities of the organic compounds, the evaluation of the logP values by the proposed RP-TLC method is well-founded in this paper. The methodology for the lipophilicity assessment for maleic and fumaric acids described in our paper can be used for the further study and estimation of the lipophilic properties of other organic compounds, indicating a different biological significance. The comparison of these results indicates that our new method of the calculation of the partition coefficients using topological indices, and also the chromatographic lipophilicities, are powerful tools in the determination of the logP values of maleic and fumaric acids.
Supplementary Materials
The following supporting information can be downloaded at: https://www.mdpi.com/article/10.3390/pr11040993/s1. Figure S1: Spectrodensitograms of maleic acid (pink line) and fumaric acid (celadon line); Table S1: Average of spot area [AU] of maleic and fumaric acids analyzed by NP-TLC; Figure S2: Calibration curve of fumaric acid tested by NP-TLC chromatography; Figure S3: Calibration curve of maleic acid tested by NP-TLC chromatography; Table S2: RM values of maleic acid analyzed by RP-TLC technique using methanol–water mobile phase; Table S3: RM values of maleic acid analyzed by RP-TLC technique using dioxane–water mobile phase; Table S4: RM values of fumaric acid analyzed by RP-TLC technique using methanol–water mobile phase; Table S5: RM values of fumaric acid analyzed by RP-TLC technique using dioxane–water mobile phase.
Author Contributions
Conceptualization, D.K. and A.P.-P.; methodology, A.P.-P.; software, A.P.-P.; investigation, D.K.; writing—original draft preparation, D.K. and A.P.-P.; writing—review and editing, D.K. and A.P.-P. All authors have read and agreed to the published version of the manuscript.
Funding
This research was funded by Medical University of Silesia grant number PCN-1-040/K/2/F.
Data Availability Statement
Not applicable.
Conflicts of Interest
The authors declare that there is no conflict of interest regarding the publication of this paper.
References
- Arnott, J.A.; Planey, S.L. The influence of lipophilicity in drug discovery and design. Expert Opin. Drug Discov. 2012, 7, 863–875. [Google Scholar] [CrossRef] [PubMed]
- Rutkowska, E.; Pająk, K.; Jóźwiak, K. Lipophilicity- methods of determination and its role in medicinal chemistry. Acta Pol. Pharm. 2013, 70, 3–18. [Google Scholar] [PubMed]
- Jóźwiak, K.; Szumiło, H.; Soczewiński, E. Lipophilicity, methods of determination and its role in biological effect of chemical substances. Wiad. Chem. 2001, 55, 1047–1074. (In Polish) [Google Scholar]
- Patrick, G. Medical Chemistry. In Basic Issues, 1st ed.; Scientific and Technical Publisher: Warsaw, Poland, 2003; pp. 271–272, 304–307. (In Polish) [Google Scholar]
- Sangster, J. Octanol-Water Partition Coefficients: Fundamentals and Physical Chemistry; Wiley&Sons: Chichester, UK, 1997; pp. 57–64. [Google Scholar]
- Cimpan, G. Lipophilicity determination of organic substances by reversed-phase TLC. In Encyclopedia of Chromatography, 2nd ed.; Cazes, J., Ed.; Taylor & Francis Group: Bosa Roca, FL, USA, 2005; Volume 2005, pp. 999–1001. [Google Scholar]
- Goldberg, I.; Rokem, J.S.; Pines, O. Review Organic acids: Old metabolites, new themes. J. Chem. Technol. Biotechnol. 2006, 81, 1601–1611. [Google Scholar] [CrossRef]
- Matteo, P.; Federico, D.; Emanuela, M.; Giulia, R.; Tommaso, B.; Alfredo, G.; Anna, C.; Annamaria, O. New and Old Horizons for an Ancient Drug: Pharmacokinetics, Pharmacodynamics, and Clinical Perspectives of Dimethyl Fumarate. Pharmaceutics 2022, 14, 2732. [Google Scholar] [CrossRef]
- Reich, A.; Adamski, Z.; Chodorowska, G.; Kaszuba, A.; Krasowska, D.; Lesiak, A.; Maj, J.; Narbutt, J.; Osmola-Mańkowska, A.J.; Owczarczyk-Saczonek, A.; et al. Psoriasis. Diagnostic and therapeutic recommendations of the Polish Dermatological Society. Part 2. Dermatol. Rev. 2020, 107, 110–137. [Google Scholar] [CrossRef]
- Zhang, D.; Bian, Q.; Li, J.; Huang, Q.; Gao, J. Enhancing effect of fumaric acid on transdermal penetration of loxoprofen sodium. Int. J. Pharm. 2020, 588, 119722. [Google Scholar] [CrossRef]
- Das, R.K.; Brar, S.K.; Verma, M. Recent advances in the biomedical applications of fumaric acid and its ester derivatives: The multifaceted alternative therapeutics. Pharmacol. Rep. 2016, 68, 404–414. [Google Scholar] [CrossRef]
- Emre, S. Review of the use of fumaric acid esters in dermatology. J. Turk. Acad Dermatol. 2016, 10, 16104r1. [Google Scholar] [CrossRef]
- Martin-Dominguez, V.; Estevez, J.; de Borja Ojembarrenna, F.; Santos, V.E.; Ladero, M. Fumaric acid production: A biorefinery perspective. Fermentation 2018, 4, 33. [Google Scholar] [CrossRef] [Green Version]
- Rao, S.; Ballal, N.V.; Narkedamalli, R.K. Efficacy of SmearOFF, maleic acid, and ethylenediaminetetraacetic acid combined with sodium hypochlorite in removal of smear layer from curved root canals: In vitro study. Saudi. Endod. J. 2021, 11, 221–227. [Google Scholar] [CrossRef]
- Ballal, N.V.; Ferrer-Luque, C.M.; Sona, M.; Prabhu, K.N.; Arias-Moliz, T.; Baca, P. Evaluation of final irrigation regimens with maleic acid for smear layer removal and wettability of root canal sealer. Acta Odontol. Scand. 2017, 76, 199–203. [Google Scholar] [CrossRef] [PubMed]
- Ferrer-Luque, C.M.; GonzálezCastillo, S.; Ruiz-Linares, M.; Arias-Moliz, M.T.; Rodríguez-Archilla, A.; Baca, P. Antimicrobial residual effects of irrigation regimens with maleic acid in infected root canals. J. Biol. Res. 2015, 22, 1–5. [Google Scholar] [CrossRef] [PubMed] [Green Version]
- Sadlak-Nowicka, J. Triclosan: Antibacterial and anti-inflammatory properties and clinical effects on plaque and gingivitis reduction. Czas. Stomatol. 2008, 61, 190–202. (In Polish) [Google Scholar]
- Konopka, T. Triclosan/copolymer in the control of subgingival plaque and periodontitis. Czas. Stomatol. 2008, 61, 203–211. (In Polish) [Google Scholar]
- Scheidelaar, S.; Koorengevel, M.C.; Pardo, J.D.; Meeldijk, J.D.; Breukink, E.; Killian, J.A. Molecular model for the solubilization of membranes into nanodisks by styrene maleic acid copolymers. Biophys. J. 2015, 108, 279–290. [Google Scholar] [CrossRef] [Green Version]
- Maleic Acid Safety Data Sheet. Available online: https://www.carlroth.com/medias/SDB-K304-PL-PL.pdf?context=bWFzdGVyfHNlY3VyaXR5RGF0YXNoZWV0c3wyNjA4MTZ8YXBwbGljYXRpb24vcGRmfHNlY3VyaXR5RGF0YXNoZWV0cy9oNzQvaGY2LzkwNTk5NjU5Mjc0NTQucGRmfDU3ODFlYWQ1YWM3N2U0N2U0NzFmOGUwZTZhYmY2NTM4YWMyMzZlMTI1YjY2NTAzNjdkZWQxNWE3NDkwNGUxZTI (accessed on 8 February 2023).
- Fumaric Acid Safety Data Sheet. Available online: https://www.carlroth.com/medias/SDB-3748-PL-PL.pdf?context=bWFzdGVyfHNlY3VyaXR5RGF0YXNoZWV0c3wyNTYwMjR8YXBwbGljYXRpb24vcGRmfHNlY3VyaXR5RGF0YXNoZWV0cy9oZDgvaDNlLzkwNjkyOTI2NTA1MjYucGRmfGVlYTI0ZjZjNjE4MGFkOGZhNjZkOWQyNTBmNzkzNjE3NTMyNTUyNzBmOWFkY2U2NWZjYjAxN2M3MzAwNmFmZDU (accessed on 8 February 2023).
- PubChem. Available online: https://pubchem.ncbi.nlm.nih.gov/compound/444266 (accessed on 8 February 2023).
- PubChem. Available online: https://pubchem.ncbi.nlm.nih.gov/compound/Fumaric-acid (accessed on 8 February 2023).
- Drugbank. Available online: https://go.drugbank.com/drugs/DB04299 (accessed on 8 February 2023).
- Drugbank. Available online: https://go.drugbank.com/drugs/DB01677 (accessed on 8 February 2023).
- Virtual Computational Chemistry Laboratory. Available online: http://www.vcclab.org/lab/alogps (accessed on 2 February 2023).
- Molinspiration Cheminformatics. Available online: https://www.molinspiration.com/cgi-bin/properties (accessed on 2 February 2023).
- Pyka-Pająk, A. Fumaric and maleic acids—Separation and detection by NP-TLC technique in connection with densitometry. Farm. Pol. 2019, 75, 475–480. (In Polish) [Google Scholar] [CrossRef]
- ICH Harmonised Tripartite Guideline: Validation of Analytical Procedures: Text and Methodology, Q2(R1), ICH, Geneva, Switzerland. 2005. Available online: https://database.ich.org/sites/default/files/Q2%28R1%29%20Guideline.pdf (accessed on 8 February 2023).
- Devillers, J.; Balaban, A.T. Topological Indices and Related Descriptors in QSAR and QSPR; Gordon and Breach Science Publishers: London The Netherlands, 1999. [Google Scholar]
- Pyka, A. Correlation of topological indexes with the chromatographic separation of isomers. J. Planar Chromatogr. Mod. TLC 1991, 4, 316–318. [Google Scholar]
- Pyka, A. Correlation of topological indexes with the chromatographic separation of isomers. Part II. J. Planar Chromatogr. Mod. TLC 1992, 5, 435–440. [Google Scholar]
- Barysz, M.; Jashari, G.; Lall, R.S.; Srivastava, R.S.; Trinajstić, N. On the distance matrix of molecules containing heteroatoms. Chemical applications of topology and graph theory. Stud. Phys. Theor. Chem. 1983, 28, 222–230. [Google Scholar]
- Pyka, A. Topological indices: TLC. In Encyclopedia of Chromatography, 3rd ed.; Cazes, J., Ed.; Taylor and Francis: Boca Raton, FL, USA, 2010; Volume 2010, pp. 2340–2350. [Google Scholar]
- Pyka, A. Topological indices: Use in HPLC. In Encyclopedia of Chromatography, 3rd ed.; Cazes, J., Ed.; Taylor and Francis: Boca Raton, FL, USA, 2010; Volume 2010, pp. 2351–2360. [Google Scholar]
- Pyka, A.; Kępczyńska, E.; Bojarski, J. Application of selected traditional structural descriptors to QSRR and QSAR analysis of barbiturates. Indian J. Chem. A 2003, 42A, 1405–1413. [Google Scholar]
- Niestrój, A. Comparison of methods for calculation of the partition coefficients of selected aliphatic compounds. J. Planar Chromatogr. Mod. TLC 2010, 23, 198–200. [Google Scholar] [CrossRef]
- Niestrój, A. Comparison of methods for calculation of the partition coefficients of selected tocopherols. J. Planar Chromatogr. Mod. TLC 2007, 20, 483–486. [Google Scholar] [CrossRef]
Figure 1.
Structural formulas of maleic acid (a) and fumaric acid (b).
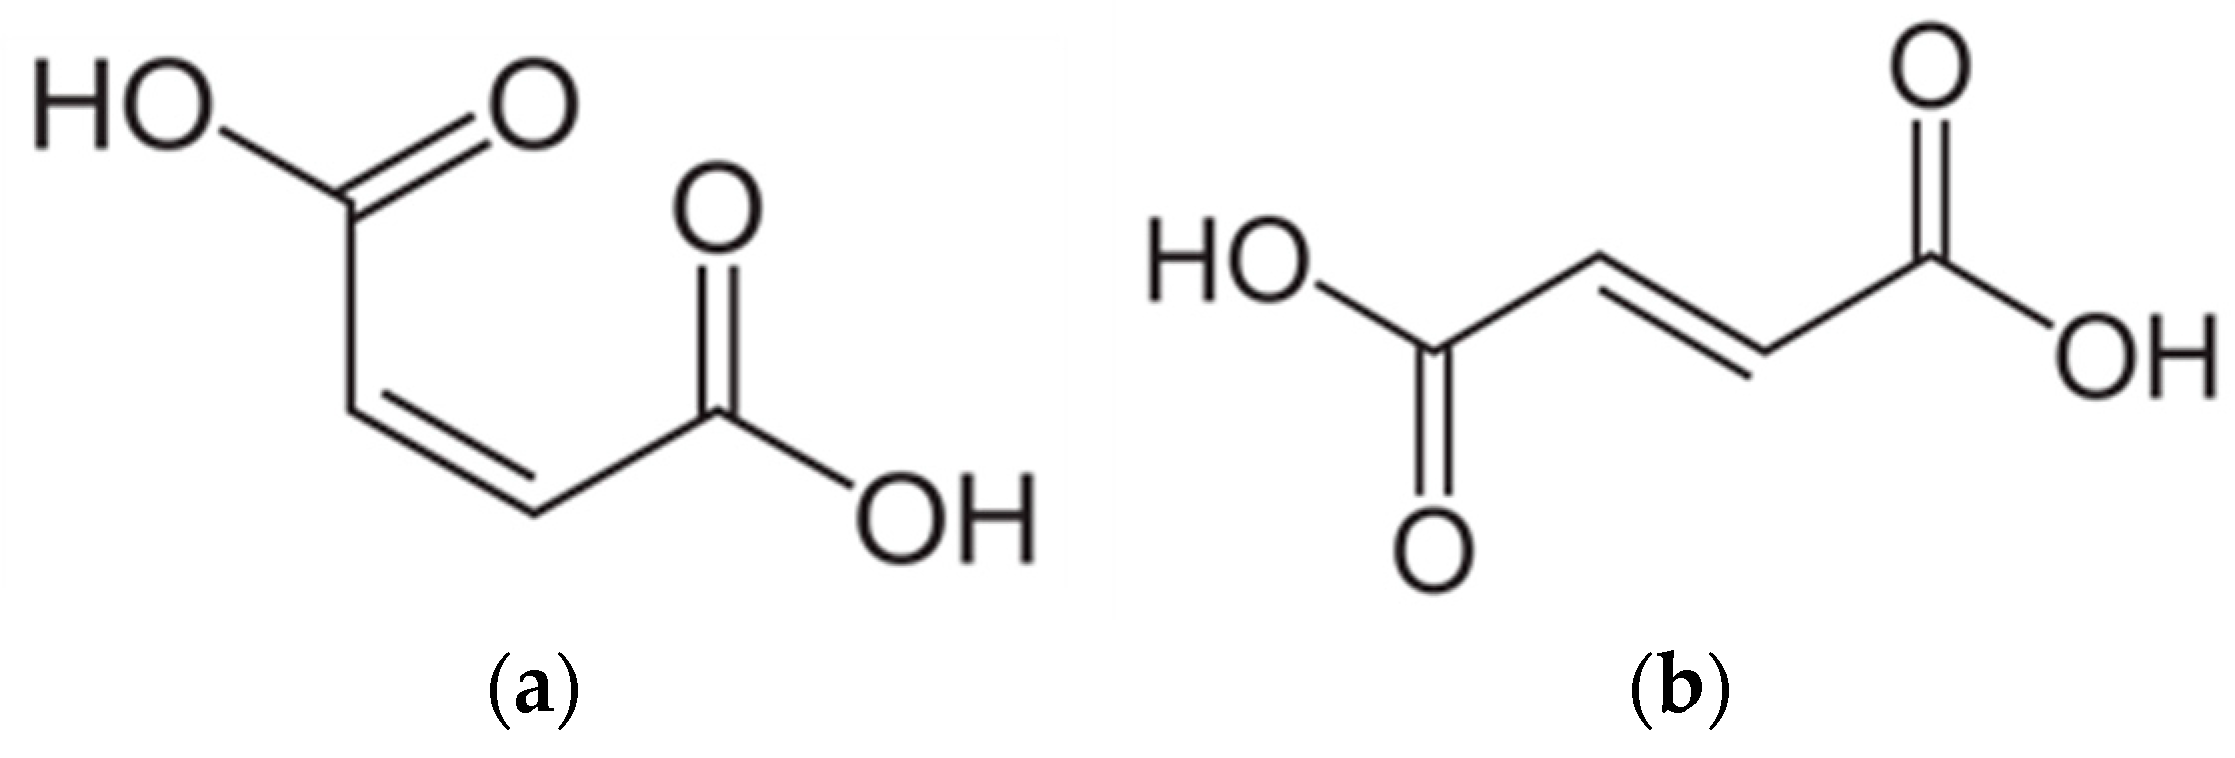
Figure 2.
Densitogram of the mixture of fumaric acid (FA) and maleic acid (MA) after extraction in the n-octanol–water system and separation by NP-TLC.
Figure 2.
Densitogram of the mixture of fumaric acid (FA) and maleic acid (MA) after extraction in the n-octanol–water system and separation by NP-TLC.

Figure 3.
Comparison of the lipophilicity of FA and MA obtained in this paper and by different methods within the literature data.
Figure 3.
Comparison of the lipophilicity of FA and MA obtained in this paper and by different methods within the literature data.


Table 1.
Experimental and theoretical physicochemical properties of maleic and fumaric acids.
| Parameter | Acid | |
|---|---|---|
| Maleic | Fumaric | |
| Experimental data | ||
| pH | 1.3 | 2.1 |
| Melting temperature | 130–135 °C | 287 °C |
| Boiling point | 157.8 °C | 290 °C |
| Flash point | 127 °C | 273 °C |
| Density | 1.59 g/mL at 20 °C | 1.64 g/mL at 20 °C |
| Solubilty in water | 478.8 g/L at 20 °C | 7 g/L at 25 °C |
| pKa | 1.83 | 3.03 |
| Partition coefficient in n-octanol-water (logPow) | −1.30 | 0.33 |
| −0.48 | 0.46 | |
| Theoretical data | ||
| AlogPs | 0.21 | 0.21 |
| AClogP | −0.76 | −0.76 |
| AlogP | −0.01 | −0.01 |
| mlogP | −0.45 | −0.45 |
| xlogP2 | −0.42 | −0.42 |
| xlogP3 | −0.34 | −0.34 |
| miLogP | −0.68 | −0.68 |
Table 2.
NP-TLC method validation results.
| Parameter | Maleic Acid | Fumaric Acid |
|---|---|---|
| Linearity range, | 8.0 ÷ 40.0 | 4.0 ÷ 40.0 |
| (µg/spot) | ||
| Calibration curves A = (a ± Sa)·x + (b ± Sb) | ||
| Slope (a ± Sa) | 647.6 (±27.5) | 1641.7 (±47.9) |
| Intercept (b ± Sb) | 785.7 (±72.2) | 15,116.6 (±1187.7) |
| Correlation coefficient, R | 0.994 | 0.996 |
| LOD (µg/spot) | 1.97 | 1.32 |
| LOQ (µg/spot) | 5.97 | 4.00 |
| Precision, CV [%] | ||
| Repeatability | 1.32% ÷ 2.12% | 1.45% ÷ 2.33% |
| Intermediate | 1.38% ÷ 2.46% | 1.83% ÷ 2.86% |
| Recovery levels (%) | ||
| 80% | R = 101.4%, CV = 1.4% | R = 98.7%, CV = 1.8% |
| 100% | R = 98.9%, CV = 1.1% | R = 102.4%, CV = 1.3% |
| 120% | R = 98.6%, CV = 0.8% | R = 99.5%, CV = 1.2% |
Where: A is spot area [AU], x is an amount of fumaric acid or maleic acid [µg/spot].
Table 3.
Statistical analysis of the obtained experimental partition coefficient (logPexp) of maleic acid and fumaric acid determined in the n-octanol–water system.
Table 3.
Statistical analysis of the obtained experimental partition coefficient (logPexp) of maleic acid and fumaric acid determined in the n-octanol–water system.
| Maleic Acid | Fumaric Acid | |
|---|---|---|
| Number of determination (n) | 6 | 6 |
| Particular obtained logPexp | −0.63 | 0.64 |
| −0.67 | 0.63 | |
| −0.66 | 0.65 | |
| −0.64 | 0.64 | |
| −0.65 | 0.61 | |
| −0.64 | 0.62 | |
| Mean value of logPexp | −0.65 | 0.63 |
| Minimum value of logPexp | −0.67 | 0.61 |
| Maximum value of logPexp | −0.63 | 0.65 |
| Variation (s2) | 0.000217 | 0.000217 |
| Standard deviation (SD) | 0.015 | 0.015 |
| Coefficient of variation [CV, %] | −2.31% | 2.38% |
| The 95% confidence interval of arithmetic mean | μ = −0.65 ± 0.02 | μ = 0.63 ± 0.02 |
Table 4.
Lipophilicity parameter (RMW) obtained on RP plates using two mobile phases, and computed using the Soczewiński–Wachtmeister equation: RM = RMW – S·φ.
Table 4.
Lipophilicity parameter (RMW) obtained on RP plates using two mobile phases, and computed using the Soczewiński–Wachtmeister equation: RM = RMW – S·φ.
| RP Plate | RMW | S | n | r | s | F | Eq. No. |
|---|---|---|---|---|---|---|---|
| Maleic acid | |||||||
| Methanol–water | |||||||
| RP18WF254 | −0.50 (±0.07) | 2.82(±0.06) | 7 | 0.994 | 0.072 | 424 | (9) |
| RP8F254s | −0.79 (±0.04) | 1.15 (±0.06) | 9 | 0.990 | 0.047 | 354 | (10) |
| CNF254s | −1.13 (±0.04) | 2.28 (±0.08) | 7 | 0.996 | 0.042 | 825 | (11) |
| RMWavg(m) = −0.81 | |||||||
| Dioxane–water | |||||||
| RP18WF254 | −1.35 (±0.05) | 2.02 (±0.09) | 7 | 0.995 | 0.046 | 533 | (12) |
| RP8F254s | −1.81 (±0.05) | 1.28 (±0.10) | 7 | 0.985 | 0.052 | 147 | (13) |
| CNF254s | −0.92 (±0.04) | 2.15 (±0.07) | 8 | 0.997 | 0.044 | 1017 | (14) |
| RMWavg(d) = −1.36 | |||||||
| Fumaric acid | |||||||
| Methanol–water | |||||||
| RP18WF254 | 0.95 (±0.09) | 3.30 (±0.14) | 9 | 0.993 | 0.108 | 556 | (15) |
| RP8F254s | 0.46 (±0.08) | 3.00 (±0.12) | 9 | 0.994 | 0.094 | 609 | (16) |
| CNF254s | 1.05 (±0.06) | 3.28 (±0.09) | 9 | 0.997 | 0.072 | 1230 | (17) |
| RMWavg(m) = 0.82 | |||||||
| Dioxane–water | |||||||
| RP18WF254 | 0.12 (±0.05) | 1.95 (±0.09) | 9 | 0.997 | 0.069 | 1080 | (18) |
| RP8F254s | 0.92 (±0.11) | 3.57 (±0.17) | 9 | 0.992 | 0.135 | 419 | (19) |
| CNF254s | 0.44 (±0.08) | 3.02 (±0.14) | 7 | 0.997 | 0.074 | 743 | (20) |
| RMWavg(d) = 0.49 | |||||||
Where: n is number of measurement points, r is correlation coefficient, s is standard error, F is value of Fisher test.
Table 5.
Selected topological indices for fumaric acid (FA) and maleic acid (MA).
| Index Based on Adjacency Matrix | ||
|---|---|---|
| χ012 | FA | 2.575 |
| MA | 2.575 | |
| Indices Based on Distance Matrix | ||
| oB | FA | 2.265 |
| MA | 2.431 | |
| 3Bq | FA | 0.2079 |
| MA | 0.2602 | |
| W | FA | 51.807 |
| MA | 44.688 | |
| A | FA | 39.94 |
| MA | 31.68 | |
Table 6.
LogP calculated using Equations (5)–(8) at the application of the topological indices and the RM values for maleic acid (MA) and fumaric acid (FA).
Table 6.
LogP calculated using Equations (5)–(8) at the application of the topological indices and the RM values for maleic acid (MA) and fumaric acid (FA).
| logP1 | logP2 | logP3 | logP4 | |||||
|---|---|---|---|---|---|---|---|---|
| MA | FA | MA | FA | MA | FA | MA | FA | |
| Methanol-water, 2:8. v/v | ||||||||
| RP18WF254 | −0.405 | 0.155 | −0.379 | 0.169 | −1.043 | 0.400 | −0.698 | 0.271 |
| RP8F254 | −0.414 | −0.070 | −0.387 | −0.076 | −1.066 | −0.180 | −0.713 | −0.122 |
| CNF254 | −0.658 | 0.138 | −0.615 | 0.150 | −1.694 | 0.355 | −1.134 | 0.241 |
| logPavg | −0.492 | 0.074 | −0.460 | 0.081 | −1.268 | 0.192 | −0.848 | 0.130 |
| Average logPavg(m): −0.767 for MA and 0.119 for FA | ||||||||
| Dioxane-water, 2:8. v/v | ||||||||
| RP18WF254 | −0.700 | −0.174 | −0.654 | −0.190 | −1.083 | −0.449 | −1.207 | −0.305 |
| RP8F254 | −0.821 | 0.060 | −0.767 | 0.065 | −2.113 | 0.153 | −1.414 | 0.104 |
| CNF254 | −0.553 | −0.139 | −0.517 | −0.152 | −1.425 | −0.358 | −0.953 | −0.243 |
| logPavg | −0.691 | −0.084 | −0.646 | −0.092 | −1.540 | −0.218 | −1.191 | −0.148 |
| Average logPavg(d): −1.017 for MA and −0.136 for FA | ||||||||
Disclaimer/Publisher’s Note: The statements, opinions and data contained in all publications are solely those of the individual author(s) and contributor(s) and not of MDPI and/or the editor(s). MDPI and/or the editor(s) disclaim responsibility for any injury to people or property resulting from any ideas, methods, instructions or products referred to in the content. |
© 2023 by the authors. Licensee MDPI, Basel, Switzerland. This article is an open access article distributed under the terms and conditions of the Creative Commons Attribution (CC BY) license (https://creativecommons.org/licenses/by/4.0/).
Share and Cite
MDPI and ACS Style
Klimoszek, D.; Pyka-Pająk, A. Lipophilicity Study of Fumaric and Maleic Acids. Processes 2023, 11, 993. https://doi.org/10.3390/pr11040993
AMA Style
Klimoszek D, Pyka-Pająk A. Lipophilicity Study of Fumaric and Maleic Acids. Processes. 2023; 11(4):993. https://doi.org/10.3390/pr11040993
Chicago/Turabian StyleKlimoszek, Daria, and Alina Pyka-Pająk. 2023. "Lipophilicity Study of Fumaric and Maleic Acids" Processes 11, no. 4: 993. https://doi.org/10.3390/pr11040993
Note that from the first issue of 2016, this journal uses article numbers instead of page numbers. See further details here.