Article

Effect of 450 nm Visible Blue Light from Light-Emitting Diode on Escherichia coli O157:H7 in Agar Gels: Optimizing the Lighting Array and Quantitative Microbial Exposure Assessment

1
Department of Food Science and Biotechnology, College of Agriculture and Life Sciences, Kangwon National University, Chuncheon 24341, Republic of Korea
2
Elderly-Friendly Food Research Center, Agriculture and Life Science Research Institute, Kangwon National University, Chuncheon 24341, Republic of Korea
*
Author to whom correspondence should be addressed.
Processes 2023, 11(5), 1331; https://doi.org/10.3390/pr11051331
Submission received: 27 March 2023 / Revised: 20 April 2023 / Accepted: 24 April 2023 / Published: 26 April 2023

Abstract

:
Visible blue light emitting diodes (LED) have been studied to inactivate Escherichia coli (E. coli) O157:H7 in agar gels. The LED array was optimized to attain uniform light illumination, and the light intensity distribution was visualized through optical simulation. The uniformity of LED light intensity was assessed, and the evenly spaced array showed the best uniformity with a Petri factor of 0.99. Microbial populations in agar gels prepared with and without a dye were analyzed after light irradiation. Each segment of the gels with different heights was taken to measure microbial reduction, and the results indicated that optical properties, such as opaqueness, played an important role in microbial reduction. The agar gel without and with a dye showed a maximum reduction of <3.4 and <2.1 log CFU/g, respectively. An exposure assessment for E. coli O157:H7 was conducted based on the assumption for the agar gel product after LED illumination. The probability results indicated that a risk (>5 log CFU/g) existed mainly in the bottom layer of the sample, despite the average contamination being <5 log CFU/g. This study provides a suitable approach for designing the LED photoinactivation process and subsequent exposure assessment to avoid risk.

1. Introduction

Light-emitting diodes (LEDs) are created by connecting p-type and n-type semiconductors, which generate light rapidly. LEDs offer various benefits, including long lifespan, low energy consumption, high spectral purity, and compact size [1]. They are directional light sources and can concentrate light intensity in a specific zone through appropriate design [2]. In recent times, LED technology has been utilized to disinfect harmful microorganisms in food and water through a non-thermal method [3]. There has been a growing interest in inactivating food pathogens using visible light, known as photodynamic inactivation or photoinactivation. The photoinactivation technique without the addition of photocatalysts or external compounds is a promising method in terms of the prevention of quality change by additives. Some bacteria produce a significant amount of ‘endogenous’ photosensitizers, such as porphyrins, which are naturally found in the cells [4]. The absorption of near monochromatic visible light by the endogenous photosensitizers results in the excitation of molecules in the presence of oxygen. When the molecules relax to the ground state, the energy is transferred to the oxygen molecule, generating reactive oxygen species (ROS). These ROS damage the cell’s organelles and chromosomal genetic materials, such as DNA, nucleic acids, lipids, and proteins, through oxidation, ultimately leading to bacterial death [5,6,7,8]. Blue light with a wavelength between 400 to 450 nm has been shown to be the most effective in exciting endogenous photosensitizers in food pathogens [9]. The significant inhibition or inactivation effect of visible blue light LEDs has been shown in various studies. For example, blue light has been shown to inhibit the growth of Salmonella enterica in orange juice [10], Escherichia coli (E. coli), and Staphylococcus aureus on the surface of fresh-cut pineapples [11], as well as Salmonella typhimurium on the surface of sliced beef [12].
The control of bacterial contamination during processing and storage plays a crucial role in determining the quality and shelf life of food products. The main sources of spoilage are bacteria present in raw materials and at contact points, such as process equipment or handlers during processing [13]. In recent years, the use of visible blue light in food production has been introduced as a cost-effective and safe method for inactivating microorganisms. However, light irradiation inactivation may be hindered by the shadow effect, which can obstruct the absorption of light. This type of inactivation is most effective for bacteria in clear liquid foods, such as fruit juices without solids, and on the surfaces of food materials, as they are highly opaque. Bacteria present on food surfaces can penetrate cracks, crevices, and intercellular spaces of food during processing and storage [14]. As a result, total inactivation of the final product must be thoroughly evaluated due to the variations in microbial populations between the surface and interior of food after irradiation. Additionally, spatial heterogeneity in irradiance from LED arrays is another important factor that can lead to non-uniform irradiance patterns and light intensity.
Agar is the first marine hydrocolloid employed in food and biotechnological applications due to its ideal physical and chemical properties. Approximately 90% of agar produced is used in the food industry, where it has a wide range of food applications globally, including in jams, jellies, dairy products, beverages, and baked goods [15,16,17]. Confectionery jellies made using agar are popular because it provides a brittle texture that is appealing to bite at a concentration range between 1 to 2%. Agar offers a strong gelling ability without the addition of sugar; thus, it has the potential to be used as a low-calorie or sugar-free ingredient. Various formulations of agar jellies have been developed, such as red beans [18] and fruit/fruit juice [19,20]. Despite the wide utilization of agar in jelly formulations, the process management for agar jellies has rarely been investigated. Confectionery jellies such as agar jellies have optimum conditions for microbial growth due to their high moisture content. Therefore, there is a need for a systematic and quantitative approach to estimate the risk. Risk assessment is an analysis framework used to manage food safety based on scientific knowledge. Among two general approaches of risk assessment, i.e., qualitative and quantitative, quantitative microbial risk assessment (QMRA) characterizes the nature and probability that an estimated risk correctly reflects the uncertainty and variability based on data [21]. Meanwhile, quantitative microbial exposure assessment can be used to estimate the possible human exposure to E. coli strains in confectionary jellies such as agar gels.
Light source design is crucial, as LED products exhibit various radiation patterns and geometries. Earlier studies that employed light sources typically utilized a single high-power LED placed at the center above the sample, leading to conclusions about surface contamination for the entire sample [22,23]. To address this shortcoming, this study investigates the heterogeneous distribution of light intensity and sample depth, considering not only the surface but also internal contamination. The primary objective is to assess the uniformity of irradiation in an agar gel model system using various LED array configurations through a combination of experiments and optical simulations. The impact of the solid model system’s optical properties, such as opaqueness or optical density, on the inactivation of the pathogenic E. coli O157:H7 through LED light exposure is also evaluated. The secondary objective is to conduct exposure assessment and estimate the potential exposure of agar gels after LED inactivation based on the microbial population at different portions of the agar gel with varying light absorption. This is necessary because relying on the average or surface microbial population for determining the shelf life is unsafe given the infectious dose of E. coli strains (106–1010 organisms) [24].

2. Materials and Methods

This study was designed to optimize the food pathogen inactivation system using LED light sources and to evaluate microbial safety in a model confectionery gel treated with the LED system. The safety of the product after treatment with LED was calculated based on the probability of safety during consumption.

2.1. Preparation of Inoculum

Escherichia coli O157:H7 (E. coli O157:H7) (ATCC 25922) was purchased from the Korean Collection for Type Cultures (Seoul, Republic of Korea). The pure culture was cultivated on tryptic soy agar (TSA) (Difco; Becton-Dickinson, Detroit, MI, USA) at 37 °C for 24 h, and a single colony was loop inoculated into 10 mL tryptic soy broth (TSB) (Difco), after which the bacteria suspension was incubated at 37 °C for 24 h. The culture was then collected by centrifugation at 5500× g for 10 min at 4 °C and washed twice with sterile 0.1% (w/v) peptone water (Difco). Following that, the supernatant was discarded after washing, and the remaining pellets were resuspended in 2% agar solution for further sample preparation.

2.2. Sample Preparation

Agar gel was prepared using a food-grade agar powder product (Samyang Inc., Sungnam, Republic of Korea) obtained from a local market in South Korea. Agar powder was dispersed in deionized water (2% w/v), and the solution was autoclaved at 121 °C for 15 min to melt and sterilize the sample. Next, the agar solution was cooled down to 45 °C, and the prepared bacteria pellets were added to achieve an initial concentration of approximately 106 CFU/g. The agar sample was prepared with and without a dye to investigate the effect of light absorbance on photoinactivation and imitate food gels containing ingredients or colorants. For the sample with a dye, 0.05% Sunset Yellow FCF (Sigma-Aldrich, St. Louis, MO, USA) was added into the agar solution with the bacteria strains. The Sunset Yellow FCF was selected as the colorant for the model sample due to its widespread utilization in food products. This aligns with prior studies in the field of food science, which have employed Sunset Yellow FCF as a model system [25]. The maximum absorbance of Sunset Yellow FCF at blue light (480 nm) further strengthens its suitability as the model colorant in this study. After stirring the sample thoroughly at 45 °C for 15 min, the agar solution was poured into plastic petri dishes to form solid gels with a diameter of 85 mm and a height of 9 mm.

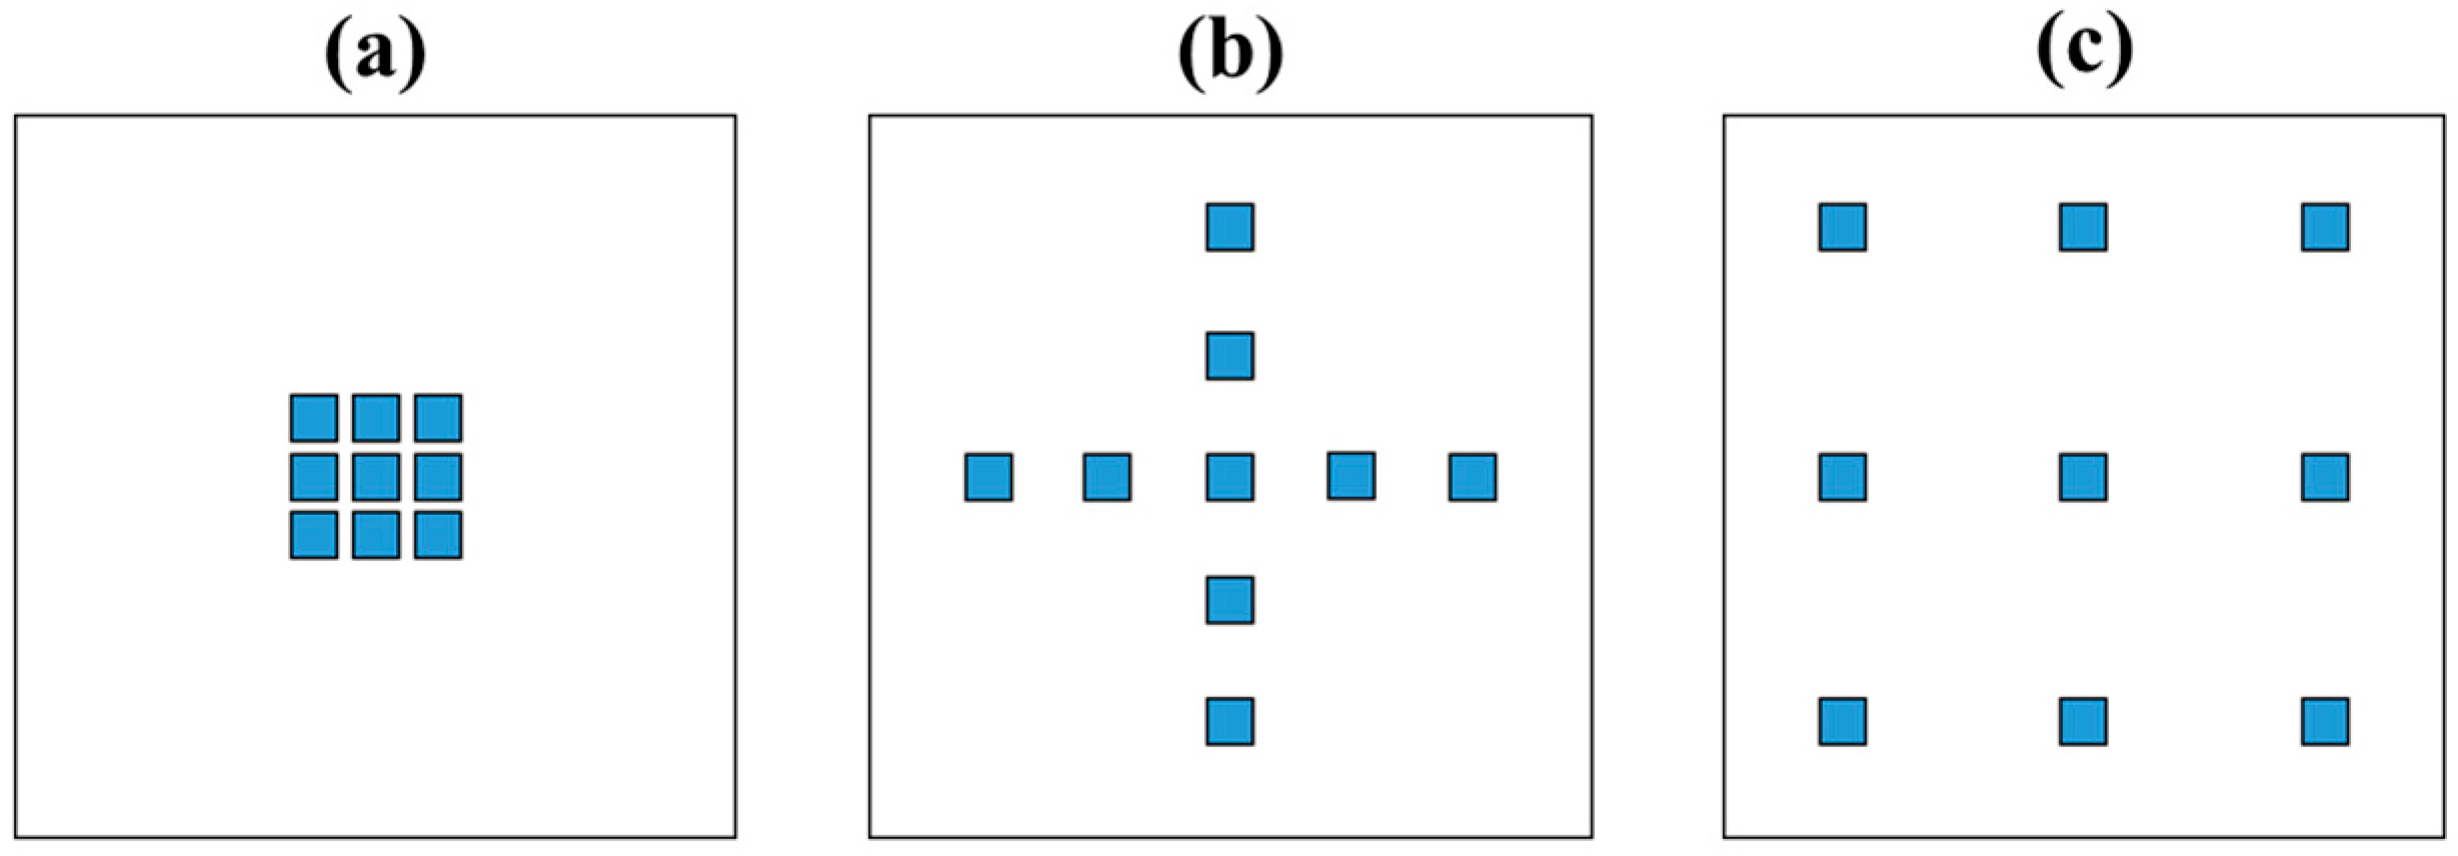
2.3. Design of LED Arrays

A single-chip surface-mount LED that emits blue light at a wavelength of 450 nm (LD CQAR; Osram, München, Germany) was attached to the LED device used in this study. Nine LEDs were fixed on an electric circuit board and connected to a DC power supply (TPE-3010DI; ODA Technologies, Incheon, Republic of Korea) to achieve a constant electric current of 1.5 A. The various arrays of LEDs were compared to design a suitable irradiation pattern, as depicted in Figure 1. The LED apparatus was assembled as shown in Figure 2 to ensure that the LED device was positioned over the agar gel at a constant height of 40 mm. The chamber of the apparatus around the sample prevents light from the environment outside. Irradiation uniformity was obtained using a light intensity sensor, a photoresistor with a 5 mm diameter, located at the same height as the sample surface by sliding the sensor every 5 mm. Irradiance was converted from resistance measured by the sensor pin on the Arduino board to lux (lm/m2) units. The irradiance was calculated using the following photometric conversion formula [22,26]:
P = L K m × V λ
where P is the irradiance (W/cm2), L is the luminance (lux), Km is the maximum value of spectral luminous efficacy (683 lm/W), and V(λ) is the photopic spectral function at a wavelength of 450 nm (0.034).
The energy per unit area (fluence or dose) applied in each experiment was calculated as follows:
E = P × t
where E is the dose (J/cm2) and t is the illumination duration (s).
To quantify the uniformity of light irradiation on the sample, a Petri factor was calculated as the ratio of the average irradiance over the area of the sample to the irradiance at the center of the sample [27].

2.4. Bacterial Enumeration

The LED apparatus with bacteria inoculated agar gel was placed in a thermostatic incubator to maintain a constant sample temperature of 25 °C. Agar samples with and without the dye were kept under light irradiation for 1, 2, 4, 6, 9, 12, and 18 h. After irradiation, the agar gels were separated from a petri dish. The gel was then horizontally sliced into 3 mm height segments using a fishing line with a thickness of 0.37 mm, and these segments corresponded to heights 0 to 3, 3 to 6, and 6 to 9 mm. Each segment was transferred into a stomacher sample bag with 0.1% sterile peptone water to achieve 1:10 dilution. Next, the sample in the bag was homogenized for 3 min in a Stomacher (BagMixer 400, Interscience, Paris, France). The suspension was then 10-fold serially diluted with sterile 0.1% peptone water. Aliquots of 0.1 mL diluent were spread on TSA. After incubation at 37 °C for 24 h, colonies were enumerated manually. The counts were calculated per gram of gel (log CFU/g).

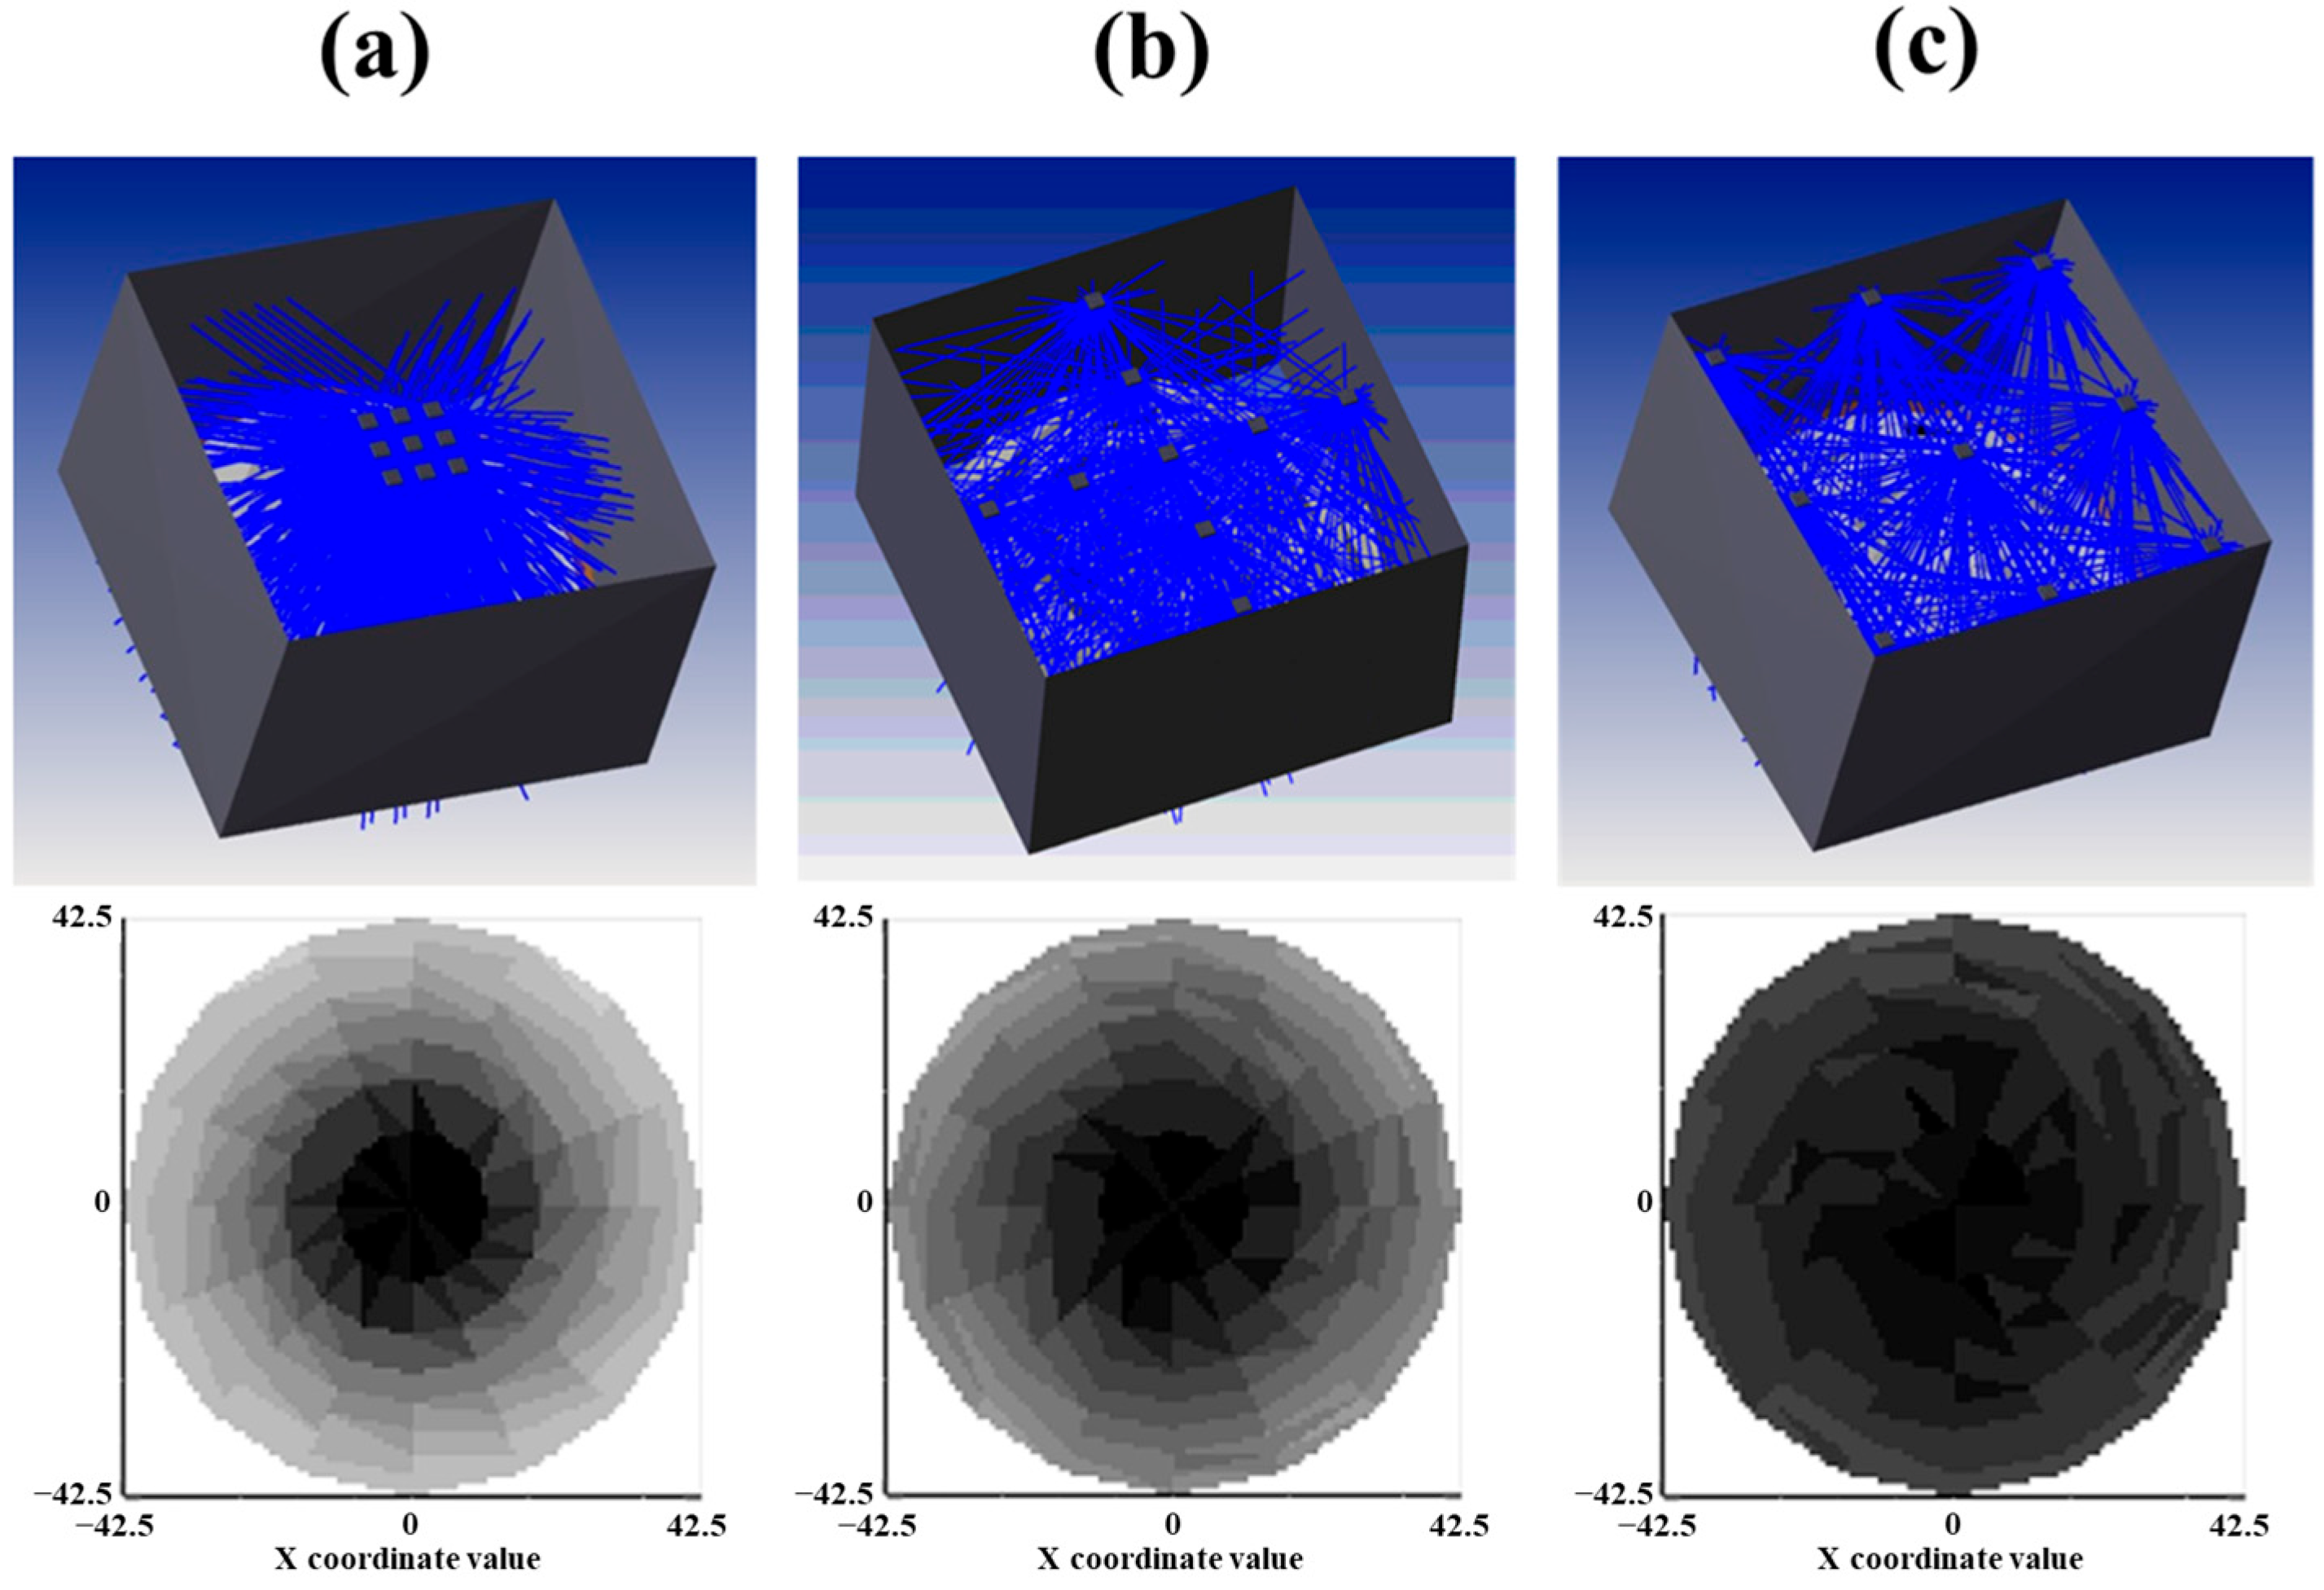
2.5. Optical Simulation for Ray Tracing

Zemax OpticStudio 16.5 (Zemax LLC, Kirkland, WA, USA) software was used to determine the optimal LED arrays for predicting the Petri factor and the irradiance power. The simulation was run in non-sequential mode, which allows for an optic simulation using the imported LED source files provided by the manufacturer (Osram, München, Germany). The basic concept of ray tracing was that the LED’s rays strike the sample surface, and the rays may be refracted. The basic principle for refraction is Snell’s Law (Equation (3)). Snell’s law of refraction states the differing light velocities between two media.
n 1 sin θ 1 = n 2 sin θ 2
where n1 and n2 are the indexes of refraction of first and second mediums, and θ1 and θ2 are the angle of incidence and refraction (Figure 2b).
The geometry was constructed to offer the same conditions as the illuminated experimental setup for agar gel in Figure 1. The total irradiation intensity in the simulation was detected using a circular detector placed with the same position as the agar gel. The random ray tracing was performed based on Monte Carlo analysis.

2.6. Exposure Assessment

The exposure assessment for E. coli O157:H7 in agar gel from production facility-to-table is depicted in Figure 3. The high possibility of E. coli O157:H7 contamination during handling is the main hazard that should be considered due to potential growth during storage or transportation. The pathway of the agar gel product starts from the final packaging after LED inactivation, which is followed by transport and display for sale and then consumption. The distributions of time and temperature at each pathway step are summarized in Table 1.
It is assumed that agar gel products are transported from the manufacturing facility to retailers after LED irradiation in storage for 18 h while the gel structure is kept stabilized. The storage temperature at the manufacturing facility was 25 °C based on an assumption of the worst case. The Pert distributions of temperature and time during transportation that were used were based on the study of Park and Yoon [28]. For storage time and temperature in retail stores, normal distributions were used for the temperature of refrigeration and the selling period, which is less than 24 h, since retailers freshly serve and sell products to avoid spoilage. The parameters used for retail storage were based on the study of Mataragas et al. [29] and an expert’s opinion. After retail storage, consumers transport the products from shops to home, for which Pert distributions were used based on the studies of Ding et al. [30], Park and Bahk [31], and Jung [32]. The exposure at home was implemented using a uniform distribution based on the storage temperature data of a home refrigerator reported by Kennedy et al. [33]. The storage time at a home refrigerator was determined by the retailers’ recommended storage period (up to 3 weeks).

2.7. Growth Model

The opportunity for bacterial growth during the product pathway was calculated using published bacterial growth models and data. A primary and secondary model was used to describe the specific growth rate of E. coli O157:H7. The growth data of the study of Oh et al. [34] were fitted using the modified Gompertz model, which is a primary model that is widely used in predictive microbiology of E. coli strains [35,36]. The formulations of the modified Gompertz model equations are as follows [37]:
N t = N 0 + N m a x N 0 exp exp B t M
where Nt is the microbial counts (log CFU/g) at time t; N0 is the initial microbial counts (log CFU/g); Nmax is the maximum microbial counts (log CFU/g); B is maximum relative growth rate at t = M (h−1); M is time at which the absolute growth rate is maximum (h).
The specific growth rate (μmax) and lag time (λ) for the modified Gompertz model were calculated from:
μ m a x = N m a x N 0 e × B
λ = M 1 B
In this study, secondary models described the specific growth rate and lag time reflecting the influence of temperature in the growth of E. coli O157:H7 in agar gels. The modified Ratkowsky model and a hyperbolic function for calculating the specific growth rate and lag times, respectively, were used according to the following equation [38]:
μ m a x = b T T m i n 1 exp c T T m a x
λ = exp p T q
where T is the temperature; Tmin and Tmax are the theoretical minimum and maximum temperatures beyond which growth is impossible; a and b are regression coefficients; p is the parameter to account for the decrease in lag time as temperature increases; q is the temperature at which lag time is infinite.
The primary and secondary models were fitted using the Curve Fitting toolbox of Matlab (R2022b, Mathworks, Natick, MA, USA), which was employed with the nonlinear least squares curve fitting method and the trust-region algorithm.

2.8. Monte Carlo Simulation for Exposure Assessment

A Monte Carlo simulation was carried out using commercial software, @RISK (v8.2, Palisade, Newfield, NY, USA), to estimate the final contamination level based on probability distributions. A simulation model, Latin Hypercube sampling, was conducted with 100,000 iterations and a random number generator seed of one (Palisade Corporation, 2002). The exposure standard for microbial population considered as hazardous was >5 log CFU/g according to the reported data on outbreaks by E. coli strains based on the weight of agar gel and the research by Saxena et al. [24]. Although E. coli O157:H7 has a relatively low infectious dose (102–106 organisms) compared to other strains, this study considers the outbreak microbial population for common E. coli strains, where the simulation was carried out based on the worst cases for E. coli O157:H7.

2.9. Statistical Analysis

An evaluation of the differences between the results was performed through statistical analysis. The significance of the results was determined using an analysis of variance (ANOVA) at p < 0.05, followed by Tukey’s multiple comparison test. The analysis was executed using IBM SPSS Statistics 21 software (IBM Corp., New York, NY, USA).

3. Results and Discussion

3.1. Influence of the LED Arrangement on the Solid Model Systems

The illumination of the arrangement of nine LEDs was investigated to obtain the most suitable light distribution over the sample area. The simulated irradiance power of each array was used to calculate the Petri factor. The traced light rays and their intensity distribution are shown in Figure 4. The centered array (Figure 4a) showed an irregular light distribution, whereas the evenly spaced array (Figure 4c) showed a regular and uniform light distribution. The simulated and measured Petri factor are presented in Table 2. The Petri factors for each array were 0.67, 0.84, and 0.99, respectively. The results show that there is a significant difference between the Petri factors (p < 0.05), which suggests that the type of array has an impact on the measurement.
The illuminance data showed slight differences between the simulated results and the measured results, while the calculated Petri factors have the same tendency in both sets of results. The peak intensity of the simulated results were 1210 lux (5.2 mW/cm2), 1038 lux (4.5 mW/cm2), and 982 lux (4.2 mW/cm2) for centered, cross, and evenly spaced array, respectively, which were nearly the same as the experimental data. The peak illuminance was the strongest for the centered array; however, the nonuniform irradiation may result in insufficient inactivation at the edge of the sample if irradiation time is determined as being center-based. On the other hand, the center part may be over-irradiated if irradiation time is determined as edge-based, which induces a bleaching effect in the color of food materials. The Petri factor for the optimal array is a value higher than 0.9 [27,39]. The optic simulation has been used to visualize the irradiation pattern of LED [40,41], and the simulation in this study also explained the LED light distribution well by visualizing the irradiance. Therefore, the optimal Petri factor in this study was shown in the evenly spaced array at 40 mm height from the samples; thus, it was selected for the inactivation study of food pathogens. The heterogeneity in light distribution from the LED arrangement can be mitigated by increasing the distance between the light source and the sample [42]. However, this also results in a decrease in light intensity, which reduces the inactivation effect. In the study of Bowker et al. [39], the cost-effectiveness of optimizing the LED array design and the distance of the sample from the light source were introduced.

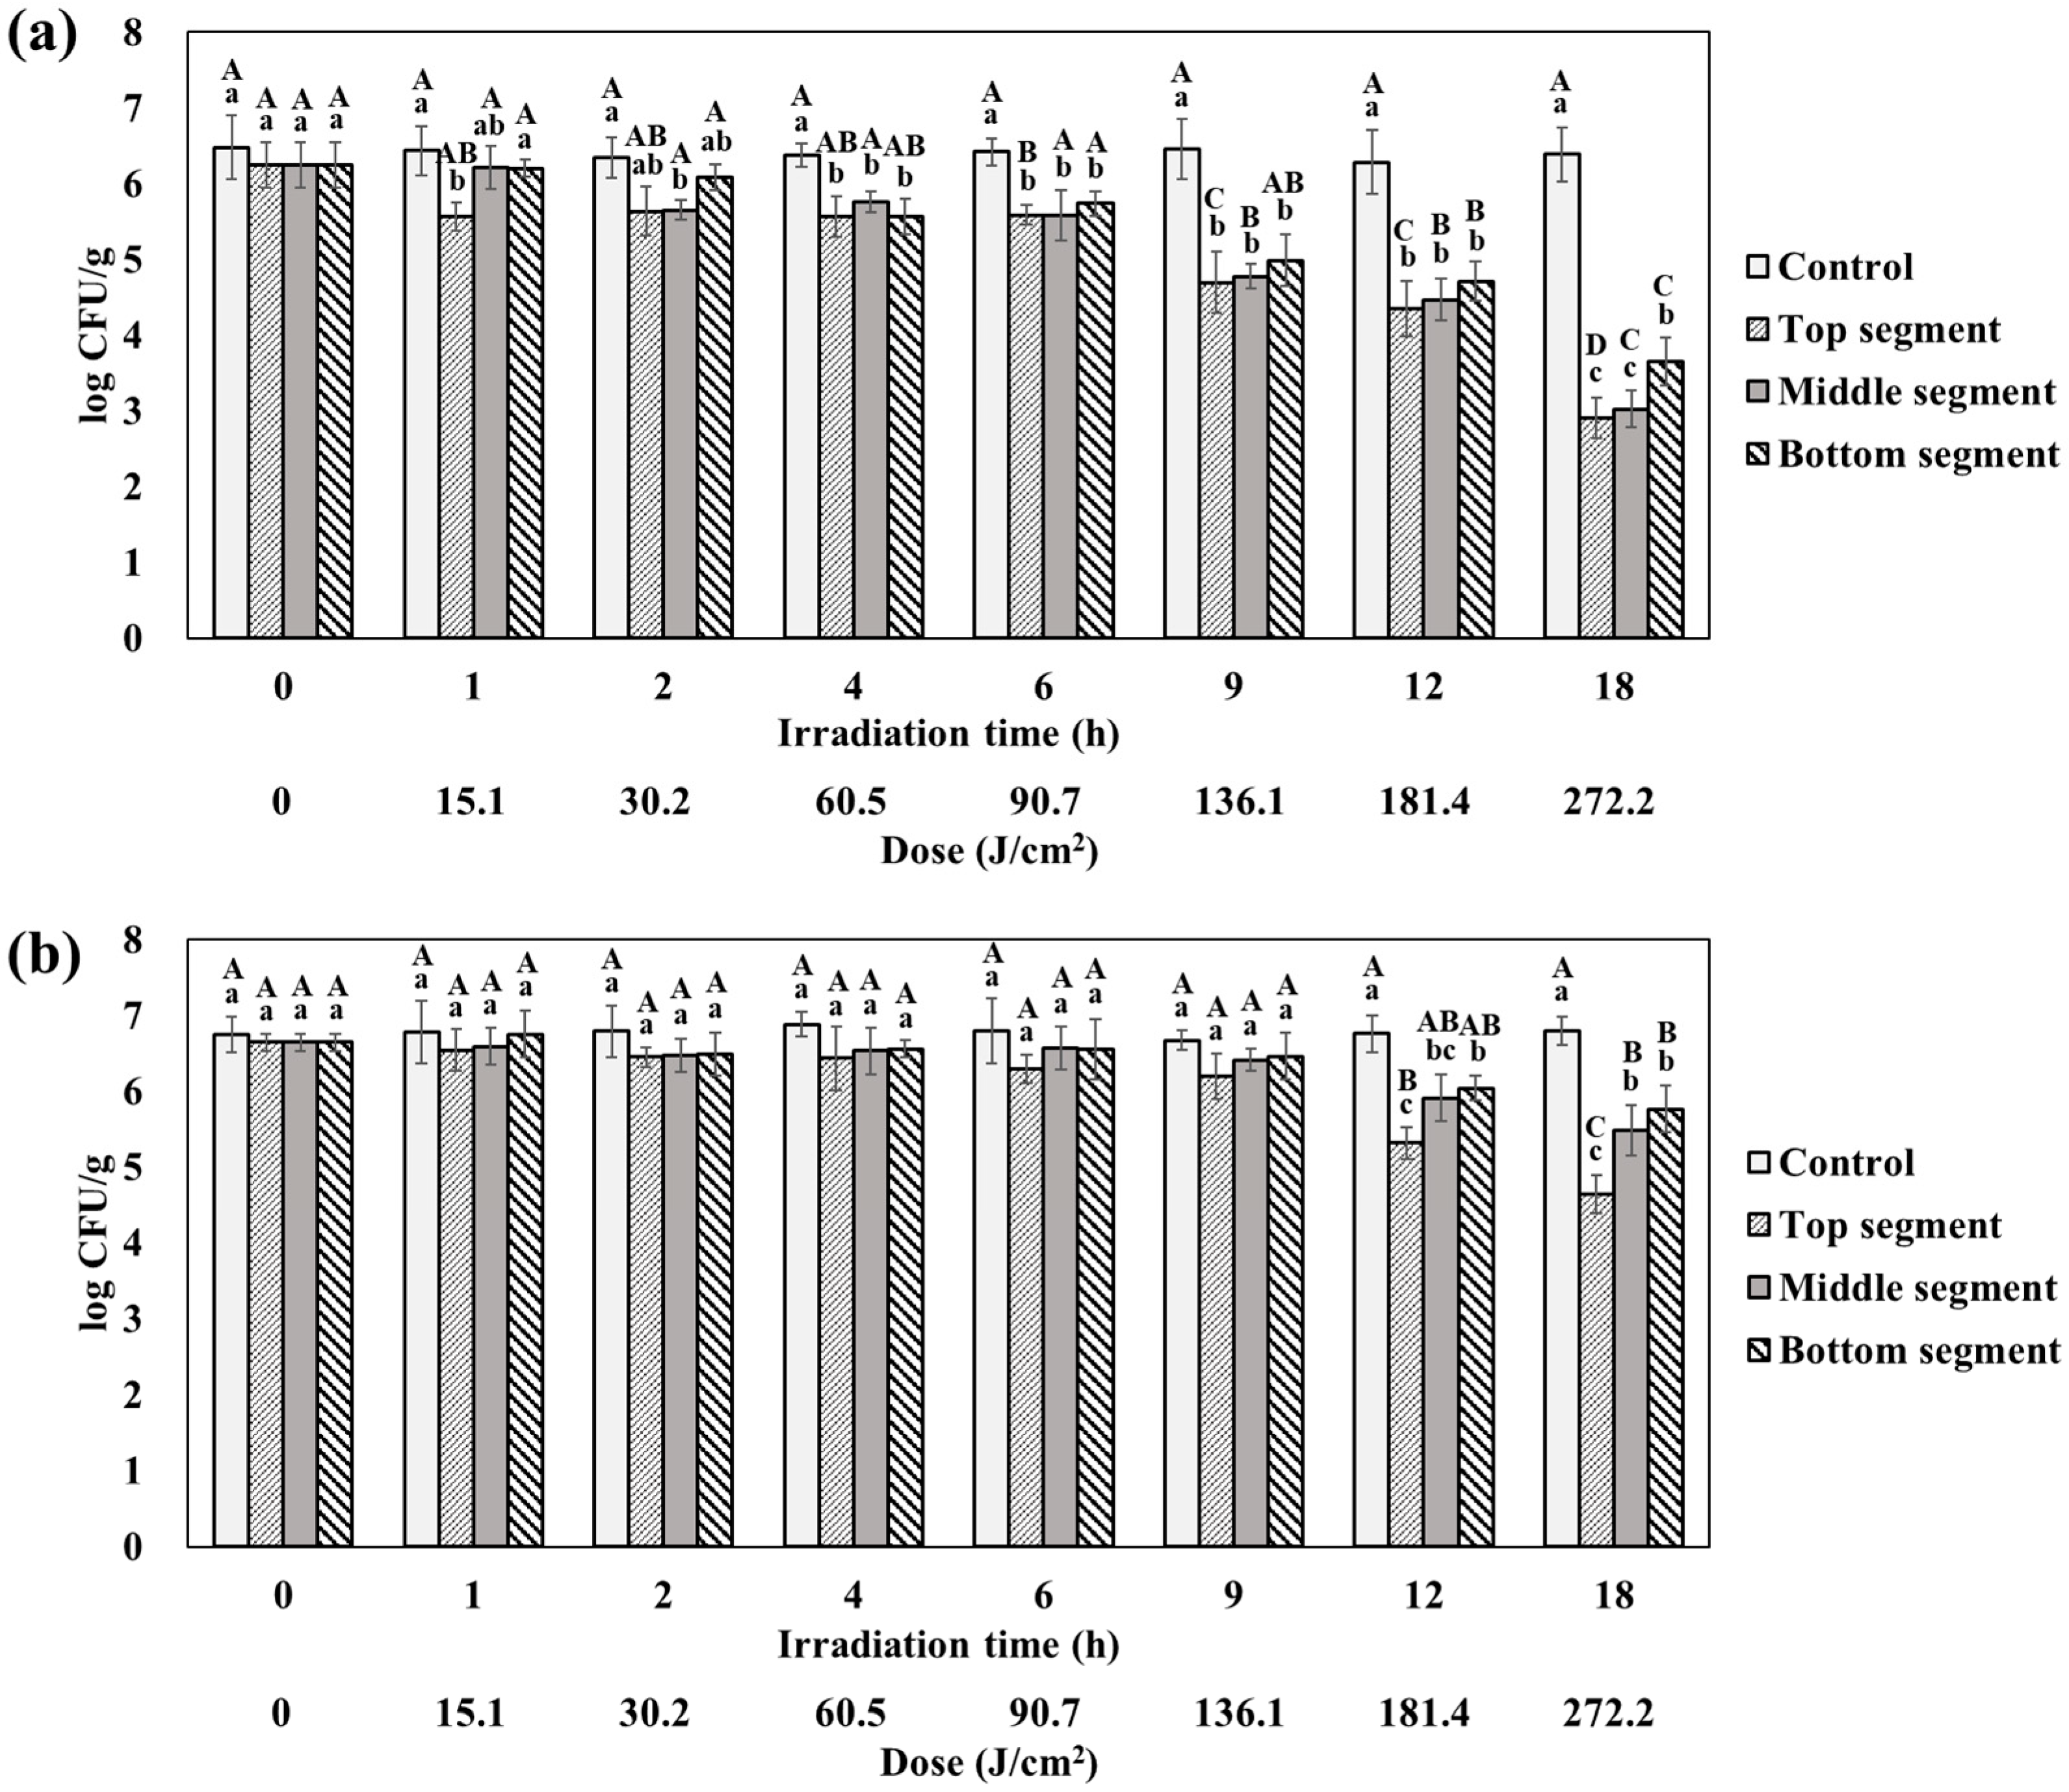
3.2. Photoinactivation Effect of Blue Light Treatment on E. coli O157:H7

The microbial reduction of E. coli O157:H7 by the irradiation of blue light on agar gels with and without a dye is shown in Figure 5. The reduction upon increasing irradiation dose indicated that light from LED lead to bacterial deaths. The average reduction of E. coli O157:H7 was approximately 3.1 log CFU/g and 1.3 log CFU/g for the agar gel without and with dye, respectively, after LED treatment at a dose of 272.2 J/cm2. E. coli O157:H7 has been found to be highly susceptible to photoinactivation by visible blue light without needing external photosensitizers or photocatalysts. E. coli O157:H7 showed a much higher reduction than other gram-negative microbial strains, such as Pseudomonas aeruginosa and Salmonella Typhimurium, when compared to the same medium [43]. However, in the study of Ghate et al. [10], S. Typhimurium showed a faster microbial reduction (4.8 log reduction after 13.6 h at 20 °C) than E. coli O157:H7 in this study. This difference was mainly due to the light dose used in the study. The mechanism behind the reduction of E. coli O157:H7 is due to the reactive oxygen species (ROS) generated by the absorption of light by endogenous porphyrins. In a study by Kim and Kang [4], blue light irradiation using a dose of 70 J/cm2 caused a reduction of 6-7 logs in E. coli O157:H7 in phosphate-buffered saline (PBS). E. coli O157:H7 was found to be damaged by photophysical effects and produced membrane pores at wavelengths of 395–405 nm, whereas ROS was the main cause of cell membrane damage at wavelengths of 415–425 nm. The formation of ROS can cause a mutation in succinate-coenzyme Q reductase (SQR), which inhibits energy production via the TCA cycle and the electron transfer chain. They revealed that blue light at higher wavelengths (415–425 nm) caused cell membrane damage of E. coli O157:H7 by TEM image and reduced SQR activity. Similarly, blue light irradiation at a wavelength of 461 nm for 7.5 h (596.7 J/cm2) resulted in a 6-log reduction in E. coli O157:H7 in tryptic soy broth (TSB) at 10 and 15 °C [44]. However, no reduction was observed at 20 °C. Another study by Kumar et al. [43] demonstrated that blue light exposure at a wavelength of 460 nm for 6–9 h (4080 J/cm2) led to a reduction of approximately 4 logs in E. coli O157:H7 in PBS at 4–25 °C. They analyzed metabolites of E. coli O157:H7 and revealed that the change in metabolites related to steroid metabolism and CoA biosynthesis demonstrated that the generation of superoxide and other ROS also implicated in photoinactivation, in addition to the mechanism involving porphyrins. A study by Hyun et al. [45] showed the E. coli O157:H7 reduction of 5.41 and 2.27 log CFU/mL in PBS and tryptic soy broth (TSB), respectively, when exposed to blue light with a wavelength of 460/470 nm at a dose of 287 J/cm2 and a temperature of 4 °C, whereas 25 °C showed no reduction. Their results showed that irradiation caused membrane damage through membrane depolarization. Intracellular ROS production adversely affects lipids in the membrane and decreases DNA integrity levels. Therefore, the reduction of E. coli O157:H7 cells can be mainly attributed to sublethal damage caused by membrane disintegration, rather than primarily by the state transition to viable but non-culturable (VBNC) cells induced by photoinactivation from LED illumination. On the other hand, the difference in reduction compared to other studies may be due to the fact that the effect of blue light irradiation on microbial reduction is highly dependent on the nutrient components of mediums, pH, and acidity. These factors can act as photosensitizers or cell damage protectors, resulting in either a synergistic or adverse effect. Overall, the light dose used in the present study is within a reasonable range to reduce the E. coli O157:H7 population in agar gels, which is a solid medium without any nutrients.

3.3. Height-Dependence of Blue Light Treatment on a Solid Model System

The reduction of E. coli O157:H7 at each segment of the slices having a different height (top, middle, and bottom slice) indicated that light from LED penetrated the sample during illumination, and the light intensity is dependent on the sample height and optical properties (Figure 5). The reduction values after 18 h (272.2 J/cm2) of light irradiation of the average population were 3.34 ± 0.27, 3.22 ± 0.24, and 2.59 ± 0.31 log CFU/g for the agar gel without a dye for the top, middle, and bottom segments, respectively. The top and middle segments showed significantly higher reduction compared to the bottom segment (p < 0.05). For the agar gel with 0.05% Sunset Yellow FCF, the reduction values of the average population were 2.00 ± 0.25, 1.16 ± 0.33, and 0.88 ± 0.31 log CFU/g for the top, middle, and bottom segments, respectively. In contrast to the sample without a dye, the reduction of the top segment showed a significant difference compared to the middle and bottom segments (p < 0.05). The height dependence of E. coli O157:H7 reduction remained clear with increasing irradiation time. It could be noted that the reduction was much lower than that of the agar gel without a dye. Moreover, the difference between the top and middle segments became larger compared to that of the gel without a dye. In the study by Bialka et al. [46], the effect of pulsed UV-light penetration on agar and denatured whey protein isolate to inactivate E. coli K12 was similar to the results of our study. However, their study concluded that the height dependence primarily results from different penetrability values by a broad range of wavelengths (100 to 1100 nm). For LED systems, wavelengths are relatively homogeneous (444 to 457 nm for LD CQAR model); it is therefore advantageous to only discuss the penetration depth of the sample. Photoinactivation with LEDs typically targets a surface decontamination phenomenon [38]. However, most of the food structures are porous and penetrable for bacteria under the surface. The visible blue LED light can be optimally used by analyzing the light absorption properties of food materials depending on heights.

3.4. Exposure Assessment of Agar Gels after LED Inactivation

The risk of E. coli O157:H7 in agar gels after LED irradiation was determined through microbial exposure assessment. The aim of the blue light illumination treatment is to deactivate foodborne pathogens. However, it should not be considered a sterilization method, which can result in the potential for the regrowth of bacterial cells once the illumination is discontinued. Thus, an exposure assessment was performed to determine the probability of microbial growth following LED inactivation.
The microbial contamination levels for the agar gels after being released from the storage of the manufacturing facility to consumers’ storage were simulated using probability distribution models constructed as presented in Table 1. The initial condition and growth model parameters to simulate the final contamination levels are summarized in Table 3 and Table 4. The initial level of E. coli O157:H7 was set to the final microbial population in each segment of agar gels after 18 h of LED irradiation.
The final contamination levels estimated by Monte Carlo simulation are shown in Figure 6. The median values of the final contamination levels in agar gels without a dye were 4.3, 4.3, and 4.9 log CFU/g for the top, middle, and bottom segments, respectively. However, the maximum levels were 4.9, 4.9, and 5.5 log CFU/g for the top, middle, and bottom segments, respectively, indicating that the probability of an outbreak exists for the agar gel even though the average of the gel is <4 log CFU/g, particularly for the bottom segment. To avoid the possibility of outbreak, it is necessary to have a decreasing temperature during storage of the products at the manufacturing facility and/or a decreasing storage time at the consumers’ place after purchasing the product. For the agar gel with a dye, the median values of the final contamination level were 5.7, 6.4, and 6.6 log CFU/g, which are above the infectious dose. Moreover, the maximum levels were 6.3, 7.1, and 7.3 log CFU/g for those gels, thus exhibiting highly hazardous contamination levels, particularly for the bottom segment. The same light irradiating condition resulted in substantial differences in the light absorption of the gel. This result suggests that the optical properties of the food materials must be considered when they are subjected to the photoinactivation process. Several studies also reported a decrease in the efficacy of LED illumination on food due to a shadowing effect created by opaqueness [3,47,48]. To avoid potential risk when designing a process such as photoinactivation by LED, exposure analysis is highly necessary [28].

4. Conclusions

Visible blue light LED was used for the photoinactivation of E. coli O157:H7 in agar gels. Achieving uniformity of the light source is the first step in designing an LED photoinactivation process. Because ununiform irradiation causes a variation in the level of inactivation in the sample, we observed quality deterioration for the highly irradiated part and temperature gradient on the sample. Optical simulation, along with the Petri factor, were advantageous tools to visualize and optimize the light intensity distribution of the targeted area under the LED source in this study. The optical properties of agar gels were crucial factors affecting light absorption, which is closely related to the degree of microbial reduction or inactivation. The shadowing effect of agar gels with a dye decreased light penetration on the gels, and it also remarkably decreased the photoinactivation efficacy at the bottom layer. Although the microbial population of agar gel is much lower than the infectious dose after LED photoinactivation, there is a possibility of microbial exposure in the product pathway. In particular, in food materials having inhomogeneous microbial population at different segments or layers, such as agar gel after LED inactivation, there is a high risk of infection or toxin generation. The product pathway scenario presented in this study demonstrates the promising application of visible blue light as a substitute for fluorescent light during food storage to control microbial growth effectively. Therefore, the present study suggests a suitable approach to design a process that includes LED photoinactivation in food materials, including confectionery gels.

Author Contributions

Conceptualization, H.J. and W.B.Y.; methodology, H.J. and W.B.Y.; software, H.J.; investigation, H.J.; writing—original draft preparation, H.J. and W.B.Y.; writing—review and editing, H.J. and W.B.Y.; supervision, W.B.Y. All authors have read and agreed to the published version of the manuscript.

Funding

This research was supported by the Basic Science Research Program through the National Research Foundation of Korea (NRF) funded by the Ministry of Education [grant number NRF-2018R1D1A3B06042501]. This study was supported by the research grant of Kangwon National University in 2023.

Institutional Review Board Statement

Not applicable.

Informed Consent Statement

Not applicable.

Data Availability Statement

The data presented in this study are available on request from the corresponding author.

Conflicts of Interest

The authors declare no conflict of interest.

References

  1. O’Toole, M.; Diamond, D. Absorbance based light emitting diode optical sensors and sensing devices. Sensors 2008, 8, 2453–2479. [Google Scholar] [CrossRef] [PubMed]
  2. Shen, S.C.; Huang, H.J.; Chao, C.C.; Huang, M.C. Design and analysis of a high-intensity LED lighting module for underwater illumination. Appl. Ocean Res. 2013, 39, 89–96. [Google Scholar] [CrossRef]
  3. Prasad, A.; Du, L.; Zubair, M.; Subedi, S.; Ullah, A.; Roopesh, M.S. Applications of Light-Emitting Diodes (LEDs) in food processing and water treatment. Food Eng. Rev. 2020, 12, 268–289. [Google Scholar] [CrossRef]
  4. Kim, D.K.; Kang, D.H. Efficacy of light-emitting diodes emitting 395, 405, 415, and 425 nm blue light for bacterial inactivation and the microbicidal mechanism. Food Res. Int. 2021, 141, 110105. [Google Scholar] [CrossRef]
  5. Soukos, N.S.; Ximenez-Fyvie, L.A.; Hamblin, M.R.; Socransky, S.S.; Hasan, T. Targeted antimicrobial photochemotherapy. Antimicrob. Agents Chemother. 1998, 42, 2595–2601. [Google Scholar] [CrossRef]
  6. Endarko, E.; Maclean, M.; Timoshkin, I.V.; MacGregor, S.J.; Anderson, J.G. High-intensity 405 nm light inactivation of Listeria monocytogenes. Photochem. Photobiol. 2012, 88, 1280–1286. [Google Scholar] [CrossRef]
  7. Ganz, R.A.; Viveiros, J.; Ahmad, A.; Ahmadi, A.; Khalil, A.; Tolkoff, M.J.; Nishioka, N.S.; Hamblin, M.R. Helicobacter pylori in patients can be killed by visible light. Lasers Surg. Med. 2005, 36, 260–265. [Google Scholar] [CrossRef]
  8. Luksienė, Z.; Zukauskas, A. Prospects of photosensitization in control of pathogenic and harmful micro-organisms. J. Appl. Microbiol. 2009, 107, 1415–1424. [Google Scholar] [CrossRef]
  9. D’Souza, C.; Yuk, H.; Khoo, G.H.; Zhou, W. Application of light-emitting diodes in food production, postharvest preservation, and microbiological food safety. Compr. Rev. Food Sci. Food Saf. 2015, 14, 719–740. [Google Scholar] [CrossRef]
  10. Ghate, V.; Kumar, A.; Zhou, W.; Yuk, H. Irradiance and temperature influence the bactericidal effect of 460-nanometer light-emitting diodes on Salmonella in orange juice. J. Food Prot. 2016, 79, 553–560. [Google Scholar] [CrossRef]
  11. Bhavya, M.L.; Shewale, S.R.; Rajoriya, D.; Hebbar, H.U. Impact of blue LED illumination and natural photosensitizer on bacterial pathogens, enzyme activity and quality attributes of fresh-cut pineapple slices. Food Bioprocess Tech. 2021, 14, 362–372. [Google Scholar] [CrossRef]
  12. Guo, D.; Bai, Y.; Fei, S.; Yang, Y.; Li, J.; Yang, B.; Lü, X.; Xia, X.; Shi, C. Effects of 405 ± 5-nm LED Illumination on Environmental Stress Tolerance of Salmonella Typhimurium in Sliced Beef. Foods 2022, 11, 136. [Google Scholar] [CrossRef]
  13. Panisello, P.J.; Rooney, R.; Quantick, P.C.; Stanwell-Smith, R. Application of foodborne disease outbreak data in the development and maintenance of HACCP systems. Int. J. Food Microbiol. 2000, 59, 221–234. [Google Scholar] [CrossRef]
  14. Trinetta, V.; Vaidya, N.; Linton, R.; Morgan, M. A comparative study on the effectiveness of chlorine dioxide gas, ozone gas and e-beam irradiation treatments for inactivation of pathogens inoculated onto tomato, cantaloupe and lettuce seeds. Int. J. Food Microbiol. 2011, 146, 203–206. [Google Scholar] [CrossRef]
  15. Hernandez-Carmona, G.; Freile-Pelegrín, Y.; Hernández-Garibay, E. Conventional and alternative technologies for the extraction of algal polysaccharides. In Functional Ingredients from Algae for Foods and Nutraceuticals, 1st ed.; Dominguez, H., Ed.; Elsevier: Amsterdam, The Netherlands, 2013; pp. 475–516. [Google Scholar] [CrossRef]
  16. Xiao, Q.; Weng, H.; Ni, H.; Hong, Q.; Lin, K.; Xiao, A. Physicochemical and gel properties of agar extracted by enzyme and enzyme-assisted methods. Food Hydrocoll. 2019, 87, 530–540. [Google Scholar] [CrossRef]
  17. Padmesh, S.; Singh, A. Agars: Properties and Applications. In Polysaccharides: Properties and Applications; Inamuddin, I., Ahamed, M.I., Boddula, R., Altalhi, T.A., Eds.; Wiley: Hoboken, NJ, USA, 2021; pp. 75–93. [Google Scholar] [CrossRef]
  18. Huang, P.; Cheng, Y.; Lu, W.; Li, P. Optimization of Concentration-Time, Agar, and Sugar Concentration for Sweet Gelatinized Adzuki-Bean Jelly Cake (Yokan) by Response Surface Methodology. Gels 2022, 8, 540. [Google Scholar] [CrossRef]
  19. Riedel, R.; Böhme, B.; Rohm, H. Development of formulations for reduced-sugar and sugar-free agar-based fruit jellies. Int. J. Food Sci. Tech. 2015, 50, 1338–1344. [Google Scholar] [CrossRef]
  20. Jakubczyk, E.; Kamińska-Dwórznicka, A. Effect of addition of chokeberry juice concentrate and foaming agent on the physical properties of agar gel. Gels 2021, 7, 137. [Google Scholar] [CrossRef]
  21. Nauta, M.J. Separation of uncertainty and variability in quantitative microbial risk assessment models. Int. J. Food Microbiol. 2000, 57, 9–18. [Google Scholar] [CrossRef]
  22. Bhavya, M.L.; Hebbar, H.U. Sono-photodynamic inactivation of Escherichia coli and Staphylococcus aureus in orange juice. Ultrason. Sonochem. 2019, 57, 108–115. [Google Scholar] [CrossRef]
  23. Zhang, Y.; Xie, J. Effects of 405 nm light-emitting diode treatment on microbial community on fresh-cut pakchoi and antimicrobial action against Pseudomonas reinekei and Pseudomonas palleroniana. J. Food Saf. 2021, 41, e12920. [Google Scholar] [CrossRef]
  24. Saxena, R.; Vasudevan, S.; Patil, D.; Ashoura, N.; Grimwade, J.E.; Crooke, E. Nucleotide-induced conformational changes in Escherichia coli DnaA protein are required for bacterial ORC to pre-RC conversion at the chromosomal origin. Int. J. Mol. Sci. 2015, 16, 27897–27911. [Google Scholar] [CrossRef] [PubMed]
  25. Hirt, B.; Fiege, J.; Cvetkova, S.; Gräf, V.; Scharfenberger-Schmeer, M.; Durner, D.; Stahl, M. Comparison and prediction of UV-C inactivation kinetics of S. cerevisiae in model wine systems dependent on flow type and absorbance. LWT 2022, 169, 114062. [Google Scholar] [CrossRef]
  26. Palmer, J.M. Radiometry and photometry: Units and conversions. In Handbook of Optics, 3rd ed.; McGraw-Hill, Inc.: New York, NY, USA, 2010; pp. 7–11. [Google Scholar]
  27. Bolton, J.R.; Linden, K.G. Standardization of methods for fluence (UV dose) determination in bench-scale UV experiments. J. Environ. Eng. 2003, 129, 209–215. [Google Scholar] [CrossRef]
  28. Park, H.W.; Yoon, W.B. A quantitative microbiological exposure assessment model for Bacillus cereus in pasteurized rice cakes using computational fluid dynamics and Monte Carlo simulation. Food Res. Int. 2019, 125, 108562. [Google Scholar] [CrossRef]
  29. Mataragas, M.; Zwietering, M.H.; Skandamis, P.N.; Drosinos, E.H. Quantitative microbiological risk assessment as a tool to obtain useful information for risk managers—Specific application to Listeria monocytogenes and ready-to-eat meat products. Int. J. Food Microbiol. 2010, 141, S170–S179. [Google Scholar] [CrossRef]
  30. Ding, T.; Iwahori, J.; Kasuga, F.; Wang, J.; Forghani, F.; Park, M.; Oh, D. Risk assessment for Listeria monocytogenes on lettuce from farm to table in Korea. Food Control 2013, 30, 190–199. [Google Scholar] [CrossRef]
  31. Park, M.; Bahk, G. Current state for temperature management of cold and frozen food transportation vehicles in Jeonbuk province. J. Food Hyg. Saf. 2017, 32, 107–113. [Google Scholar] [CrossRef]
  32. Jung, H. Consumer Survey and Hazard Analysis for the Improvement of Food Hygiene and Safety in Purchase. Master’s Thesis, Korea University, Seoul, Republic of Korea, 2011. [Google Scholar]
  33. Kennedy, J.; Jackson, V.; Blair, I.S.; McDowell, D.A.; Cowan, C.; Bolton, D.J. Food safety knowledge of consumers and the microbiological and temperature status of their refrigerators. J. Food Prot. 2005, 68, 1421–1430. [Google Scholar] [CrossRef]
  34. Oh, D.; Ding, T.; Jin, Y. A new secondary model developed for the growth rate of Escherichia coli O157: H7 in broth. Indian J. Microbiol. 2012, 52, 99–101. [Google Scholar] [CrossRef]
  35. Xie, T.; Yuan, X.; Wen, D.; Shi, H. Growth and thermal inactivation of Listeria monocytogenes and Escherichia coli O157: H7 in four kinds of traditionally non-fermented soya bean products. Int. J. Food Sci. Tech. 2021, 56, 4062–4069. [Google Scholar] [CrossRef]
  36. Lee, S.; Han, A.; Yoon, J.; Lee, S. Growth evaluation of Escherichia coli O157: H7, Salmonella typhimurium, and Listeria monocytogenes in fresh fruit and vegetable juices via predictive modeling. LWT 2022, 162, 113485. [Google Scholar] [CrossRef]
  37. Juneja, V.K.; Melendres, M.V.; Huang, L.; Subbiah, J.; Thippareddi, H. Mathematical modeling of growth of Salmonella in raw ground beef under isothermal conditions from 10 to 45 C. Int. J. Food Microbiol. 2009, 131, 106–111. [Google Scholar] [CrossRef]
  38. Zwietering, M.H.; De Koos, J.T.; Hasenack, B.E.; De Witt, J.C.; Van’t Riet, K. Modeling of bacterial growth as a function of temperature. Appl. Environ. Microbiol. 1991, 57, 1094–1101. [Google Scholar] [CrossRef]
  39. Bowker, C.; Sain, A.; Shatalov, M.; Ducoste, J. Microbial UV fluence-response assessment using a novel UV-LED collimated beam system. Water Res. 2011, 45, 2011–2019. [Google Scholar] [CrossRef]
  40. Moreno, I.; Sun, C. Modeling the radiation pattern of LEDs. Opt. Express 2008, 16, 1808–1819. [Google Scholar] [CrossRef]
  41. Simons, R.; Gabbai, U.E.; Moram, M.A. Optical fluence modelling for ultraviolet light emitting diode-based water treatment systems. Water Res. 2014, 66, 338–349. [Google Scholar] [CrossRef]
  42. Jung, H.; Yuk, H.; Yoon, W.B. Effect of LED light on the inactivation of Bacillus cereus for extending shelf-life of extruded rice cake and simulation of the patterns of LED irradiation by various arrays of LEDs. J. Appl. Biol. Chem. 2019, 62, 181–186. [Google Scholar] [CrossRef]
  43. Kumar, A.; Ghate, V.; Kim, M.J.; Zhou, W.; Khoo, G.H.; Yuk, H.G. Inactivation and changes in metabolic profile of selected foodborne bacteria by 460 nm LED illumination. Food Microbiol. 2017, 63, 12–21. [Google Scholar] [CrossRef]
  44. Ghate, V.S.; Ng, K.S.; Zhou, W.; Yang, H.; Khoo, G.H.; Yoon, W.B.; Yuk, H.G. Antibacterial effect of light emitting diodes of visible wavelengths on selected foodborne pathogens at different illumination temperatures. Int. J. Food Microbiol. 2013, 166, 399–406. [Google Scholar] [CrossRef]
  45. Hyun, J.E.; Moon, S.K.; Lee, S.Y. Antibacterial activity and mechanism of 460–470 nm light-emitting diodes against pathogenic bacteria and spoilage bacteria at different temperatures. Food Control 2021, 123, 107721. [Google Scholar] [CrossRef]
  46. Bialka, K.L.; Demirci, A.; Walker, P.N.; Puri, V.M. Pulsed UV-light penetration of characterization and the inactivation of Escherichia coli K12 in solid model systems. Trans. ASABE 2008, 51, 195–204. [Google Scholar] [CrossRef]
  47. Kim, M.; Yuk, H. Antibacterial mechanism of 405-nanometer light-emitting diode against Salmonella at refrigeration temperature. Appl. Environ. Microbiol. 2017, 83, 2582. [Google Scholar] [CrossRef] [PubMed]
  48. Kim, M.; Lianto, D.K.; Koo, G.H.; Yuk, H. Antibacterial mechanism of riboflavin-mediated 460 nm light emitting diode illumination against Listeria monocytogenes in phosphate-buffered saline and on smoked salmon. Food Control 2021, 124, 107930. [Google Scholar] [CrossRef]
Figure 1. Various arrangements for LEDs. (a) Centered array; (b) cross array; (c) evenly spaced array.
Processes 11 01331 g001
Figure 2. Diagram of the LED illumination apparatus (a) and the behavior of light rays between the air and the solid model system (b).
Processes 11 01331 g002
Figure 3. Diagram of manufacturing facility-to-consumer pathway of agar gel product.
Processes 11 01331 g003
Figure 4. Ray-tracing simulation of various LED arrangements and the simulated light intensity on the samples. (a) centered array; (b) cross array; (c) evenly spaced array.
Processes 11 01331 g004
Figure 5. Reduction of Escherichia coli O157:H7 in an agar gel without dye (a) and with 0.05% Sunset Yellow FCF dye (b) at each segment after LED treatment with 450 nm visible blue light at 25 °C. Means have been assigned different uppercase letters (A–C), and lowercase letters (a–c) are statistically significant (p < 0.05) among the irradiation times and between the samples, respectively.
Processes 11 01331 g005
Figure 6. Probability density of final contamination level of Escherichia coli O157:H7 in agar gel at each segment. (a) Agar gel with dye; (b) Agar gel without dye.
Processes 11 01331 g006
Table 1. Implementation of inputs used to simulate the level of Escherichia coli O157:H7 of agar gels after LED inactivation during manufacturing at a facility or being displayed at a retail store.
InputsImplementationsUnitsSources/Note
Transportation from manufacturing facility
TemperaturePert (6, 12, 20)°C[21]
TimePert (2, 4, 12)h[21]
Retail storage
TemperatureNormal (5.44, 2.32)°C [22]
TimePert (1, 8, 13)hRetailer info
Transportation from retail shop to home
TemperaturePert (2, Uniform (4, 8.32), Uniform (15, 25))°C[23]
TimePert (19.5, 59, 98.6)min[25]
Home storage
TemperatureNormal (5.85, 2.49)°C [26]
TimeUniform (0, 21)dayRetailer info
Table 2. Petri factor of LED arrangements at 40 mm height.
Petri FactorLED Arrangement
Centered ArrayCross ArrayEvenly Spaced Array
Measured0.67 ± 0.09 c0.84 ± 0.05 b0.99 ± 0.06 a
Simulated0.540.700.85
Means within the same row that have been assigned different letters (a–c) are statistically significant (p < 0.05) as determined through an ANOVA analysis.
Table 3. Initial condition used to simulate the final contamination of Escherichia coli O157:H7.
InputsImplementationsUnitsSources/Note
Initial level of Escherichia coli O157:H7
Agar gels without dye
Top segmentNormal (2.90, 0.27)Log CFU/gMeasured
Middle segmentNormal (3.02, 0.24)Log CFU/gMeasured
Bottom segmentNormal (3.65, 0.31)Log CFU/gMeasured
Agar gels with dye
Top segmentNormal (4.64, 0.25)Log CFU/gMeasured
Middle segmentNormal (5.48, 0.33)Log CFU/gMeasured
Bottom segmentNormal (5.76, 0.31)Log CFU/gMeasured
Table 4. Secondary model parameters to calculate the growth of Escherichia coli O157:H7.
ModelParameterValue
Modified Ratkowsky modelTmax58.24
Tmin0.31
b0.030
c0.046
Hyperbolic modelp105.50
q−18.75
Disclaimer/Publisher’s Note: The statements, opinions and data contained in all publications are solely those of the individual author(s) and contributor(s) and not of MDPI and/or the editor(s). MDPI and/or the editor(s) disclaim responsibility for any injury to people or property resulting from any ideas, methods, instructions or products referred to in the content.

