Article

Emissions and Absorption of CO2 in China’s Cold Regions

1
State Key Laboratory of Urban Water Resource and Environment, School of Environment, Harbin Institute of Technology, Harbin 150090, China
2
Harbin Ecological and Environmental Monitoring Center, Harbin 150076, China
3
Meteorological Observation Center, China Meteorological Administration, Beijing 100081, China
4
Longfengshan Regional Background Station, China Meteorological Administration (CMA), Harbin 150200, China
*
Authors to whom correspondence should be addressed.
Processes 2023, 11(5), 1336; https://doi.org/10.3390/pr11051336
Submission received: 20 March 2023 / Revised: 23 April 2023 / Accepted: 25 April 2023 / Published: 26 April 2023

Abstract

:
Energy production and consumption are dominant sources of CO2 emissions. Investigating the amount and characteristics of CO2 emission sources can aid in reducing CO2 emissions from energy-related sectors, which could lead to the development of advanced technologies and ideas for abatement. Cities play a significant role in CO2 emissions, representing a distinctive unit with a specialized energy consumption structure, meteorology, economy, agriculture, forest acreage, etc. Those properties interact and influence CO2 emissions. The city-level emission inventory is an important scientific database helping to investigate emission abatement technologies and establish control strategies. In this study, city-level CO2 emissions and ecological absorption of China’s coldest province are quantified. In the targeted region, winter lasts for about 6 months. Sectors of industry, thermal power generation, and domestic heating are dominant contributors to the total emissions. The provincial CO2 emissions from energy consumption increased gradually, reaching 327.61 million tons in 2019. Cities with strong industrial activities produced higher CO2 emissions. Moreover, the targeted region is a strong agriculture province, with the largest contribution to grain production in China. The absorption of farmland and forest was quantified, at 343.91 and 69.3 million tons in 2019, respectively. The total absorption was higher than the energy-related emissions. This indicated that the targeted region would provide a considerable carbon sink, attributed to the properties of its ecological system. From 2017 onwards, small boilers (single boilers smaller than 32 steam tons) were removed, and hence the emissions were lower than the original value. This study presents the characteristics of CO2 emissions, and reveals the co-benefit of air pollution control on CO2 reduction.

Graphical Abstract

1. Introduction

Climate change is one of the most significant challenges facing humanity today, with its impacts being felt across the world in both natural ecosystems and human society. Scientific research has demonstrated the significant impacts of climate change, and the sixth report of the Intergovernmental Panel on Climate Change (IPCC) projected that the global temperature will rise by 1.5 °C over the next two decades due to the emissions of greenhouse gases, particularly carbon dioxide and methane [1,2]. As a result, there has been a growing recognition of the need for concerted efforts to reduce greenhouse gas emissions and mitigate the impacts of climate change.
Energy consumption is one of the primary anthropogenic sources of CO2 emissions, resulting from various human activities such as burning fossil fuels, industrial processes, and forest vegetation destruction. The structure of energy consumption in different regions has a significant impact on the characteristics of CO2 emissions [3]. Cities are a critical unit for global climate action since the unique characteristics of each city, including its location, economy, population, meteorology, environment, and ecosystem, result in diverse energy consumption properties. Cities are responsible for 67–76% of global CO2 emissions and energy consumption [4]. Therefore, quantifying city-level CO2 emissions is crucial for effectively reducing CO2 and mitigating climate change, considering the specificities of each city.
To effectively reduce CO2 emissions, it is necessary to accurately determine the role that energy-related industries play in contributing to these emissions. While some research has been conducted on CO2 emissions at the city level, the majority of these studies have been limited to megacities or provincial capitals, and therefore lack a comprehensive understanding of emissions on a broader scale [5,6,7]. CO2 emissions were compiled in previous studies based on activity data and emission factors. These data were collected from categorized sources, including fuel combustion, farmland irrigation, burned biomass, and production of goods, etc. [5,6,7,8,9]. In this study, the methods for constructing city-level emission inventories were investigated, taking into account various local datasets. This study provides a city-level CO2 emission inventory, and the scientific data provide useful information for policymaking to reduce CO2 emissions in these cities.
This study aims to address the research gaps by focusing on the CO2 footprint in China’s coldest region. Many previous studies provided the methods for calculating CO2 absorption in China, according to the categories of farmland, utilization of fertilizers, area of living wood, etc. [10,11]. Variations of regions referred to the meteorological conditions and agricultural activities. This paper also utilized IPCC guidelines to calculate CO2 emissions and living wood and crop absorption methods to estimate the ecological absorption of CO2. This assessment helps us to better understand the importance of promoting sustainable practices in Heilongjiang province to maintain its vital role as a significant carbon sink.
In this study, CO2 emissions are calculated based on energy categories and endpoint sectors, and the computation methods of the emission inventory are verified according to local parameters. Additionally, this study takes into account the agriculture sector, which is also an important anthropogenic source of CO2 emissions. Furthermore, as the targeted cities are located in a strong agricultural province with special meteorological conditions, the carbon sinks of the province are also quantified. These factors are essential for understanding the carbon footprint of the targeted cities and provide useful information for policymakers to develop effective policies to reduce CO2 emissions in these cities.
This research also provides methods for city-level CO2 emission inventories that can be used in other regions globally. It highlights the need for more localized and context-specific approaches to CO2 emission reductions, considering the unique characteristics of each city. The research findings could also be used to guide policymakers in the development of effective climate change policies and strategies that consider the unique characteristics of their respective cities.

2. Methodology

2.1. Target Region

Heilongjiang Province is located in Northeast China (121°11′–135°05′, 43°26′–53°33′), with special meteorology. The winters of Heilongjiang Province last for 6 months, with ambient temperature differences of more than 60 °C. The lowest temperature reached −50 °C. Energy consumption equaled 115.25 million tons of standard coal in 2020 [12]. Heilongjiang Province is known as a strong agriculture province, contributing to 56% of China’s agriculture. The forest acreage is 46% of the total, and the area of living wood is about 1500 million km2, which would play an important role in carbon absorption.

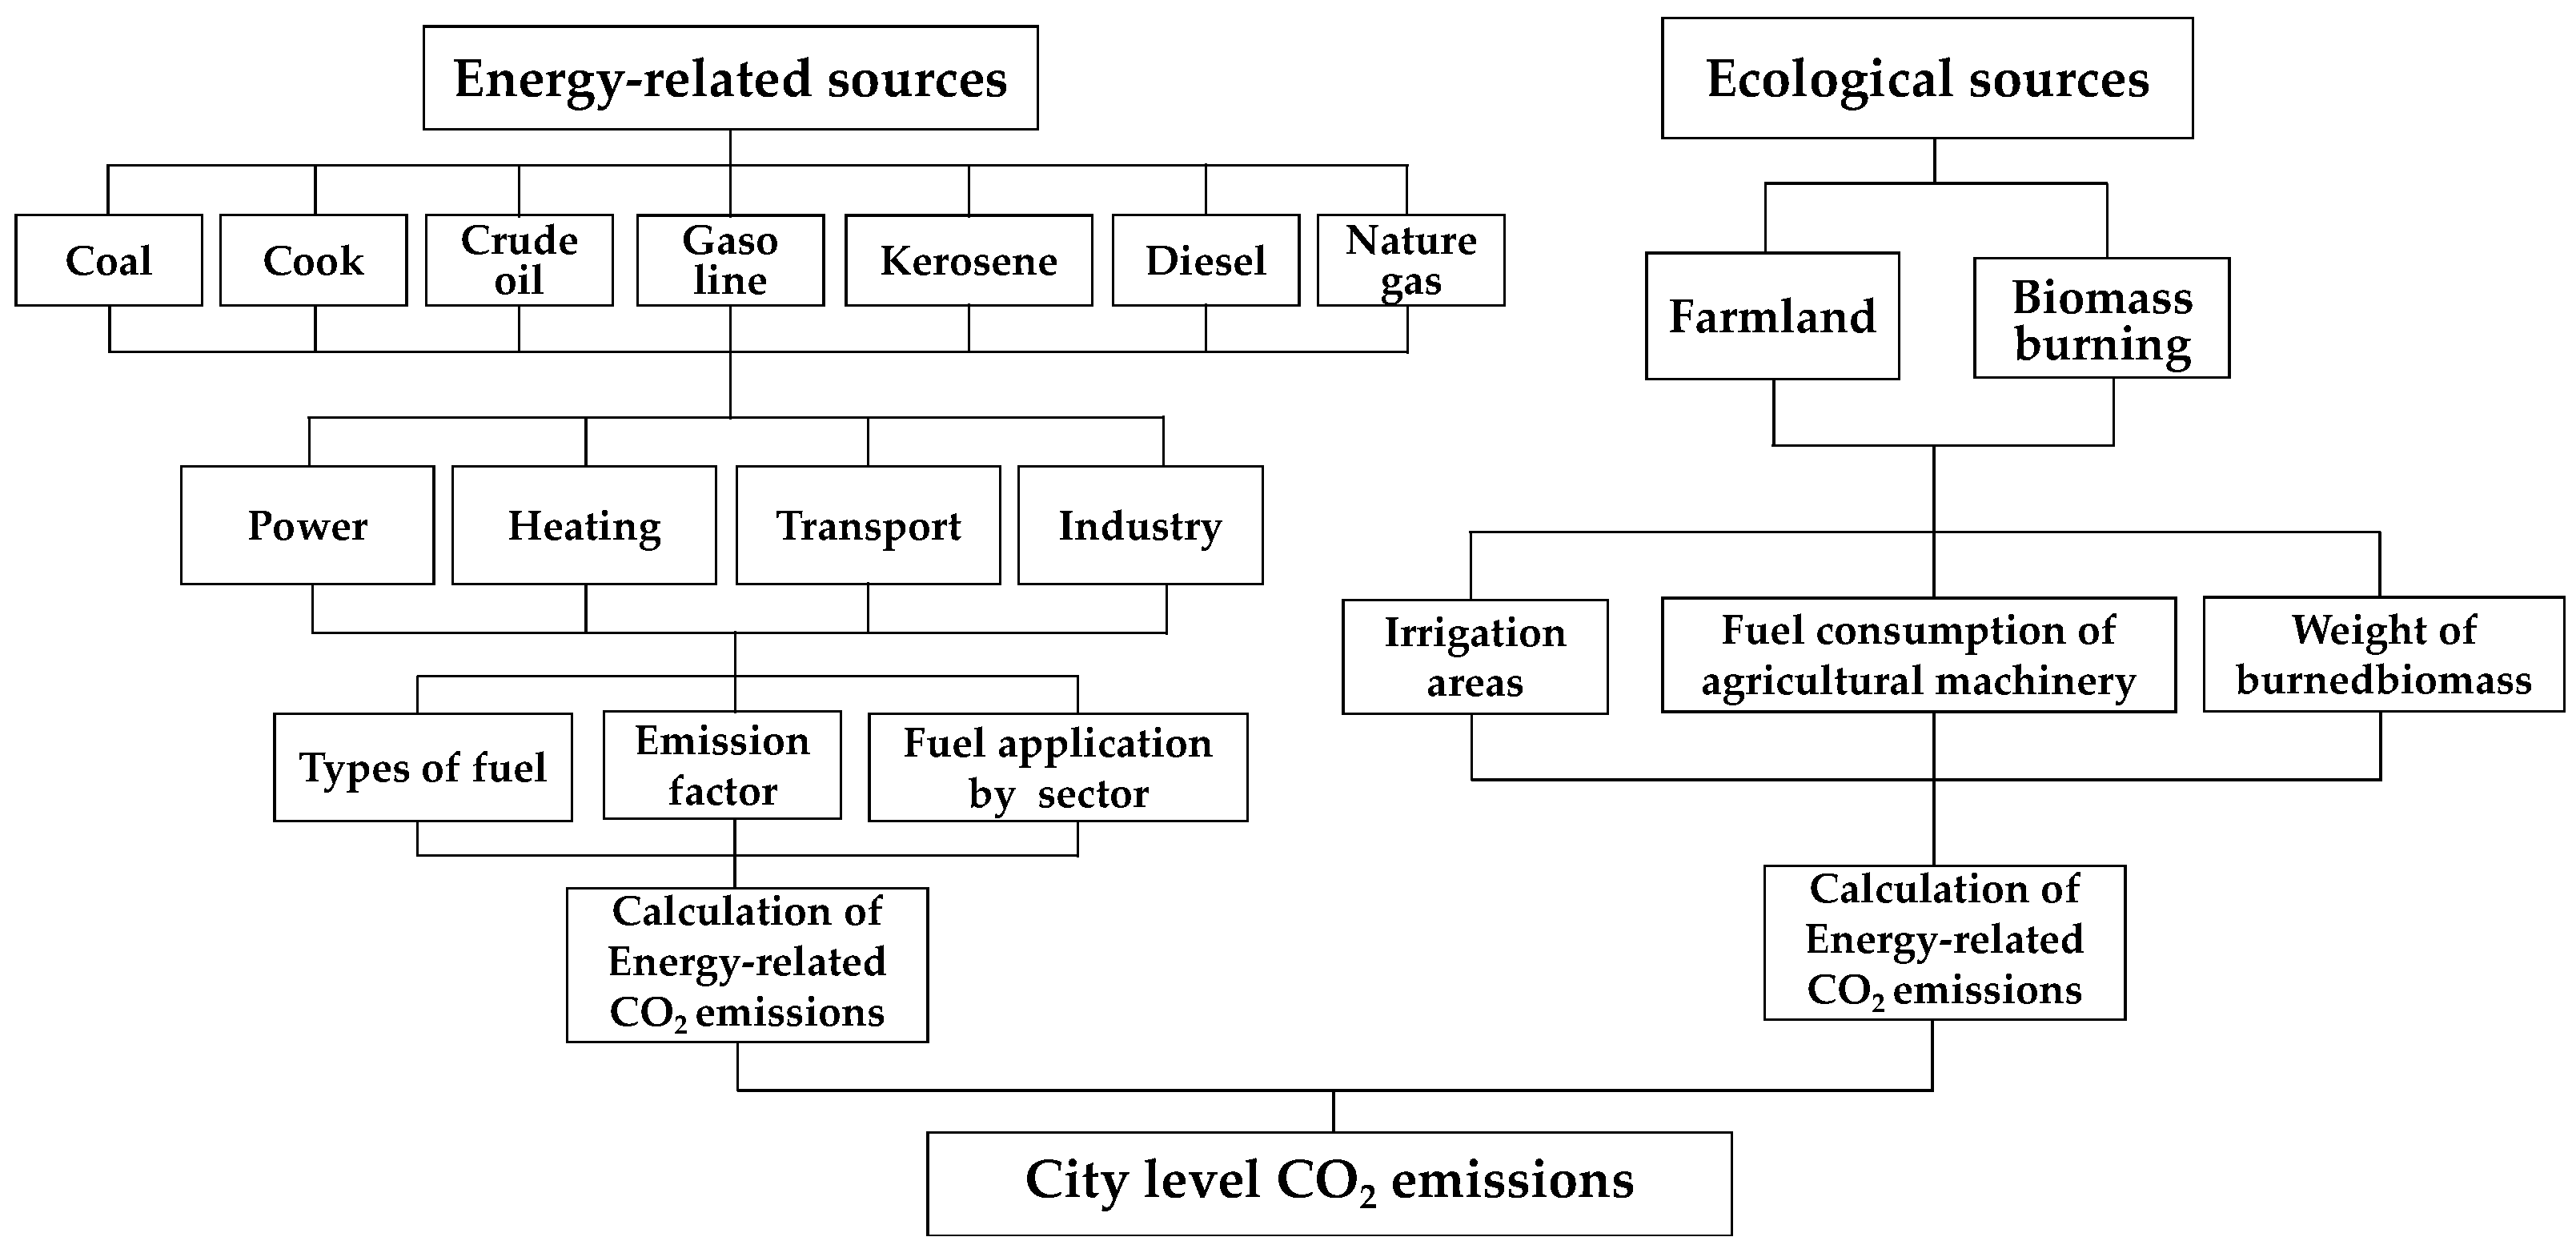
2.2. City-Level CO2 Emission Inventory

City-level CO2 emission sources in cold regions are categorized into anthropogenic and natural sources. In terms of the distinct characteristics of meteorological conditions, the source classification in each category is specified (Figure 1). Heating is a significant source of CO2 emissions, being is much higher in some areas than in others. Emissions from agriculture and wood occur at the relevant time of year. Hence, the emissions and absorption are subject to seasonal variation in China’s cold regions.
A city-level CO2 emissions inventory was built according to activity data and emission factors (Equation (1)). Activity data in the form of weight of fuel combustion, irrigation areas of farmland, amount of burned biomass, production of goods (e.g., cement, iron), etc., were mainly collected from the National Statistical Yearbook of China and the Heilongjiang Province Statistical Yearbook [12,13]. Emission factor data were available from National Statistical Organizations and recommendations from IPCC Reports [14], and previous studies [9,15].
E = A i , j × EF i
where E represents the total CO2 emissions of the targeted region; A refers to the activity data; EF represents the emission factors; i represents types of sectors; and j represents cities.

2.2.1. Energy-Related Emission Inventory

For energy-related sources, activity data were the fuel consumption by sector. Emission factors were the amounts of CO2 emissions per unit of fuel combustion (Equation (2)). The net calorific value, emission factors, and oxidation efficiency were parameters associated with the properties of fossil fuels without big changes in the short term, which were uniform data for target years, adapted from previous studies [3,16]. The activity dataset was associated with the amount of energy production consumption and consumption.
E e = i j AD ij × NCV i × EF i × O ij
where Ee represents CO2 emissions of energy consumption; i represents the categories of energy, i ∈ [1, 17]; j is the types of sectors, j ∈ [1, 48]; ADij is the energy consumption of sector j [3]; NCVi is the net calorific value of fossil fuel i; EFi is the CO2 emission factor of fossil fuel i [17]; and Oij is the oxidation efficiency [3].

2.2.2. Industrial Process

Industrial processed included cement, iron, and ammonia production [6,7]. The activity data were adapted from the local statistical yearbook [1,16]. Emission factors were detected according to the products, which represent the amount of CO2 emissions by the unit mass of goods production (Equation (3)) [8,18,19].
E p = p AD p × EF p
where Ep represents CO2 emissions of industrial processes; p represents the types of industrial processes; ADp refers to the output of cement, iron, and ammonia; EFp is the emission factors of industrial processes.

2.2.3. Farmland Ecosystem

CO2 emissions of the farmland ecosystem are emitted from five sectors [10,11], including applications of chemical fertilizer, pesticide, agricultural film, farmland irrigation, and agricultural machinery (Equations (4) and (6)) [20,21,22]:
E irri = AD f × EF f × 44 12
E e = ( S e × EF s + W e × EF w ) × 44 12
E = E irri + E e
where Eirri represents the emissions from the farming process; i represents the process of fertilizer and pesticide administration, agricultural films, and farmland irrigation; e represents the agricultural machinery; E is the total emissions of the farmland ecosystem; ADf is the application amount and irrigation areas; Se is the planting area of crops; We is the power of the agricultural machine; EFf represents the emission factors of fertilizers, pesticides, agricultural films, and farmland irrigation; EFs is the emission factors of crops [10,11]; and EFw refers to the emission factors of agricultural machinery [10,11].

2.3. Emission Factors

Emission factors of energy-related factors are the amounts of carbon oxidized per unit of energy consumed [16]. For other sectors, emission factors correlate with products of industrial processes (cement, iron) and farming activities (fertilizing, irritation, machinery, etc.). The emission factors of CO2 were adapted from previous studies [10,11,16], and are illustrated in Table 1.

2.4. CO2 Absorption

2.4.1. Farmland Ecosystem

CO2 absorption was calculated for the whole growth period of crops in the farmland ecosystem (Equation (7)):
C = i C i × Y i × ( 1 W i ) × ( 1 + R i ) / H i × 44 12
where C refers to the CO2 absorption of crops; i is the type of crop; Ci is the absorption rate of crop i; Yi is the economic production of crop i (Heilongjiang Province Statistical Year Book); Wi is the water content of crop i; Ri is the root to shoot ratio of crop i [10,11]; and Hi is the economic coefficient of the crop i [23,24,25,26].

2.4.2. Living Wood

This paper mainly considers the absorption of CO2 by living trees (i.e., arbor trees, scattered trees, side trees, and sparse forests) (Equation (8)):
Δ E = V × ( GR CR ) × SVD × BEF × 0 . 5 × 44 12
where ΔE refers to CO2 differences between the emission and absorption of living wood (net absorption in this study); V is the accumulation of living wood; GR is the annual growth rate of living wood; CR is the annual consumption rate of living wood; SVD is the density of wood; and BEF is the weighted average biomass conversion coefficient.

3. Results and Discussion

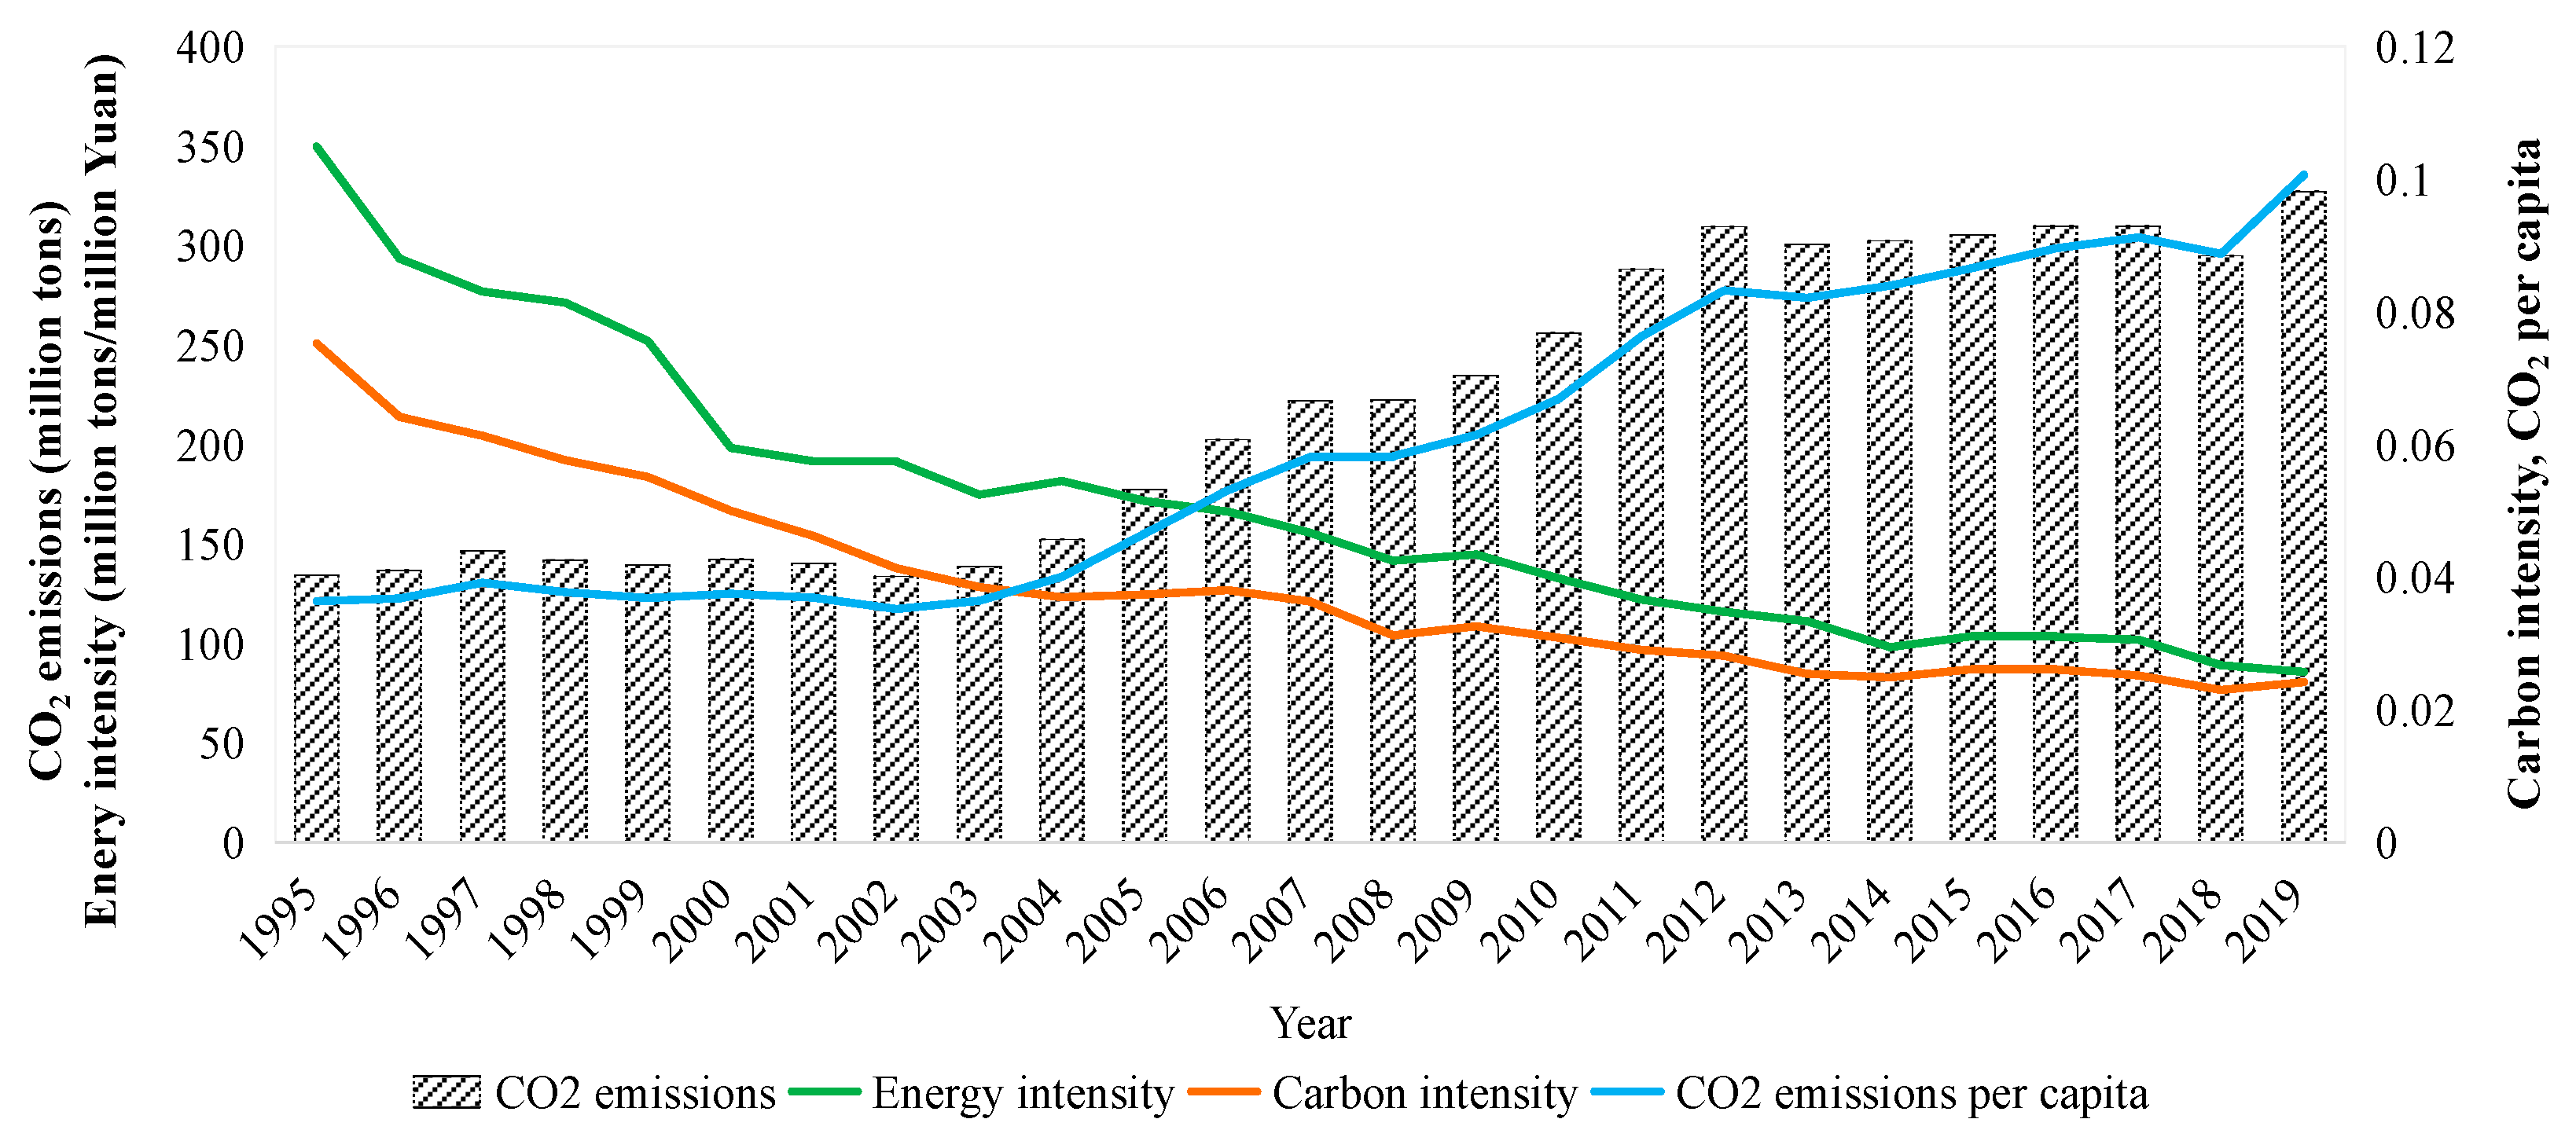
3.1. Total CO2 Emissions in Heilongjiang Province

Heilongjiang Province is a typical cold region in China. It has the longest winter in China, the lowest ambient temperature reaches −50 °C in certain areas, and the heating services are required for 6 months. The statistical data on energy consumption have been recorded since 1995. Emissions of CO2 increased over time. The annual increase rate was 24.16%. In 2019, CO2 emissions reached 327.61 million tons (Figure 2). The temporal emissions and trend were mostly consistent with previous studies [3], with an R2 of 0.93 (Figure S1). In this study, emissions of farmland ecosystems were considered.

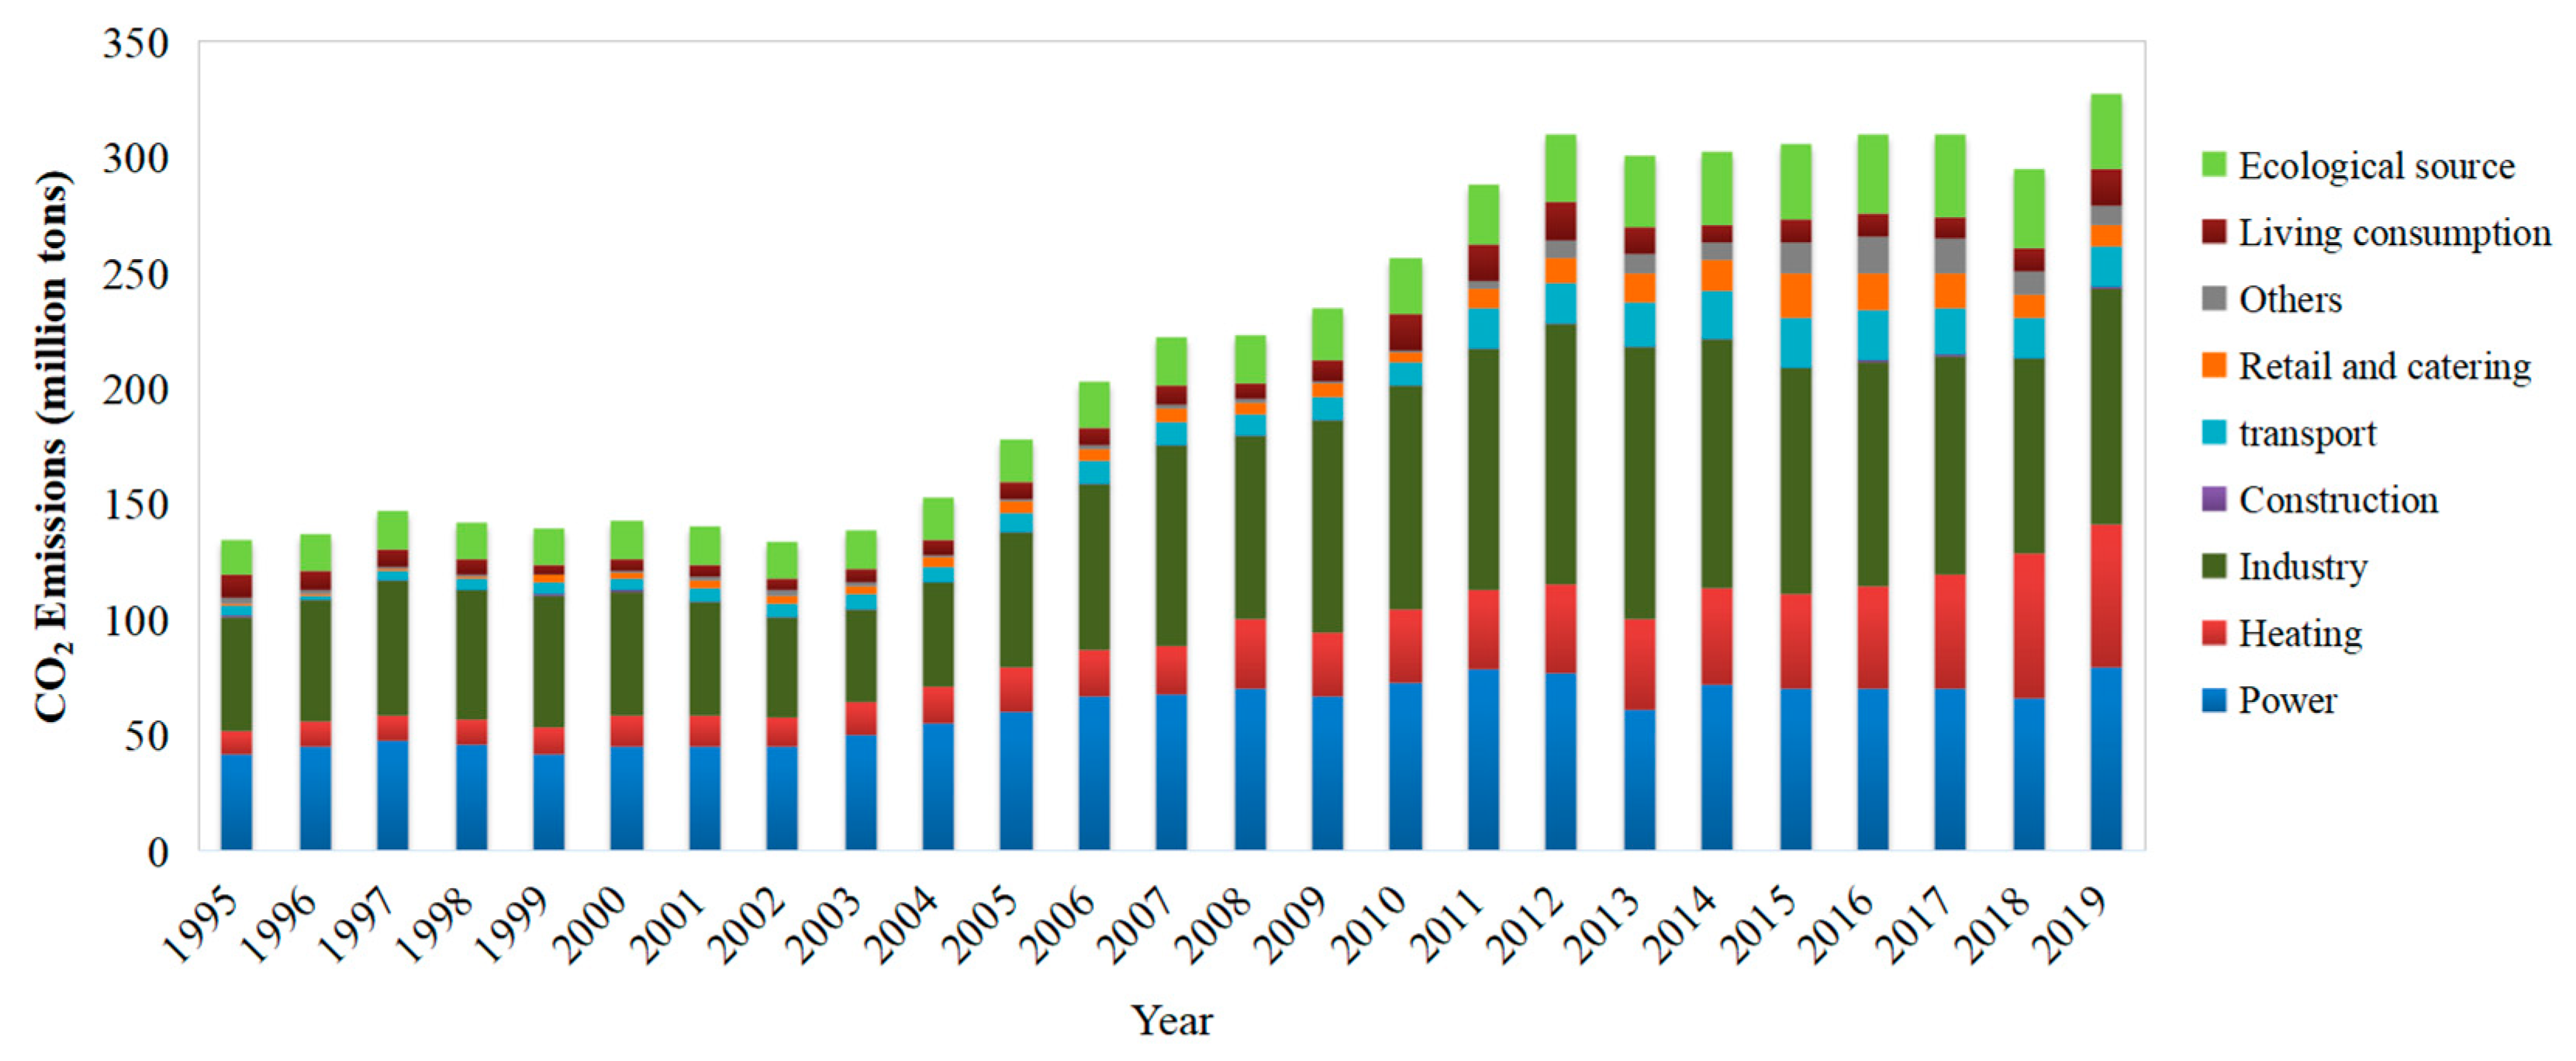
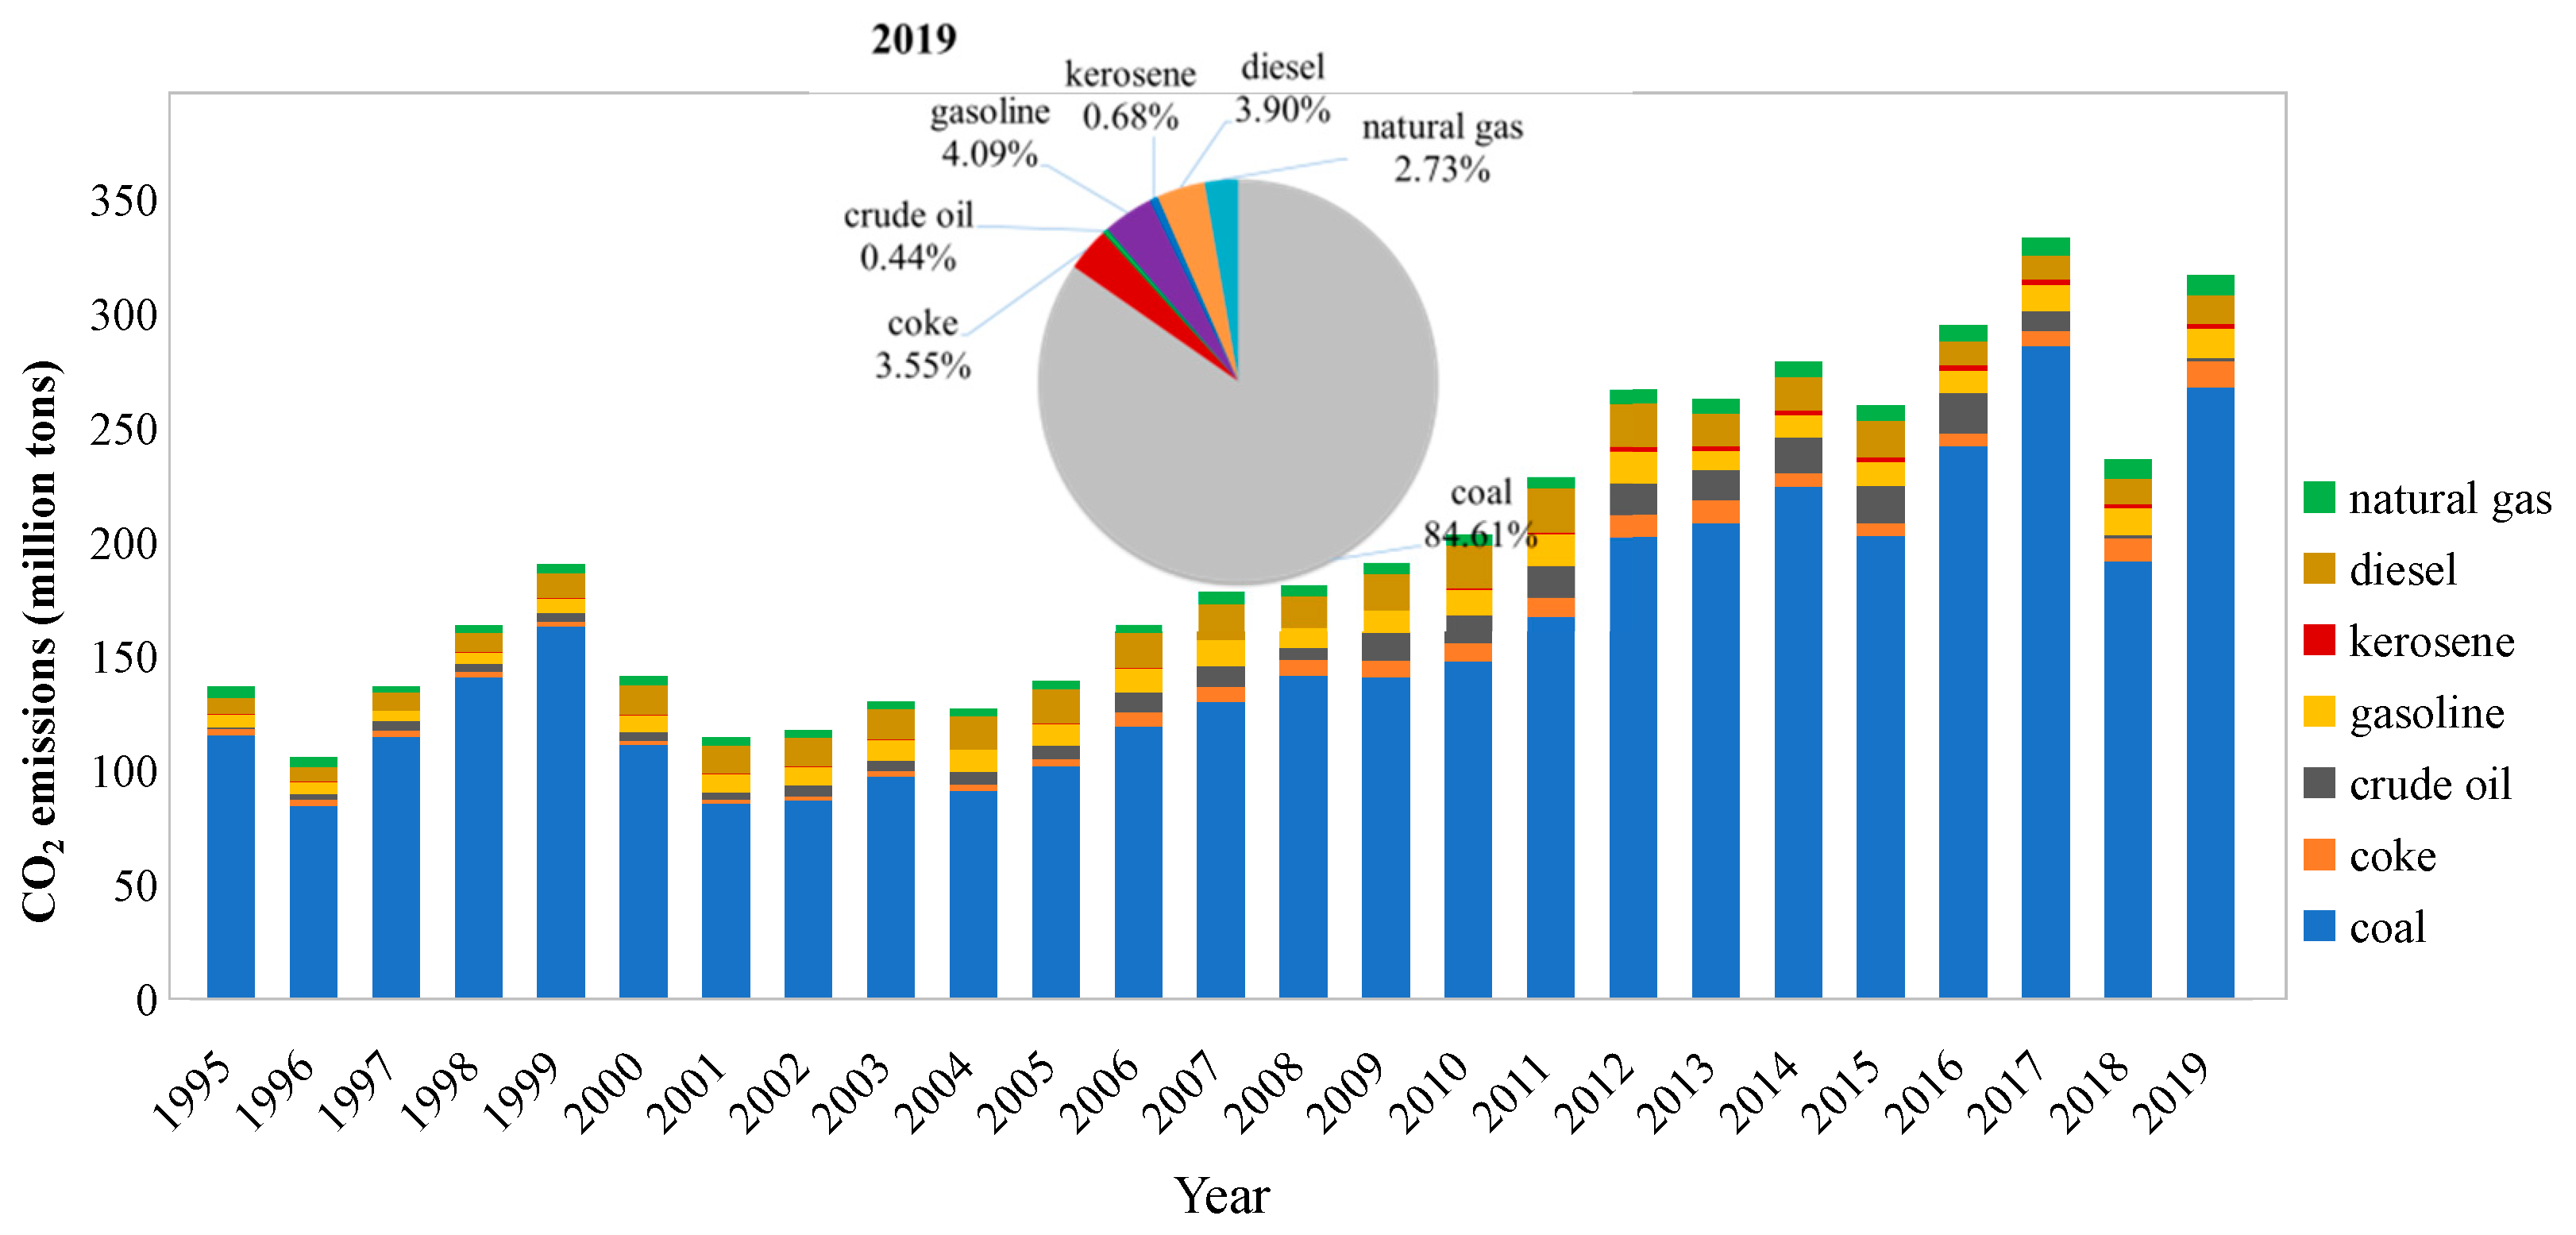
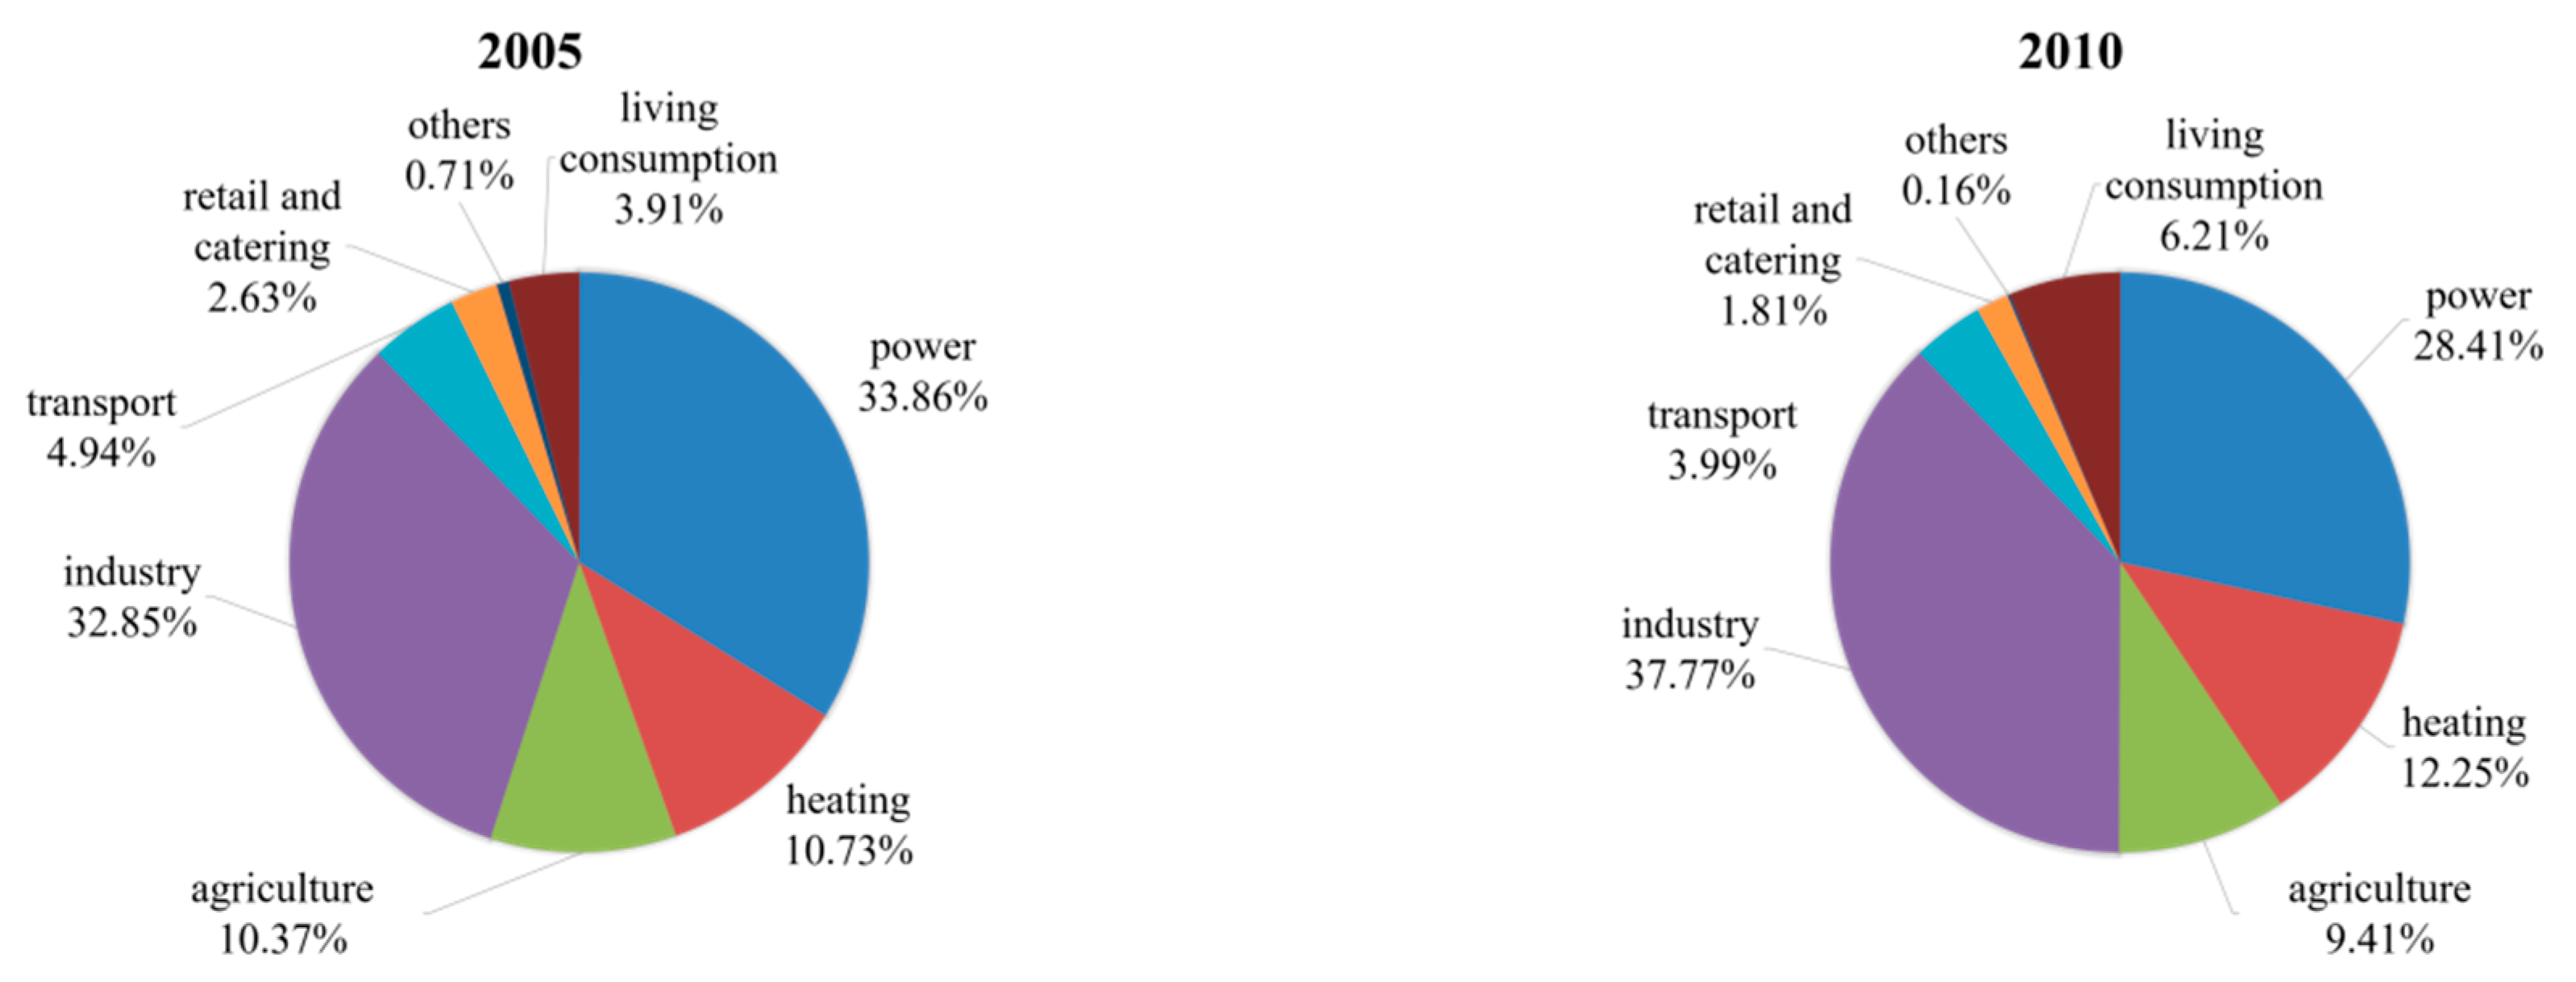
3.1.1. Dominant Energy-Related Sectors

Coal combustion is the dominant source of CO2 emissions. It contributed to 84.64% of total emissions in 2019. The winter of 2018 was unusually warm, and coal consumption was much lower than in 2017 or 2019, and hence the emissions were obviously lower. Other energy types contributed to 13.91–28.18% of total emissions from 1995 to 2019 (Figure 3).
Energy is utilized by various sectors, including power generation, heating, transportation, agriculture, retail, and domestic consumption, among others. According to computing results, industry and power generation are dominant anthropogenic emission sources and contributed to 33.85% and 33.86% of total emissions in 2005, respectively. Heating and agriculture are important contributors too. The contributions of the heating sector increased gradually, associated with the increased population and heating areas. The contributions of the agriculture sector were stable, and the rates were around 10%. In 2019, industry, power generation, heating, and agriculture contributed to 84.54% of total emissions (Figure 4).
The industrial sector emits CO2 through coal combustion and manufacturing processes. For coal combustion, CO2 emissions rose rapidly from 2005 to 2014. The emissions from raw coal combustion were 169.86 million tons with a contribution rate of 69.09%, which was much higher than the national average [3]. Thereafter, the government paid significant attention to air pollution control. Emissions of CO2 from coal combustion were abated by the bans and control strategies, falling to 63.5 million tons in 2019.
Moreover, Daqing is the city with the largest oil production in China. As a strong industrial city in Heilongjiang Province, its industrialization is at the forefront of other cities, contributing to 65% of the total provincial CO2 emissions.
Cement, iron, and ammonia production are typical industrial processes in Heilongjiang Province. From 1985 to 2019, the emissions from cement, iron, and ammonia production all showed a steady upward trend. The CO2 emissions of iron production were greater than those of cement. Emissions from iron production increased significantly from 2000 to 2013, and then decreased to 175 million tons in 2017. Emissions from cement production increased slightly in 1985–2013, decreased from 2014 to 2017, and then increased again in 2018. Harbin city contributed to 30–40% of CO2 emissions from the cement sector, while 10–15% of CO2 emissions came from Qiqihar’s cement sector.
Thermal power generation is an important source of CO2 emissions. Emissions from the thermal power sector rose on the whole from 1995 to 2011, by which time CO2 emissions reached 78.84 million tons in 2012. Emissions were stable from 2013 to 2018, when they were around 70 million tons. Emissions from the thermal power generation sector rose to 79.57 million tons. From the perspective of cities, Daqing is the largest contributor to CO2 emissions in the thermal power generation sector. From 2000 to 2014, the contribution rate was about 45% to 65%. The contribution rate of Harbin was stable in the range of 15–25%.
The emissions of the heating sector in Heilongjiang Province are on the rise. Emissions have increased rapidly since 2007, reaching 61.44 million tons in 2019. This indicates that the demand for fossil fuels for heating in Heilongjiang continued to increase. Due to the cold weather in Heilongjiang Province, a larger amount of emissions from the heating sector was noticed. For instance, the contribution of the heating sector in Harbin (9.43%, the capital city of Heilongjiang Province) was about three times higher than that in Shanghai (2.9%) [24]. From the perspective of the city, Daqing consumed the largest amount of fossil fuel for heating, followed by Harbin and Mudanjiang.
Driving forces refer to energy, GDP, and populations, affecting CO2 emissions. In this study, carbon intensity is applied to CO2 emissions (million tons) per unit GDP (million yuan, RMB). The carbon intensity reduced over time, which was consistent with the tendency of the energy intensity. The total CO2 emissions and CO2 emissions per capita in Heilongjiang Province during the period of 1995–2003 were in a stable state; from 2004 to 2011, both figures rose sharply; after 2011, the total carbon emissions were stable, but due to the decline in the population, the per capita emissions still showed an upward trend (Figure 5). The population is a significant factor in CO2 emissions, which was consistent with the analysis based on the 2011–2016 data in a previous study [27]. The warm winter of 2018 led to a significant decline in per capita carbon emissions.

3.1.2. Emissions from Ecological Sectors

The farmland ecosystem has the dual role of being both a carbon source and a carbon sink. In general, CO2 is emitted from the processes of five farmland sectors in Heilongjiang Province, including applications of chemical fertilizer, pesticides, agricultural films, farmland irrigation, and agricultural machinery. Overall, CO2 emissions rose smoothly until 2016, reaching 23.12 million tons. The CO2 emissions estimated in Yunnan Province were 35.26 million tons in 2015, which was higher than that in Heilongjiang province [9]. From 2017, the emissions showed a downward trend, owing to the reduction in fertilizer usage. The decreasing trend of farmland ecosystem CO2 emissions was also found in Beijing since 2004, at a rate of 5.5% annually from 2004 to 2012 [28].
Chemical fertilizer (nitrogen fertilizer, phosphate fertilizer, potash fertilizer, and compound fertilizer) contributed to 60–70% of the total CO2 emissions from the farmland ecosystem sector, which is the biggest contributor, followed by farmland irrigation, pesticides, agricultural film, and machinery [11,28]. The contribution of fertilizer in Heilongjiang Province was consistent with that in Beijing (63.5%, 2004–2012) and 10–20% more than that in Chongqing (approximately 50%, 2006–2015). From the perspective of spatial distribution, the emissions of Harbin, Suihua, Qiqihar, and Jiamusi were about 2.4, 1.73, 1.71, and 1.55 million tons, respectively, with 62.59% of total emissions coming from the fertilizer administration process in 2019.
Irrigation is the second biggest contributor to the farmland ecosystem sector in many regions of China, including Yunnan Province, Beijing, and Chongqing [10,11,28]. In Heilongjiang province, the emissions from irrigation increased gradually from 1996, contributing up to 28% of total emissions from the farmland ecosystem sector. The emissions in Qiqihar and Harbin are much higher than those of other cities, with 40% of total emissions being contributed by the irrigation process. In sum, 28% of the total CO2 emissions of Daqing and Jiamusi came from the irrigation process.
Applications of pesticide, agricultural machinery, and agricultural film emitted 5%, 6%, and 4% of total CO2 in the farmland ecosystem sector in 2019, reaching 1.16, 1.37, and 0.92 million tons, respectively.

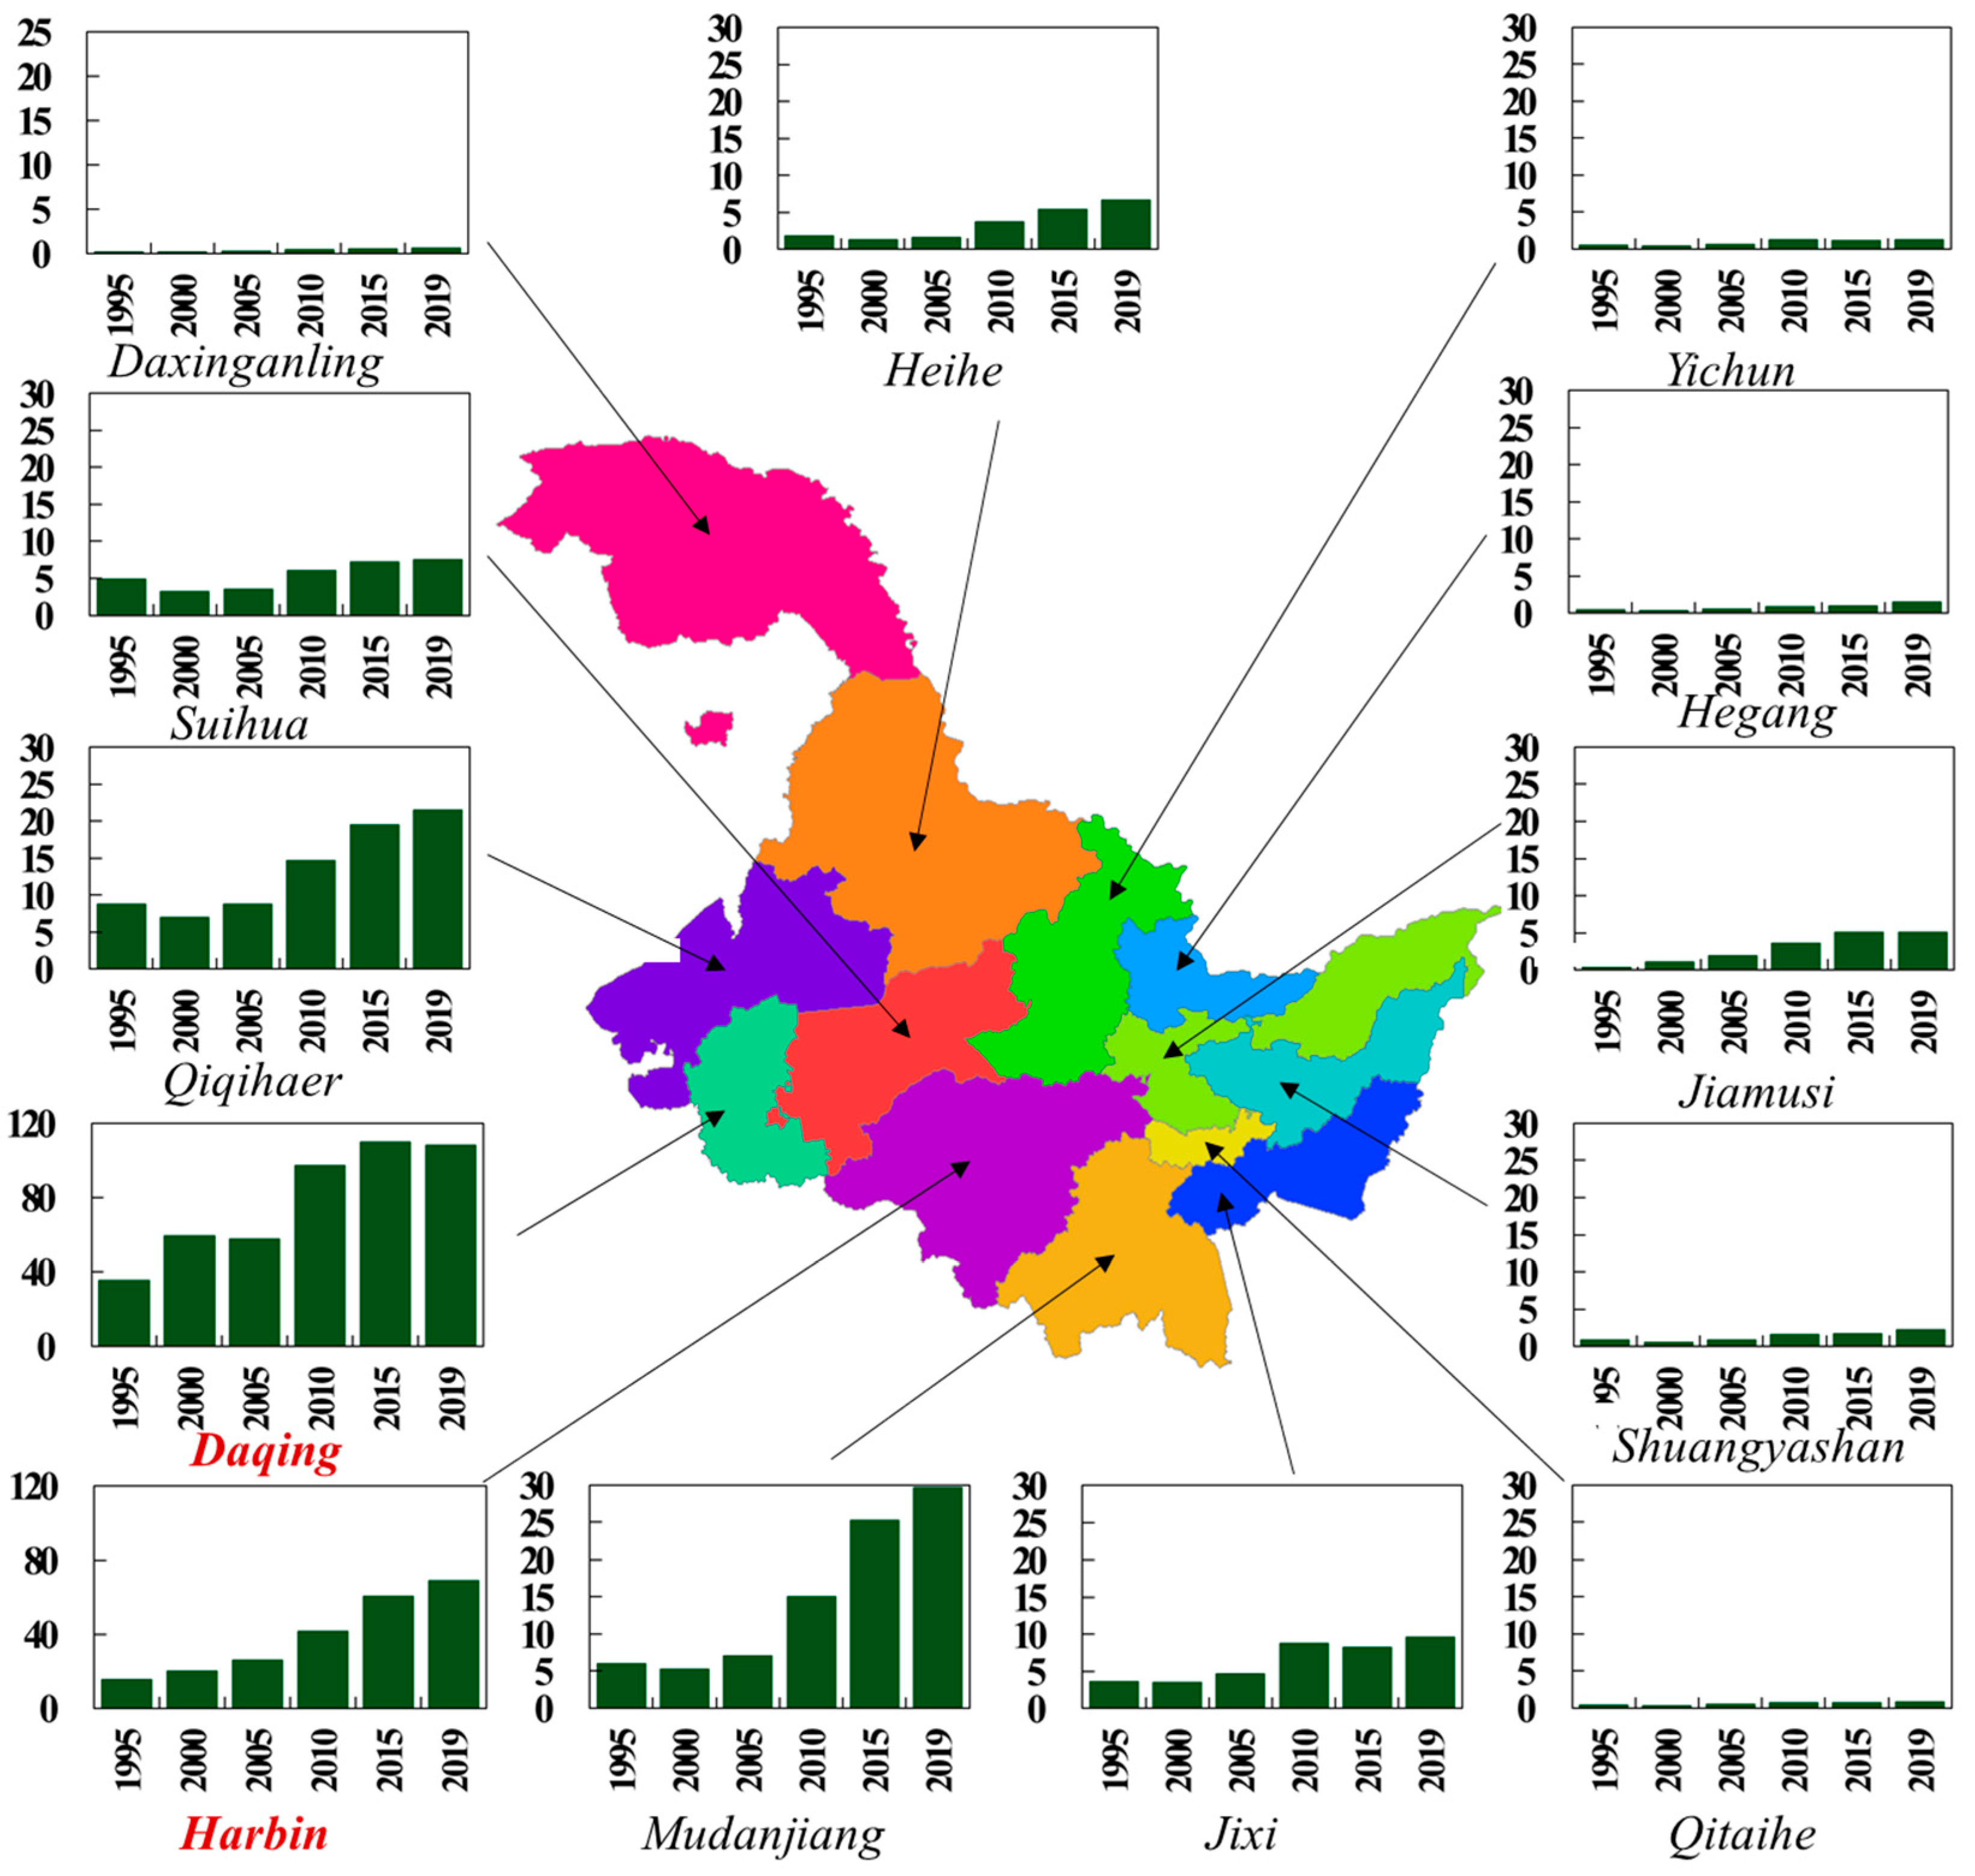
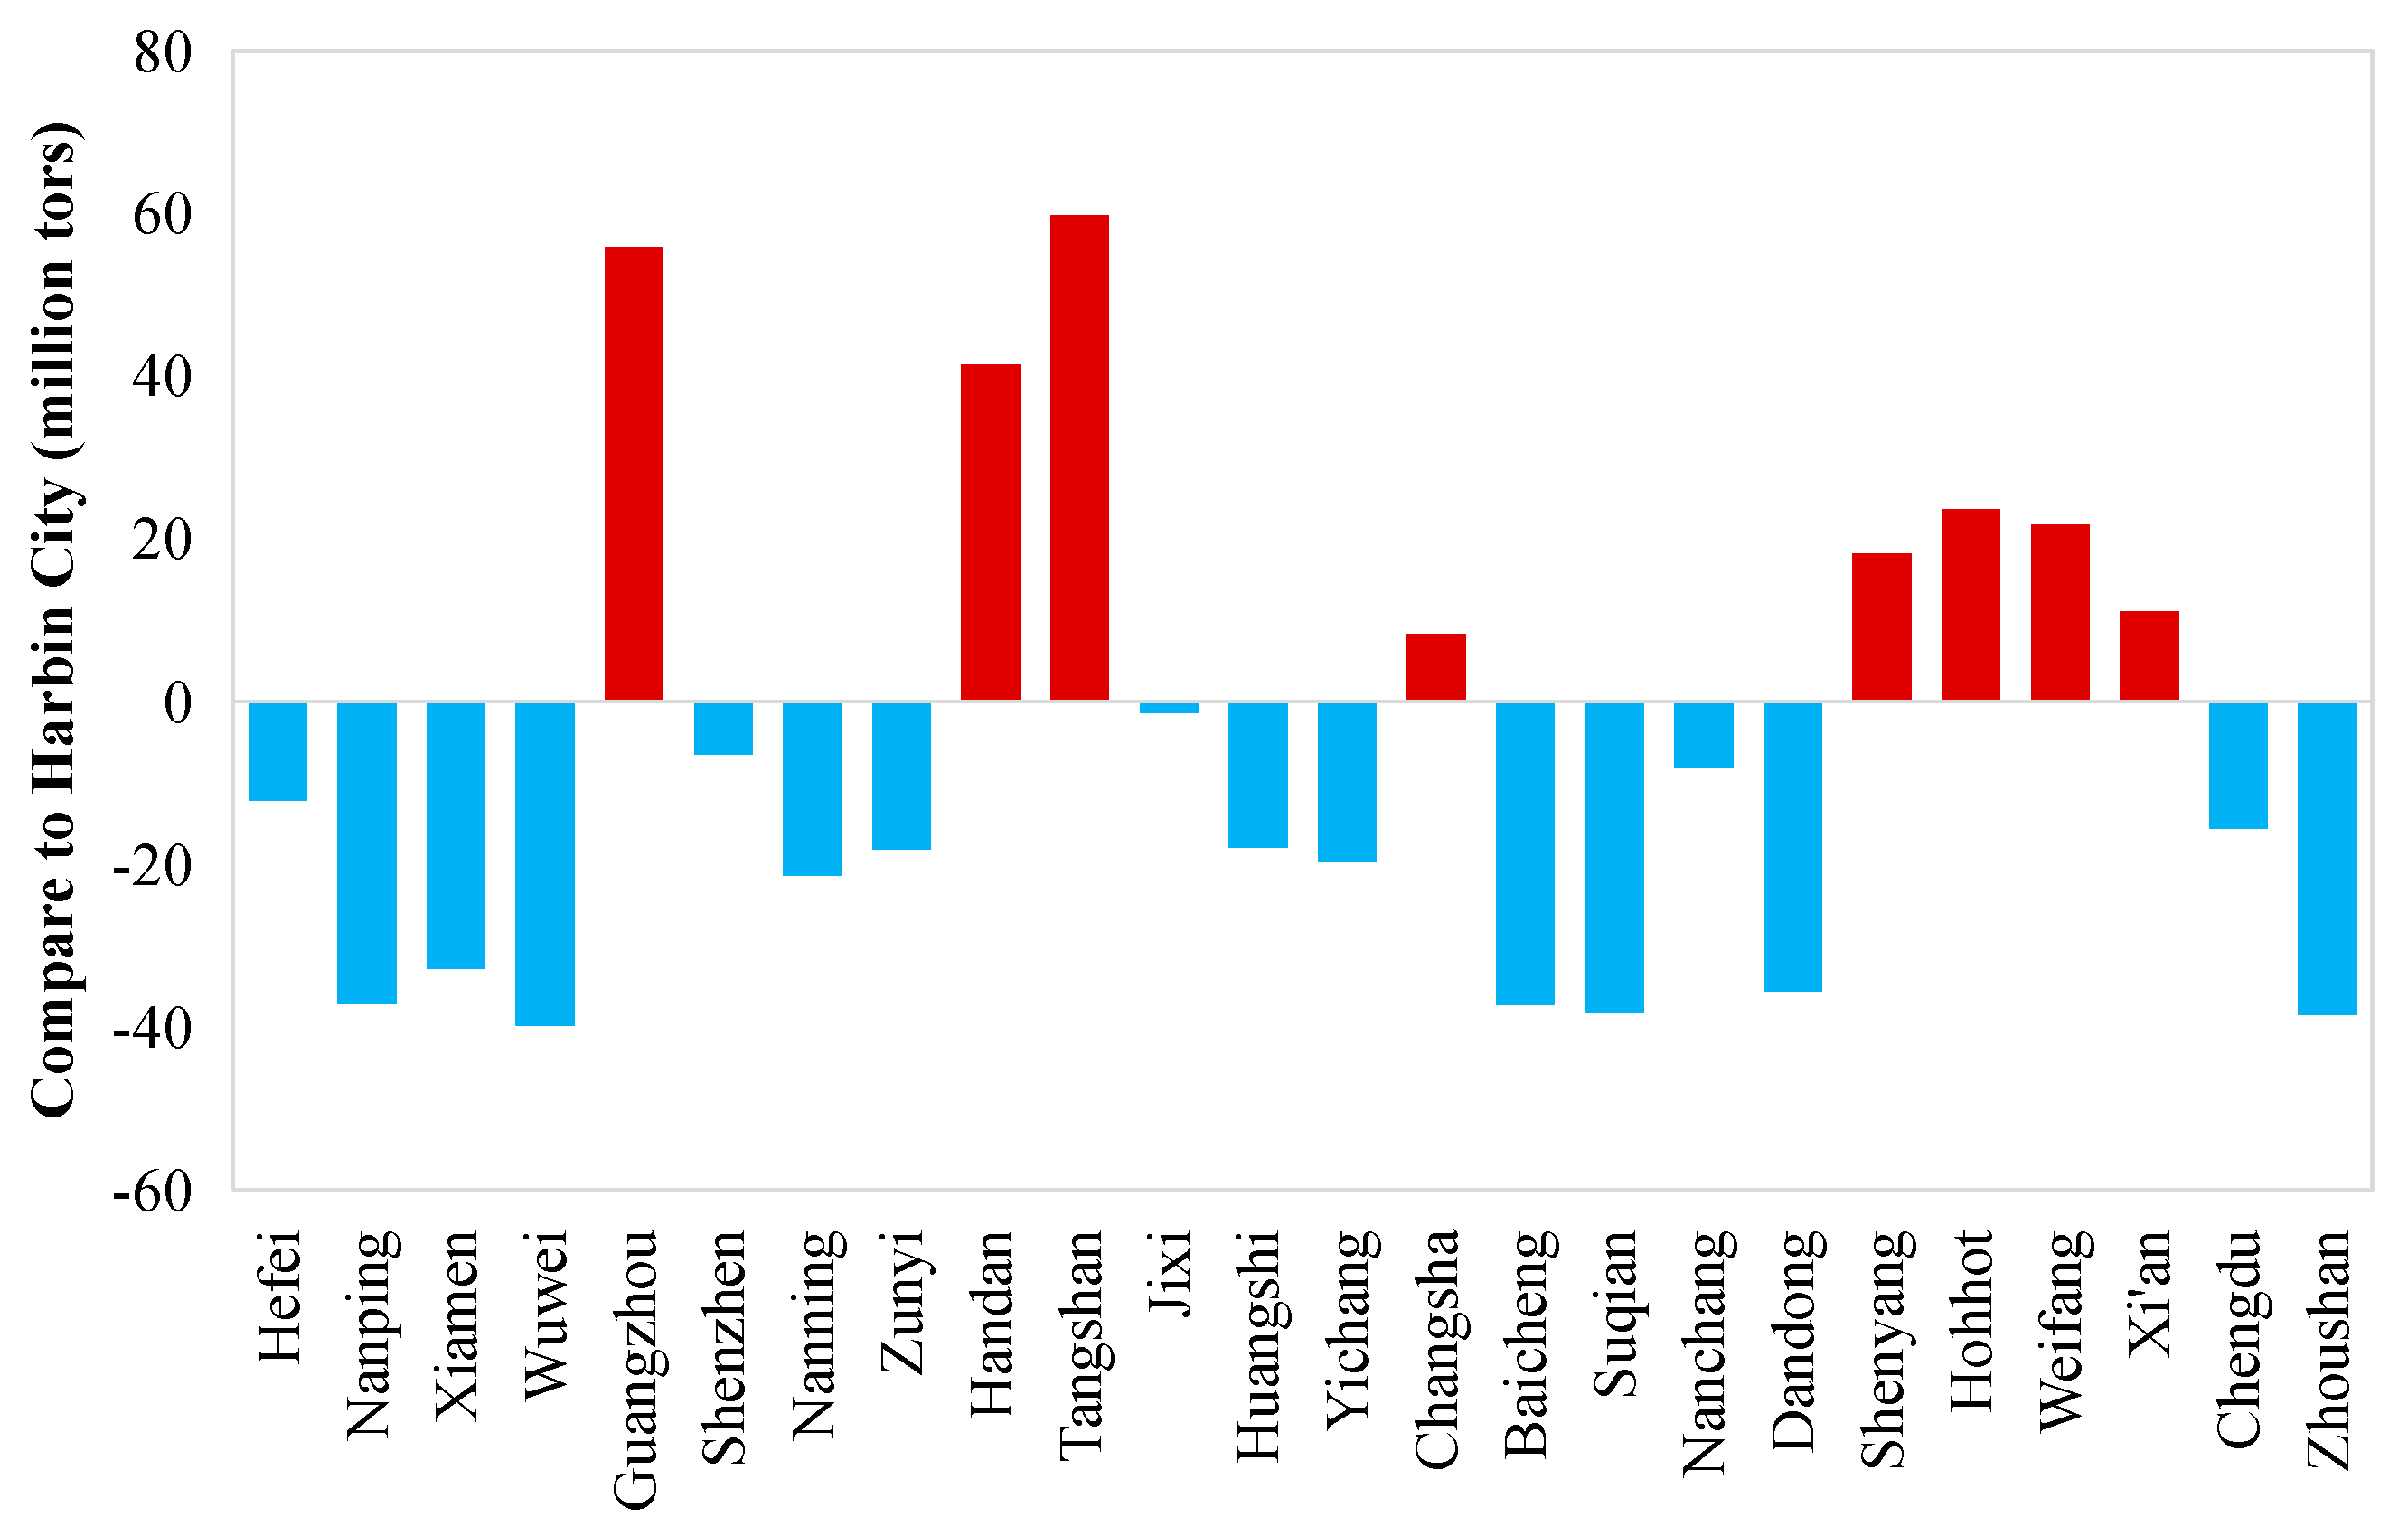
3.2. City-Level CO2 Emissions in Heilongjiang

The total emissions of carbon dioxide in cities in Heilongjiang Province all increased over time, from 1995 to 2019. Emissions from Daqing were 35.38–108.21 million tons, making it the largest contributor in Heilongjiang Province (Figure 6). However, the growth rate was 4.77% annually from 1995 to 2019, which was much lower than the mean growth rates of cities that ranged from 8.56 to 9.90% for 1990 to 2010 [1]. In Daqing, the power, heating, and industrial sectors are relatively developed, and the combustion of fossil fuels in these three sectors is the dominant anthropogenic source. The main sources of carbon dioxide emissions in Harbin are cement production and farmland ecosystems. The emissions form Harbin (the capital of Heilongjiang province) were up to 69 million tons in 2019. Compared to other capital cities, the emissions of Harbin (41.44 million tons) were much lower than those of Nanjing and Guangzhou in 2010, but twice as high as those from Shanghai (18.87 million tons). The differences can be attributed to the characteristics of energy consumption in these cities [6]. Emissions in Qiqihar and Mudanjiang followed similar trends, with emissions of 22 million tons and 29 million tons in 2019, respectively. The emissions of Jixi, Heihe, Suihua, and Jiamusi were in the range of 3 million to 10 million tons. The emissions of the other cities were relatively low, at less than 1 million tons.
According to the data of other cities, the CO2 emissions of Guangzhou, Handan, Tangshan, Changsha, Shenyang, Hohhot, Weifang, and Xi’an [3] were higher than those of Harbin, owing to the characteristics the development of the cities (Figure 7). The emissions of Hefei, Chengdu, Zunyi, Nanning, and Shenzhen, etc., are lower those of than Harbin, because of the energy consumption. The heating sector may be the significant factor that makes the most difference.

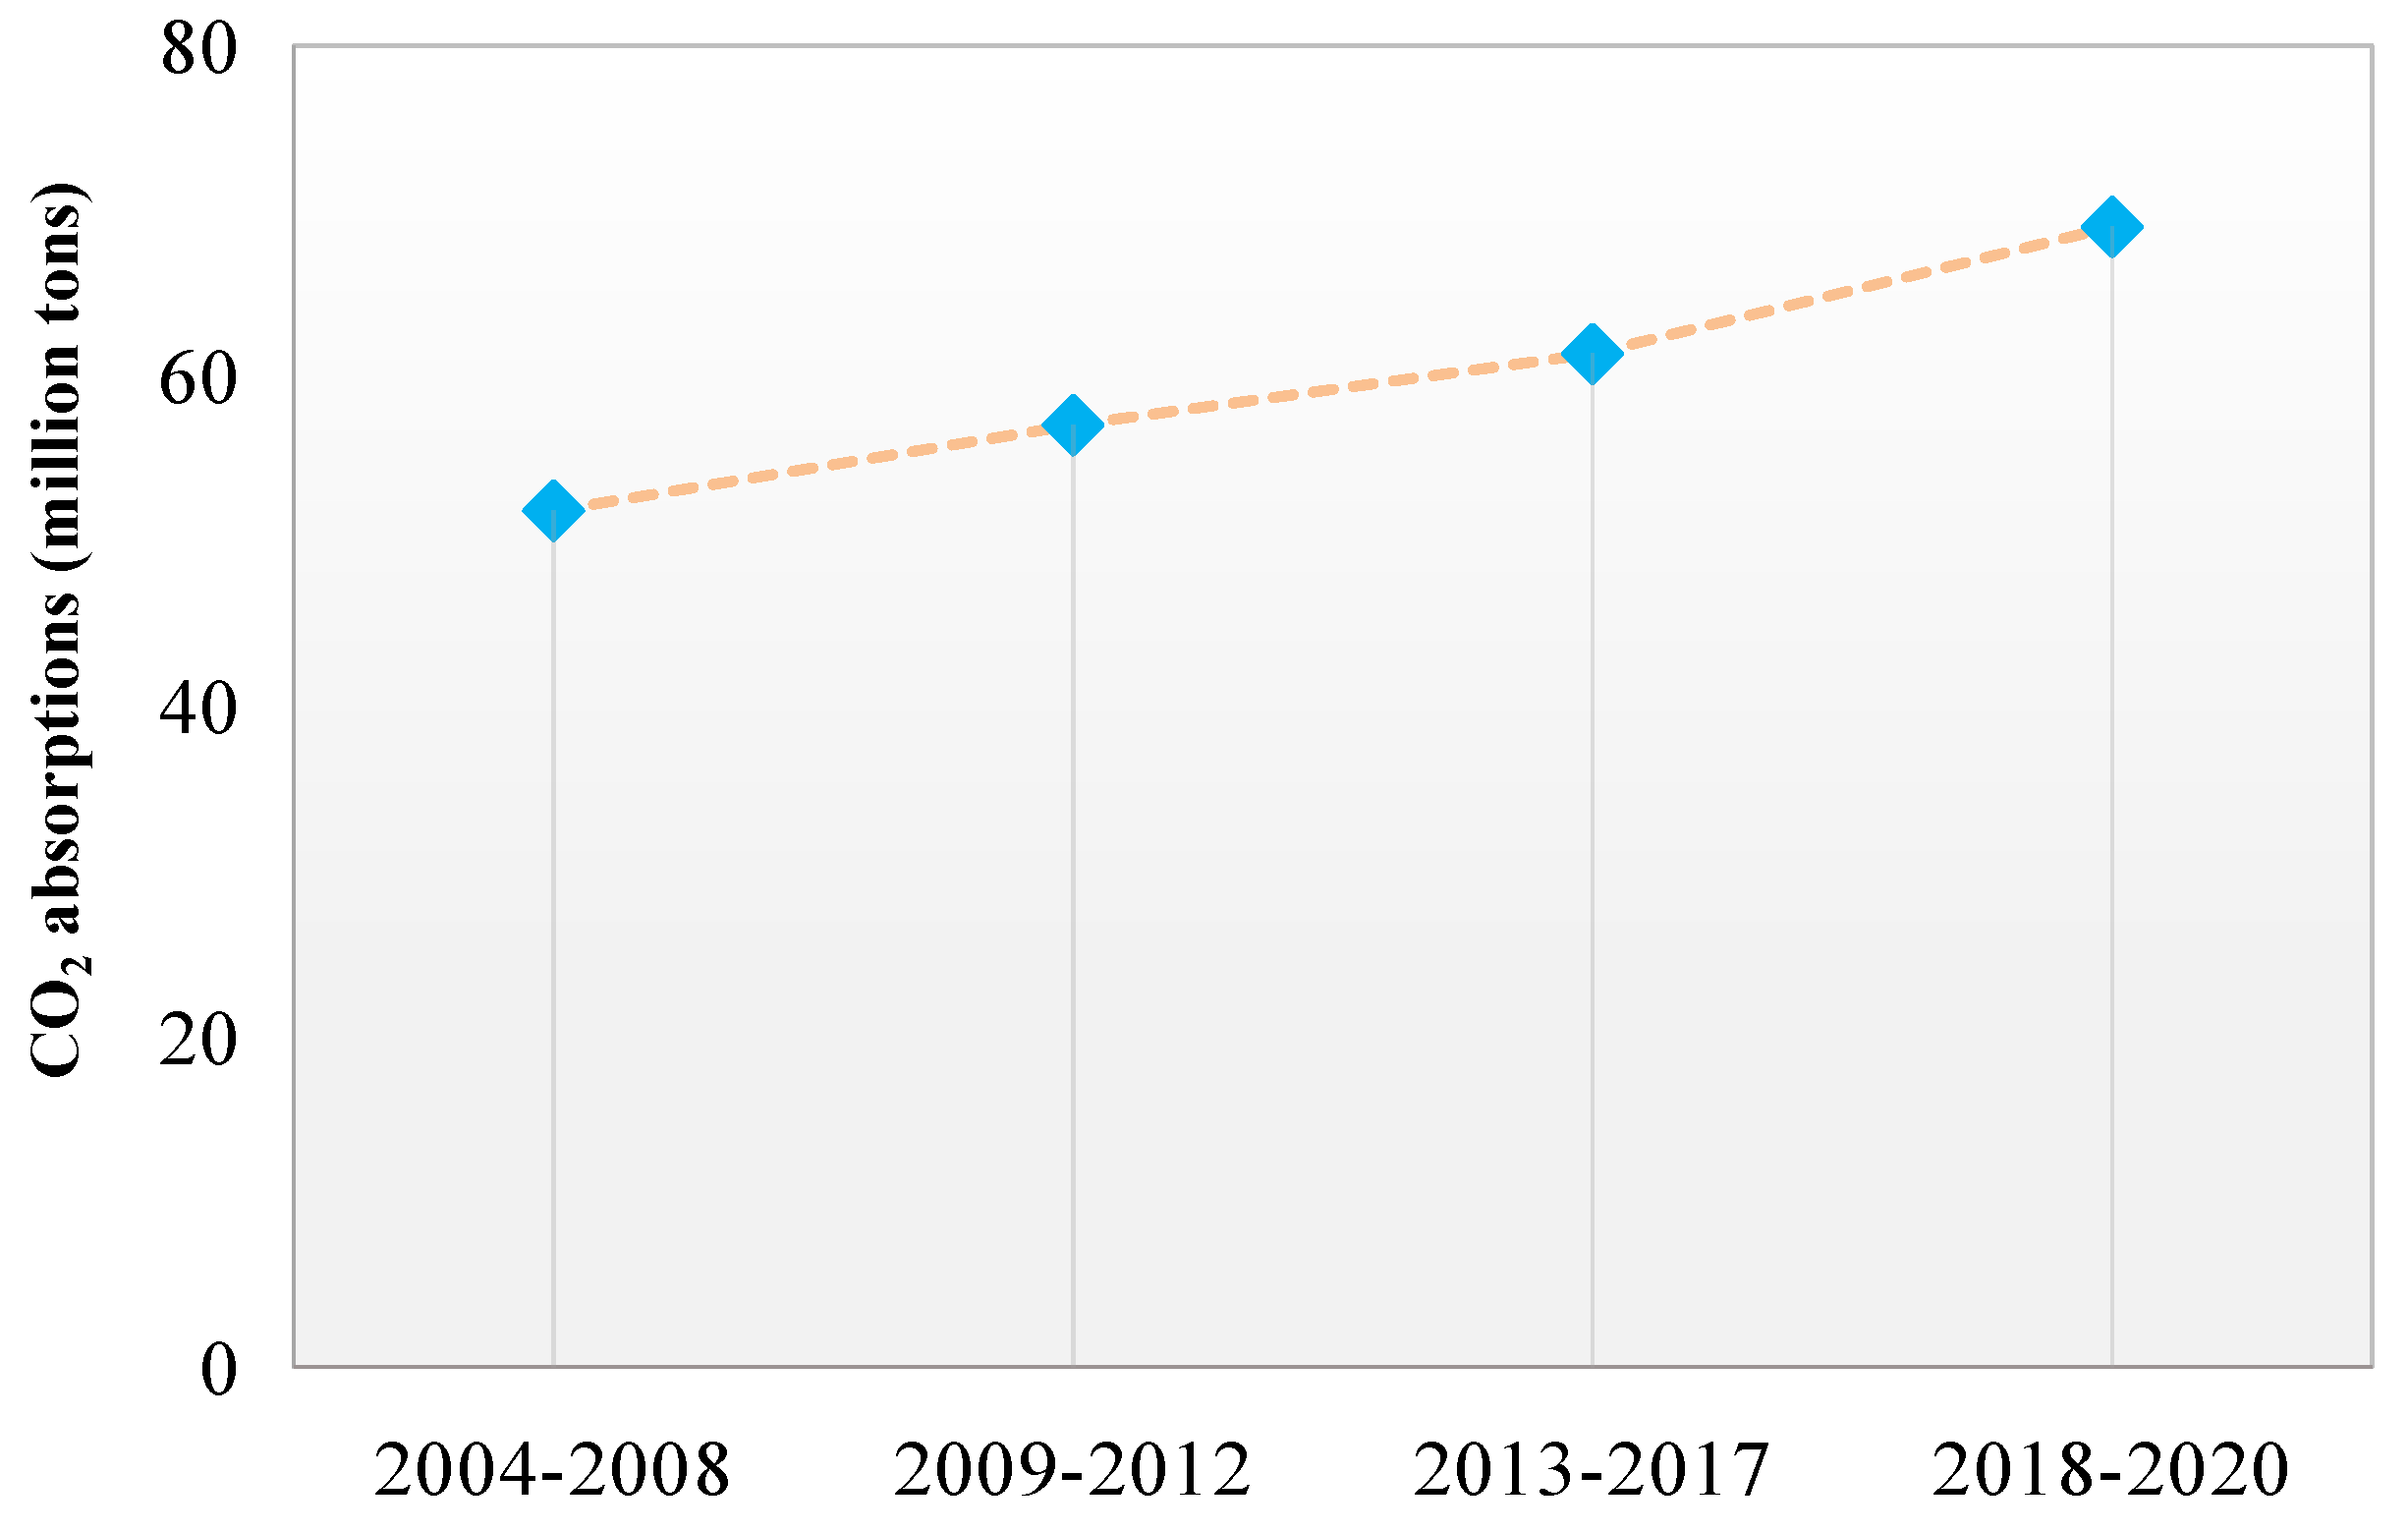
3.3. CO2 Absorption by Ecosystem

3.3.1. CO2 Absorption from the Farmland Ecosystem

Heilongjiang Province is an important grain-producing province. The farmland ecosystem is a significant carbon sink with a higher capacity. The overall carbon dioxide absorption has increased rapidly since 2004. The amount of absorption reached 343.91 million tons in 2019. Compared to Yunnan, the absorption was more than an order of magnitude higher than that of Yunnan province (20.31 million tons) in 2015 [10]. Hence, Heilongjiang Province would provide a considerable regional carbon sink.
In terms of crop types, the planting area and production of corn in Heilongjiang Province rank first in China, and the total CO2 absorption of corn accounts for 49.92% of the total farmland absorption in 2019. Rice is the second-largest contributor to CO2 absorption according to crop types, accounting for about 36.79% of the absorption. Beans absorbed about 12% of CO2 in the farmland sector, while other crops (vegetables, fruits, grains, etc.) absorbed 2.56% of the total. In the southwest region of China, absorption of corn are higher than those of rice. For instance, rice contributed to 41% and 33% of the total CO2 absorption in Yunnan and Chongqing, respectively, which were higher than those of corn (39% in Yunnan, 25.42% in Chongqing) [10,11].
Before 1997, the absorption in Qiqihar, Heihe, and Suihua was much higher than in other cities in Heilongjiang Province. Then, the absorption of Harbin increased rapidly, contributing to 15.91% of total absorption and ranking first in 2019; Qiqihar ranked second, and the proportion of total absorption was 15.43%, followed by Jiamusi (10%), Daqing (8%), etc.

3.3.2. CO2 Absorption from Living Wood

Living wood refers to the trees, scattered wood, and sparse forest trees. The net absorption of CO2 by living wood in Heilongjiang Province increased gradually, with a growth rate of about 10% (Figure 8). The annual absorption was 69.3 million tons.

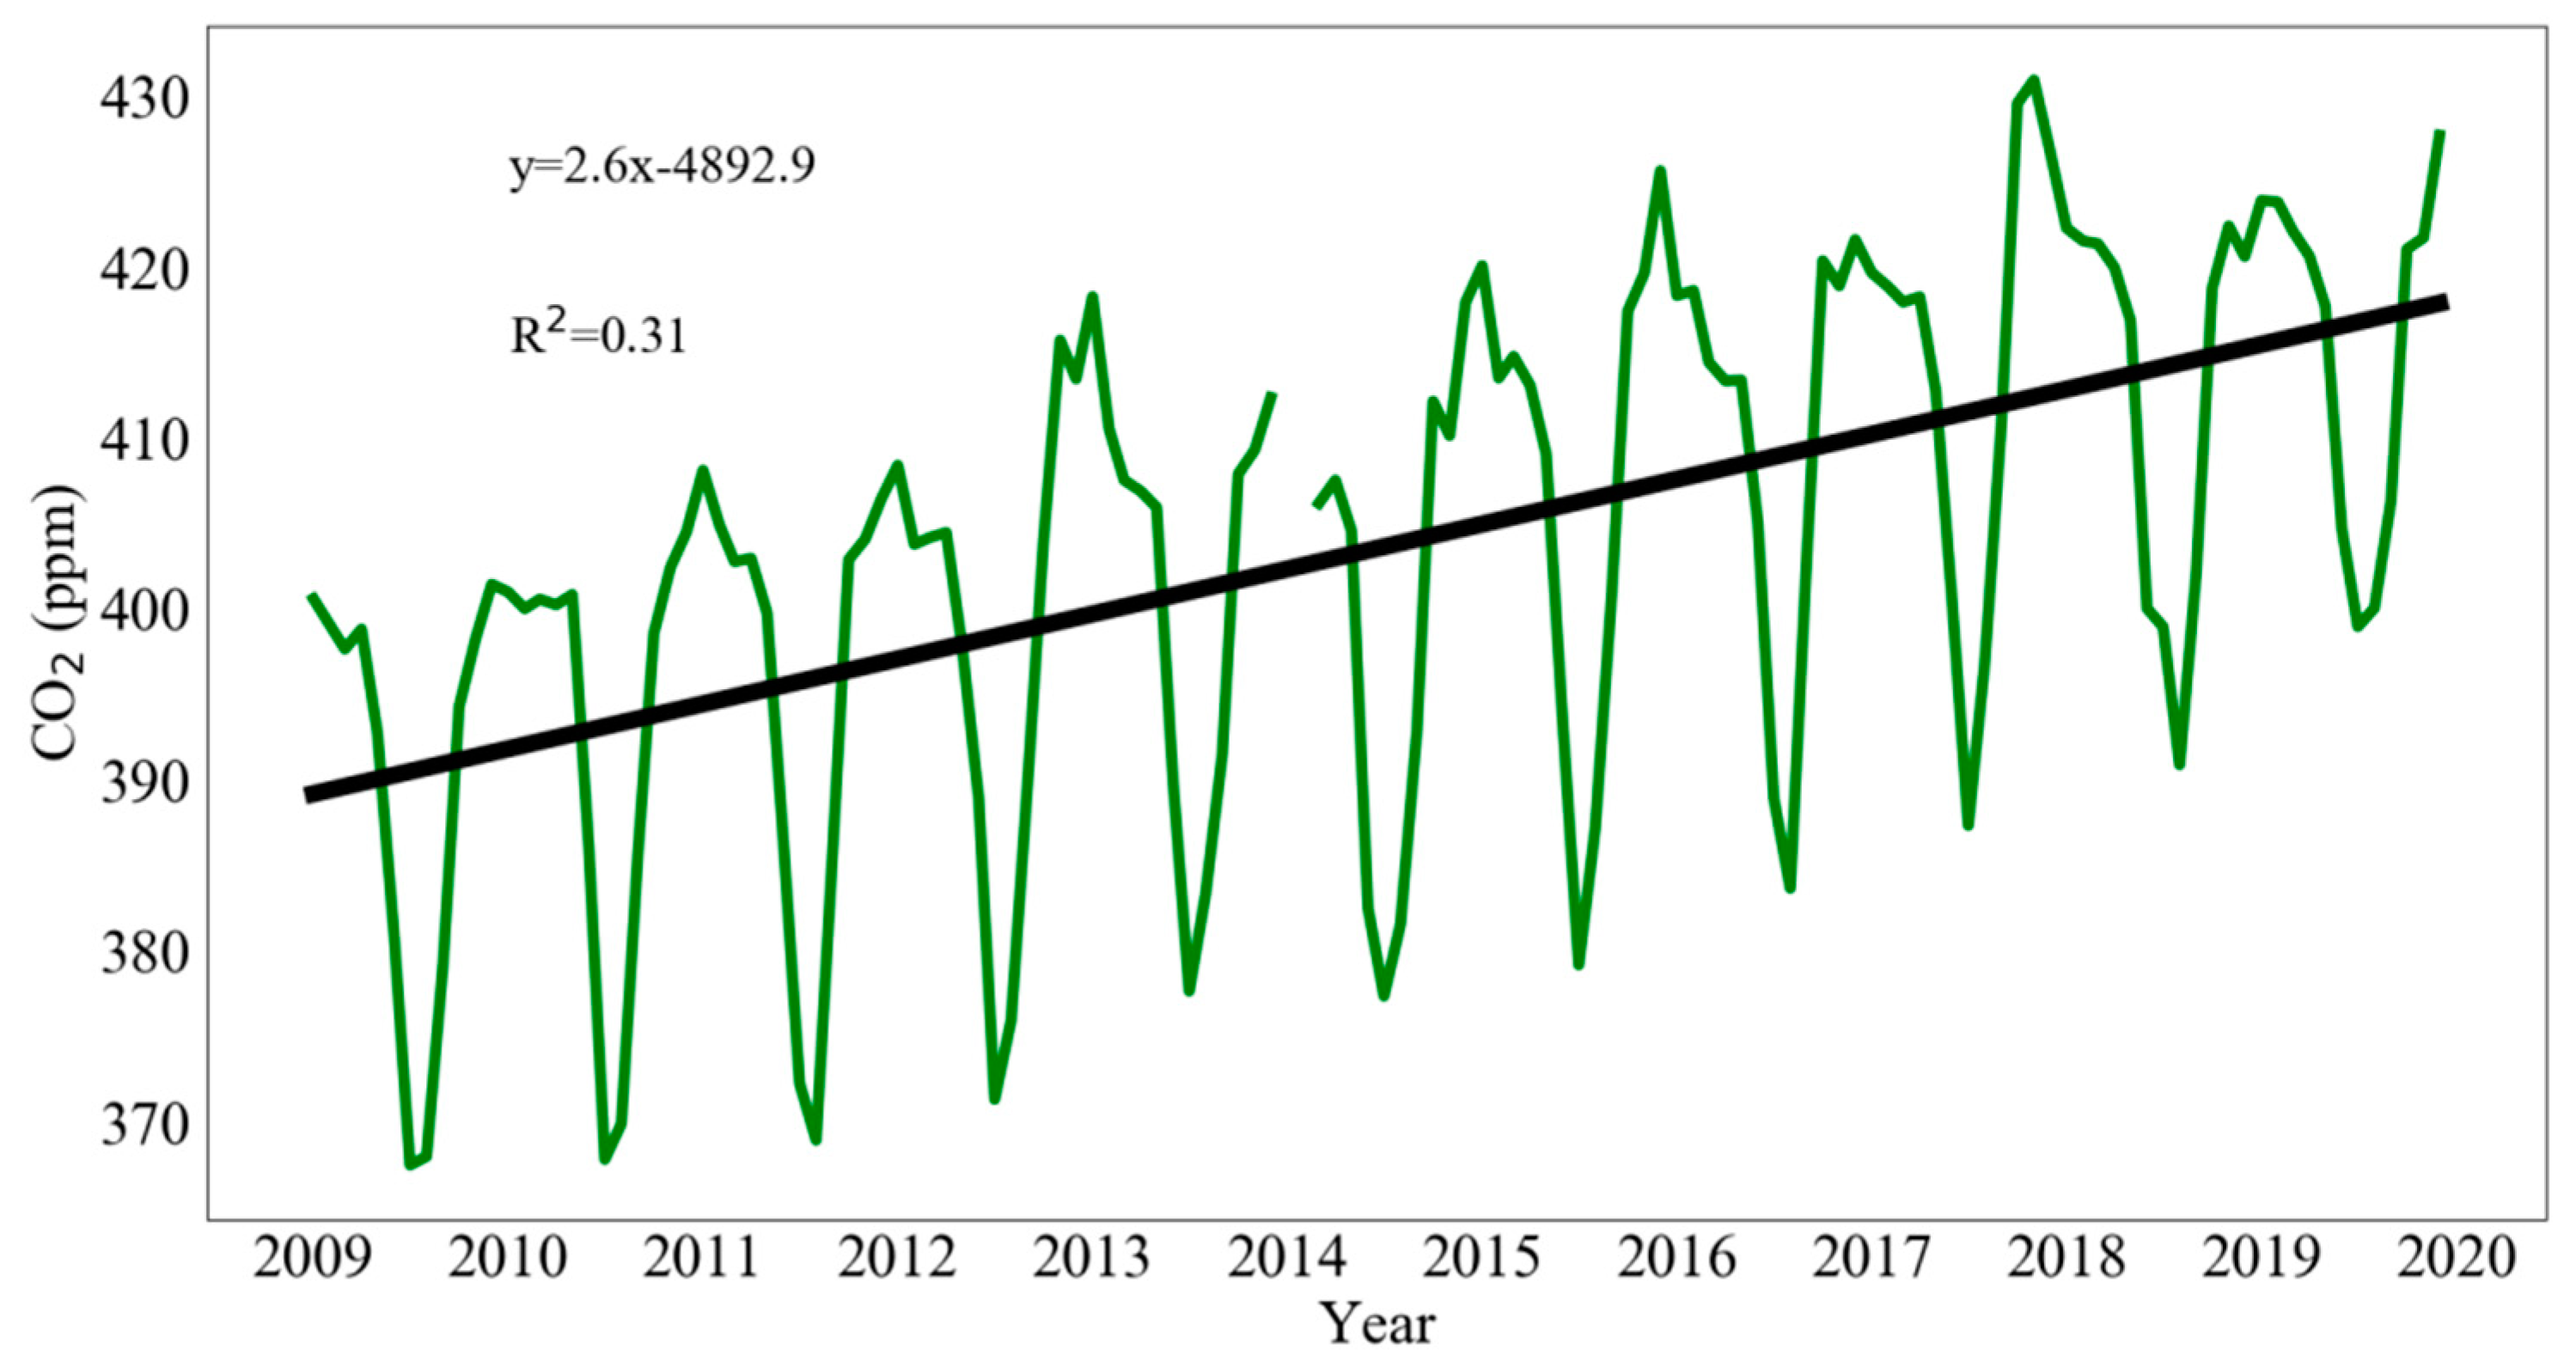
3.4. Impacts on Ambient CO2

Monthly CO2 mixing ratios of the in situ measurements at Longfengshan Background Station (44.73 N, 127.6 E, 331 a.s.l.) in Heilongjiang Province, which is the only WMO/GAW station in the northeastern China plain, observing atmospheric greenhouse gases. The atmospheric CO2 mole fractions were continuously measured by a Cavity Ring Down Spectrometer (CRDS; Picarro Inc., Santa Clara, CA, USA) [1]. A robust local regression mathematical method was applied to distinguish the mixing ratio in the background and polluted conditions [29]. The long-term trend was estimated based on a linear curve fitting the CO2 background mixing ratios.
The annual means of CO2 concentrations rose gradually (Figure 9). Peaks appeared in winters, influenced by increased energy consumption for power generation, heating, and industrial boilers. Moreover, trees lose their leaves, and agriculture in the field ceases. Valley values appeared in the summers. In the summer, energy consumption is much lower than in the winter, and all trees and crops help to absorb CO2. The diurnal amplitude at Longfengshan Background Station is 50.6 ± 7.0 ppm in summer, which is the largest value among the four WMO/GAW stations in China [7].

4. Conclusions

This study focused on quantifying CO2 emissions and environmental characteristics behaviors in the coldest region of China. The results provide valuable insights into the specialized structure of energy consumption in the cold region, where the industrial sector, thermal power generation, and heating were identified as the dominant emission sectors. Long winters in the region resulted in a large amount of CO2 emissions, which were primarily influenced by the heating sector and farmland ecosystem. Emissions of cities were distinct according to the driving forces of energy, population, agriculture and natural emission sources.
This study highlighted the importance of national and regional air pollution control strategies in mitigating CO2 emissions. The city of Harbin in Heilongjiang Province has successfully reduced CO2 emissions by replacing smaller heating boilers with more efficient and cleaner technologies. However, coal consumption remains a significant contributor to the increase in CO2 emissions in recent years, necessitating the adoption of advanced technologies for CO2 emission control and the use of clean alternative energies to resolve bottleneck issues in the near future.
This study also found that GDP and population were significant driving forces affecting CO2 emissions, with carbon intensity applied to CO2 emissions per unit GDP reducing over time. However, per capita emissions continued to show an upward trend despite stable total carbon emissions, primarily due to a decline in population.
Overall, this study provides valuable insights into the city-level CO2 emissions and sheds light on the investigation of the proper methods to compile city-level emissions in cold regions to better understand the environmental behaviors of greenhouse gases and CO2 emissions. It underscores the need for continued research on city-level scaled emission inventory and model reliability analysis to facilitate more efficient ways of mitigating climate change [5,30,31,32]. Additionally, the adoption of advanced technologies for CO2 emission control and clean alternative energies is essential to achieve long-term sustainable development goals [33,34,35].

Supplementary Materials

The following supporting information can be downloaded at: https://www.mdpi.com/article/10.3390/pr11051336/s1, Figure S1: Correlation of CO2 emissions compared to previous studies; Table S1: Ratios of upper and lower emission factors; Figure S2: Sensitivity analysis of CO2 emissions.

Author Contributions

Writing—original draft preparation, W.S.; writing—review and editing, W.S., R.C., Y.Z. and M.W.; Investigation, W.Y., M.W. and C.L.; Data curation, Z.Z., R.C., X.W., M.L. and D.Y.; Methodology, Z.Z., W.Y. and Z.G.; Supervision, W.S. and D.Y.; conceptualization, Y.Z.; formal analysis, X.W. All authors have read and agreed to the published version of the manuscript.

Funding

This research was funded by the National Natural Science Foundation of China (51778181), and Open Project of State Key Laboratory of Urban Water Resource and Environment, Harbin Institute of Technology (No. ES201908).

Data Availability Statement

Not applicable.

Conflicts of Interest

The authors declare no conflict of interest.

References

  1. Fang, S.; Luan, T.; Zhang, G.; Wu, Y.; Yu, D. The determination of regional CO2 mole fractions at the Longfengshan WMO/GAW station: A comparison of four data filtering approaches. Atmos. Environ. 2015, 116, 36–43. [Google Scholar] [CrossRef]
  2. IPCC. AR6 Report: Climate Change 2022: Impacts, Adaptation and Vulnerability. 2022. Available online: https://www.ipcc.ch/report/sixth-assessment-report-working-group-ii/ (accessed on 1 April 2023).
  3. Shan, Y.; Guan, D.; Zheng, H.; Ou, J.; Li, Y.; Meng, J.; Mi, Z.; Liu, Z.; Zhang, Q. China CO2 emission accounts 1997–2015. Sci. Data 2018, 5, 170201. [Google Scholar] [CrossRef] [PubMed]
  4. IPCC. Summary for Policymakers. In Climate Change 2014: Mitigation of Climate Change. Contribution of Working Group III to the Fifth Assessment Report of the Intergovernmental Panel on Climate Change; Edenhofer, O., Pichs-Madruga, R., Sokona, Y., Farahani, E., Kadner, S., Seyboth, K., Adler, A., Baum, I., Brunner, S., Eickemeier, P., et al., Eds.; Cambridge University Press: Cambridge, UK; New York, NY, USA, 2014. [Google Scholar]
  5. Han, P.; Zeng, N.; Oda, T.; Zhang, W.; Lin, X.; Liu, D.; Cai, Q.; Ma, X.; Meng, W.; Wang, G.; et al. A city-level comparison of fossil-fuel and industry processes-induced CO2 emissions over the Beijing-Tianjin-Hebei region from eight emission inventories. Carbon Balance Manag. 2020, 15, 25. [Google Scholar] [CrossRef] [PubMed]
  6. Yu, W.; Pagani, R.; Huang, L. CO2 emission inventories for Chinese cities in highly urbanized areas compared with European cities. Energy Policy 2012, 47, 298–308. [Google Scholar] [CrossRef]
  7. Mi, Z.; Zhang, Y.; Guan, D.; Shan, Y.; Liu, Z.; Cong, R.; Yuan, X.-C.; Wei, Y.-M. Consumption-based emission accounting for Chinese cities. Appl. Energy 2016, 184, 1073–1081. [Google Scholar] [CrossRef]
  8. 2006 IPCC Guidelines for National Greenhouse Gas Inventories. Available online: https://www.ipcc.ch/report/2006-ipcc-guidelines-for-national-greenhouse-gas-inventories/ (accessed on 1 April 2023).
  9. Cui, C.; Li, S.; Zhao, W.; Liu, B.; Shan, Y.; Guan, D. Energy-Related CO2 Emission Accounts and Datasets for 40 Emerging Economies in 2010–2019. Earth Syst. Sci. Data 2023, 15, 1317–1328. [Google Scholar] [CrossRef]
  10. Li, M.; Liu, S.; Wu, X.; Sun, Y.; Hou, X.; Zhao, S. Temporal and spatial dynamics in the carbon footprint and its influencing factors of farmland ecosystems in Yunnan Province. Acta Ecol. Sin. 2018, 38, 8822–8834. [Google Scholar]
  11. Hang, X.; Zhang, J.; Hu, L.; Luo, J.; Ma, L.; Liao, D. Analysis of Carbon Footprints in Farmland Ecosystem of Chongqing City 2006–2015; Chongqing Academy of Agricultural Sciences: Chongqing, China, 2018; p. 401329. [Google Scholar]
  12. Heilongjiang Province Statistical Yearbook. Available online: http://tjj.hlj.gov.cn/tjj/c106782/common_zfxxgk.shtml (accessed on 1 April 2023).
  13. National Statistical Yearbook of China. Available online: http://www.stats.gov.cn/tjsj/ndsj (accessed on 1 April 2023).
  14. Intergovernmental Panel on Climate Change (IPCC). 2019 Refinement to the 2006 IPCC Guidelines for National Greenhouse Gas Inventories; Calvo Buendia, E., Tanabe, K., Kranjc, A., Baasansuren, J., Fukuda, M., Ngarize, S., Osako, A., Pyrozhenko, Y., Shermanau, P., Federici, S., Eds.; IPCC: Geneva, Switzerland, 2019; ISBN 978-4-88788-232-4. [Google Scholar]
  15. Lei, Y.; Zhang, Q.; Nielsen, C.; He, K. An Inventory of Primary Air Pollutants and CO2 Emissions from Cement Production in China, 1990–2020. Atmos. Environ. 2011, 45, 147–154. [Google Scholar] [CrossRef]
  16. Liu, Z.; Guan, D.; Wei, W.; Davis, S.J.; Ciais, P.; Bai, J.; Peng, S.; Zhang, Q.; Hubacek, K.; Marland, G.; et al. Reduced carbon emission estimates from fossil fuel combustion and cement production in China. Nature 2015, 524, 335–338. [Google Scholar] [CrossRef]
  17. Shan, Y.; Huang, Q.; Guan, D.; Hubacek, K. China CO2 emission accounts 2016–2017. Sci. Data 2020, 7, 54. [Google Scholar] [CrossRef]
  18. Dhakal, S. Urban energy use and carbon emissions from cities in China and policy implications. Energy Policy 2009, 37, 4208–4219. [Google Scholar] [CrossRef]
  19. Fang, C.; Wang, S.; Li, G. Changing urban forms and carbon dioxide emissions in China: A case study of 30 provincial capital cities. Appl. Energy 2015, 158, 519–531. [Google Scholar] [CrossRef]
  20. Hou, L. Study on Carbon Emissions of Wheat-Maize Rotation System under Multiple Perspectives—A Case of Shandong Province. Ph.D. Thesis, JLU (Jilin University), Changchun, China, 2022. [Google Scholar]
  21. Guotong, Q.; Fei, C.; Na, W.; Dandan, Z. Inter-Annual Variation Patterns in the Carbon Footprint of Farmland Ecosystems in Guangdong Province, China. Sci. Rep. 2022, 12, 14134. [Google Scholar] [CrossRef]
  22. Liu, J.; Zhong, Y.; Jia, X.; Yan, W.; Cao, J.; Shangguan, Z. Wheat Straw Decomposition Patterns and Control Factors Under Nitrogen Fertilization. J. Soil Sci. Plant Nutr. 2021, 21, 3110–3121. [Google Scholar] [CrossRef]
  23. Lu, F.; Wang, X.; Han, B. Assessment on the availability of nitrogen fertilization in improving carbon sequestration potensial of China’s cropland soil. Chin. J. Appl. Ecol. 2008, 19, 2239–2250. [Google Scholar]
  24. Wang, Y.; Sun, D.; Li, Z.; Wu, Y. Study on Relationship of Root Morphological Characters and Yeild Formation in Different Sorghum Varietie. Hortic. Seed 2011, 84–86. [Google Scholar]
  25. Huang, W.; Jiang, W.; Yao, Y.; Song, X.; Wu, G.; Yuan, H.; Ren, C.; Sun, Z.; Wu, J.; Kang, Q. Effects of Low Potassium Stress on Growth and Development of Flax. Plant Fiber Sci. China 2020, 42, 273–282. (In Chinese) [Google Scholar]
  26. Liebig, M.A.; Gross, J.R.; Kronberg, S.L.; Phillips, R.L. Grazing management contributions to net global warming potential: A long-term evaluation in the Northern Great Plains. J. Environ. Qual. 2010, 39, 799–809. [Google Scholar] [CrossRef] [PubMed]
  27. Chen, C.; Zhao, T.; Yuan, R.; Kong, Y. A Spatial-Temporal Decomposition Analysis of China’s Carbon Intensity from the Economic Perspective. J. Clean. Prod. 2019, 215, 557–569. [Google Scholar] [CrossRef]
  28. Tian, Z.; Ma, X.; Liu, R. Interannual Variations of the Carbon Footprint and Carbon Eco-Efficiency in Agro-Ecosystem of Beijing, China. J. Agric. Resour. Environ. 2015, 32, 10. [Google Scholar]
  29. Ruckstuhl, A.F.; Henne, S.; Reimann, S.; Steinbacher, M.; Vollmer, M.K.; O’Doherty, S.; Buchmann, B.; Hueglin, C. Robust extraction of baseline signal of atmospheric trace species using local regression. Atmos. Meas. Tech. 2012, 5, 2613–2624. [Google Scholar] [CrossRef]
  30. Saikawa, E.; Kim, H.; Zhong, M.; Avramov, A.; Zhao, Y.; Janssens-Maenhout, G.; Kurokawa, J.; Klimont, Z.; Wagner, F.; Naik, V.; et al. Comparison of emissions inventories of anthropogenic air pollutants and greenhouse gases in China. Atmos. Chem. Phys. 2017, 17, 6393–6421. [Google Scholar] [CrossRef]
  31. Tao, M.; Cai, Z.; Che, K.; Liu, Y.; Yang, D.; Wu, L.; Wang, P.; Yang, M. Cross-Inventory Uncertainty Analysis of Fossil Fuel CO2 Emissions for Prefecture-Level Cities in Shandong Province. Atmosphere 2022, 13, 1474. [Google Scholar] [CrossRef]
  32. Yang, E.G.; Kort, E.A.; Wu, D.; Lin, J.C.; Oda, T.; Ye, X.; Lauvaux, T. Using Space-Based Observations and Lagrangian Modeling to Evaluate Urban Carbon Dioxide Emissions in the Middle East. JGR Atmos. 2020, 125, e2019JD031922. [Google Scholar] [CrossRef] [PubMed]
  33. Ayomikun, B.; Anastasia, I.; Alexey, C. A Comprehensive Review of the Role of CO2 Foam EOR in the Reduction of Carbon Footprint in the Petroleum Industry. Energies 2023, 16, 1167. [Google Scholar] [CrossRef]
  34. Fetisov, V.; Gonopolsky, A.M.; Zemenkova, M.Y.; Andrey, S.; Davardoost, H.; Mohammadi, A.H.; Riazi, M. On the Integration of CO2 Capture Technologies for an Oil Refinery. Energies 2023, 16, 865. [Google Scholar] [CrossRef]
  35. Gładysz, P.; Strojny, M.; Bartela, L.; Hacaga, M.; Froehlich, T. Merging Climate Action with Energy Security through CCS—A Multi-Disciplinary Framework for Assessment. Energies 2022, 16, 35. [Google Scholar] [CrossRef]
Figure 1. Source classification of CO2 emissions in Heilongjiang Province.
Processes 11 01336 g001
Figure 2. Total CO2 emissions by sectors from 1995 to 2019 in Heilongjiang Province.
Processes 11 01336 g002
Figure 3. Total energy-related CO2 emissions in Heilongjiang Province.
Processes 11 01336 g003
Figure 4. Variations of the CO2 emissions in Heilongjiang Province by sector.
Processes 11 01336 g004aProcesses 11 01336 g004b
Figure 5. Effects of driving forces on CO2 emissions (population, energy intensity, carbon intensity).
Processes 11 01336 g005
Figure 6. Variations of the city-level CO2 emissions in 1995, 2000, 2005, 2010, 2015, and 2019 (unit: million tons).
Processes 11 01336 g006
Figure 7. Comparisons of CO2 emissions to other cities, 2010.
Processes 11 01336 g007
Figure 8. The CO2 absorption by living wood (2004–2020).
Processes 11 01336 g008
Figure 9. Monthly CO2 concentrations in Heilongjiang Province (2009–2019).
Processes 11 01336 g009
Table 1. Emission factors for sectors.
SectorsEmission FactorsUnits
Coal0.491 [16]tCO2/ton
Oil0.838 [16]tCO2/ton
Natural gas0.590 [16]tCO2/thousand m3
Cement0.074 [16]tCO2/ton
Iron0.04 [8]tCO2/ton
Fertilizer0.89 [10,11]tCO2/ton
Pesticide4.93 [10,11]tCO2/ton
Farm films5.18 [10,11]tCO2/ton
Machinery0.18 [10,11]kg/kW
Irritation266.48 [10,11]kg/hm2
Disclaimer/Publisher’s Note: The statements, opinions and data contained in all publications are solely those of the individual author(s) and contributor(s) and not of MDPI and/or the editor(s). MDPI and/or the editor(s) disclaim responsibility for any injury to people or property resulting from any ideas, methods, instructions or products referred to in the content.

