1. Introduction
Fluidic oscillators have been widely applied in aerospace, chemistry, cleaning, etc. In recent years, fluidic oscillators have been used as a flow control actuator to delay flow separation and increase the side force in the aerospace field because they can convert steady-state inflow into sweeping outflow without any driving component [
1,
2,
3,
4,
5]. Jones et al. [
6] compared the performance of the fluidic oscillator and the conventional jet actuator in the separation control regime at a maximum Reynolds number of 30 × 10
6. They found that, for the 30° flap high-lift configuration, the fluidic oscillator can reduce the mass flow by 54% while achieving the same performance as the conventional jet actuator. Pandit and Ranade [
7] evaluated the fluidic oscillator as a continuous crystallizer to improve product consistency and reduce labor costs. They reported that, compared with batch crystallizers, the use of the fluidic oscillator can reduce the process times, enhance mixing performance, and improve scalability, but the most common daily use of the fluidic oscillator is as a windshield washer fluid nozzle [
8,
9].
Depending on the internal geometry and the oscillation mechanism, fluidic oscillators are mainly divided into two types: the feedback-type fluidic oscillator and the feedback-free fluidic oscillator. The feedback-type fluidic oscillator consists of two feedback paths connecting the inlet and outlet of the oscillation chamber. Many researchers have studied the oscillation mechanism and the performance of the feedback-type fluidic oscillator. Bobusch et al. [
10] experimentally investigated the internal flow characteristics of an enlarged feedback-type fluidic oscillator by using particle image velocimetry (PIV) and proper orthogonal decomposition technology. They found that the oscillation is not solely based on the momentum exerted from the feedback channel flow but mainly on the growing separation bubble that is filled with this flow. Xie [
11] used the high-speed Schlieren technology and the Malvern particle size analyzer to investigate the influence of injection pressure on the spray characteristics of a feedback-type fluidic oscillator, including the spray sweep angle, oscillation frequency, volume flow rate, and the spray parcel size. Researchers revealed that the periodic establishing and vanishing of the pressure gradient, and the Coanda effect, are the main causes of the oscillation phenomenon [
11,
12].
The basic principle of the feedback-free fluidic oscillator is the unsteady interaction of two jets within a cavity without feedback channels, which leads to a periodically sweeping spray [
8]. The feedback-free fluidic oscillator used in this paper includes two inlet paths and an impact cavity. To investigate the details of the jet interaction behavior, several researchers [
13,
14,
15,
16] used experimental and numerical approaches to visualize the internal flow field of the fluidic oscillator. Due to the special structure of the impact cavity, several periodic vortices are generated when the fluid, respectively, enters the impact cavity through the two inlet paths. These vortices drive the jets to switch periodically, forming an oscillation spray without external interference. Tomac and Gregory [
17,
18,
19] measured the internal flow of the fluidic oscillator using PIV and the results demonstrated that the causes of jet sweeping are different for different Reynolds Numbers and flow rates. In the low-speed flow zone (Re < 1500), the oscillation behavior is caused by the complex combination of jet interaction and bifurcation, eddy-shear layer interaction, and eddy-wall interaction. In the transition zone (1500 < Re < 2000), the dome vortex plays an important role in the kinetic energy transfer mechanism in the oscillator through jet bifurcation. In the high-speed flow zone (Re > 2000), the formation and position of the internal saddle point are directly related to the external sweep angle of the jet. The numerical method can elaborate the mechanism from a wider range of perspectives. Wu [
20] presented a 3D CFD simulation to analyze the oscillation mechanism and its influence on spray oscillation behaviors. The results indicated that the periodic growth and merger of vortices lead to a periodic inversion of the pressure gradient between the left and right of the impact chamber, resulting in the oscillation behavior of the main jet.
As for the spray characteristics of the feedback-free fluidic oscillator, researchers [
21,
22] usually focus on the sweep angle, oscillation frequency, and volume flow rate. Wu [
20] found a bi-model spray spatial flow distribution with varying oscillation frequency and a constant sweep angle. The spray characteristics are dictated by the geometry of the oscillator, whether it is a feedback-type fluidic oscillator or a feedback-free fluidic oscillator [
23,
24,
25]. Reichenzer [
26] found that the oscillation frequency was sensitive to the angle of the inlets and the distance between the inlets by using optical schlieren experiments and 2D CFD simulations. Bidadi, Heister, and Matsutomi [
22] analyzed the difference between the 2D model and the 3D model, which indicated the thickness of the impact chamber has a great influence on the flow in the oscillator. Jhaveri [
27] found that the oscillation frequency is affected by the variation of the geometry of the impact chamber and the width of the outlet, and the driving pressures of the feedback-free fluidic oscillators with different geometry are also different. Concretely, the cavity exit width and the shoulder length have the most effect on performance characteristics, and the length of the cavity exit affects the width of the jet but does not influence others. Tomac and Gregory [
28] used experimental and numerical methods to understand the effects of scaling on fluidic oscillation performance of the feedback-free fluidic oscillator. The results show that the frequency is not only influenced by the flow rate, but also by the oscillator geometry and test fluid. However, they did not explain the mechanism of the effect of geometry on the spray characteristics. Synthesizing the above literature, the influence mechanism of oscillator geometry on spray characteristics is crucial to the design of oscillators, and this has not yet been fully revealed. In order to understand the mechanism of oscillator geometry on spray characteristics, the analysis of the internal flow field is essential.
In this study, a numerical model validated by the experimental results was established to analyze the oscillation mechanism and investigate the effects of some key inner structural parameters on the internal flow and spray characteristics. The experimental results under different pressures, including the spray morphology, sweep angle, oscillation frequency, and volume flow rate, were, respectively, measured to gain an insight into the spray characteristics of the feedback-free fluidic oscillator. The objective is to establish a link among the oscillator geometry, the internal flow pattern, and the spray characteristics, as well as to understand the basic fluid dynamics of fluidic oscillators, which will provide a theoretical basis for future oscillator designs.
2. Materials and Methods
2.1. Experimental Method
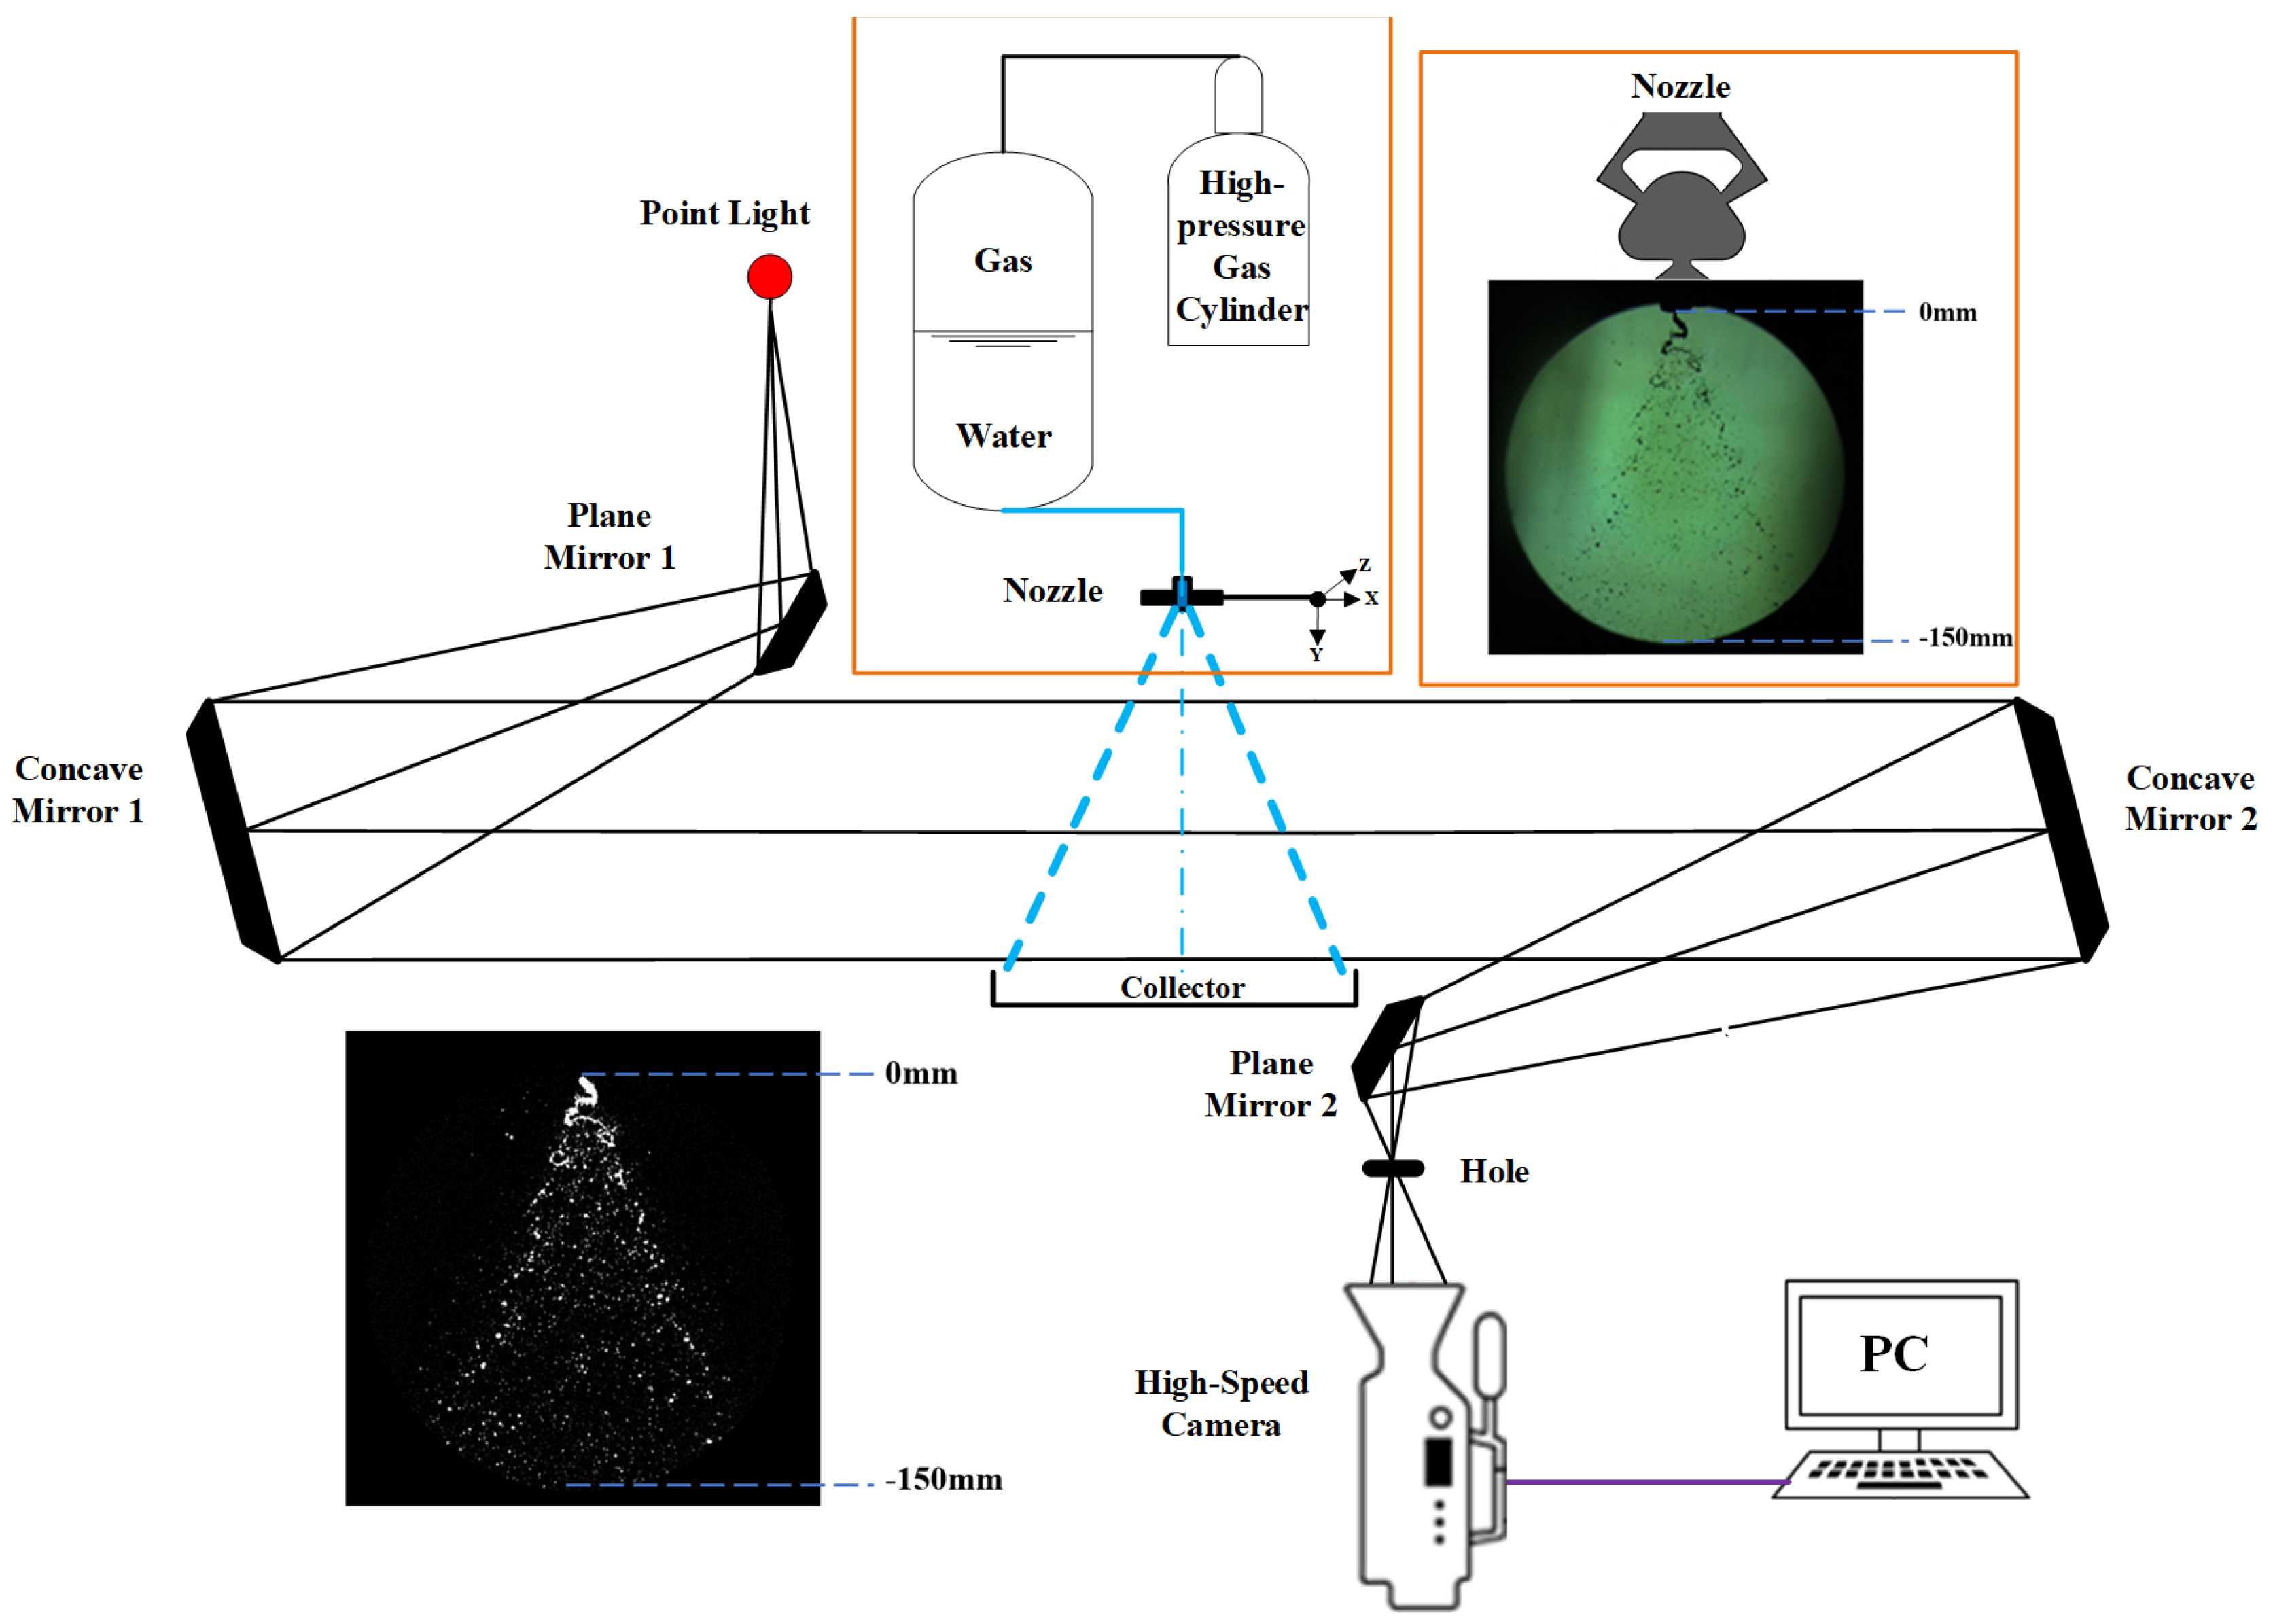
The high-speed Schlieren system with a frame rate of 10,000 fps was used to measure the spray morphology and oscillation frequency. The high-speed Schlieren system and injection system are depicted in
Figure 1. The injection system consists of a high-pressure gas cylinder and a pressurized water cylinder. The working pressure of the oscillation is 0.16 MPa, and a wider injection pressure from 0.12 MPa to 0.22 MPa has been considered in the experiments. The boundary of the spray is captured by the Schlieren method based on the density difference between the spray and the air, which can capture the parcels boundary more distinctly than the shadowgraph method. The spray sweep angle and oscillation frequency can be obtained by the post-processing of the high-speed camera images. The measurement of volume flow rate would not start until the spray pattern was stable, and the injection duration was set to 30 s. More configuration information and operation principles of the experimental systems can be found in our recently published paper [
11].
The oscillator position and the typical spray images are shown in the upper-right of
Figure 1. The post-processed image is shown in the bottom-left of
Figure 1, which was obtained by the image processing method including background subtraction, binarization, and reverse colors. The spray velocity, spray sweep angle, and spray oscillation frequency can be obtained according to the Schlieren imaging results.
Figure 2a shows the 3D shape of the feedback-free fluidic oscillator. The working fluid enters from the nozzle inlet and flows into two inlet paths before entering the impact cavity, where two jets interfere with each other, resulting in an oscillation jet flowing out. The oscillator structures are depicted in
Figure 2b. The sharp corners in the inlet paths are for processing convenience, which are far from the impact chamber and have no effect on the flow inside it. The oscillator thickness is 0.8 mm, the cavity exit width is 0.65 mm, the radius of the cavity shoulder is 0.88 mm, and other geometrical dimensions of the oscillator are shown in
Figure 2c.
2.2. Numerical Method
The inner structure of the feedback-free fluidic oscillator is complex, containing many curved surfaces; therefore, unstructured grids were used for the internal flow field simulation, as shown in
Figure 3a. The standard wall functions method was used for the near-wall treatment [
23]. The smallest cell size was set to comply with the Taylor microscale [
29], and the Taylor microscale is about 0.04 mm, in our case. The minimum was set to 0.04 mm at the near-wall flow region and the maximum grid size was set to 0.1 mm.
A hybrid mesh scheme was used in the external computational domain, which can get a better resolution for liquid phase distribution. As shown in
Figure 3b, unstructured tetrahedral grids were adopted for the position close to the nozzle outlet, where the minimum grid size was 0.1 mm and the maximum was 2.5 mm, while structured hexahedral grids were adopted for the region far away from the nozzle outlet, where the grid size was set to 2.5 mm. In order to reduce the influence of the prominent geometry change close to the nozzle inlet, an additional flow path was added to the nozzle inlet. The grid size of this section was set to 0.1 mm and the total length was 10 mm. The total grid number of the computation domain was 1.1 million. The grid dependence test has been accomplished in our previous work, which will not be introduced in this paper [
20].
The entire computational domain contains the flow field mesh inside and outside the oscillator. To observe the complete spray pattern, the external computational domain was set to 250 mm × 210 mm × 70 mm, as depicted in
Figure 4a. The origin of the coordinate system of the entire computational domain was located at the centre of the nozzle outlet. The boundary conditions are demonstrated in
Figure 4b. The inlet was set as pressure inlet, the outlet was set as atmospheric pressure outlet, and the boundary near the oscillator was set as wall boundary.
ANSYS-Fluent was used for this calculation. The Volume of Fraction (VOF) method was used to simulate the two-phase flow (air and water) by solving the momentum equation and the volume fraction of different components separately. The realizable k-epsilon model, which is commonly used in the study of fluidic oscillators, was selected for the calculation to improve the computational stability and solution accuracy [
23,
30,
31]. The computational domain of the internal flow field was initialized with water, while the external computational domain was set with air at 0.1 MPa. The experimentally measured spray oscillation frequency was 830 Hz. Therefore, the calculation time step was set to 0.01 ms (10,000 Hz) to ensure temporal accuracy. To observe a stable spray pattern in the external flow field, the maximum number of iterations for each calculation step was set to 20 and the total calculation step was set to 10,000.
2.3. Model Verification
To verify the credibility of the numerical model, the calculation results (i.e., spray sweep angle, spray oscillation frequency, and volume flow rate) were compared with experimental results. The volume fraction distribution of water phase was used to depict the numerical spray morphology with the threshold value of 0.002. The numerical results under different injection pressures were compared with the experimental results obtained by the high-speed Schlieren technique, as shown in
Figure 5. The experimental sweep angle was determined by an algorithm that analyzes the edge gradient. The spray oscillates between the left and right boundaries, similar to a pendulum.
The comparison of experimental and numerical results of some spray characteristics at different injection pressures is shown in
Figure 6. According to
Figure 6a, the injection pressure has no significant effect on the spray sweep angle. The maximum error between the experimental and numerical results is 2.16° when the injection pressure is 0.18 MPa, and the relative error rate is 4.7%. The average volume flow rate in a whole sweep period is taken as the volume flow rate. The comparison of the volume flow rate between the numerical and experimental results is shown in
Figure 6b. The volume flow rate increases with the increase in injection pressure. Due to the frictional loss along the pipeline, the actual injection pressure in the experiments is lower than the numerical inlet pressure, which might be the reason why the numerical results are slightly larger than the experimental results. The maximum error of the volume flow rate is 7.7%, which is less than 10%, indicating that the numerical model has adequate accuracy.
The monitoring point was set at the centre of the nozzle outlet (the origin of the coordinate system in
Figure 4) to obtain the flow velocity information. The spray sweep velocity is defined as the horizontal velocity component along the sweep direction (the x-direction in
Figure 4a). As shown in
Figure 6c, the variation of spray sweep velocity under different injection pressures is similar to a sinusoid. In order to eliminate the interference of time, the phase of the sweep velocity curve is used instead of time to describe the sweep period in the subsequent analysis. According to the definition of Tomac [
17], the first point where the velocity changes from negative to positive is defined as the 0° phase, and the first point where the velocity changes from positive to negative is set to the 180° phase, and the point at the centre position of the 0° and 180° phase is set to 90° phase. The rules for defining 270° and 360° are similar to those described above.
The time from 0° phase to 360° phase is defined as a sweep period
Tsw, and the spray oscillation frequency is defined as
f = 1/
Tsw.
Figure 6d shows the comparison of the spray oscillation frequency at different injection pressures. As the injection pressure increases, the sweep velocity increases and the sweep period becomes shorter, so the oscillation frequency increases. The numerical results are a little bit higher than the experimental results, but the maximum error of oscillation frequency is only 1.7%, which indicates an excellent consistency between numerical and experimental results.
3. Oscillation Mechanism Analysis
At the steady state, the velocity vector distribution and pressure distribution in the central section of the oscillator (XY plane, Z = 0) at different phases in half a cycle (0° to 180° phase) were extracted, and the results are shown in
Figure 7, respectively. The inlet pressure was set to 0.16 MPa (Re = 6500 at cavity exit), and the velocity vector distribution results are consistent with the PIV results measured by Tomac and Gregory [
19].
At the 0° phase, the spray is basically along the Y-axial direction and the main jet deflects to the right. As shown in
Figure 7a, the left jet and the right jet hit each other in the middle of the impact cavity, creating a high-pressure area that causes the left jet to deflect to the left. The vortex at the left shoulder is squeezed by the left jet, leading to higher pressure on the left shoulder than the right. Driven by the pressure difference, the main jet flows to the right at the exit of the impact cavity. However, due to the hysteresis of the working fluid flowing from the impact cavity exit to the external flow field, the velocity direction of the spray is determined by the flow state inside the impact cavity a certain time ago (about 0.05 ms). In other words, the current flow state of the inner flow field represents the subsequent sweep trend of the outer flow field. The flow direction at the impact cavity exit is shifted to the right at this phase moment, so the main jet of the outer flow field starts to deflect to the right.
At the 45° phase, as shown in
Figure 7b, the right jet squeezes the left jet to the left, making the left jet disconnected from the main jet. Part of the left jet continues to flow into the left shoulder, while the other part sinks into the right jet through the bottom, and the main jet is dominated by the right jet at this moment. The high-pressure area at the cut-off point makes the velocity direction of the right jet start to deflect from left to right. As shown in
Figure 7c, the dividing point between the left shoulder vortex and the main jet is defined as the hit point (HP), where the horizontal direction velocity is 0. The main jet hits the HP on the left wall of the impact cavity exit, forming another high-pressure area in the impact cavity. The significant pressure gradient leads to a greater right deflection angle of the main jet at the exit of the impact chamber, which eventually leads to the continued right deflection of the spray.
At the 90° phase moment, the spray reaches the farthest limit position in the positive direction of the X-axis. The left shoulder vortex at this moment is larger than the 45° phase moment, and more working fluid merges into the right jet through the bottom of the impact cavity. Compared with the 45° phase, the main jet is slightly shifted to the right, and the pressure on the left shoulder becomes less. The deflection angle of the main jet at the impact cavity exit is also reduced, which will cause the spray to start to deflect to the centre.
At the 135° phase, the left jet squeezes the right jet, making the left shoulder vortex larger, and the cut-off point consequently moves to the right. Therefore, the main jet deflects to the right and the pressure on the left shoulder becomes less. At this time, most of the main jet flows out from the cavity exit, and the amount of working fluid that hits the HP decreases, causing a reduction in pressure in this area. The pressure difference between the left and right sides decreases, the main jet velocity at the impact cavity exit is basically along the Y-axis, and the spray continues to deflect to the centre.
At the 180° phase, as shown in
Figure 7e, the velocity and the pressure distribution are axisymmetric with that at the 0° phase. The spray returns to the middle position, and the main jet deflects to the left. In the next half-cycle, the spray in the external flow field will deviate to the farthest limit position in the negative direction of the
X-axis and then return to the central position.
The special inner structure of the feedback-free fluidic oscillator causes a periodic change in the state of the internal jets and vortices, leading to a periodic reversal of pressure, which results in the periodic sweep spray characteristics. The above description of the oscillation mechanism is the basis for understanding the effect of inner geometry on internal flow and spray characteristics. The influence of the inner structural parameters, including the impact angle (IA), the cavity exit width (CEW), and the shoulder radius (SR), on the internal flow and spray characteristics will be discussed in the next section.
4. Influence of Inner Structural Parameters
The impact angle, cavity exit width, and shoulder radius are depicted in
Figure 8. The IA is the included angle between the inlet directions of the left and right jets, and the intersection of the extended centre lines of the two inlet paths is defined as the impact point. The position of the impact point is kept fixed when the IA changes. The CEW is the width of the impact cavity exit, and the SR is the radius of the left and right shoulder of the impact cavity. The following simulations were carried out at an inlet pressure of 0.16 MPa.
4.1. Effect of the Impact Angle
The water volume fraction distribution of the external flow field, the velocity vector distribution, and the pressure distribution inside the oscillator with different IA at the 90° phase are shown in
Figure 9. The 90° phase is the moment when the spray reaches the farthest limit position, and the internal flow at this moment is most representative. By comparing the internal flow and pressure distribution at this moment for different structures, the reason for the variation of spray characteristics within structures can be derived.
The impact shoulder area decreases as the IA increases, while the impact point remains the same. As shown
Figure 9a, with smaller IA, most of the left jet converges into the main jet through the bottom, a part of it forms the left shoulder vortex, and a small part forms a tiny vortex on the left side of the bottom. Most of the main jet flows out through the nozzle exit, while the remaining fluid is divided into two parts to form the left and right shoulder vortices, respectively. As the IA increases (when IA = 90°), most of the left jet no longer converges into the main jet through the bottom, but merges into the left shoulder vortex. The main jet and the left shoulder vortex squeeze each other, resulting in higher pressure on the left side. With the role of the pressure gradient, the main jet tends to deflect to the right. The distance between the HP and the impact cavity centreline is defined as HPD, as shown in
Figure 9c. The HPD can be used to measure the farthest distance that the main jet can reach before exiting the outlet. The smaller the IA, the larger the HPD.
When the IA is small, the inlet paths are closer to the bottom, and the longitudinal dimension of the left shoulder is longer. As the IA increases, the inlet flow path is shifted upward and closer to the left shoulder, so more left jet can merge into the shoulder vortex, which blocks the main jet stream to the left, and the HP shift towards the cavity exit. Here is the microscopic explanation for this phenomenon: At this moment, the main jet squeezes the left shoulder vortex until the horizontal velocity component of the main jet becomes zero and hits the exit wall at the HP. When IA = 80°, less left jet flows into the left shoulder vortex, so the main jet can deform the left shoulder vortex. As the IA increases, the rightward velocity component of the left shoulder vortex becomes larger, which causes the main jet momentum to decrease in the horizontal direction and the pressure to decrease on the left side, so the HP is closer to the impact cavity exit, and a smaller HPD is obtained.
The variation in the spray sweep angle, oscillation frequency, and volume flow rate with the IA is shown in
Figure 10a. When the IA is increased from 80° to 120°, the spray sweep angle decreases from 94.56° to 34.15°, and the volume flow rate decreases from 7.34 mL/s to 6.93 mL/s. With the increase in the IA, the spray oscillation frequency first increases and then decreases. When IA = 100°, the spray oscillation frequency is up to 847 Hz, which is significantly higher than in the other cases.
Figure 10b shows the variation of the HPD and sweep angle with IA, the larger the HPD, the larger the spray sweep angle. This is because the larger the HPD, the farther the main jet develops to the left, and the greater the velocity deflection when it reaches the exit. In particular, when the IA = 80°, the left shoulder vortex is deformed by the main jet and has a different shape from other cases, so the HPD is larger than expected.
When the IA < 100°, it is not easy to change direction due to the thicker main jet and larger inertia. Meanwhile, the HPD is larger and the main jet swings farther. Even if the pressure difference in the impact cavity is large, the oscillation frequency remains small; however, when the IA > 100°, although the main jet is thinner and the HPD is smaller, the oscillation frequency is still small due to the lower pressure difference.
Since the exit area of the impact chamber is constant, the volume flow rate variation is mainly influenced by the inside flow characteristics. With the increase in the IA, the amount of the left jet converging into the main jet decreases, so the main jet becomes thinner, and the volume flow rate becomes smaller.
4.2. Effect of the Cavity Exit Width
As shown in
Figure 11, when the CEW changes, the flow regime of the left jet is almost invariable, a part of it enters the left shoulder vortex, and the other part enters the main jet through the bottom. More fluid can flow out as the CEW increases, so the volume flow rate increases, and the main jet inside the cavity becomes thicker. In addition, the vortex on the right shoulder decreases and the overall pressure of the impact chamber decreases.
When the CEW = 0.45 mm, significantly higher pressure can be found in the entire impact cavity due to little water flowing out of the exit. The average pressure difference between the left side (red box) and right side (blue box) is 8.9 kPa, which is smaller than in other cases (i.e., the average pressure difference is 12.6 kPa when CEW = 0.55 mm), causing the main jet to sweep slowly, but when the CEW is increased to 0.55 mm, the HPD remains the same and the mass of the main jet increases slightly. The increase in the average pressure difference is the main reason for the increase in oscillation frequency.
As the CEW further increases (CEW > 0.55 mm), more of the left jet merges into the main jet through the bottom, and a portion of the right shoulder vortex also flows out due to the increased exit area, leading to a thicker main jet with larger inertia. Meanwhile, the average pressure difference increases and the HPD increases, which causes the oscillation frequency to decrease slightly.
The change of the CEW affects the flow pattern nearby the exit. The results of different spray characteristics as the CEW is increased from 0.45 to 0.85 mm are shown in
Figure 12a. With the increase in the CEW, the sweep angle is enlarged from 41° to 76°, and the volume flow rate increases in an approximately linear pattern. Meanwhile, the oscillation frequency suddenly increases from 621 Hz to 926 Hz when the CEW is increased to 0.55 mm. However, the oscillation frequency slightly decreases and remains fluctuated when the CEW further increases.
According to
Figure 12b, it can be seen that for the CEW ≤ 0.65 mm, the variation of CEW has less effect on the left shoulder vortex, and the HPD is the same, while when CEW ≥ 0.75 mm, the main jet is more robust and the fluid sunk into the left shoulder vortex decreases, so the HP position is gradually shifted away from the exit. The changing sweep angle results of the CEW in
Figure 12b indicate that the HPD is no longer the only factor affecting the sweep angle. When CEW = 0.85 mm, the main jet has more space to develop to the right as it develops from the leftmost side toward the exit, causing a larger sweep angle.
4.3. Effect of the Shoulder Radius
The water phase volume fraction distribution of the external flow field, internal flow field velocity vector distribution, and pressure distribution of the oscillator with different SR at the 90° phase are shown in
Figure 13. As the SR increases, both of the shoulder vortices become smaller, and the flow can be divided into two stages according to the flow pattern of the internal jets. In the first stage (i.e., when the SR increases from 0.68 mm to 0.88 mm), the jets’ flow pattern and the pressure distribution are little changed because the shoulder volume is still large enough. The volume flow rate has a slight increase from 6.9 mL/s to 7.1 mL/s. In the second stage (i.e., when the SR increases from 0.88 mm to 1.08 mm), the left jet is more likely to merge into the main jet from the bottom rather than into the left shoulder vortex, which causes the main jet to become thicker. Therefore, the volume flow rate increases from 7.1 mL/s to 7.6 mL/s, and the increase is larger than that of the previous stage. As for the pressure inside the cavity, there is no major difference, except the pressure in the left shoulder rises a little bit.
The variation of the sweep angle, frequency, and volume flow rate with the SR is shown in
Figure 14a. As the SR increases from 0.68 mm to 0.88 mm, the sweep angle and frequency remain roughly unchanged. However, when the SR is greater than 0.88 mm, the sweep angle increases rapidly, while the oscillation frequency is reduced by about 15% as the SR increases from 0.88 mm to 1.08 mm. As for the volume flow rate, similar to the change in the IA, there is only a slight increase as the SR increases.
As the SR increases from 0.68 mm to 0.88 mm, the shoulder volume is still large enough to develop a vortex and more left jet can enter the left shoulder, which prevents the main jet from deflecting to the left, and the HPD is similar. However, when the SR is greater than 0.88 mm, the left shoulder volume is too small, and more left jet prefers to merge into the main jet through the bottom, so the right velocity component of the left shoulder vortex squeezed with the main jet is small, and the main jet becomes thicker with higher momentum. Therefore, the HPD increases and the main jet deflects further to the left. As shown in
Figure 14b, the variation of the HPD and sweep angle with the SR contains a similar tendency.
When the SR is less than 0.88 mm, the HPD remains constant and the sweep angle fluctuates slightly, resulting in a slight change in the oscillation frequency. When the SR is greater than 0.88 mm, the main jet becomes a little stronger, and the pressure difference also fluctuates slightly. The oscillation frequency is mainly affected by the HPD. A larger HPD represents a longer sweep distance inside the impact cavity, leading to a smaller oscillation frequency.
4.4. Influence Mechanism of Spray Characteristics
The above discussion on different oscillator structures indicates that the oscillator inner geometries affect the internal flow pattern, which in turn affects the spray characteristics. The change of the oscillator structures leads to the deformation of vortices and the change of jet flow pattern inside the impact cavity, leading to the change in the HPD. The larger the HPD, the greater the velocity deflection. Unfortunately, the effect of inner structural parameters on the internal flow cannot be quantified and only qualitative conclusions can be obtained as described above. As for the effect of internal flow on spray characteristics, the variation of the dimensionless sweep angle with dimensionless HPD is shown in
Figure 15. The HPDori represents the HPD value of the original structure, and the SAori represents the sweep angle of the original structure. It is obvious that the dimensionless sweep angle is linear with the dimensionless HPD, and the fitting formula is as follows:
The maximum coefficient of determination (R2) of this fitting formula is 0.97. It is interesting to note that when y = 0, the value of x is not 0. That means that the oscillator oscillates only when the value of HPD is greater than a threshold. The points representing different SRs and IAs (black and blue points) are close to the fitting line except for the rightmost point, which represents the case of the left shoulder vortex being squeezed and deformed (IA = 80°). The points representing different CEWs (red points) have a larger variance overall, which means the CEW is another factor affecting the sweep angle.
The internal flow factor affecting the oscillation frequency can be decoupled into three factors (the HPD, the inertia of the main jet, and the pressure difference between the left and right sides). A larger HPD means a longer time for one cycle. The increase in the jet inertia and the decrease in the pressure difference can also reduce the oscillation speed.
The average volume flow rate can be calculated by:
Here,
V is the average volume flow rate,
is the average velocity of the cavity exit, and
A is the cavity exit area. Based on the Bernoulli equation, the exit average velocity is mainly influenced by the pressure difference between the inlet and outlet. When the pressure difference is constant, the most critical factor affecting the volume flow rate is the CEW, which is consistent with the numerical results.
5. Conclusions
In this paper, the oscillator spray morphology, oscillation frequency, and volume flow rate with different pressures were measured experimentally, and these were used to validate the numerical results. It has been verified that the current numerical model is accurate. The sweeping mechanism of the feedback-free fluidic oscillator has been interpreted based on the numerical results of the internal flow in half a period. Then, the influence of three key parameters of the oscillator inner structure, including the impact angle, the cavity exit width, and the shoulder radius on the spray characteristics was investigated from the perspective of the internal flow. The present work established the link between the oscillator structures, internal flow, and spray characteristics. The main conclusions are as follows.
(1) The spray sweep angle is not significantly affected by injection pressure, but oscillation frequency and volume flow rate demonstrate an approximately linear relationship with injection pressure. The unique oscillator structures cause periodic variation in internal jets and vortices, resulting in the spray’s sweeping behavior within the external field.
(2) As the IA increases, the inlet flow path moves closer to the shoulder, allowing a larger volume impinging jet to merge into the shoulder vortex. This results in a smaller HPD and a thinner main jet. In addition, the pressure difference between the left and right sides decreases. The changes in internal flow lead to a rapid decrease in spray sweep angle, a slight decline in volume flow rate, and an initial increase followed by a decrease in oscillation frequency.
(3) As the CEW increases from 0.45 mm to 0.85 mm, the volume flow rate increases linearly from 5.3 mL/s to 9.3 mL/s and the sweep angle is enlarged from 41° to 76°. Particularly, an increase in the CEW from 0.45 mm to 0.55 mm causes a sudden rise in the oscillation frequency suddenly from 621 Hz to 926 Hz due to an increase in pressure difference between the left and right sides of the cavity.
(4) The development of vortices in the left and right shoulders, and their volumes, are affected by SR. The impact can be divided into two stages according to the flow pattern of the internal jets, with significant changes in internal flow and spray state only when the SR is greater than 0.88 mm.
(5) HPD has an approximately linear relationship with sweep angle, whereas oscillation frequency is affected by HPD, main jet inertia, and pressure difference between the left and right sides. The CEW primarily affects volume flow rate.
Author Contributions
Conceptualization, Z.W. and P.L.; methodology, Z.H.; software, Y.G.; validation, W.Z., X.L. and R.S.; formal analysis, P.L.; investigation, W.X. and L.L.; resources, Z.W. and L.L.; data curation, Z.H.; writing—original draft preparation, Z.W. and P.L.; writing—review and editing, Z.H. and P.L. All authors have read and agreed to the published version of the manuscript.
Funding
This work was funded by the National Nature Foundation (U1832809).
Institutional Review Board Statement
Not applicable.
Informed Consent Statement
Written informed consent has been obtained from the patient(s) to publish this paper.
Data Availability Statement
Data are available in this paper.
Acknowledgments
The paper is supported by an industrial gift from Jiangsu Riying Electronics Co., Ltd.
Conflicts of Interest
The authors declare no conflict of interest.
Nomenclature
| IA | Impact angle |
| CEW | Cavity exit width |
| SR | Shoulder radius |
| HP | Hit point between the left shoulder vortex and the main jet |
| HPD | The distance between the hit point and the impact cavity centreline |
| HPDori | The HPD value of the original structure |
| SA | The sweep angle |
| Saori | The sweep angle of the original structure |
| X | The dimensionless value (HPD/HPDori) in fitting formula |
| y | The dimensionless value (SA/SAori) in fitting formula |
| The average velocity of the cavity exit |
| A | The cavity exit area |
| V | The average volume flow rate |
References
- Cattafesta, L.N., III; Sheplak, M. Actuators for active flow control. Annu. Rev. Fluid Mech. 2011, 43, 247–272. [Google Scholar] [CrossRef]
- Raghu, S. Fluidic oscillators for flow control. Exp. Fluids 2013, 54, 1455. [Google Scholar] [CrossRef]
- Raman, G.; Cain, A. Innovative actuators for active flow and noise control. Proc. Inst. Mech. Eng. Part G J. Aerosp. Eng. 2002, 216, 303–324. [Google Scholar] [CrossRef]
- Whalen, E.A.; Shmilovich, A.; Spoor, M.; Tran, J.; Vijgen, P.; Lin, J.C.; Andino, M. Flight Test of an Active Flow Control Enhanced Vertical Tail. AIAA J. 2018, 56, 3393–3398. [Google Scholar] [CrossRef]
- Kim, N.-H.; Kim, K.-Y. Flow control using fluidic oscillators on an airfoil with a flap. Eng. Appl. Comput. Fluid Mech. 2021, 15, 377–390. [Google Scholar] [CrossRef]
- Jones, G.S.; Milholen, W.E.; Chan, D.T.; Goodliff, S.L. A Sweeping Jet Application on a High Reynolds Number Semi-Span Supercritical Wing Configuration. In Proceedings of the 35th AIAA Applied Aerodynamics Conference, Denver, CO, USA, 5–9 June 2017. [Google Scholar]
- Pandit, A.V.; Ranade, V.V. Fluidic Oscillator as a Continuous Crystallizer: Feasibility Evaluation. Ind. Eng. Chem. Res. 2020, 59, 3996–4006. [Google Scholar] [CrossRef]
- Gregory, J.; Tomac, M.N. A review of fluidic oscillator development and application for flow control. In Proceedings of the 43rd AIAA Fluid Dynamics Conference, San Diego, CA, USA, 24–27 June 2013. [Google Scholar]
- Stouffer. D.R. Liquid Oscillator Device. U.S. Patent No. US04508267A, 2 April 1985.
- Bobusch, B.C.; Woszidlo, R.; Bergada, J.M.; Nayeri, C.N.; Paschereit, C.O. Experimental study of the internal flow structures inside a fluidic oscillator. Exp. Fluids 2013, 54, 1559. [Google Scholar] [CrossRef]
- Xie, W.; Hu, Z.J.; Zhao, W.B.; Zhai, J.C.; Wang, Y.F.; Li, L.G.; Wu, Z.J. Experimental and numerical studies on spray characteristics of an internal oscillating nozzle. At. Sprays 2019, 29, 19–37. [Google Scholar] [CrossRef]
- Gregory, J.; Sakaue, H.; Sullivan, J. Fluidic Oscillator as a Dynamic Calibration Tool. In Proceedings of the 22nd AIAA Aerodynamic Measurement Technology and Ground Testing Conference, St. Louis, MO, USA, 24–26 June 2002. [Google Scholar]
- Li, W.-F.; Huang, G.-F.; Tu, G.-Y.; Liu, H.-F.; Wang, F.-C. Experimental study of planar opposed jets with acoustic excitation. Phys. Fluids 2013, 25, 014108. [Google Scholar] [CrossRef]
- Zhang, Y.; Fu, Q.; Mo, C.; Yang, L. Molecular dynamics simulation of a nanoscale feedback-free fluidic oscillator. AIP Adv. 2017, 7, 115311. [Google Scholar] [CrossRef]
- Gregory, J.W.; Sullivan, J.P.; Raghu, S. Visualization of jet mixing in a fluidic oscillator. J. Vis. 2005, 8, 169–176. [Google Scholar] [CrossRef]
- Tomac, M.N. Internal Fluid Dynamics and Frequency Characteristics of Feedback-Free Fluidic Oscillators; The Ohio State University ProQuest Dissertations Publishing: Columbus, OH, USA, 2013. [Google Scholar]
- Tomac, M.N.; Gregory, J.W. Internal jet interactions in a fluidic oscillator at low flow rate. Exp. Fluids 2014, 55, 1730. [Google Scholar] [CrossRef]
- Tomac, M.N.; Gregory, J.W. Internal Flow Physics of a Fluidic Oscillator Spray in the Transition Regime. At. Sprays 2016, 26, 673–686. [Google Scholar] [CrossRef]
- Tomac, M.N.; Gregory, J.W. Oscillation characteristics of mutually impinging dual jets in a mixing chamber. Phys. Fluids 2018, 30, 117102. [Google Scholar] [CrossRef]
- Wu, Z.; Zhao, W.; Hu, Z.; Xie, W.; Wang, Y.; Li, L. Study on the Spray Characteristics and Oscillation Mechanism of a Feedback-Free Internal Impinging Nozzle. Flow Turbul. Combust. 2021, 107, 979–1002. [Google Scholar] [CrossRef]
- Gregory, J.; Sullivan, J.; Raman, G.; Raghu, S. Characterization of a Micro Fluidic Oscillator for Flow Control. In Proceedings of the 2nd AIAA Flow Control Conference, Portland, OR, USA, 28 June–1 July 2004. [Google Scholar]
- Bidadi, S.; Heister, S.D.; Matsutomi, Y. Computational and experimental study of jet interaction fluidic injectors. At. Sprays 2011, 21, 127–138. [Google Scholar] [CrossRef]
- Tomac, M.N.; Sundström, E. Fluidic Oscillator with Variable Sweep and Inclination Angles. AIAA J. 2020, 58, 1182–1193. [Google Scholar] [CrossRef]
- Melton, L.P.; Koklu, M.; Andino, M.; Lin, J.C.; Edelman, L. Sweeping jet optimization studies. In Proceedings of the 8th AIAA Flow Control Conference, Reston, VA, USA, 13 June 2016. [Google Scholar]
- Koklu, M. Effect of a Coanda Extension on the Performance of a Sweeping-Jet Actuator. AIAA J. 2016, 54, 1131–1134. [Google Scholar] [CrossRef]
- Reichenzer, F.; Schneider, M.; Dörr, S. Influence of Geometry on a Feedback-Free Fluidic Oscillator with Nonoutlet Facing Jets. AIAA J. 2018, 56, 4768–4774. [Google Scholar] [CrossRef]
- Jhaveri, V.; DeSalvo, M.; Glezer, A.; Colton, J. Effects of manufacturing parameters on performance of fluidic oscillators for aerodynamic flow control. Proc. Inst. Mech. Eng. Part G J. Aerosp. Eng. 2018, 233, 3603–3611. [Google Scholar] [CrossRef]
- Tomac, M.N.; Gregory, J. Frequency Studies and Scaling Effects of Jet Interaction in a Feedback-Free Fluidic Oscillator. In Proceedings of the 50th AIAA Aerospace Sciences Meeting including the New Horizons Forum and Aerospace Exposition, Nashville, Tennessee, 9–10 January 2012. [Google Scholar]
- Pope, S.B.; Pope, S.B. Turbulent Flows; Cambridge University Press: Cambridge, UK, 2000. [Google Scholar]
- Hossain, M.A.; Prenter, R.; Lundgreen, R.K.; Ameri, A.; Gregory, J.W.; Bons, J.P. Experimental and Numerical Investigation of Sweeping Jet Film Cooling. J. Turbomach. 2018, 140, 031009. [Google Scholar] [CrossRef]
- Kara, K.; Kim, D.; Morris, P.J. Flow-Separation Control Using Sweeping Jet Actuator. AIAA J. 2018, 56, 4604–4613. [Google Scholar] [CrossRef]
Figure 1.
Schematic of the experimental system and the resulting images.
Figure 1.
Schematic of the experimental system and the resulting images.
Figure 2.
(a) The 3D shape of the oscillator; (b) The definition of the oscillator structures; (c) Geometry dimensions of the oscillator with the prolonged inlet.
Figure 2.
(a) The 3D shape of the oscillator; (b) The definition of the oscillator structures; (c) Geometry dimensions of the oscillator with the prolonged inlet.
Figure 3.
(a) The mesh setting of the internal flow field; (b) The hybrid mesh scheme in the external computational domain.
Figure 3.
(a) The mesh setting of the internal flow field; (b) The hybrid mesh scheme in the external computational domain.
Figure 4.
(a) Flow field computational domain of feedback-free fluidic oscillator; (b) Boundary condition setup.
Figure 4.
(a) Flow field computational domain of feedback-free fluidic oscillator; (b) Boundary condition setup.
Figure 5.
The experimental spray morphology and the numerical results of water volume fraction contour in the stable phase at different injection pressures. (a) 0.12 MPa; (b) 0.14 MPa; (c) 0.16 MPa; (d) 0.18 MPa; (e) 0.20 MPa; (f) 0.22 MPa.
Figure 5.
The experimental spray morphology and the numerical results of water volume fraction contour in the stable phase at different injection pressures. (a) 0.12 MPa; (b) 0.14 MPa; (c) 0.16 MPa; (d) 0.18 MPa; (e) 0.20 MPa; (f) 0.22 MPa.
Figure 6.
(a) The experimental results and numerical results of spray sweep angle at different injection pressures; (b) Relation between volume flow rate and injection pressure; (c) The spray sweep velocity under different injection pressures; (d) Relation between oscillation frequency and injection pressure.
Figure 7.
The velocity vector distribution and pressure distribution in half a period at 0.16 MPa.
Figure 7.
The velocity vector distribution and pressure distribution in half a period at 0.16 MPa.
Figure 8.
The key inner structural parameters of the oscillator.
Figure 8.
The key inner structural parameters of the oscillator.
Figure 9.
The water phase volume fraction distribution of the external flow field, internal flow field velocity vector distribution, and pressure distribution of the oscillator with different IA at the 90° phase.
Figure 9.
The water phase volume fraction distribution of the external flow field, internal flow field velocity vector distribution, and pressure distribution of the oscillator with different IA at the 90° phase.
Figure 10.
(a) Variation of spray sweep angle, oscillation frequency, and volume flow rate with IA; (b) Variation of sweep angle and the HPD with IA.
Figure 10.
(a) Variation of spray sweep angle, oscillation frequency, and volume flow rate with IA; (b) Variation of sweep angle and the HPD with IA.
Figure 11.
The water phase volume fraction distribution of the external flow field, internal flow field velocity vector distribution, and pressure distribution of the oscillator with different CEW at the 90° phase.
Figure 11.
The water phase volume fraction distribution of the external flow field, internal flow field velocity vector distribution, and pressure distribution of the oscillator with different CEW at the 90° phase.
Figure 12.
(a) Variation of spray sweep angle, frequency, and volume flow rate with CEW; (b) Variation law of spray sweep angle and HPD with CEW.
Figure 12.
(a) Variation of spray sweep angle, frequency, and volume flow rate with CEW; (b) Variation law of spray sweep angle and HPD with CEW.
Figure 13.
The water phase volume fraction distribution of the external flow field, internal flow field velocity vector distribution, and pressure distribution of the oscillator with different SR at the 90° phase.
Figure 13.
The water phase volume fraction distribution of the external flow field, internal flow field velocity vector distribution, and pressure distribution of the oscillator with different SR at the 90° phase.
Figure 14.
(a) Variation of spray sweep angle, frequency, and volume flow rate with shoulder radius; (b) Variation of spray sweep angle and HPD with shoulder radius.
Figure 14.
(a) Variation of spray sweep angle, frequency, and volume flow rate with shoulder radius; (b) Variation of spray sweep angle and HPD with shoulder radius.
Figure 15.
Variation of the sweep angle with the HPD.
Figure 15.
Variation of the sweep angle with the HPD.
| Disclaimer/Publisher’s Note: The statements, opinions and data contained in all publications are solely those of the individual author(s) and contributor(s) and not of MDPI and/or the editor(s). MDPI and/or the editor(s) disclaim responsibility for any injury to people or property resulting from any ideas, methods, instructions or products referred to in the content. |
© 2023 by the authors. Licensee MDPI, Basel, Switzerland. This article is an open access article distributed under the terms and conditions of the Creative Commons Attribution (CC BY) license (https://creativecommons.org/licenses/by/4.0/).

 ,
, 