Article

Study on Failure Mechanism of Roadway Surrounding Rock and Hierarchical Continuous Support Technology in Unidirectional Fault Area

1
Key Laboratory of Deep Coal Resource Mining, Ministry of Education of China, School of Mines, Sun Yueqi Honors College, China University of Mining and Technology, Xuzhou 221116, China
2
School of Civil Engineering, Xuzhou University of Technology, Xuzhou 221018, China
3
Xuzhou Coal Mining Group Co., Ltd., Xuzhou 221018, China
*
Author to whom correspondence should be addressed.
Processes 2023, 11(5), 1453; https://doi.org/10.3390/pr11051453
Submission received: 14 April 2023 / Revised: 8 May 2023 / Accepted: 9 May 2023 / Published: 11 May 2023
(This article belongs to the Special Issue Advanced Technologies of Deep Mining)

Abstract

:
A fault is a common geological structure in coal mining. Large deformation or even instability and collapse often occur in roadways in fault areas, which restricts the safe and efficient production of mines. With the track roadway of the 5206 working face of Xin’an Coal Mine as the engineering background, this study aims to explore the failure mechanism of surrounding rock under the influence of fault structures. Field investigation and numerical simulation were used comprehensively to analyze the failure characteristics of the surrounding rock under the influence of a unidirectional fault structure. Based on the principle of thick-layer transboundary anchorage, the hierarchical continuous support technology of transboundary anchoring in the fault structure area was proposed. The results show that the stress near the fault area is relatively concentrated, and the rock mass strength is low, which may easily cause the deformation and failure of the surrounding rock under the dynamic stress response. Using the new technology to reconstruct the bearing structure of the broken surrounding rock mass, the deformation of the surrounding rock can be effectively restrained. According to the monitoring feedback, the roadway deformation in the roof and two sides is reduced by 68.5% and 35.4%, respectively; and the maximum evolutionary depth of the roof crack is reduced to 3.5 m from 7.5 m in the original support scheme. Moreover, this study also explored the necessity of wedge anchorage for corner anchor cables and the deformation characteristics of surrounding rock at different fault dip angles. These results provide an important reference for the maintenance and control of coal roadways under the influence of unidirectional fault structures.

1. Introduction

Coal is by far the world’s most abundant, most widely distributed, and most economical energy resource. Nearly 80 countries have coal resources, among which the United States boasts of the richest coal reserves, accounting for 23.2% of the global resources, Russia 15.1%, Australia 14.0%, China 13.3%, and India 10.3%. The total reserves of the above five countries account for all 76.0% of the world’s total reserves. China is rich in coal reserves while scarce in oil and gas. Its coal occurrence is not the highest in the world, but its coal consumption ranks at the top. Coal has been the main energy in China for a long time. With the depletion of shallow coal resources, deep mining has become normal in coal resource development in China [1,2,3]. Compared with shallow mining, the rock mass in deep mining is in a mechanical environment featured with “Three Highs and One Disturbance”, namely, high stress, high seepage pressure, high temperature, and strong mining disturbance. In this case, the influence of high stress on the stability of deep roadways becomes more significant [4,5], which is specifically manifested as heavy weighting, quick deformation, a large range of surrounding rock failure, and great proneness to roof instability and collapse. In some sense, it has become the bottleneck restricting deep mining [1,6]. The occurrence conditions of deep coal resources are complicated, and there are many fault structures. Accordingly, the coal mining process is easily affected by faults [7]. The existence of a fault structure is not conducive to the continuity and integrity of rock strata, which often leads to large deformation of the coal roadway surrounding rock and even causes serious disasters [8,9,10]. In order to ensure the stability of the surrounding rock in a deep unidirectional fault structure area, it is necessary to study its failure mechanism and put forward reasonable and effective control technology [11].
Numerous studies have been conducted on the failure mechanism of roadway surrounding rock in fault zones [12,13,14]. Meng et al. [15] revealed the influence of normal faults on the physical and mechanical properties and stress distribution of coal rock mass through the observation and numerical simulation analysis of cracks in the surrounding rock near normal faults. Through a similar simulation experiment, Gou [16] concluded that roadway surrounding rock shows differentiated deformation characteristics in the fault-affected area. Through numerical simulation analysis, Wang et al. [17] maintained that the asymmetric mining stress field near the fault is the main reason for the asymmetric large deformation and support failure in this kind of roadway. Islam and Shinjo [18] studied the distribution characteristics of the surrounding rock stress in fault zones after mining disturbance and analyzed the stability and safety of surrounding rock around the fault zones. Mark [19] simulated the failure mechanism of a deep soft rock roadway using UDEC numerical simulation software and concluded that high horizontal stress is the main reason for roadway instability. Based on the data recorded by the local seismic network in the coal basin of Upper Silesia, Poland, Marcak et al. [20] obtained the uneven distribution of horizontal tectonic stress near faults. Based on the engineering background of a coal mine in South Africa, Naoi et al. [21] tested a large number of shear microcracks on the surface of natural faults using acoustic waves. As their findings revealed, the stress distribution characteristics and intensity of faults were reflected by the presence or absence of acoustic emission events. Sainoki et al. [22] conducted numerical simulations using FLAC3D and concluded that under the influence of mining, the shear displacement of the fault plane changes. According to their findings, the shear displacement is closely affected by the mining depth, the fault friction angle, and the relative position between the fault and coal seam, while the fault stiffness and expansion angle have little influence on it.
In order to ensure the rationality of support design, many studies have been conducted on the failure mechanism of roadway surrounding rock in fault fracture zones, and many control technologies have been proposed accordingly. In the 1960s, based on his years of practical engineering experience, Raboewicz [23] proposed the new Austrian tunnelling method (NATM) and information construction. The core of this method is to give full play to the bearing capacity of the surrounding rock. In the 1970s, Salamon et al. proposed an energy support theory, which holds that the surrounding rock and supporting body have a common action mechanism, and the two follow the law of the conservation of energy. If the energy released by the surrounding rock can be completely absorbed by the supporting body, the supporting body and surrounding rock will become whole and have deformation synergistic effect. As long as the supporting body stiffness is sufficient, the surrounding rock will not be damaged. Liu [24] put forward the bolt–shotcrete support technology of a coal roadway in a fault area and analyzed its advantages and disadvantages. Kang et al. [25,26] proposed the high prestressed strong support system and maintained that the deformation and failure of the surrounding rock in a fault area can be effectively controlled by improving the support strength and stiffness at the initial stage of support. Zhang et al. [27,28,29] put forward the continuous beam roof control theory and efficient long anchorage support technology, which can greatly reduce the development of surrounding rock cracks. On this basis, in view of the large fault zone surrounding rock, they developed an advanced grouting technology to control the caving of the rock mass in the goaf zone. Based on the analysis of the evolution and distribution of surrounding rock stress near a fault, Xiao et al. [30] proposed the control technology of reducing the reduction rate of the surrounding rock stress to improve the stress state of the roof and two sides of the wall rock.
The above studies have greatly promoted the revelation of the failure mechanism of roadway surrounding rock in fault structural areas. However, there are few studies on the stability of roadway surrounding rock under the influence of deep unidirectional fault structures. In addition, the geological occurrence of major mining areas in China is obviously different, so the selection of a support scheme cannot be limited to engineering analogy, and the surrounding rock control of this kind of roadway needs to be further studied. Therefore, with the 5206 working face track roadway of Xin’an Coal Mine as the engineering background, this study analyzed the failure mechanism of roadway surrounding rock under a deep unidirectional fault structure through field investigation, theoretical analysis, numerical simulation, and other comprehensive methods. On this basis, the differential hierarchical continuous support technology was put forward, which has been validated by good feedback and application effects in engineering practices and thus has high promotional value.

2. Engineering Geology Overview

2.1. Occurrence Characteristics and Support Scheme

Xin’an Coal Mine is located in Pingliang City, Gansu Province, China, with an annual output of 1.2 million tons of coal. The test site is the track roadway of the 5206 working face. The coal seam excavated by this roadway is a 5# coal seam, with an average thickness of 10.1 m, an average burial depth of 880 m, and an average dip angle of 6°. To the east wing of the 5206 working face is the goaf of the 5204 working face; 112 m above its overlying exists the goaf of the 1206 and 1208 working faces. The 5026 track roadway is located below the coal body at the edge of the goaf in the 1208 working face. Its spatial location is shown in Figure 1.
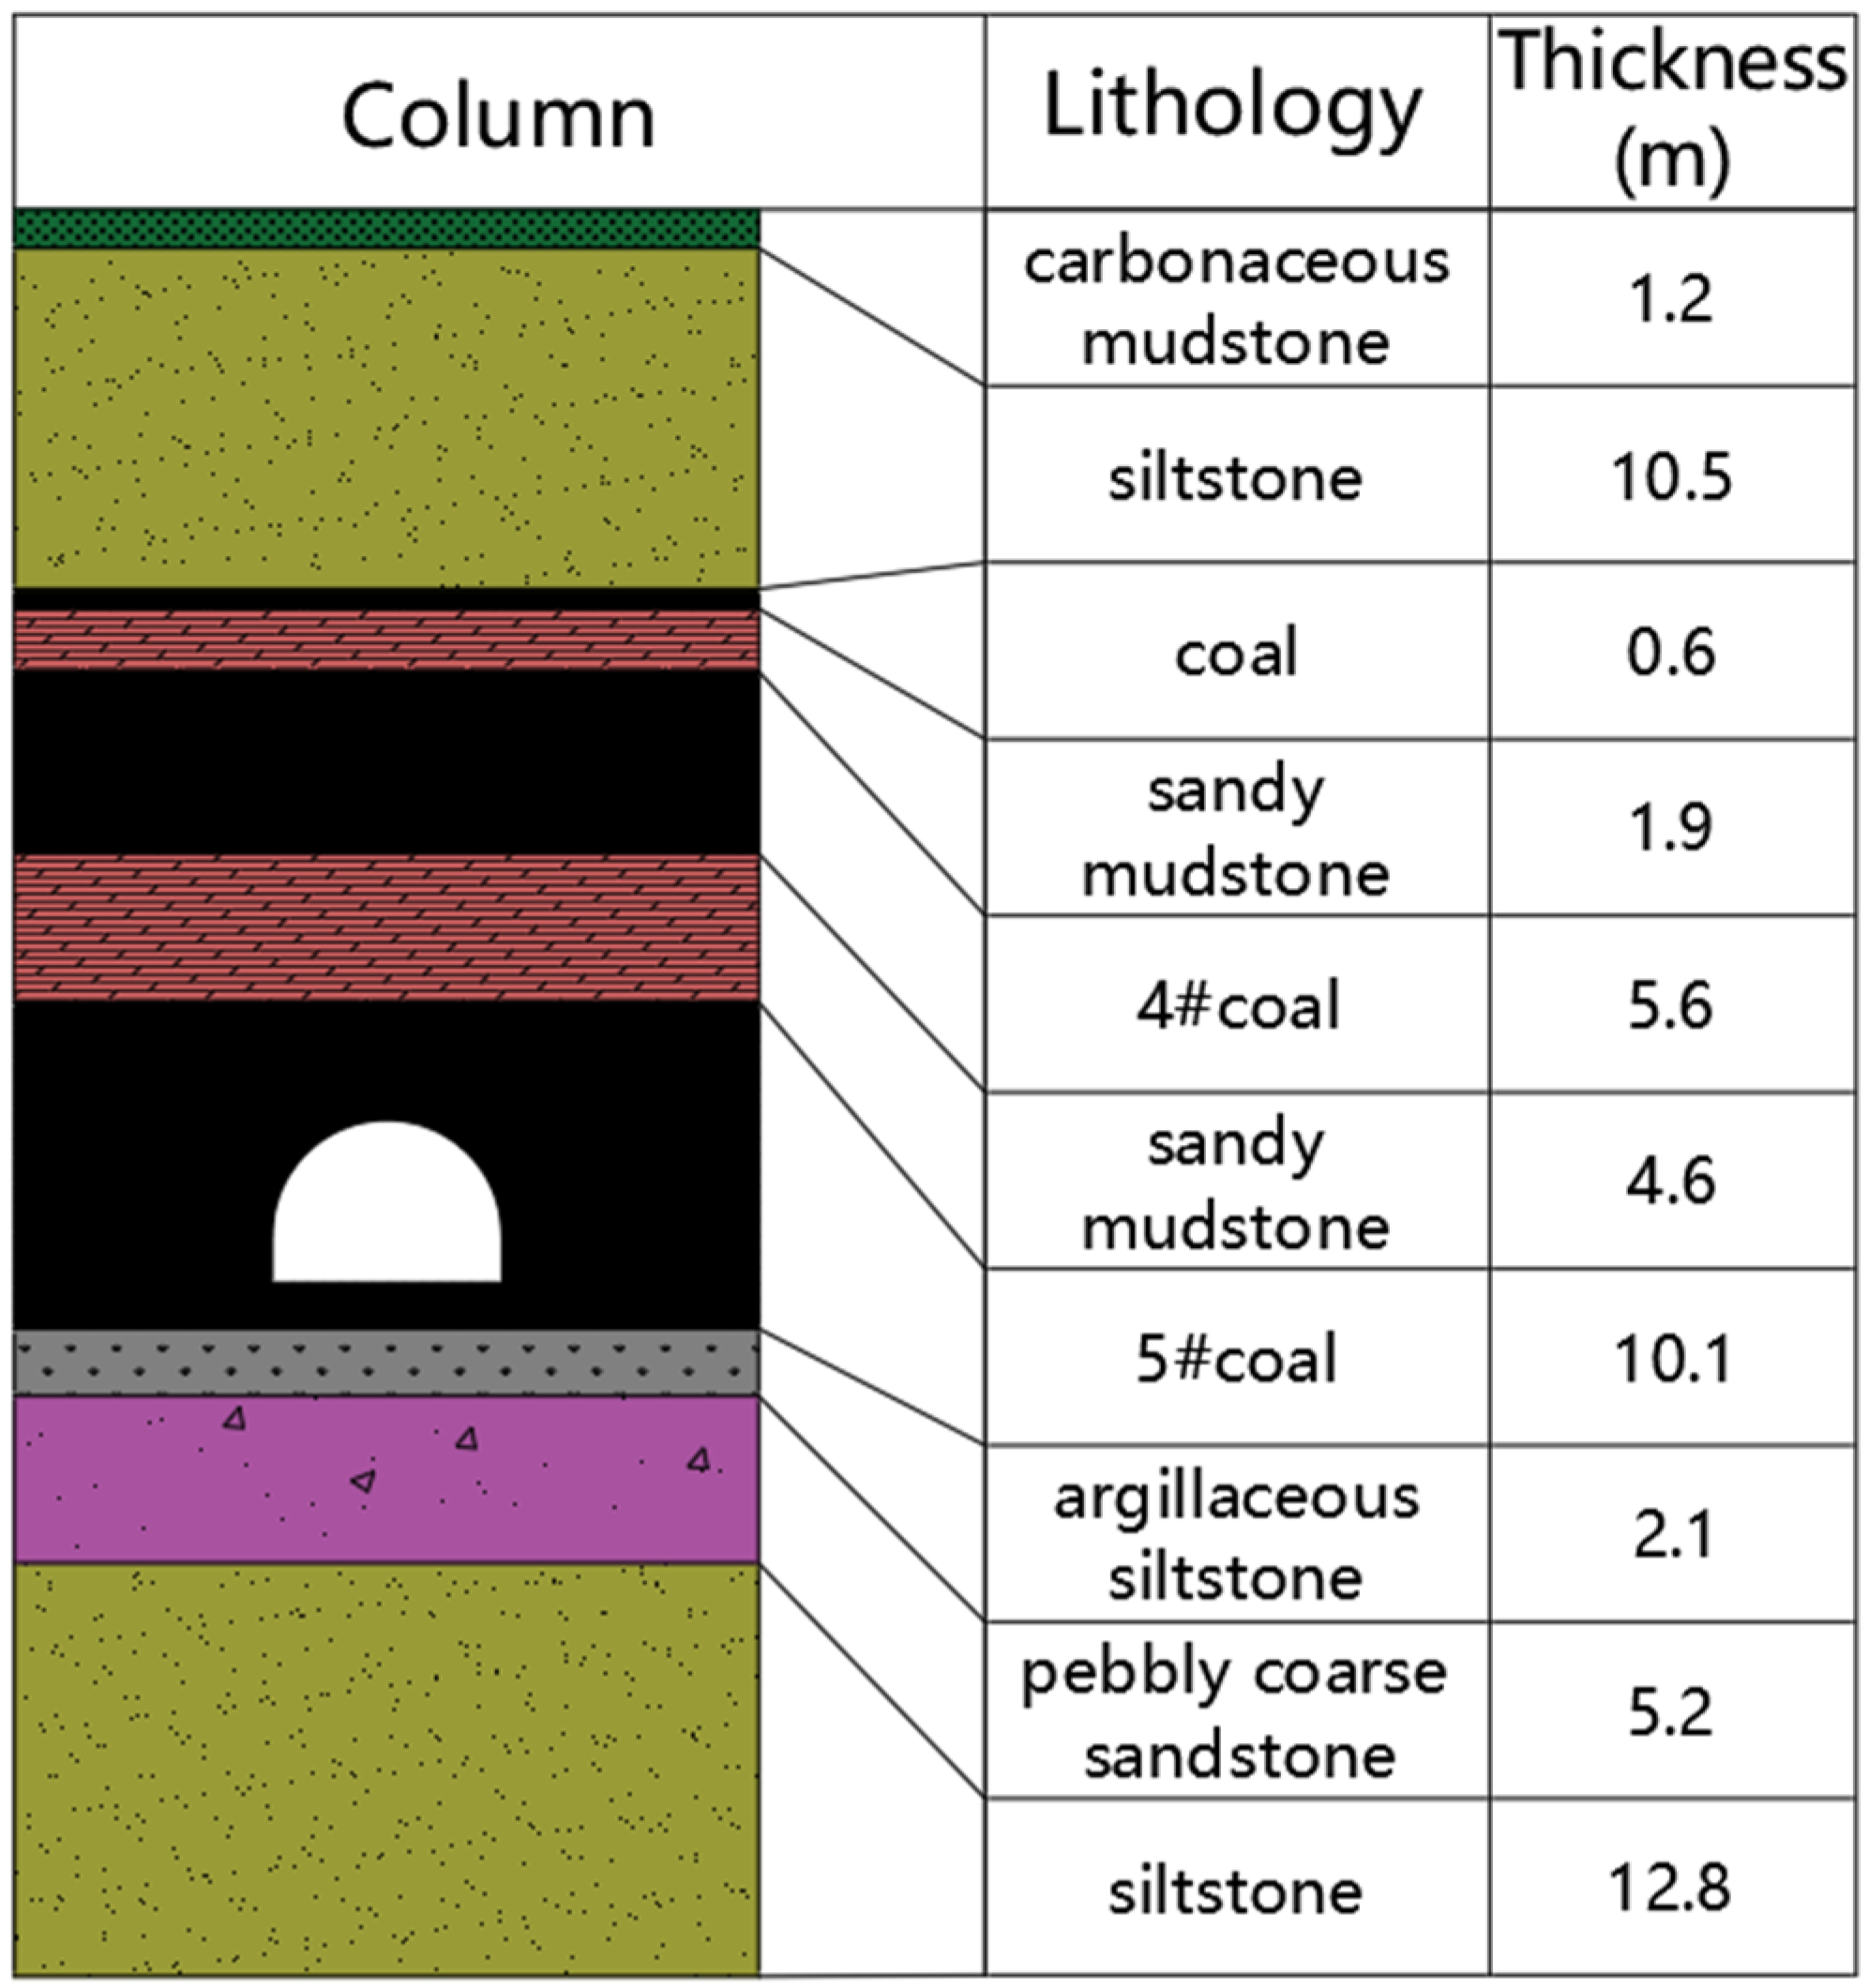
The section of the track roadway in the 5026 working face is designed as a straight wall semicircular arch. The width and height of the roadway is 5.50 m and 3.90 m, respectively. The height of the straight wall and the arch are 1.15 m and 2.75 m, respectively. There are 3~7 m of top coal of different thicknesses in the roof of track roadway, and the direct roof of the coal seam is coal–mudstone composite rock with a thickness of 13 m, and the strength of each layer is relatively low. The old roof is siltstone with a thickness of 10.5 m; the immediate bottom is composed of 2.1 m-thick argillaceous siltstone and 5.2 m-thick coarse sandstone. The specific occurrence of rock strata is shown in Figure 2.
The test section is located in the fault concentration area. According to the statistics, there are 15 faults occurring within the 250 m-long test range, among which there are 2 faults with a drop of more than 3 m, 8 faults with a drop of 1~3 m, and the rest are small faults with a drop of less than 1 m. All faults in the area are east–west striking. The faults are shown in Table 1.
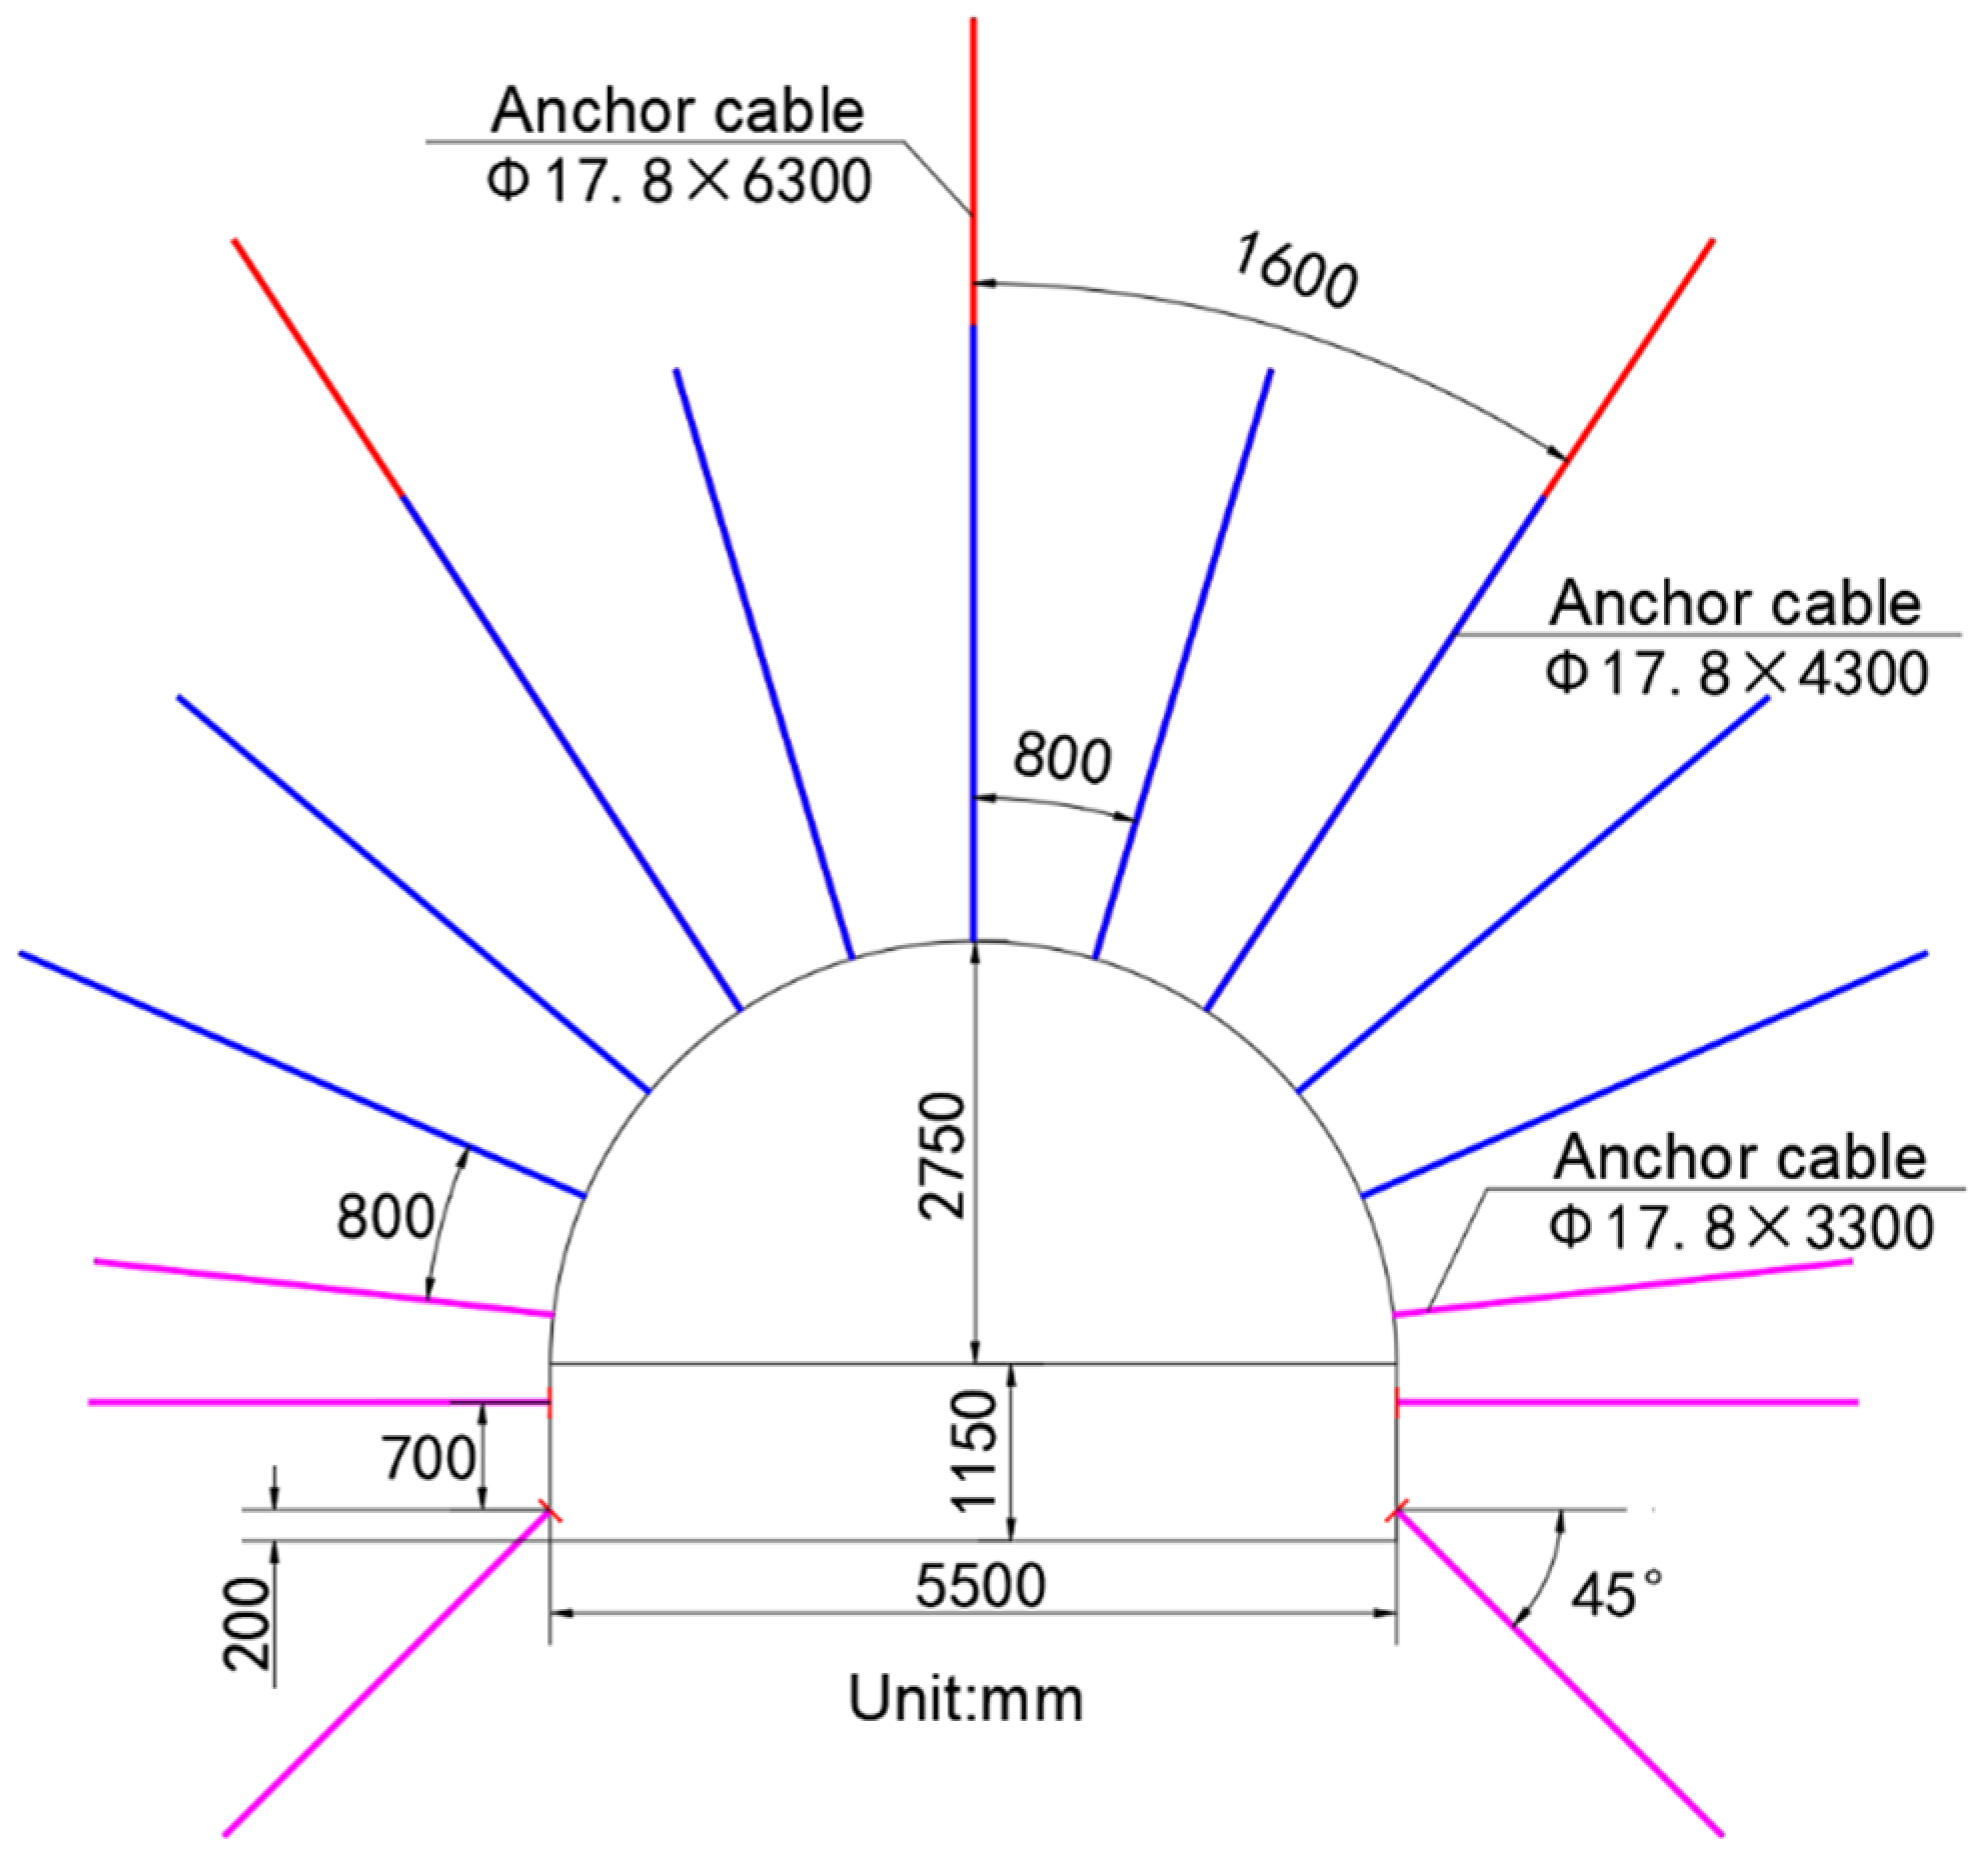
In the primary support of 5206 track roadway, a combined support was applied to the roof, namely, a first-stage short anchor cable + a second-stage long anchor cable + a reinforced ladder beam + diamond mesh. The diameter and length of the first-stage anchor cables were 17.8 mm and 4300 mm, respectively. Nine cables were arranged in each row, and the spacing between rows was 800 mm × 800 mm. The diameter and length of the second-stage anchor cables were 17.8 mm and 6300 mm, respectively. Three cables were arranged in each row, and the spacing between the rows was 800 mm × 1600 mm. All the anchor cables were constructed perpendicular to the roof.
The side and shoulder of the track roadway were supported with the combination of a first-stage short anchor cable + a reinforced ladder beam + diamond mesh. The diameters and lengths of the anchor cables were 17.8 mm and 3300 mm, respectively. Six cables were arranged in each row on the two sides. Except for the anchor cables at the bottom corner, which were constructed with a dip angle of 450, all the other cables were installed perpendicular to the sides. The specific support parameters are shown in Figure 3.

2.2. Deformation Characteristics and Deterioration Analysis of Surrounding Rock

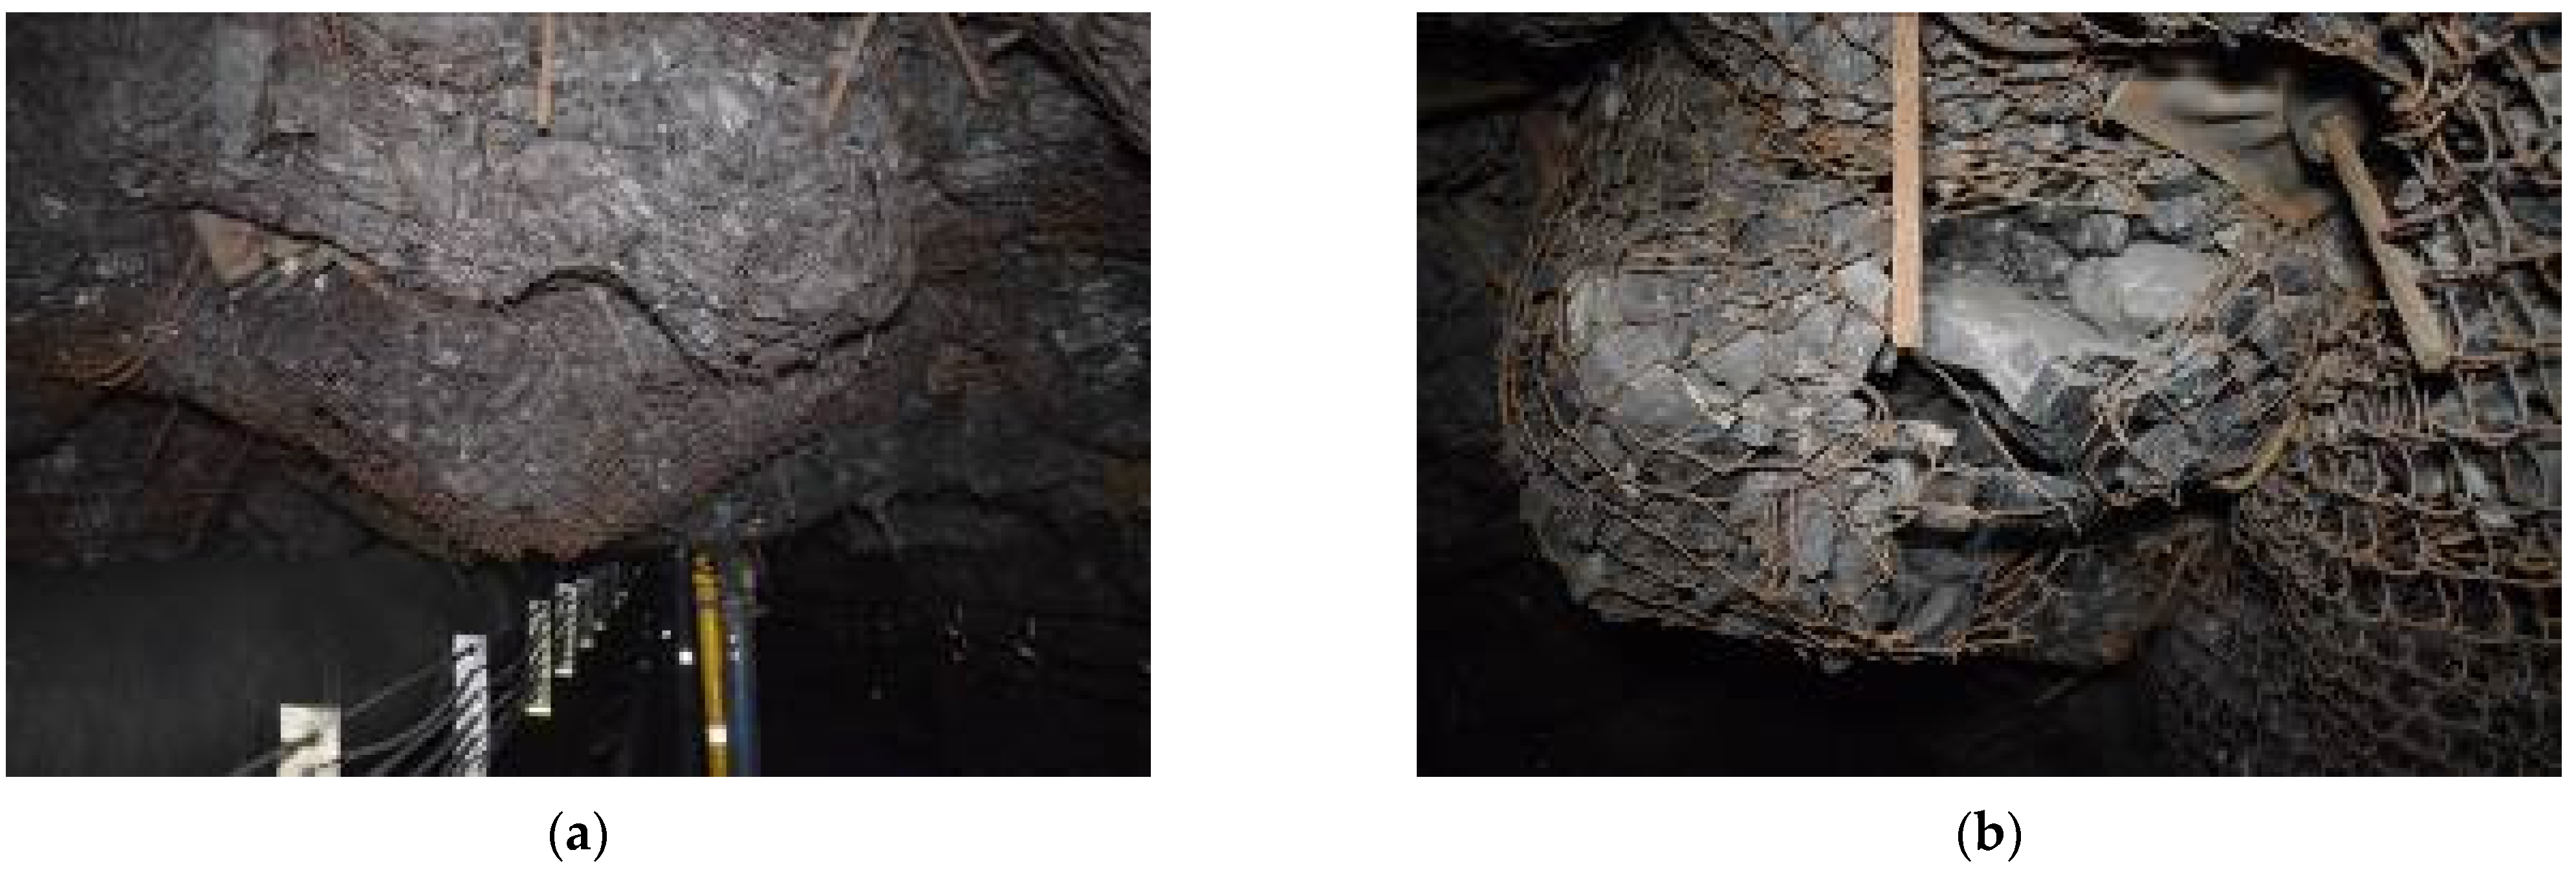
On the whole, the 5206 track roadway presents differentiated deformation and failure characteristics. Specifically, the deformation at the interface area of the roof faults is very serious, while the deformation in other areas tends to be mild. The two sides obviously shrink, producing serious floor heave. As is shown in Figure 4, due to the lack of stiffness of the diamond mesh, it is unable to play a strong restraint role in the roof fracture zone. As the rock mass between the cables gradually subsides, the diamond mesh forms a fractured net bag. The height of the roadway can no longer meet the normal use requirements, and the diamond mesh is also torn in the area with large local deformation (Figure 4b). In this case, the roadway faces great safety risks.
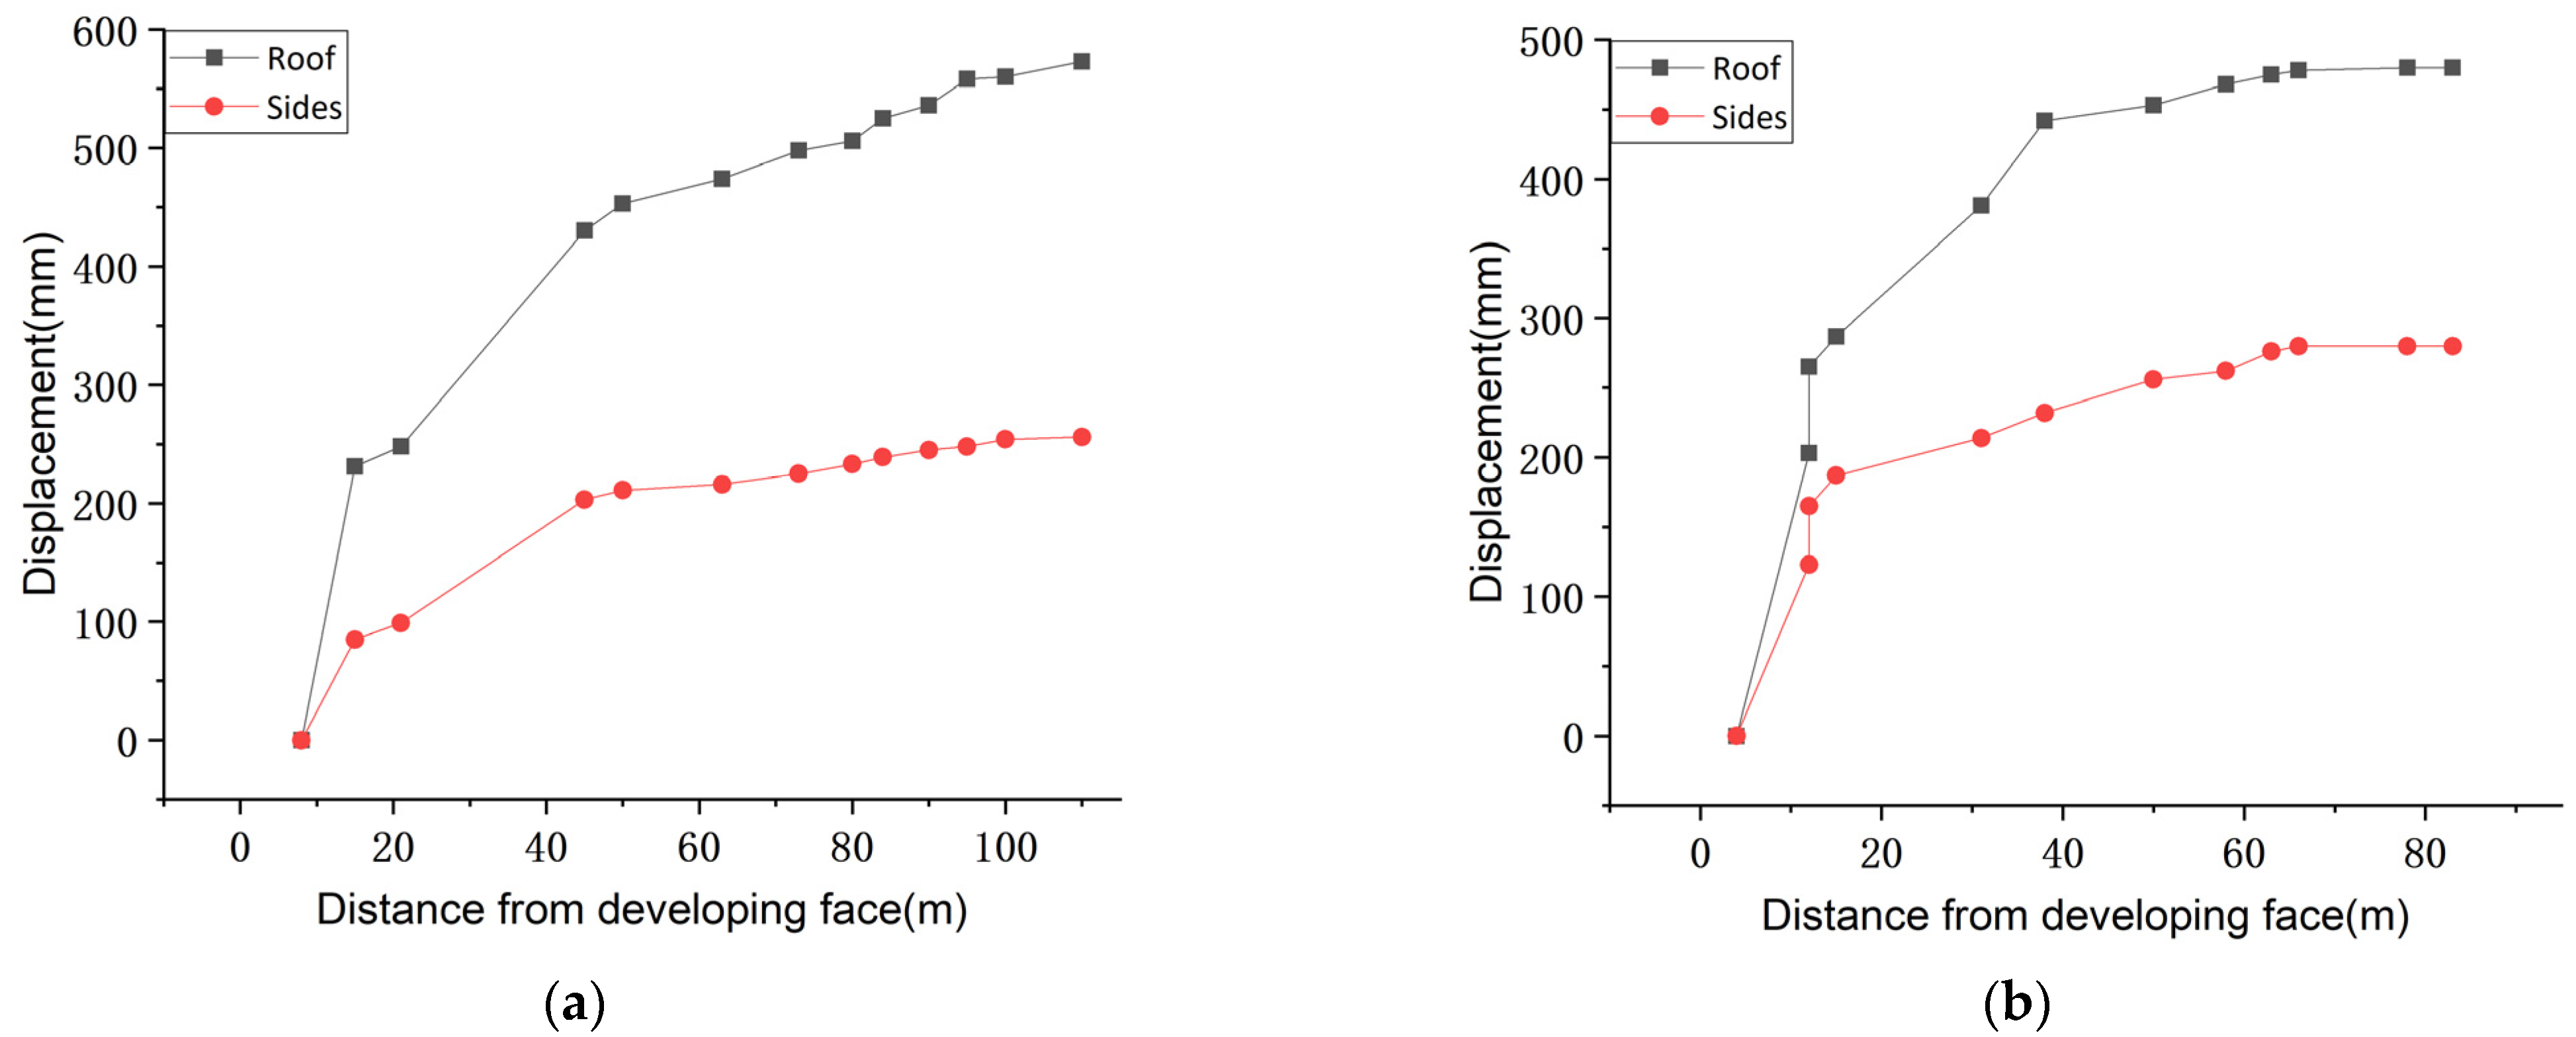
In order to evaluate the roadway deformation quantitatively, two displacement monitoring stations were arranged in the primary supporting area to monitor the roof subsidence and side convergence using the cross distribution method. The monitoring results are shown in Figure 5. As can be seen from the figure, the roadway deformation can be divided into three stages: intense deformation stage, slow deformation stage, and relatively stable stage. The dividing points of the three stages are 18 m and 60 m away from the heading, respectively. However, as the results of station 1 indicate, the rock mass in this area is still in continuous deformation. Finally, the roof subsidence of the two stations is 573 mm and 480 mm, respectively, and the convergence of the two sides is 256 mm and 280 mm, respectively. To sum up, although the roof of the roadway is supported by a full anchor cable, the large deformation of surrounding rock is still not controlled. Moreover, due to the influence of faults, the roof deformation is much greater than that of the side, which again proves that the roof needs to be strengthened and the surrounding rock modified to achieve long-term stability.
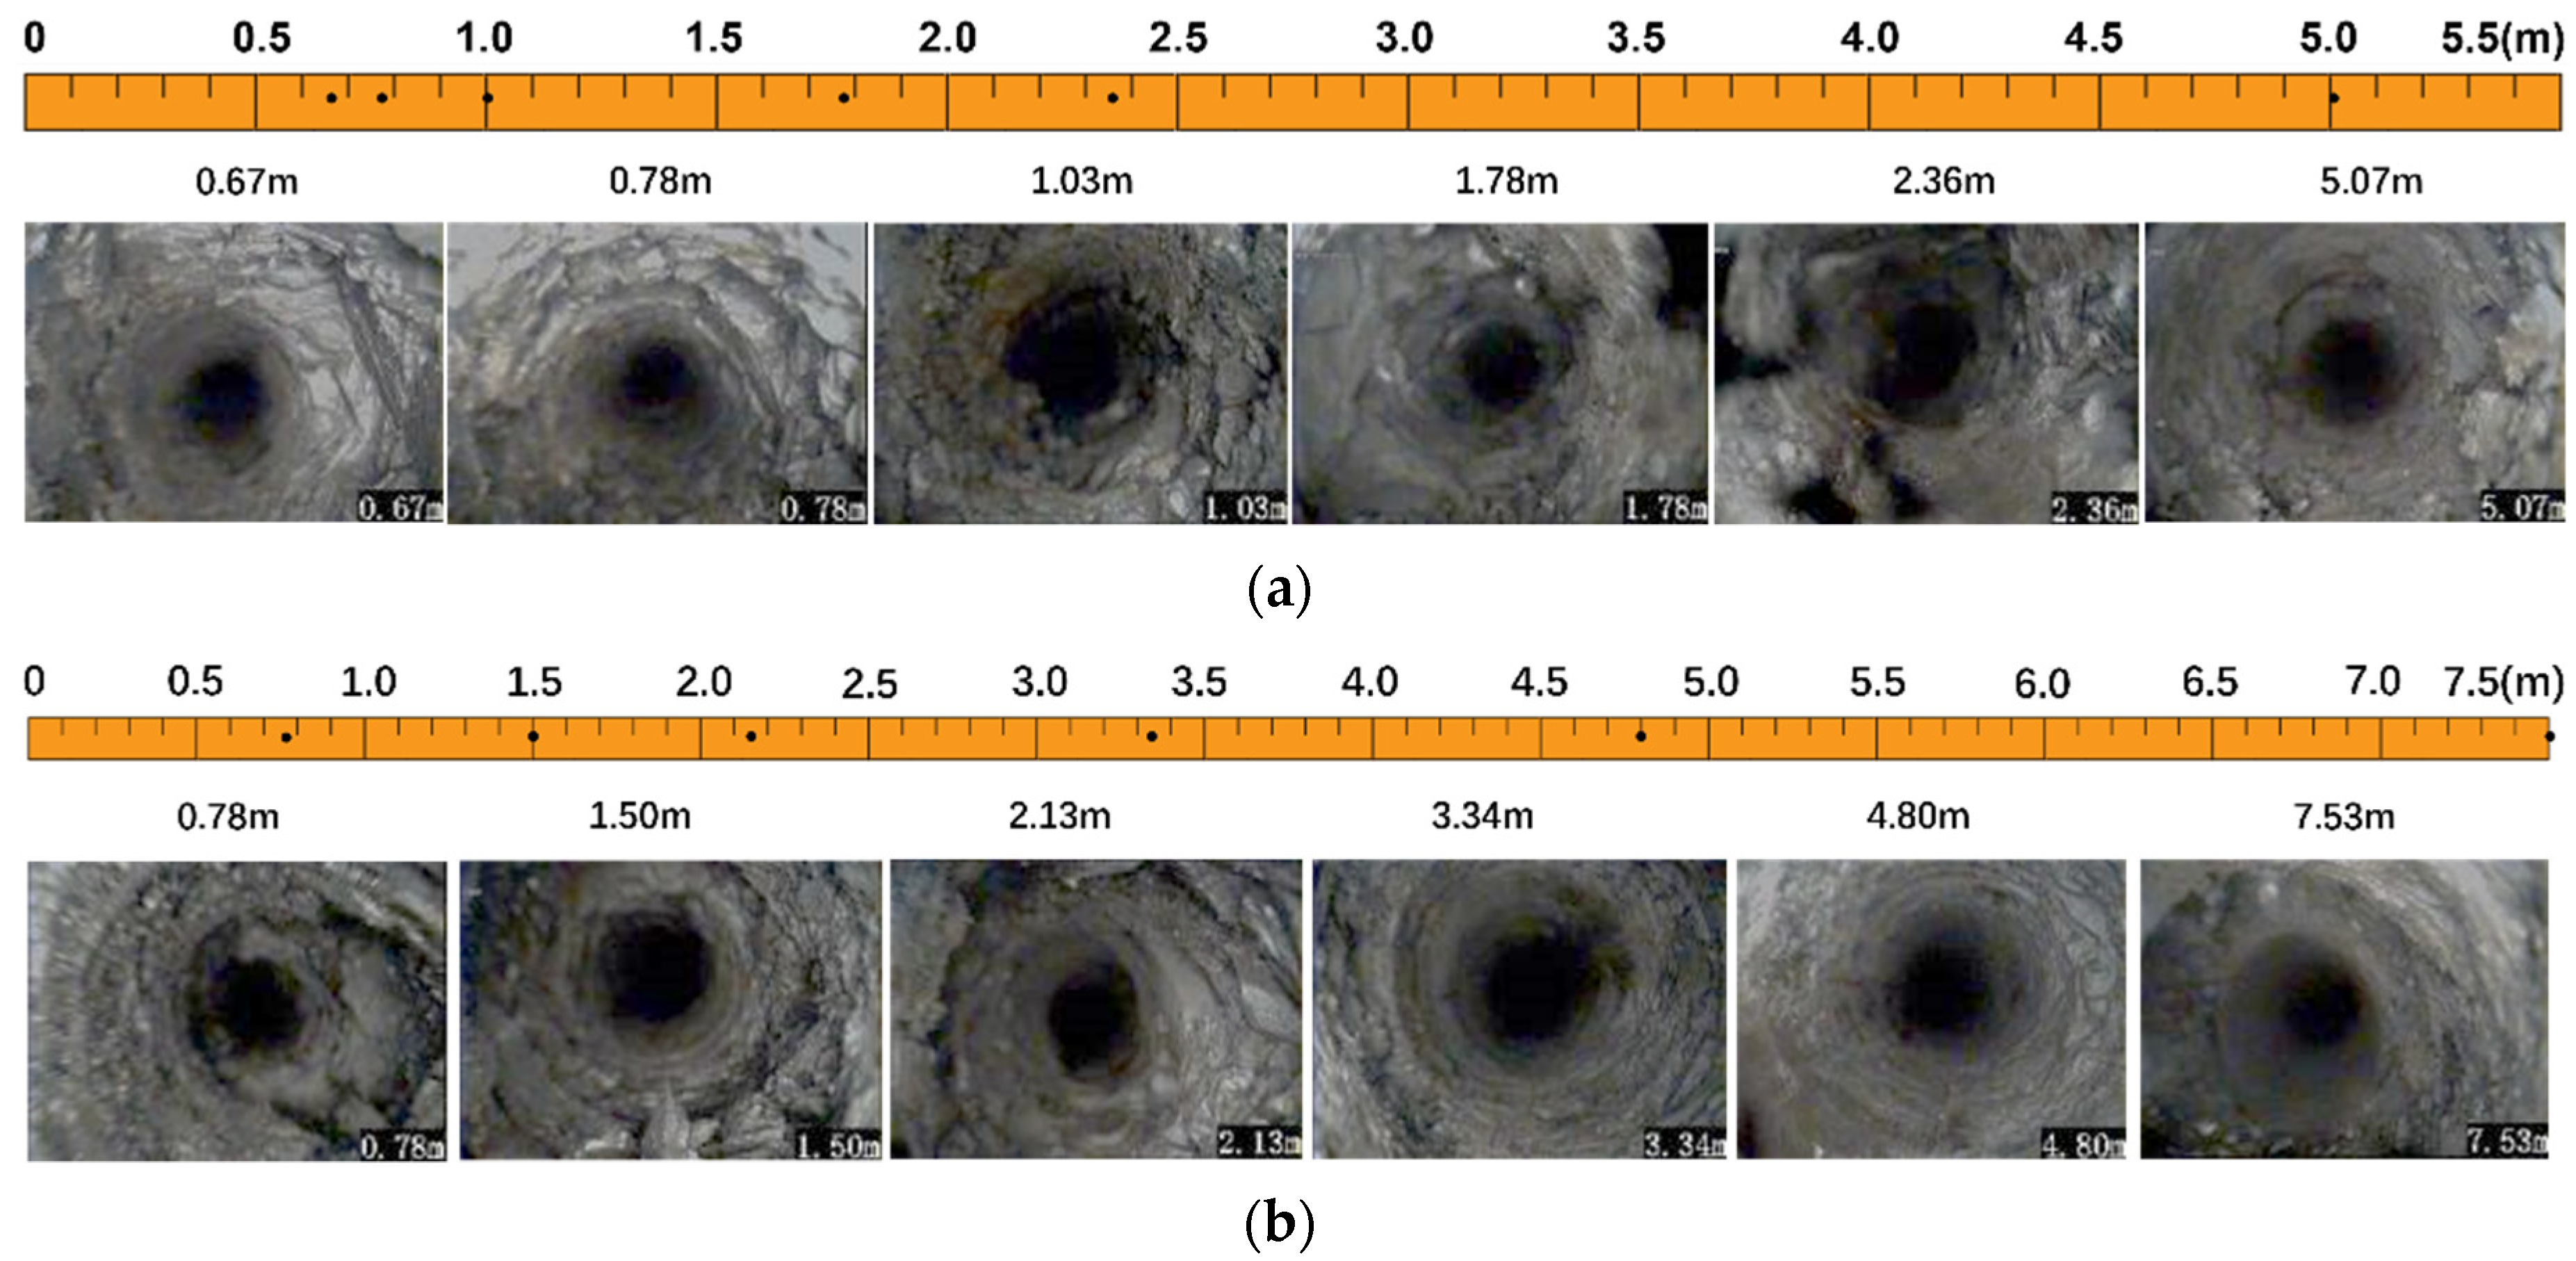
In order to further determine the development of cracks in the roadway surrounding rock, borehole peepholes were used to characterize the evolution of cracks in the roof. In the fault-concentrated occurrence area, two peepholes were arranged, respectively, defined as K1 and K2, with a depth of 8 m. The images obtained from the peepholes are shown in Figure 6.
The peephole K1 is located within the range of 50~150 m, where there are many faults with a drop of 1 m. As can be seen from Figure 6a, the fragmentation of the roof rock mass is very serious within the range of 2.4 m, and cross-cracks are highly common. The maximum depth of the fracture evolution observed through this peephole is 5.1 m, and there are as many as 42 separation fractures. The peephole K2 is located within the range of 150 m~200 m, where the number of faults is small, but the faults have a relative large drop of 2 m. From Figure 6b, it can be seen that the integrity of the peephole wall is relatively poor, and the number of separation fractures reaches up to 64. The maximum depth of the fracture evolution observed through this peephole is 7.5 m, and nine annular cracks are distributed between 5.5 m and 7.5 m in the roof.
Through the analysis of the peephole results at different positions of the 5206 track roadway, it can be seen that the evolution of the fracture separation layer is highly correlated with the fault drop. On the one hand, the shallow fragmentation degree of the area near the medium-drop fault is significantly higher than that near the low-drop fault area. In the case of the peephole K2, the area with a high damage degree is up to 5.5 m, while the damage depth of the peephole K1 is only 2.4 m. On the other hand, the fracture evolution depth near the fault with a moderate drop (7.5 m) is higher than that of the fault with a small drop (5.1 m). The fracture of the surrounding rock evolved to the depth of the roof and crossed the second-stage cable anchoring zone, indicating that the rock mass in the anchoring zone undergoes a change from elastoplastic deformation to plastic deformation.
According to the investigation and monitoring of the track roadway in 5206 working face, the roadway deformation analysis in the fault area is as follows:
(1)
The shallow coal rock mass is broken, and the overall subsidence of the roof is rather significant. The roof in the fault-concentrated area presents bulging deformation of different degrees. According to the degree of deformation, the area is divided into two categories. In the range of 130~200 m, the roof subsidence is the most severe in the medium fault drop area, which is about 800 mm. However, in the 50 m~130 m area, there are few faults, and the fault drop is small; and the roof deformation is relatively small. Therefore, it can be concluded that high ground stress and tectonic stress are the main causes of roof breakage and subsidence;
(2)
The synergy effect of the original supporting components is poor, and the supporting quality is insufficient. ① With low stiffness and a poor prestress diffusion effect, the metal mesh cannot cooperate with the anchor cable, thus failing to strengthen the constraints actively. ② The coordination between the 4.3 m-long cables and 6.3 m-long cables is rather poor, thus failing to provide a continuous strengthening control over the surrounding rock. As revealed by the field investigation, the prestress of the anchor cable is generally between 40 kN and 110 kN, which is relatively low. Accordingly, its reinforcement effect on the rock mass in a large range is rather limited. In this case, the two-stage support system is gradually destroyed, which is another reason for the large deformation of the surrounding rock;
(3)
The damage degree of the surrounding rock in fault area is high, and the long-term control of the surrounding rock cannot be realized without modification. The failure effects of the different fault drops are different, but the common feature is that the shallow surrounding rock is relatively prone to be fractured, which will reduce the strength and flexural stiffness of the anchorage zone and is not conducive to long-term control of the surrounding rock.

3. Distinct Element Numerical Model and Monitoring Scheme

3.1. The Determination of Model Parameters

UDEC (Universal Distinct Element Code) is a discontinuous mechanics method that uses distinct element theory to provide accurate analysis for underground engineering. It is usually applied to simulate mechanical response of jointed rock strata, such as stress displacement and crack evolution under static and dynamic loads [13]. In the model, the mechanical properties of rock mass are jointly determined by the mechanical parameters of block and contact surface. The block parameters include density, volume modulus, and shear modulus, and the parameters of contact surface include normal stiffness, tangential stiffness, cohesion, internal friction angle, etc. The volume modulus and shear modulus in the model are determined by the elastic modulus and Poisson’s ratio, and the specific conversion relationship is shown as [31]:
K = E 3 ( 1 2 ν )
G = E 2 ( 1 + ν )
In Voronoi module, the elastic modulus of polygon blocks depends on the normal stiffness and tangential stiffness of the contact surface, and its calculation formula can be expressed as:
k n = 10 [ K + 4 3 G Δ Z min ]
k s = 0.4 k n
where k n denotes the normal stiffness; k s is the tangential stiffness of the contact surface; and Δ Z min represents the minimum side length of a block.
Therefore, in order to determine the mechanical parameters of model blocks and contact surfaces, it is necessary to use the mechanical parameters of real rock strata obtained through laboratory experiments to verify the rationality of the model parameters.
(1)
The determination of rock mass parameters
The parameters obtained through laboratory uniaxial compression and tensile experiments are rock parameters, while the parameters applied in UDEC 7.0 software are rock mass parameters. Therefore, in order to apply the mechanical parameters obtained in the laboratory, these parameters need to be converted.
Zhang and Einstein [32] proposed an equation for the conversion of rock elastic modulus and rock mass elastic modulus, as shown below:
E m E r = 10 0.0186 R Q D 1.91
where E r denotes the elastic modulus of rock; E m refers to the elastic modulus of rock mass; and R Q D is the rock quality designation, which is obtained through the various peepholes in the roof of Zhaojiaba coal mine.
Singh and Seshagiri [33] found that there is a very strong linear relationship between the n power of the elastic modulus ratio between rock and rock mass and the compressive strength ratio between rock and rock mass, which is expressed as follows:
σ c m σ c = ( E m E r ) j
where σ c denotes the compressive strength of rock; σ c m refers to the compressive strength of rock mass; and the value of j is usually set at 0.56.
The tensile strength of rock mass can be obtained using the following equation:
σ t m = k σ c m
According to Hoek and Brown [34], k is generally set at 0.05~0.1. Therefore, it is set at 0.1 in this study.
The rock mechanics parameters were converted into rock mass mechanics parameters through calculation and are shown in Table 2;
(2)
The validation of model parameters
According to Equations (1)–(4), the rock mass parameters were calculated to obtain the microscopic parameters of the contact surface. Accordingly, the uniaxial compression plane model was established using UDEC software, with which the uniaxial compression simulation experiment was carried out. Then the simulated mechanical parameters, such as compressive strength and elastic modulus of rock strata, were compared with the parameters obtained from the laboratory experiments.
After several parameter adjustments, the microscopic parameters and failure mode were basically consistent with the results obtained from the laboratory experiment. Therefore, the microscopic parameters at this time were selected as the final mechanical parameters of the model, as shown in Table 3.
The error of the experimental and simulated values of each rock layer was within 8%, indicating that the mechanical parameters of the model block and contact surface are in good agreement with the actual conditions, and the values are reasonable.

3.2. The Establishment of Distinct Element Numerical Model

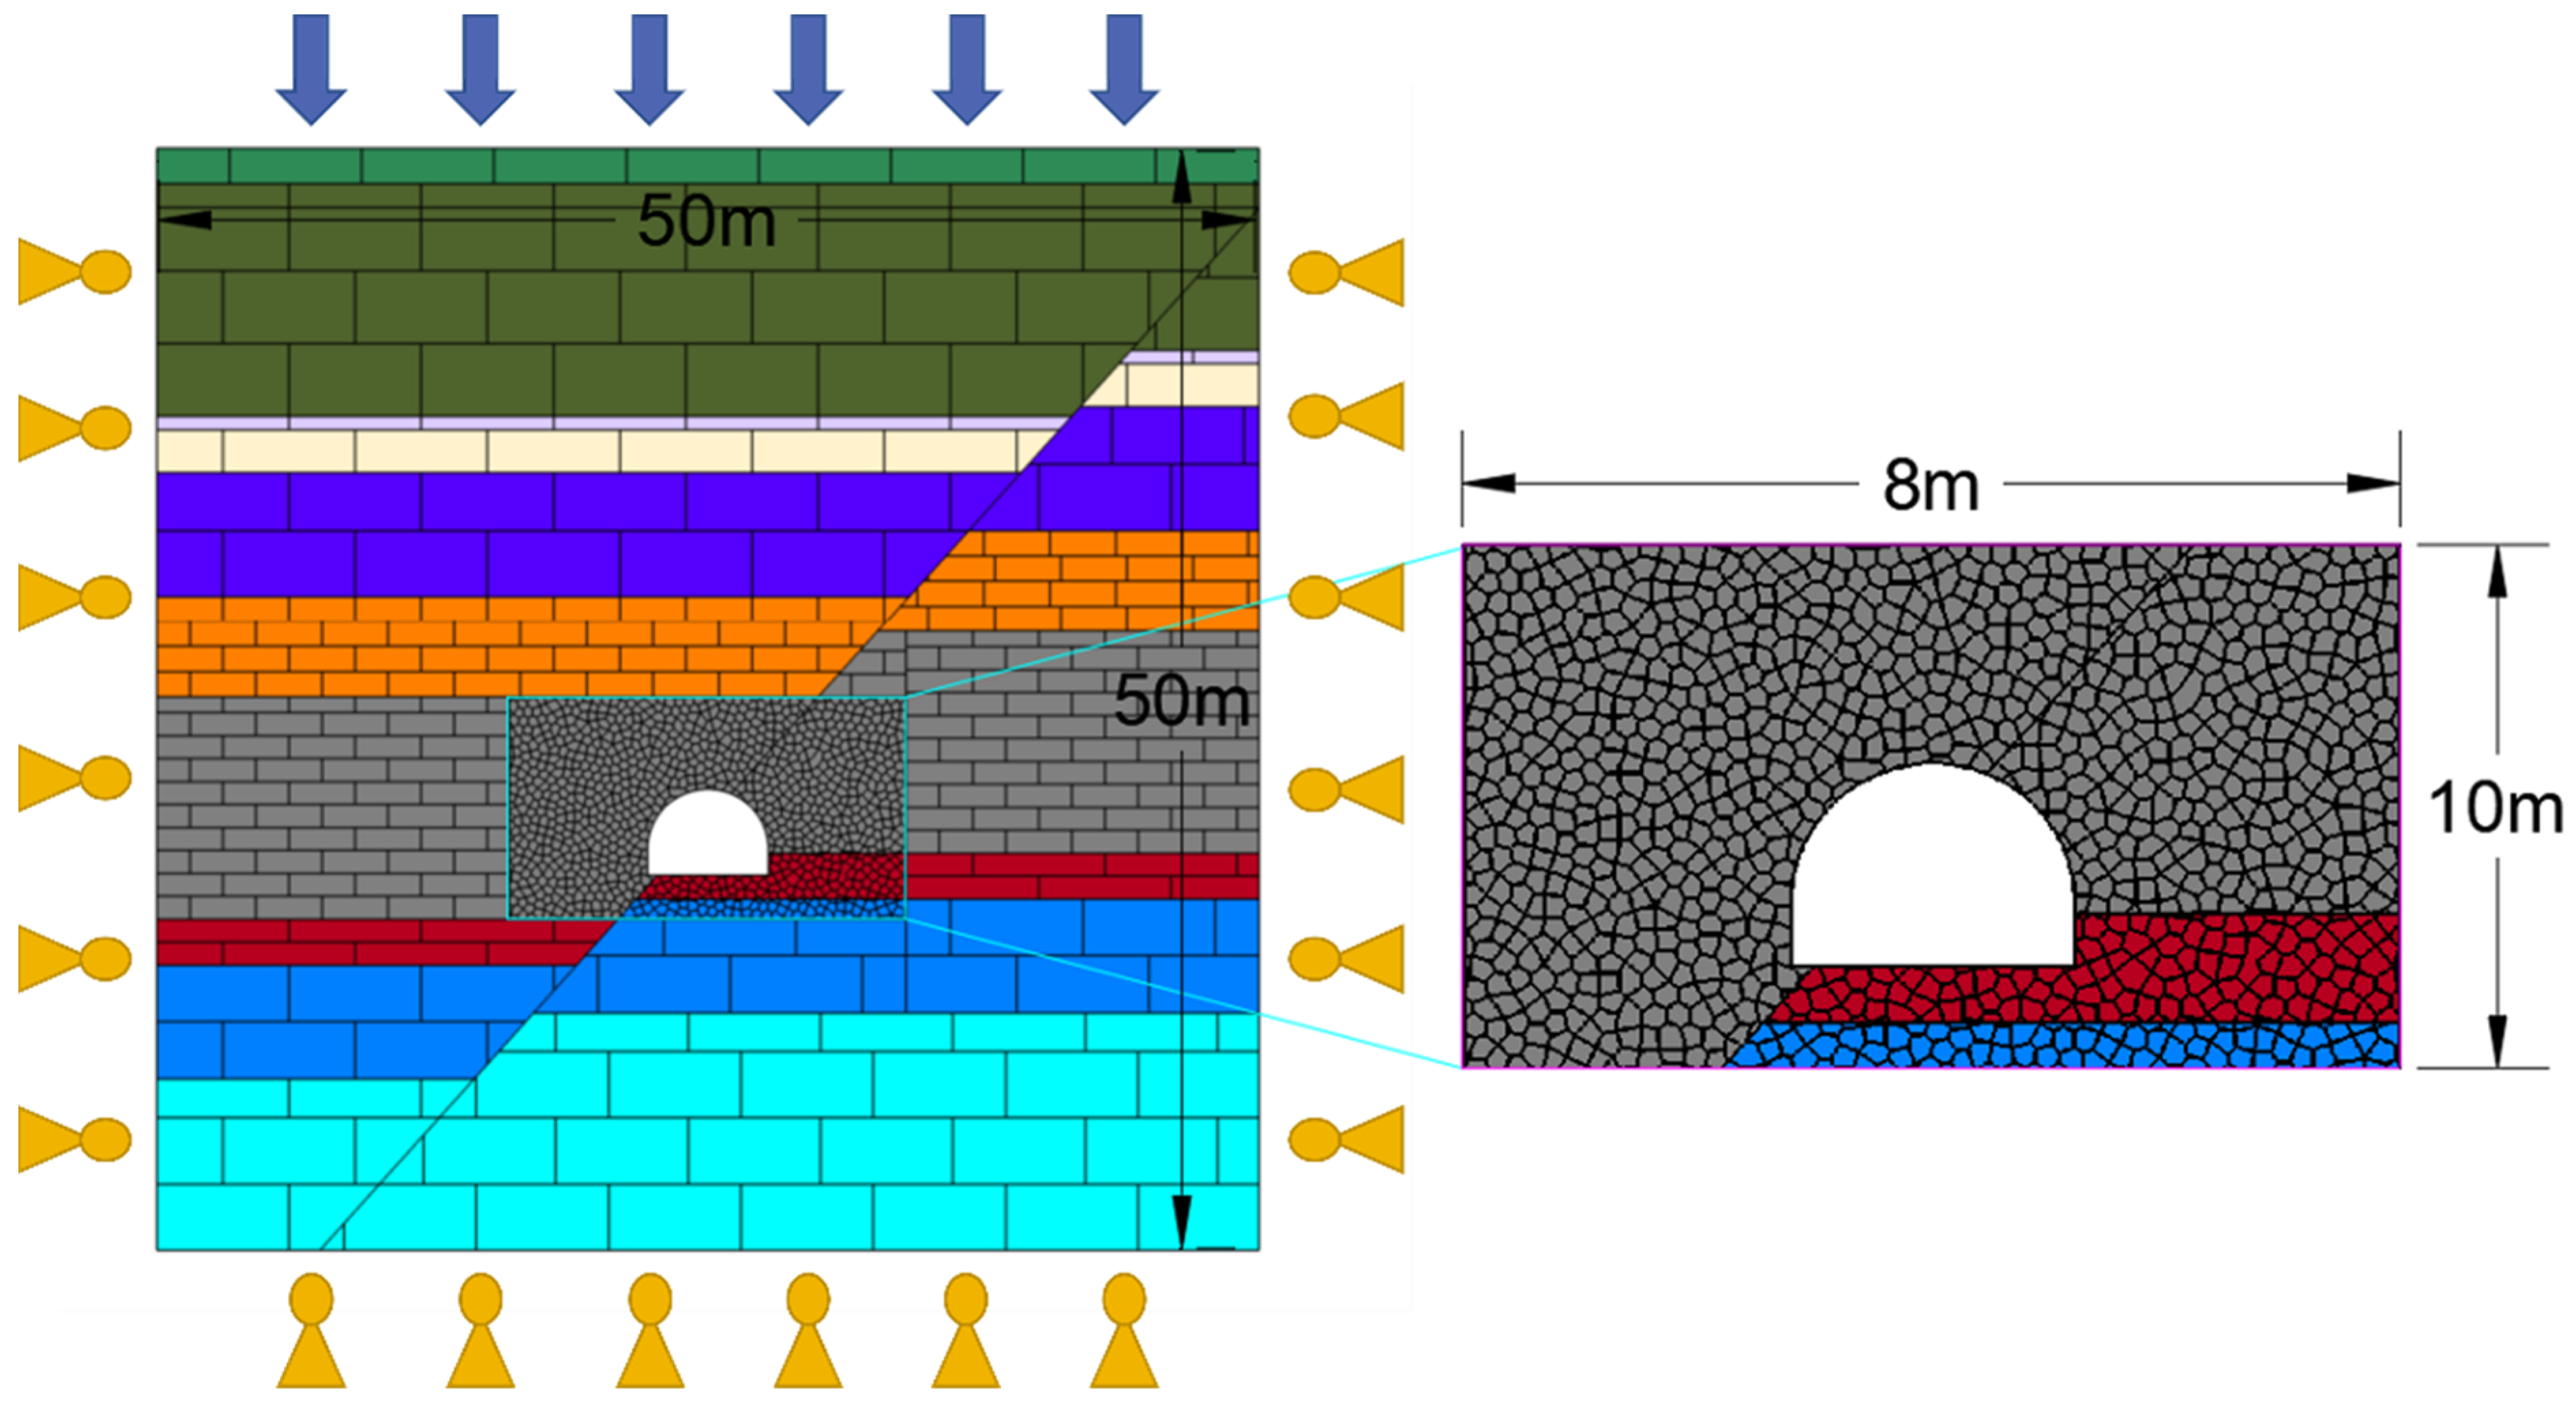
According to the rock occurrence in the 5206 track roadway, the UDEC model was designed to be 50 × 50 m, as shown in Figure 7. As can be seen from the figure, a normal fault with a drop of 3 m and dip angle of 480 was designed in the model. This fault divides the model into two sections: the left section and the right section. The former consists of 10 layers, which are siltstone, pebbly coarse sandstone, argillaceous siltstone, 5# coal, sandy mudstone, 4# coal, sandy mudstone, coal, siltstone, and carbonaceous mudstone from the bottom up, respectively. The latter contains 9 layers, without the siltstone layer at the uppermost, compared with the left section. This model adopted the mechanical parameters defined in Section 3.1, which are shown in Table 3.
The model simulation mainly aims to study the influence law of excavation on the deformation of surrounding rock in the fault area. In order to improve the computational efficiency, only the area of interest was treated with encryption processing to generate polygons with an average side length less than 0.3 m; the other parts of the model were divided into rectangular blocks. Vertical and horizontal stresses were applied to the upper boundary of the model to simulate the overburden stress. The horizontal displacement of the left and right boundaries and the vertical displacement of the bottom boundary of the model were constrained. The roadway excavation was simulated by removing the roadway block, and the model was run to an equilibrium state. Then, the deformation and stress distribution of the roadway roof and sides were observed in different regions.

3.3. Model Monitoring Scheme

(1)
Stress Monitoring
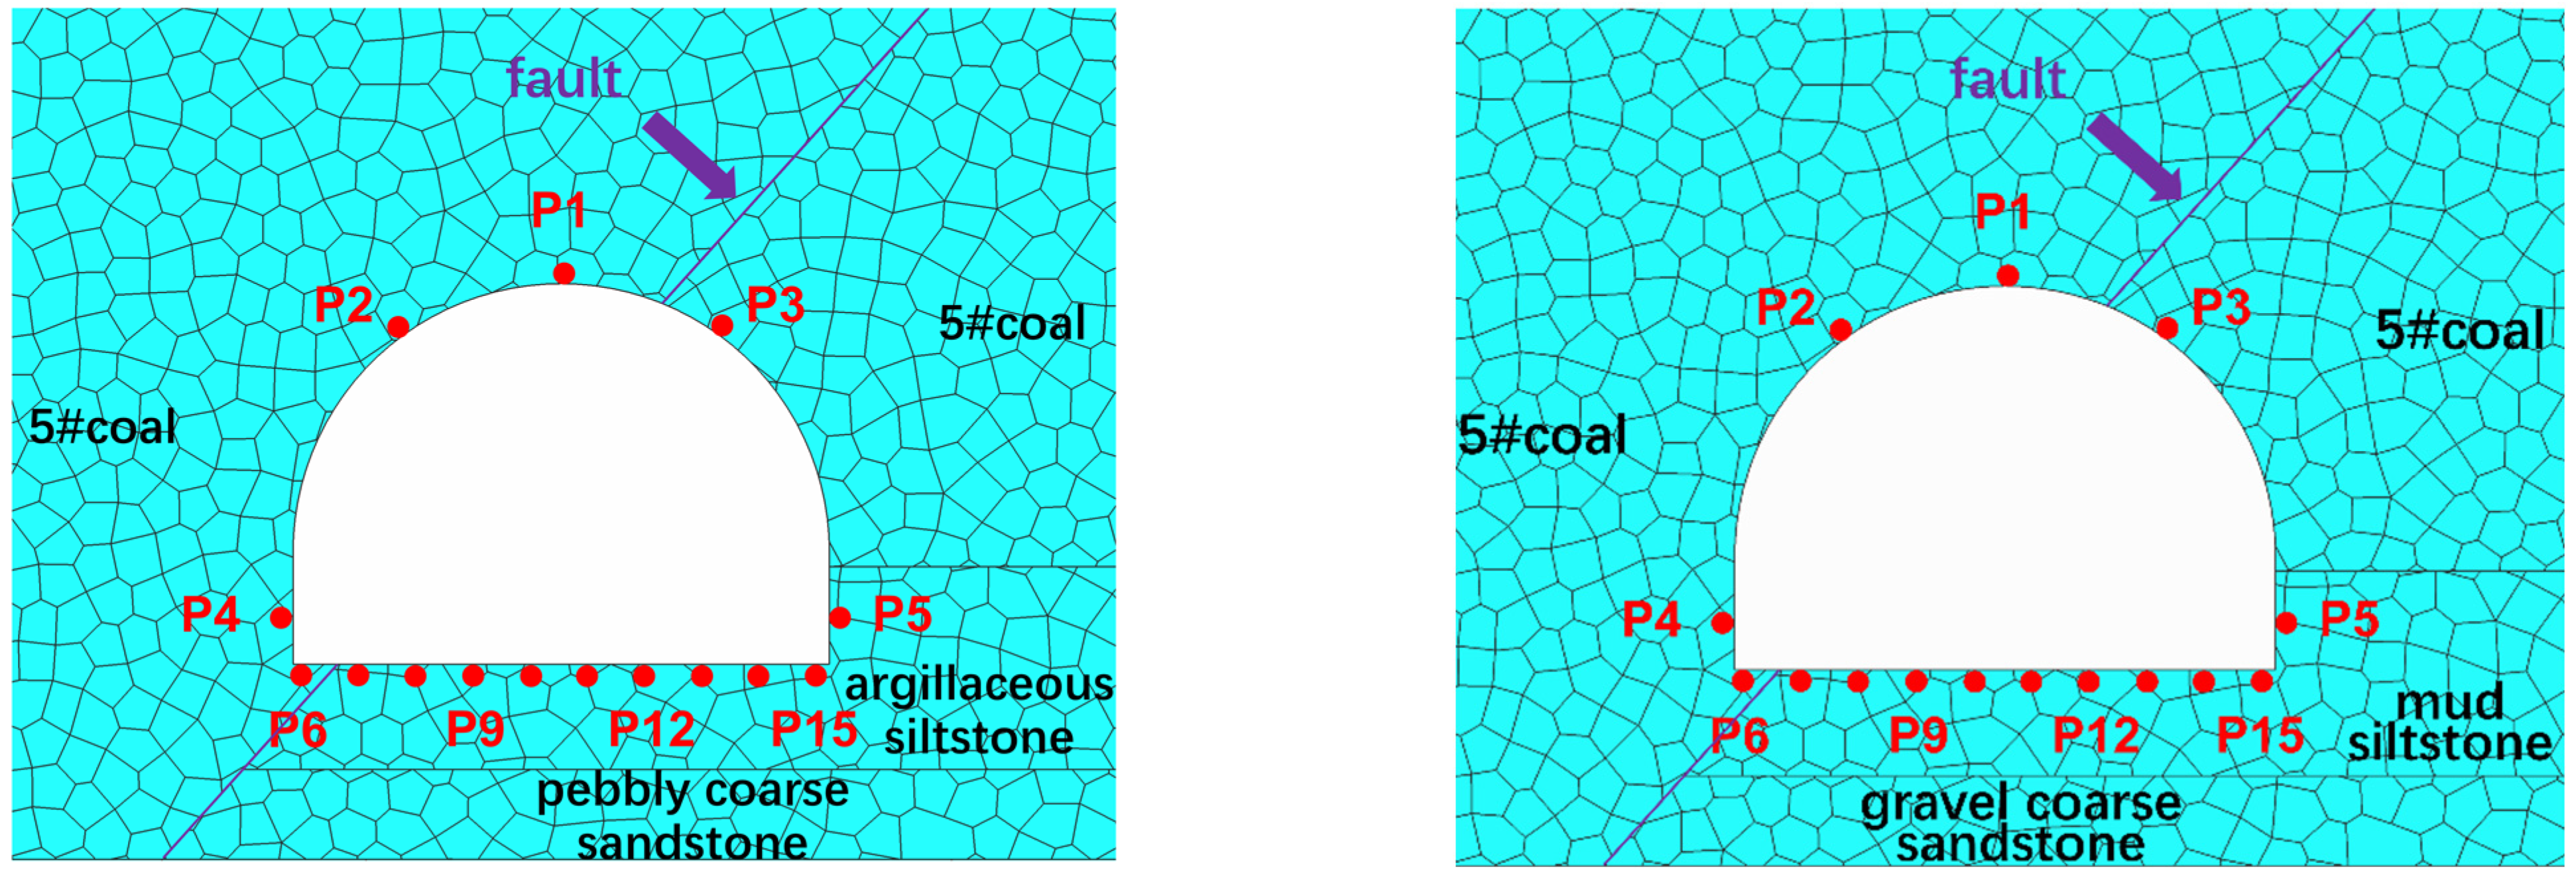
In order to compare and analyze the differences in surrounding rock deformation under different supports, stress monitoring points were arranged on the surface and at a depth of 1 m of the roadway roof, two sides, and the left and right arches (30° to the arch center) to monitor the evolution process of horizontal stress and vertical stress. The specific monitoring point distribution is shown in Figure 8.
(2)
Displacement Monitoring
Displacement monitoring points were arranged on the surface and at a depth of 1 m of the roadway roof, two sides, and the left and right arches (30° to the arch center) to monitor the evolution law of roadway surface displacement. The specific monitoring point distribution is shown in Figure 9.

4. Deformation Mechanism of Roadway Surrounding Rock under Influence of Unidirectional Fault Structure

4.1. Stress Analysis of Surrounding Rock

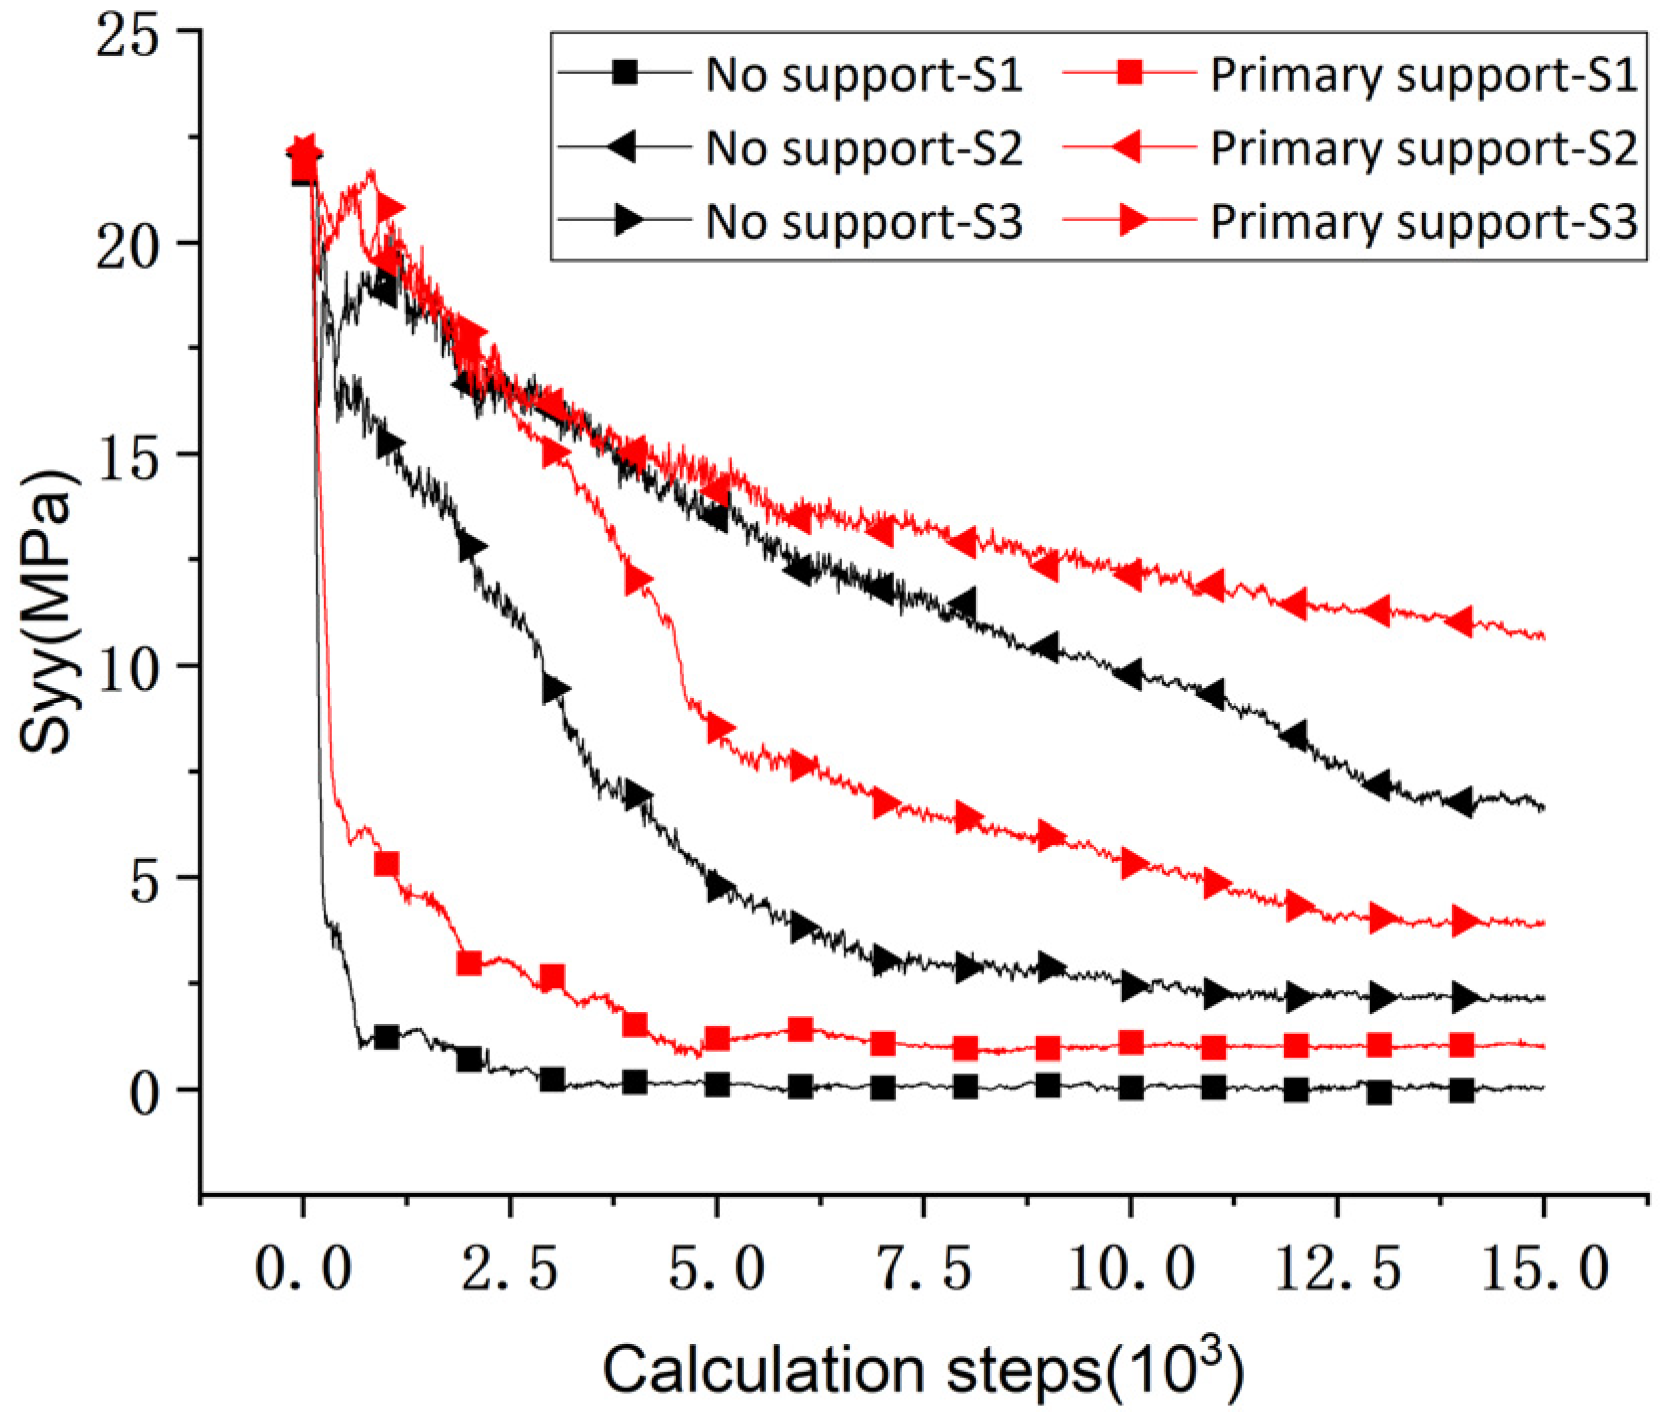
Figure 10 displays the SYY stress evolution law in different positions of the roadway roof. Once the excavation is initiated, the roof stress is released rapidly, indicating that the SYY stress is released quickly when the roof is not supported. At this time, the stress changes from three-way to two-way, and the bearing capacity of the roof gradually decreases. However, after the primary support is adopted, due to the low preload, the SYY stress release is still rapid, and the stress level is improved compared with that without support but only by 0.89 MPa. Therefore, it can be concluded that the common anchor cables can only exert a rather limited control effect on the roof.
The SYY stress on the right arch is released faster than that on the left arch. This is because the right arch is located in the fault area, and the high concentrated stress leads to the rapid reduction of vertical stress after excavation. Although the primary support inhibits the release of roof stress in the early stage, it fails to work significantly in the middle and late stages. In contrast, the primary support has a better effect on the vertical stress suppression in the left arch, and the stress level increases by 4.0 MPa (58.8%) compared with that without support.
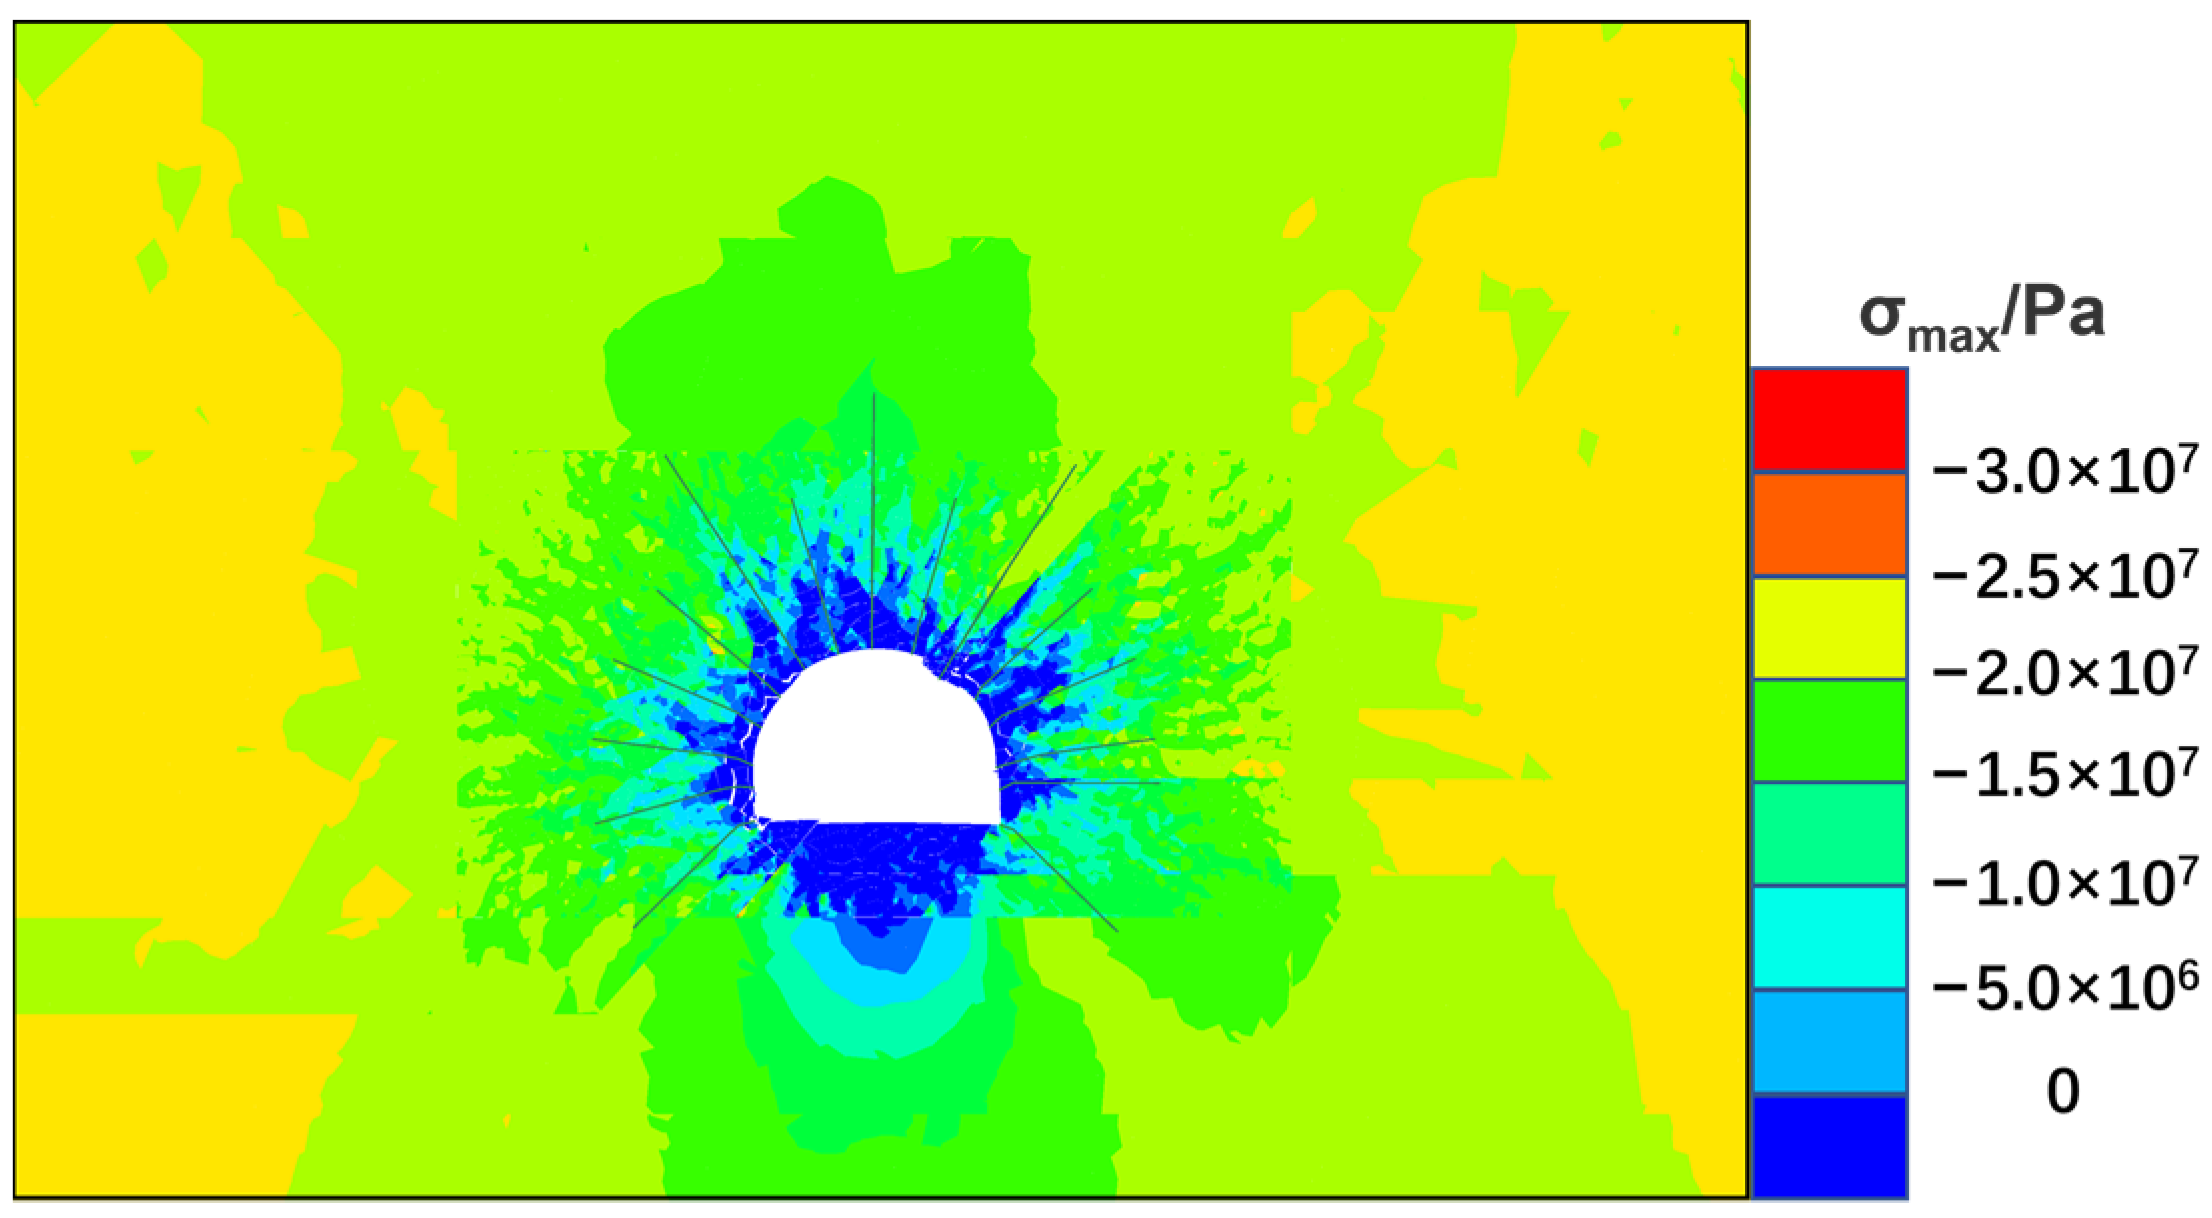
Figure 11 shows the SXX stress evolution law of the two sides of the roadway. The stress at both sides of the roadway is released rapidly after excavation. The significant subsidence of the roof strata accelerates the release of strain energy at the side rock mass. When the primary support of the common anchor cables is conducted, the stress level on the right side is significantly improved, but the stress level on the left side does not change noticeably. Figure 12 shows the comparison of maximum principal stress distribution under the conditions of no support and primary support. As can be seen, the primary support significantly improves the stress state in the left arch, right side, and bottom floor, and the stress relaxation zone decreases as a whole. However, the stress state control effect is not obvious in the right arch and left side where the fault is located.

4.2. Displacement Analysis of Surrounding Rock

Figure 13 displays the displacement vector diagram of the surrounding rock without support and with the primary support. As can be seen from Figure 13a, when there is no support, serious uneven deformation occurs in the roadway surrounding rock. The maximum deformation in the roof appears at the fracture on the right, reaching up to 916 mm; the maximum deformation on the left is 760 mm. The floor heave on the left corner is larger than that on the right, and the maximum floor heave is 610 mm. The deformation of the left and right sides is 445 mm and 180 mm, respectively.
When the primary support scheme is conducted, the stability of the left side of the roof, the two sides, and the floor is greatly improved, and the roadway deformation is still concentrated in the fault area on the right side of the roof, as shown in Figure 13b. The deformation of the left side of the roof, the two sides, and the floor is 410 mm, 380 mm, and 288 mm, respectively, with a reduction rate of 46%, 39%, and 53%. However, the deformation of the fault area on the right side of the roof is still large, producing serious subsidence. This indicates that the primary support scheme fails to control the large deformation of the surrounding rock under the influence of a one-way fault.
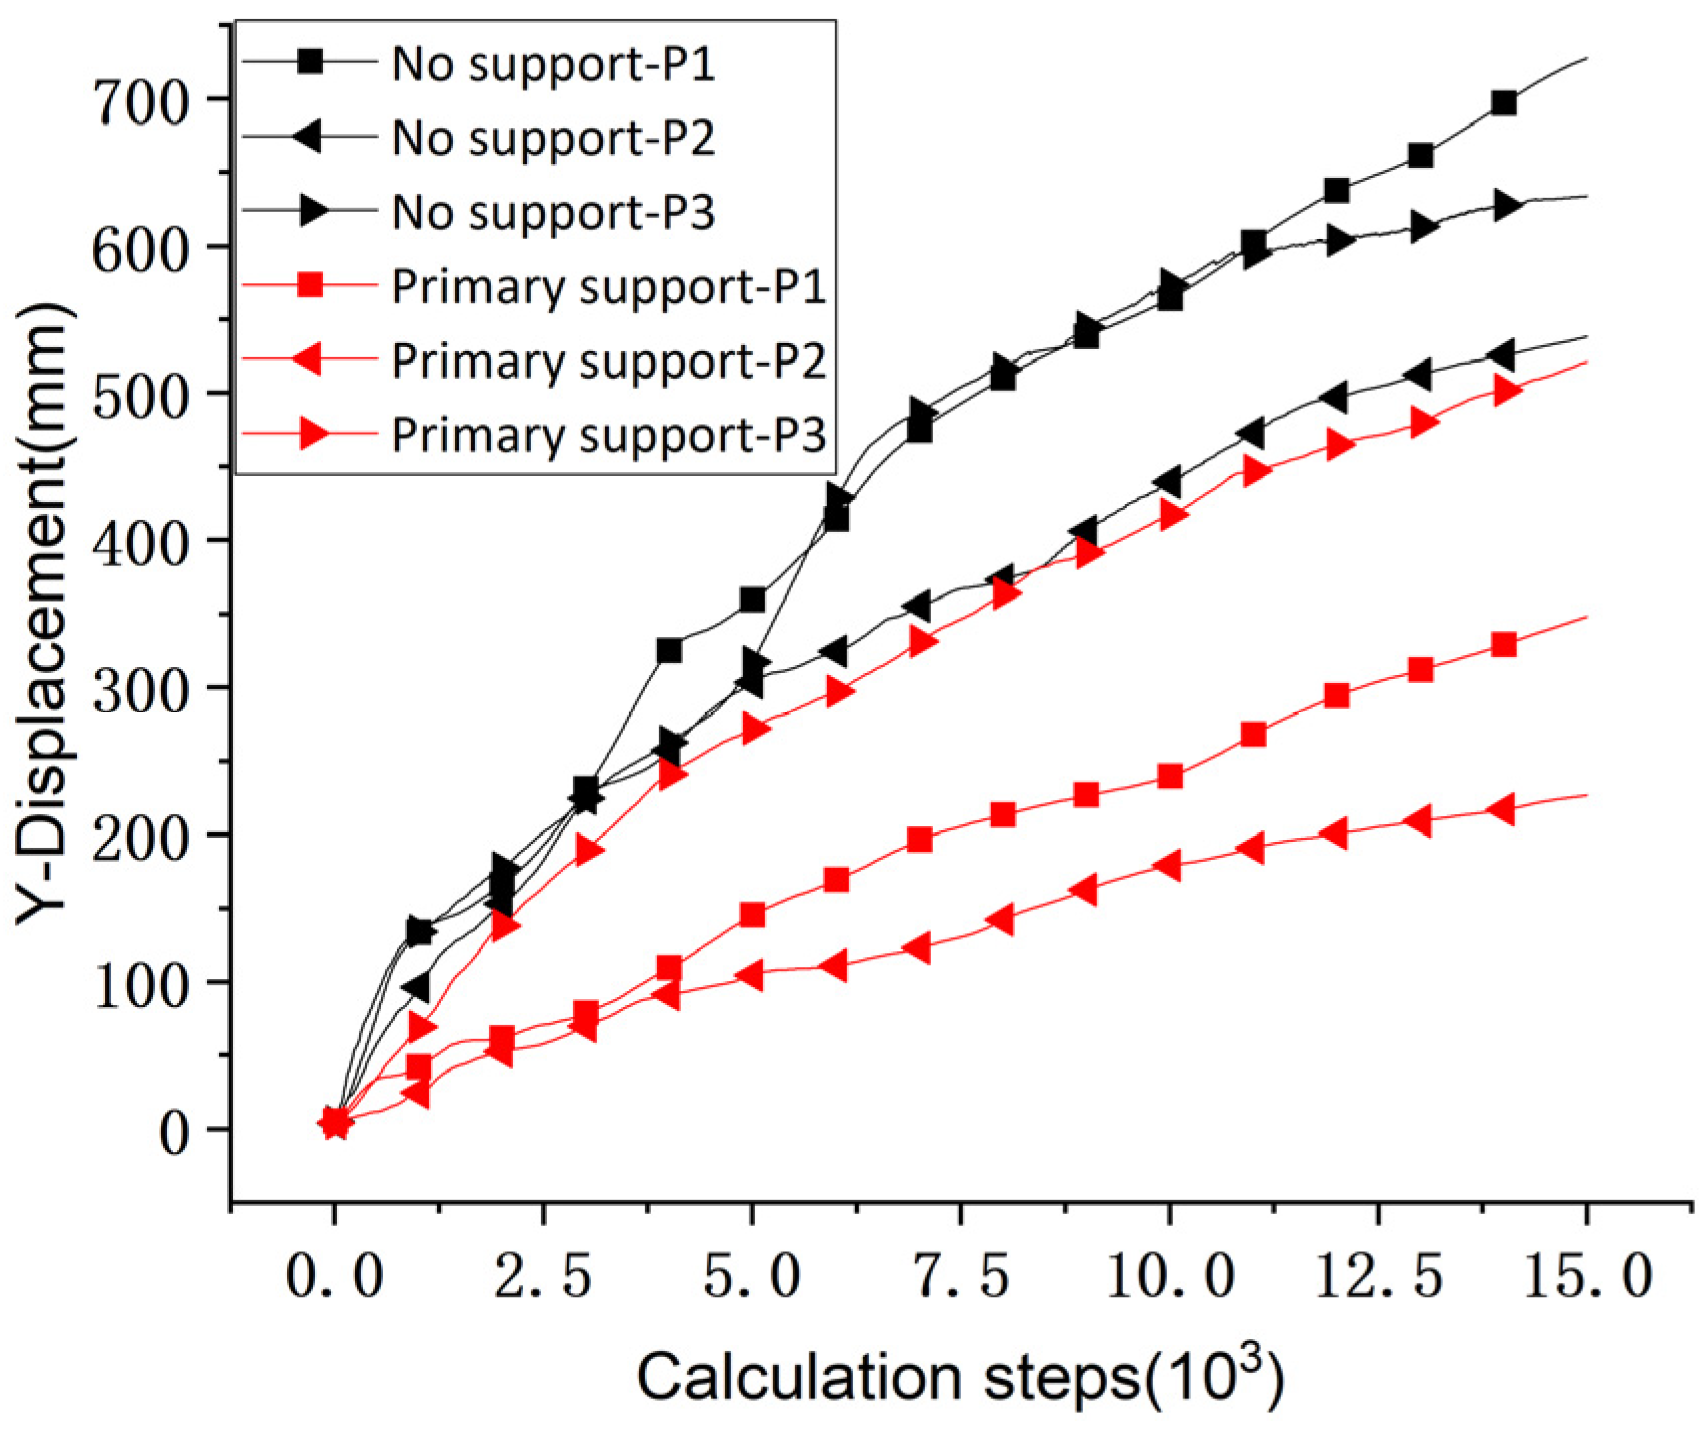
As is shown in Figure 14, with the primary support, the maximum roof subsidence is 348 mm, a reduction of 52.1% compared with the situation without any support. When there is no support, the roof subsidence is rapid in the early stage of excavation, then the deformation rate slows down and speeds up again in the middle and late stages. After the primary support is adopted, the roof control works to some extent, but the displacement evolution trend does not change.
Under the primary support condition, the maximum subsidence of the left arch decreases from 538 mm to 227 mm, a reduction of 57.8%. The right arch is located in the fault occurrence area. Its maximum subsidence decreases from 634 mm to 521 mm, which is only reduced by 17.8%. This indicates that the primary support is far from meeting the support requirements of the fault occurrence area, and it is urgent to optimize the support parameters.
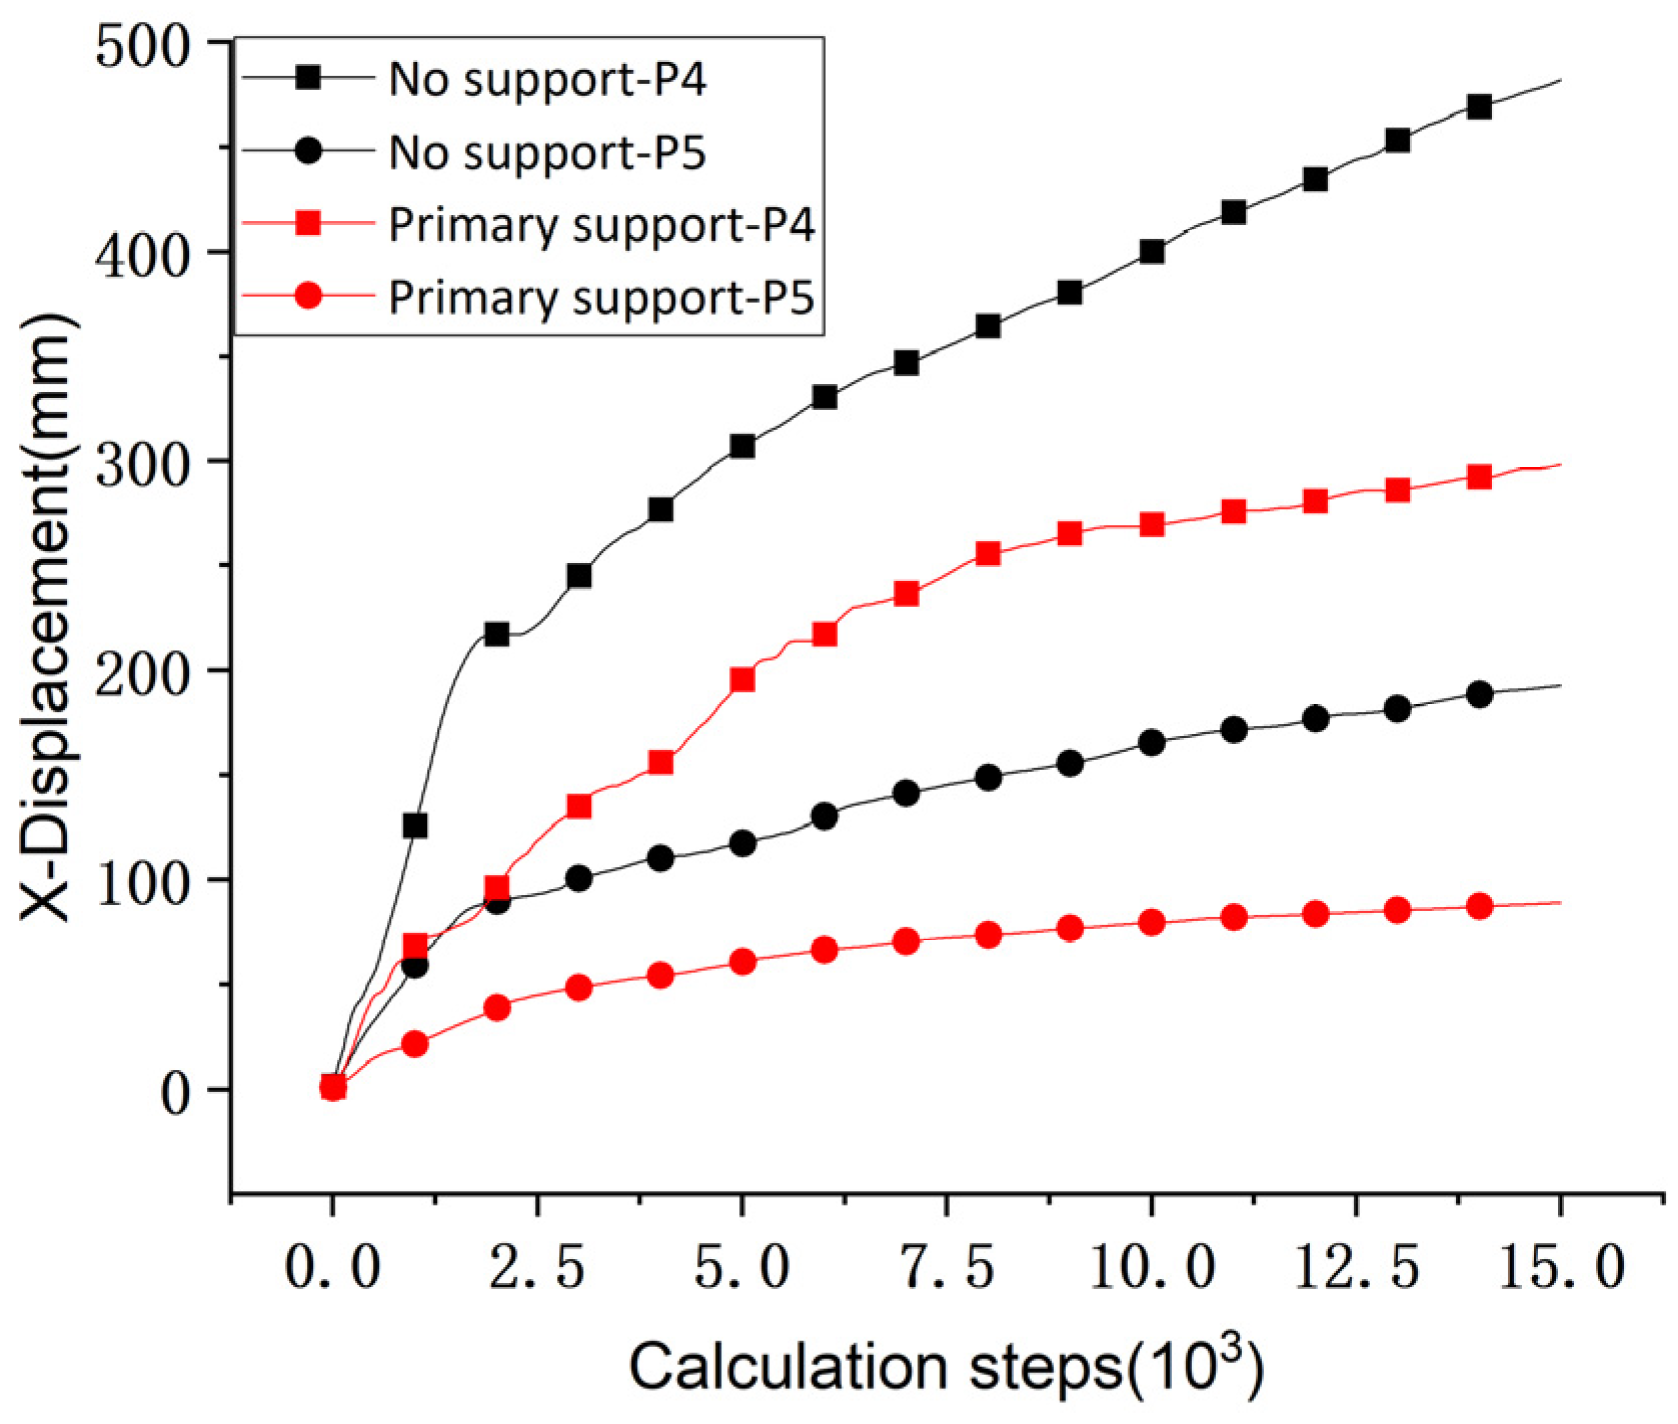
Figure 15 displays the horizontal displacement evolution of the left and right sides of the roadway. The results show that after the primary support is adopted, the horizontal displacement of the left side decreases by 38% from 481 mm to 298 mm. The right side is located in argillous siltstone with strong compressive capacity, and its deformation is significantly reduced compared with that of the left side. The transverse displacement is reduced by 53.6% from 192 mm to 89 mm. It shows that the primary support has good control over the deformation of the right side, but because the left side is close to the fault area and affected by the concentrated stress, the existing support does not achieve the ideal control effect.
Figure 16 shows the overall deformation of the roadway floor. Compared with the right side of the floor, the left side is more seriously deformed, mainly because the left side is at the fault position. After the primary support scheme is adopted, the overall situation of floor heave is obviously alleviated, but the floor heave trend is basically the same as that without support, indicating that the primary support does not significantly inhibit floor heave, and no wedge carrier is formed to inhibit the deformation of the bottom fault area.

4.3. Failure Mechanism of Surrounding Rock under the Influence of Unidirectional Fault Structure

As shown by the results of the surrounding rock deformation, the roof subsidence is obvious, the two sides’ shrinkage and floor heave are serious, and regional net bags and sags are common occurrences. According to the preliminary analysis, the roof of the 5206 track roadway is composed of several groups of coal–mudstone, and the thickness of each rock stratum has been changing, resulting in the uneven occurrence of the surrounding rock and low rock strength. Under the comprehensive influence of the superimposed fault structure, the surrounding rock breakage and asymmetric deformation would happen easily.
The failure cause of the surrounding rock under the influence of a single fault was further analyzed:
(1)
The redistribution of stress
The existence of a fault would induce significant changes in the stress field near the fault, which causes the stress concentration of the surrounding rock. When the strength of the surrounding rock is weak or there are composite rock layers, the surrounding rock is easily damaged;
(2)
Dynamic stress response
When the fault is active, it creates inertial forces that cause dynamic stress responses in the surrounding rock mass; and these responses can cause strong vibrations in the surrounding rock mass. The left floor of the 5206 track roadway is located in the fault area, with intense dynamic stress. The fault stress accumulates to the fault in a short time, resulting in the upward bulging of the floor and serious deformation of the left side near the fault;
(3)
Fracture expansion
Fault activity, the geometry of the fault surface, and the mechanical characteristics of the surrounding rock all affect the direction and scale of the fracture expansion. When the fracture expansion reaches a certain extent, the surrounding rock would fail. The right arch of the 5206 track roadway is located in the fault area, where the rock mass is relatively broken. With the excavation of the roadway, the fracture expansion is intensified, which leads to the rapid development of the right arch fracture zone and then causes the overall subsidence of the roof.

5. Hierarchical Continuous Anchorage Technology

5.1. Transboundary Bolt-Grouting Hierarchical Continuous Support

In the early stage of roadway excavation, the surrounding rock is disturbed to form the fissure zone, plastic zone, and elastic zone. The surrounding rock in the fissure zone shows discontinuous deformation characteristics and belongs to the discontinuous deformation zone. The surrounding rock in the plastic zone shows the characteristics of quasi-continuous deformation, which belongs to the quasi-continuous deformation zone. There is only elastic deformation in the elastic zone, where continuous stress transfer can be realized. Accordingly, the elastic zone is classified as a continuous deformation zone. If the anchoring point of the bolt is located in the discontinuous deformation zone and the quasi-continuous deformation zone, it is called boundary support and critical support. Due to the tensile stress generated by the bolt end on the surrounding rock, crack damage occurs in this area, which easily leads to crack expansion and penetration and finally induces the overall displacement of the anchoring zone. If the anchor bolt is anchored to the continuous deformation area, transboundary control can be realized, and the thick-layer anchorage structure is constructed accordingly. In this case, the constraint on the surrounding rock can be strengthened, and this method is called thick-layer transboundary anchorage [35]. Thick-layer anchorage as a primary support structure is the premise of realizing continuous support. A long anchor cable is used as a secondary support to anchor through the shallow anchor layer into the deeper rock layer. Through constructing a deep large bearing circle, a wider range of rock mass is mobilized to jointly bear the roof load, thus realizing hierarchical continuous support. The combined control of magnitude and displacement is realized through long and short anchor cables, which is called the transboundary hierarchical continuous support technology, as shown in Figure 17.
According to the above analysis, the hierarchical continuous support is based on the combined action of long and short anchor cables, among which the thick-layer anchorage structure is the key. Therefore, a high preload is applied to the anchor cables in the early stage of excavation to inhibit the deformation of the surrounding rock and curb the further development of cracks in the thick-layer anchorage area. As the rock mass in the fault area is relatively broken, it is necessary to seal and reinforce the cracks in the anchoring area through hysteretic grouting to improve the strength and stiffness of the thick-layer anchoring structure. This technology can realize continuous stress transfer, eliminate the tensile stress zone of the roof, and improve the bearing capacity of the structure.

5.2. New Support Scheme

According to the engineering geological condition of the 5206 track roadway, several principles of surrounding rock control under the influence of a unidirectional fault structure are put forward based on hierarchical continuous support technology:
(1)
Differentiated support principle
Under the influence of faults, the stress is concentrated in the fault area, causing the surrounding rock to be seriously broken and the fracture separation layer greatly developed. In this situation, the grouting anchor cable support is adopted in the fault area to reconstruct the bearing structure of the broken rock mass. In addition, the anchor cable is set at a depression angle of 15° on the left side near the shoulder socket so that a high-quality wedge anchor solid can be formed in the left bottom angle fault area. The ordinary anchor cable support is adopted in nonfault areas to restrict the crack development of coal rock mass in the roof, thus finally realizing the differentiated and efficient control of the surrounding rock;
(2)
Surrounding rock modification principle
Part of the original first-level ordinary anchor cable support would be changed to a grouting anchor cable support. The grouting method is used to seal the surrounding rock cracks and thus improve the integrity and strength of basic anchor layer;
(3)
Two-stage coordinated anchorage principle
In order to inhibit the long-term deformation of the surrounding rock in the fault area, the second-stage reinforced anchor cable is applied on the basis of the first-stage foundation bearing layer. The practice proves that when the length of the second-stage cable is 1.5~2.0 times that of the first-stage cable, the synergistic control effect is the best. Therefore, the length of the first-stage cable and the second-stage cable are set as 3.8 m and 5.8 m, respectively;
(4)
Reinforced protection principle
A higher preload up to 150 kN is applied to the anchor cable to improve the sensitivity of the cable, timely perceive and limit the expansion and deformation of the surrounding rock, and curb the further development of fracture separation layer in the anchoring area. Based on the above principles, a layer of steel pipe is applied inside the diamond-shaped metal mesh to restrict the deformation of shallow rock mass.
The new support scheme is shown in Figure 18.
Basic support for the roof: High strength grouting anchor cables with a diameter of 22 mm are used jointly with ordinary anchor cables whose diameter is 21.6 mm to provide joint support. The length of both types of cables is 3.8 m. The row distance between the anchor cables is 800 mm × 800 mm; for each row, there are five grouting cables and six ordinary cables; the preload is not less than 150 kN; and the five cables in the middle are reinforced with a steel ladder beam whose length is 3300 mm and bar diameter is 14 mm;
Secondary reinforced support for the roof: The ordinary anchor cables with Φ21.6 mm are used for the secondary reinforced support. The cables are 5.8 m long, and the distance between two anchor cables in the same row is 800 mm × 1600 mm, and the preload is not less than 180 kN;
Support for the sides: for the left side, two Φ22 mm × 3800 mm high-strength grouting anchor cables are used; for the right side, two Φ21.6 mm × 3800 mm ordinary anchor cables are used at a row distance of 700 × 800 mm. The anchor cable near the shoulder socket of the left side is placed at a depression angle of 15°, while the anchor cable near the shoulder socket of the right side is placed vertical to the side. The anchor cables near the floor are arranged at a depression angle of 45° and a distance of 200 mm to the floor. For each row, there are four anchor cables in total with a preload no less than 150 kN; two steel ladder beams whose length is 2500 mm and bar diameter is 12 mm are equipped for each row.

5.3. Numerical Simulation of New Support Scheme

From the comparison of Figure 12 and Figure 19, it can be seen that the joint support of the asymmetric grouting short anchor cable and the long anchor cable effectively improves the stress state of the surrounding rock. The stress relaxation zone in the surrounding rock has been significantly reduced. Through the grouting modification of the fractured rock mass in the fault area, the broken rock mass that has lost its bearing capacity can be re-consolidated into the whole. This practice improves the bonding force and shear capacity of the rock mass structural plane, thus enhancing the bearing capacity of the rock strata and contributing to the long-term stability control of the surrounding rock.
The displacement vector evolution of the surrounding rock under the new support condition is shown in Figure 20. Compared with the primary support scheme, the roadway deformation under the new support tends to be uniform, and the surrounding rock does not obviously slip or collapse, indicating that the surrounding rock and the support system have better coordination. At the same time, after the reconstruction of the bottom corner grouting, a limit is formed at the bottom corner, which restrains the upward displacement of the floor and realizes the effective control of the whole section of the roadway surrounding rock.
As can be seen from Figure 21, compared with the primary support, the maximum roof subsidence under the new support condition decreases from 348 mm to 96 mm, a reduction of 72.4%. The maximum subsidence of the right arch decreases by 49.3% from 521 mm to 264 mm. The maximum floor heave is located in the fault area on the left side of the floor, and the floor heave volume decreases by 41.9% from 181 mm to 105 mm.
As can be seen from Figure 22, the horizontal displacement of the roadway under the new support is also well controlled, and the maximum horizontal displacement of the left and right sides decreases by 40.3% and 48% from 298 mm and 89 mm to 176 mm and 46 mm, respectively. The maximum horizontal displacement in the fault area of the right arch decreases by 71.1% from 201 mm to 58 mm. In conclusion, the new support effectively controls the deformation of roadway near the fault, and the supporting effect has been significantly improved.

5.4. Engineering Practice

5.4.1. Monitoring of Roadway Surface Displacement

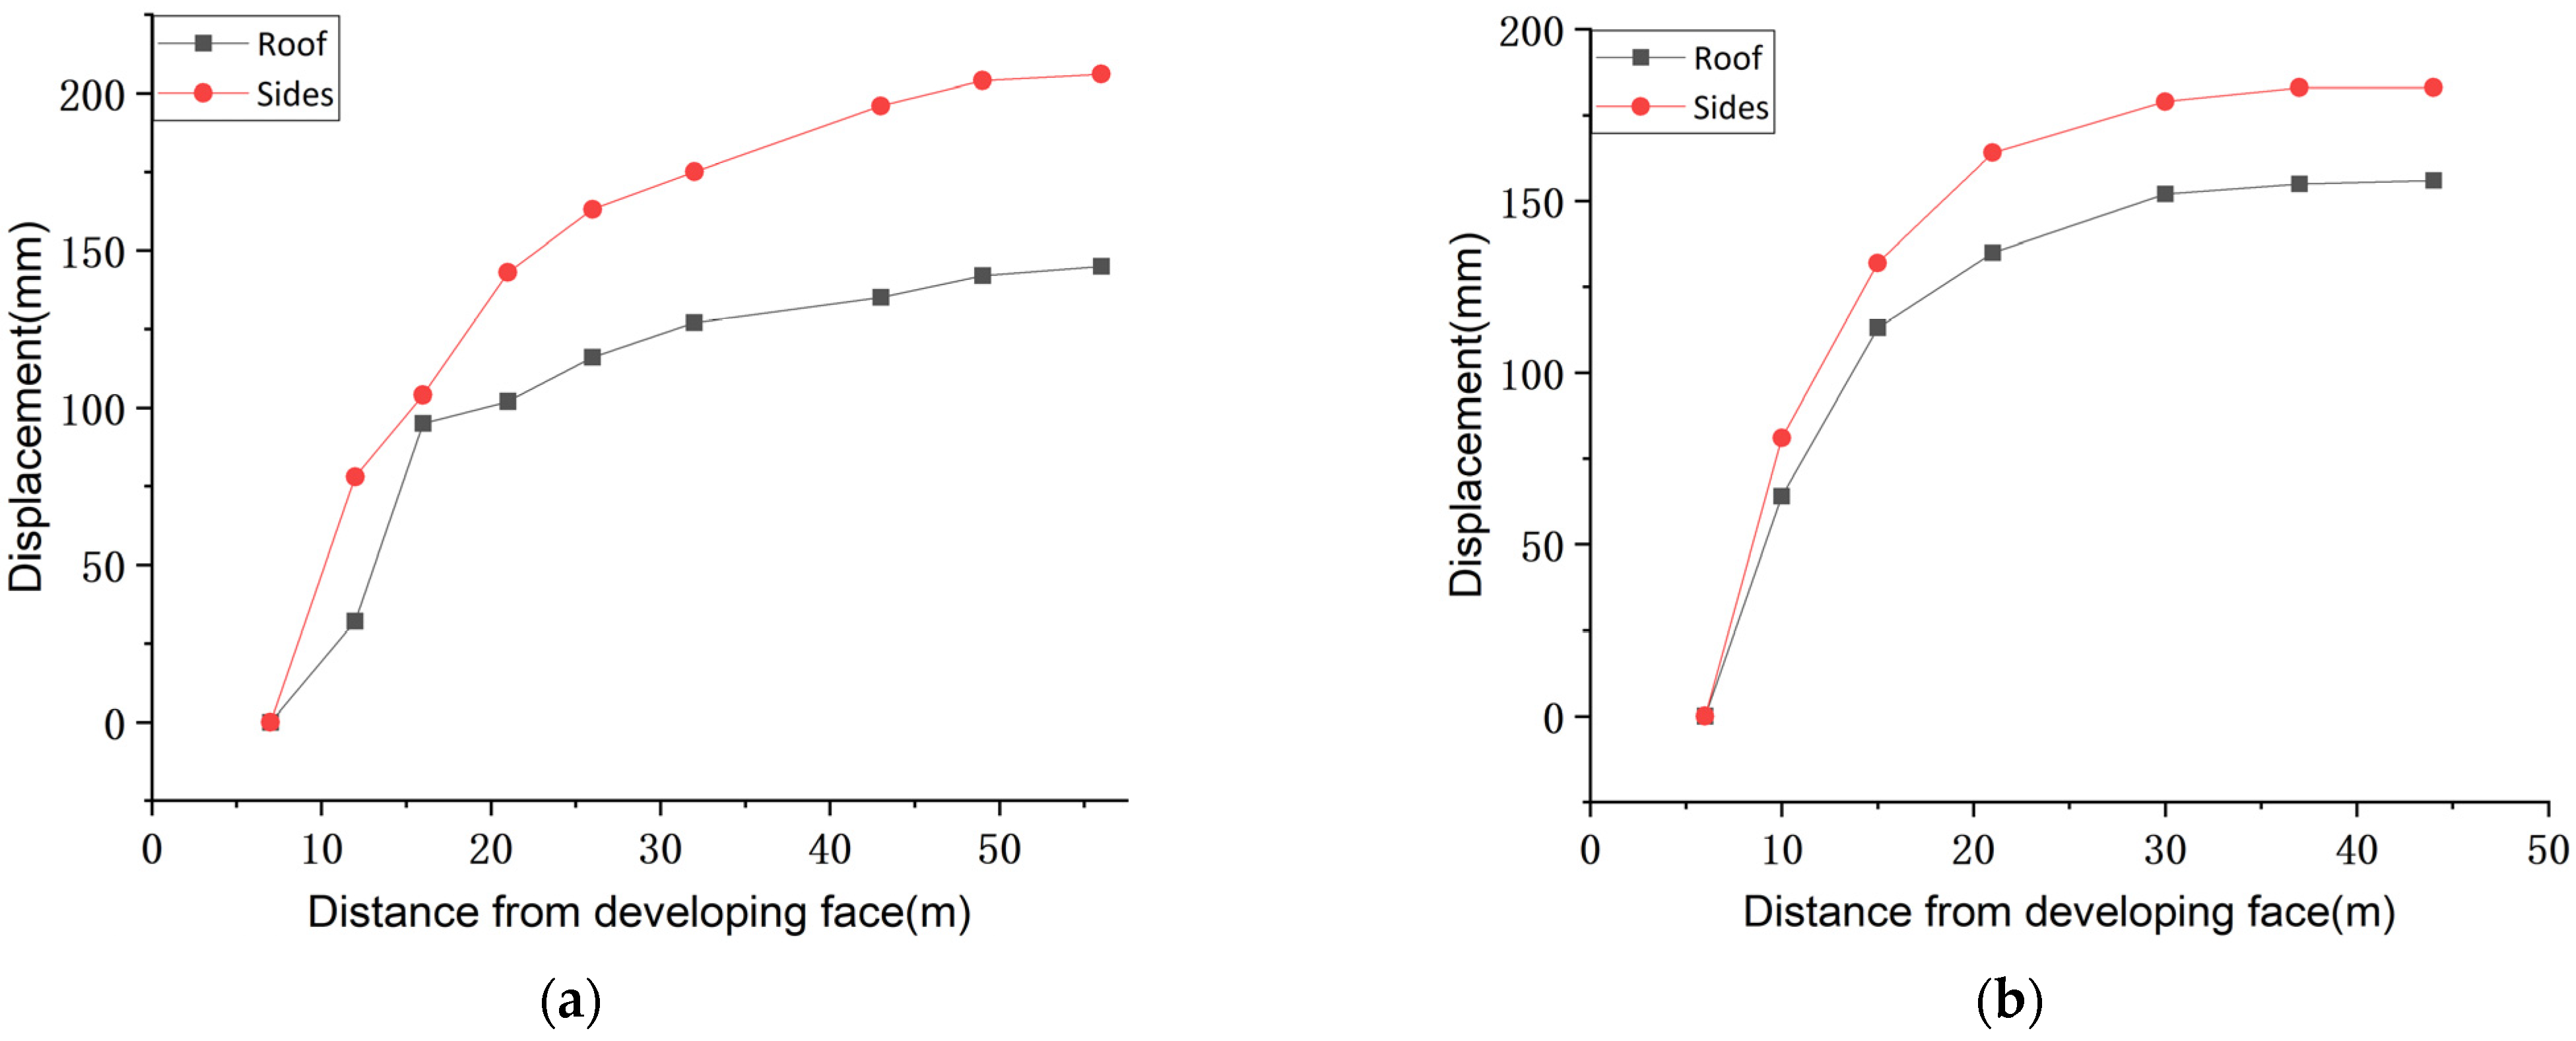
In order to evaluate the control effect of the new support, two displacement monitoring stations were arranged in this area, and the monitoring results are shown in Figure 23.
After the new support is adopted, the range of the violent influence of roadway excavation on the surrounding rock deformation is reduced from 45 m to less than 30 m, which indicates that the application of the new support plays a positive role in the initial maintenance and control of the roof. In the end, the side displacement observed by the two stations is 206 mm and 183 mm, and the roof subsidence is 145 mm and 156 mm, respectively, which is significantly lower than that under the primary support condition.

5.4.2. Monitoring of Fracture Development in Surrounding Rock

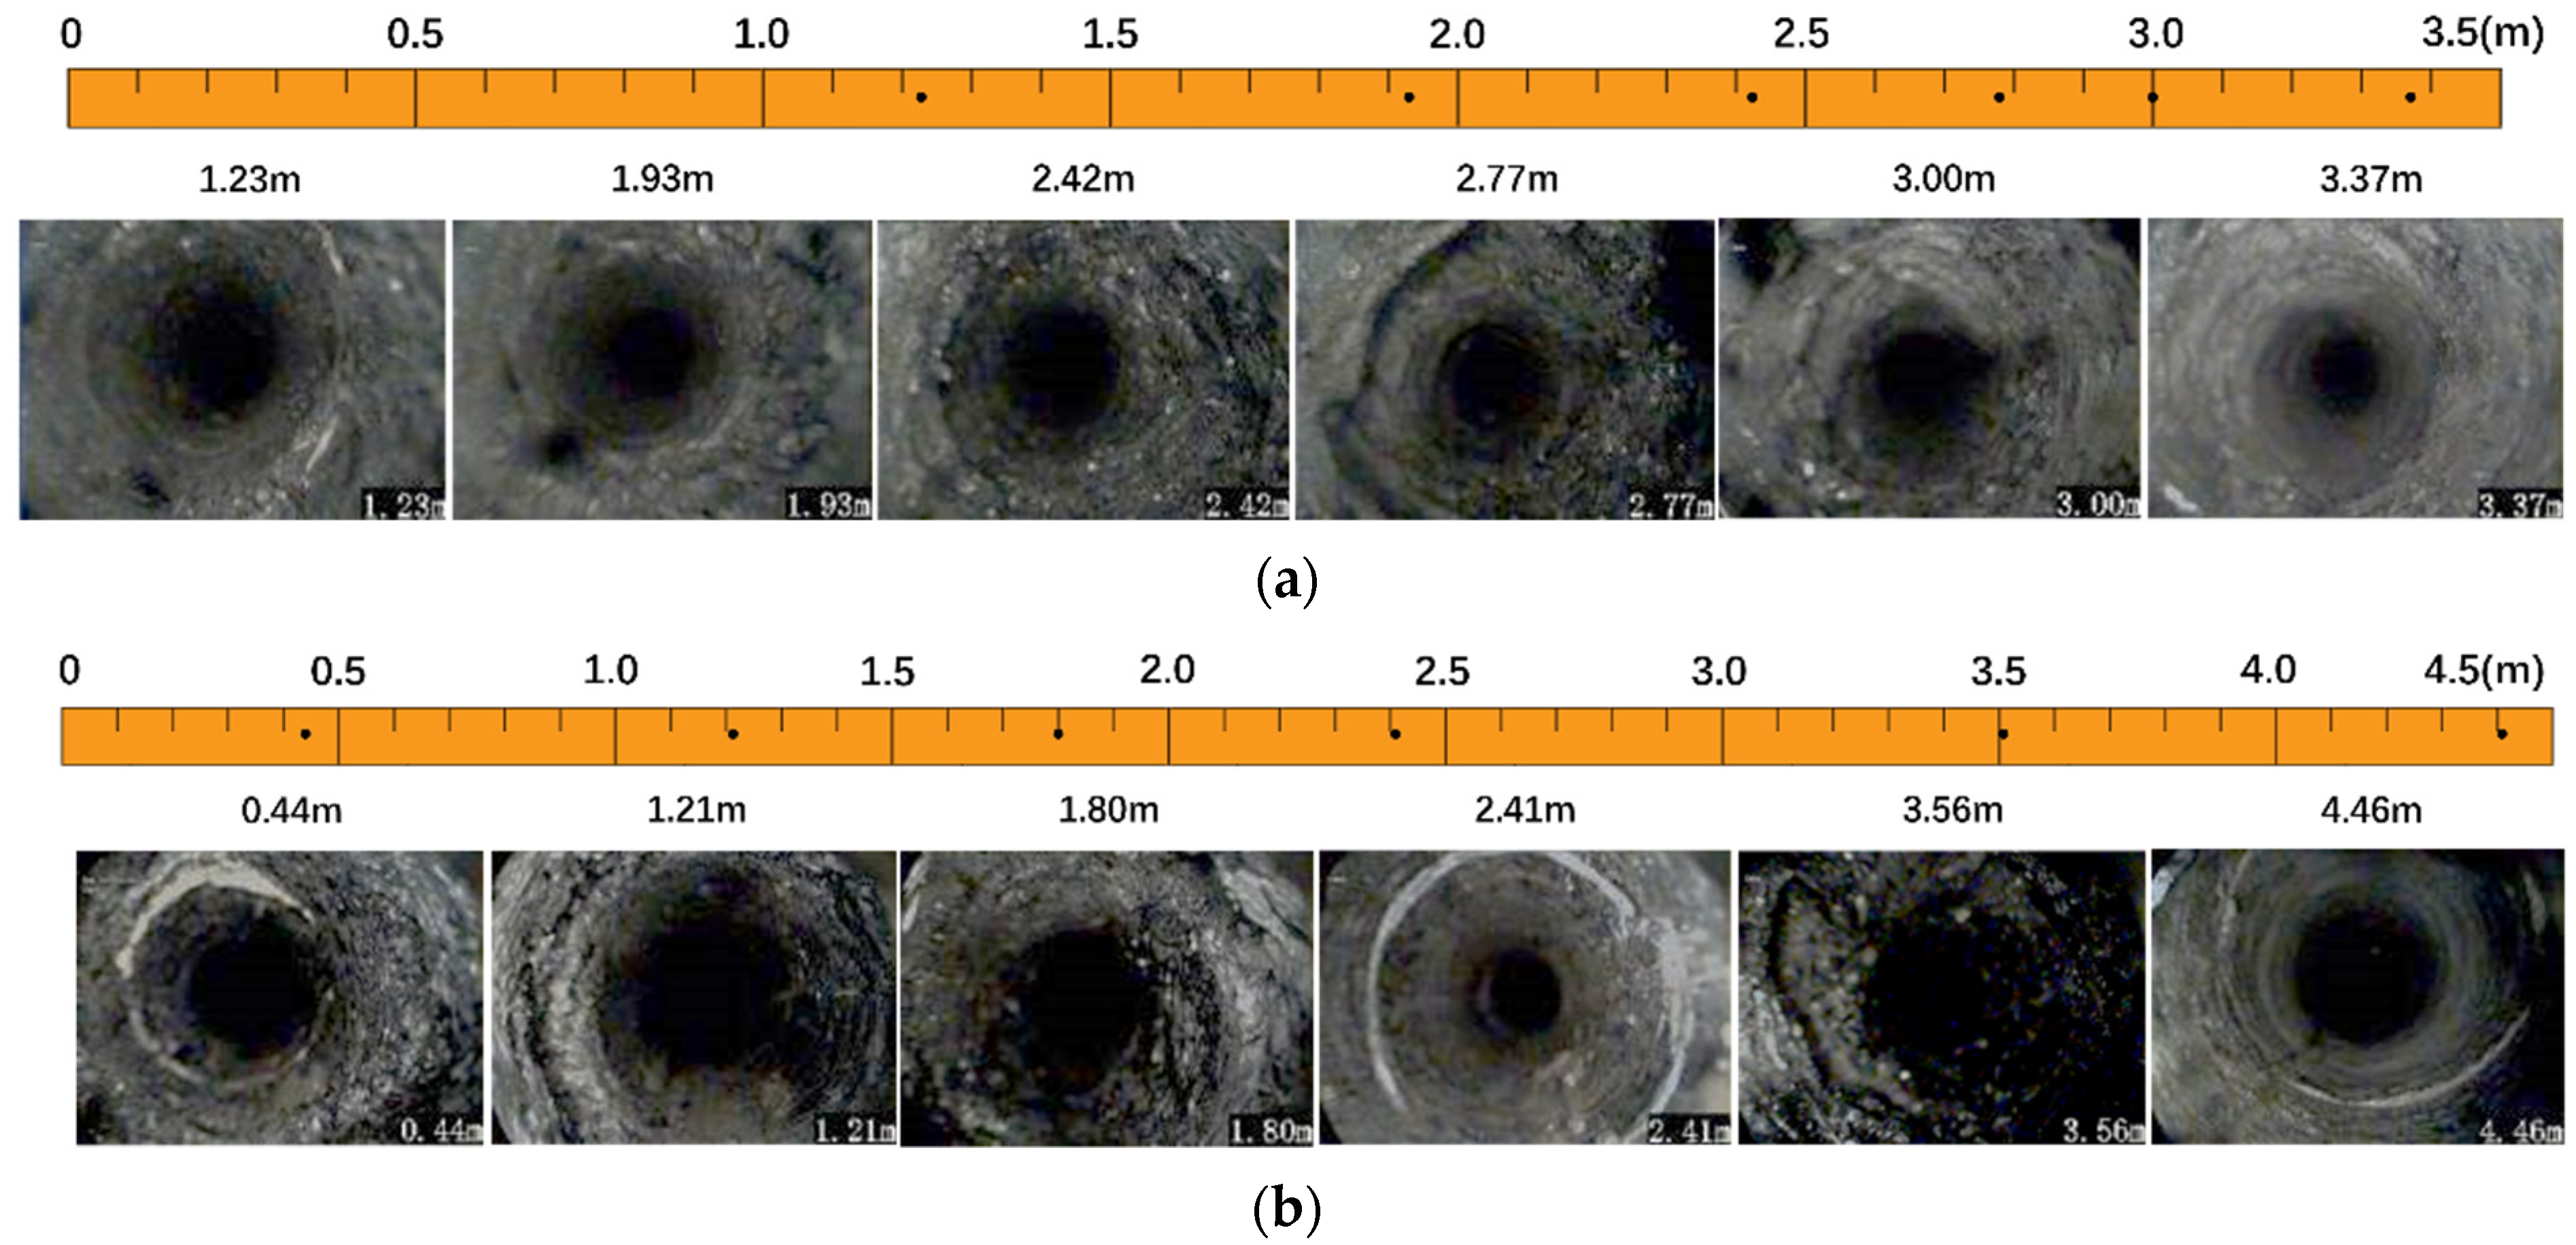
In order to further determine the fracture development in the roadway surrounding rock under the new support, the borehole peephole was used to monitor and characterize the roof. Two borehole peepholes were arranged in the concentrated occurrence area of medium drop faults, respectively, and defined as K3 and K4. Both the boreholes’ depth was 8 m, and images obtained through the peephole are shown in Figure 24.
Figure 24a shows the internal rock structure of the roof through the K3 peephole. As can be seen, the shallow coal body is still relatively broken, and the bed-separated fractures mainly occur below 3 m. There are 13 fractures observed through the peephole, and the maximum evolution depth of the bed-separated fractures is 3.4 m. Figure 24b shows that the K4 peephole is located in the whole anchor area with grouting. Obvious traces of grout filling annular cracks are observed at 0.44 m, 2.41 m, and 4.46 m, respectively, and the cracks are relatively developed in the shallow part of the pore wall. There are 15 fractures observed through the borehole, and the maximum crack evolution depth is 3.5 m.
According to the peephole results, the fracture development in the roof is significantly retarded under the new support condition, and the number of shallow separation and cracks is significantly reduced. The depth of cracks is generally within 3 m in the roof, and exceptionally and locally up to 3.5 m. As observed through the two peepholes, the maximum number of fractures is 15, declining by 76.6% from 64 under the primary support condition. The maximum fracture depth declines from 7.5 m to 3.5 m. The monitoring data prove that the new support can significantly inhibit the development of cracks and significantly improve the integrity of the surrounding rock. The grouting modification method can timely close the cracks in the anchoring area, improve the mechanical properties of the rock mass in the anchoring area, and realize the long-term stability control of the surrounding rock under the influence of a unidirectional fault structure.

5.4.3. Photos of Roadway Maintenance and Control

Compared with the serious damage of roadway under the primary support condition (see Figure 25a), the deformation and failure of the roadway surrounding rock in the fault area are significantly controlled under the new support condition, and the support condition achieves the expected effect, as shown in Figure 25b.

6. Discussion

6.1. Necessity Analysis of Wedge Anchorage for Corner Anchor Cable

Floor heave refers to the upward bulging and deformation of the roadway floor under the influence of underground pressure [36]. It not only affects the stability control of the roof directly but also coal transportation and pedestrians. For a long time, floor heave control has been one of the difficulties in roadway maintenance [37]. Especially under the influence of fault structures, the stress condition of roadway surrounding rock becomes more complex [38], and floor heave becomes increasingly serious. Therefore, it is necessary to study floor control measures in order to scientifically and effectively restrain floor heave deformation.
In order to explore the influence of corner anchor cables at different angles on floor control, based on the primary support, the arrangement of the corner anchor cables were changed from 45° down horizontally to 15° down horizontally, which is commonly used in engineering practice. Through simulation analysis, the vertical displacement nephogram of the roadway surrounding rock under different angles of the corner anchor cables is shown in Figure 26.
After excavation, the roadway corner becomes one of the most stress concentrated parts. When the stress exceeds the ultimate strength of the rock mass, shear failure occurs immediately, resulting in a number of broken irregular small blocks. As can be seen from Figure 26a, under horizontal stress extrusion, small rock masses move to the interior of the roadway, resulting in floor deformation. As shown in Figure 26b, when the corner anchor cable is anchored at 45°, the floor heave is significantly mitigated compared with the case at 15°; the maximum floor heave decreases from 285 mm to 206 mm, a reduction of 27.7%. At 45°, the corner anchor cable can anchor into deeper rock formation, forming a wedge carrier to constrain the deformation of the shallow rock mass. It can be found from the figure that the corner anchor cable at different angles has little influence on the deformation of the roadway roof. However, in the long run, the effective control of floor deformation will also strengthen the other structural rock masses of the roadway and improve the stability of the roof and two sides of the roadway surrounding rock, as each zone of deep roadway surrounding rock is an organic unity interacting with each other. In this sense, the effective control of the floor also plays an important role in promoting the overall stability of the roadway. Accordingly, it is extremely necessary to anchor the corner anchor cable at 45° down horizontally.
Therefore, in the new support scheme, the corner anchor cable was installed at 45° down horizontally, and a hollow grouting anchor cable was used to replace the ordinary anchor cable to achieve the modification of the surrounding rock. In this way, a high-quality wedge anchor solid was constructed on both sides of the bottom corner, so that the broken surrounding rock formed a complete embedded structure, which greatly improved the stress condition of the roadway surrounding rock and effectively controlled the floor deformation.

6.2. Discussion on Surrounding Rock Deformation under Different Fault Angles

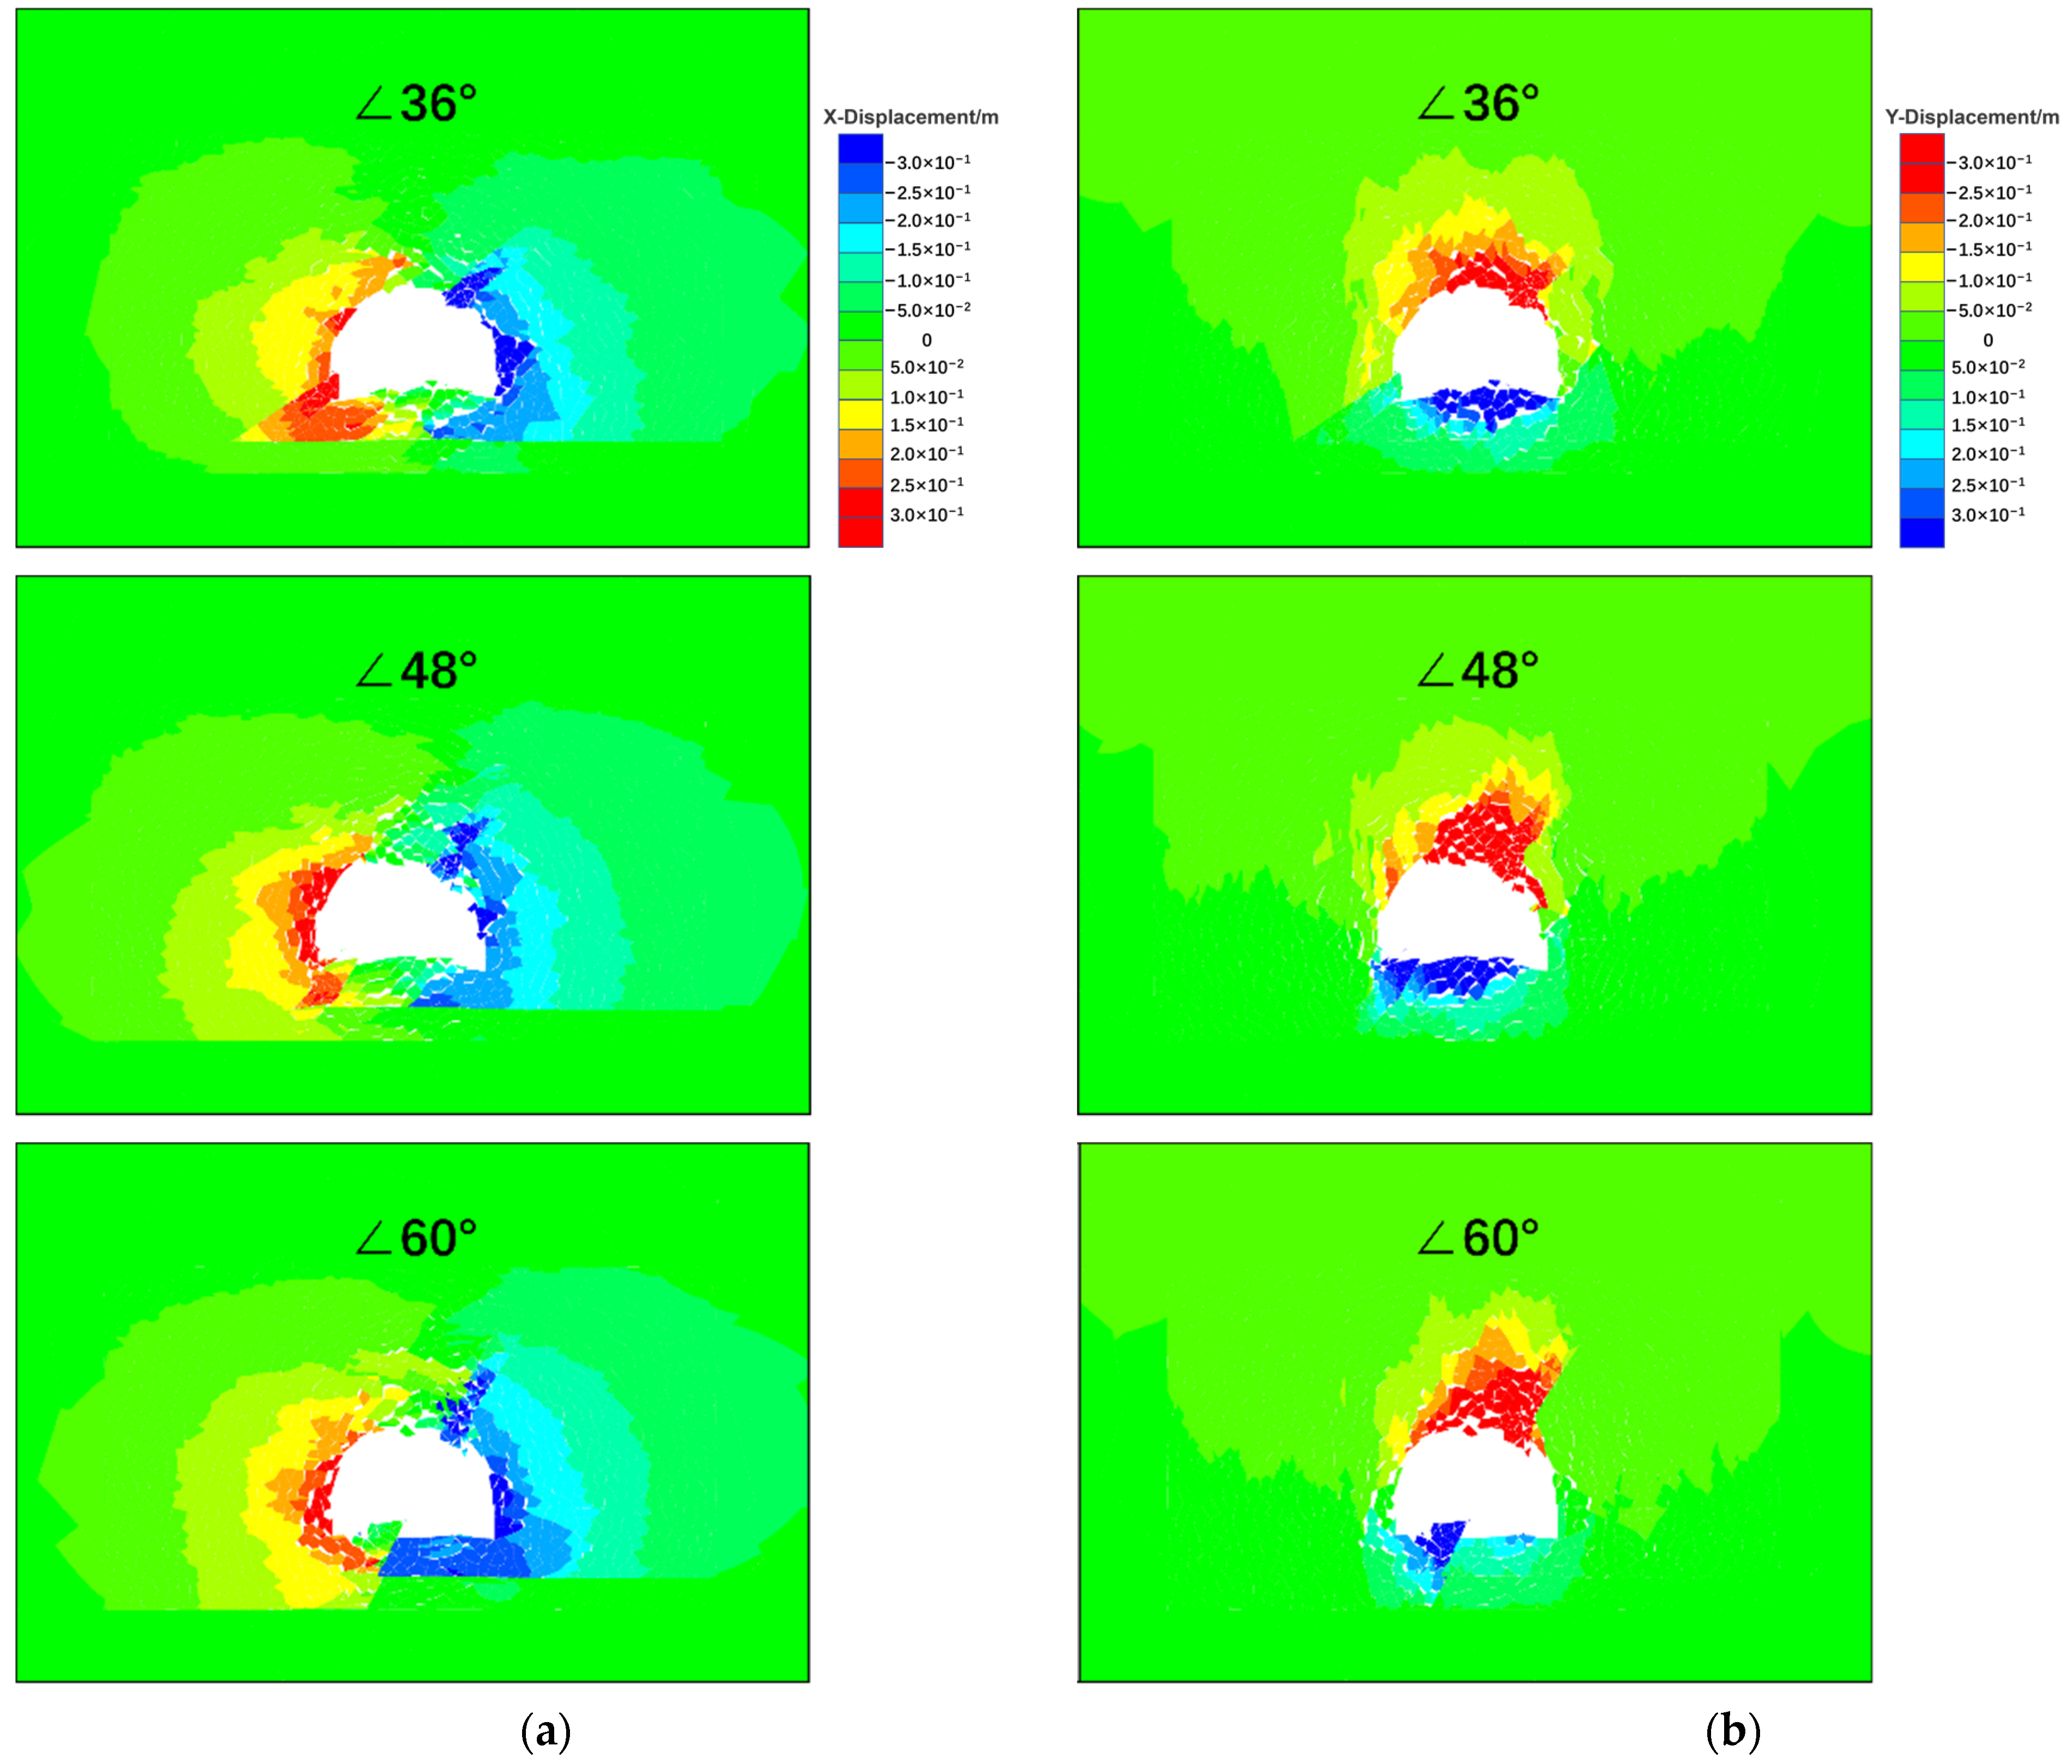
A fault exerts a huge impact on the deformation and stress of the surrounding rock mass, and the fault dip angle plays a leading role in the initial stress distribution characteristics of the rock mass. Meanwhile, it is also an important factor affecting the stability of the roadway. Therefore, it is necessary to study the surrounding rock deformation laws under different fault dip angles by means of the control variable method to control the surrounding rock deformation under the influence of faults more scientifically and accurately. The rock mass structure and fault dip remain unchanged, and the fault dip angle was increased by 12°. In this way, the numerical calculation models of the normal faults whose dip angle was 36°, 48°, and 60° were established, respectively, as shown in Figure 27.
As is shown in Figure 27a, when the dip angle of the fault is 36°, 48°, and 60°, respectively, the horizontal displacement of the left side is 493 mm, 481 mm, and 462 mm successively (that of the right side is 238 mm, 192 mm, and 176 mm, respectively). In other words, as the dip angle increases, the side shrinkage decreases gradually. The main reason is that after roadway excavation, the stress is concentrated at the fault. In this case, the closer to the fault core, the greater the horizontal deformation of the surrounding rock. When the fault dip angle is 36°, the left side of the roadway is located at the fault, so the shrinkage of the left side is the largest. With the increase in the fault dip angle, the fault gradually shifts away from the sides to the middle of the roadway floor; accordingly, the shrinkage of the two sides decreases.
Figure 27b shows the vertical displacement nephogram at different fault dip angles. As can be seen, although the fault dip angle is different, the influence law of the fault on the whole deformation distribution of the surrounding rock is roughly the same. After excavation, due to the formation of the free face, the surrounding rock of the roof sags under its own gravity. At the same time, the floor bulges upward due to excavation unloading. The maximum deformation of the roof and floor occurs in the fault fracture zone, and the closer to the fault core area, the greater the deformation appears to be. The main reason for this phenomenon is that, compared with the complete surrounding rock, the rock mass at the fault is weak and broken, and the construction disturbance has a higher influence on it. In addition, the fault tends to slip downward along the dip angle. With the increase in the dip angle of the fault, the vertical component increases, so the roof at the fault subsides more noticeably. When the fault dip angle is 36°, 48°, and 60°, respectively, the maximum roof subsidence is 454 mm, 634 mm, and 763 mm.
According to the above discussion, the deformation of roadway surrounding rock presents differentiated deformation characteristics under faults with different dip angles. The fault fracture zone exerts a certain influence on the roadway, and roadway deformation will be significantly larger in the fault area. The deformation and failure of the roadway surrounding rock near the fault are the most serious, mainly concentrated at the roof and floor. As the fault dip angle increases, the overall deformation of the surrounding rock displays a downward trend. Therefore, for faults with different dip angles, differentiated anchorage methods should be adopted to provide key protection for the surrounding rock near the faults. In the new support scheme, differentiated support was adopted for different surrounding rock conditions. A grouting anchor cable support was adopted for the surrounding rock near faults to reconstruct the bearing structure of the broken rock mass. This can effectively control the deformation and failure of the roadway surrounding rock at different fault dip angles.

7. Conclusions

(1)
According to the simulation analysis of UDEC discrete element software, under the influence of deep roadway excavation disturbance, the rock mass in the fault area is subjected to dynamic stress response, thus inducing dislocation and deformation in the weak plane of the fault. Consequently, the stress deterioration is further aggravated, and the cracks of surrounding rock extend towards the deep, while the roof loses its effective bearing capacity, which intensifies the deformation in the two sides and floor;
(2)
The mechanisms of thick layer transboundary anchorage and hierarchical continuous anchorage were demonstrated. On this basis, a differentiated two-stage continuous support technology is proposed for the roadway support in a unidirectional fault structure. To be specific, this technology can be expressed as “first-stage grouting anchor cable/ordinary anchor cable; second-stage high strength anchor cable”. The first-stage grouting can improve the mechanical properties of fractured rock mass in the fault; the second-stage coordinated anchorage can enhance the deformation resistance of the surrounding rock and its long-term stability;
(3)
The importance of the wedge anchoring of the bottom corner anchor cable under the influence of the fault structure was analyzed. When the bottom corner anchor cable is constructed 45° horizontally downward and modified by grouting, a high-quality wedge anchoring structure can be formed in the broken surrounding rock, which greatly improves the stress condition of the surrounding rock. The deformation characteristics of the roadway surrounding rock under 36°, 48° and 60° fault dip angles were discussed, and it is concluded that the differential two-stage continuous support technology can adapt to the maintenance and control of the roadway surrounding rock under different fault dip angles;
(4)
The field tests show that compared with the original scheme, the new scheme significantly reduces the deformation of the surrounding rock in the roof and two sides by 68.47% and 35.4%, respectively. According to the peephole results, under the new support condition, the maximum roof crack depth is reduced from 7.5 m to 3.5 m, and the number of cracks is also reduced by 76.6%. The integrity of the roadway surrounding rock in the fault area is significantly improved. This study provides an important reference for the safety maintenance and control of similar roadway engineering.

Author Contributions

Funding acquisition, Z.X. and N.Z.; methodology, Z.X. and N.Z.; formal analysis, F.M., F.G. and Z.X.; software, F.M. and R.C.; investigation, F.M., F.G., Y.L., N.Z., Q.C. and Z.X.; writing—original draft, Z.X.; writing—review and editing, Z.X. and F.M. All authors have read and agreed to the published version of the manuscript.

Funding

This research was funded by the National Natural Science Foundation of China (52104104, 52034007, 52274101).

Institutional Review Board Statement

Not applicable.

Informed Consent Statement

Not applicable.

Data Availability Statement

The data are available from the corresponding author on reasonable request.

Acknowledgments

We would also like to thank the anonymous reviewers for their valuable comments and suggestions that lead to a substantially improved manuscript.

Conflicts of Interest

The authors declare no conflict of interest.

References

  1. Xie, H.P.; Gao, M.Z.; Zhang, R.; Peng, G.Y.; Wang, W.Y.; Li, A.Q. Study on the Mechanical Properties and Mechanical Response of Coal Mining at 1000 m or Deeper. Rock Mech. Rock Eng. 2019, 52, 1475–1490. [Google Scholar] [CrossRef]
  2. Ranjith, P.G.; Zhao, J.; Ju, M.H.; De Silva, R.V.S.; Rathnaweera, T.D.; Bandara, A. Opportunities and Challenges in Deep Mining: A Brief Review. Engineering 2017, 3, 546–551. [Google Scholar] [CrossRef]
  3. Yang, H.Q.; Zhang, N.; Han, C.L.; Sun, C.L.; Song, G.H.; Sun, Y.N.; Sun, K. Stability Control of Deep Coal Roadway under the Pressure Relief Effect of Adjacent Roadway with Large Deformation: A Case Study. Sustainability 2021, 13, 4412. [Google Scholar] [CrossRef]
  4. Gao, M.Z.; Xie, J.; Guo, J.; Lu, Y.Q.; He, Z.Q.; Li, C. Fractal evolution and connectivity characteristics of mining-induced crack networks in coal masses at different depths. Geomech. Geophys. Geo-Energy Geo-Resour. 2021, 7, 9. [Google Scholar] [CrossRef]
  5. Wang, Q.; Qin, Q.; Jiang, B.; Jiang, Z.H.; He, M.C.; Li, S.C.; Wang, Y. Geomechanics model test research on automatically formed roadway by roof cutting and pressure releasing. Int. J. Rock Mech. Min. Sci. 2020, 135, 104506. [Google Scholar] [CrossRef]
  6. Xie, Z.Z.; Zhang, N.; Yuan, Y.X.; Xu, G.; Wei, Q. Study on Safety Control of Composite Roof in Deep Roadway Based on Energy Balance Theory. Sustainability 2019, 11, 3688. [Google Scholar] [CrossRef]
  7. Zhang, B.; Zhou, H.Q.; Chang, Q.L.; Zhao, X.; Sun, Y.T. The Stability Analysis of Roadway near Faults under Complex High Stress. Adv. Civ. Eng. 2020, 2020, 8893842. [Google Scholar] [CrossRef]
  8. Jiang, J.Q.; Wu, Q.L.; Qu, H. Evolutionary characteristics of mining stress near the hard-thick overburden normal faults. J. Min. Saf. Eng. 2014, 31, 881. [Google Scholar] [CrossRef]
  9. Kong, P.; Jiang, L.S.; Shu, J.M.; Wang, L. Mining Stress Distribution and Fault-Slip Behavior: A Case Study of Fault-Influenced Longwall Coal Mining. Energies 2019, 12, 2494. [Google Scholar] [CrossRef]
  10. Kang, Y.S.; Hou, C.C.; Liu, J.Y.; Geng, Z.; Chen, J.B.; Liu, B. Numerical Analyses on the Stability of a Deep Coalmine Roadway Passing through a Fault Zone: A Case Study of the Gugui Coalfield in China. Energies 2021, 14, 2114. [Google Scholar] [CrossRef]
  11. Zeng, C.L.; Zhou, Y.J.; Zhang, L.M.; Mao, D.G.; Bai, K.X. Study on overburden failure law and surrounding rock deformation control technology of mining through fault. PLoS ONE 2022, 17, e0262243. [Google Scholar] [CrossRef] [PubMed]
  12. Wang, F.T.; Zhang, C.; Wei, S.F.; Zhang, X.G.; Guo, S.H. Whole section anchor-grouting reinforcement technology and its application in underground roadways with loose and fractured surrounding rock. Tunn. Undergr. Space Technol. 2016, 51, 133–143. [Google Scholar] [CrossRef]
  13. Zhang, S.; Zhang, D.S.; Wang, H.Z.; Liang, S.S. Discrete element simulation of the control technology of large section roadway along a fault to drivage under strong mining. J. Geophys. Eng. 2018, 15, 2642–2657. [Google Scholar] [CrossRef]
  14. Yang, S.Q.; Chen, M.; Jing, H.W.; Chen, K.F.; Meng, B. A case study on large deformation failure mechanism of deep soft rock roadway in Xin’An coal mine, China. Eng. Geol. 2017, 217, 89–101. [Google Scholar] [CrossRef]
  15. Meng, Z.P.; Peng, S.P.; Feng, Y.; Lei, Z.Y. Influence of fracture structure plane on underground pressure and roof stability of working face. Coal Geol. Explor. 2006, 34, 24–27. [Google Scholar]
  16. Gou, P.F.; Hu, Y.G. Effect of faults on movement of roof rock strata in gateway. J. Min. Saf. Eng. 2006, 23, 285–289. [Google Scholar]
  17. Wang, X.Y.; Bai, J.B.; Li, L.; Han, Z.T. Deformation failure mechanism and control technology of mining-induced roadway near a fault. J. Min. Saf. Eng. 2014, 31, 674. [Google Scholar] [CrossRef]
  18. Islam, M.R.; Shinjo, R. Mining-induced fault reactivation associated with the main conveyor belt roadway and safety of the Barapukuria Coal Mine in Bangladesh: Constraints from BEM simulations. Int. J. Coal Geol. 2009, 79, 115–130. [Google Scholar] [CrossRef]
  19. Mark, C.; Gale, W.; Oyler, D.; Chen, J. Case history of the response of a longwall entry subjected to concentrated horizontal stress. Int. J. Rock Mech. Min. Sci. 2007, 44, 210–221. [Google Scholar] [CrossRef]
  20. Marcak, H.; Mutke, G. Seismic activation of tectonic stresses by mining. J. Seismol. 2013, 17, 1139–1148. [Google Scholar] [CrossRef]
  21. Naoi, M.; Nakatani, M.; Otsuki, K.; Yabe, Y.; Kgarume, T.; Murakami, O.; Masakale, T.; Ribeiro, L.; Ward, A.; Moriya, H.; et al. Steady activity of microfractures on geological faults loaded by mining stress. Tectonophysics 2015, 649, 100–114. [Google Scholar] [CrossRef]
  22. Sainoki, A.; Mitri, H. Dynamic modelling of a mining-induced fault slip. In Proceedings of the ISRM International Symposium (EUROCK), Wroclaw, Poland, 23–26 September 2013; pp. 763–768. [Google Scholar]
  23. Celico, F.; Petrella, E.; Celico, P. Hydrogeological behaviour of some fault zones in a carbonate aquifer of Southern Italy: An experimentally based model. Terra Nova 2006, 18, 308–313. [Google Scholar] [CrossRef]
  24. Liu, C.W. Relation between bolting-shotcrete support and NATM metmod forsoft rock driftsin coal mines. ChinaMining Mag. 2000, 9, 61–64. [Google Scholar]
  25. Kang, H.P.; Jiang, P.F.; Wu, Y.Z.; Gao, F.Q. A combined “ground support-rock modification-destressing” strategy for 1000-m deep roadways in extreme squeezing ground condition. Int. J. Rock Mech. Min. Sci. 2021, 142, 104746. [Google Scholar] [CrossRef]
  26. Kang, H.P.; Yang, J.H.; Gao, F.Q.; Li, J.Z. Experimental Study on the Mechanical Behavior of Rock Bolts Subjected to Complex Static and Dynamic Loads. Rock Mech. Rock Eng. 2020, 53, 4993–5004. [Google Scholar] [CrossRef]
  27. Zhang, N.; Xu, X.L.; Chen, Z.F.; Wang, C. Geological guarantee and construction controlling technique of main roadway crossing fault zone with 435 m fall. Chin. J. Rock Mech. Eng. 2008, 27, 3292–3297. [Google Scholar]
  28. Xie, Z.Z.; Zhang, N.; Feng, X.W.; Liang, D.X.; Wei, Q.; Weng, M.Y. Investigation on the evolution and control of surrounding rock fracture under different supporting conditions in deep roadway during excavation period. Int. J. Rock Mech. Min. Sci. 2019, 123, 104122. [Google Scholar] [CrossRef]
  29. An, Y.P.; Zhang, N.; Zhao, Y.M.; Xie, Z.Z. Field and numerical investigation on roof failure and fracture control of thick coal seam roadway. Eng. Fail. Anal. 2021, 128, 105594. [Google Scholar] [CrossRef]
  30. Xiao, T.Q.; Bai, J.B.; Li, J.P.; Wang, X.Y.; Yan, S. Stabilization mechanism of crushed surrounding rock in coal roadway with bolt support near fault. J. Min. Saf. Eng. 2010, 27, 482–486. [Google Scholar]
  31. Li, X.H.; Ju, M.H.; Yao, Q.L.; Zhou, J.; Chong, Z.H. Numerical Investigation of the Effect of the Location of Critical Rock Block Fracture on Crack Evolution in a Gob-side Filling Wall. Rock Mech. Rock Eng. 2016, 49, 1041–1058. [Google Scholar] [CrossRef]
  32. Zhang, L.Y.; Einstein, H.H. Using RQD to estimate the deformation modulus of rock masses. Int. J. Rock Mech. Min. Sci. 2004, 41, 337–341. [Google Scholar] [CrossRef]
  33. Singh, M.; Rao, K.S. Empirical methods to estimate the strength of jointed rock masses. Eng. Geol. 2005, 77, 127–137. [Google Scholar] [CrossRef]
  34. Hoek, E.; Brown, E.T. Practical estimates of rock mass strength. Int. J. Rock Mech. Min. Sci. 1997, 34, 1165–1186. [Google Scholar] [CrossRef]
  35. Yang, H.Q.; Han, C.L.; Zhang, N.; Sun, Y.T.; Pan, D.J.; Sun, C.L. Long High-Performance Sustainable Bolt Technology for the Deep Coal Roadway Roof: A Case Study. Sustainability 2020, 12, 1375. [Google Scholar] [CrossRef]
  36. Zhou, X.M.; Wang, S.; Li, X.L.; Meng, J.J.; Li, Z.; Zhang, L.H.; Pu, D.D.; Wang, L.K. Research on Theory and Technology of Floor Heave Control in Semicoal Rock Roadway: Taking Longhu Coal Mine in Qitaihe Mining Area as an Example. Lithosphere 2022, 2022, 3810988. [Google Scholar] [CrossRef]
  37. Lai, X.P.; Xu, H.C.; Shan, P.F.; Kang, Y.L.; Wang, Z.Y.; Wu, X. Research on Mechanism and Control of Floor Heave of Mining-Influenced Roadway in Top Coal Caving Working Face. Energies 2020, 13, 381. [Google Scholar] [CrossRef]
  38. Xu, Y.C.; Zhang, E.M.; Luo, Y.Q.; Zhao, L.; Yi, K. Mechanism of Water Inrush and Controlling Techniques for Fault-Traversing Roadways with Floor Heave Above Highly Confined Aquifers. Mine Water Environ. 2020, 39, 320–330. [Google Scholar] [CrossRef]
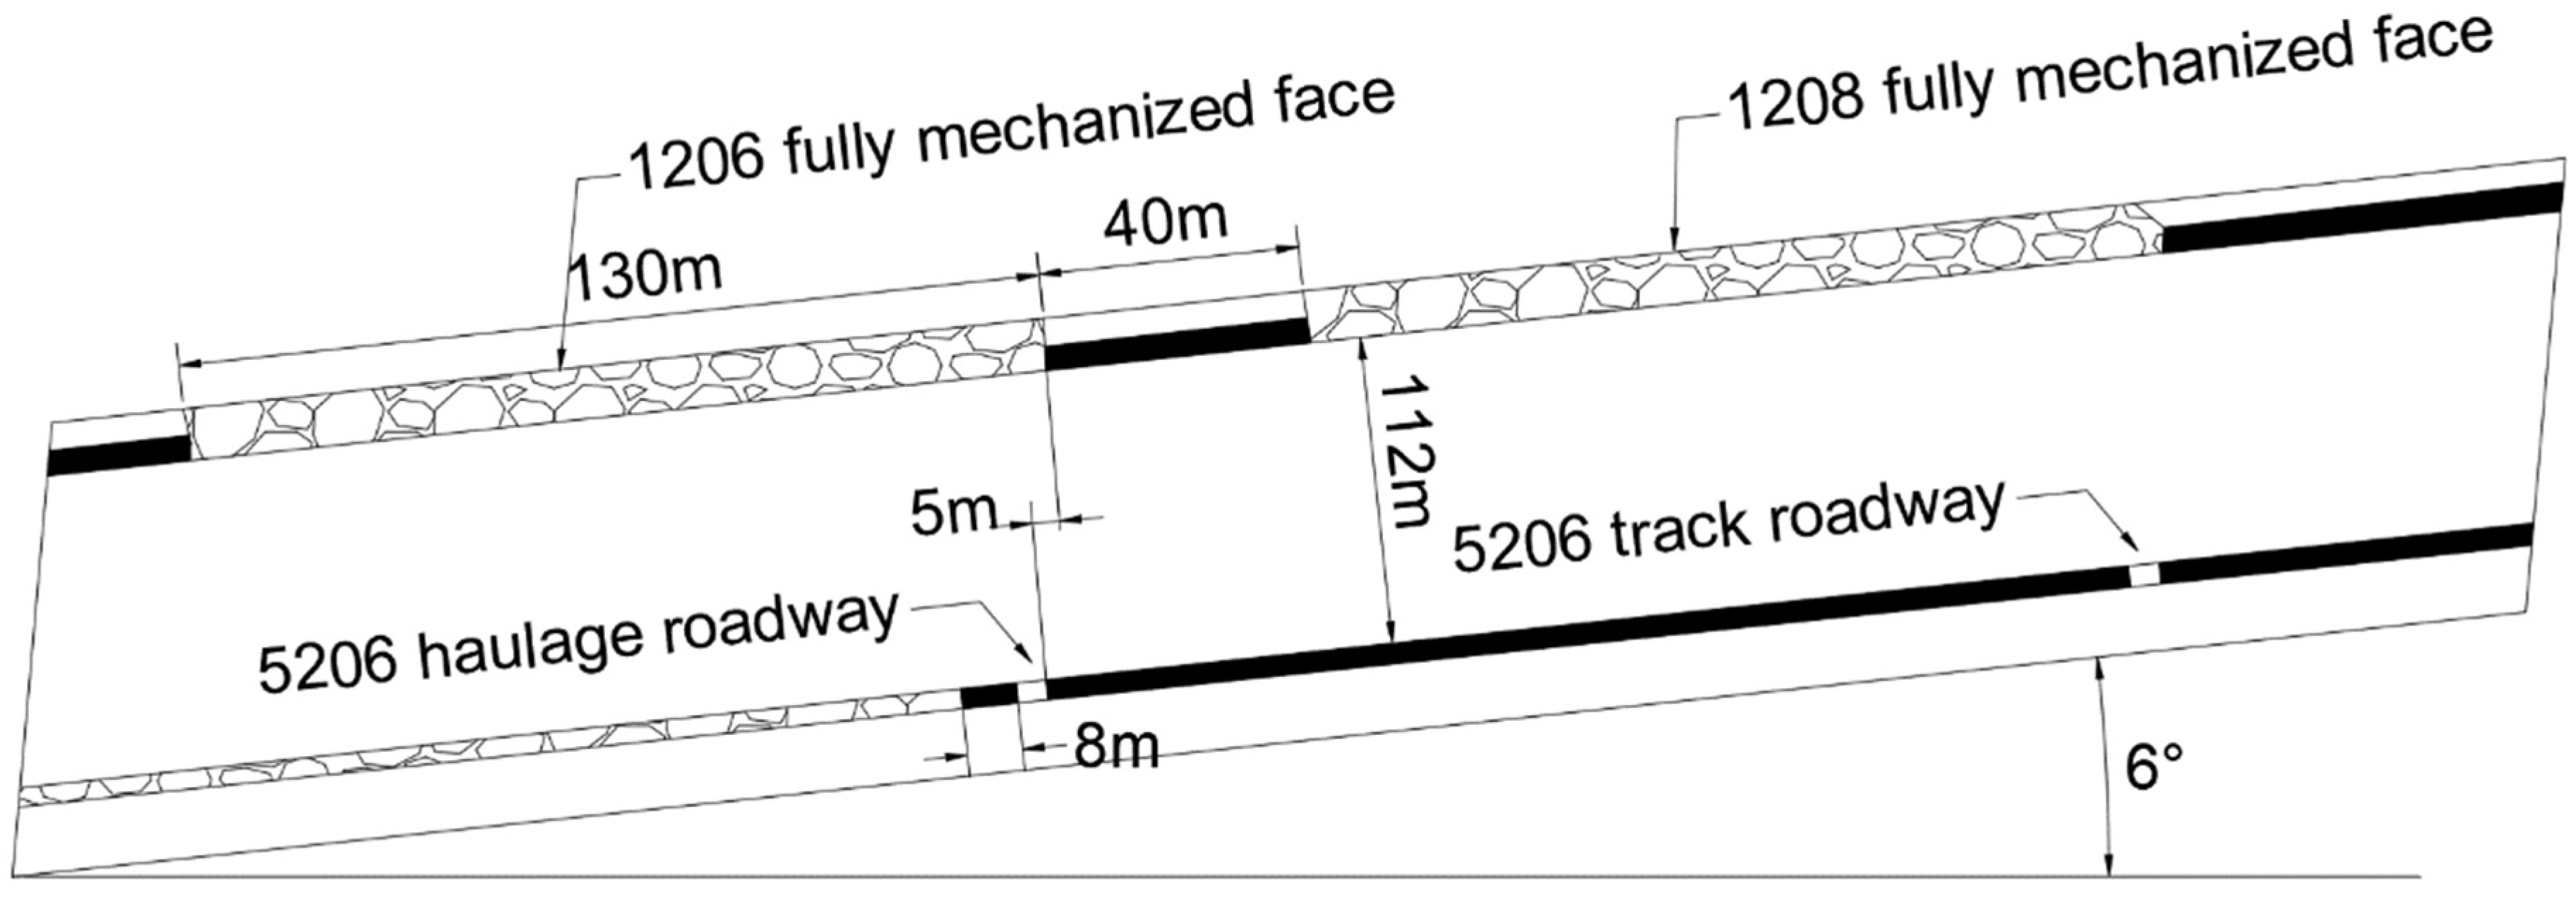
Figure 1. Spatial location plan of roadways.
Processes 11 01453 g001
Figure 2. Strata occurrence of the 5206 track roadway.
Processes 11 01453 g002
Figure 3. Schematic diagram of the primary support scheme.
Processes 11 01453 g003
Figure 4. Roadway maintenance and control effect. (a) Roof bulge; (b) diamond mesh tearing.
Processes 11 01453 g004
Figure 5. Displacement evolution of the primary support scheme. (a) Monitoring station 1; (b) monitoring station 2.
Processes 11 01453 g005
Figure 6. Images obtained through peepholes under the primary support scheme. (a) K1; (b) K2.
Processes 11 01453 g006
Figure 7. UDEC model.
Processes 11 01453 g007
Figure 8. Distribution of stress monitoring points.
Processes 11 01453 g008
Figure 9. Distribution of displacement monitoring points.
Processes 11 01453 g009
Figure 10. SYY stress evolution diagram of roof monitoring points.
Processes 11 01453 g010
Figure 11. SXX stress evolution diagram of side monitoring points.
Processes 11 01453 g011
Figure 12. Distribution of maximum principal stress with no support and with the primary support. (a) Without support; (b) with the primary support.
Processes 11 01453 g012
Figure 13. Displacement vector diagram of surrounding rock without support and with the primary support. (a) Without support; (b) with the primary support.
Processes 11 01453 g013
Figure 14. Displacement evolution diagram of roof measuring points along Y direction.
Processes 11 01453 g014
Figure 15. Displacement evolution diagram of the two sides along X direction.
Processes 11 01453 g015
Figure 16. Displacement evolution diagram of the floor measuring points along Y direction.
Processes 11 01453 g016
Figure 17. Conceptual diagram of transboundary hierarchical continuous support technology.
Processes 11 01453 g017
Figure 18. Diagram of new support scheme.
Processes 11 01453 g018
Figure 19. Maximum principal stress distribution around roadway under new support condition.
Processes 11 01453 g019
Figure 20. Displacement vector diagram of surrounding rock under new support condition.
Processes 11 01453 g020
Figure 21. Vertical displacement diagram of surrounding rock under primary and new support conditions. (a) Under primary support condition; (b) under new support condition.
Processes 11 01453 g021
Figure 22. Horizontal displacement diagram of surrounding rock under primary and new support conditions. (a) Under primary support condition; (b) under new support condition.
Processes 11 01453 g022
Figure 23. Displacement evolution under new support condition. (a) Monitoring station 1; (b) monitoring station 2.
Processes 11 01453 g023
Figure 24. Images obtained through roof peepholes under new support condition. (a) K3; (b) K4.
Processes 11 01453 g024
Figure 25. Photos of roadway maintenance and control under primary and new support conditions. (a) Under primary support condition; (b) under new support condition.
Processes 11 01453 g025
Figure 26. Vertical displacement nephogram of roadway surrounding rock under different angles of corner anchor cables. (a) At 15° down horizontally; (b) at 45° down horizontally.
Processes 11 01453 g026
Figure 27. Roadway displacement nephogram at different fault dip angles. (a) Horizontal displacement nephogram; (b) vertical displacement nephogram.
Processes 11 01453 g027
Table 1. Faults in the 5206 track roadway.
Fault NameInclinationDip Angle
(°)
Drop Height
(m)
PropertyDistance from Lanehead (m)
F1south485.5reverse fault1
F2north483normal fault16
F3south651normal fault33
F4south601.2normal fault45
F5south500.4normal fault52
F6south360.7normal fault57
F7south402.4normal fault68
F8north850.5normal fault71
F9north551.5normal fault94
F10north550.3normal fault102
F11south550.15normal fault113
F12south481.0normal fault131
F13north451.2normal fault143
F14south602.5normal fault173
F15north451.4normal fault198
Table 2. Conversion of rock parameters and rock mass parameters.
LithologyIntact Rock CharacteristicsRQDRock Mass Characteristics
σ c / MPa E r / GPa σ c m / MPa E m / GPa σ t m / MPa
Coal9.81.6695.30.50.7
Sandy mudstone18.24.48012.82.61.6
Carbonaceous mudstone15.33.17610.21.41.1
Siltstone42.316.79332.910.33.2
Pebbly coarse sandstone46.423.99736.115.83.6
Argillaceous siltstone37.914.68227.38.12.2
Table 3. Model mechanical parameters of rock strata.
LithologyBlock PropertiesContact Properties
Density
(kg/m3)
Elastic Modulus
(GPa)
Kn
(GPa/m)
Ks
(GPa/m)
φ
(°)
C
(MPa)
σt
(MPa)
Coal14000.8293121172.30.7
Sandy mudstone19802.9540216233.81.5
Carbonaceous mudstone18601.6492184213.21.0
Siltstone23308.610614213112.63.6
Pebbly coarse sandstone260010.013424683315.35.2
Argillaceous siltstone21208.28443563010.83.2
Disclaimer/Publisher’s Note: The statements, opinions and data contained in all publications are solely those of the individual author(s) and contributor(s) and not of MDPI and/or the editor(s). MDPI and/or the editor(s) disclaim responsibility for any injury to people or property resulting from any ideas, methods, instructions or products referred to in the content.