Article

An Improved Acid Fracturing Design through RoqSCAN Technology: A Case Study from Daniudi Gas Field in Ordos Basin, China

1
Petro-Engineering Research Institute, North China Oil and Gas Branch, Sinopec, Zhengzhou 450016, China
2
Key Laboratory of Marine Oil & Gas Reservoirs Production, Sinopec Petroleum Exploration and Production Research Institute, Beijing 100083, China
*
Author to whom correspondence should be addressed.
Processes 2023, 11(5), 1475; https://doi.org/10.3390/pr11051475
Submission received: 10 March 2023 / Revised: 3 May 2023 / Accepted: 8 May 2023 / Published: 12 May 2023
(This article belongs to the Section Energy Systems)

Abstract

:
The concept of geological engineering-integrated fracturing is widely applied in the conventional and unconventional reservoirs, aiming to achieve efficient and economic development. There is no doubt that fine reservoir evaluation is the basis and core of geological engineering-integrated fracturing. Therefore, in this paper, we performed a series of investigations on the basis of formation fine evaluation by using RoqScan technology. Firstly, the physical parameters of the target well located in Daniudi Gas Field were evaluated by a laboratory test and logging interpretation. Next, the composition and function of the RoqSCAN tool were introduce in detail. Furthermore, the elements, minerals, and rock mechanical parameters of the target well were evaluated by the RoqSCAN tool. Finally, the fine reservoir model was established on the basis of fine formation evaluation. Moreover, we conducted a series of research on porosity and principal stress of the target formation to compare the difference between the fine model and the conventional model. Based on the fine reservoir model, the acid-fracturing design and numerical simulation were further investigated. The results of experiments and numerical simulation mainly achieved the following findings: 1. The porosity and permeability of the target formation indicated that it was a tight, low-permeability reservoir; 2. According to the comparison of the distribution for different parameters in the target well, the modeling with fine reservoir evaluation had higher accuracy than the traditional modeling; 3. Based on the fine evaluation results, acid fracturing is recommended as a stimulation method to enhance the productivity of the target formation. This study provides an essential method for the integrated fracturing design of geological engineering.

1. Introduction

According to the Annual Energy Outlook 2022 released by the U.S. Energy Information Administration (EIA), the carbonate reservoir is one of the most significant domains of oil and gas exploration and development, with more than 60% of the world’s oil and 40% of the world’s gas reserves [1,2]. It is well known that most of the production increases since the 21st century were the results of hydraulic fracturing techniques. For carbonate reservoirs, acid fracturing technology was often used as a stimulation method. It refers to the use of acid, such as gelled acid and viscoelastic-surfactant acid, as a fracturing fluid, without proppant, at a pressure higher than the formation pressure. During acid fracturing, the corrosion action of the acid solution dissolves the wall surface of the fracture into uneven surfaces so that after stopping the pump for pressure relief, the fracture surface will not be completely closed. Therefore, it will have high acid-etched conductivity, which can restore and improve the production capacity of oil wells [3,4,5]. In addition, fracturing technology based on the concept of geological engineering integration has been widely used in the field in recent years.
The optimization goal of the integration of geological engineering is to maximize the stimulation and stable production potential of reservoir reconstruction, which achieves cost reduction and efficiency increase. Its technical core is the dynamic optimization and timely matching of engineering parameters and geological parameters [6,7]. Therefore, it can be concluded that geological and engineering sweet spot evaluation is the basis of reservoir economic benefit development. Wu et al. believed that quantitative evaluation was conducive to optimizing deep shale gas sweet spot selection, drilling and fracturing construction, and improving shale gas development efficiency [8]. Li et al. predicted the double “sweet spot” parameters of shale gas through earthquakes [9]. Liao et al. quantitatively evaluated the parameters of geological sweet spots and volume fracturing, including the stress difference coefficient, buried depth, fracture density, curvature, siliceous mineral content, and brittleness index, etc., by assigning values to the material basis and preservation conditions and defining the sweet spot area of shale gas, supporting the effective development of shale gas on a large scale [10]. Based on the logging data and logging interpretation results, Nie et al. carried out the research on the fine identification and division of the horizontal section of horizontal wells through small layers [11]. Jiang et al. carried out normalization correction on the gas logging results of the horizontal section and divided the horizontal section with the gas logging results of normalization correction, which increased the scientific nature of geological segmentation [12]. Liang et al. established a three-dimensional model of a shale gas reservoir, which was mainly composed of geophysical, reservoir geology, fracture system, and rock geo-mechanics models [13]. Based on the evaluation and identification of the “sweet spot”, with the goal of a “high and stable production of” the dessert body “and with the work guide of” reverse thinking design and forward operation construction, Yang et al. carried out the geological fine evaluation [14]. Wang et al. established an index system for the evaluation of the geological sweet spot, engineering sweet spot, and comprehensive sweet spot and used the analytic hierarchy process to carry out the evaluation of the geological engineering-integrated sweet spot [15]. Based on the logging data, the key parameters of reservoir geological evaluation, such as TOC, porosity, gas content, brittle mineral content, and micro-fracture development interval, were extracted to comprehensively evaluate the geological sweet spot. Considering that lithology is the main factor controlling geological sweet spots and brittleness index, and horizontal principal stress difference are the main factors controlling engineering sweet spots, seismic methods of predicting geological and engineering sweet spots were established on the basis of prestack simultaneous inversion. Jiang et al. presented a study from the perspectives of sweet spot optimization, drilling, well completion engineering, and fracturing technology in the Luzhou area, southern Sichuan [16]. Combined with the geology engineering integration, the coupling relationship was systematically analyzed between engineering and geological factors.
Based on the above investigation, many scholars have carried out a lot of research on the fine evaluation of reservoir geology through theory, experimentation, and simulation. However, most of these evaluation parameters need to be obtained by expensive laboratory analysis and testing methods through coring in the vertical section or by measuring and calculating through special logging methods after drilling. The timeliness of these measurement methods cannot meet the exploration and development needs. Recently, a new, automated mineralogy instrument developed by Robertson and Carl Zeiss was applied in the field to test both mineralogical information and textural data for reservoir characterization and well completion design at the wellsite in real-time. This new developed tool is called RoqSCAN [17,18,19,20,21]. According to the previous research papers, the RoqSCAN system is an e-beam analytical tool with a ruggedized mobile scanning electron microscope (SEM) platform [22,23,24,25]. Moreover, the technology was applied and achieved good results in the Bakken Formation [26]. At present, the RoqSCAN analysis is unique in that it also provides fracture and pore throat information, such as pore size, micro-fracture, and aspect ratio.
The structure of this paper is as follows. Firstly, the background of the target well, including physical properties and logging interpretation, etc., was introduced. Then, the RoqSCAN tool was introduced to perform fine reservoir evaluation. The RoqSCAN tool is a portable scanning electron microscope (SEM) system that consists of a scanning electron microscope, X-ray detector, and a highly configured computer workstation. We conducted element, mineral, and rock mechanical parameter testing by using the tool. Finally, we established the fine reservoir model and performed acid fracturing design for the target formation. The comparative analysis for the vertical and horizontal distribution of porosity and minimum horizontal principal stress was conducted to compare the difference between fine modeling and conventional modeling. Based on the established fine model, the perforation optimization, fracturing fluid’s performance evaluation, and acid fracturing numerical simulation were also performed to achieve exploration breakthrough.

2. Target Well

Daniudi Gas Field is located in the northeast of the Ordos Basin, with an area of 2003 km2. The natural gas resources are about 559.9 billion m3. The main task of the current exploration was to optimize the exploration targets and to realize the exploration breakthroughs. Therefore, the target vertical well X, with a measure depth of 3567 m, was deployed as an evaluation well in the area. Based on the previous exploration and development experience, the reservoir formation and fracture development were favorable. Furthermore, as shown in Figure 1, the fracture characteristic from core samples also illustrated that the natural fractures were developed in the target formation [27]. It should be noted that the Majiagou Formation is the reservoir formation. Ma 4, Ma 5, and Ma 6 are the single layers of the Majiagou formation and are also the main producing layers. Furthermore, the main task of well X was to evaluate the Ma 5 and Ma 6 sections of the Majiagou Formation and also to explore the Ma 4 section. In other words, the subsequent research on fine evaluation, geological modeling, and acid fracturing design were all conducted for these three single layers.

2.1. Physical Parameter

As shown in Table 1, the lithology was gray calcareous dolomite, and the total hydrocarbon distribution in gas logging was 5–78%. Furthermore, the average porosity of the target formation measured by 20 groups of the core test was about 5%, which was relatively low and had a poor physical property. Therefore, the implementation of the fracturing stimulation was the key to achieving productivity breakthrough.

2.2. Comprehensive Evaluation
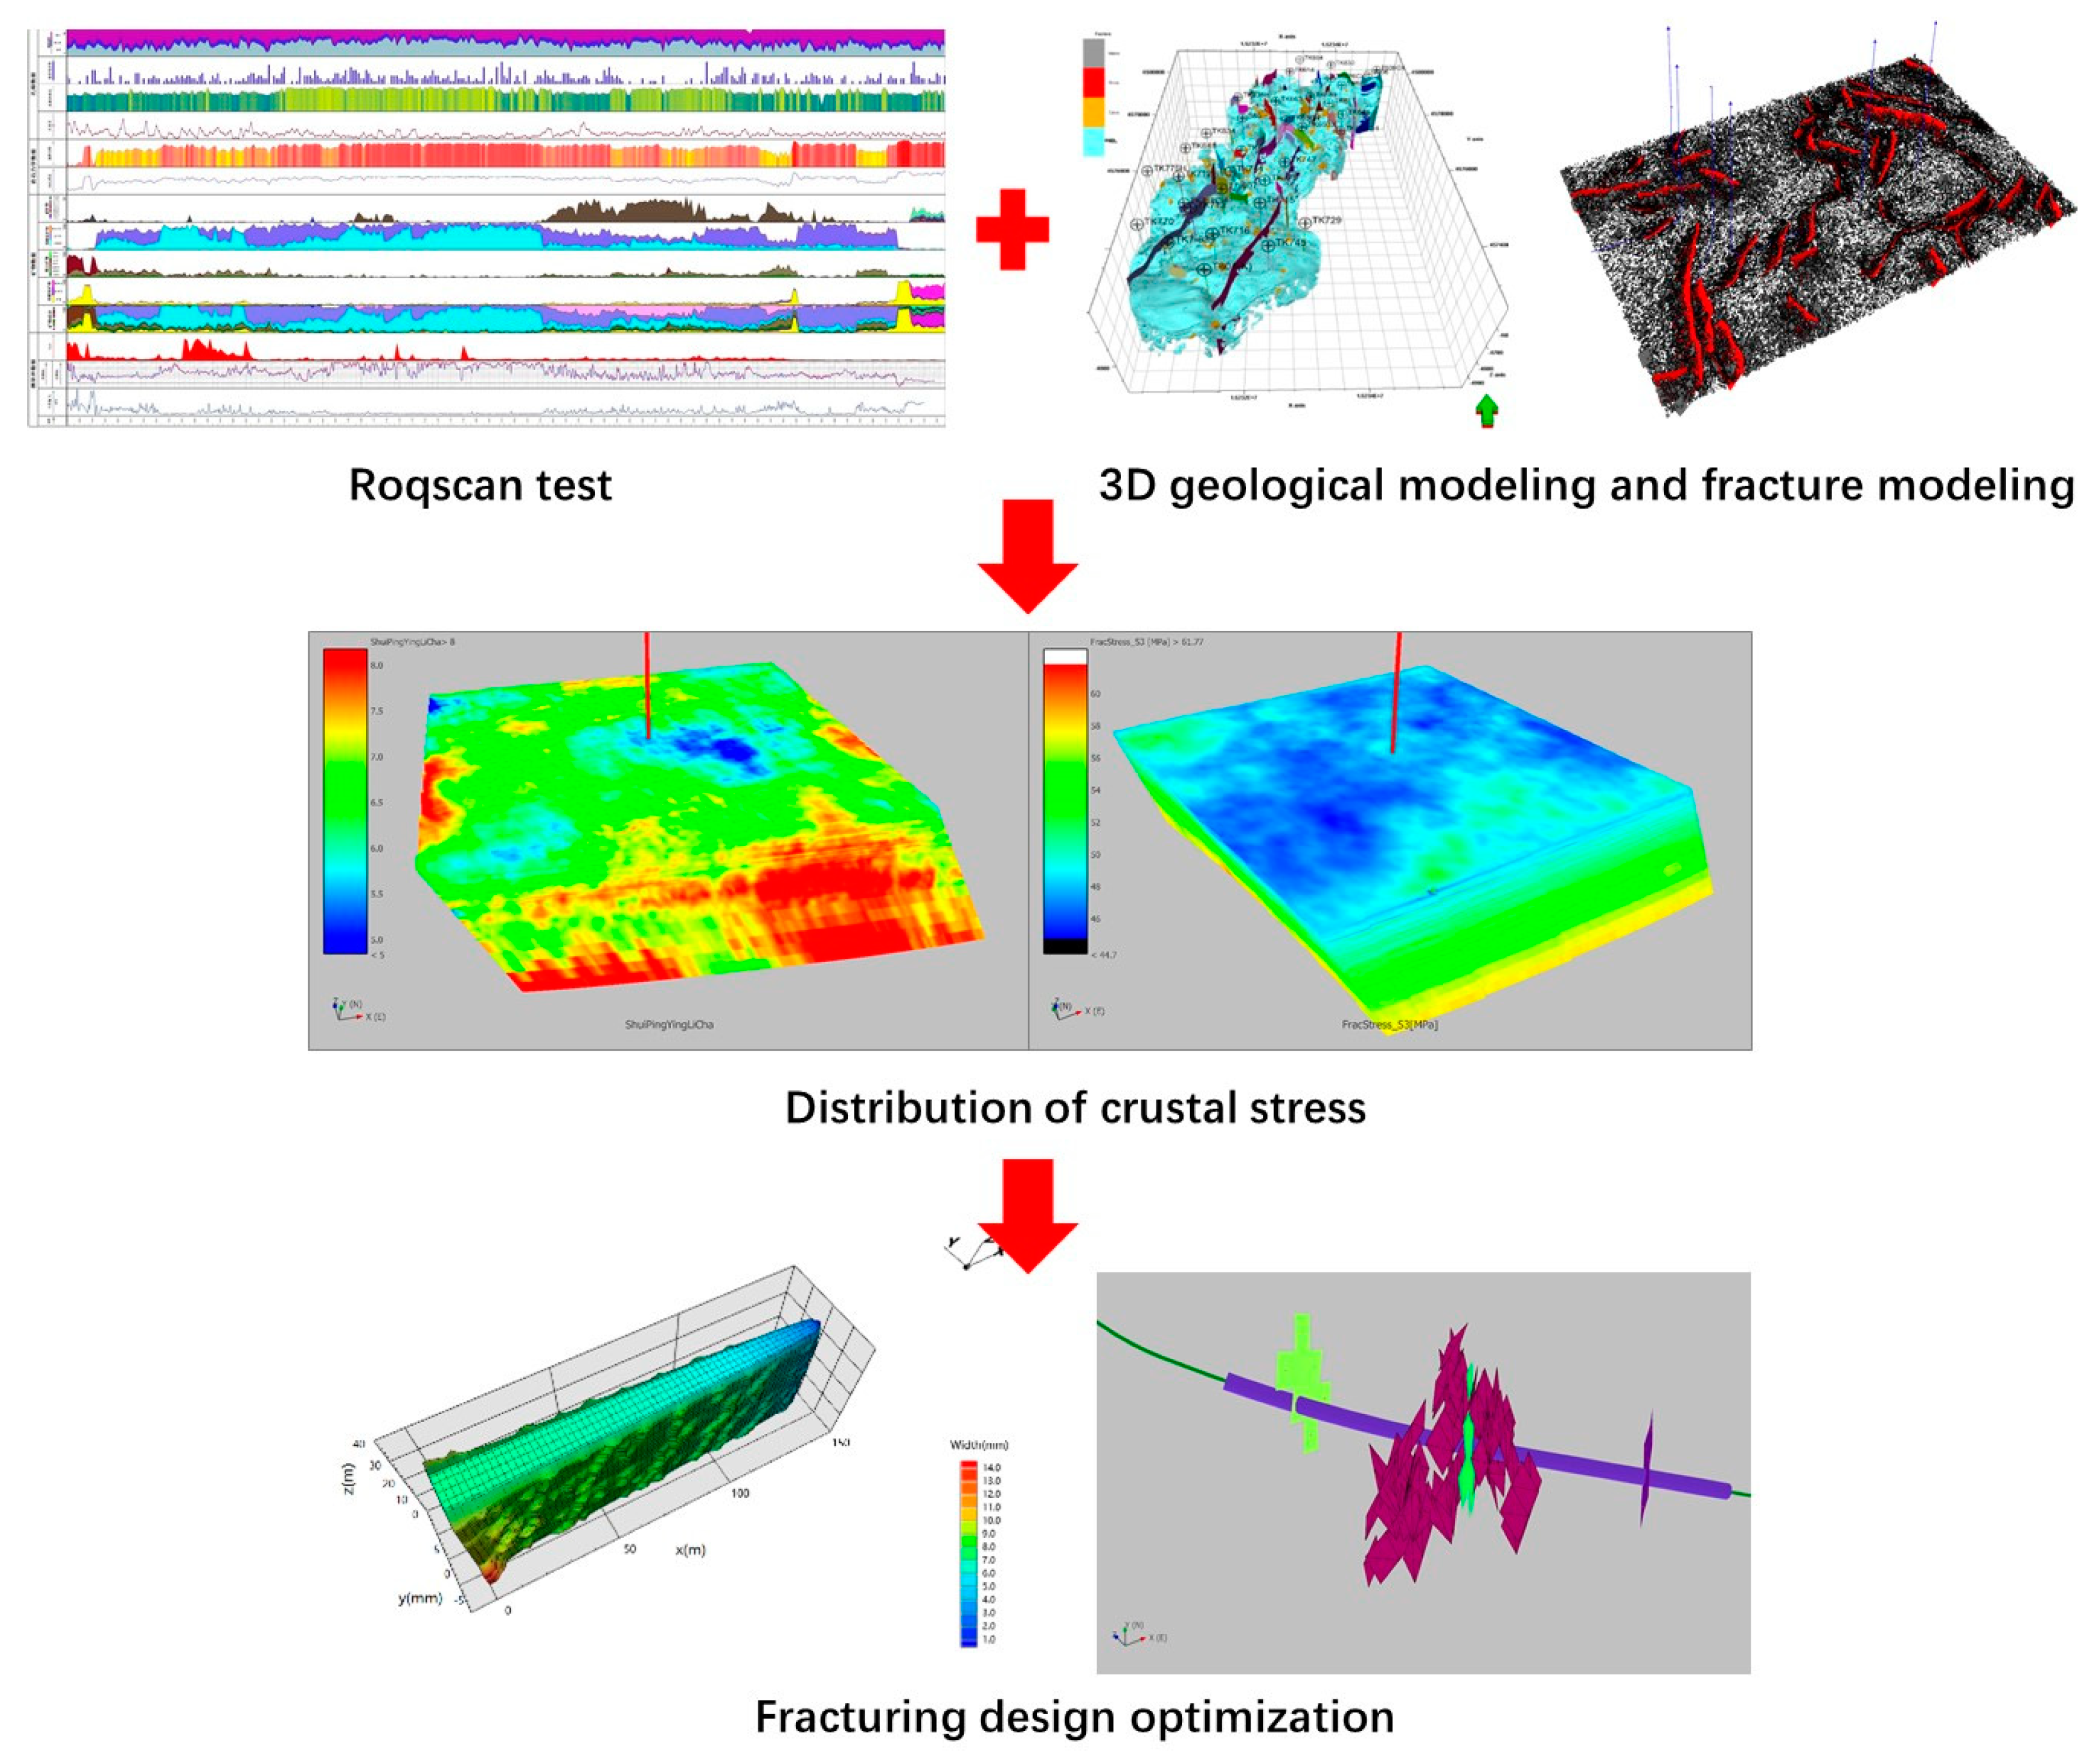
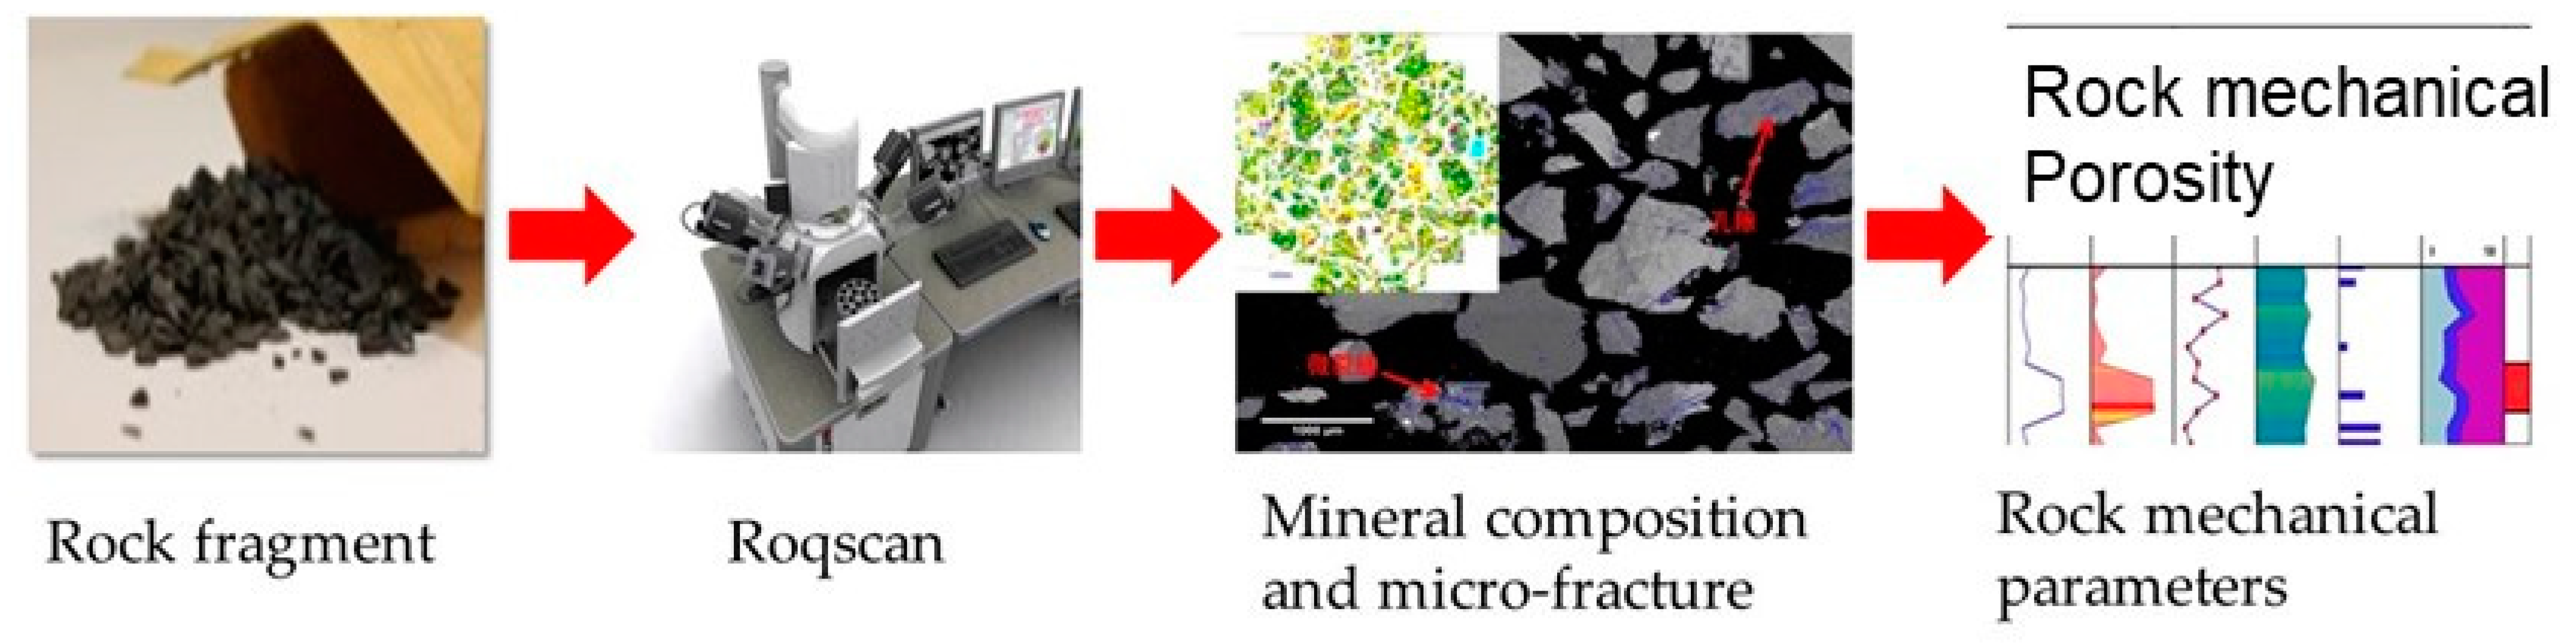
Based on the logging interpretation, Ma 5 and Ma 6 were comprehensively evaluated as the gas layer and the gas-bearing layer, respectively. More information can be found in Table 2. It can be seen that the logging-interpreted permeabilities of Ma 5 and Ma 6 were 0.11 mD and 0.10 mD, respectively. Furthermore, the final interpreted conclusions of Ma 5 and Ma 6 were the gas layer and the gas-bearing layer.

3. Research Method

The fracturing design based on fine reservoir evaluation in this paper was different from the conventional fracturing design. In order to clarify its difference, the specific research method flowchart is shown in Figure 2. Firstly, the core samples were from logging cutting and were scanned by using the RoqSCAN tool for the entire well section of the target reservoir. According to the obtained parameter data of the elements, minerals, rock mechanics, and so on, the maximum and minimum horizontal principal stresses and brittleness index were inversely calculated. These parameters were used for three-dimensional geological modeling, which was more accurate than the traditional data derived from logging and geological interpretation data. Then, the crustal stress distribution characteristic, which had the greatest effect on artificial fracture initiation and propagation, was clarified on the basis of the 3D geological modeling above. Moreover, the vertical and horizontal crustal stress fields, as well as along the vicinity of the wellbore, were described and characterized in detail, which provided the accurate stress data for the numerical simulation of fracture propagation during hydraulic fracturing. Finally, the acid fracturing design of the target formation was performed, including perforation optimization, fracturing fluid evaluation, acid-etched fracture morphology, acid-etched conductivity, and so on.

4. Results and Discussion

4.1. Fine Reservoir Evaluation

At present, the concept and practice of geological engineering integration have been widely applied to the hydraulic fracturing of unconventional oil and gas reservoirs. However, the use of seismic, logging, core, and other data cannot accurately describe the mineral composition, the minimum principal stress, the maximum principal stress, and some other parameters, which means a lack of guidance for subsequent effective reservoir fracturing. In light of this, RoqSCAN technology, with the automated mineralogy tool, which can provide the above parameters at the well site in real-time, was introduced to perform fine reservoir evaluation. In other words, the RoqSCAN testing is a supplement to seismic and logging interpretation data, which can improve the accuracy of the subsequent 3D geological modeling and fracturing design numerical simulation.

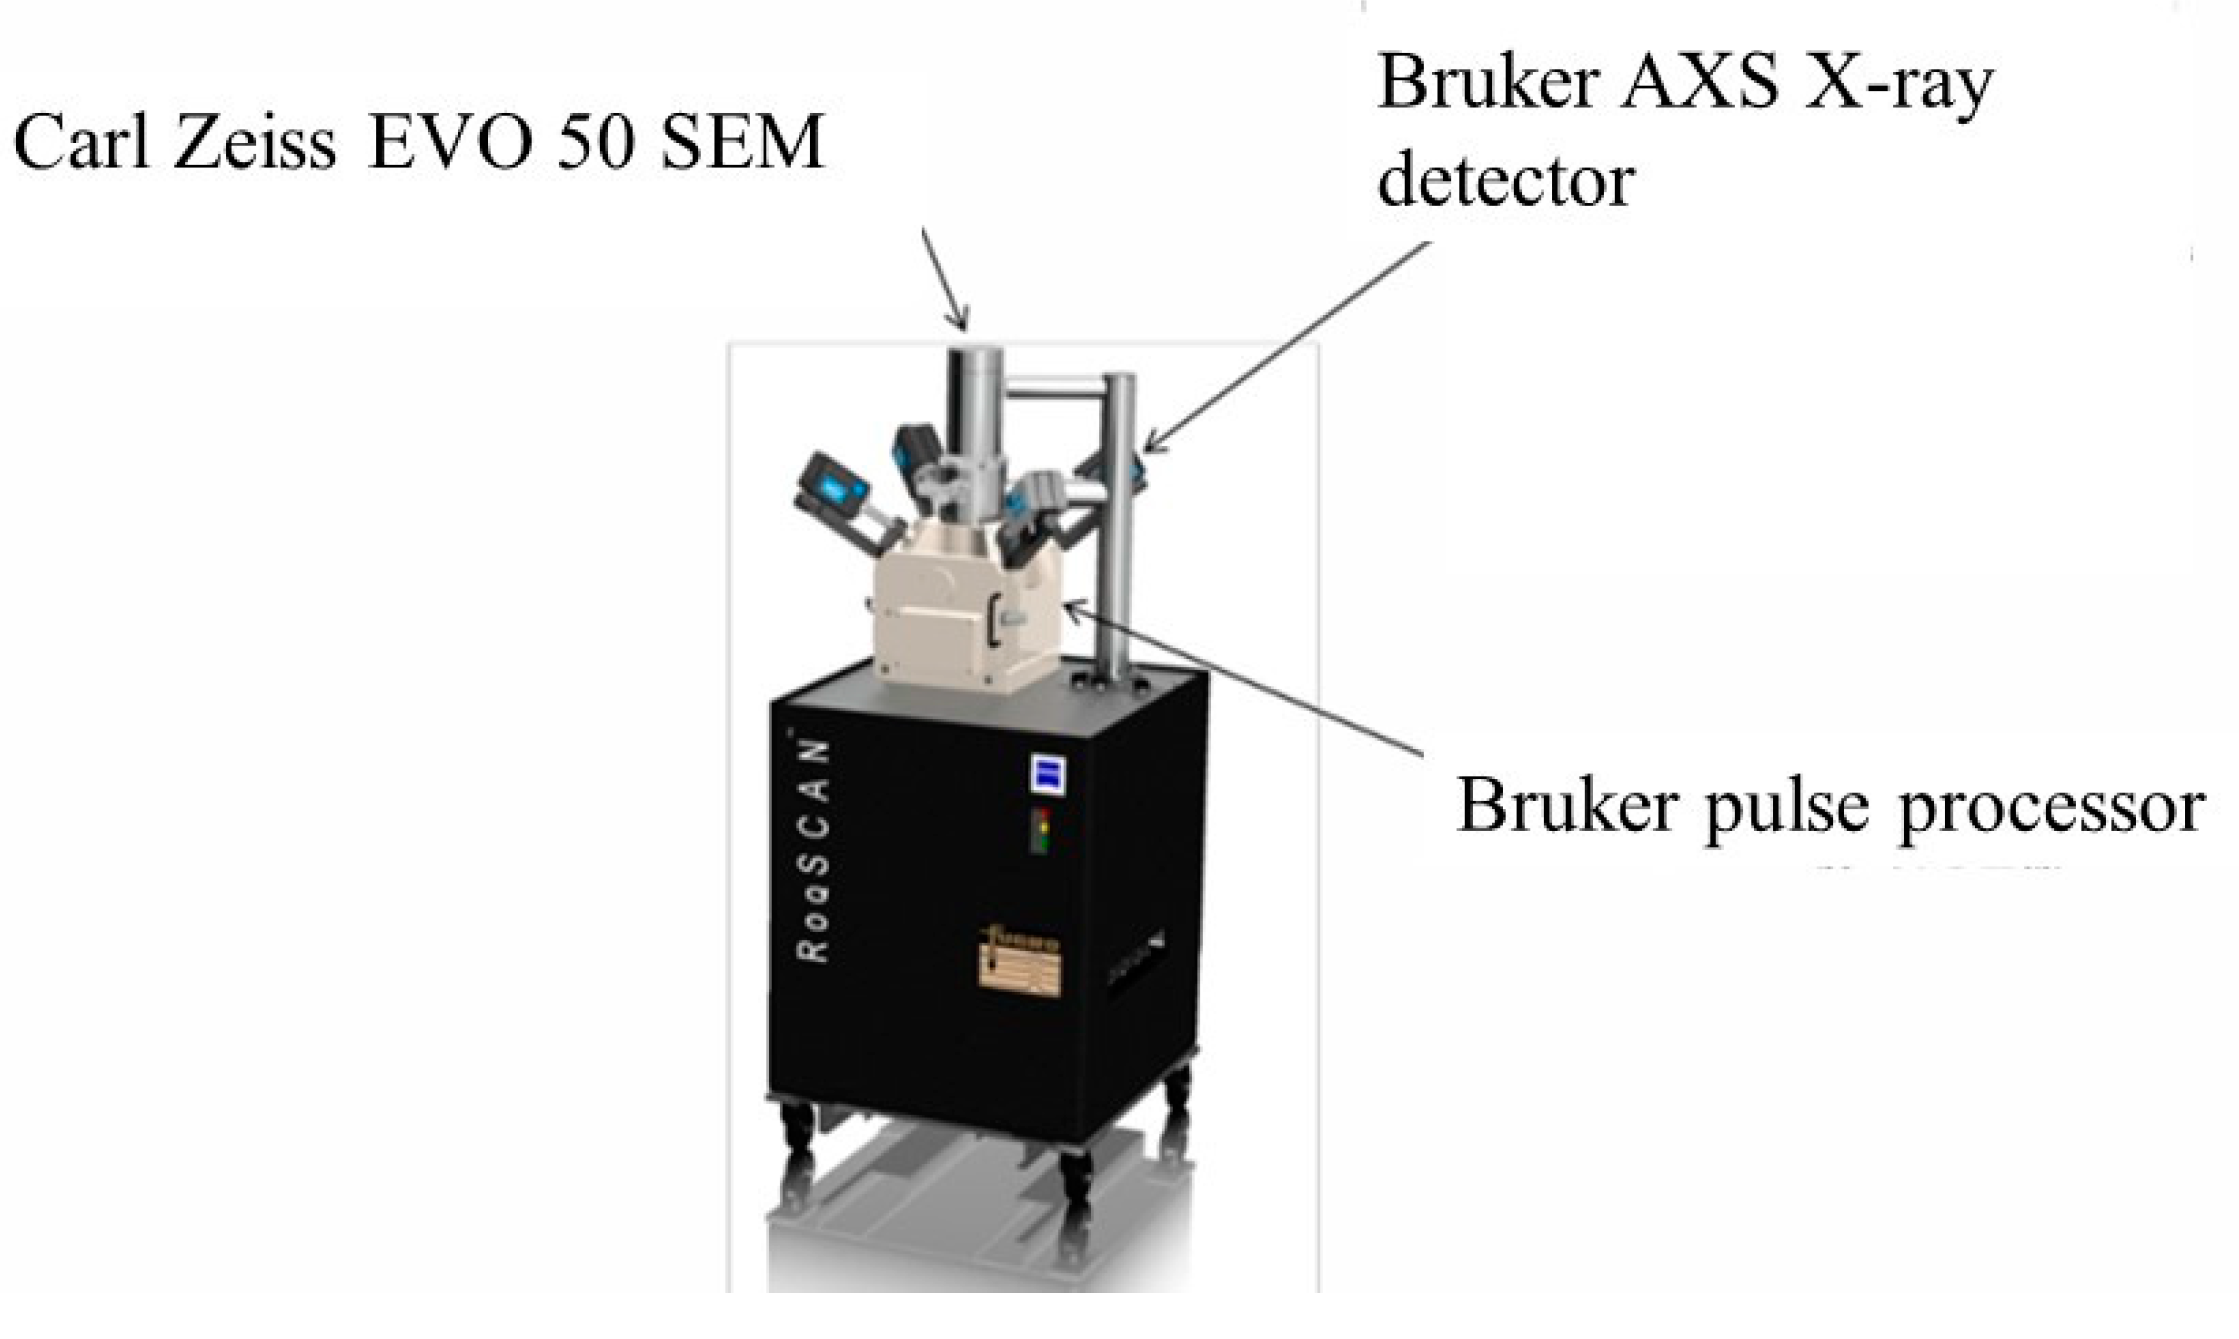
4.1.1. Experimental Setup

As shown in Figure 3, RoqSCAN is a portable and durable scanning electron microscope (SEM) system designed and developed by CGG Robertson and Carl Zeiss for field application, and it consists of a scanning electron microscope, X-ray detector, and a highly configured computer workstation.
Figure 4 shows the RoqSCAN workflow. First, the rock fragments were polished and coated with carbon to make a scanning sample. Then, the sample was scanned to obtain the compositions and contents of elements and minerals, as well as the development of pores and micro-fractures. Finally, the rock mechanical parameters, including brittleness index, elastic modulus, and Poisson’s ratio, were retrieved, based on the measured element mineral composition and pore, as well as micro-fracture, data.

4.1.2. Element and Mineral

This paper used well X as an example to carry out element and mineral analysis. It is noteworthy that RoqSCAN technology, with a detection accuracy of elements greater than 0.01%, can detect the relative percentage content of elements and identify 50 elements. In addition, it also can detect the mineral composition and percentage content, including brittle minerals, clay minerals, and accessory minerals. The scanning pictures available after the technical scanning included the backscattered pore distribution map, the backscattered fracture distribution map, the high-resolution mineral composition coloring map, and the RoqSCAN backscattered imaging map.
According to the element scanning results, we selected representative elements, as shown in Figure 5. The main elements of the target interval were oxygen, silicon, calcium, aluminum, etc., of which oxygen and calcium were the main elements, indicating that the well section was mainly composed of carbonate minerals.
Based on the investigation of elements for target formation, the development of minerals, pores, and micro-fractures were further studied. As shown in Figure 6, the pores and micro-fractures, as well as mineral types, for the Ma 5 and Ma 6 section were presented by using the RoqSCAN scanning picture. Obviously, the development of pores and fractures in the reservoir and the types of minerals had a certain impact on the subsequent hydraulic fracturing.
In terms of mineral types for target formation, they were divided into silicate, carbonate, and clay for analysis and investigation. As shown in Table 3, the content distribution and average content of different minerals for target formation were presented. It can be seen that carbonate rock was the main mineral, taking up 70%, followed by quartz minerals, accounting for about 10%, and clay minerals, accounting for about 9%. Other kinds of trace minerals merely accounted for a small proportion. Due to the high carbonate content, acid fracturing might be more suitable for the target reservoir. Moreover, the clay minerals were mainly in the illite and illite–Mongolian mixed layer. Therefore, it was necessary to prevent velocity-sensitive and water-sensitive damages during reservoir stimulation.

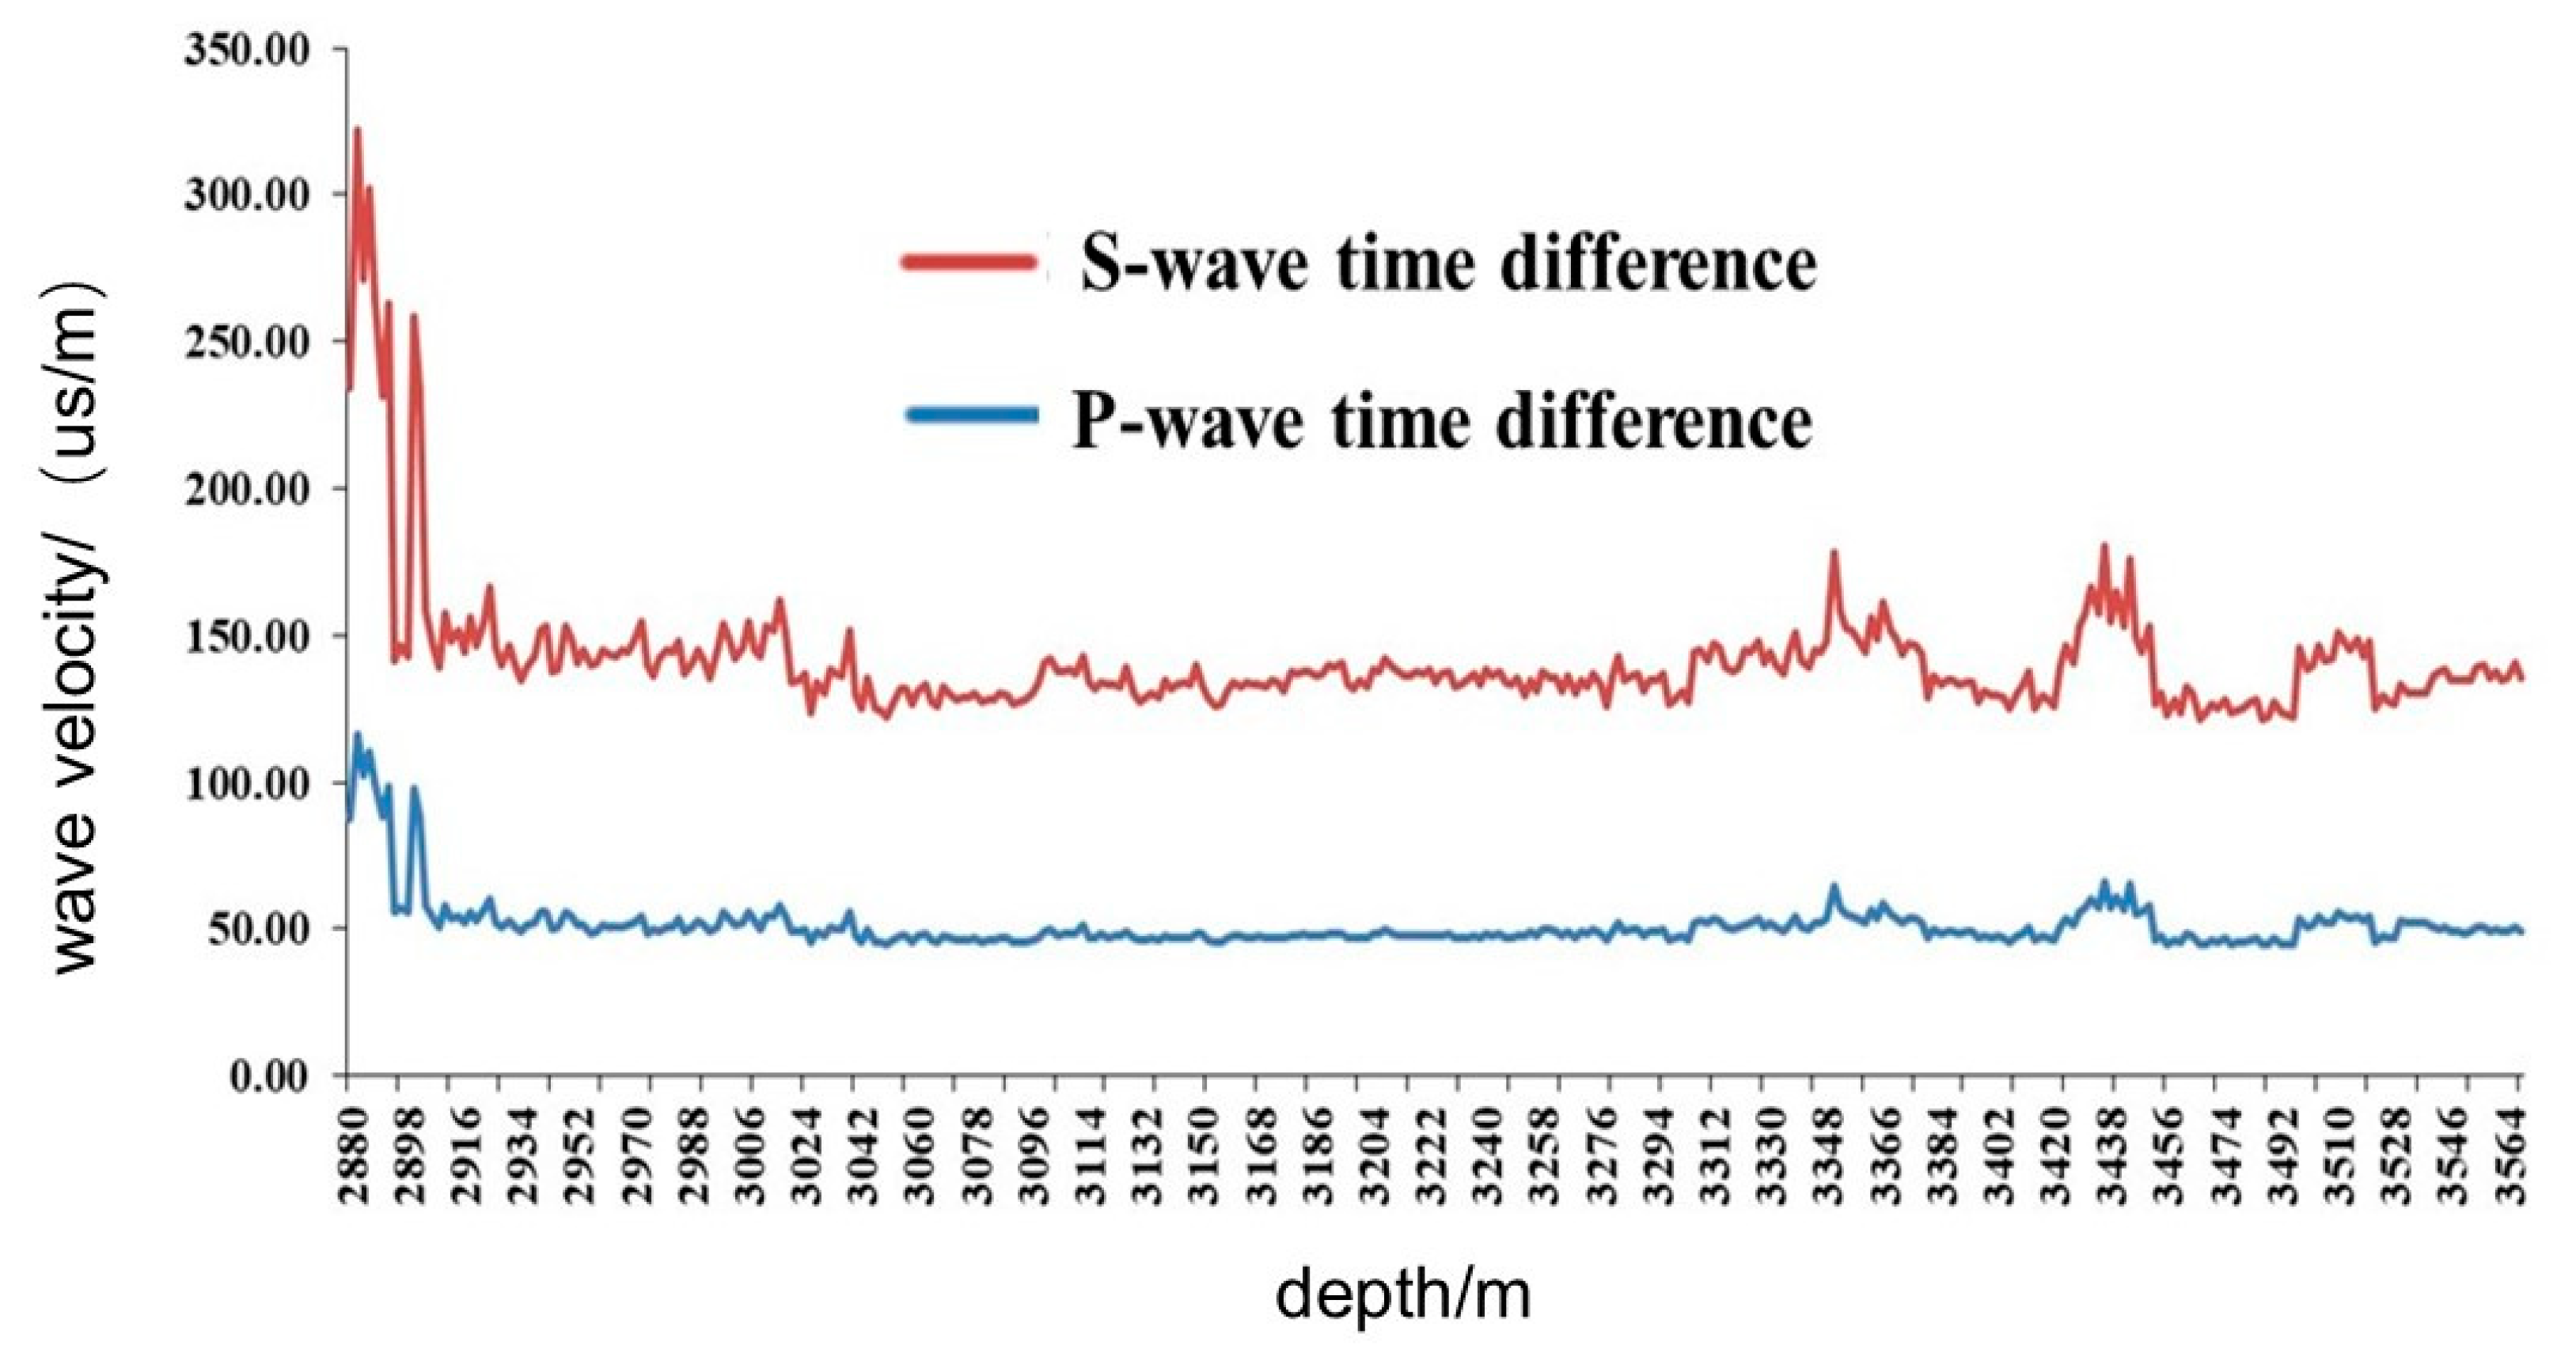
4.1.3. Rock Mechanical Parameters

According to the data obtained from RoqSCAN scanning, the continuous elastic modulus, Poisson’s ratio, brittleness index, and sonic transit time of the whole scanning well section were inversely calculated to provide data support for guiding the optimization of segmented clustering.
It can be seen from the curve in Figure 7 that the range of the P-wave offset time of the target interval was 44.38~116.46 us/m, and the value of the S-wave offset time was 76.91~205.63 us/m, which reflects the heterogeneity of the horizontal interval.
The elastic modulus and Poisson’s ratio reflected the supporting capacity of the rock after fracture and the fracture capacity under stress and had important roles and influences on the compressibility of the reservoir rock and the complexity of fracture extension during fracturing. The Poisson’s ratio and the elastic modulus of the target layer ranges are presented in Figure 8.
Formation brittleness evaluation is of great significance to guide fracturing. The higher the brittleness index is, the easier the formation rock is to fracture, and the higher the compressibility is. It can be seen from Figure 9 that the brittleness index of the target interval was slightly higher, ranging from 38.5% to 99.6%, which was conducive to fracturing reconstruction.

4.2. Acid Fracturing Design

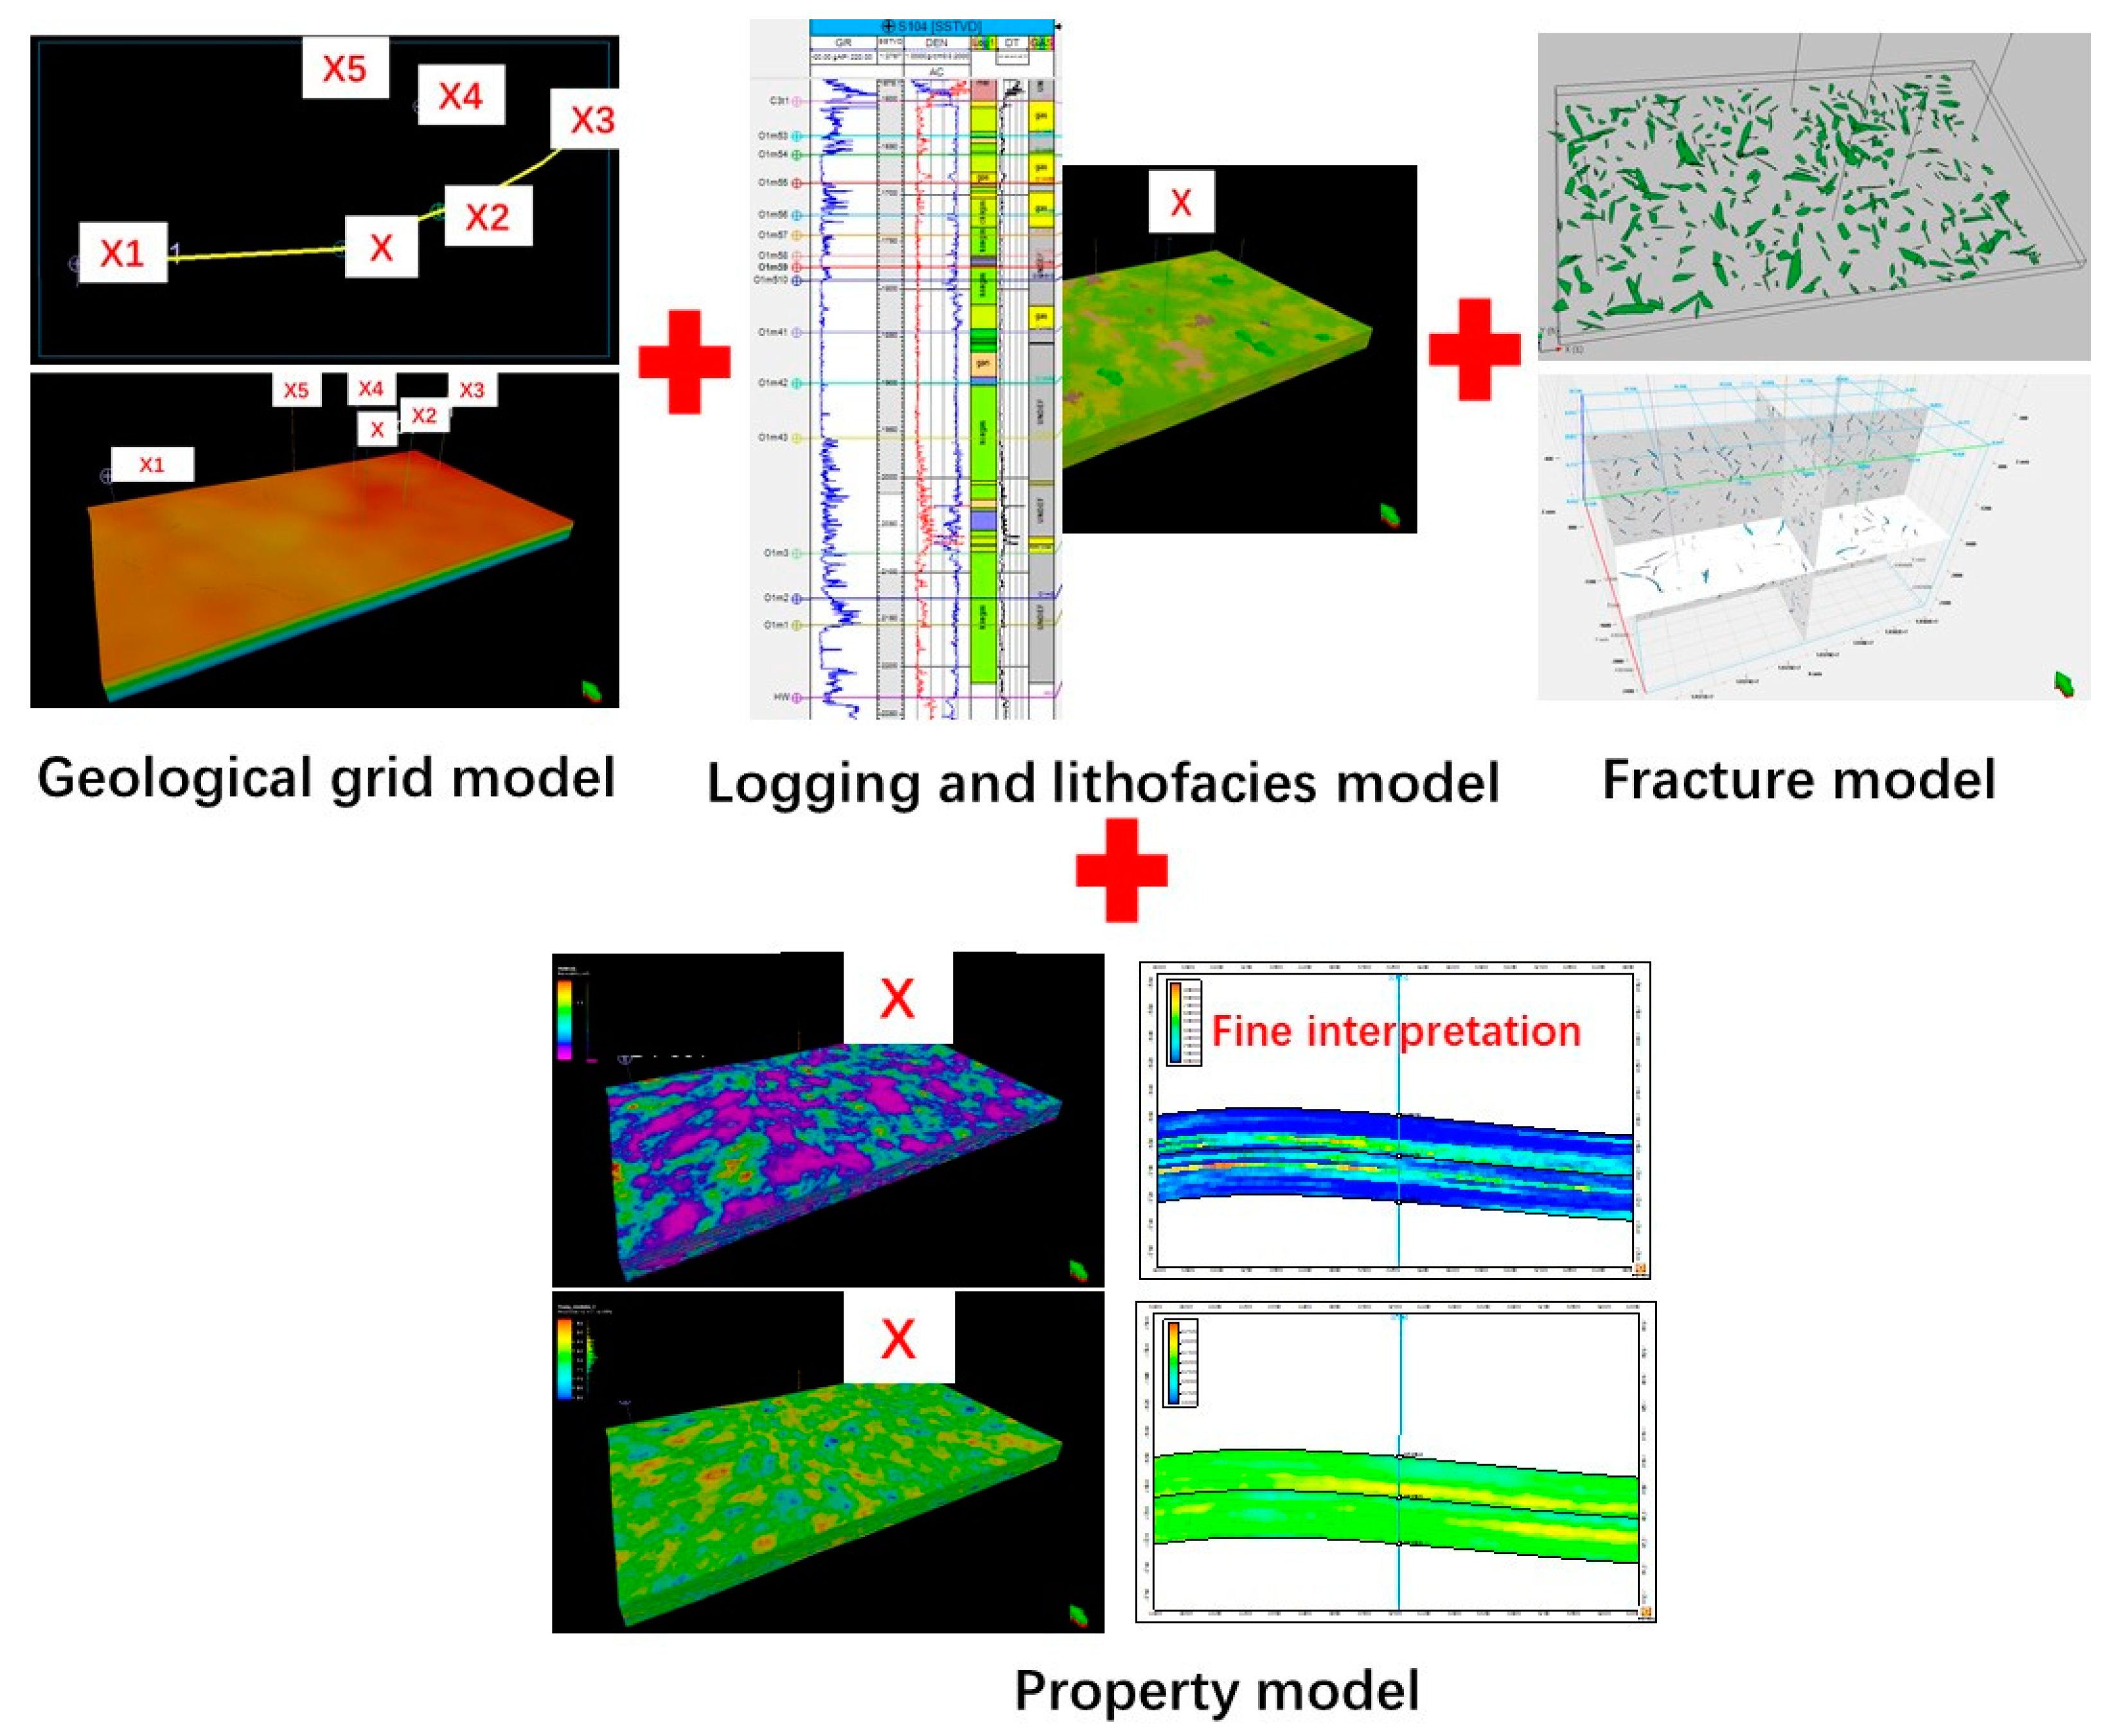
4.2.1. Fine Reservoir Modeling

Based on the fine reservoir evaluation, this paper first developed geological modeling to provide the model basis for the fracturing design. As shown in Figure 10, the geological grid model, lithofacies model, and natural fracture model were consistent with the conventional modeling, but the property model with fine evaluation results was different from conventional modeling. For the property model, some parameters, such as the horizontal principal stress, porosities obtained by RoqSCAN results were added to the model-establishing process to improve the accuracy of the model.
It should be noted that the software used for modeling was Schlumberger’s Petrel commercial software. These parameters, including porosity, mineral compositions, brittleness index, Young’s modulus, Poisson’s ratio, and crustal stress calculated by inversion obtained by RoqSCAN testing, were added in the model to replace the ones calculated from logging interpretation. Then, this model was imported into the commercial software Fracman for crustal stress analysis and numerical simulation of hydraulic fracturing design.

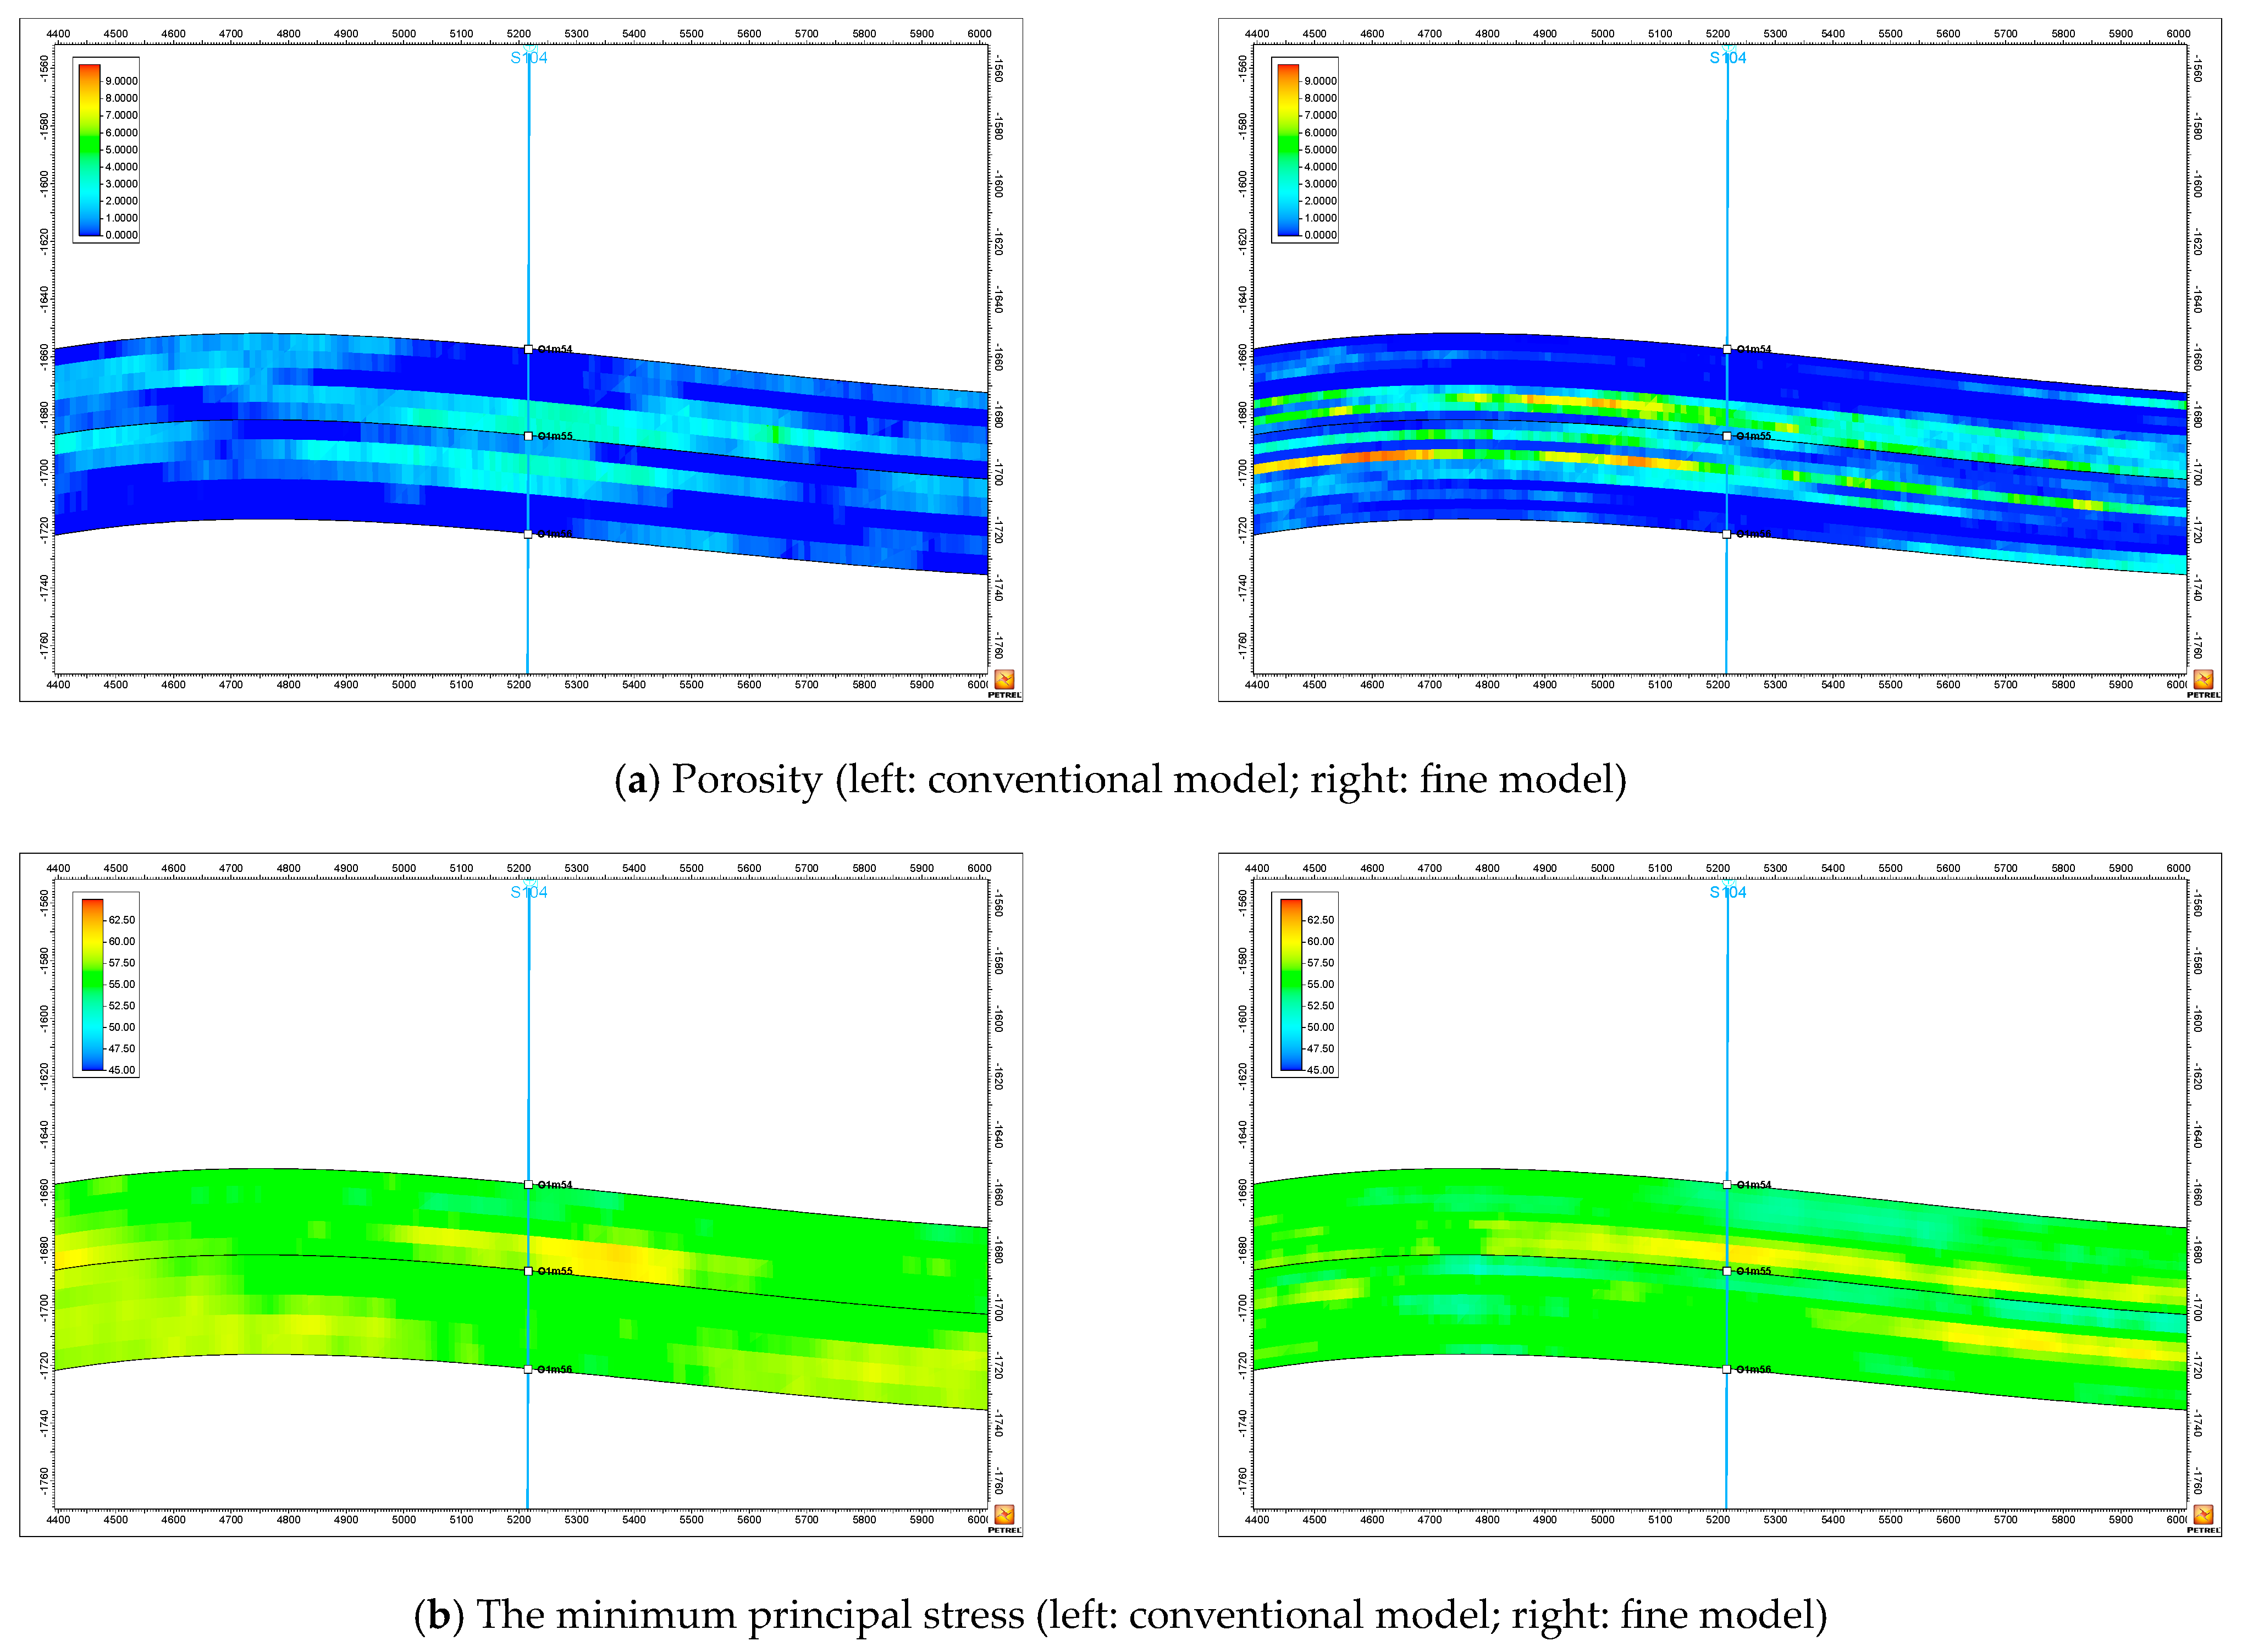
4.2.2. Comparative Analysis

In order to compare the difference between fine modeling and conventional modeling, this paper carried out further research on the basis of the established model. Taking porosity and minimum horizontal principal stress as examples, Figure 11 shows the specific comparison results. It can be seen that the porosity model established by fine scanning results was more precise in describing the reservoir. In the same way, the description of the minimum horizontal principal stress was more precise and accurate, which has guiding significance for the subsequent fracturing design.
Through the above analysis, we know that it is more accurate to use scanning results to model. In order to further analyze the plane distribution characteristics of the physical parameters of the target layer, this paper used the Ma 5 layer as an example to carry out analysis. Figure 12 shows the plane distribution characteristics of the parameters, including porosity, Young‘s modulus, and Poisson’s ratio at the top, middle, and bottom of the target formation. It can be clearly seen that the porosity distribution in the layer had strong heterogeneity. The porosity in the north was significantly higher. Since the crustal stress had a great influence on the initiation and propagation of fractures during hydraulic fracturing of acid fracturing, the interlayer characteristics of crustal stress for the target formation were further analyzed. Similarly, Figure 13 shows the characteristics of interlayer principal stress and stress differences in the upper, middle, and lower parts of the target reservoir. It can be seen that the distribution patterns of maximum and minimum horizontal principal stresses were basically similar. Moreover, the stress difference was mainly distributed between 5–8 MPa, which was conducive to the formation of a complex fracture network in subsequent fracturing and increased the stimulated reservoir volume.

4.2.3. Fracturing Design

In general, fracturing design consists of perforation, fracturing materials, fracture propagation simulation, and so on. This section will introduce these parts in detail. It is widely known that perforation construction is required before fracturing. Moreover, perforation is also conducive to fracture initiation, and the specific perforation parameters are shown in Table 4. It can be seen that the perforation density and depth were 16 hole/m and 90°, respectively. A proper perforation density is conducive to uniform liquid injection and promotes uniform fracture initiation and propagation. Furthermore, a perforating phase angle of 90° is easier for promoting fracture initiation. The perforation diameter and depth were greater than 12 mm and greater than 1000 mm, respectively. Similarly, the optimized perforation diameter and depth are also conducive to the initiation and propagation of fractures.
Fracturing fluid is one of the most critical factors for successful fracturing design. Since the carbonate content of the target reservoir was high, acid fluid was selected as the reconstruction fluid. At present, there are many types of acid solutions, and a more mature, thickened acid system was selected in this paper. It should be noted that the gelled acid was composed of 1 wt% thickener, 0.5 wt% cleanup additive, 0.5 wt% clay stabilizer, 1 wt% high-temperature corrosion inhibitor, and 1 wt% ferric ion stabilizer. As shown in Figure 14, the thickened acid had good hanging performance. Furthermore, the viscosity–temperature curve showed that the viscosity of the thickened acid was approximately 30 mPa·s under the shear rate of 170 s−1. More detailed information on gelled acid can be found in our published research.
Based on the above investigation on perforation and fracturing fluid, we further developed the pumping program design and fracture propagation simulation. Table 5 shows the designed pumping procedure. It can be seen that the pre-flush slickwater was mainly used for cooling the formation and establishing the operation displacement. Moreover, the viscosity of slickwater in the pump schedule was about 5 mPa·s under the shear rate of 170 s−1. Pre-resistance reducing acid was used to communicate with natural fractures and reduce construction difficulty. The main gelled acid was used to create and etch fractures to form high-conductivity channels.
The numerical simulation of fracture propagation during acid fracturing was carried out on the basis of the fine reservoir evaluation and the design of the pumping program. It is common knowledge that acid-etched fracture conductivity and effective acid-etched fracture length are the two key factors to determine the acid fracturing effect. Hence, these two factors were investigated. The numerical simulation results are shown in Figure 15. The numerical simulation showed that the acid-etching fracture was 150 m long and 30 m high. In addition, the gelled acid formed non-uniform etching on the fracture wall. The maximum dynamic fracture width reached 14 mm, and the closed fracture width was 4 mm, which effectively ensured the high conductivity of the acid-etched fracture. Compared with the length of acid-etching fracture, the effective acid-etching fracture length determined the final stimulation effect. It can be seen that the effective acid-etched fracture length could reach 142 m, indicating that acid fracturing achieved the satisfactory stimulation effect. Moreover, the distribution of acid-etched fracture conductivity showed that the average conductivity within acid-etched fractures reached 20 D·cm, which meets the later production requirements.

5. Conclusions

In this paper, we performed a series of investigations on the basis of formation fine evaluation by using RoqSCAN technology. The physical parameters of the target well were evaluated by a laboratory test and logging interpretation. Moreover, we established a fine reservoir model and performed a series of investigations on physical parameter distributions, fracturing design, and so on. Based on the laboratory experiments, numerical simulation, and theoretical analysis, the following conclusions were reached:
(1)
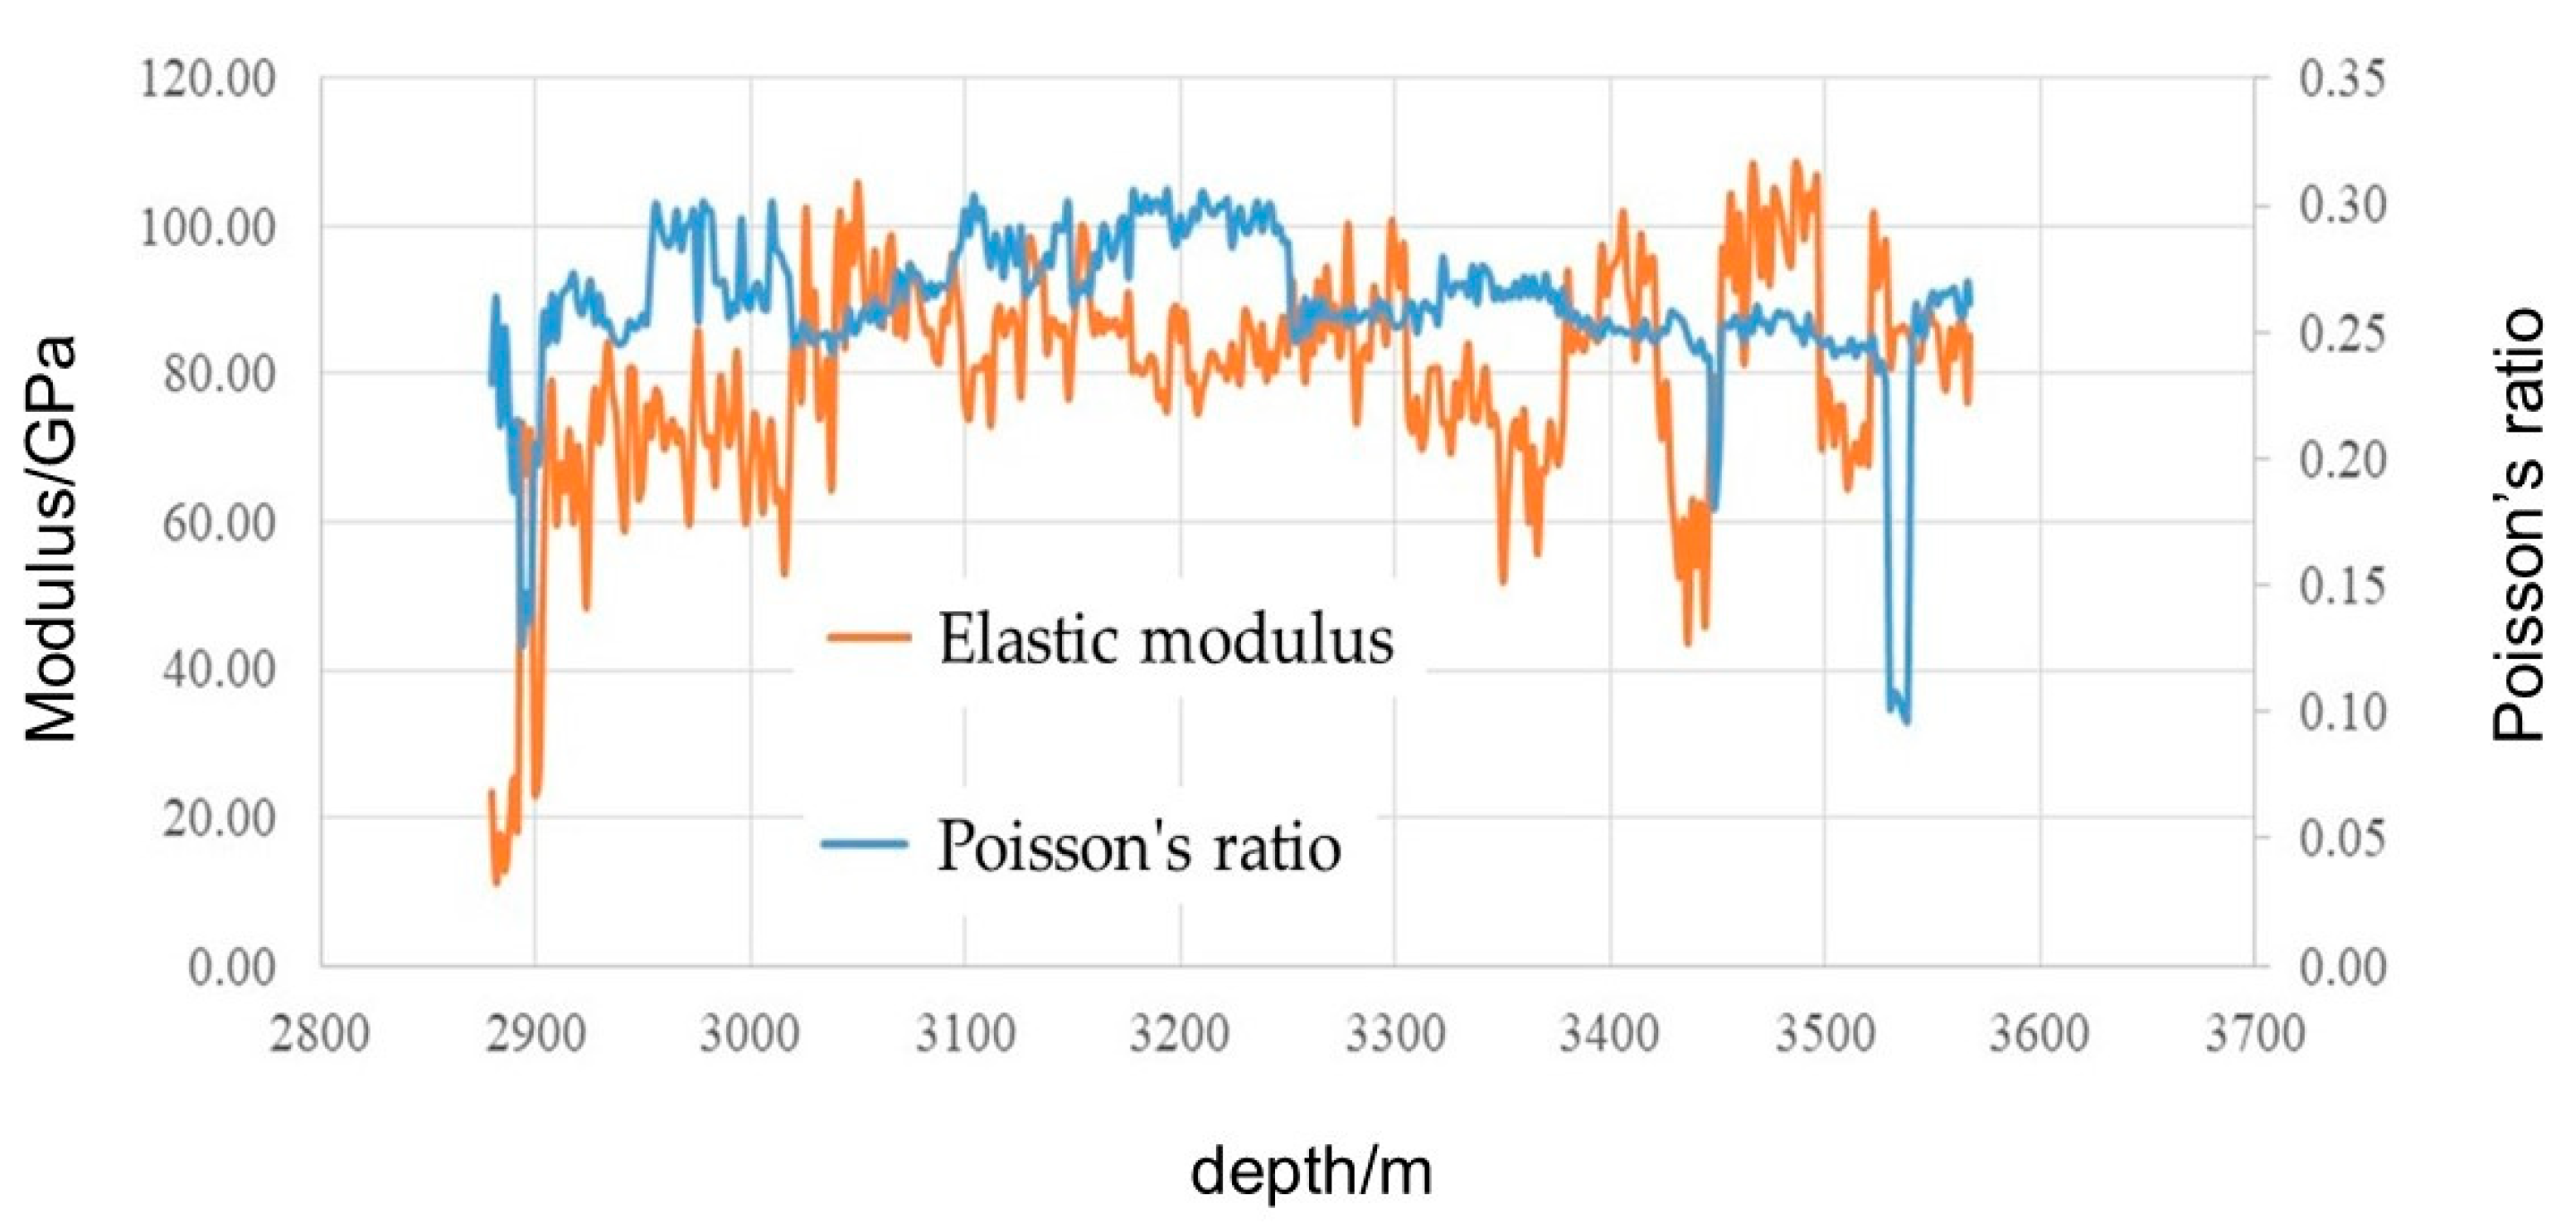
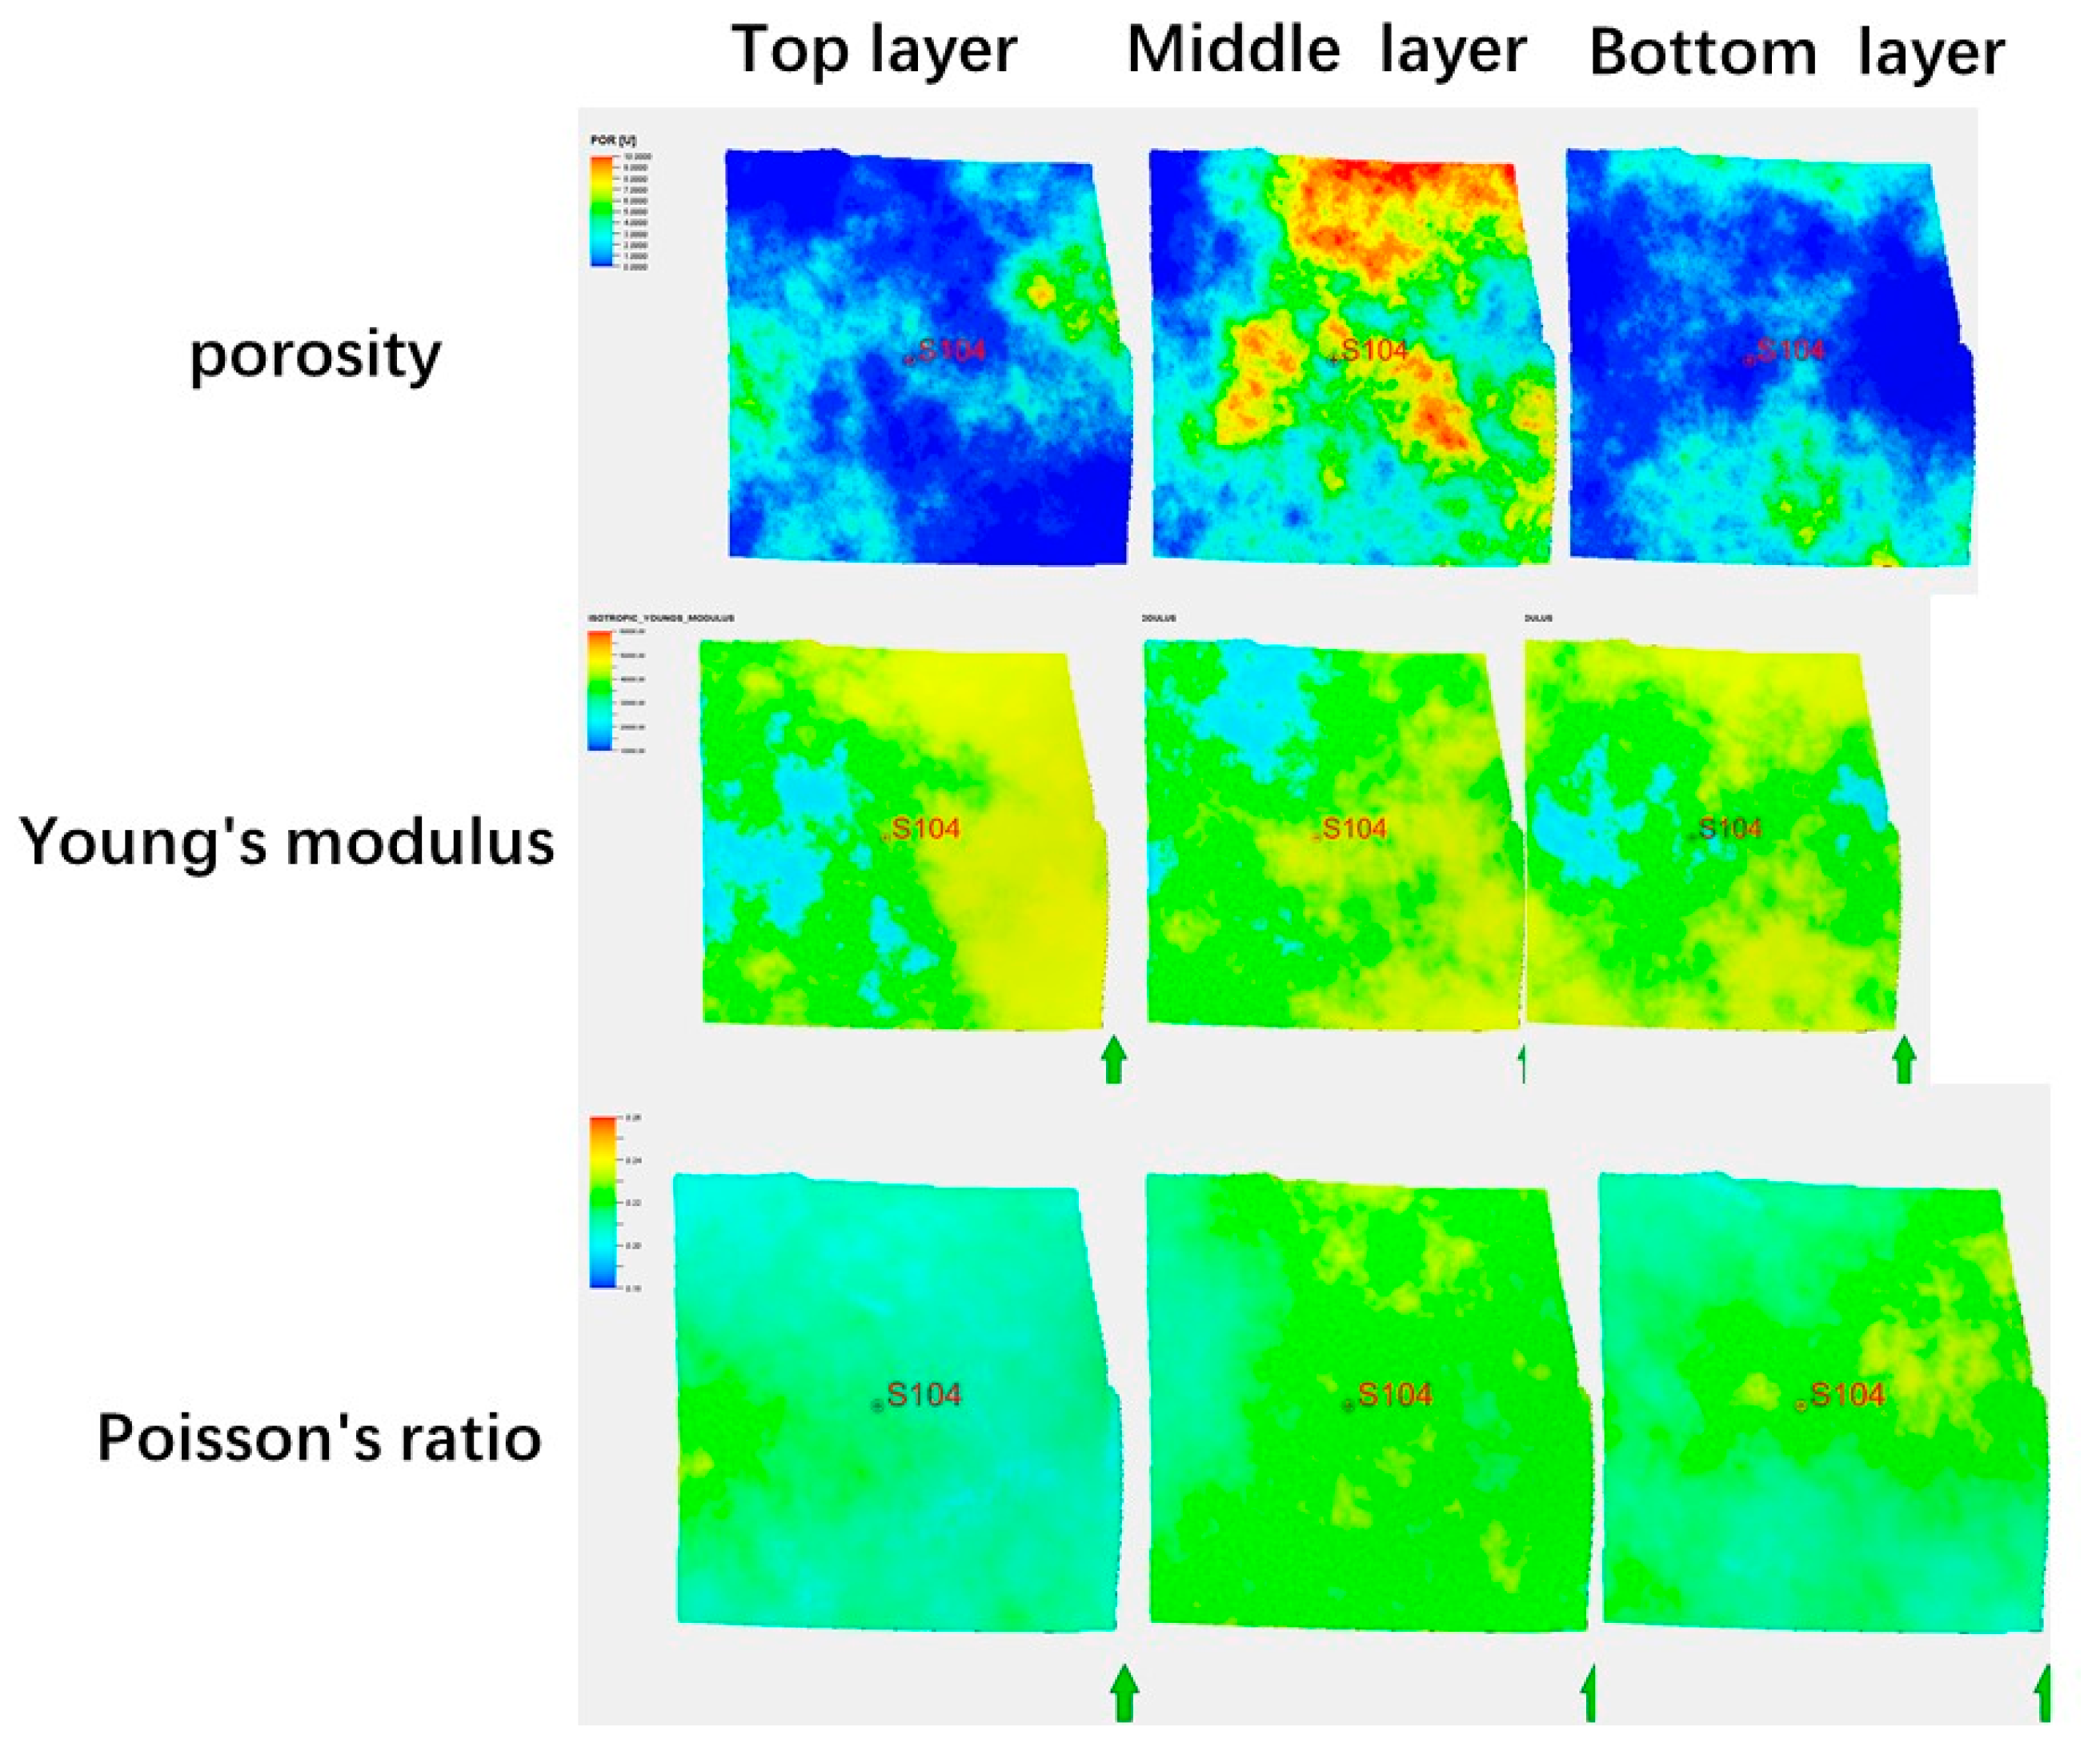
The RoqSCAN technology had good applicability and could significantly improve modeling accuracy. Carbonate rock was the main mineral, taking up 70%, followed by quartz minerals, accounting for about 10%, and clay minerals, accounting for about 9%. The elastic modulus and Poisson’s ratio were distributed between 60–100 GPa and 0.18–0.31, respectively. The brittleness index of the target interval was slightly higher, ranging from 38.5 to 99.6, which was conducive to fracturing reconstruction.
(2)
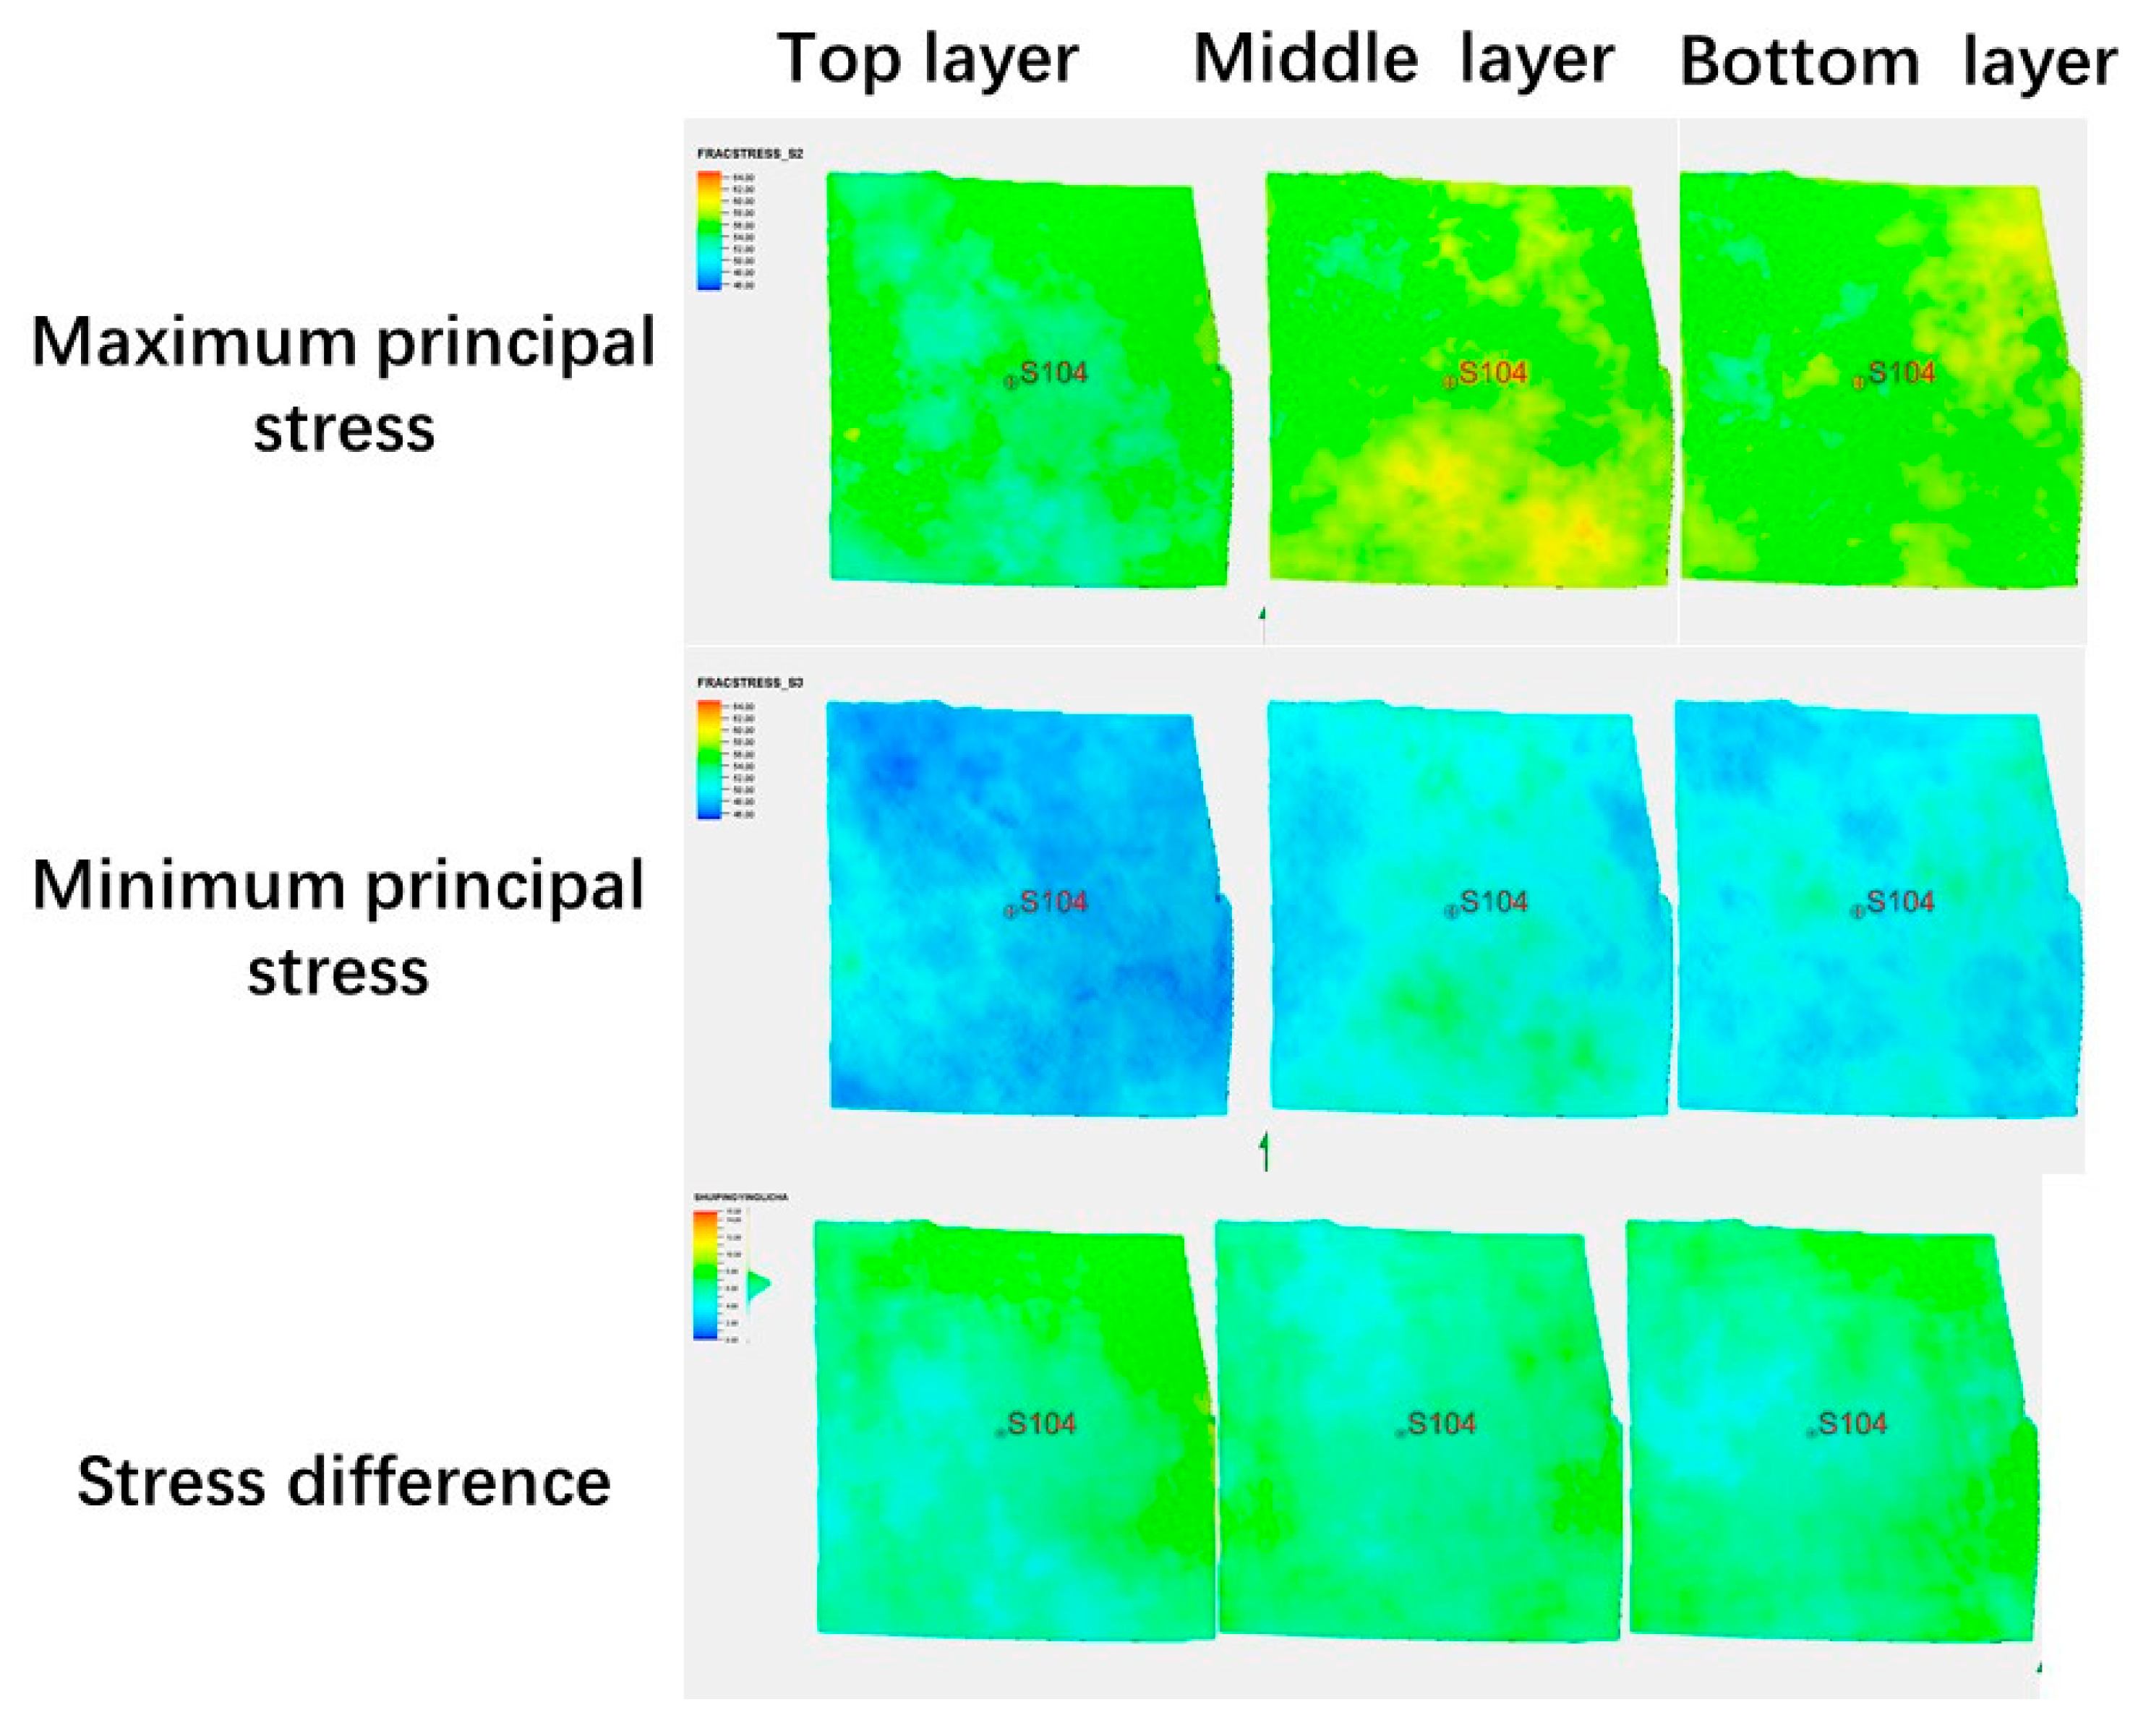
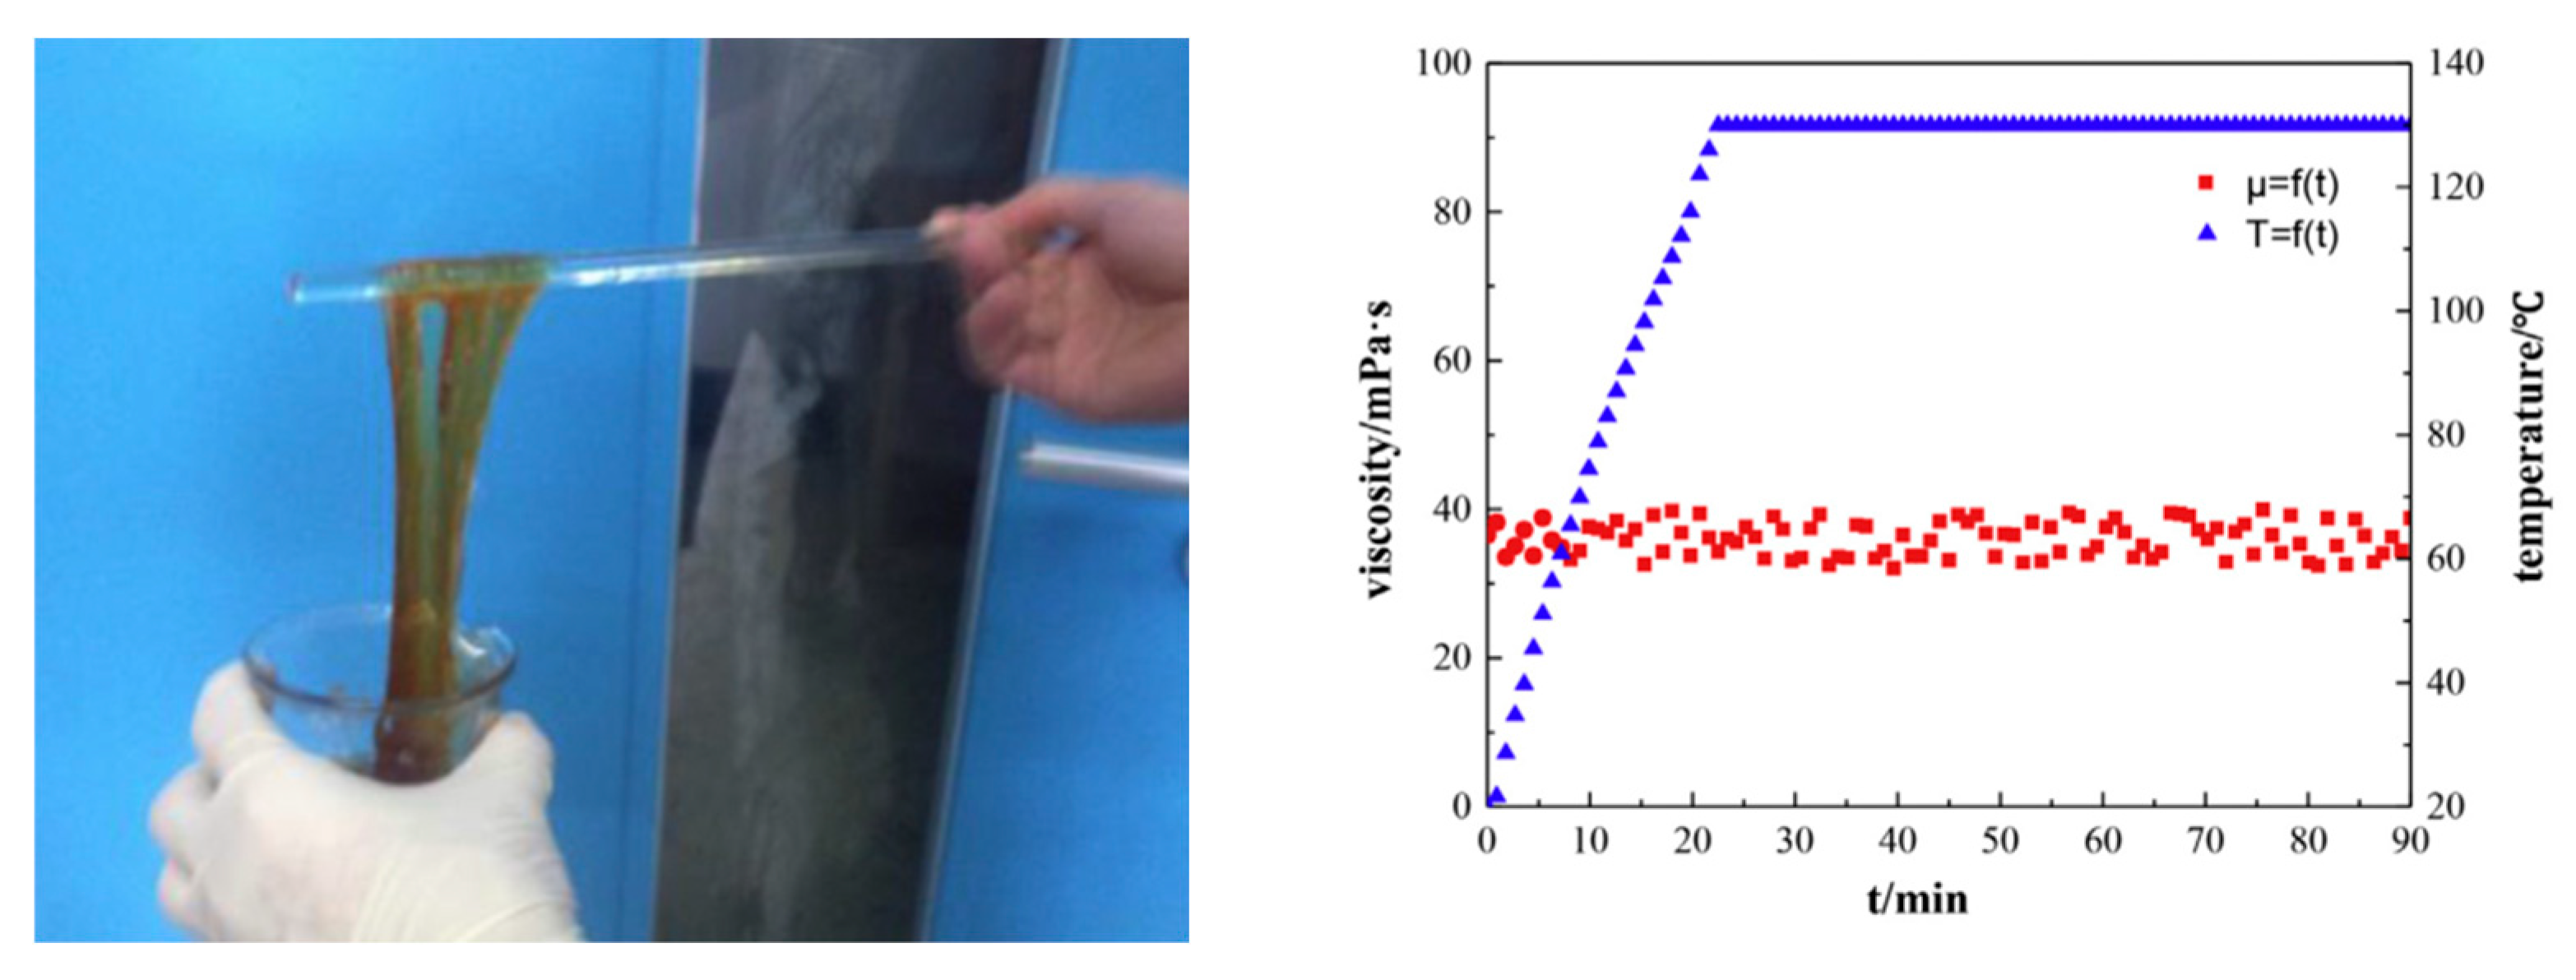
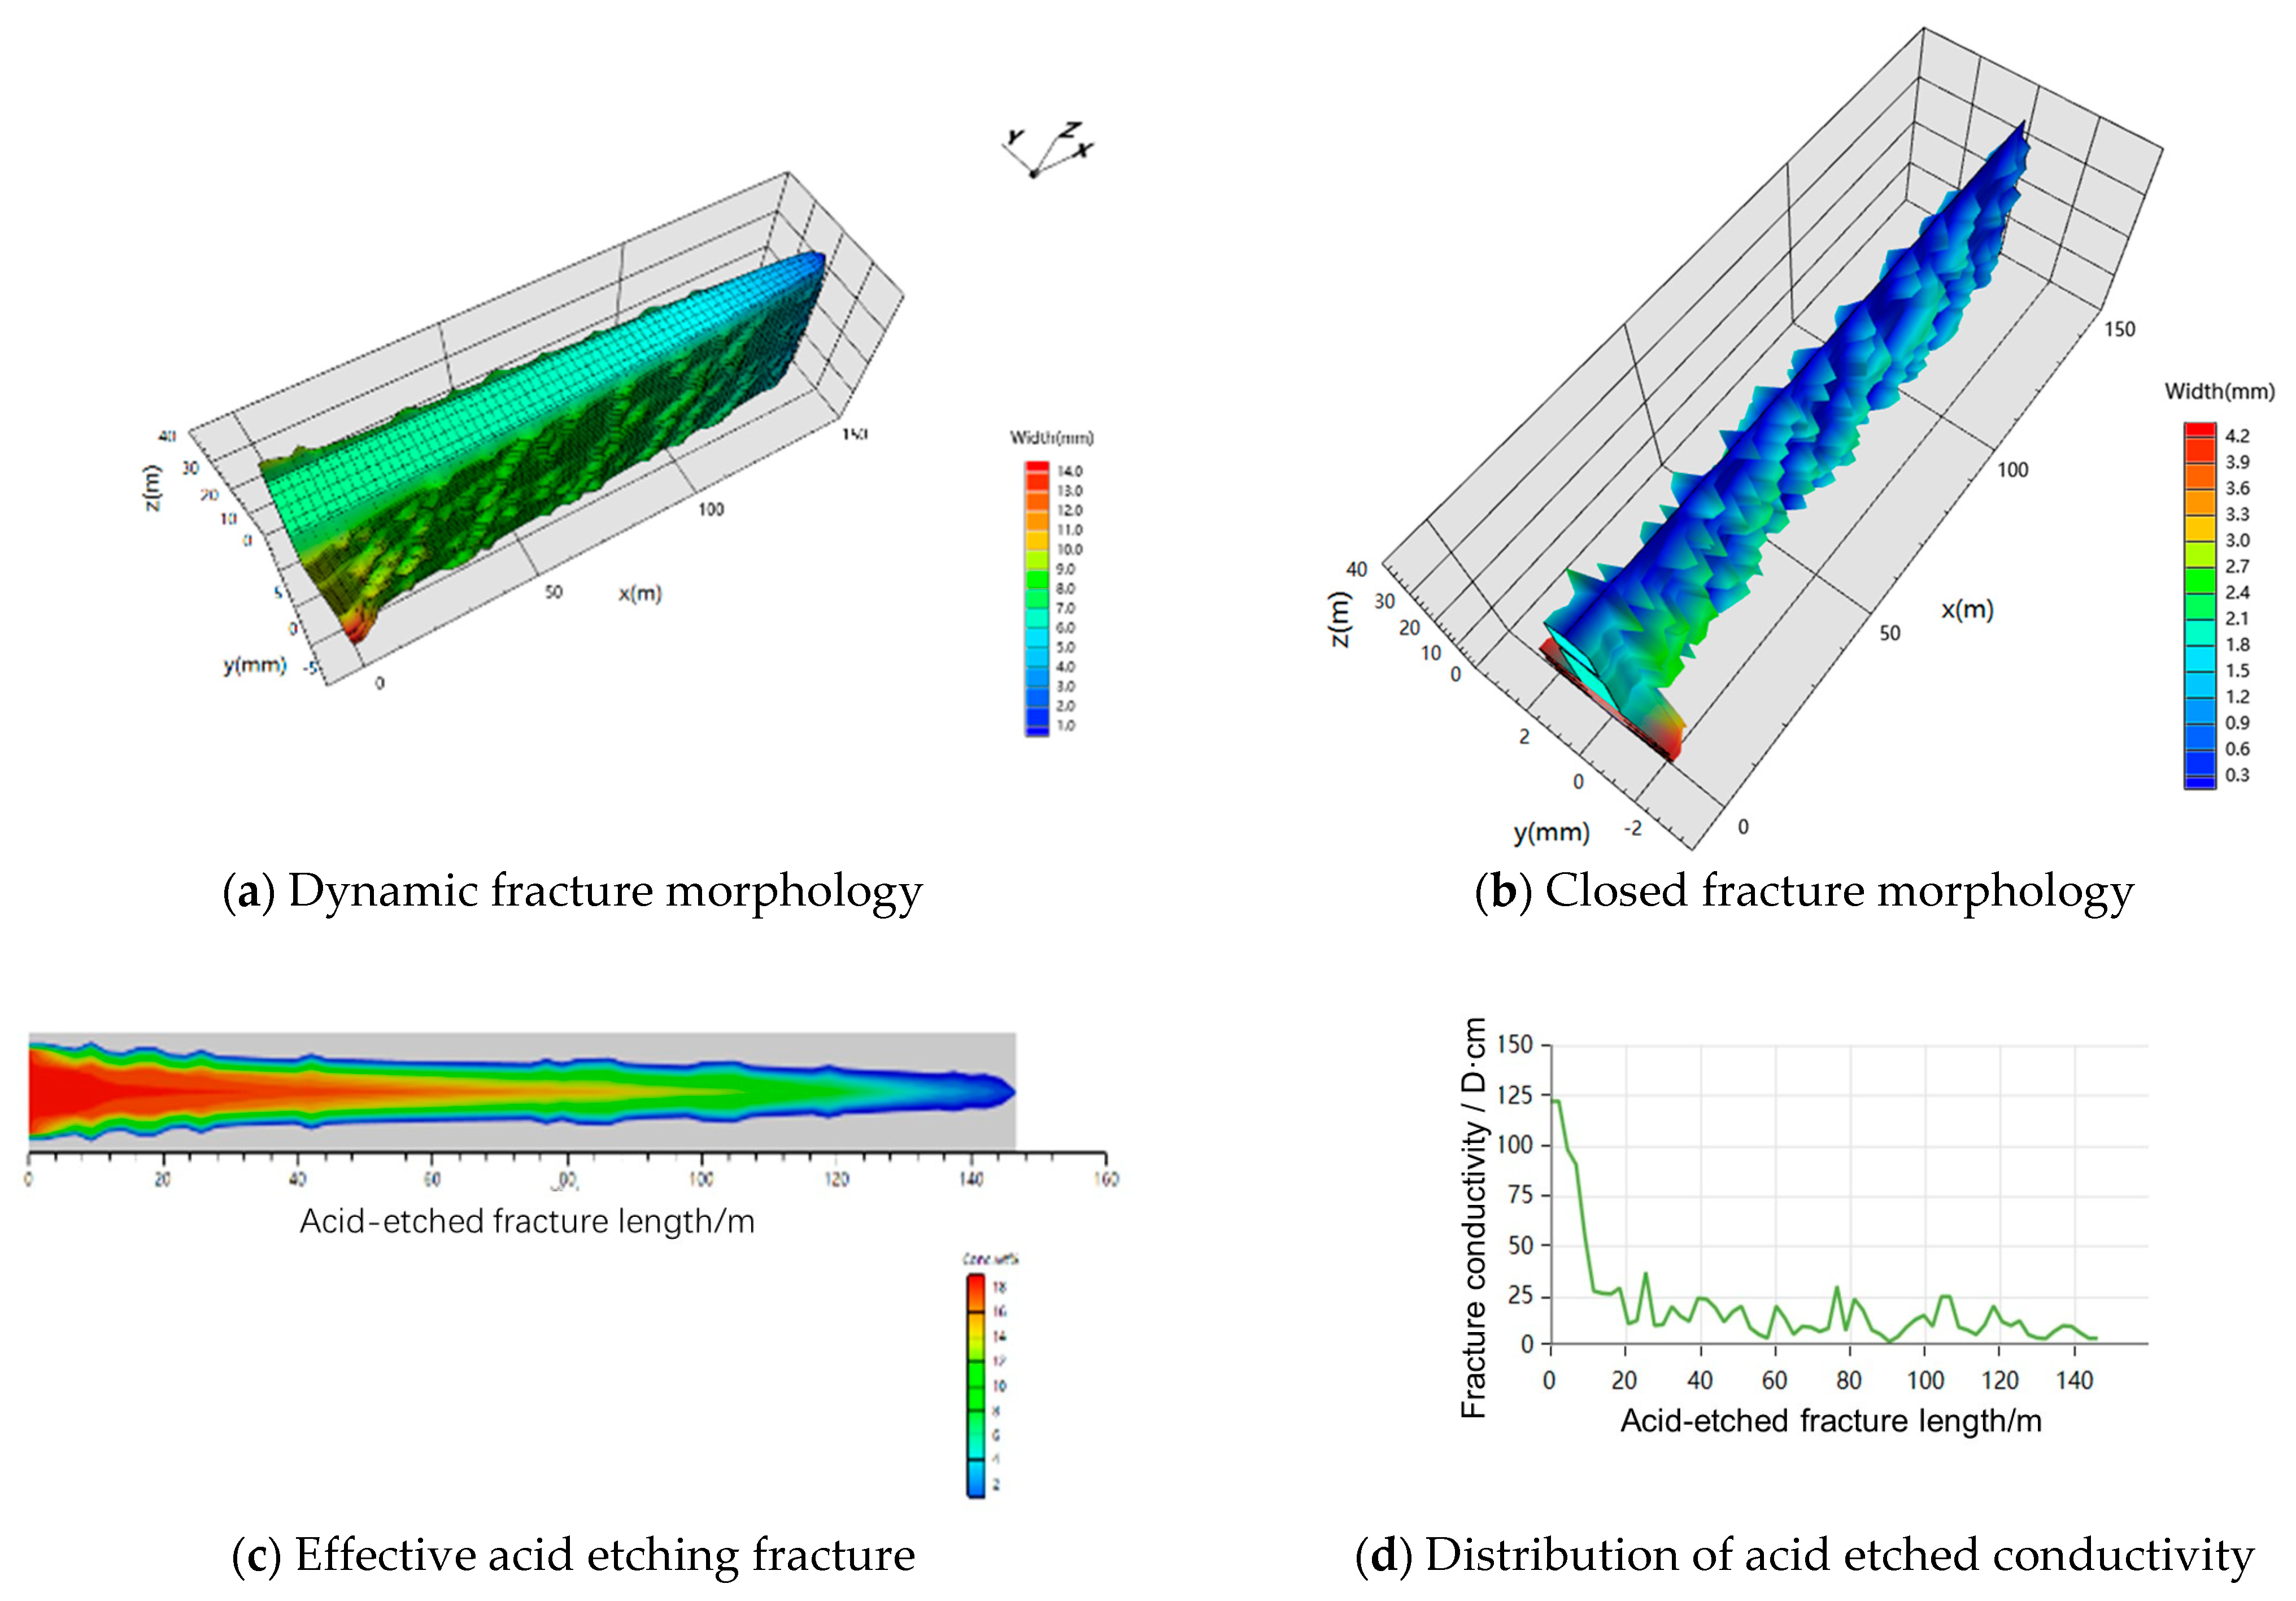
Compared with the conventional modeling, the model with some parameters obtained by the RoqSCAN tool in this paper had higher accuracy. These parameters, including minerals, rock mechanics, and the maximum and minimum horizontal principal stresses, were used for three-dimensional geological modeling, which was more accurate than the traditional data derived from logging and geological interpretation data. The longitudinal and planar distributions of porosity and stress indicated that fine reservoir modeling was more accurate. Gelled acid had a favorable performance. Numerical simulation results showed that the acid-etched fracture was 150 m long, with an average acid-etched conductivity of 20 D.cm.

Author Contributions

X.W.: supervision; J.H.: supervision; X.Q.: data curation; L.L.: data curation; L.Z.: writing and investigation. All authors have read and agreed to the published version of the manuscript.

Funding

This research was funded by China Petroleum and Chemical Corporation for financial support (Grant No. P21063-3).

Data Availability Statement

Not applicable.

Conflicts of Interest

The authors declare no conflict of interest.

References

  1. EIA. Annual Energy Outlook 2018; U.S. Energy Information Administration: Washington, DC, USA, 2022.
  2. Zhang, L.; Zhou, F.; Mou, J.; Xu, G.; Zhang, S.; Li, Z. A new method to improve long-term fracture conductivity in acid fracturing under high closure stress. J. Petrol. Sci. Eng. 2018, 171, 760–770. [Google Scholar] [CrossRef]
  3. Zhang, L.; Zhou, F.; Zhang, S.; Li, Z.; Wang, J.; Wang, Y. Evaluation of permeability damage caused by drilling and fracturing fluids in tight low permeability sandstone reservoirs. J. Petrol. Sci. Eng. 2019, 175, 1122–1135. [Google Scholar]
  4. Zhang, L.; Zhou, F.; Mou, J.; Pournik, M.; Tao, S.; Wang, D.; Wang, Y. Large-scale true tri-axial fracturing experimental investigation on diversion behavior of fiber using 3D printing model of rock formation. J. Petrol. Sci. Eng. 2019, 181, 106171. [Google Scholar] [CrossRef]
  5. Zhang, L.; Zhou, F.; Mou, J.; Feng, W.; Li, Z.; Zhang, S. An integrated experimental method to investigate tool-less temporary-plugging multistage acid fracturing of horizontal well by using self-degradable diverters. SPE J. 2020, 25, 1204–1219. [Google Scholar] [CrossRef]
  6. Jiang, T.; Bian, X.; Sun, C.; Zhang, F.; Lin, L.; Wei, J.; Zhong, G. Key Technologies in Geology-Engineering Integration Volumetric Fracturing for Deep Shale Gas Wells. Earth Sci. 2023, 48, 1–13. [Google Scholar]
  7. Zou, C.N.; Zhao, Q.; Cong, L.Z.; Wang, H.; Shi, Z.; Wu, J.; Pan, S. Development Progress, Potential and Prospect of Shale Gas in China. Nat. Gas Ind. 2021, 41, 1–14. [Google Scholar]
  8. Wu, Q.; Liang, X.; Xian, C.; Li, Y. Geological-engineering integration and efficient development of marine shale gas in southern China. China Pet. Explor. 2015, 20, 1–23. [Google Scholar]
  9. Li, S.G.; Xu, T.J.; Lü, Q.; Fan, H.; Zhou, X. Seismic Prediction Technology with Double “Desert” Parameters for Deep Shale Gas. Nat. Gas Ind. 2019, 39, 113–117. [Google Scholar]
  10. Liao, D.L.; Lu, B.P.; Chen, Y.J. An Evaluation Method of Geological Sweet Spots of Shale Gas Reservoir: A Case Study of the Jiaoshiba Gas Field, Sichuan Basin. Acta Pet. Sin. 2019, 40, 144–151. [Google Scholar]
  11. Nie, H.K.; He, Z.L.; Liu, G.X.; Zhang, G.R.; Lu, Z.Y.; Li, D.H.; Sun, C.X. Status and Direction of Shale Gas Exploration and Development in China. J. China Univ. Min. Technol. 2020, 49, 13–35. [Google Scholar]
  12. Jiang, T.X.; Bian, X.B.; Yuan, K.; Zhou, L. A New Method in Staged Fracturing Design Optimization for Shale Gas Horizontal Wells. Pet. Drill. Tech. 2014, 42, 1–6. [Google Scholar]
  13. Liang, X.; Wang, G.; Xu, Z.; Zhang, J.; Chen, Z.; Xian, C.; Lu, H.; Liu, C.; Zhao, C.; Xiong, S. Comprehensive evaluation technology for the dessert of marine complex mountain shale gas reservoirs in southern China—Taking Zhaotong National Shale Gas Demonstration Zone as an example. Nat. Gas Ind. 2016, 36, 33–42. [Google Scholar]
  14. Yang, Z.; Tang, Z.; Chen, X.; Guo, X.; Li, C.; Wu, Y.; Huang, D.; Jiang, T.; Xiang, W.L.; Wu, Y.; et al. “Source exploration”: Main types of tight oil and progress in geological engineering integration. China Pet. Explor. 2020, 25, 73–83. [Google Scholar]
  15. Wang, H.; Liu, Y.; Zhang, X.; Guo, W.; Yu, R.; Sun, Y.; Liang, P.; Kang, L. Geology-Engineering Intergration Shale Gas Sweet Spot Evaluation Based on Analytic Hierarchy Process: Application to Zhaotong Shale Gas Demonstration District, Taiyang Shale Gas Field, Haiba Area, X Well Region. Earth Sci. 2023, 48, 92–109. [Google Scholar]
  16. Jiang, Z.; Liang, Z.; Shen, Y.; Tang, X.; Wu, W.; Li, Z.; Xue, Z. Coupling Key Factors of Shale Gas Sweet Spot and Research Direction of Geology-Engineering Integration in Southern Sichuan. Earth Sci. 2023, 48, 110–129. [Google Scholar]
  17. Chen, M.; Tang, C.; Ou, C.; Wang, C.; Liang, B. Application effect analysis of RoqSCAN technology in shale gas mud cutting in southern Sichuan. Well Logging Eng. 2020, 31, 21–28. [Google Scholar]
  18. Ashton, T.; Eagleridge Energy LLC; Ly, C.V.; Spence, G. Robertson—A CGG Company; Oliver, G. SPE 168806 /URTeC 1581626 Application of Real-Time Well-Site Tools for Enhanced Geosteering, Reservoirand Completions Characterization. In SPE/AAPG/SEG Unconventional Resources Technology Conference; OnePetro: Richardson, TX, USA, 2013. [Google Scholar]
  19. Wang, T.; Yang, Y.; Peng, Y.; Zhao, J.; Qi, T.; Zeng, J.; Hou, P. Simulation and evaluation for acid fracturing of carbonate reservoirs based on embedded discrete fracture model. Nat. Gas Ind. B 2021, 8, 637–649. [Google Scholar] [CrossRef]
  20. Zhang, L.; Mou, J.; Cheng, X.; Zhang, S. Evaluation of ceramsite loss control agent in acid fracturing of naturally fractured carbonate reservoir. Nat. Gas Ind. B 2021, 8, 302–308. [Google Scholar] [CrossRef]
  21. Johnson, C.; Pownceby, M.I.; Wilson, N.C. The application of automated electron beam mapping techniques to the characterisation of low grade, fine-grained mineralisation; potential problems and recommendations. Miner. Eng. 2015, 79, 68–83. [Google Scholar] [CrossRef]
  22. Ashton, T.; Ly, C.V.; Spence, G.; Guy, O. Portable Technology Puts Real-time Automated Mineralogy on the Well Site. In Proceedings of the SPE Unconventional Resources Conference and Exhibition-Asia Pacific, Brisbane, Australia, 11–13 November 2013. [Google Scholar] [CrossRef]
  23. Oliver, G.M.; Ly, C.V.; Spence, G.; Rael, H. A New Approach to Measuring Rock Properties Data from Cores & Cuttings for Reservoir & Completions Characterization: An Example from the Bakken Formation. In Proceedings of the SPE Unconventional Resources Conference and Exhibition-Asia Pacific, Brisbane, Australia, 11–13 November 2013. [Google Scholar] [CrossRef]
  24. Ly, C.V.; Oliver, G.M.; Spence, G.; Centurion, S.; Jackson, C.E.; Hearn, F.P.; Palomarez, V. Cross Correlation of Logging Data with SEM-Based Mineralogical and Textural Well Data: A New Tool for Optimized Completion Design. In Proceedings of the SPE Russian Oil and Gas Exploration & Production Technical Conference and Exhibition, Moscow, Russia, 14–16 October 2014. [Google Scholar] [CrossRef]
  25. Chatellier, J.-Y.; Tristan, E. New Approach to Reveal Compartmentalization in Montney Horizontal Wells for Completion Design Optimization. In Proceedings of the SPE/AAPG/SEG Unconventional Resources Technology Conference, Houston, TX, USA, 26–28 July 2021. [Google Scholar] [CrossRef]
  26. Peake, N.; Castillo, G.; Voisey, S.; Chesser, K.; Van de Coevering, N.; Bouziat, A.; Oliver, G.; Ly, C.V.; Mayer, R.; Kuo, L. Unconventional Reservoirs: Integrating Surface Seismic, Microseismic, Mineralogy and Rock Properties in the Haynesville Shale. In Proceedings of the SPE/AAPG/SEG Unconventional Resources Technology Conference, Denver, CO, USA, 25–27 August 2014. [Google Scholar] [CrossRef]
  27. Peng, X.; Deng, H.; He, J.; Lei, T.; Zhang, Y.; Hu, X. Characteristics and genesis of fractures in the Middle Ordovician Majiagou Formation of the Daniudi Gas Field in the Ordos Basin. Pet. Exp. Geol. 2022, 44, 41–50+93. [Google Scholar]
Figure 1. The fracture characteristic of the core samples from Daniudi gas field [27].
Processes 11 01475 g001
Figure 2. The flowchart of fracturing design based on the fine reservoir evaluation.
Processes 11 01475 g002
Figure 3. RoqSCAN setup composition.
Processes 11 01475 g003
Figure 4. RoqSCAN workflow.
Processes 11 01475 g004
Figure 5. Element distributions of the target formation.
Processes 11 01475 g005
Figure 6. Scanning pictures of the target formation.
Processes 11 01475 g006
Figure 7. Distribution of the P-wave offset time and the S-wave offset time.
Processes 11 01475 g007
Figure 8. Distribution of the Poisson’s ratio and the elastic modulus.
Processes 11 01475 g008
Figure 9. Distribution of the brittleness index.
Processes 11 01475 g009
Figure 10. Fine reservoir modeling workflow.
Processes 11 01475 g010
Figure 11. Comparative analysis of property parameters (left: conventional modeling; right: fine reservoir modeling).
Processes 11 01475 g011
Figure 12. Plane distribution characteristics of physical parameters.
Processes 11 01475 g012
Figure 13. Plane distribution characteristics of crustal stress.
Processes 11 01475 g013
Figure 14. Picture and rheological curve of gelled acid [2].
Processes 11 01475 g014
Figure 15. Numerical simulation of acid fracturing.
Processes 11 01475 g015
Table 1. Physical parameters of the target formation.
Depth
m
Carbonate Content
%
Porosity
%
Total Hydrocarbon Distribution
%
2973.0–2977.0
(Ma 5)
44.7–76.05.35.02–13.99
2992.0–2995.5
(Ma 6)
82.1–94.05.751.01–72.61
Table 2. Logging interpretation of the target formation.
Measure Depth
m
GR
API
RD
Ω·m
AC
μs/m
CNL
%
DEN
g/cm3
VSH
%
PER
mD
Sg
%
Conclusion
2973.0–2977.0
(Ma 5)
23.0971.1206.14.22.54 4.30.11 65.1Gas layer
2992.0–2995.5
(Ma 6)
42.61067.4171.62.42.66 7.70.10 57.2Gas-bearing layer
Note: GR: natural gamma; RD: deep lateral resistivity; AC: acoustic transit time; CNL: compensated neutron logging; DEN: density; VSH: shale content; PER: permeability; Sg: saturation of gas.
Table 3. Mineral compositions of the target formation.
MineralContent Range
%
Average
%
SilicateQuartz0.62~86.847.86
Potassium feldspar0.00~15.771.04
Plagioclase0.00~52.461.96
CarbonateCalcite0.27~95.1733.65
Dolomite0.00~86.2933.63
Ferro-dolomite0.00~4.861.02
ClayIllite0.05~13.973.40
Illite mixed layers0.00~31.474.86
Calcareous clay0.00~6.341.58
Table 4. Perforation parameters.
Perforated
Section
m
Perforation Density
hole/m
Perforation
Angle
°
Perforation
Diameter
mm
Perforation
Depth
mm
2973.0–2977.01690≥12≥1000
Table 5. Pumping program design.
No.FluidInjection Rate
m3/min
Volume
m3
Note
1Slick water1–250Establish displacement and cooling
2Drag-reducing acid6–8150Connect natural fractures
3Gelled acid6–8250Create fractures and etching
4Slick water6–850Replace
Disclaimer/Publisher’s Note: The statements, opinions and data contained in all publications are solely those of the individual author(s) and contributor(s) and not of MDPI and/or the editor(s). MDPI and/or the editor(s) disclaim responsibility for any injury to people or property resulting from any ideas, methods, instructions or products referred to in the content.

