Abstract
In this study, the combustion characteristics of pine needles, pine needle humus, and the co-combustion of these two types of biomass with coal were compared. In addition, the optimization of the combustion performance of coal/humus was assisted through the following studies: (i) the combustion performance of coal/pine needle humus was studied under four different oxygen concentrations (N2, 10%O2/90%N2, 20%O2/80%N2, and 40%O2/60%N2); (ii) the synergistic effect between the humus and coal during combustion was also investigated by adjusting the blending ratio and oxygen content; (iii) the mechanisms of the optimized combustion processes were expounded by kinetics and thermodynamics discussion. The results demonstrated that the combustion characteristics of the coal/humus blends were found to be higher than those of the coal/pine needle blends. The coupling interactions of the oxygen content and blending ratio contributed to the significant synergistic effect between the two fuels, and the synergistic effect showed a nonlinear variation with an increased oxygen concentration. The synergistic effect in a rich oxygen environment (O240%/N260%) is 5.1 times greater than that in the synthetic air (O220%/N280%) and 13.8 times greater than that in the oxygen-poor environment (O210%/N290%). Hence, the blending ratio could be adjusted to maintain the intensity of the synergistic effect in an oxygen-rich atmosphere.
1. Introduction
At present, coal consumption accounts for more than 50% of China’s energy structure (BP Statistical Review of World Energy, 2022) and still dominates. However, as a non-renewable resource, the contradiction between the supply and demand of coal is increasingly prominent. To achieve a low-carbon economy and reduce energy consumption and emissions, China has been committed to improving its energy structure and reducing the proportion of coal consumption. Considering the practical aspect, the adjustment of the energy structure needs to be carried out gradually in the long term, during which the efficient and clean utilization of coal is particularly important. Biomass is widely distributed as a renewable energy source, but its low energy density greatly limits the widespread use of biomass as a sustainable fuel [1]. Fortunately, it can be blended with coal for power generation or chemical products using co-thermochemical technologies. The co-combustion of biomass blended with coal is considered an alternative, feasible route for biomass utilization and coal pollution control [2]. According to China Energy News, a power plant in Hebei Province has been co-firing walnut shells with coal to generate electricity. According to calculations, the power plant can save the equivalent of 57,000 tons of coal and reduce CO2 emissions by 70,000 tons per year by co-firing 100,000 tons of walnut shells annually. Biomass has a low sulfur content but a high content of alkali and alkaline earth metals (AAEMs), which can react with SO2 to form sulfates and facilitate the fixation of gaseous sulfur [3], while reducing the yield of N-containing gas [4]. Therefore, biomass is advantageous in limiting the emission of air pollutants such as SOx and NOx [5,6]. At the same time, the presence of K, Na, and Ca can shorten the ignition delay time and increase the combustion temperature [7,8]. Furthermore, the co-combustion of coal blended with biomass will also provide stable burning and enhance the thermal behavior as the mixture has more volatile matter and a lower ash content compared with coal.
Researchers have been studying the co-combustion process of various biomass materials and coal, finding that the synergistic effects arising during co-combustion by combining certain fuels can improve the combustion performance. Qu et al. [9] found that lignite co-combustion with a humus ratio of 20% showed the best synergistic effect, and they proposed a new synergistic index (SI) to distinguish a catalytic synergistic effect from a non-catalytic synergistic effect. Li et al. [10] found, in their study of pelletized coal/biomass mixtures, a co-combustion in which, with an increase in biomass proportion, the maximum temperature during combustion increases, the reactivity increases, and the activation energy decreases nonlinearly, indicating the existence of a synergistic effect. Zhang et al. [11] pointed out that the synergy between coal gangue and pine sawdust is mainly due to the thermal effect. In general, the synergistic effect is classified as the catalytic effect and non-catalytic effect of biomass components on coal during co-combustion [12,13,14]. The catalytic effect is ordinarily attributed to the abundance of AAEMs in biomass (such as cornstalk), which augments the reactivity of chars originating from coal [15,16]. The non-catalytic effect is also dominated by the highly volatile content originating from cellulose, hemicellulose, or lignin in biomass [14,17]. It is reported that a substantial number of intermediates (such as phenoxy radicals) released from lignin in biomass attack the coal during the co-thermal dissolution of the blended fuels, which contributes to the accelerated scission of aliphatic C-C bonds in coal [18,19]. However, the synergistic effects still remain controversial, possibly due to the type of coal/biomass, reaction kinetics, and thermodynamic factors [20,21,22]. Therefore, studying the synergistic mechanism of co-pyrolysis of lignite and biomass has profound significance for energy development and utilization.
The combustion performance of the coal/biomass mixtures is influenced by factors such as the type of biomass and coal, mixture ratio, combustion temperature, atmosphere, and other related parameters [23,24]. Different proportions of coal and biomass may lead to different reaction pathways and product compositions, which can affect the efficiency of co-combustion. The researchers noted that the synergistic effect on the co-combustion of coal and biomass mixtures increased as the proportion of biomass increased [25,26]. However, researchers have found that when biomass is co-fired with coal at a mass ratio of 0–100%, the highest synergistic effect is achieved when the biomass content is 70% [27]. This indicates that further research is needed to investigate the influence of biomass proportion on the pyrolysis of the mixture.
The combustion of biomass under different atmospheres can result in varying chemical changes, which may have an impact on the combustion performance of coal/biomass [28]. Cheng et al.’s [29] study revealed that drying biomass (wood) at varying oxygen concentrations (0, 3, 6, 10, and 21%) resulted in maximum reductions of 66.18% and 73.53% in H/C and O/C ratios, respectively. The higher heating value (HHV) also showed a significant increase, but negative effects were observed when the oxygen concentration was too high (21%). Therefore, researchers have conducted extensive research on the combustion characteristics of coal/biomass under different oxygen atmospheres. Varol et al.’s [30] study found that selecting an appropriate excess air ratio can alter the emissions of NOx and SOx after combustion. Yang et al. [12] also found that the emission curve of NOX is influenced by the concentration of O2. Guang et al. [31] burned anthracite coal and Robinia pseudoacacia char (RPC) in a pure oxygen atmosphere, demonstrating that the addition of biomass and an increase in the heating rate enhanced the combustion performance. However, their study did not compare the results with other combustion atmospheres and did not clarify the advantages of a pure-oxygen-atmosphere combustion. Chen et al. [32] established three different oxygen concentrations to investigate the combustion characteristics under different oxygen atmospheres. They found that when the oxygen concentration increased from 30% to 70%, the reaction rate increased from 6.43%/min to 6.66%/min, indicating better combustion performance. However, they did not further investigate the impact of oxygen concentration on the synergistic effect of the mixture.
Forest fires, which usually cause incalculable damage to the ecological environment, losses to the economy, and casualties, has been given more attention. Forest humus stemming from dead/living organisms, plant litter, and roots plays a pivotal role in the occurrence and spread of fire [33]. Rational utilization for humus is accordingly an effective way to reduce the risk of forest fire; moreover, humus may be used as a potential biofuel because of its ideal ignition and combustion performance [34]. Coincidentally, the high content of AAEMs and lignin in humus not only enhances the catalytic effect but also promotes a non-catalytic effect during the co-thermochemical conversion of humus and coal. Indeed, few focus on the synergistic effect of coal/humus during co-combustion, let alone convert biomass into humus for co-combustion with others. It is thus evident that the research regarding the mechanisms of interactions and possible synergistic effects in coal/humus blends is still essential, which is beneficial for understanding the co-combustion behavior. The combustion performance is compared and analyzed by changing the oxygen concentration and blending ratio, which is conducive to investigating synergistic effects in coal/humus blends.
In the present contribution, the combustion characteristics of pine needles, pine-needle humus, low-rank coal, coal/pine needle blends, and coal/humus blends were studied by using thermogravimetric analysis (TGA). The difference between the combustion of coal/pine needle blends and coal/humus blends was compared. The synergistic interaction between the humus and coal during combustion was also investigated under different blend ratios and oxygen concentrations. Based on the model-free method, viz., Kissinger–Akahira–Sunose (KAS), Flynn–Wall–Ozawa (FWO), and Friedman, the kinetic parameters of the co-combustion were estimated [35]. Subsequently, the thermodynamic parameters, i.e., the changes in enthalpy (△H), Gibbs free energy (△G), and entropy (△S), at the different conversion rates were determined. Based on the sensitivity of the humus to oxygen, an efficient strategy could be proposed to enhance the synergy between two fuels: (i) converting biomass into humus under controlled conditions, and (ii) increasing the oxygen concentration of co-combustion. The results of our study can augment the understanding of the combustion characteristics and synergy of coal/humus blends, providing a useful reference for the application and optimization of co-firing biomass with coal in thermochemical conversion systems.
2. Materials and Methods
2.1. Experimental Materials
The Shengli lignite (SL) samples were obtained from the Shengli Coal Field—the largest lignite base in China. The pine-needle humus (PH) samples were transformed from pine needles (PNs) in the soil of an intelligent artificial climate box (ZHUJIANG LRH-1000-GSI, temperature at 25 ± 1 °C and humidity at 85 ± 5%) over 90 days. The intelligent artificial climate box provides all the external factors needed for the process of decomposition. The soil microbial community decomposes the organic matter in the pine needles, such as lignin, and converts it into humus through biological or chemical reactions. Pine needles were collected in Zhengzhou, China, which is located at a latitude of 34.75° N and longitude of 113.62° E.
The air-dried SL and PH samples were separately milled and sieved into a particle size fraction of 80–125 μm. The samples were then dried in a vacuum at 40 °C for 24 h and stored in a desiccator before use in experiments, which ensures the relative integrity of the sample structure. The coal/pine needle blends were named NBR20%, NBR50%, and NBR80% according to the pine needle blending ratios (20%, 50%, 80%, respectively). The coal/humus with different blending ratios was named HBR20%, HBR50%, and HBR80%. The mixed samples were tumbled to achieve proximate homogeneity using a ball mill. The proximate analysis and ultimate analysis of SL, PH, and PN were carried out using the coal industry analysis standard GB/T 212-2008 and the solid biomass fuel industry analysis standard GB/T 28731-2012, respectively. The ash composition of SL, PH, and PN was analyzed by X-ray fluorescence spectrometry (Panalytical Axios). The higher heating value (HHV) is the heat released when the fuel is completely burned, that is, the sum of the combustion heat of the fuel and the condensation heat of the water vapor, which can be calculated by approximate analysis [36,37]. The results are shown in Table 1.

Table 1.
Characteristics of SL, PN, and PH.
2.2. Experiment
The co-combustion/pyrolysis experiments of SL, PH, and their blends were performed via a congruent-mass TGA method. A simultaneous thermal analyzer (NETZSCH STA 2500) was employed to record the thermogravimetry (TG) curves during these processes. For each TGA run, the samples (8 ± 0.1 mg) within an aluminum crucible were heated from room temperature to 900 °C. A constant gas flow rate of 100 mL/min was sustained for each of the four atmospheres (N2, oxygen-free atmosphere; O210%/N290%, oxygen-poor atmosphere; O220%/N280%, synthetic air; and O240%/N260%, oxygen-rich atmosphere). Data analysis was performed using the software Origin2018 and Python script.
2.3. Combustion Characteristics of the Samples
The combustibility performance of a fuel is expressed by the combustibility index S, which is defined as [38]
where (dw/dt)max is the maximum mass loss rate; (dw/dt)mean is the average mass loss rate. Ti and Tb represent the ignition temperature and the burnout temperature, respectively. The greater the index S is, the more vigorously the sample burns, the faster the char burns out, and the better the combustion characteristics are.
2.4. Analysis of Mixed Combustion Synergistic Interaction
Many researchers pay attention to interactions between the two fuels during the co-combustion system, but few consider how to enhance the tight interactions. Here, we utilized the sensitivity of the humus to the oxygen to enhance the synergistic interaction; the corresponding strategies were as follows: (i) converting biomass into humus under controlled conditions and (ii) increasing the oxygen concentration of co-combustion.
In this study, the synergistic interaction between the humus and coal was also investigated under different conditions (from an oxygen-free atmosphere to an oxygen-rich atmosphere), and the extent of synergistic interaction is expressed by the relative deviation [19].
where Wc is the calculated value for the arithmetic weighted average of coal and humus and xPH is the percentage of PH in the blend. WPH,T and WSL,T are the masses of PH and SL at time T, respectively (the specific values are obtained from the individual TG curves of PH and SL). We is the mass of the blend in the experiment.
2.5. Kinetic and Thermodynamic Analyses
Based on kinetic analysis methods, the reaction rate for the combustion of a mixture can be expressed as Equation (4):
where f(α) is the mechanism function; α, viz., rate of conversion, is defined as the ratio of weight loss at time t to the total weight loss of the combustion; and h(O2) is the O2 partial pressure function. The temperature-dependent constant k(T) and conversion degree α can be described by Equations (5) and (6) [39]:
where m0, mt, and m∞ are, respectively, the initial weight, the weight at time t, and the weight at the end of combustion. For a constant heating rate, β = dT/dt, another form of Equation (4) can be obtained by combining Equations (5) and (6); thus:
where A, Eα, and R are the pre-exponential factor A = A0h(O2), apparent activation energy, and universal gas constant, respectively.
Equation (8) is obtained by integrating Equation (7):
Different assumptions and approximations are involved in the different methods. These methods avoid the errors caused by the selected reaction mechanism to give an accurate Eα estimation [35,40]. In this study, the typical model-free methods of the Kissinger–Akahira–Sunose (KAS) method, Flynn–Wall–Ozawa (FWO) method, and Friedman method were consequently used to estimate the activation energy.
2.5.1. The Kissinger–Akahira–Sunose (KAS) Method
The KAS method derived from the Coats–Redfern approximation is the iso-conversional method first used to study the kinetic behaviors of fuels. The KAS method is defined in Equation (9) [41].
From Equation (9), a plot of ln(β/T2) versus 1/T gives a linear equation with Eα/R as its slope.
2.5.2. The Flynn–Wall–Ozawa (FWO) Method
The FWO method is an integration method derived from the Doyle approximation and has been successfully applied to non-isothermal experiments [42].
A plot of ln(β) versus 1/T will give a slope of −1.0516 Eα/R to determine the Eα while A is obtained from the intercept.
2.5.3. The Friedman Method
The Friedman method is a differential iso-conversional method, which is the most straightforward technique to determine the effective activation energy. Let Equation (7) be rearranged into the following equation [43]:
At constant conversion with different heating rates, a plot of ln(βdα/dT) versus 1/T will give a straight line where the slope is used to determine the Eα while A is obtained from its intercept.
2.6. Computational Method of Thermodynamic Parameters
Thermodynamic parameters are significant in expressing the total heat content of a system during the combustion process. Thermodynamic parameters such as the exponential factor (A), enthalpy (△H), Gibbs free energy (△G), and entropy (△S) are expressed using the following equations [44,45]:
where KB is the Boltzmann constant (1.381 × 10⁻²³ J/K), h is the Planck constant (6.626 × 10⁻³⁴ J·s), Tm is the DTG peak temperature, and β uses the heating rate of 10 °C/min.
3. Results and Discussion
3.1. Thermal Behavior of Individual Samples
3.1.1. Comparison of Humus and Original Biomass
Figure 1 shows the comparison of pine-needle humus (PH) treated for 90 days and original pine needle (PN) with respect to compositions and thermal characteristics. After 90 days of humification, the cellulose content of the sample is slightly reduced and the hemicellulose content is too small to detect (Figure 1a). The lignin content of PH is decreased by 10.45% compared with PN due to the conversion of lignin into humic substances. In appearance, PN gradually becomes numerous small particles of humus and is particularly crisp (Figure 1b). From Figure 1c, the peak around 320 °C for PN corresponds to the oxidative decomposition of light volatiles such as cellulose and hemicellulose, while PH corresponds only to the oxidative decomposition of cellulose in reaction zone I. Stage II indicates the decomposition of high-molecular-weight volatiles (such as lignin) and the combustion of partially fixed carbon [9,46,47]. Compared with PN, PH shows a peak corresponding to humus in reaction zone III. Lignocellulosic substances normally exhibit poor thermal conductivity, so the conversion of lignin into humic substances improves the combustion characteristics [48]. Meanwhile, the catalytic effect of more AAEMs after humification accelerates the combustion process of the biomass, resulting in the first weight loss peak at lower temperatures in the PH samples [8]. For cellulose, lignin, and humic acid, their firing weight loss reaches peak values of 9.9, 4.9, and 4.8%/min at 328, 435, and 521 °C, respectively, which can be used as supplementary proof (Figure S2).
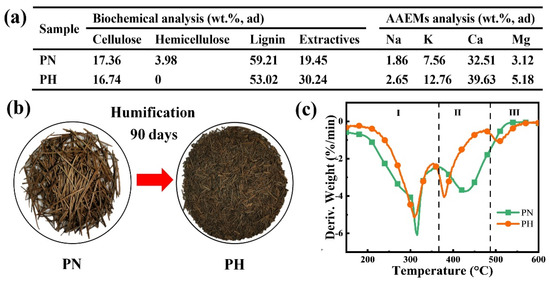
Figure 1.
The difference between before and after biomass humification: (a) compositions, (b) images, and (c) DTG curves of samples (20%O2/80%N2).
3.1.2. Thermal Behavior of PN, PH, and SL under Increased O2/N2 Atmosphere
Figure 2 shows the comparison of the derivative weight loss of pure PN, PH, and SL fuels under increased atmospheric O2 concentrations from 0 to 40%. From Figure 2a, it can be seen that after the addition of O2, the peak at 332 °C splits into two distinct peaks, which are in the ranges of 396–321 °C and 417–457 °C, respectively. As presented in Figure 2b, the pyrolysis of the PH occurs in the relatively broad temperature range of 220–510 °C with a lower weight loss rate. When O2 is involved in the reaction, the broad temperature range mainly splits into three obvious peaks due to the different oxidation reactivity of each component. Almost all of these peaks shift to lower temperatures and the peaks sharpen with the increased O2 concentration, thus showing that the reactivity of volatiles from PH is augmented by adding oxygen. From Figure 2c, compared with the DTG of PH, SL has only one peak to move to lower temperatures with the increase in O2 concentration. The SL shows higher weight loss rates than the PH in different oxidation atmospheres due to the simultaneous oxidation of both volatiles and fixed carbon.
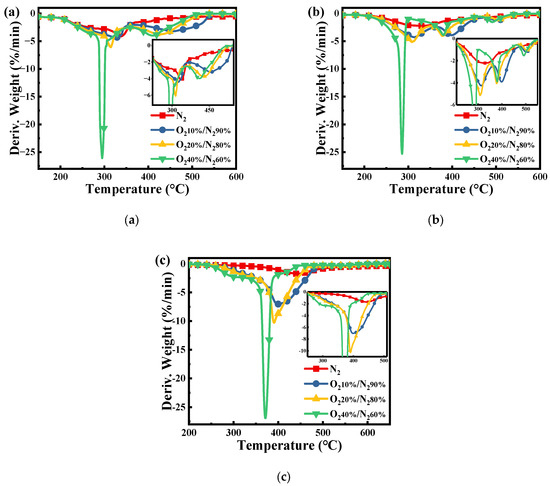
Figure 2.
DTG curves of the (a) PN, (b) PH, and (c) SL under different atmospheres with β = 10 °C/min.
As shown in Table 2, the ignition temperature and burnout temperature of PN and PH are lower than those of SL, indicating that biomass has better ignition and burnout characteristics, but the comprehensive combustion characteristics of SL are higher than those of biomass. At the same time, due to the high oxygen content in the biomass (Table 1), it shows high reactivity. Therefore, it is speculated that blending high-reactivity biomass can improve the reactivity of SL.
Table 2.
Combustion characteristic parameters of PN, PH, and SL (20%O2/80%N2).
3.1.3. Co-Combustion Behavior of the PN/SL Blends under Synthetic Air
Observation of the TG/DTG curves for the combustion of the blends under a synthetic air atmosphere (Figure 3) reveals that the main weight loss of all the blends occurs between 200 °C and 700 °C. Moreover, as the biomass blending ratio increases, the peak of the first weight loss peak increases and the peak of the second weight loss peak decreases; at the same time, the second weight loss peak shifts to lower temperatures. Compared to SL alone, the two fuel blends have remarkably lower ignition temperatures and higher combustion indices (Table 3), indicating improved combustion performance.
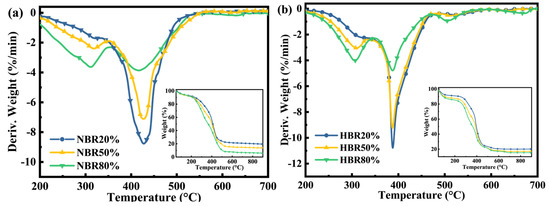
Figure 3.
DTG−TG curves of the (a) coal/pine needle blends and (b) coal/humus blends under synthetic air.
Table 3.
Combustion characteristic parameters of coal/pine needle blends and coal/humus blends (20%O2/80%N2).
The co-combustion process of the two fuel blends is altered due to the differences between PH and PN in terms of elements and composition. The coal/humus combustion index is 13.86–17.20% higher than that of coal/pine needles, indicating that the humified pine needles improve the combustion performance of SL more than the raw biomass does. As can be seen from the blends’ DTG plot, there is little difference between the first weight loss peaks for coal/pine needles and coal/humus, but the difference between the second weight loss peaks is greater. It is worth noting that the second weight loss peak is mainly generated by lignin decomposition and fixed carbon combustion, and the fixed carbon content in PH is higher than that in PN, so the peak of fixed carbon combustion formed by co-combustion after adding PH to SL is larger than that formed by adding PN to SL. In addition, it has been shown that the addition of lignin to lignite leads to reduced combustion reactivity [38]; therefore, the reduced lignin content of humified pine needles is also more conducive to promoting combustion. Meanwhile, the high content of AAEMs in PH could function as a catalyst to promote the reaction, allowing for rapid and adequate combustion of lignite; the lower content of volatiles, N, and S in PH would facilitate clean combustion conditions. Therefore, humus could be a potential fuel to improve coal combustion performance and reduce pollution.
3.2. Co-Combustion Behavior of the PH/SL Blends under Increased O2/N2 Atmosphere
Figure 4 shows the comparison of TG/DTG of pure PH and SL fuels and their blends under the increased atmospheric O2 content from 0 to 40%. With the increased O2 concentration, the two peaks sharply increase from the DTG profiles and the amount of residue at the end of combustion gradually decreases from the TG profiles. The two peak temperatures of the blend (e.g., HBR50%, Tp1 = 280 °C, Tp2 = 362 °C) are lower under 40%O2/60%N2 compared to the others, indicating that enough oxygen can accelerate the interactions between PH and SL. On closer inspection, only two wide peaks are observed under the N2 atmosphere due to the simultaneous reaction of both lignin and humus during an oxygen-free atmosphere. The addition of oxygen advances the reaction of lignin in the humus, and consequently, the third peak of the humus is independent. With the increased O2 content from 10% to 40%, for HBR20%, the variation in the ignition temperature (Ti) is 82.1 °C but the variation in the burnout temperature is 55.8 °C, while for HBR80%, the variation in Ti is 32.5 °C but the variation in Tb (burnout temperature) is 38.9 °C, as shown in Table 4. This can be attributed to the different sensitivity of the fuels to oxygen. Despite the increase in oxygen content, less oxygen reacts with the SL due to the high reactivity of the PH, thus hindering the improvement of combustion characteristics. This demonstrates that there is an optimum blending ratio for the highest combustion characteristics in an O2/N2 atmosphere. Therefore, the O220%/N280% atmosphere is chosen as a reference to analyze the effect of the blending ratio on combustion characteristics (Figure 4c) because the oxygen concentration reaches an industrial value. It has been widely noted that the DTG peak height (R) corresponding to the maximum weight loss rate is directly proportional to the reactivity, whilst the peak temperature (Tp) corresponding to the peak height is inversely proportional to the reactivity of the fuels [49]. To analyze the thermal characteristic of the samples, the combustion reactivity index (Rc) is defined as the value of Σ103Ri/Tpi (i = 1, 2, 3) for all peaks and is used to express reactivity. The order of reactivity (Rc) of the samples during the whole combustion is HBR20% (33.4) > HBR50% (29.7) > PH (28.9) > HBR80% (28.6) > SL (28.2). This result indicates that the combustion reactivity of the blend is improved by adding an appropriate amount of PH during the O220%/N280% atmosphere. Meanwhile, the reactivity is less than pure PH at a 80% PH content in the blend, implying that a high content of PH in the blends may not be of benefit to the reactivity. This can be attributed to the fact that more carbonaceous deposits generated from the lignin volatiles may cover the surface of the low-rank coal particles at lower temperatures, thus impeding the mass transfer [50]. It is concluded that a proper blending ratio should be considered first before improving the combustion reactivity of the blend by increasing the oxygen content.
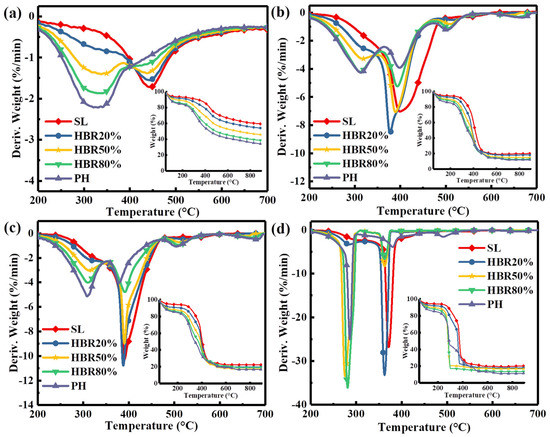
Figure 4.
DTG−TG curves of the blend under different atmospheres: (a) N2, (b) 10%O2/90%N2, (c) 20%O2/80%N2, and (d) 40%O2/60%N2.
Table 4.
Combustion characteristic parameters of samples.
In fact, the purpose of the humification is to reduce the lignin content of poor heat transfer in the biomass, which improves the combustion characteristics and shortens the burnout time. Moreover, humus converted from lignin can also produce intermediates (e.g., phenoxy radicals), inducing the dense and heat-resistive structural components of low-rank coal to decompose [51,52]. The lignin in biomass being converted to a humus during co-thermochemical conversion is an efficient route to optimize heat transfer.
3.3. Synergistic Interaction of PH and SL under Increased O2/N2 Atmosphere
The relative deviation (δW) between the experimental TG curve and the calculated TG curve is used to express the synergistic effect of coal and humus co-combustion. When δW is close to zero, it indicates that the experimental and calculated values are not significantly different and that there is a limited synergistic effect from blend co-combustion. When δW is positive, PH and SL co-combustion appears as a negative synergy, and when δW is negative, it is a positive synergy. The relative deviations with respect to TG curves of the blends in four atmospheres are shown in Figure 5. It is observed that the peak of δW dramatically increases by about 80 times with an increased O2/N2 atmosphere. The peak of δW is extremely significant in the range of 600–700 °C under an N2 atmosphere, 550–680 °C under a 10%O2/90%N2 atmosphere, 390–450 °C under a 20%O2/80%N2 atmosphere, and 300–340 °C under a 40%O2/60%N2 atmosphere. Obviously, with an increased O2 content, the temperature ranges of peaks gradually shift to the low-temperature zone. This suggests that the addition of more oxygen leads to the early occurrence of synergy. The oxygen-rich atmosphere is beneficial to activating the carbonaceous deposits covering the surface of particles, thus accelerating decomposition and facilitating mass transfer. With the increased O2 content, the blending ratio corresponding to peak value declines from 80% to 20%, but the optimal blending ratio is about 50% under a 40%O2/60%N2 atmosphere. It is apparent that the coupling interactions of composite factors (the blending ratio and oxygen content) lead to the nonlinear variation in the synergistic effect. This indicates that both the oxygen concentration and blending ratio play a vital role in synergistic interactions between PH and SL. Due to the different sensitivity of the fuels to oxygen, PH volatiles clogged in the gap between particles and attached to the particle’s surface at lower temperatures can be decomposed earlier. Hence, the ratio of biomass in blended fuel can be increased by properly increasing the oxygen concentration in co-combustion, which can reach an optimal degree of synergistic effect.
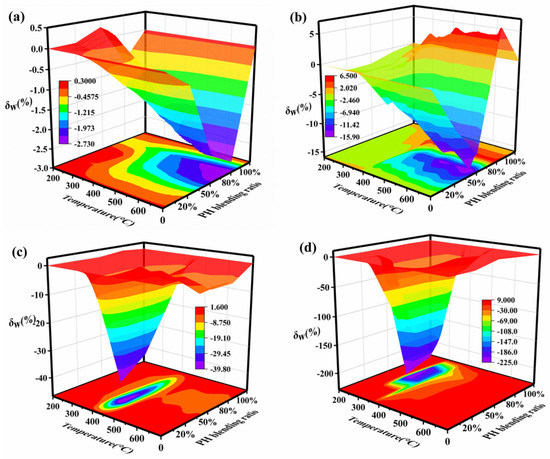
Figure 5.
Relative deviations of the blend under different atmospheres: (a) N2, (b) 10%O2/90%N2, (c) 20%O2/80%N2, and (d) 40%O2/60%N2.
3.4. Discussion on the Kinetics
3.4.1. Calculation of Apparent Activation Energy
The preceding discussion has confirmed the presence of synergy between PH and SL and that the significance of the interaction depends on the oxygen concentration and blending ratio during co-combustion. Under the 20%O2/80%N2 atmosphere, the blending ratio of PH reaches a minimum (HBR20%) that is closest to the industrial value. In this study, the Eα values of PH, SL, and the blend (HBR20%) are investigated by the methods of FWO, KAS, and Friedman in four atmospheres.
Table 5 shows changes in Eα values of HBR20% as a function of four atmospheres. As pointed out earlier, the three α ranges of 0.1–0.35, 0.4–0.75, and 0.8–0.9 correspond to the three combustion stages of cellulose, lignin and volatiles of coal, and residual lignin and humus, respectively. Despite the different atmospheres, the Eα values estimated by the KAS method have similar trends (Figure 6a). The mean Eα values of the blend in the whole stages follow the order: lignin and volatiles of coal > residual lignin and humus > cellulose. The lower mean Eα value of HBR20% in 20%O2/80%N2 compared to the other atmospheres (Figure 6b) suggests that the extent of synergy does not depend solely on the oxygen content. This may be explained by the different sensitivity of the substances to oxygen.
Table 5.
The Eα values of HBR20% in four atmospheres as a function of α by the KAS method.
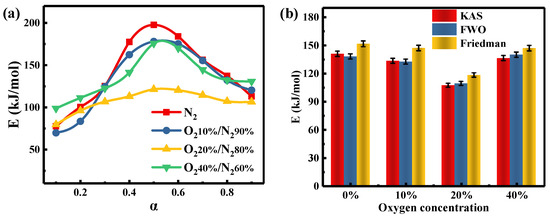
Figure 6.
Activation energy of HBR20% in four atmospheres as a function of α according to (a) the KAS method and (b) three model-free methods.
3.4.2. Discussion on Thermodynamic Parameters
To help better understand the co-combustion of the blend, the thermodynamic parameters (ΔH, ΔS, and ΔG) based on the Eα values are obtained by KAS methods. Figure 7 shows the Eα, ΔH, ΔS, and ΔG versus α for the samples under different atmospheres. For example, under the oxygen-rich atmosphere, the Eα of the blend (HBR20%) increases from 111.27 to 175.67 kJ/mol (0.2 < α < 0.5); when α is greater than 0.5, Eα begins to decrease and finally reaches 132.33 kJ/mol (Figure 7a). Table 6 lists the thermodynamic parameters of partial samples in the four atmospheres. The Eα value first decreases and then increases with the increased O2 concentration. The vital factors affecting the reaction activation energy could be the reduced concentrations of active molecules, the limitation of diffusion, and the involvement of organic impurities [53]. The heat released from the oxidation of the char soars with the O2 concentration, promoting the thermal effect during co-combustion. The actual energy required for the combustion process is enhanced due to the increased crystal size and ash content of char. In the present study, the results show that E reaches its minimum in the O220%/N280% atmosphere.
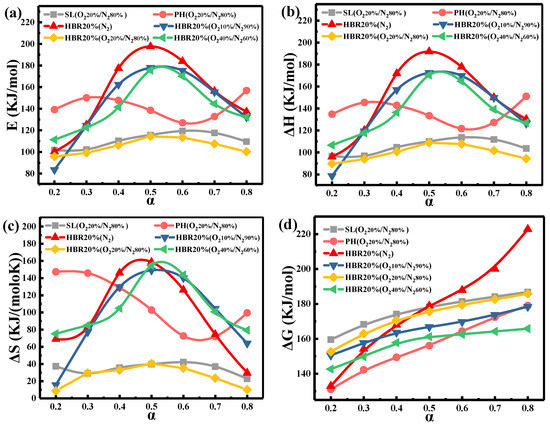
Figure 7.
Changes in (a) E, (b) ΔH, (c) ΔS, and (d) ΔG of samples as a function of α.
Table 6.
Thermodynamic and kinetic parameters of samples in four atmospheres (β = 10 °C/min).
The changes in △H demonstrate the energy difference between the fuels and the activated complex [54]. As listed in Table 6, the average values of △H for SL, PH, and the blend are 105.35, 136.68, and 99.57 kJ/mol, respectively. The results suggest that a lower heat energy is required for the dissociation of the bonds in the combustion of the blends compared to the individual samples, which is in accordance with estimates of the activation energy. In addition, the average values of △H and Eα for SL, PH, and the blend (HBR20%) under O220%/N280% change in a narrow interval, indicating that there is a limited potential energy barrier to impede the formation of the activated complex [54].
The positive value of ΔS indicates an increasing degree of disorder in the reaction products [55]. The high activation entropy means the material is far from its own thermodynamic equilibrium. After 50% conversion, the △S for the blend (HBR20%) under different atmospheres decreases, indicating that the co-combustion state is near their thermodynamic equilibrium and the degree of disorder of products declines [56]. For HBR20%, the ΔS value of the O240%/N260% atmosphere reaches 106.22 J/(mol·K), higher than those of the other atmospheres in Table 6. This indicates that the higher O2 concentration restrains the co-combustion process. The changes in △G illustrate the total increase in energy of the system for the formation of the activated complex. As a comprehensive evaluation of the degree of reaction, a lower △G value indicates a higher favorability of reaction [57]. The average values of △G for SL and PH are 176.09 and 156.36 kJ/mol, respectively. Based on the ∆G values of SL and PH and the proportion of the blend, the theoretical value of ∆G for the blends calculated by the weighing average method is 172.14 kJ/mol, which is higher than the experimental ∆G (169.82 kJ/mol) for the blends. This is attributed to the involvement of synergistic effects in the co-combustion process.
4. Conclusions
The study showed that the increased fixed carbon and AAEM content and reduced lignin content of the humified biomass resulted in improved combustion performance of the humus. The combustion performance after the co-combustion of coal/humus was 13.9–17.2% higher than that of coal/pine needles. Further analysis of the effect of mixing ratio and oxygen concentration on coal/humus combustion performance revealed that when the PH blending ratio was increased from 20% to 80%, the ignition temperature was reduced by 3.7–16.9% and the burnout temperature by 0.5–3.2%. The enhancement of combustion characteristics in the co-firing of humus with coals was proved with up to an 11.1–23.3% reduction in ignition temperature and up to a 6.5–9.0% reduction in burnout temperature with an increased O2 content from 10% to 40%. With the increase in the oxygen concentration from 0% to 40%, the degree of synergistic effect increased to nearly 80-fold, and the synergy effect did not change linearly with the blending ratio. The slight difference between ΔH and Eα (5.05–5.68 kJ/mol) showed that coal/humus is prone to co-combustion products. The higher ΔS value (106.22 J/(mol·K)) in O240%/N260% compared to other atmospheres implied a higher combustion reactivity of the humified biomass in the oxygen-rich atmosphere. It has been shown that the co-combustion performance of low-rank coals can be improved by adjusting the oxygen concentration and co-mingling ratio. This study provides a reference for further research into the co-combustion of humic substances with coal.
Supplementary Materials
The following supporting information can be downloaded at: https://www.mdpi.com/article/10.3390/pr11061615/s1, Figure S1: DTG curves of SL; Figure S2: DTG curves of cellulose, lignin and humic acid; Table S1: Combustion characteristic parameters of two blends.
Author Contributions
Conceptualization, G.Z. and T.Z.; methodology, T.Z., G.L., K.W. and X.Q.; validation, G.Z., P.L., K.W. and G.L.; formal analysis, T.Z.; investigation, C.L.; resources, G.Z.; data curation, T.Z., C.L., X.Q. and Q.Y.; writing—original draft preparation, T.Z. and X.Q.; writing—review and editing, G.L.; visualization, X.Q. and Q.Y.; supervision, P.L.; project administration, G.Z.; funding acquisition, G.Z. and G.L. All authors have read and agreed to the published version of the manuscript.
Funding
This work was funded by the Natural Science Foundation of China (No. 51904274), Open-Fund of Henan Key Laboratory of Coal Green Conversion (CGCF202104), Henan Provincial Key Research and Extension Special Project (Science and Technology Research), Zhengzhou University Young Backbone Teacher Training Program, and Henan University Science and Technology Innovation Team (19IRTSTHN028).
Data Availability Statement
The data presented in this study are available on request from the corresponding author.
Conflicts of Interest
The authors declare no conflict of interest.
References
- Toptas, A.; Yildirim, Y.; Duman, G.; Yanik, J. Combustion behavior of different kinds of torrefied biomass and their blends with lignite. Bioresour. Technol. 2015, 177, 328–336. [Google Scholar] [CrossRef] [PubMed]
- Wu, Z.Q.; Ma, C.; Jiang, Z.; Luo, Z.Y. Structure evolution and gasification characteristic analysis on co-pyrolysis char from lignocellulosic biomass and two ranks of coal: Effect of wheat straw. Fuel 2019, 239, 180–190. [Google Scholar] [CrossRef]
- Sun, Y.; Chen, J.; Zhang, Z. Distributional and compositional insight into the polluting materials during sludge combustion: Roles of ash. Fuel 2018, 220, 318–329. [Google Scholar] [CrossRef]
- Wei, Y.; Tian, H.; Liu, L.; Cheng, S.; Qing, M.; Chen, Y.; Yang, H.; Yang, Y. The effects of alkali metals and alkaline earth metals on the mechanism of N-containing gases production during glutamic acid pyrolysis. J. Anal. Appl. Pyrolysis 2022, 168, 105787. [Google Scholar] [CrossRef]
- Liu, Y.Q.; Tan, W.Y.; Liang, S.H.; Bi, X.L.; Sun, R.Y.; Pan, X.J. Comparative study on the co-combustion behavior of torrefied biomass blended with different rank coals. Biomass Convers. Biorefinery 2022, 12, 1–13. [Google Scholar] [CrossRef]
- Zhao, K.; Jensen, A.D.; Glarborg, P. NO Formation during Oxy-Fuel Combustion of Coal and Biomass Chars. Energy Fuels 2014, 28, 4684–4693. [Google Scholar] [CrossRef]
- Carvalho, A.; Rabaçal, M.; Costa, M.; Alzueta, M.U.; Abián, M. Effects of potassium and calcium on the early stages of combustion of single biomass particles. Fuel 2017, 209, 787–794. [Google Scholar] [CrossRef]
- Zhang, R.; Lei, K.; Ye, B.Q.; Cao, J.; Liu, D. Effects of alkali and alkaline earth metal species on the combustion characteristics of single particles from pine sawdust and bituminous coal. Bioresour. Technol. 2018, 268, 278–285. [Google Scholar] [CrossRef]
- Qu, X.Y.; Zhou, G.L.; Cao, Y.J.; Li, P.; He, Y.Y.; Zhang, J. Synergetic effect on the combustion of lignite blended with humus: Thermochemical characterization and kinetics. Appl. Therm. Eng. 2019, 152, 137–146. [Google Scholar] [CrossRef]
- Li, H.J.; Chi, H.Y.; Han, H.D.; Hu, S.; Song, G.x.; Wang, Y.k.; He, L.m.; Wang, Y.; Su, S.; Xiang, J. Comprehensive study on co-combustion behavior of pelletized coal-biomass mixtures in a concentrating photothermal reactor. Fuel Process. Technol. 2021, 211, 106596. [Google Scholar] [CrossRef]
- Zhang, Y.Y.; Zhang, Z.Z.; Zhu, M.M.; Cheng, F.Q.; Zhang, D.K. Interactions of coal gangue and pine sawdust during combustion of their blends studied using differential thermogravimetric analysis. Bioresour. Technol. 2016, 214, 396–403. [Google Scholar] [CrossRef]
- Yang, X.D.; Luo, Z.Y.; Liu, X.R.; Yu, C.J.; Li, Y.a.; Ma, Y.C. Experimental and numerical investigation of the combustion characteristics and NO emission behaviour during the co-combustion of biomass and coal. Fuel 2021, 287, 119383. [Google Scholar] [CrossRef]
- Oladejo, J.; Adegbite, S.; Gao, X.; Liu, H.; Wu, T. Catalytic and non-catalytic synergistic effects and their individual contributions to improved combustion performance of coal/biomass blends. ApEn 2018, 211, 334–345. [Google Scholar] [CrossRef]
- Oladejo, J.; Adegbite, S.; Pang, C.H.; Liu, H.; Parvez, A.; Wu, T. A novel index for the study of synergistic effects during the co-processing of coal and biomass. ApEn 2017, 188, 215–225. [Google Scholar] [CrossRef]
- Qin, Y.H.; He, Y.Y.; Ren, W.P.; Gao, M.J.; Wiltowski, T. Catalytic effect of alkali metal in biomass ash on the gasification of coal char in CO2. J. Therm. Anal. Calorim. 2019, 139, 3079–3089. [Google Scholar] [CrossRef]
- Liu, Y.Z.; Wang, Z.Y.; Wan, K.D.; Lv, Y.; Xia, J.; He, Y.; Cen, K.F. In-situ measurements of release characteristics and catalytic effects of different chemical forms of sodium during combustion of Zhundong coal. Energy Fuels 2018, 32, 6595–6602. [Google Scholar] [CrossRef]
- Ni, Z.S.; Song, Z.H.; Bi, H.B.; Jiang, C.L.; Sun, H.; Qiu, Z.C.; He, L.Q.; Lin, Q.Z. The effect of cellulose on the combustion characteristics of coal slime: TG-FTIR, principal component analysis, and 2D-COS. Fuel 2023, 333, 126310. [Google Scholar] [CrossRef]
- Shui, H.F.; Hui, Z.; Jiang, Q.Q.; Zhou, H.; Pan, C.X.; Wang, Z.C.; Lei, Z.P.; Ren, S.B.; Kang, S.G. Co-thermal dissolution of Shenmu–Fugu subbituminous coal and sawdust. Fuel Process. Technol. 2015, 131, 87–92. [Google Scholar] [CrossRef]
- He, Y.Y.; Chang, C.; Li, P.; Han, X.L.; Li, H.L.; Fang, S.Q.; Chen, J.Y.; Ma, X.J. Thermal decomposition and kinetics of coal and fermented cornstalk using thermogravimetric analysis. Bioresour. Technol. 2018, 259, 294–303. [Google Scholar] [CrossRef]
- Ellis, N.; Masnadi, M.S.; Roberts, D.G.; Kochanek, M.A.; Ilyushechkin, A.Y. Mineral matter interactions during co-pyrolysis of coal and biomass and their impact on intrinsic char co-gasification reactivity. Chem. Eng. J. 2015, 279, 402–408. [Google Scholar] [CrossRef]
- Kajitani, S.; Zhang, Y.; Umemoto, S.; Ashizawa, M.; Hara, S. Co-gasification Reactivity of Coal and Woody Biomass in High-Temperature Gasification. Energy Fuels 2010, 24, 145–151. [Google Scholar] [CrossRef]
- Barmina, I.; Valdmanis, R.; Zake, M. The effects of biomass co-gasification and co-firing on the development of combustion dynamics. Energy 2018, 146, 4–12. [Google Scholar] [CrossRef]
- Qian, X.; Lee, S.; Chandrasekaran, R.; Yang, Y.; Caballes, M.; Alamu, C. Electricity Evaluation and Emission Characteristics of Poultry Litter Co-Combustion Process. Appl. Sci. 2019, 9, 4116. [Google Scholar] [CrossRef]
- Zhang, P.; Chen, Z.; Zhang, Q.; Zhang, S.; Ning, X.; Zhou, J. Co-pyrolysis characteristics and kinetics of low metamorphic coal and pine sawdust. RSC Adv. 2022, 12, 21725–21735. [Google Scholar] [CrossRef] [PubMed]
- Satyam Naidu, V.; Aghalayam, P.; Jayanti, S. Synergetic and inhibition effects in carbon dioxide gasification of blends of coals and biomass fuels of Indian origin. Bioresour. Technol. 2016, 209, 157–165. [Google Scholar] [CrossRef]
- Wei, J.; Guo, Q.; Chen, H.; Chen, X.; Yu, G. Study on reactivity characteristics and synergy behaviours of rice straw and bituminous coal co-gasification. Bioresour. Technol. 2016, 220, 509–515. [Google Scholar] [CrossRef]
- Ismail, T.M.; Banks, S.W.; Yang, Y.; Yang, H.; Chen, Y.; Bridgwater, A.V.; Ramzy, K.; Abd El-Salam, M. Coal and biomass co-pyrolysis in a fluidized-bed reactor: Numerical assessment of fuel type and blending conditions. Fuel 2020, 275, 118004. [Google Scholar] [CrossRef]
- Rousset, P.; Macedo, L.; Commandré, J.M.; Moreira, A. Biomass torrefaction under different oxygen concentrations and its effect on the composition of the solid by-product. J. Anal. Appl. Pyrolysis 2012, 96, 86–91. [Google Scholar] [CrossRef]
- Cheng, W.; Shao, J.A.; Zhu, Y.J.; Zhang, W.; Jiang, H.; Hu, J.; Zhang, X.; Yang, H.; Chen, H. Effect of oxidative torrefaction on particulate matter emission from agricultural biomass pellet combustion in comparison with non-oxidative torrefaction. Renew. Energy 2022, 189, 39–51. [Google Scholar] [CrossRef]
- Varol, M.; Atimtay, A.T.; Olgun, H.; Atakül, H. Emission characteristics of co-combustion of a low calorie and high sulfur–lignite coal and woodchips in a circulating fluidized bed combustor: Part 1. Effect of excess air ratio. Fuel 2014, 117, 792–800. [Google Scholar] [CrossRef]
- Yang, G.; Liu, Y.; Gao, L.; Su, Y. Investigation of the synergistic effect and kinetic behavior of anthracite and biochar during co-combustion process in pure oxygen atmosphere. J. Energy Inst. 2022, 101, 1–18. [Google Scholar] [CrossRef]
- Chen, C.; Huang, Y.; Yang, S.; Qin, S.; Chen, F. Effect of oxygen enriched atmospheres on combustion of bagasse, coal and theirs blends by thermogravimetric analysis. J. Environ. Chem. Eng. 2020, 8, 104398. [Google Scholar] [CrossRef]
- Rein, G.; Garcia, J.; Simeoni, A.; Tihay, V.; Ferrat, L. Smouldering natural fires: Comparison of burning dynamics in boreal peat and Mediterranean humus. In Modelling, Monitoring and Management of Forest Fires I; WIT Press: Ashurst Lodge, UK, 2008; pp. 183–192. [Google Scholar]
- Fahmy, T.Y.A.; Fahmy, Y.; Mobarak, F.; El-Sakhawy, M.; Abou-Zeid, R.E. Biomass pyrolysis: Past, present, and future. Environ. Dev. Sustain. 2020, 22, 17–32. [Google Scholar] [CrossRef]
- Patidar, K.; Singathia, A.; Vashishtha, M.; Kumar Sangal, V.; Upadhyaya, S. Investigation of kinetic and thermodynamic parameters approaches to non-isothermal pyrolysis of mustard stalk using model-free and master plots methods. Mater. Sci. Energy Technol. 2022, 5, 6–14. [Google Scholar] [CrossRef]
- Qian, X.; Lee, S.; Soto, A.-m.; Chen, G. Regression Model to Predict the Higher Heating Value of Poultry Waste from Proximate Analysis. Resources 2018, 7, 39. [Google Scholar] [CrossRef]
- DemİRbaŞ, A. Relationships Between Heating Value and Lignin, Fixed Carbon, and Volatile Material Contents of Shells from Biomass Products. Energy Sources 2003, 25, 629–635. [Google Scholar] [CrossRef]
- Xiao, Z.; Wang, S.; Luo, M.; Cai, J. Combustion characteristics and synergistic effects during co-combustion of lignite and lignocellulosic components under oxy-fuel condition. Fuel 2022, 310, 122399. [Google Scholar] [CrossRef]
- Mehmood, M.; Ahmed, M.; Liu, Q.; Liu, C.G.; Tahir, M.; Aloqbi, A.; Tarbiah, N.; Alsufiani, H.; Gull, M. Helianthus tuberosus as a promising feedstock for bioenergy and chemicals appraised through pyrolysis, kinetics, and TG-FTIR-MS based study. Energy Convers. Manag. 2019, 194, 37–45. [Google Scholar] [CrossRef]
- Shahbeig, H.; Nosrati, M. Pyrolysis of municipal sewage sludge for bioenergy production: Thermo-kinetic studies, evolved gas analysis, and techno-socio-economic assessment. Renew. Sustain. Energy Rev. 2020, 119, 109567. [Google Scholar] [CrossRef]
- Kissinger, H.E. Reaction Kinetics in Differential Thermal Analysis. Anal. Chem. 1957, 29, 1702–1706. [Google Scholar] [CrossRef]
- Tong, W.; Liu, Q.; Ren, S.; Zhou, J.; Zhang, T.; Yang, C. Effect of pyrolysis temperature on pine sawdust chars and their gasification reactivity mechanism with CO2. Asia-Pac. J. Chem. Eng. 2018, 13, e2256. [Google Scholar] [CrossRef]
- Barzegar, R.; Yozgatligil, A.; Atimtay, A.T. Co-combustion of high and low ash lignites with raw and torrefied biomass under air and oxy-fuel combustion atmospheres. Energy Sources Part A Recovery Util. Environ. Eff. 2022, 1–15. [Google Scholar] [CrossRef]
- Xu, Y.L.; Chen, B.L. Investigation of thermodynamic parameters in the pyrolysis conversion of biomass and manure to biochars using thermogravimetric analysis. Bioresour. Technol. 2013, 146, 485–493. [Google Scholar] [CrossRef] [PubMed]
- Prabhakar, A.; Sadhukhan, A.K.; Gupta, P. Study of co-pyrolysis kinetics, synergetic effects, and thermodynamics of coal and biomass blends. Energy Sources Part A Recovery Util. Environ. Eff. 2022, 44, 7095–7108. [Google Scholar] [CrossRef]
- Gani, A.; Naruse, I. Effect of cellulose and lignin content on pyrolysis and combustion characteristics for several types of biomass. Renew. Energy 2007, 32, 649–661. [Google Scholar] [CrossRef]
- Dorez, G.; Ferry, L.; Sonnier, R.; Taguet, A.; Lopez-Cuesta, J.M. Effect of cellulose, hemicellulose and lignin contents on pyrolysis and combustion of natural fibers. J. Anal. Appl. Pyrolysis 2014, 107, 323–331. [Google Scholar] [CrossRef]
- Shi, K.Q.; Oladejo, J.M.; Yan, J.F.; Wu, T. Investigation on the interactions among lignocellulosic constituents and minerals of biomass and their influences on co-firing. Energy 2019, 179, 129–137. [Google Scholar] [CrossRef]
- Li, X.W.; Mei, Q.Q.; Dai, X.H.; Ding, G.J. Effect of anaerobic digestion on sequential pyrolysis kinetics of organic solid wastes using thermogravimetric analysis and distributed activation energy model. Bioresour. Technol. 2017, 227, 297–307. [Google Scholar] [CrossRef]
- Esfilar, R.; Mehrpooya, M.; Moosavian, S.M.A. Thermodynamic assessment of an integrated biomass and coal co-gasification, cryogenic air separation unit with power generation cycles based on LNG vaporization. Energy Convers. Manag. 2018, 157, 438–451. [Google Scholar] [CrossRef]
- Zou, H.H.; Evrendilek, F.; Liu, J.; Buyukada, M. Combustion behaviors of pileus and stipe parts of Lentinus edodes using thermogravimetric-mass spectrometry and Fourier transform infrared spectroscopy analyses: Thermal conversion, kinetic, thermodynamic, gas emission and optimization analyses. Bioresour. Technol. 2019, 288, 121481. [Google Scholar] [CrossRef]
- Zhang, J.H.; Liu, J.Y.; Evrendilek, F.; Zhang, X.C.; Buyukada, M. TG-FTIR and Py-GC/MS analyses of pyrolysis behaviors and products of cattle manure in CO2 and N2 atmospheres: Kinetic, thermodynamic, and machine-learning models. Energy Convers. Manag. 2019, 195, 346–359. [Google Scholar] [CrossRef]
- Zhang, J.H.; Liu, J.Y.; Evrendilek, F.; Xie, W.M.; Kuo, J.H.; Zhang, X.C.; Buyukada, M. Kinetics, thermodynamics, gas evolution and empirical optimization of cattle manure combustion in air and oxy-fuel atmospheres. Appl. Therm. Eng. 2019, 149, 119–131. [Google Scholar] [CrossRef]
- Gohar, H.; Khoja, A.H.; Ansari, A.A.; Naqvi, S.R.; Liaquat, R.; Hassan, M.; Hasni, K.; Qazi, U.Y.; Ali, I. Investigating the characterisation, kinetic mechanism, and thermodynamic behaviour of coal-biomass blends in co-pyrolysis process. Process Saf. Environ. Prot. 2022, 163, 645–658. [Google Scholar] [CrossRef]
- Yan, J.C.; Yang, Q.T.; Zhang, L.; Lei, Z.P.; Li, Z.K.; Wang, Z.C.; Ren, S.B.; Kang, S.G.; Shui, H.F. Investigation of kinetic and thermodynamic parameters of coal pyrolysis with model-free fitting methods. Carbon Resour. Convers. 2020, 3, 173–181. [Google Scholar] [CrossRef]
- Aprianti, N.; Faizal, M.; Said, M.; Nasir, S.; Fudholi, A. Gasification kinetic and thermodynamic parameters of fine coal using thermogravimetric analysis. Energy 2023, 268, 126666. [Google Scholar] [CrossRef]
- Ming, X.; Xu, F.F.; Jiang, Y.; Zong, P.J.; Wang, B.; Li, J.; Qiao, Y.Y.; Tian, Y.Y. Thermal degradation of food waste by TG-FTIR and Py-GC/MS: Pyrolysis behaviors, products, kinetic and thermodynamic analysis. J. Clean. Prod. 2020, 244, 118713. [Google Scholar] [CrossRef]


Disclaimer/Publisher’s Note: The statements, opinions and data contained in all publications are solely those of the individual author(s) and contributor(s) and not of MDPI and/or the editor(s). MDPI and/or the editor(s) disclaim responsibility for any injury to people or property resulting from any ideas, methods, instructions or products referred to in the content. |
© 2023 by the authors. Licensee MDPI, Basel, Switzerland. This article is an open access article distributed under the terms and conditions of the Creative Commons Attribution (CC BY) license (https://creativecommons.org/licenses/by/4.0/).