Article

Dynamic Evolution and Quantitative Characterization of Fractures in Coal at the Eastern Edge of Ordos Basin under Axial Loading

1
School of Energy Resources, China University of Geosciences, Beijing 100083, China
2
MOE Key Lab of Marine Reservoir Evolution and Hydrocarbon Enrichment Mechanism, Beijing 100083, China
3
MOLR Key Lab of Shale Gas Resources Survey and Strategic Evaluation, Beijing 100083, China
*
Author to whom correspondence should be addressed.
Processes 2023, 11(6), 1631; https://doi.org/10.3390/pr11061631
Submission received: 5 May 2023 / Revised: 21 May 2023 / Accepted: 24 May 2023 / Published: 26 May 2023
(This article belongs to the Special Issue Advances in Numerical Modeling for Deep Water Geo-Environment)

Abstract

:
Understanding the evolution of pore-fracture networks in coal during loading is of paramount importance for coalbed methane exploration. To shed light on these dynamic changes, this study undertook uniaxial compression experiments on coal samples collected from the eastern edge of the Ordos Basin, complemented by μ-CT scanning to obtain a 3D visualization of the crack network model. The compression process was divided into three stages, namely, micro-crack compaction, linear elasticity, and peak failure. An increase in stress resulted in greater concentration and unevenness in fractal dimensions, illustrating the propagation of initial cleats and micro-cracks in the dominant crack direction and the ensuing process of crack merging. These results provide valuable insights into the internal structure and behavior of coal under stress, informing more efficient strategies for coalbed methane extraction.

1. Introduction

In the 21st century, sustainable human development is closely related to the supply of energy [1]. Coalbed methane (CBM) is an unconventional natural gas occurring in coal reservoirs [2]. Coal is a porous medium with heterogeneity, where many natural fractures, pores, and defects are randomly distributed [3]. The fracture network plays a dominant role in the storage and transport of CBM. The formation and evolution of the microfractures in coal rocks are affected by the microscopic composition of coal, coal rank, fluid pressure formed during coalification, and tectonic stress. In particular, tectonic stress is an essential factor in the distribution and expansion of microfractures in coal seams [4]. With the increase in burial depth, the stress conditions of coal rocks become more complex, resulting in the decline of CBM permeability [5], gas protrusion [6,7], and rock explosion [8,9], which probably enhances the difficulty of CBM exploration. Therefore, it is important to understand the initiation and evolution of the fracture network of coal rocks under different stress conditions, which is vital for exploiting CBM [10] and engineering safety [11,12].
Numerous studies have been conducted on the fracture structure of coal rock. The methods to study the fracture structure in coal seams mainly include Mercury injection capillary pressure (MICP) [13,14], nitrogen adsorption (NGD) [15,16], nuclear magnetic resonance (NMR) [17], scanning electron microscopy (SEM) [18], field emission scanning electron microscopy (FESEM) [19], and the micro-CT technique (μ-CT) [20,21]. The μ-CT technique has attracted more research interest because it is nondestructive, intuitive, fast, and capable of reconstructing three-dimensional fracture network models. Yao et al. proposed a novel method for quantifying and 3D visualizing the spatial distribution of minerals, pores, and fractures in coal [22]. Mathews et al. provided a comprehensive explanation and analysis of the CT scanning technology in the study of coal fracture network structures [23]. Shi et al. combined CT technology with fractal theory to analyze the physical characteristics of coal fractures and discussed the CT images of different coal ranks [4]. Wang et al. used μ-CT to study the effects of temperature on coal sample structure, showing that increased temperatures promote the expansion and widening of fractures and induce new fractures [24]. Based on CT images, Wu explored in detail the fractal characteristics of coal fracture network structures and derived the relationship between 2D and 3D fractal dimensions [25]. HW Zhou characterized the evolution of pore-fracture networks in coal under uniaxial compression conditions by combining MICP, X-ray μ-CT technology, and the presented fractal model [21]. In summary, many researchers have made progress in visualizing the 3D reconstruction of the coal microstructure and quantitatively characterizing the fracture networks.
Many researchers have utilized CT scanning technology to study the evolution of coal fractures under uniaxial compression. To avoid the effect of unloading on the coal fracture network, Xi et al. proposed an in situ CT observation method to study the evolution of coal fracture networks under the influence of confining pressure and axial load [26]. Li et al. conducted an in situ observation of coal fractures under uniaxial and triaxial compression and performed three-dimensional visualization and quantitative characterization [27]. On this basis, Wang et al. further quantitatively analyzed the dynamic evolution of coal fractures by combining fractal theory and found that the fractal dimension of coal rock fractures is positively correlated with the crack rate, crack density, and crack connectivity during the process [28]. Hao et al. compared the development pattern of the fracture structure of bituminous coal under uniaxial compression, tension, and shear using the CT technique, finding that under uniaxial compression load, tensile damage occurred in bituminous coal and fractures extended mainly along the vertical direction [29]. Song et al. compared the fracture characteristics of brittle coals under uniaxial and cyclic compression loading and found that the former exhibited abrupt damage caused by large cleavage fractures while the latter exhibited progressive damage by a mixed fracture network [30].
CBM in medium-rank coal is abundant in China, especially in the Ordos Basin [31,32]. The eastern margin of the Ordos Basin is one of the major CBM-rich producing blocks at present [33,34]. However, research on the internal fracture network evolution of coal samples under uniaxial compression in this region is limited. In this study, firstly, in situ uniaxial compression experiments and μ-CT scanning experiments were conducted on coal samples extracted from the eastern edge of the Ordos Basin, obtaining the corresponding stress–strain law and CT scanning images under different loads. Secondly, the CT images of coal rocks scanned at each stress loading stage were processed, and 3D visualized fracture network models were extracted. By combining fracture structure parameters, we depicted the dynamic evolution process of fracture networks in coal in an intuitive and quantitative manner. Finally, the evolution process of internal network fractures in coal rocks under different axial stresses was analyzed by combining stress–strain curves, fracture network structure parameters, and fractal theory.

2. Materials and Methods

2.1. Coal Sampling

The coal sample was taken from the Rongtai coal mine in Lvliang, at the eastern edge of the Ordos Basin. The coal-bearing strata are mainly the Upper Carboniferous Taiyuan Group (C2t) and the Lower Permian Shanxi Group (P1s). Samples were taken from fresh extraction faces downhole, immediately wrapped in waterproof and shockproof polyethylene film, and returned to the laboratory.

2.2. Sample Processing and Physicochemical Analysis

A column sample of Φ3.8 × 8.1 mm was made in the laboratory using the wire-cutting technique along the vertical laminae direction for uniaxial compression and a μ-CT scan experiment (Figure 1). The column sample was polished with sandpaper to make the surface roughness less than 0.02 mm to eliminate the possible end effect of the coal sample during the uniaxial compression test. It is worth noting that in order to avoid the influence of the native voids in the coal samples on the experiments, we deliberately avoided the areas with large voids when processing the coal samples and selected the dense parts of the coal samples for wire cutting. Meanwhile, parallel samples were made from the remaining samples of wire-cutting and the maximum vitrinite reflectance (Ro, max) measurement and maceral composition analysis according to relative standards [35,36]. The industrial components were determined by an SDLA618 automatic industrial analyzer.
According to Table 1, the results of maceral composition analysis and the maximum vitrinite reflectance (Ro, max) determination indicate that the content of the vitrinite group in the coal sample was 58%, the content of the inertinite group was 40.2%, and the Ro, max value was 1.5%, which indicates that the coal sample belonged to the middle-rank coal. In addition, the mineral composition content of the coal sample was 1.8%, which was mainly dominated by clay minerals. The results of the industrial analysis showed that the fixed carbon content of the coal sample was 77.03%, volatile content was 18.8%, ash content was 4.17%, and moisture content was 0.6%, which indicates medium-volatile and low-ash coals. In Table 1, Mad, Vad, Aad, and FCad indicate moisture (air-dried basis), volatile matter (dry, ash-free basis), ash (air-dried), and fixed carbon (air-dried basis), respectively.

3. The Experimental Procedure

3.1. Experimental Equipment

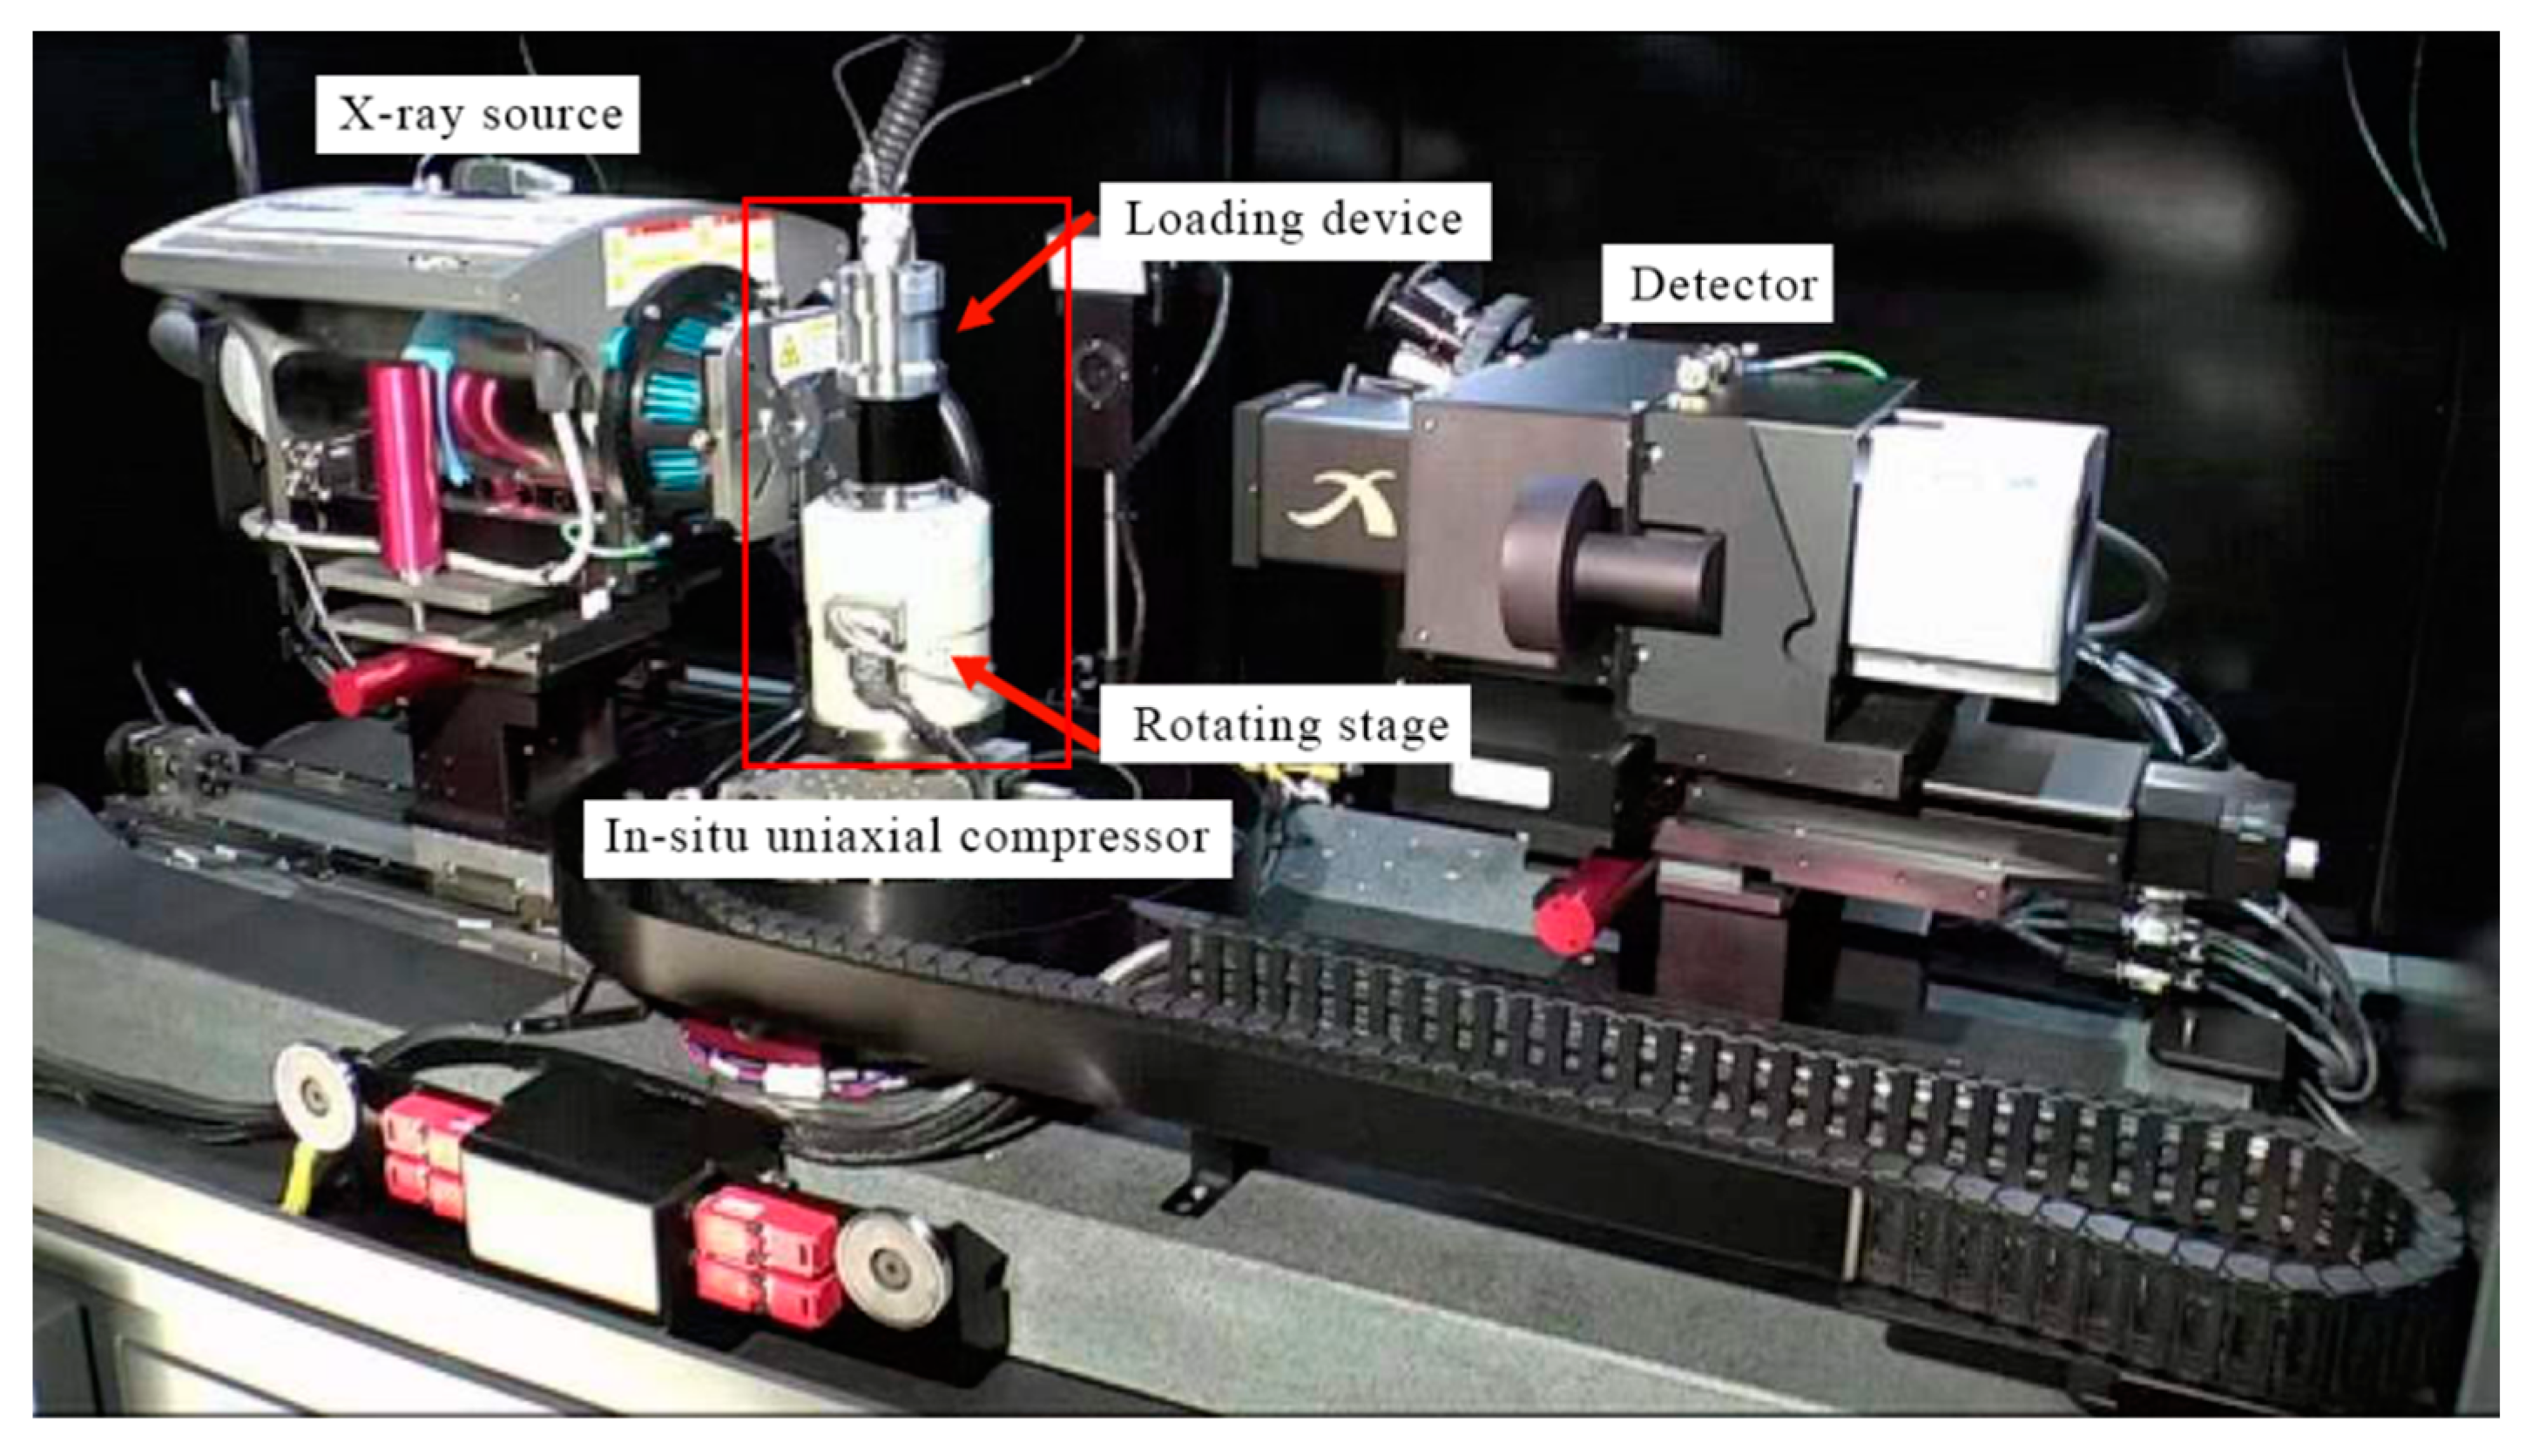
Experiments were conducted utilizing a uniaxial loading device with an integrated X-ray μ-CT system at the Institute of Geology and Geophysics, Chinese Academy of Science (Figure 2). This device can obtain high-precision CT scan images while compressing the coal sample in situ, avoiding the unloading effect.
The loading system uses the Deben CT5000TEC uniaxial compression device, which can provide a maximum loading force of 5 kN at a constant loading rate of 0.03–3.00 mm/min, with real-time stress–strain data recorded in the computer during loading.
The μ-CT system uses the Xradia 520 Versa 3D X-ray microscope, which consists of an X-ray source, a rotary table, and a detector. The X-ray source operates at a voltage range of 30–160 kv with a maximum output power of 10 w. The rotary table carrying the coal sample can be rotated 360° to ensure that the internal fissures of the coal rock are captured in all directions. The X-rays emitted from the source pass through the rotating coal sample and are received by the detector, which converts the received attenuated X-rays signal into a high-resolution digital image reflecting the internal information of the coal sample, providing the basis for subsequent 3D modeling. Compared to conventional micro-CT, the system employs a dual-stage magnification technique for 0.7 μm spatial resolution and voxel-by-voxel imaging of 70 nm voxels. This allows high-resolution images of coal samples even when they are far from the ray source, providing the possibility to observe the continuous evolution of 3D fracture networks within coal rocks under axial compressive loading in the laboratory. To ensure that the voids detected in the μ-CT scanning experiments are all cracks formed in the coal sample during uniaxial compression, we need to choose the best scanning resolution. In this study, the optimal resolution was adjusted according to the field of view. We chose it by switching between different magnification objectives and adjusting the relative distance between the X-ray source, the coal sample and the objective. Through several tunings, we finally chose 11.27 μm for voxel imaging and subsequent fracture studies to ensure scanning accuracy and sample integrity. However, there were still limitations in the detection of microfractures due to unavoidable human errors.

3.2. Experimental Procedure

Before the test loading, Teflon sheets were bedded, and silicone grease was applied to ensure uniform stress distribution at the end of the sample during loading. Subsequently, uniaxial compression experiments were performed on the coal samples at the same loading rate. The experimental schematic diagram is shown in Figure 3. To ensure that the core position was not affected under different stresses, the loading was suspended when the axial stresses reached different stresses, the compression pressure was maintained using the servo control function, and μ-CT scanning experiment was performed. Due to the difference in density and structure of the coal rock’s internal composition, the coal rock’s pore fracture can be distinguished from the coal matrix and minerals by the different intensities of light in different parts [37].
The specific experimental procedure is as follows:
  • To ensure the stress state of the coal rock, uniaxial compression was performed at a loading rate of 0.03 mm/min. The loading was suspended when the axial stress reached 20 N of stress. The first μ-CT scan was performed.
  • The loading rate of 0.03 mm/min was kept constant, and the second μ-CT scan was performed when the axial stress reached 150 N.
  • The coal rock damage was observed in real time, and a third μ-CT scan was performed when the axial stress reached 200 N.
Three sets of μ-CT images of coal samples under different stress states were obtained from three CT experiments. To obtain high-quality CT images, the optimal scanning parameters must be set according to the sample size and material characteristics. In this study, the μ-CT scanning voltage was 86 kV and the current was 70 μA. The CT images were scanned every 40 min at a spatial resolution of 11.27 µm/pixel, and 1010 CT images were generated for each set of scans, resulting in a total of three sets of μ-CT images under different stress conditions. The entire experiment was performed at room temperature.

3.3. Three-Dimensional Modeling Method of Coal Rock Fracture Network

3.3.1. Two-Dimensional CT Image Preprocessing

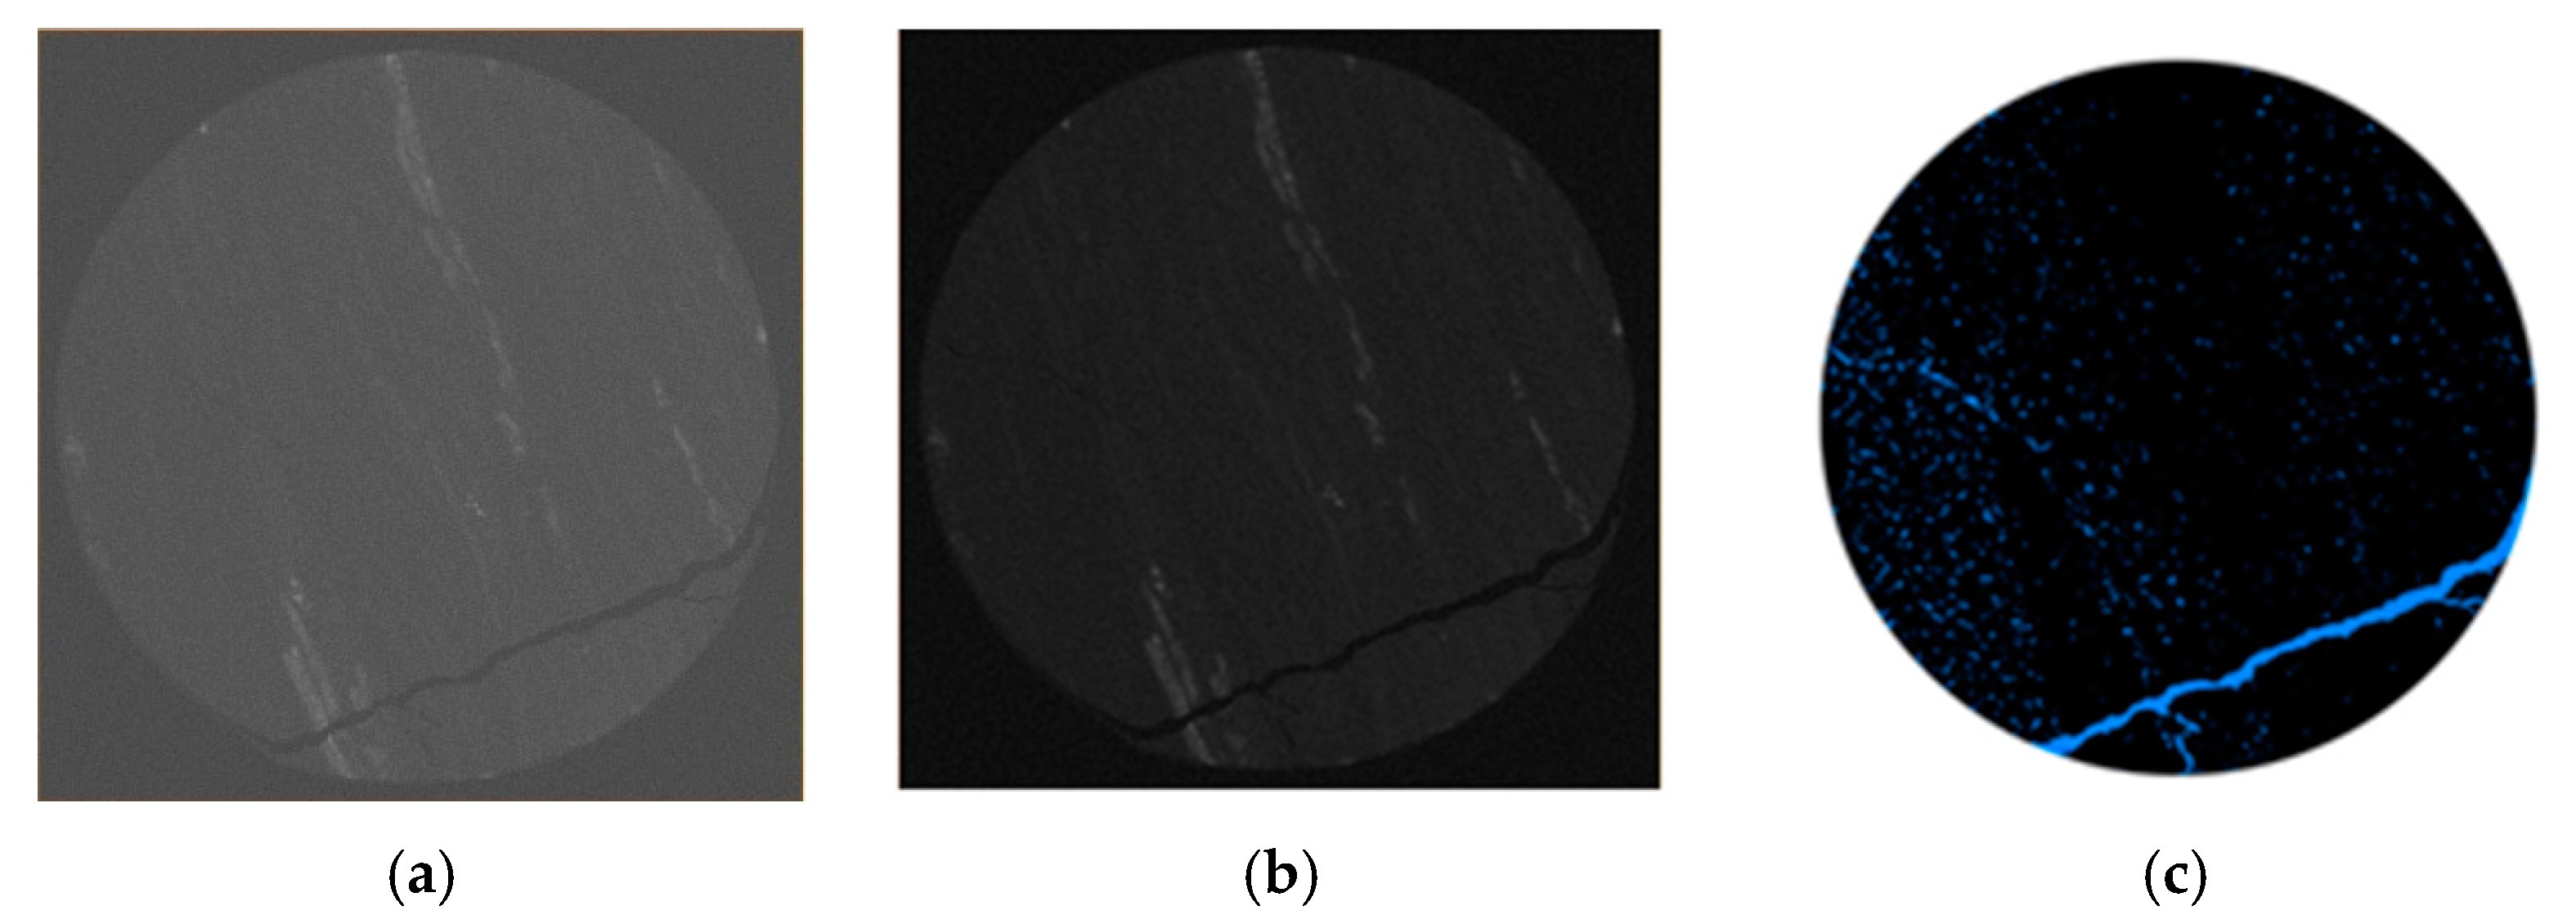
The original CT scan images of coal samples are noisy due to unavoidable systematic environmental and equipment errors. This study used an improved adaptive median filtering algorithm for filtering and noise removal. Compared with the traditional median filtering algorithm, this algorithm can customize the processing order according to the characteristics of the pixels, thus removing noise more effectively, and, by adjusting the parameters, it can more flexibly adapt to different noise densities.
After the raw CT images were median filtered, the image segmentation was performed using an interactive threshold segmentation algorithm. The threshold pixels were set according to the grayscale difference between the pore fracture, coal matrix, and minerals. The image was binarized into the region of interest (ROI) and the background. The binarized image can well reflect the pore-fissure structure information in the coal rock. It can effectively distinguish the pore fissures in the coal sample from the coal matrix and minerals. As shown in Figure 4c, the blue area indicates the pore fracture and the black area indicates the coal matrix and minerals.

3.3.2. Three-Dimensional Fracture Network Extraction

The preprocessed 2D CT images were reconstructed to obtain the 3D data body of coal rock, and the 3D pore-fracture model was obtained by threshold segmentation of the data body. Pores and fractures are basically the same in the image gray value and cannot be distinguished. However, due to the difference in morphology and size of pores and fractures in coal rocks, shape factors are introduced to distinguish pores from fractures.
The shape factor characterizes the proximity of the hole and throat configuration to the sphere, with a sphere value of 1. The smaller and closer to the sphere, the larger and more irregular; its calculation formula is
S h a p e   F a c t o r = A r e a 3 36 π × V o l u m e 2
where, Shape Factor is the shape factor; Area is the surface area of the pore-fracture structure in μm2; and Volume is the volume of the pore-fracture structure in μm3.
Subsequently, a specific Shape Factor threshold was set, and structures with a Shape Factor greater than this threshold were judged as fractures, while structures having a Shape Factor less than this threshold were judged to be pores, thus achieving automatic differentiation between pores and fractures (Figure 5).
Figure 6 shows the pictures of segmented voids with different shape value intervals, where we choose Shape Factor = 20 as our threshold.
The pores and fractures were partitioned by Shape Factors to distinguish pores and fractures within the coal rock, providing a methodological basis for the subsequent study of fracture-related properties.

4. Results and Discussion

4.1. Evolution Characters of Stress–Strain

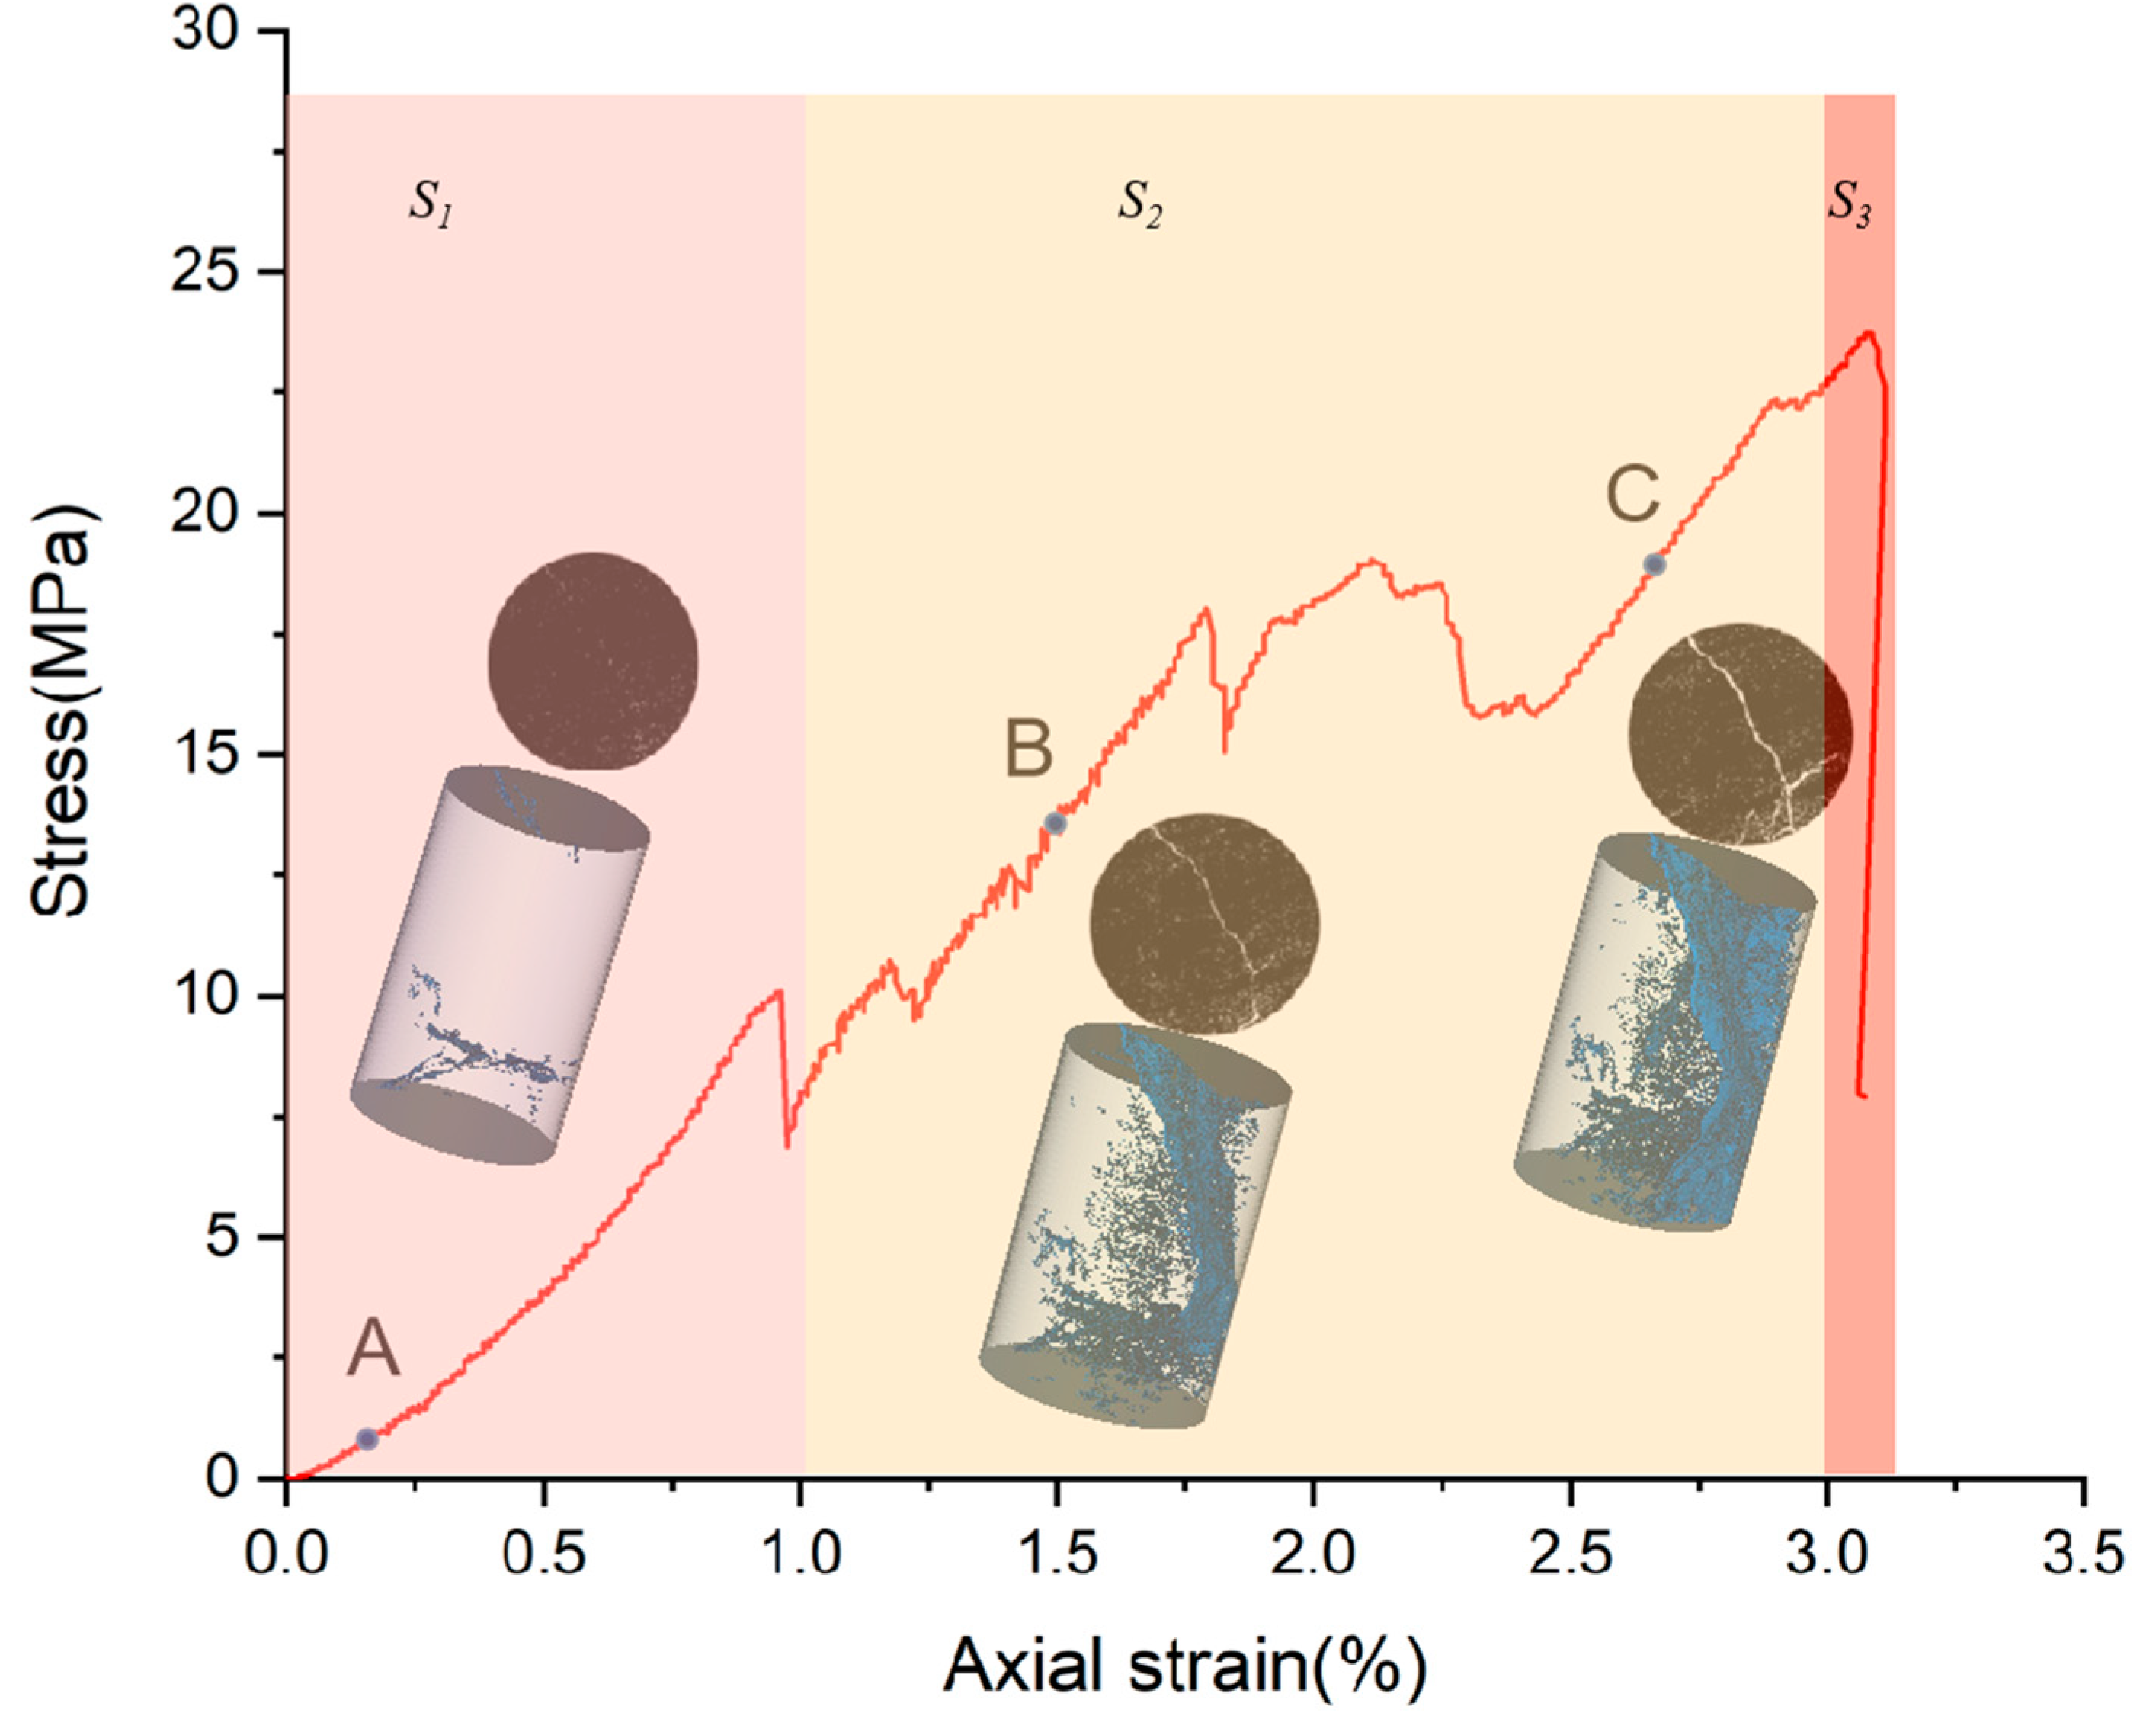
The stress–strain curve of the sample is shown in Figure 7. The compression process can be divided into the microfracture compaction stage (S1), linear elasticity stage (S2), and peak failure stage (S3). From the CT scan results of points A, B, and C, as the axial stress increases, the crack network gradually begins to initiate, develop, and penetrate the sample. During the initial compaction stage (0~1.1% axial strain), the curve is concave, indicating that the rate of stress change is greater than that of strain change; as the axial load increases, the curve falls and then rises again into the linear stage (1.1~3.0% axial strain). The first significant drop in the curve is due to the gradual expansion and connection of local small and medium-sized natural cleats under the stress, resulting in local failure. Large cracks can be observed on the surface of the sample, but due to the redistribution of stress, it still has a large bearing capacity. Afterwards, the line grew approximately linearly, but due to the increase in stress, the pores continued to develop and multi-scale cracks connected with each other, and sharp fluctuations appear in the curve. The main crack continued to propagate until it penetrated the sample, causing the splitting failure and complete loss of its load-bearing capacity, thereby exhibiting strong brittleness characteristics. Through calculation, the failure strength of the sample is 24.58 MPa and the elastic modulus is 6.32 GPa.

4.2. Fracture Porosity

The volume and surface area of cracks can reflect their expansion characteristics and using fracture porosity φ as the fracture evaluation index can be used to quantitatively characterize the overall evolution degree of cracks. The calculation formula is
φ = V f V c
where V f is the total volume of cracks in the coal, mm3; V c is the total volume of the coal sample, mm3. As shown in Figure 7 and Figure 8, a fracture porosity test was conducted on the sample before the experiment, and it was found that the fracture porosity was 0.124%. When the axial stress was 20 N (point A), the fracture porosity was 0.06% with the 3.44 × 108 μm3 crack volume, which was 51.61% lower than the intact sample. This is due to the closure of some micropores in the S1 stage corresponding to the 20 N condition. When the pressure increased to 150 N (point B), the fracture porosity rose to 0.597% with the 3.37 × 109 μm3 crack volume, an increase of 895% compared to point A. The main reason for this is that there is a large drop in the stress–strain curve between A and B, indicating the generation of macroscopic cracks and a sudden outbreak in the total volume of cracks. When the stress reached 200 N (point C), the fracture porosity further increased to 1.48% with the 8.19 × 109 μm3 crack volume, an increase of 995% and 248% compared to points A and B, respectively. Obviously, the curve from B to C fluctuates frequently, and the sample undergoes the process of multiple local failure–stress redistributions to resist deformation. Further connection of cracks and a sharp increase in crack volume appear. In addition, large secondary fractures continue to develop along the dominant plane, and new fractures continue to form, further promoting an increase in fracture rate until the sample is destroyed. In the above two stages, the slope of the AB segment is smaller than that of BC, which may be because the energy in the early stage is mainly used for crack germination, and the average distance of micro-cracks inside the coal rock is relatively large. In the later stage, the pore cracks develop to a certain extent, and the average distance decreases, making it easier for them to communicate with each other, resulting in a faster increase in fracture porosity.

4.3. Fractal Characteristics of the Fracture Network

Coal rock is a complex system with a fractal structure. The fractal dimension of fractures can reflect the chaotic complexity and irregular tortuosity of fractures in coal rock. There are many common methods to calculate fractal dimension, such as box counting, ball counting, and Fourier transform. In this study, the box counting method was used to calculate the fractal dimension of the crack, that is, a series of cubes with different sizes are used to cover the binary image of the crack, and then the number of pixels in each cube is counted. With the continuous reduction in the size of the cube, the number of pixels contained in the cube shows a certain pattern. Therefore, by analyzing the relationship between the cube size and the number of pixels, we can calculate the fractal dimension of the crack. The calculation formula is
D F = l i m ε 0 l o g   N ε l o g   N 0
where D F is the fractal dimension of the coal rock fracture, N ε represents the number of pixels within the coal rock fracture, and N 0 is the minimum number of pixels within the cube.
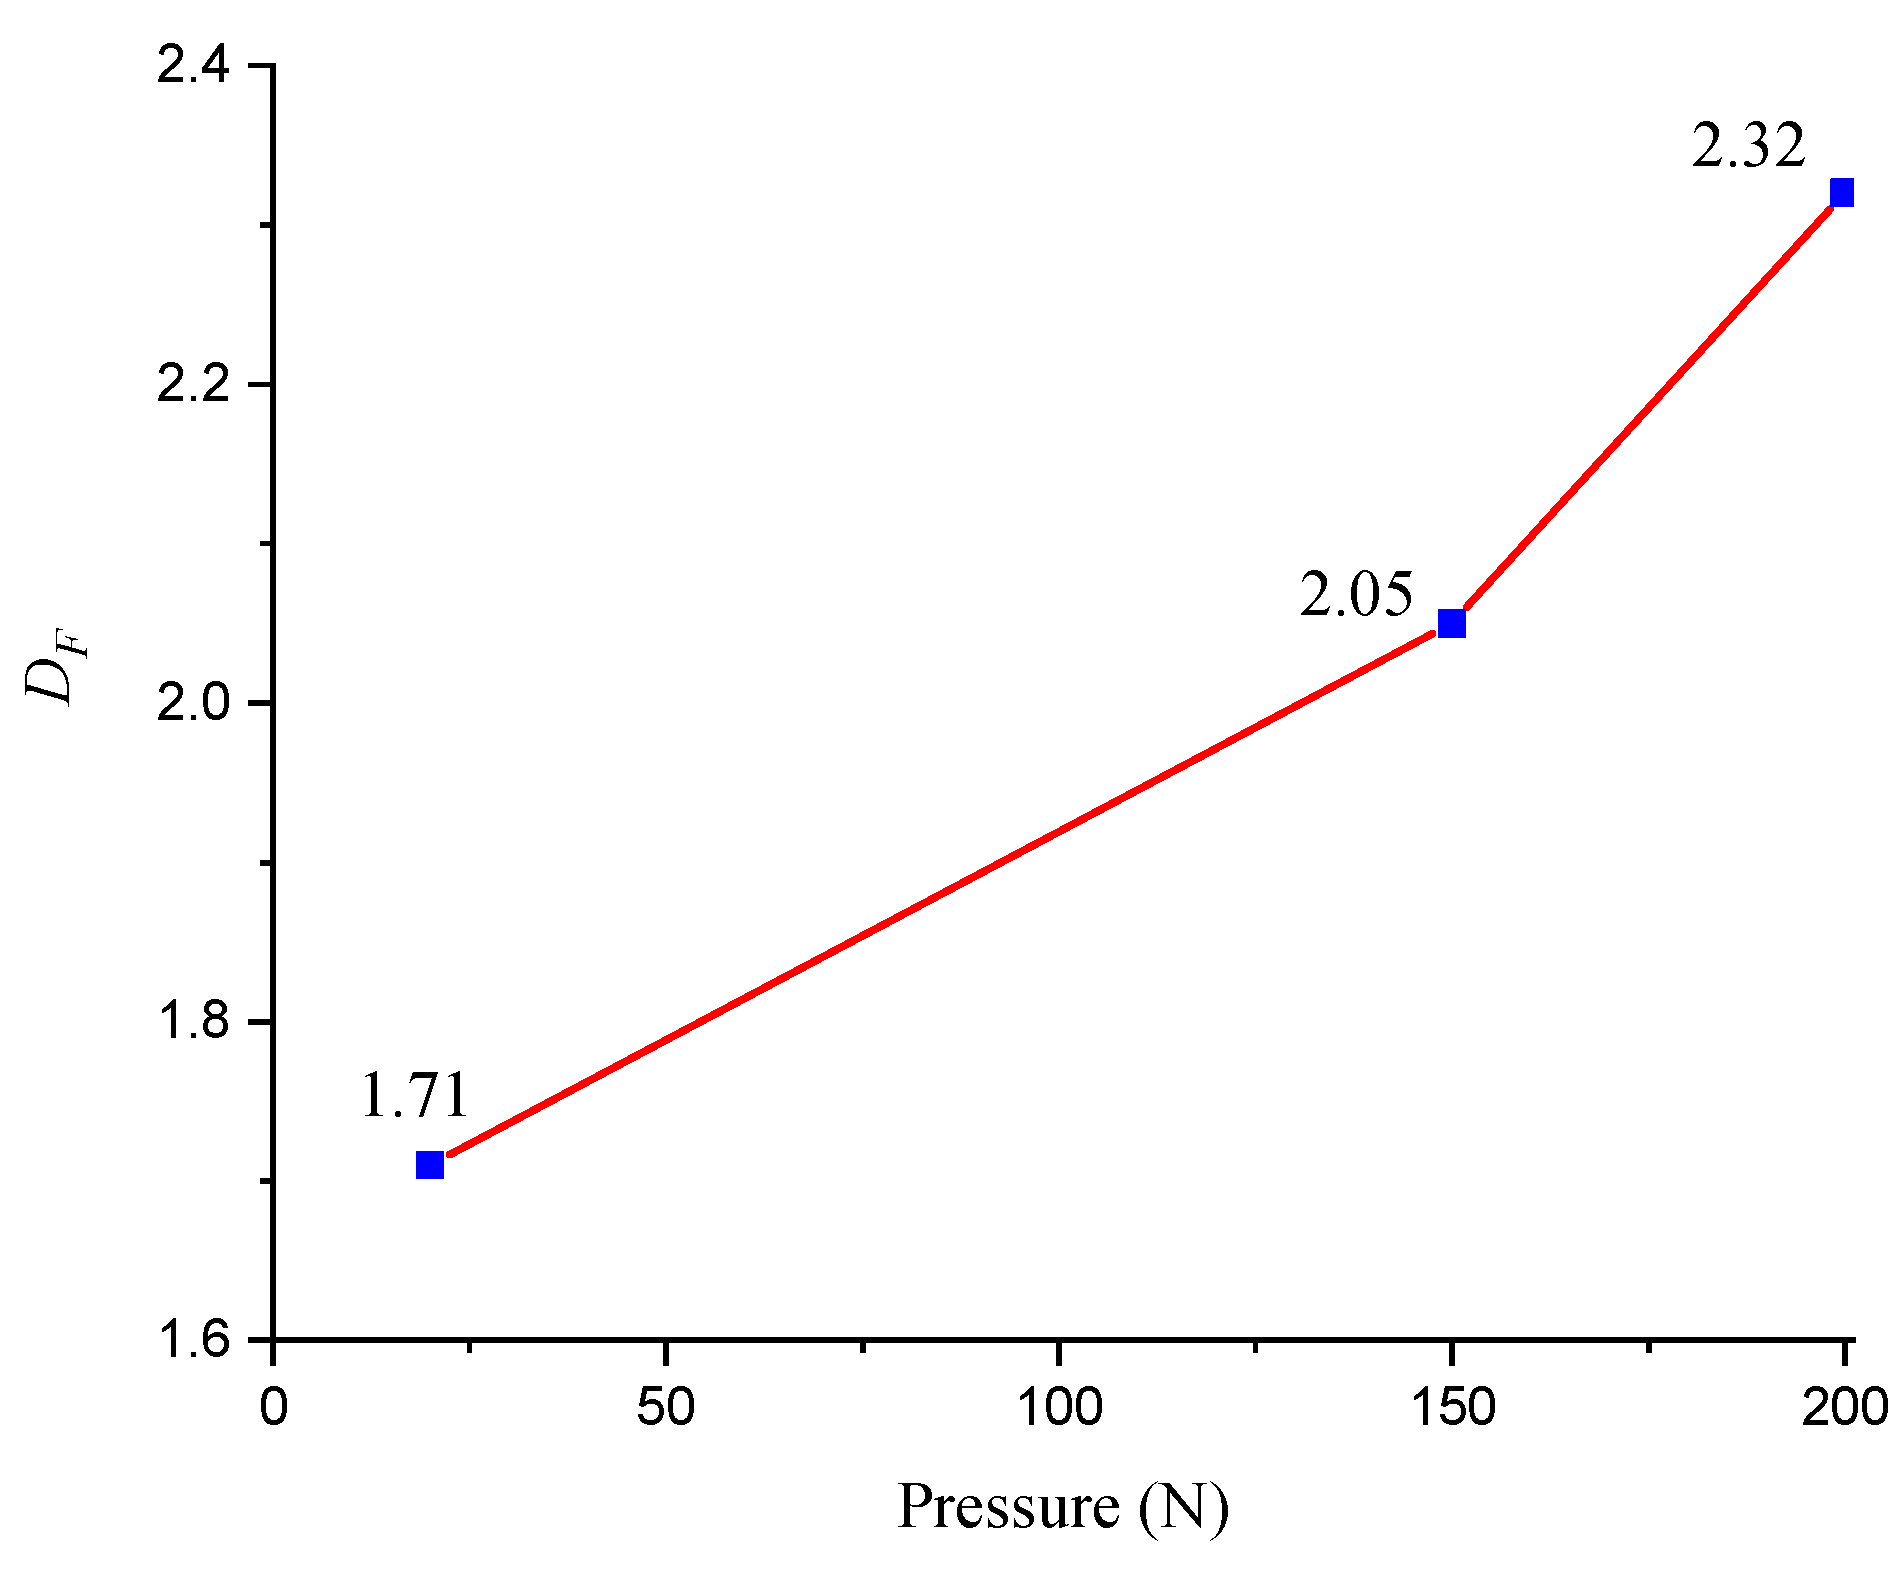
A higher fractal dimension represents a more complex fracture structure, and the more dispersed the distribution, the looser the connection between the fractures, which means the stronger the damage. According to Figure 9, when the axial stress is 20 N, the D F is 1.71, indicating that the distribution of coal rock fractures is relatively dispersed and there are many small fractures. At 150 N, the D F increases to 2.05, which shows that the fracture distribution begins to concentrate, and some large fractures appear. When the pressure reaches 200 N, the fractal dimension of coal rock fractures rises further to 2.32, which indicates that the fracture is concentrated and the large cracks are about to penetrate the sample. Similarly, the latter slope is greater, which reveals that, as stress increases, the fractures begin to concentrate faster and damage to the coal rock is gradually accelerating.

4.4. Dynamic Evolution of Fractures

The μ-CT slices were used to perform 3D fracture reconstruction to determine the fracture network. Figure 10 shows the three-dimensional crack network extracted from the sample at axial pressure of 20 N, 150 N, and 200 N. The overall crack propagation process of coal and rock is as follows:
  • When the axial pressure is 20 N, there are three forms of fracture networks in coal and rock: (1) the embryonic form of the main fracture network extending along a monoclinic direction in the upper part; (2) the local network of fractures extending horizontally at the lower part; and (3) the fracture network extends in a monoclinic direction (opposite to the initial extension direction of the main fracture network) at the lower left side. At this time, the number of coal rock fractures is 67 with a total crack area of 3.79 × 107 μm2.
  • At 150 N (1) the embryonic network of the main fracture continues to merge with the lower transverse fracture network; (2) the fracture network at 20 N continues to expand along the original dominant plane; and (3) the horizontal cracks germinate densely from top to bottom, the number of cracks increases to 311, and their total area is 3.52 × 108 μm2.
  • At 200 N, the sample approaches failure, with (1) the main crack continuing to extend along the dominant plane to the bottom of the coal rock, and (2) the transverse small cracks in the middle connecting with each other and forming a larger-scale crack network. Finally, the number of coal rock cracks decreases to 289 with a total crack area of 5.35 × 108 μm2.

5. Conclusions

To visually and quantitatively characterize the distribution characteristics and dynamic evolution process of the internal fracture network of coal under different pressure states, coal samples were subjected to uniaxial compression loading and μ-CT scanning, obtaining corresponding stress–strain data and CT scanning slices under different loads. The results show the following:
  • The compression process of the sample can be divided into the micro-crack compaction stage (S1), linear elastic stage (S2), and peak failure stage (S3). S1 shows that the stress change rate is greater than the strain change rate; in the S2 stage, the curve is approximately linear, but significant fluctuations are due to the expansion and connection of small and medium-sized natural cleats under stress, leading to local failure; and in the S3 stage, the main crack continued to propagate and penetrated the sample, which completely lost its load-bearing capacity. The sample exhibited strong brittle characteristics, with a failure strength of 24.58 MPa and an elastic modulus of 6.32 GPa.
  • The crack volume at 20 N, 150 N, and 200 N was 3.44 × 108 μm3, 3.37 × 109 μm3, and 8.19 × 109 μm3, respectively, corresponding to fracture porosity of 0.06%, 0.597%, and 1.48%. The sample underwent local failure and stress redistribution to resist deformation while new cracks continued to form and connect. The early energy was mainly used for crack initiation, and the average distance between micro-cracks was relatively large. In the later stage, the average distance between cracks decreased, making it easier for them to communicate with each other, resulting in greater crack rate growth.
  • The fractal dimensions for axial pressures of 20 N, 150 N, and 200 N were 1.71, 2.05, and 2.32, respectively. This means that as the stress increases, cracks begin to concentrate and their size becomes more uneven, which may lead to further fragmentation of the coal rock.
  • As the stress increases, the initial cleats propagate in the dominant crack direction, while many transverse micro-cracks continue to sprout internally, ultimately forming the main crack. The total crack area at 20 N, 150 N, and 200 N was 3.79 × 108 μm2, 3.52 × 108 μm2, and 5.35 × 108 μm3, respectively, but the number of cracks increased first and then decreased, which means that the cracks constantly merged as they arose.

Author Contributions

Conceptualization, S.Z. and Y.Z.; methodology, Y.Z.; software, Y.Z. and Y.T.; validation, S.Z. and Y.Z.; formal analysis, Y.Z.; resources, S.Z.; data curation, M.W. and B.W.; writing—original draft preparation, Y.Z. and Y.T.; writing—review and editing, Y.Z. and S.Z.; visualization, Y.Z., Y.T. and M.W.; supervision, S.Z.; project administration, Y.Z.; funding acquisition, S.Z. All authors have read and agreed to the published version of the manuscript.

Funding

This work was supported by National Natural Science Foundation of China (No: 4187020695).

Data Availability Statement

Not applicable.

Acknowledgments

This work was supported by National Natural Science Foundation of China (No: 4187020695).

Conflicts of Interest

The authors declare no conflict of interest.

References

  1. Sun, X.; Luo, T.; Wang, L.; Wang, H.; Song, Y.; Li, Y. Numerical simulation of gas recovery from a low-permeability hydrate reservoir by depressurization. Appl. Energy 2019, 250, 7–18. [Google Scholar] [CrossRef]
  2. Hou, Z.; Xie, H.; Zhou, H.; Were, P.; Kolditz, O. Unconventional gas resources in China. Environ. Earth Sci. 2015, 73, 5785–5789. [Google Scholar] [CrossRef]
  3. Tan, Y.; Pan, Z.; Feng, X.-T.; Zhang, D.; Connell, L.D.; Li, S. Laboratory characterisation of fracture compressibility for coal and shale gas reservoir rocks: A review. Int. J. Coal Geol. 2019, 204, 1–17. [Google Scholar] [CrossRef]
  4. Shi, X.; Pan, J.; Hou, Q.; Jin, Y.; Wang, Z.; Niu, Q.; Li, M. Micrometer-scale fractures in coal related to coal rank based on micro-CT scanning and fractal theory. Fuel 2018, 212, 162–172. [Google Scholar] [CrossRef]
  5. Tao, S.; Chen, S.; Pan, Z. Current status, challenges, and policy suggestions for coalbed methane industry development in China: A review. Energy Sci. Eng. 2019, 7, 1059–1074. [Google Scholar] [CrossRef]
  6. Dai, L.; Liu, Y.; Cao, J.; Yang, X.; Sun, H.; Wen, G.; Wang, B. A Study on the Energy Condition and Quantitative Analysis of the Occurrence of a Coal and Gas Outburst. Shock Vib. 2019, 2019, 8651353. [Google Scholar] [CrossRef]
  7. Wang, K.; Du, F. Coal-gas compound dynamic disasters in China: A review. Process Saf. Environ. Prot. 2020, 133, 1–17. [Google Scholar] [CrossRef]
  8. Tang, J.; Li, S.; Qin, G.; Lu, W.; Zhu, Z.; Jia, C.; Wen, H.; Yang, L.; Xu, C. Experiments on Mechanical Response and Energy Dissipation Behavior of Rockburst-Prone Coal Samples Under Impact Loading. Shock Vib. 2021, 2021, 9924456. [Google Scholar] [CrossRef]
  9. Zhang, W.; Mu, C.; Xu, D.; Li, Z.; Wu, B. Energy Action Mechanism of Coal and Gas Outburst Induced by Rockburst. Shock Vib. 2021, 2021, 5553914. [Google Scholar] [CrossRef]
  10. Cai, Y.; Liu, D.; Pan, Z.; Yao, Y.; Li, J.; Qiu, Y. Pore structure and its impact on CH4 adsorption capacity and flow capability of bituminous and subbituminous coals from Northeast China. Fuel 2013, 103, 258–268. [Google Scholar] [CrossRef]
  11. Chen, Z.; Guo, X.; Shao, L.; Li, S.; Tian, X. Design of a three-dimensional earth pressure device and its application in a tailings dam construction simulation experiment. Acta Geotech. 2021, 16, 2203–2216. [Google Scholar] [CrossRef]
  12. Chen, Z.; Feng, Y.; Zhang, X.; Guo, X.; Shao, L.; Cao, Y.; Li, S.; Gao, L. Similarity criterion for the nonlinear thermal analysis of the soil freezing process: Considering the dual effect of nonlinear thermal parameters and boundary conditions. Acta Geotech. 2022, 17, 5709–5719. [Google Scholar] [CrossRef]
  13. Rodríguez de Castro, A.; Agnaou, M.; Ahmadi-Sénichault, A.; Omari, A. Numerical porosimetry: Evaluation and comparison of yield stress fluids method, mercury intrusion porosimetry and pore network modelling approaches. Comput. Chem. Eng. 2020, 133, 106662. [Google Scholar] [CrossRef]
  14. Li, X.; Kang, Y.; Haghighi, M. Investigation of pore size distributions of coals with different structures by nuclear magnetic resonance (NMR) and mercury intrusion porosimetry (MIP). Measurement 2018, 116, 122–128. [Google Scholar] [CrossRef]
  15. Zhao, J.; Qin, Y.; Shen, J.; Zhou, B.; Li, C.; Li, G. Effects of Pore Structures of Different Maceral Compositions on Methane Adsorption and Diffusion in Anthracite. Appl. Sci. 2019, 9, 5130. [Google Scholar] [CrossRef]
  16. Sui, H.; Li, X.; Pei, P. Study on the Influence of Characteristics of Pore Structure on Adsorption Capacity of Tectonic Coals in Guizhou Province. Energies 2022, 15, 3996. [Google Scholar] [CrossRef]
  17. Zhao, Y.; Lin, B.; Liu, T.; Zheng, Y.; Sun, Y.; Zhang, G.; Li, Q. Multifractal analysis of coal pore structure based on NMR experiment: A new method for predicting T2 cutoff value. Fuel 2021, 283, 119338. [Google Scholar] [CrossRef]
  18. Chen, J.; Cheng, W.; Wang, G. Simulation of the meso-macro-scale fracture network development law of coal water injection based on a SEM reconstruction fracture COHESIVE model. Fuel 2021, 287, 119475. [Google Scholar] [CrossRef]
  19. Fang, H.; Sang, S.; Liu, S.; Du, Y. Methodology of three-dimensional visualization and quantitative characterization of nanopores in coal by using FIB-SEM and its application with anthracite in Qinshui basin. J. Pet. Sci. Eng. 2019, 182, 106285. [Google Scholar] [CrossRef]
  20. Ni, X.; Miao, J.; Lv, R.; Lin, X. Quantitative 3D spatial characterization and flow simulation of coal macropores based on μCT technology. Fuel 2017, 200, 199–207. [Google Scholar] [CrossRef]
  21. Zhou, H.W.; Zhong, J.C.; Ren, W.G.; Wang, X.Y.; Yi, H.Y. Characterization of pore-fracture networks and their evolution at various measurement scales in coal samples using X-ray μCT and a fractal method. Int. J. Coal Geol. 2018, 189, 35–49. [Google Scholar] [CrossRef]
  22. Yao, Y.; Liu, D.; Che, Y.; Tang, D.; Tang, S.; Huang, W. Non-destructive characterization of coal samples from China using microfocus X-ray computed tomography. Int. J. Coal Geol. 2009, 80, 113–123. [Google Scholar] [CrossRef]
  23. Mathews, J.P.; Campbell, Q.P.; Xu, H.; Halleck, P. A review of the application of X-ray computed tomography to the study of coal. Fuel 2017, 209, 10–24. [Google Scholar] [CrossRef]
  24. Wang, D.; Liu, H.; Cheng, X. A Miniature Binocular Endoscope with Local Feature Matching and Stereo Matching for 3D Measurement and 3D Reconstruction. Sensors 2018, 18, 2243. [Google Scholar] [CrossRef] [PubMed]
  25. Wu, H.; Zhou, Y.; Yao, Y.; Wu, K. Imaged based fractal characterization of micro-fracture structure in coal. Fuel 2019, 239, 53–62. [Google Scholar] [CrossRef]
  26. Ju, Y.; Xi, C.; Zhang, Y.; Mao, L.; Gao, F.; Xie, H. Laboratory In Situ CT Observation of the Evolution of 3D Fracture Networks in Coal Subjected to Confining Pressures and Axial Compressive Loads: A Novel Approach. Rock Mech. Rock Eng. 2018, 51, 3361–3375. [Google Scholar] [CrossRef]
  27. Li, Y.; Cui, H.; Zhang, P.; Wang, D.; Wei, J. Three-dimensional visualization and quantitative characterization of coal fracture dynamic evolution under uniaxial and triaxial compression based on μCT scanning. Fuel 2020, 262, 116568. [Google Scholar] [CrossRef]
  28. Wang, D.; Zeng, F.; Wei, J.; Zhang, H.; Wu, Y.; Wei, Q. Quantitative analysis of fracture dynamic evolution in coal subjected to uniaxial and triaxial compression loads based on industrial CT and fractal theory. J. Pet. Sci. Eng. 2021, 196, 108051. [Google Scholar] [CrossRef]
  29. Hao, D.; Tu, S.; Zhang, C.; Tu, H. Quantitative characterization and three-dimensional reconstruction of bituminous coal fracture development under rock mechanics testing. Fuel 2020, 267, 117280. [Google Scholar] [CrossRef]
  30. Song, S.; Ren, T.; Dou, L.; Sun, J.; Yang, X.; Tan, L. Fracture features of brittle coal under uniaxial and cyclic compression loads. Int. J. Coal Sci. Technol. 2023, 10, 9. [Google Scholar] [CrossRef]
  31. Chen, Y.; Tang, D.; Xu, H.; Tao, S.; Li, S.; Yang, G.; Yu, J. Pore and fracture characteristics of different rank coals in the eastern margin of the Ordos Basin, China. J. Nat. Gas Sci. Eng. 2015, 26, 1264–1277. [Google Scholar] [CrossRef]
  32. Meng, Y.; Tang, D.; Xu, H.; Li, C.; Li, L.; Meng, S. Geological controls and coalbed methane production potential evaluation: A case study in Liulin area, eastern Ordos Basin, China. J. Nat. Gas Sci. Eng. 2014, 21, 95–111. [Google Scholar] [CrossRef]
  33. Chen, Y.; Tang, D.; Xu, H.; Li, Y.; Meng, Y. Structural controls on coalbed methane accumulation and high production models in the eastern margin of Ordos Basin, China. J. Nat. Gas Sci. Eng. 2015, 23, 524–537. [Google Scholar] [CrossRef]
  34. Xu, H.; Tang, D.Z.; Liu, D.M.; Tang, S.H.; Yang, F.; Chen, X.Z.; He, W.; Deng, C.M. Study on coalbed methane accumulation characteristics and favorable areas in the Binchang area, southwestern Ordos Basin, China. Int. J. Coal Geol. 2012, 95, 1–11. [Google Scholar] [CrossRef]
  35. Zhou, S.; Yan, D.; Tang, J.; Pan, Z. Abrupt change of pore system in lacustrine shales at oil- and gas-maturity during catagenesis. Int. J. Coal Geol. 2020, 228, 103557. [Google Scholar] [CrossRef]
  36. Li, Q.; Liu, D.; Cai, Y.; Zhao, B.; Lu, Y.; Zhou, Y. Effects of natural micro-fracture morphology, temperature and pressure on fluid flow in coals through fractal theory combined with lattice Boltzmann method. Fuel 2021, 286, 119468. [Google Scholar] [CrossRef]
  37. Wang, G.; Shen, J.; Liu, S.; Jiang, C.; Qin, X. Three-dimensional modeling and analysis of macro-pore structure of coal using combined X-ray CT imaging and fractal theory. Int. J. Rock Mech. Min. Sci. 2019, 123, 104082. [Google Scholar] [CrossRef]
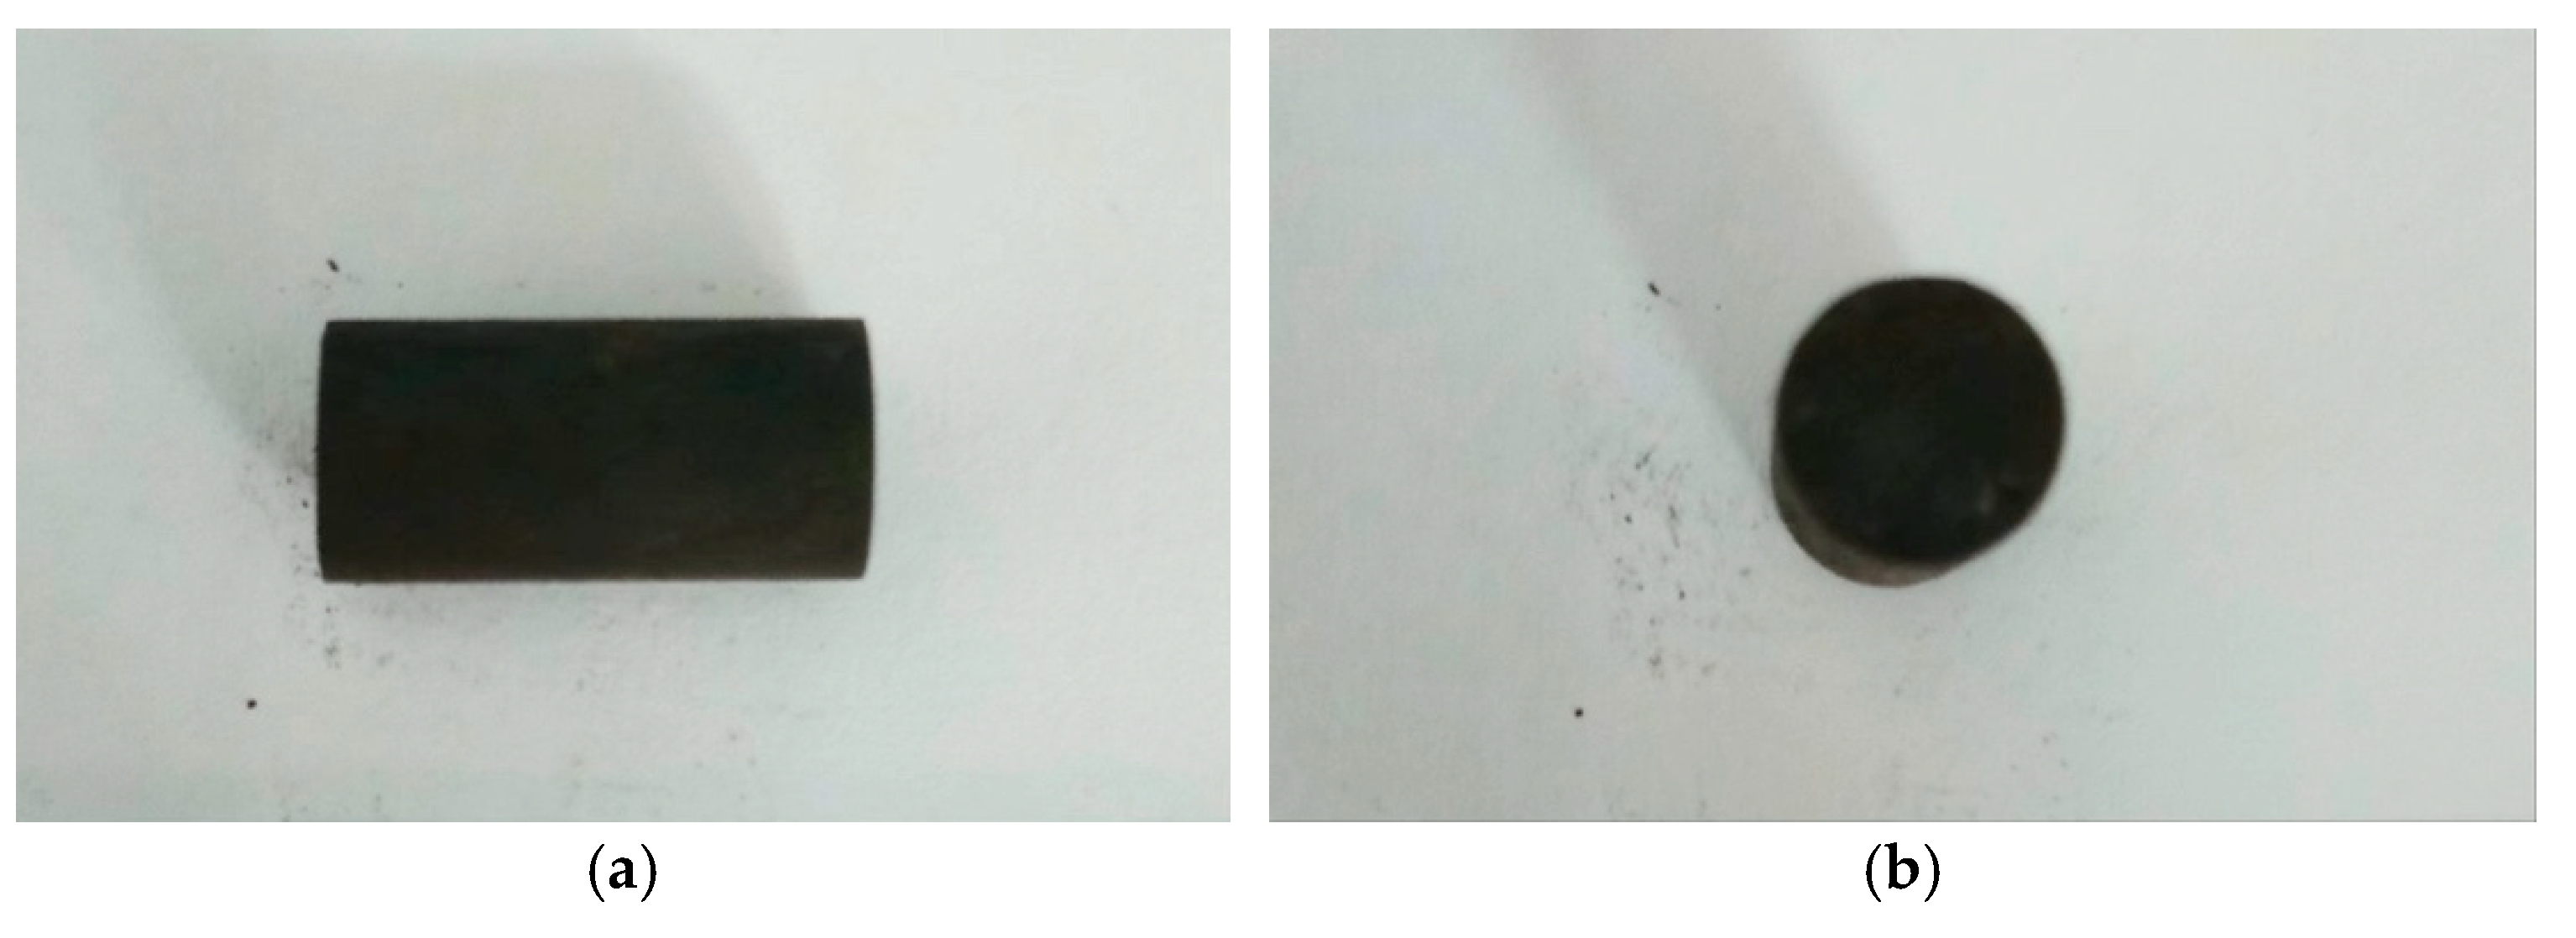
Figure 1. Processed coal sample: (a) horizontal direction; (b) vertical direction.
Processes 11 01631 g001
Figure 2. The uniaxial loading device with an integrated X-ray μ-CT system.
Processes 11 01631 g002
Figure 3. Experimental schematic diagram of loading system and CT scan imaging system.
Processes 11 01631 g003
Figure 4. D CT image preprocessing flow: (a) original image; (b) denoised image; (c) binarized image.
Processes 11 01631 g004
Figure 5. The process of 3D fracture network extraction.
Processes 11 01631 g005
Figure 6. Pictures of segmented voids with different shape value intervals from 1 to 20.
Processes 11 01631 g006
Figure 7. Stress–strain curve of the sample.
Processes 11 01631 g007
Figure 8. Relationship between fracture porosity and pressure.
Processes 11 01631 g008
Figure 9. Relationship between fractal dimension and pressure.
Processes 11 01631 g009
Figure 10. Process of crack development under different pressures (the colors of X, Y, and Z axes are red, green, and blue, respectively).
Processes 11 01631 g010
Table 1. Maceral Composition and Industrial Components Data of the Coal Sample.
Ro, max (%)Macerals Composition (%)Industrial Components (%)
VitriniteInertiniteClay MineralSulfide MineralMadVadAadFCad
1.55840.21.40.40.618.84.1777.03
Disclaimer/Publisher’s Note: The statements, opinions and data contained in all publications are solely those of the individual author(s) and contributor(s) and not of MDPI and/or the editor(s). MDPI and/or the editor(s) disclaim responsibility for any injury to people or property resulting from any ideas, methods, instructions or products referred to in the content.