Abstract
Pharmaceutical manufacturing processes are moving towards automation and real-time process monitoring with the help of process analytical technologies (PATs) and predictive process models representing the real system. In this paper, we present a digital twin developed for an adjuvant manufacturing process involving a microfluidic formation of lipid particles. The twin uses a hybrid model for estimating the current state of the process and predicting system behavior in real time. The twin is used to control the adjuvant particle size, a critical quality attribute, by varying process parameters such as the temperature and inlet flow rates. We describe steps in the design and implementation of the twin, starting from the conception of the mechanistic model, up to the generation of its surrogate model used as state estimator, PATs and the setup of the information technology—Operational technology architecture. We demonstrate the performance of the twin by introducing different disturbances in the process and comparing the effect on the product critical quality attributes with and without the control of the digital twin. Finally, we showcase the digital twin implementation for the process in good manufacturing practice, through an engineering run, which demonstrated the robustness of the process when controlled by the digital twin.
1. Introduction
With the emergence of industrial revolution 4.0, manufacturing processes are moving towards automation and real-time process monitoring where interconnected computers and intelligent machines communicate with each other and make decisions with minimal human involvement [1,2,3]. Digitizing manufacturing processes allows us to have a better understanding of the system, leverage available data to increase productivity, enhance product launch timelines and optimize processes to drive growth [4,5,6]. In this context, one of the most relevant tools and concepts that has arisen in the era of the digitalization of the manufacturing processes is the digital twin.
The digital twin is an in silico replica of the physical process [7,8]. In the digital twin of a manufacturing process, the real plant is connected to the virtual plant and there is a two-way connectivity between them [9,10]. The connection between the real and virtual plant allows the real plant to constantly send process analytical technology (PAT) data and process information to the virtual plant. During the perturbations, the virtual plant runs the underlying models to predict the quality attributes and transfer the control actions to the real plant (Figure 1). The underlying process models in the virtual plant are frequently updated with the knowledge from either the first principles model or data-driven model. The computation time in first principles models is limiting, and we need to build surrogate models which combine data from first principles models to build hybrid models. These hybrid models are solved [8] using new data.
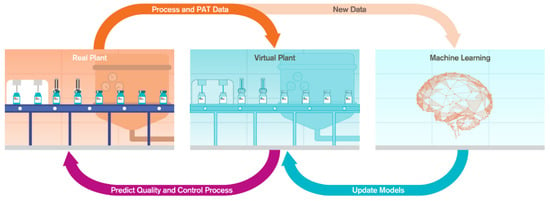
Figure 1.
Structure and data flow in digital twin.
There are various advantages of implementing a digital twin in a manufacturing process. The digital twin enables automation and advanced control, leading to an increase in robustness in manufacturing [11,12]. The digital twin reduces the development costs by optimizing the development cycles, reducing the actual number of experiments needed to develop a process [8,13,14,15,16,17,18,19,20,21]. It also helps to achieve real-time release with the help of the effective and precise control of desired quality attributes [22].
The present work describes the application of a digital twin to the continuous formulation of a particle-based adjuvant. Adjuvants enhance the immune response of vaccines whose active ingredient (or antigen) has an insufficient effect on the innate immune response [23]. The addition of adjuvant particles in vaccines also helps to optimize the amount of antigen needed per dosage and thus provide more doses of the vaccine during high demands. The adjuvant particles considered here are a new-generation adjuvant containing two immunostimulatory molecules. It is formulated by continuously mixing an organic and an aqueous phase in a chamber engraved in a microfluidic chip which efferently brings both phases to a complete mixing stage.
2. Materials and Methods
2.1. Process Description
The adjuvant particle manufacturing process involves the mixing of organic and aqueous solutions in a microfluidic chip (Figure 2). A solvent-based solution (organic phase) and a water-based solution (aqueous phase) are brought together. A precipitation process then begins with the formation of disc-like particles that are suspended in the surrounding liquid. The size of the discs increases as the process evolves. Eventually, the discs reach critical size and close, forming spherical particles. The size of these particles and the concentration of materials in the final product are the critical quality attributes of this process. The temperature and the flow rates, the main process parameters, are measured using temperature sensors and flow rate transmitters. The concentrations are measured using near-infrared (NIR) probes as described in Section 2.2.1.
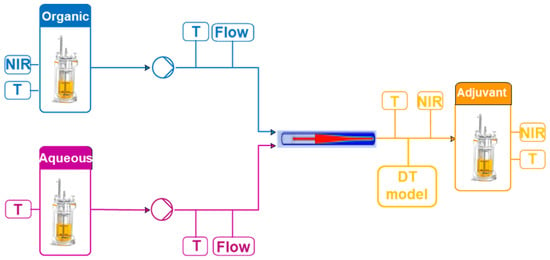
Figure 2.
Adjuvant particle manufacturing process.
2.2. Digital Twin Components
Building the digital twin involves six components (Figure 3): PAT tools, process models, control models, experimental validation, building information technology (IT)–operational technology (OT) architecture, and the user interface. We have described the role of each component and key challenges in building the digital twin for adjuvant manufacturing.
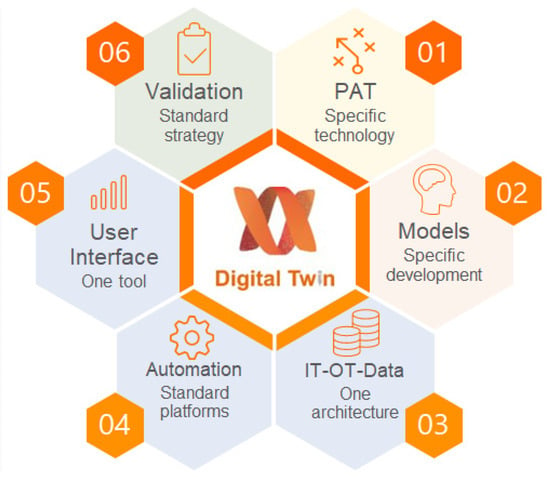
Figure 3.
Digital twin components.
2.2.1. PAT Tools
The PAT is one of the key pillars of the digital twin. It can be considered as the eyes of a digital twin as it is used to measure the evolution of the process in real time. The sensors allow us to measure process parameters such as the temperature, pressure, and flow rate while probes such as spectrometers generate spectra that can be linked to the composition of the raw materials and the critical quality attributes.
The first step of the PAT evaluation was the screening of the right technology. NIR and Raman technologies were tested on different concentrations of the raw materials and attributes in order to compare the acquisition time, sensitivity and accuracy of models. In this exercise, NIR and Raman gave similar results on the prediction error and the clustering of the same conditions. From there, a risk assessment was evaluated and the NIR technology was selected due to its lower environmental health and safety (EHS) risk, its ease of use and its high acquisition speed.
An NIR spatially resolved spectroscopy (NIR-SRS) device with three channels was implemented: a reflexion probe (P1) on the first channel was installed in the organic phase to check its composition before starting the process, a flow cell (P2) on the second channel was installed at the exit of the microfluidic chip to check the quality attributes of the product in real time and a third reflexion probe (P3) on the third channel was installed in the harvest vessel for a last check of the final product. From the process monitoring perspective, the flow cell (Figure 4) is the most important attribute, which is a focus of this article. The flow cell measures along two angles. The first one at 90° (diffusion) is the average of the spectra of five optic fibers. The second one at 180° (transmission) is the average of the spectra of three optic fibers. That means, for each timepoint of measurement, two different spectra are acquired in order to observe geometric shapes in addition to the chemical information that this technology offers. The spectra were measured in absorbance with a mix of ethanol and isopropanol as a reference. The integration time was 150 ms and a spectrum from each optic fiber was the average of 30 scans to increase the signal/noise ratio.
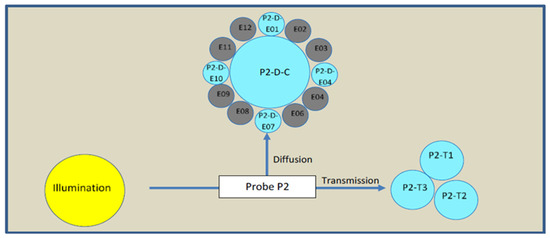
Figure 4.
NIR probe 2 arrangements.
The quality attributes measured by the NIR-SRS flow cell were the concentrations of the three lipids initially present in the organic phase and a fourth component initially present in the aqueous phase. The spectrometer was connected during the execution of the design of experiments (DoE) by varying several process parameters to extend the ranges of the quality attributes for model-building perspectives. In-line spectra were collected every five seconds, aligned with other sensors’ data and saved in the SIPAT (Siemens, Munich, Germany) platform. From there, chemometrics models were built offline on each quality attribute by using multivariate data analysis techniques to correlate these attributes to the spectra. The models were built using Matlab (Mathworks, Natick, MA, USA) and PLS Toolbox (Eigenvector, Manson, WA, USA) software and then transferred in SIPAT for their use in real time to estimate the concentrations. To build the models, NIR-SRS spectra were preprocessed using two filters: first, the standard normal variate algorithm was applied to normalize the spectra and then a first derivative was obtained using Savitzky–Golay smoothing and the differentiation algorithm (number of points in filter = 15, the order of the polynomial = 2). A principal component analysis was performed on the samples generated in the design space to discriminate those that were different from the consistent samples. Finally, the partial least square models were built using the spectra and their concentrations for each quality attribute. These models are used to predict the concentrations of each of them in routine and in real time from the new spectra generated in-line.
2.2.2. Process Models
The computational fluid dynamics (CFD) model was developed to study the effect of the temperature and flow rates of the aqueous phase and organic phase on the size of the adjuvant particles formed at the outlet of the microfluidic chip. The model comprised the equations representing the process of formation of the adjuvant particles coupled with mixing in the microfluidic chamber. The model was solved using STAR-CCM+ (Siemens) software. The model results were validated using experimental data (see Section 2.2.4). The CFD simulations are computationally expensive, and it is not practically possible to use them in real time for controlling the process.
CFD model results were used to gather the average particle size data and then these data were combined with the experimental ones to build a state estimator model. The state estimator model is a machine learning (ML) model mapping input process parameters (flow rate of an aqueous phase, flow rate of an organic phase and temperature) to the particle size quality attribute as an output. The state estimator model’s main goal is to cope with the CFD model being impractical for real-time control. To deal with CFD and experimental data distributions being slightly different, we leveraged a two-stage transfer learning approach [24]. About 1000 simulations from mechanistic models combined with around 100 experimental data points were used to train the state estimator model. This in turn would allow us to correct any model mismatch from the CFD model predictions. The predictions from the state estimator model are compared to the specifications to anticipate deviations and send to the control model to calculate corrective actions.
2.2.3. Control Models
Control models were built to suggest the control action based on predictions from the state estimator model and desired/optimal critical process parameters and critical quality attributes. According to the implemented control logic, the state estimator model predicts, at defined time steps, the size of adjuvant particles for the given flow rates and temperature conditions. The control model checks if the adjuvant particle sizes are within the desired/normal range of operation, and in case of any deviations, the model back-calculates the control action, i.e., optimized flow rate set points for aqueous and organic phases for controlling the deviated behavior of the system. To take the control action, it is required that data flow between models, sensors, systems, and cloud services.
Various tools such as SIPAT, Matlab, AzureML, etc., work in unison to generate data that in turn are used to optimize/control the process. It is essential that data from each of these systems are stored, monitored and tracked for posterity.
2.2.4. Experimental Data Generation and Model Validation
Experimental data consist of two data sets, a D-optimal DoE at a small scale and a long run at a large scale. During the DoE run at a small scale, the following process parameters were varied: temperature (three levels tested), total flow rate (five levels tested), aqueous:organic ratio (three ratios tested), concentration of organic phase (three flow rates tested) and concentration of aqueous phase (three flow rates tested). A total of 90 conditions were tested. The transitions between the setpoints were changed dynamically (no complete stop between experiments), then the process was allowed to stabilize for 4 to 6 min, after which samples were taken for offline analysis. The following responses were recorded offline: adjuvant size by dynamic light scattering (DLS), adjuvant polydispersity index by DLS, concentration of aqueous and organic phases. The product was also monitored in-line through NIR.
A second experimental data set consisted of a long run carried out at a large scale. In contrast to the first data set, the second one took place at the typical production flow rate and temperature in a larger scale system, aiming to mimic production circumstances. Several conditions were tested during the run, namely: one long section at steady state (1.9 h), two short sections with a variation in temperature and flow rate (5 min each) and two short sections where the flow was stopped for up to 1 hr and restarted (5 min each). Similarly to the first data set, NIR spectra were collected in-line whereas samples were taken for DLS analysis offline.
A Zetasizer (Malvern Panalytical Ltd., Malvern, UK) was used for the collection of size distribution through DLS. Figure 5 displays a typical size distribution:
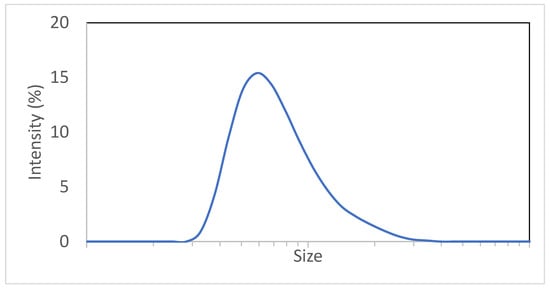
Figure 5.
Typical adjuvant particle size distribution.
2.2.5. IT-OT Architecture
The digital twin is the combination of many different components that, once connected, allow the data to flow from the physical lab (point a in Figure 6), through the various automation and IT systems (point b1 and b2), to the models or digital replica of the process (point c) and in the opposite direction to reach the physical lab with control actions on the process (point d1 and d2).
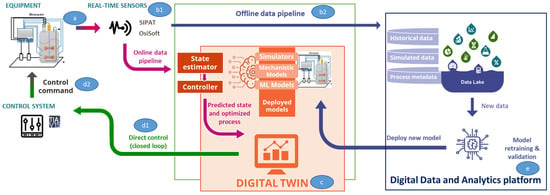
Figure 6.
Digital twin data flow and the different components involved. a: equipment; b1: real-time sensors; b2: offline data pipeline; c: digital twin; d1: direct control; d2: control commands; e: digital data and analytics platform.
Lab Floor
- Lab equipment
- Programmable logic controllers (PLCs): ruggedized industrial computer used to perform control actions on the lab process
- I/O sensors: devices connected to the equipment that detect events or changes and send the information to the data historian
- PAT sensors: PAT capable of measuring in real-time raw materials, intermediates, and products, providing insights on how process variables affect chemistry, bioprocess, or particle-based systems
IT and Automation Systems
- Open platform communication (OPC) server: it allows communication to automation controllers, I/O sensors, and field devices
- Data historian: automation software that records process data in a time-series fashion. In our context, it is used to record equipment and I/O sensors data, as well as ML models predictions and control actions
- PAT software: controls PAT sensors, calibrating them and managing alarms, collects raw data measured by PATs, runs/integrates with statistical and/or physical models to calculate a multivariate quantitative or qualitative representation of the process operation or the products quality attributes, interprets statistical results and exchanges data with the OT data streaming platform
- OT data streaming platform: provides near-real-time data transmission, ingestion and processing within the OT network. It serves as a single point of connection for the different data producers (i.e., data historian, PAT software, etc.) and data consumers (i.e., ML models) and transforms data to match a defined logical data model, minimizing the impact of changes in one system to others. As a result, the digital twin becomes agnostic of the underlying technological components and horizontal, simplifying its application to other labs
- Data pipelines: from the lab to the models to the data lake, through the data streaming platform, both in an online fashion for process monitoring and control and in an offline fashion, for user training and process simulation
Digital Equivalent of the Physical Process
- ML models: State estimator model combined with control models establish the behavior of the physical process which can be solved in real-time
- Docker container: where the models are deployed for process monitoring and control
Closed Loop Systems
- OPC server: see point IT and automation systems above
- Control system: acts on the physical process and implements the identified control actions
- Monitoring and control user interface: shows, in near-real time, the process performances and the control actions
On Edge Cloud Platform
- Data lake: where the process data, predictions and control actions are stored and made available to the end users for further analysis, process simulation and end-user training
- Model versioning and retraining [24]
- Simulation user interface: allows the end users to execute the digital twin models offline and to perform in silico experimentation
2.2.6. User Interface
Online user interface corresponds to the interface that is connected to the physical process in the lab through OsiPi. This interface displays real-time values that are captured (for example: size of the adjuvant particles).
3. Results
3.1. Digital Twin Proof of Concept Run
The digital twin was used as a proof of concept where an external perturbation was introduced in the process. The real-time measurements of critical process parameters, i.e., the flow rate of aqueous phase (panels D and H), flow rate of organic phase (panels C and G) and temperature (panels B and F) and critical quality attribute, i.e., predicted size of adjuvant particles (panels A and E) are plotted in Figure 7. To test the system behavior, the temperature was perturbed (~10%), and we captured the changes in process parameters in control-enabled and control-disabled conditions.
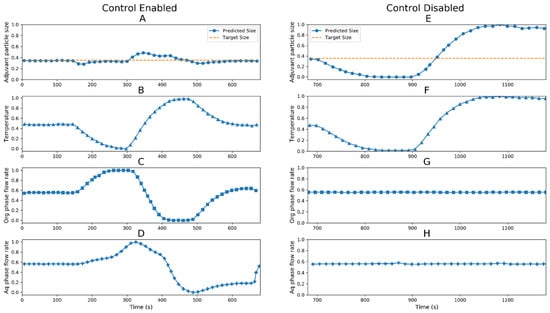
Figure 7.
Normalized values of process parameters and quality attributes for digital twin control enabled (left panels) and control disabled case (right panels). Critical quality attribute: adjuvant particle size (●); panel (A) (control enabled) and panel (E) (control disabled), critical process parameters: temperature (▲); panel (B) (control enabled) and panel (F) (control disabled), organic phase flow rate (■); panel (C) (control enabled) and panel (G) (control disabled) and aqueous phase flow rate (✚); panel (D) (control enabled) and panel (H) (control disabled).
The control-enabled condition considered that the digital twin was estimating the state of the system, predicting the size of the adjuvant particles regardless of the adjuvant particle composition, comparing it with the target size in normal operating ranges, calculating new operating process parameters (flow rates of aqueous and organic phases) if required and transmitting the new calculated set points to the system to maintain the adjuvant particle size within target size. The control-disabled condition considered that the digital twin estimated the state of the system and predicted/monitored the size of the adjuvant, but no control action was taken to curb the perturbation.
The temperature perturbation was introduced at 150 s; the state estimator model estimated the new size of the adjuvant particles based on the inputs and compared with the normal range. As the particle size started to deviate from desired values, the digital twin calculated new flow rates for aqueous and organic phases to bring the deviated adjuvant particle size within the acceptable range. The control actions helped to maintain the critical quality attribute within specifications.
The control disabled model showed that since there were no controls in place, during temperature perturbation, the flow rates of aqueous and organic phases were kept constant. This led to an excessive increase/decrease in the size of the adjuvant particles. In the control-disabled case, the important critical quality attribute was not maintained in the desired range. These observations were validated by taking samples during this test and the actual sizes of adjuvant particles were measured offline.
3.2. Digital Twin Engineering Run
The digital twin was tested during an engineering run (small scale) in a good manufacturing practice (GMP) facility, and Figure 8 represents the data. Temperatures of aqueous and organic phases were measured along with organic and aqueous flow ratio. The plots represent the normalized values of temperatures and total flow rate of aqueous and organic phases over the period of 6 min (we normalized parameters for better representation; normalization was performed based on the lowest and highest value of the same parameter) at the beginning of the operation. Therefore, it is demonstrated how the digital twin would have acted to take the process at its defined steady state. The ratio of aqueous and organic phase was maintained constant and the twin predicted the size of the adjuvant particles. The size of the particles was kept at the target. At each time point, the state estimator model calculated the size of the particles based on the temperature and the flow rates of the two phases. The predicted size was compared with the target size and the twin further suggested an action for the total flow rate. The twin proposed an action for the total flow rate since the model was maintaining a constant flow ratio of aqueous and organic phases. The twin was not connected with the control system in this case; hence, it was not directly implementing the control action but suggesting an operator to take one.
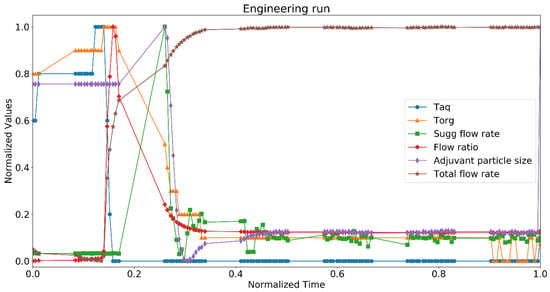
Figure 8.
Normalized values of process parameters and quality attributes for digital twin in engineering run at GMP facility. Critical quality attribute: adjuvant particle size, critical process parameters: aqueous phase temperature (Taq), organic phase temperature (Torg), suggested flow rate (Sugg flow rate), flow ratio, and total flow rate.
At the beginning of the run, there were slight variations in the temperatures, and the pumps took a minute to stabilize the flow rates. As the pumps were acting on the set points of the flow rates for the aqueous and organic phases, the flow ratio increased momentarily (between 0.15 and 0.3 normalized time) and the predicted size increased. The state estimator model predicted an increase in the suggested flow rate to curb this deviation. As the flow rates attained their desired set points, the predicted size decreased. There was a slight variation in the temperatures, which further impacted the predicted size. The system reached a steady state at around 0.4 normalized time, and there were rarely any deviations in the process parameters and critical quality attribute. Hence, the suggested flow rate remained constant throughout the rest of the run.
4. Discussion
We developed and implemented a digital twin for the manufacturing of adjuvant particles. The twin was tested in a lab set up with control-enabled and -disabled conditions. We later implemented the twin in a GMP production environment and performed an engineering run. To our knowledge, the implemented case study represents the first published application showing how to build a real digital twin for a biopharmaceutical process step and its transfer to a GMP environment. The process of development and implementation was helpful to understand the key challenges of developing such a twin in a development and GMP environment.
Experimental data were not widely available due to the limited raw materials. Additionally, the number of process variables made the description of the experimental space especially difficult. The lack of a reliable particle size and content measurement in-line forced the measurements to take place offline. Therefore, we have relied on offline DLS and HPLC measurements to construct our models. We work with the assumption that the process is scalable. Additional experiments carried out during development showed that working at small or large scale does not significantly impact the product attributes (particle size, polydispersity and content).
As demonstrated in the present work, there are considerable advantages for control strategies relying on digital twins and ML. The regulatory framework and guidance related to such process modeling and control schemes are limited, including ICH Q8/Q9/Q10 Q&As Points to Consider and ICH Q13. While the scientific literature around model-based and predictive controls is becoming quite abundant in relation to pharmaceutical applications [25,26], there is no specific reference to artificial intelligence (AI)/ML in pharmaceutical manufacturing regulation and guidance, and while integration into direct process control clearly meets the criteria of a high-impact model, there are unique aspects related to GMP (e.g., model validation, model change management) and regulatory submission (e.g., requisite filing information, post-marketing change reporting) that are currently unaddressed. While some regulators have begun to address aspects of AI/ML, these were only tangentially tied to pharmaceutical manufacturing or were only applicable to specific regions. Several industry positions directly address AI model validation and the maintenance of models in the post-marketing phase; however, it is unclear whether regulators will fully embrace these considerations or whether such approaches will be readily harmonized with existing regional frameworks [27,28]. Regulators are clearly focused on facilitating the development and deployment of advanced pharmaceutical manufacturing technology, especially given the challenges encountered during the COVID-19 pandemic. The recently published PDUFA VII bill in the US directly addresses advanced manufacturing technology and tasks the FDA with the organization of public workshops and the development of guidance [29]. The EMA has recently solicited feedback on the development of the Quality Innovation Group (QIG); advanced manufacturing technology, such as digital twins and AI/ML-based process control models, appear to be clearly within its remit [30]. An ongoing dialogue with regulators will be critical to realizing the potential of this advanced manufacturing technology while assuring a suitable level of regulatory oversight and assurance of quality [31,32].
5. Conclusions
Adjuvants are added to vaccine drug products to increase the efficacy of the vaccines and optimize the amount of antigen needed per dosage. Here, we developed a digital twin for the adjuvant manufacturing process. The digital twin is based on a hybrid model that estimates the current state of the process and predicts any control action needed to maintain product critical quality attributes. The PAT models acted as the eyes of the process and helped us to continuously monitor the process performance. The surrounding IT/OT structure helped us to deliver automated control responses to the feedback loop. We demonstrated that the digital twin is capable of taking control actions in case of any perturbations. We also tested the twin performance without a control mode in a GMP environment where the twin suggested the control actions to maintain critical quality attributes in desired ranges.
Author Contributions
Conceptualization, P.J., A.K.-G., P.M.S., L.V., M.B. and S.D.; Methodology, A.K.-G. and T.P.; Formal Analysis, P.P., E.T., P.J., A.K.-G., P.M.S., B.S., T.P. and L.S.; Data Curation, P.P., P.J., P.M.S. and M.B.; Writing—Original Draft Preparation, P.P., E.T., A.K.-G., L.V., B.S. and T.P.; Writing—Review and Editing, P.P., E.T., P.J., A.K.-G., P.M.S., M.B., B.S., T.P., L.S. and S.D. All authors have read and agreed to the published version of the manuscript.
Funding
The proof of concept was performed in collaboration between GlaxoSmithKline Biologicals SA, Atos, and Siemens, which was finished in February 2019. Since March 2019, GlaxoSmithKline Biologicals SA has been the only sponsor of the work and contracted Siemens to provide automation and PAT integration services. GlaxoSmithKline Biologicals SA also covered all costs associated with the development and publication of the present manuscript.
Data Availability Statement
Not applicable.
Conflicts of Interest
All authors are or were employees of the GSK group of companies at the time of the study and declare free resources from Siemens and Atos to complete the proof of concept. A.K., B.S. and L.V. hold shares in the GSK group of companies.
References
- Sniderman, B.; Mahto, M.; Cotteleer, M. Industry 4.0 and manufacturing ecosystems: Exploring the world of connected enterprises. Deloitte Consult. 2016, 1, 3–14. [Google Scholar]
- Tao, F.; Qi, Q.; Liu, A.; Kusiak, A. Data-driven smart manufacturing. J. Manuf. Syst. 2018, 48, 157–169. [Google Scholar] [CrossRef]
- O’Donovan, P.; Leahy, K.; Bruton, K.; O’Sullivan, D.T. An industrial big data pipeline for data-driven analytics maintenance applications in large-scale smart manufacturing facilities. J. Big Data 2015, 2, 25. [Google Scholar] [CrossRef]
- Lee, J.; Lapira, E.; Yang, S.; Kao, A. Predictive manufacturing system-Trends of next-generation production systems. Ifac Proc. Vol. 2013, 46, 150–156. [Google Scholar] [CrossRef]
- Litster, J.; Bogle, I.D.L. Smart process manufacturing for formulated products. Engineering 2019, 5, 1003–1009. [Google Scholar] [CrossRef]
- Rosen, R.; Von Wichert, G.; Lo, G.; Bettenhausen, K.D. About the importance of autonomy and digital twins for the future of manufacturing. Ifac-Papersonline 2015, 48, 567–572. [Google Scholar] [CrossRef]
- Haag, S.; Anderl, R. Digital twin–Proof of concept. Manuf. Lett. 2018, 15, 64–66. [Google Scholar] [CrossRef]
- Portela, R.; Varsakelis, C.; Richelle, A.; Giannelos, N.; Pence, J.; Dessoy, S.; von Stosch, M. When is an in silico representation a digital twin? A biopharmaceutical industry approach to the digital twin concept. In Digital Twins. Advances in Biochemical Engineering/Biotechnology; Herwig, C., Pörtner, R., Möller, J., Eds.; Springer: Cham, Switzerland, 2020; Volume 176, pp. 35–55. [Google Scholar] [CrossRef]
- Tao, F.; Cheng, J.; Qi, Q.; Zhang, M.; Zhang, H.; Sui, F. Digital twin-driven product design, manufacturing and service with big data. Int. J. Adv. Manuf. Technol. 2018, 94, 3563–3576. [Google Scholar] [CrossRef]
- Shao, G.; Helu, M. Framework for a Digital Twin in Manufacturing: Scope and Requirements. Manuf. Lett. 2020, 24, 105–107. [Google Scholar] [CrossRef]
- Zobel-Roos, S.; Schmidt, A.; Mestmäcker, F.; Mouellef, M.; Huter, M.; Uhlenbrock, L.; Kornecki, M.; Lohmann, L.; Ditz, R.; Strube, J. Accelerating Biologics Manufacturing by Modeling or: Is Approval under the QbD and PAT Approaches Demanded by Authorities Acceptable without a Digital-Twin? Processes 2019, 7, 94. [Google Scholar] [CrossRef]
- Chen, Y.; Yang, O.; Sampat, C.; Bhalode, P.; Ramachandran, R.; Ierapetritou, M. Digital twins in pharmaceutical and biopharmaceutical manufacturing: A literature review. Processes 2020, 8, 1088. [Google Scholar] [CrossRef]
- Krippl, M.; Kargl, T.; Duerkop, M.; Dürauer, A. Hybrid modeling reduces experimental effort to predict performance of serial and parallel single-pass tangential flow filtration. Sep. Purif. Technol. 2021, 276, 119277. [Google Scholar] [CrossRef]
- Möller, J.; Kuchemüller, K.B.; Steinmetz, T.; Koopmann, K.S.; Pörtner, R. Model-assisted design of experiments as a concept for knowledge-based bioprocess development. Bioprocess Biosyst. Eng. 2019, 42, 867–882. [Google Scholar] [CrossRef]
- Baur, D.; Angelo, J.; Chollangi, S.; Muller-Spath, T.; Xu, X.; Ghose, S.; Li, Z.J.; Morbidelli, M. Model-assisted process characterization and validation for a continuous two-column protein A capture process. Biotechnol. Bioeng. 2019, 116, 87–98. [Google Scholar] [CrossRef]
- Mouellef, M.; Vetter, F.L.; Zobel-Roos, S.; Strube, J.J.P. Fast and versatile chromatography process design and operation optimization with the aid of artificial intelligence. Processes 2021, 9, 2121. [Google Scholar] [CrossRef]
- Gerogiorgis, D.I.; Castro-Rodriguez, D. A Digital Twin for Process Optimisation in Pharmaceutical Manufacturing. In Computer Aided Chemical Engineering; Elsevier: Amsterdam, The Netherlands, 2021; Volume 50, pp. 253–258. [Google Scholar]
- Davidopoulou, C.; Ouranidis, A.J.P. Pharma 4.0-Artificially Intelligent Digital Twins for Solidified Nanosuspensions. Pharmaceutics 2022, 14, 2113. [Google Scholar] [CrossRef]
- Bhalode, P.; Chen, Y.; Ierapetritou, M. Hybrid Modelling Strategies for Continuous Pharmaceutical Manufacturing within Digital Twin Framework. In Computer Aided Chemical Engineering; Elsevier: Amsterdam, The Netherlands, 2022; Volume 49, pp. 2125–2130. [Google Scholar]
- Sokolov, M.; von Stosch, M.; Narayanan, H.; Feidl, F.; Butté, A. Hybrid modeling—A key enabler towards realizing digital twins in biopharma? Curr. Opin. Chem. Eng. 2021, 34, 100715. [Google Scholar] [CrossRef]
- Klepzig, L.S.; Juckers, A.; Knerr, P.; Harms, F.; Strube, J.J.P. Digital twin for lyophilization by process modeling in manufacturing of biologics. Processes 2020, 8, 1325. [Google Scholar] [CrossRef]
- Schmidt, A.; Helgers, H.; Vetter, F.L.; Juckers, A.; Strube, J. Digital Twin of mRNA-Based SARS-COVID-19 Vaccine Manufacturing towards Autonomous Operation for Improvements in Speed, Scale, Robustness, Flexibility and Real-Time Release Testing. Processes 2021, 9, 748. [Google Scholar] [CrossRef]
- Di Pasquale, A.; Preiss, S.; Tavares Da Silva, F.; Garcon, N. Vaccine Adjuvants: From 1920 to 2015 and Beyond. Vaccines 2015, 3, 320–343. [Google Scholar] [CrossRef]
- Canzani, E.; Timmer, S. Beyond building predictive models: TwinOps in biomanufacturing. TechRxiv 2021. preprint. [Google Scholar]
- Alber, M.; Buganza Tepole, A.; Cannon, W.R.; De, S.; Dura-Bernal, S.; Garikipati, K.; Karniadakis, G.; Lytton, W.W.; Perdikaris, P.; Petzold, L. Integrating machine learning and multiscale modeling—Perspectives, challenges, and opportunities in the biological, biomedical, and behavioral sciences. NPJ Digit. Med. 2019, 2, 115. [Google Scholar] [CrossRef]
- Peng, G.C.; Alber, M.; Buganza Tepole, A.; Cannon, W.R.; De, S.; Dura-Bernal, S.; Garikipati, K.; Karniadakis, G.; Lytton, W.W.; Perdikaris, P. Multiscale modeling meets machine learning: What can we learn? Arch. Comput. Methods Eng. 2021, 28, 1017–1037. [Google Scholar] [CrossRef] [PubMed]
- Doddridge, G.; Doherty, S.; Shi, Z.; Huang, T.-K.; Cauchon, N.; Wang, T.; Wisniak, O.; Hutchens, C.; Lequeux, I. Industry Proposal: Regulatory Submission and Lifecycle Management Strategy of Models Used in the Manufacture of Pharmaceuticals and Biological Products. Biophorum 2021, 2021. [Google Scholar] [CrossRef]
- Erdmann, N.; Blumenthal, R.; Baumann, I.; Kaufmann, M. AI Maturity Model for GxP Application: A Foundation for AI Validation. ISPE 2022, 2022. [Google Scholar]
- Food and Drug Amendments of 2022. 2022. Available online: https://republicans-energycommerce.house.gov/wp-content/uploads/2022/05/UFAs-reauth_01_xml.pdf (accessed on 1 June 2022).
- Pardoe, D.; Stone, P. Boosting for regression transfer. In Proceedings of the 27th International Conference on International Conference on Machine Learning Committee for Medicinal Products for Human Use (CHMP), London, UK, 19–22 July 2010; pp. 863–870. Available online: https://www.ema.europa.eu/en/documents/minutes/chmp-prom-minutes-meeting-6-december-2021_en.pdf (accessed on 1 June 2022).
- Artificial Intelligence/Machine Learning (AI/ML)-Based Software as a Medical Device (SaMD) Action Plan. Available online: https://www.fda.gov/media/145022/download (accessed on 1 June 2022).
- Danish Medicines Agency, Questions to Critical GxP AIML Applications Based on Static AIML Algorithms and Supervised Learning V.0.9.4. 2021. Available online: https://laegemiddelstyrelsen.dk/en/licensing/supervision-and-inspection/inspection-of-authorised-pharmaceutical-companies/using-aiml-algorithms-in-gxp/~/media/B02C888935984271BF61BD756ADDAB6B.ashx (accessed on 1 June 2022).
Disclaimer/Publisher’s Note: The statements, opinions and data contained in all publications are solely those of the individual author(s) and contributor(s) and not of MDPI and/or the editor(s). MDPI and/or the editor(s) disclaim responsibility for any injury to people or property resulting from any ideas, methods, instructions or products referred to in the content. |
© 2023 by the authors. Licensee MDPI, Basel, Switzerland. This article is an open access article distributed under the terms and conditions of the Creative Commons Attribution (CC BY) license (https://creativecommons.org/licenses/by/4.0/).
