Article

The Use of Response Surface Methodology to Optimize Assisted Extraction of Bioactive Compounds from Cucurbita maxima Fruit By-Products

1
Laboratory of Aromatic and Medicinal Plant, Center of Biotechnology Borj Cedria, BP 901, Hammam Lif 2050, Tunisia
2
Mountain Research Center (CIMO), Polytechnic Institute of Bragança, Campus de Santa Apolónia, 5300-253 Bragança, Portugal
3
Associate Laboratory for Sustainability and Technology in Mountains Regions (SusTEC), Polytechnic Institute of Bragança, Campus de Santa Apolónia, 5300-253 Bragança, Portugal
4
Department of Agriculture, Crop Production and Rural Environment, University of Thessaly, Fytokou Street, 38446 Volos, Greece
5
High Agronomic Institute of ChottMariem, BP 47, Chott Mériem Sousse 4042, Tunisia
*
Authors to whom correspondence should be addressed.
Processes 2023, 11(6), 1726; https://doi.org/10.3390/pr11061726
Submission received: 18 April 2023 / Revised: 25 May 2023 / Accepted: 31 May 2023 / Published: 5 June 2023

Abstract

:
This work aimed to optimize the extraction conditions of bioactive compounds obtained from three squash by-products (e.g., peel, endocarp, and seeds) using the response surface methodology (RSM). The selected independent variables were ethanol concentration, extraction time, and extraction temperature. Squash by-products’ bioactive molecules were extracted according to the matrix proposed by the experimental plan. Significant variability in total phenolic compound content (TPC) and antioxidant activity, depending on the extraction time, the solvent concentration, and the extraction temperature, was recorded for the tested by-products. The experimental results adequately fitted with second-order polynomial models and showed significant linear, quadratic, and interaction effects of the independent variables. Data analysis suggested that the optimal extraction conditions were 12.2% ethanol for 11.2 min at 55 °C for peels; 28.5% ethanol for 10.5 min at 37 °C for endocarp; and 20% ethanol for 10.5 min at 60 °C for seeds. The results obtained showed that the experimental and predicted values of TPC and antioxidant activities as an indicator of a successful extraction fit with each other, thus indicating the optimal extraction conditions. Under these conditions, the obtained extracts exhibited high, although variable, TPC with epicatechin and epigallocatechin as major compounds, as well significant antimicrobial potency, which reached 100% and 80% inhibition of the tested bacteria and fungi.

1. Introduction

Fruit and vegetable processing industries create enormous amounts of under-utilized by-products with an inordinate economic potential and high environmental burden [1]. Processing by-products account for 25% up to 60% of the weight of the fruit and principally consist of skin (peels) and lower percentages of pulp and seeds. All of these fractions present a remarkable chemical composition and, therefore, could be considered as raw ingredients for the development of integrated biorefinery methodologies and as sources of natural bioactive agents. Subsequently, the need to obtain nutritious foods from new sources and lower waste in industry has created a great interest in studying different parts of plants that are presently considered waste as opposed to being appreciated as by-products with high nutritional value and great potential use in human diets. Squash seeds, peel, and endocarp are commonly considered as waste during processing. However, they possess a high content of polyphenols and fatty and amino acids, which, when valorized as a by-product or ingredient, can transfer high added value to food products while reducing waste and losses for manufacturers [2].
Cucurbita maxima, commonly known as squash, belongs to the Cucurbitaceae family and is an annual, herbaceous plant, which can adapt to different agroecological conditions [3]. Squash is a species with a great agronomic potential use worldwide thanks to its attractive color, low-cost production, nutritional potential, and functional properties for food application [4,5]. It is also a useful vegetable with an identical position among other vegetables, thanks to its peel, flesh, and seeds, each possessing outstanding bioactive compounds that can be applicable in the treatment and prevention of health disorders [6,7]. On the other hand, fruit by-products (such as peels, seeds, and endocarp) generated from the squash industry represent an interesting source for transforming industrial waste into renewable energy. Therefore, eliminating this by-product could help reduce the environmental burden within the context of sustainable development and the circular economy [8]. Thus, many uses of squash by-products have been suggested so far. For example, de Escalada Pla et al. [9] revealed that fiber fractions could be used as food, cosmetic, and pharmaceutical ingredients for nutritional and technological applications, while valorizing squash waste at the same time. Moreover, Genevois et al. [10] reported that squash by-products could be used as a growth substrate and support Lactobacillus casei (ATCC393) in beverages with high consumers’ acceptability. A study conducted by Pająk et al. [11] showed that squash by-products represent an excellent source of carotenoid pigments, while they also contain significant levels of starch (60% of starch on a dry matter basis).
On the other hand, seeds are already consumed both toasted and salted because they exhibit numerous beneficial effects to human health thanks to their macro- and micronutrient content. They are also a natural source of phytosterols and antioxidant compounds such as tocopherols and carotenoids and present an excellent source of unsaturated fatty acids such as oleic and linoleic acids [12]. The oil extracted from seeds is currently used as salad seasoning because of its characteristic aroma and flavor, while dried seeds can be used as a thickener for soups or as snacks [13]. Seeds can be considered as a natural functional food thanks to their high content of bioactive molecules, which have been associated with antiparasitic, anthelmintic, vermifuge, and tenifuge activities [14]. Moreover, squash peels are considered to be rich in antioxidants by Daiuto et al. [15], who detected high levels of ascorbic acid and tocopherols. Moreover, Kim et al. [16] determined an appreciable content of carotenoids in the peels of three Cucurbitaceae species (C. pepo, C. moschata, and C. maxima) and suggested that β-carotene contents in peels were 5–15 times higher than in the flesh. Moreover, the genotype is also important for the bioactive compound profile of plant-derived tissues because, according to Kulczyński et al. [17], a significant variability was recorded in the antioxidant potential of fruit pulp of different pumpkin cultivars.
In terms of food technology applications, researchers made bread from peel flour in order to partially replace wheat flour, and the use of squash flour increased the total protein content in the final product [18]. A study conducted by Bochnak and Świeca [19] indicated that squash powder is a good source of potentially bioaccessible phenolic compounds and antioxidants. Indeed, different parts of squash are rich sources of biologically active compounds such as phenolic compounds, flavonoids, flavones, tocopherols, and tocotrienols [20]. Squash flour also exhibits high total antioxidant activity [21] and possesses anti-hypertensive properties [22]. Vitamin E (tocopherol), which is a potent antioxidant, can also be found in high contents in squash seeds. In the same manner, endocarp from squash is a very interesting by-product, despite being the most ignored and underutilized [6].
However, in order to obtain the highest bioactive potential, the choice of the appropriate extraction method is extremely important, as it should take into consideration several parameters such as the extraction yield and duration of the protocol, safety issues, the production cost, the complexity, as well as the sustainability of the methods [23]. Currently, new sustainable extraction techniques, also known as “green and innovative”, are being studied. Considering the current trend to obtain extracts with higher contents in bioactive components and with greater efficiency, the processing time, using lower temperatures and smaller amounts of solvent, could be reduced, thus resulting in products with a minimum degree of degradation [24]. For this purpose, ethanol can be used as an extraction solvent to reduce the environmental and toxicological impacts, as it is renewable, formed by biotechnological processes, and is a nontoxic solvent [25]. Indeed, the efficiency of an extraction process is influenced by many factors including the solvent composition, the extraction temperature, the extraction time, and the solvent to solid ratio [26].
Response surface methodology (RSM) is a useful tool for optimizing chemical processes; it is an efficient mathematical and statistical technique for analyzing empirical models that describe the effect of independent variables and their interactions on response variables [27]. This methodology is employed as an alternative process to reduce the challenges of traditional experimentation as well as to evaluate the effects of multiple variables and their interactions [28]. Optimizing factorial variable settings where a response reaches a specified maximum or minimum value is part of the RSM. On the other hand, factorial methods are effectively expanded for more in-depth modeling of the effects, but they still serve to model the response. RSM is based on the findings of factorial studies as well as extra treatments applied both within and outside of the factorial space (center point and star points). This kind of structure is referred to as a central composite design. Multiple regression analysis yields the upgraded model, and the response surface may be shown using the corresponding equation. Moreover, plots indicate locations where a reaction exhibits the same magnitude as well as the factors’ optimal levels [29]. According to Sendi et al. [23], RSM can improve existing extraction processes and enable new commercial extraction opportunities and processes. Compared with maceration and Soxhlet extraction, RSM has been proved to be an effective and reasonable method with low toxicity and high reproducibility [23]. In this respect, RSM has been successfully used so far to optimize the extraction of phenolic compounds from many plant matrices [30,31,32,33,34].
In the present study, RSM was adopted to identify the most favorable conditions for the extraction of squash by-products. The studied by-products were C. maxima seeds, peel, and endocarp. An investigation plan defining the number of experiments to be performed was established. The independent factors and their levels were selected based on a preliminary study of the extraction variables, and the fixed responses were total phenolic compounds content (TPC) and antiradical capacity based on the DDPH assay.

2. Materials and Methods

2.1. Chemicals and Reagents
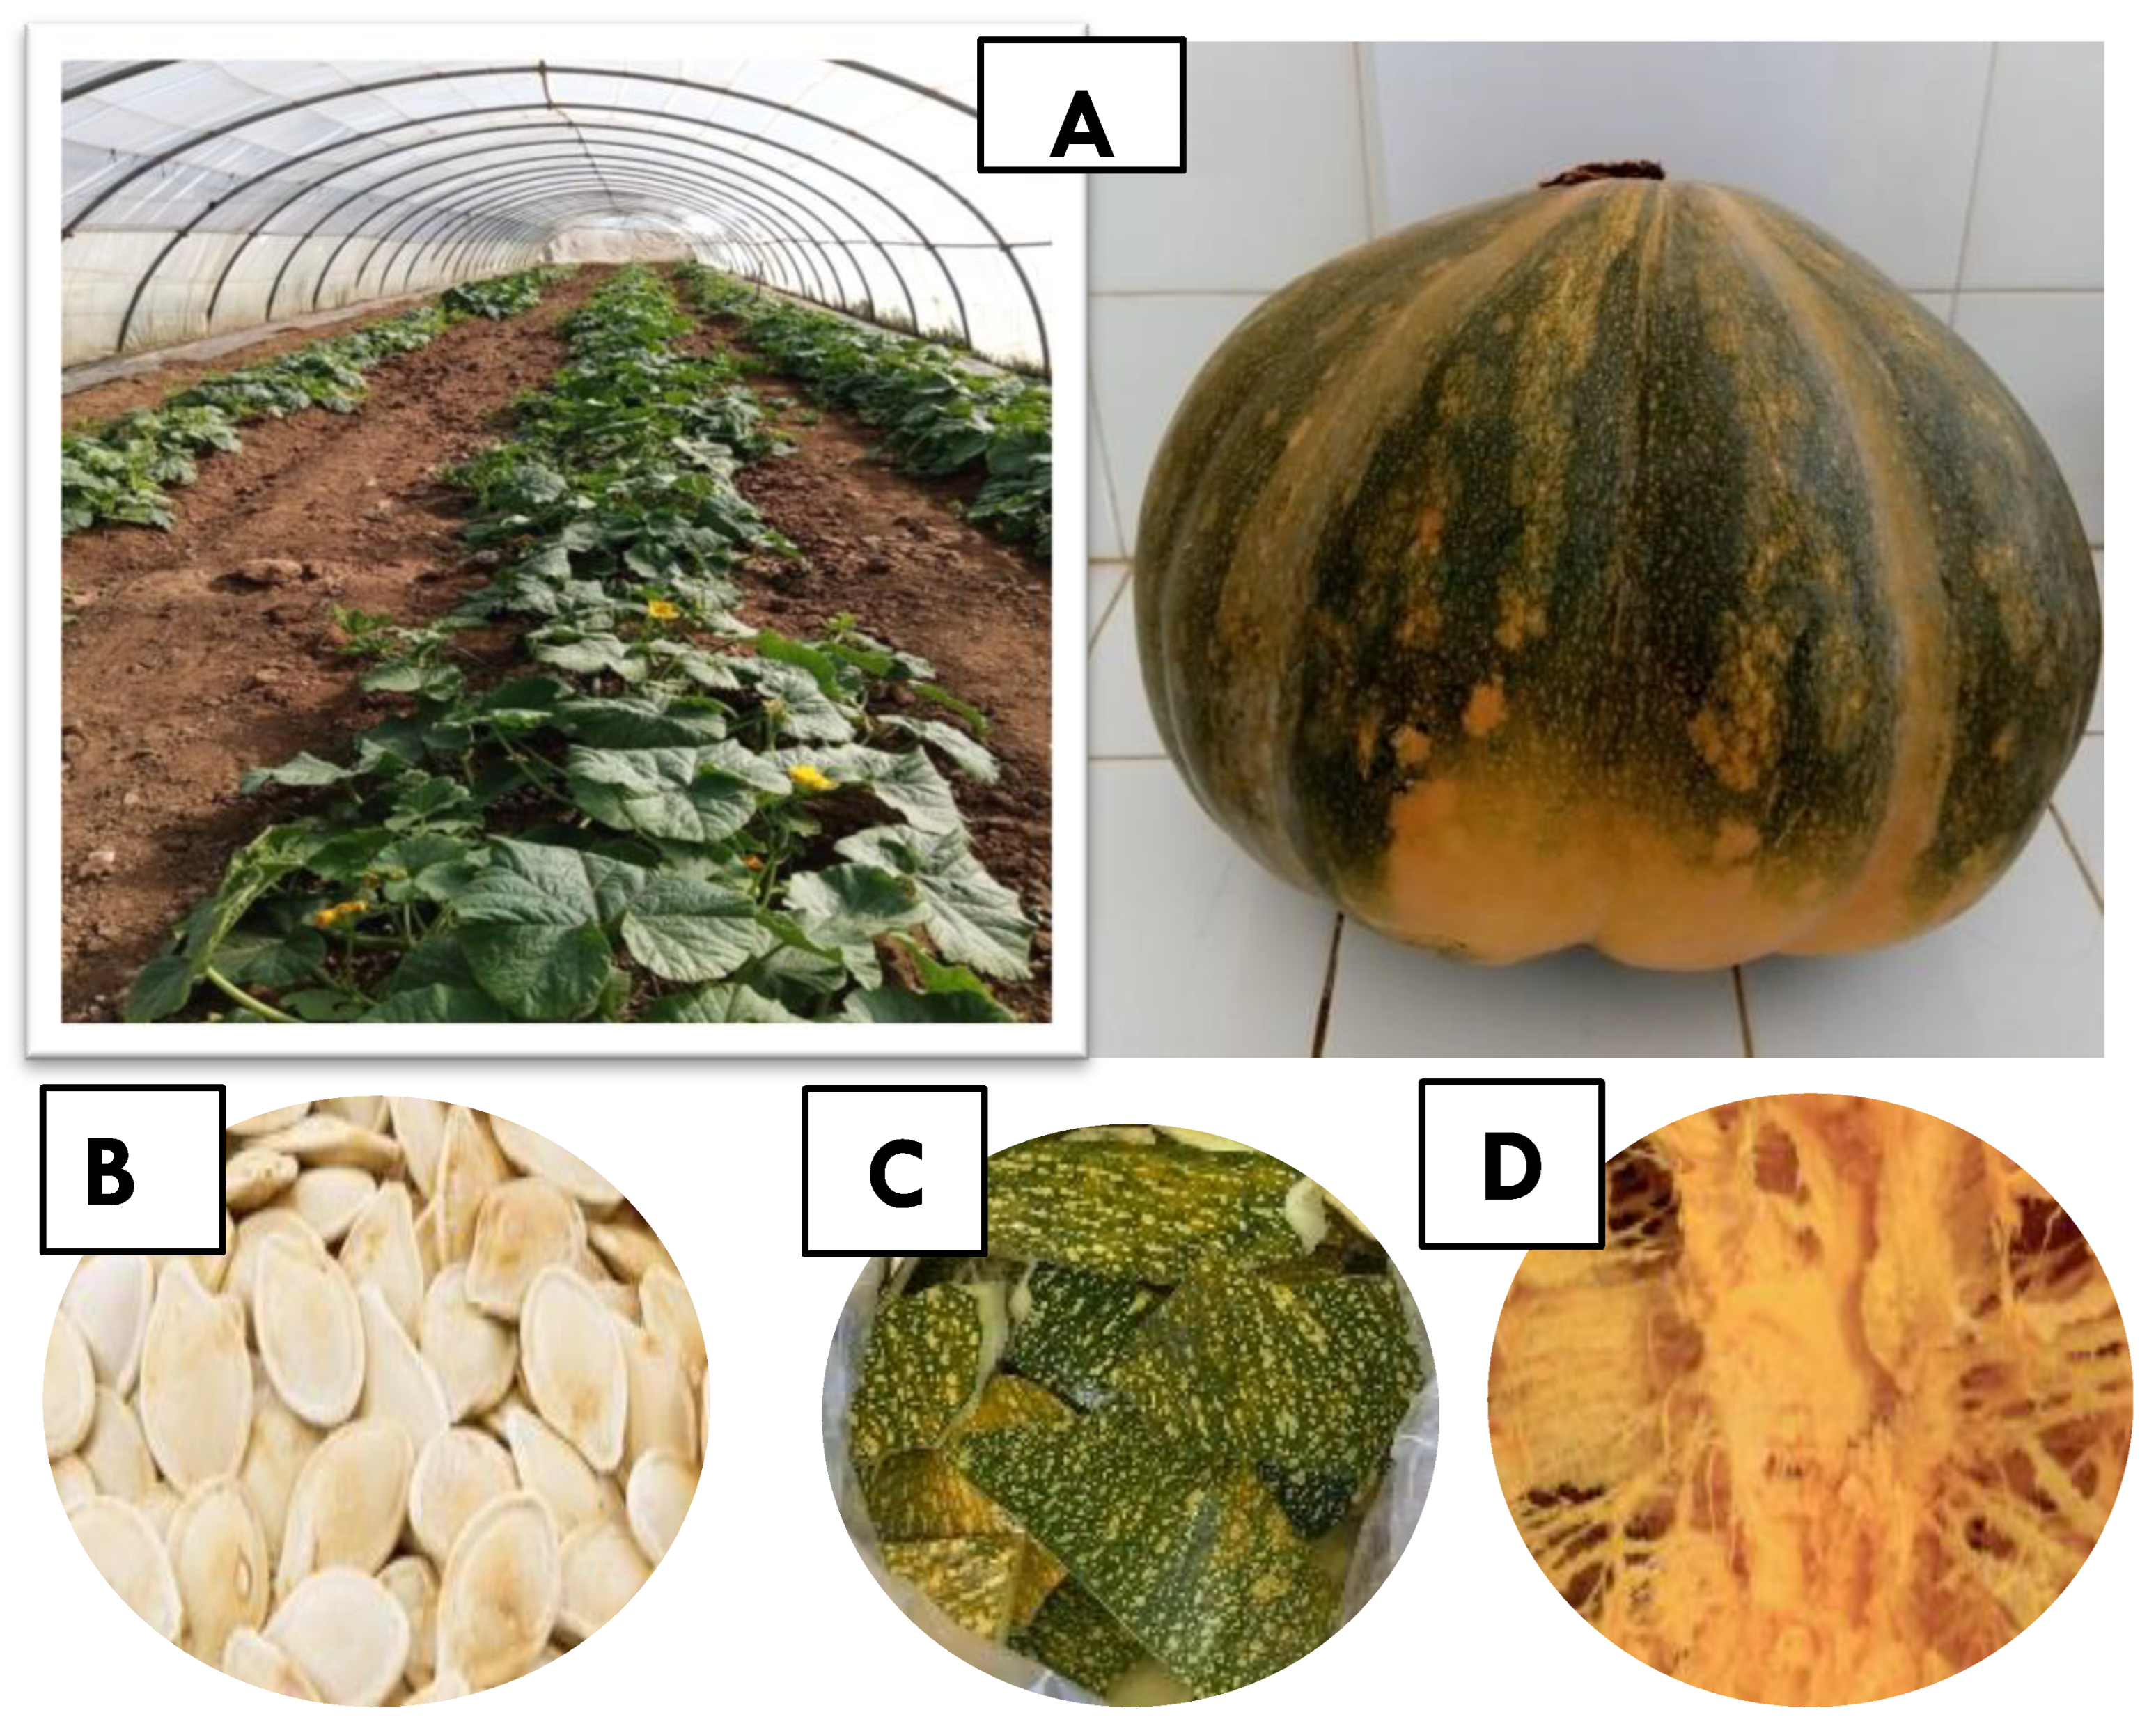
Gallic and formic acid were purchased from Fluka (99.8 and 98% purity Buchs, Switzerland). HPLC pure standards were purchased from Sigma (St. Louis, MO, USA). DPPH (2,2-diphenyl-1-picrylhydrazyl) and Folin–Ciocalteu and sodium carbonate reagents were purchased from Sigma-Aldrich (São Paulo, Brazil). Ultrapure water was prepared with the Millipore system (Billerica, MA, USA). Ethanol and methanol were obtained from Loba Chemie Pvt. (97% purity). Mueller–Hinton broth and Sabouraud broth were purchased from BIOKAR Diagnostics (Allonne, France).

2.2. Plant Sampling

Fruit of Tunisian squash landraces or Cucurbita maxima Duch. of ‘Batati’ genotype were generously procured from the Higher Agronomic Institute Chott-Mariem (ISA-CM) at the end of the summer season (Figure 1). An inventory number of NGBTUN 746 was assigned for this landrace according to the National Gene Bank of Tunisia database. Fruits of the landrace NGB 746 were issued from self-pollination applied in each plant mother and marked until the physiological maturity for harvesting and seed extraction. The fruits used were harvested at the same ripeness stage based on the squash descriptor of UPOV (2015). Six fruits from three different specimens were prepared by meticulously separating the by-products from the pulp. The obtained by-products were divided into peels (thickness of around 150 mm), endocarp, and seeds and washed thoroughly with distilled water (Figure 1). All samples were frozen at −20 °C, then lyophilized (Christ Martin™ Lyophilisateur Alpha 1–4 Ldplus NU, Osterode, Germany), and finally ground to a fine powder and stored at −20 °C until further extraction.

2.3. Extraction Protocols

2.3.1. Conventional High-Energy Ultrasonic-Assisted Extraction

The conventional high-energy extraction included the combination of maceration with ultrasonication, according to the slightly modified methodology previously described by Sendi et al. [23]. Firstly, 3 g of powdered sample was extracted with 70 mL of hydroethanolic solution (ethanol/water, 80:20) at ambient temperature with magnetic stirring over 60 min. The ultrasound-assisted extraction (UAE) was performed using an ultrasonic bath (Model: Power Sonic 405, Hwashin Technology Co., Yeongcheon-si, Republic of Korea) with a capacity of 5.7 L at 200 W and 80 kHz. The obtained extracts were centrifuged at 9000× g for 15 min at 4 °C. Finally, the supernatants were vacuum-evaporated (Hei-VAP Advantage, Heidolph Instruments GmbH, Schwabach, Germany) at 45 °C for ethanol removal, while the residual water was lyophilized (Christ Martin™ Lyophilisateur Alpha 1–4 Ldplus NU, Germany) to dryness for subsequent analysis.

2.3.2. Low-Energy Extraction Modeling and Optimization Using RSM

The response surface methodology (RSM) was adopted in order to determine the optimum conditions of extraction time (X1 expressed in min), ethanol concentration (X2 expressed in % or v/v), and extraction temperature (X3 expressed in °C) leading to extracts with a maximum content of total phenolic compounds (YTPC) and the highest possible antioxidant capacity (YIP50) from squash by-products (peels, seeds, and endocarp). The experiments were performed based on the Box–Behnken design (BBD). Table 1 details the coded values of the experimental factors and their levels for the Box–Behnken design. The complete design was carried out randomly and comprised 17 combinations including 5 replicates at the central point (Table 1). To define the optimum conditions, it was necessary for the polynomial function to contain quadratic terms.

2.3.3. Screening Test of Factors and Level Range for Phenolic and Antiradical Compound Extraction

Primary selection and evaluation of factors and levels were carried out to determine the appropriate experimental domain for the RSM design. Independent variables, which included time (X1), solvent concentration (X2), and extraction temperature (X3), were preliminarily tested.

2.3.4. Experimental Design

The central composite rotatable design (CCRD) consisted of 17 experiments: 5 of which corresponded to a complete factorial design 24, 8 experiments were used as star points (α ± 2), and the remaining 5 were in the middle factors’ fields. Statistical analysis was accomplished by means of the software STATISTICA (version 7.0) for the experimental design and regression analysis of the experimental data. Student’s t-test controlled the checking of the statistical significance of the regression coefficient. Fisher’s F-test assessed the second-order model equation at p < 0.05. Model adequacy was estimated thanks to the coefficient of determination (R2) and the F-test value obtained from the analysis of variance (ANOVA). Regression analysis and three- and two-dimensional response surface plots were plotted to evaluate the optimum conditions for anti-DPPH radical activity (YIP50) and total phenolic compound content (YTPC). A 95.0% confidence level was used in the test of statistical significance, which was based on the total error criteria. Information on the operating conditions is detailed in Table 1. This work assessed the influence of extraction time (from 5 to 120 min) and ethanol concentration (from 10 to 50%) while the extraction temperature was kept under 60 °C, aiming to avoid the boiling temperature of ethanol (e.g., 78 °C). All of these conditions were defined according to preliminary experimental results. The variation in antiradical activity (YIP50) and total phenolic compounds content (YTPC) versus the three retained variables X1, X2, and X3 was established through a polynomial second-degree model as follows:
Y = b0 + b1 × X1 + b2 × X2 + b3 × X3 + b11 × (X1 × X1) + b22 × (X2 × X2) + b33 × (X3 × X3) + b12 × (X1 × X2) + b13 × (X1 × X3) + b23 × (X2 × X3).
where Y represents the measured response variables; b0 is a constant; b1, b2, and b3 are the linear, quadratic, and interactive coefficients of the model, respectively; and X1 and X2 are independent variables.
Extraction via simple maceration was performed in seeds, peel, and endocarp obtained from “Batati” squash grown in the Higher Agronomic Institute Chott-Mariem (ISA-CM). Nontoxic food grade ethanol was used as the extraction solvent. Extractions were performed in Erlenmeyer flasks in which 10 g of seed or peel or endocarp in a mass ratio of 10:100 and solvents in predetermined volumes were added. The extraction time and temperature of each experiment were set as described in Table 1.

2.4. Determination of Total Phenolic Compound Content

The total phenolic compound (TPC) content in the different extracts was evaluated with the Folin–Ciocalteu reagent using the method described by Mansour et al. [35] adapted to a 96-well plate. Briefly, 100 µL of Folin–Ciocalteu reagent was mixed with 20 µL of each extract and left for 5 min of incubation. After that, a volume of 80 µL of CO3NO2 (75 g/L) solution was added. After 60 min of incubation, the sample absorbances were read at 765 nm. TPC was expressed as milligrams of gallic acid equivalent per gram of extract (mg GAE/g E). Analyses were performed at least in triplicate.

2.5. Phenolic Compounds by HPLC

The characterization of phenolic compounds was performed by means of HPLC (Agilenttechnologies 1260; Ratingen, Germany Japon) equipped with a reverse phase C 18 column (4.6 × 100 mm and 3.5 mm particle size) zorbax Eclipse XD B C18, as previously described [36]. The DAD detector was set to a scanning range of 200–400 nm. The column temperature was maintained at 25 °C. The injected extract volume was 2 μL and the flow rate of the mobile phase was equal to 0.4 mL/min. Mobile phase B was milli-Q water constituted of 0.1% formic acid and mobile phase A was methanol. The optimized chromatographic conditions were described as follows: 0–5 min: 10% A–90% B; 5–10 min: 20% A–80% B; 10–30 min: 30% A–70% B; 30–40 min: 50% A–50% B; 40–45 min: 60% A–40% B; 45–50 min 70% A–30% B; 50–55 min: 90% A–10% B; 55–60 min: 50% A–50% B; and 60 min: 10% A–90% B. The phenolic identification was realized by associating their retention time and the UV spectra with those of pure standards.
Quality control was assured as follows. The recovery percentage for each standard was determined using the ratio of the standard concentration after and before HPLC. The characteristics of the calibration curves acquired by injecting known concentrations of several standard chemicals were used to calculate the limits of detection and quantification for quantitative analysis. For each sample, the limits of detection (LODs) and limits of quantitation (LOQs) were computed in triplicate. Plotting the concentration versus peak area led to the sequential creation of calibration curves. The standard curve of five repetitions was used to calculate the mean of the slope (S) and standard deviation of the intercept (ⱺ). In order to determine LOD and LOQ, the following formulae were used:
LOD = 3.3 (ⱺ/S) and LOQ = 7 (ⱺ/S),
Linear ranges and intra- and interday repeatability of spiked analytes data are detailed in Table S1 (Supplementary Materials).

2.6. DPPH Radical Scavenging Activity Assay

Antiradical activity against DPPH radical was measured as previously described by Hatano et al. [37]. An aliquot of each extract (50 µL of 1 mg/mL) and 150 µL of DPPH solution (200 µM) were mixed together. The mixtures were incubated at ambient temperature in the dark for 20 min. DPPH scavenging ability was expressed as IC50 (mg/mL), which is the concentration capable of inhibiting 50% of the DPPH radical. The inhibition percentage (IP %) of DPPH radical was calculated using the following formula:
IP (%) = [(A0 − A1)/A0] × 100
where A0 and A1 are the absorbance of the control and the sample, respectively, at 514 nm using a microplate spectrophotometer (EZ Read 2000, Biochrom, Cambridge, UK).

2.7. Antimicrobial Activity

Microbial strain. To assess extracts obtained after mathematical optimization of antimicrobial activity, the microbial growth inhibitory potency was evaluated against that of food-borne bacteria, namely, Salmonella typhimurium (ATCC 14028), Pseudomonas aeruginosa (ATCC 8166), and Staphylococcus aureus (ATCC 6538), as well as one pathogenic yeast, Candida albicans (ATCC 2091). Fresh microbial suspensions were prepared from the bacterial working stocks after their enrichment on Mueller–Hinton broth or MH for bacterial growth and Sabouraud broth for yeast growth, followed by their incubation for 18–24 h at 37 °C [20].
Microbial survivability. A volume of 100 µL of overnight bacterial volumes of the tested samples were added distinctly. Then, an aliquot of 100 μL of each tube was covered with standard Agar and incubated for 24 h at 37 °C. Once the incubation was over, the presumed obtained microbial population was numbered. A negative control was also achieved using the same method, using sterile physiological water instead of the extracts [28]. Each inactivation test was conducted in triplicate. The absorbance data allowed calculating the percentage of growth inhibition using the following formula:
Growth inhibition (%) = 100 − [((ASample − ASC)/ AGC − ASC) × 100]
where AGC is the absorbance of the growth control (positive control), ASC is the absorbance of the sterility control (negative control), and ASample is the absorbance of the samples.

2.8. Statistical Analyses

Each experiment was carried out at least three times and the results using a microplate spectrophotometer (EZ Read 2000, Biochrom, Cambridge, UK) were shown as mean ± standard deviation. To assess the differences between the means of independent variables, we employed the analysis of variance (ANOVA) using IBM SPSS Statistics Software (Version 20.0, IBM SPSS Inc., Armonk, NY, USA) and then performed Duncan’s multiple range test (DMRT). If the one-way ANOVA was not appropriate, Kruskal–Wallis test was used after verifying that the groups were normally distributed and that the variances were homogeneous. To determine the linear correlation between variables, Pearson’s correlation test was carried out. A significance level of p < 0.05 was set to test the statistical significance. RSM experiments were designed and analyzed using NemrodW software Design Expert 8.05b. The adequacy of the model was verified through ANOVA (using the Fisher test), analyzing the residual plots of the Y response, and measuring the R2.

3. Results and Discussion

Considering that C. maxima fruit (squash) by-products can contain important bioactive compounds such as antioxidant molecules, the current study was designed with two objectives: (a) the application of a green solvent system (ethanol) for the extraction of bioactive metabolites from squash by-products and (b) the utilization of RSM for the optimization of parameters related to extraction variables.
In particular, we implemented RSM to investigate the influence of three independent variables on TPC and DPPH scavenging activity of peel, seed, and endocarp extracts. DPPH scavenging activity (YIP50) and total phenolic compound content (YTPC) in squash extracts obtained from 17 experiments for each by-product (peels, seeds, and endocarp) are listed in Table 1. From this table, it is observed that the amounts of TPC fluctuated between 14.23 and 18.10 mg GAE/g E for peels, 9.98 and 15.95 mg GAE/g E for endocarp, and 10.05 and 14.98 mg GAE/g E for seeds. Antiradical activity expressed as inhibition percentage (IP) at 50% varied between 65% and 73% for peels, between 38% and 67% for endocarp, and between 27.55% and 55.90% for seeds. According to these data, peels were distinguished by higher levels of TPC and by the best antiradical capacity, reaching 73% of DPPH inhibition.
The data obtained from the central composite design (17) were fitted to second-order polynomial equations. The significance of the models’ coefficients was determined by analysis of variance (ANOVA). The data in Table 2 describe only significant coefficients and the corresponding p-values inferior to 0.05, indicating the considerable effect of these coefficients on the corresponding response variables. Generally, the results showed that, for the two responses, extraction time and ethanol concentration had significant quadratic effects (p < 0.05). Precisely, these two factors stimulated a negative effect on TPC and a positive effect on the DPPH scavenging ability. In addition, it is important to highlight that all of the linear coefficients were significant (p < 0.05) for DPPH scavenging ability.
For the two responses, a considerable interaction effect was established between variables as follows: extraction time–ethanol concentration, duration of extraction–ethanol concentration, and extraction temperature–extraction time. Firstly, for the response of DPPH scavenging activity, the interaction between the extraction time and the extraction temperature had a significant effect. Secondly, the interaction between the ethanol concentration and the extraction temperature showed a significant effect on TPC response. The validity of models was confirmed using the lack of fit test, as summarized in Table 3. ANOVA for the lack of fit test for the two responses was insignificant (p > 0.05), indicating that the model adequately fitted the experimental data. Besides, the coefficients of multiple determinations (R2), which were obtained for the response of DPPH scavenging ability and total phenolic compound content for each by-product, revealed that there were good correlations between the tested responses and the independent variables. Similar results were reported by Belwal et al. [30], who also suggested a significant correlation between the extraction condition parameters (e.g., temperature, the ratio of sample to solvent and the concentration of solvent, and the total phenolic compound content and antioxidant activity) of Berberis asiatica fruit. On the other hand, Chen et al. [38], who tested the ultrasound-assisted extraction technique in Lycium ruthenicum Murr. (LR) fruit, suggested that, for the optimization of the extraction technique, only the solvent to sample ratio significantly affected the tested response, whereas extraction time had no significant impact on the total phenolic compound content.

3.1. Modeling and Numerical Optimization of the Extraction Process

3.1.1. Response Surface Analysis of DPPH Radical Scavenging Activity

The analysis of variance, as detailed in Table 3, highlighted the relationship between DPPH scavenging ability and extraction parameters for the three studied by-products. The following equations define the mathematical model that describes the relationship between the significant independent variables and response of DPPH scavenging activity.
(peels) YDPPH = 75.374 + 0.925 × X1 + 0.734 × X2 − 7.027 × (X1 × X1) − 4.745 × (X2 × X2) − 2.23 × (X3 × X3) − 1.067 × (X1 × X2)
(endocarp) YDPPH = 66.794 + b1 × X1 − 8.196 × (X1 × X1) − 7.671 × (X2 × X2) − 11.258 × (X3 × X3) − 1.943 × (X1 × X2) − 3.140 × (X1 × X3) + 4.105 × (X2 × X3)
(seeds) YDPPH= 53.903 + 2.333 × X1 − 4.199 × X2 − 2.534 × X3 − 7.879 × (X1 × X1) − 3.099 × (X2 × X2) − 9.223 × (X3 × X3) + 4.651 × (X1 × X2) +3.570 × (X1 × X3) + 6.611 × (X2 × X3)
According to Fisher’s F-test, the observed F values for the coefficients were superior to the tabulated values: Fobserved = 63.6624 > Ftabulated = 3.68 (peels); Fobserved = 194.8989 > Ftabulated = 3.68 (endocarp); and Fobserved = 72.39 > Ftabulated = 3.68 (seeds). All of the corresponding p-values were smaller than 0.0001. This finding indicated that the independent variables listed in Table 2 had a significant effect on the response of DPPH scavenging ability. Indeed, the ratio of the mean square of validity and the pure error was inferior to the tabulated value. The Fisher test also indicated that the results of the proposed model were valid.
Figure 2 presents the dimensional response surfaces of all of the significant interaction effects of the factors mentioned in Table 2. In other words, Figure 2 illustrates the effect of ethanol concentration, extraction time, and temperature and their mutual interaction on the DPPH scavenging ability and total phenolic compound content. For peels, at 10% of ethanol concentration and with a high temperature (up to 55 °C), a good inhibition of DPPH was observed when the extraction decreased to 10 min (75% of inhibition) (Figure 2A). For endocarp, an increase in the DPPH scavenging capacity (67% of inhibition) was observed with a medium extraction temperature (35 °C) and ethanol concentration of 30% at a fixed extraction of 10 min (Figure 2B). As can be seen in Figure 2C, for seeds, the effect of ethanol concentration, extraction time, and extraction temperature indicated that the inhibition percentage (IP) was inferior to that in peels and endocarp, with a maximum value of approximately 56% when the extraction temperature, ethanol concentration, and extraction time were set to 60 °C, 20%, and 22.5 min, respectively.

3.1.2. Response Surface Analysis of Total Phenolic Compound Content

The mathematical models that correlated the content of total polyphenols (TPC) of each by-product with significant independent variables are provided below:
(peels) Y PPT = 17.876 + 0.296 × X2 − 1.532 × (X1 × X1) − 1.162 × (X2 × X2) + 0.539 × (X3 × X3) − 0.452 × (X1 × X2) − 0.530 × (X1 × X3) + 0.350 × (X2 × X3)
(endocarp) Y PPT = 15.570 -0.922 × X1 − 1.907 × (X1 × X1) − 1.240 × (X2 × X2) − 1.740 × (X3 × X3) − 1.740 × (X1 × X3)
(seeds) Y PPT = 14.641 + 0.817 × X1 + 0.050 × X2 + 0.030 × X3 – 1.858 × (X1 × X1) − 1.061 × (X2 × X2) − 0.936 × (X3 × X3) − 0.249 × (X1 × X2) + 0.807 × (X1 × X3) − 0.454 × (X2 × X3)
Table 1 summarizes the yields of TPC (YTPC) from all of the experiments, and these data were used to perform multiple linear regression analysis using a quadratic polynomial model. As presented in Table 3, analysis of variance (ANOVA) of total phenolic compound content showed that the contribution of the quadratic model was significant. Indeed, according to Fisher’s F-test, the recorded F value coefficients were superior to the tabulated values (Fobserved = 52.3732 > Ftabulated = 3.68, Fobserved = 8.3155 > Ftabulated = 3.68, and Fobserved = 31.52 > Ftabulated = 3.68 for peels, endocarp, and seeds, respectively), indicating that the experimental data fitted well with the model. In agreement with literature reports, temperature was a pivotal factor for phenolic compound extraction [39]. Based on our results, the variable that had the most significant influence on phenol compound extraction yield was temperature, while the maximum yield for the three by-products of squash was obtained when the extraction temperature exceeded 35 °C. An increase in the extraction temperature at a 10% ethanol concentration significantly increased the TPC extraction yield in peels, while an increase in ethanol concentration to 30% significantly improved the TPC extraction yield in endocarp. On the other hand, in the case of seeds, the interaction of ethanol concentration (X1) and extraction time (X2) was a less influential factor, as evidenced in Table 3. The results shown below in Table 4 also demonstrated that the experimental and predicted values of TPC extraction yield fitted with each other, concluding that the optimal extraction conditions were achieved at the abovementioned conditions.

3.1.3. Optimization of Extraction Parameters

Response surface methodology (RSM) is a widely used method to efficiently optimize complex extraction procedures [40]. Briefly, RSM is a collection of mathematical and statistical techniques based on the fit of a polynomial equation to the experimental data. This can be efficiently employed when a response or a set of responses of interest are influenced by multiple parameters and the aim is to optimize the responses by the experimental design. This method has been widely recommended as RSM significantly reduces the number of experimental runs, cost, and time while providing accurate results [41]. Generally, for the two tested responses in peels, the optimum point was marked in the area corresponding to the following conditions: ethanol concentration: 12%; extraction time: 11 min; and extraction temperature: 55 °C. Under these optimal extraction conditions, the experimental values of DPPH free radical scavenging activity (IP) and total phenolic compound content were 75% of inhibition and 17.5 mg GAE/g E, respectively. For seeds, these conditions were 20% ethanol concentration, extraction time: 22.5 min, and extraction temperature: 60 °C, which resulted in IP of DPPH of 54% and 15 mg GAE/g E, respectively. Interestingly, the DPPH scavenging abilities of squash by-product extracts evaluated in this study were higher than those obtained in other reports. In particular, Singh et al. [42] assessed different parts of cucurbit fruits with different solvents to determine their DPPH free radical scavenging activity, and the antioxidant activity for 70% methanolic extracts of squash peel was limited to only 44%. Asif et al. [20], who conducted research to investigate the antioxidant activity of 65%, 80%, and 99.9% methanolic extracts of squash peels using the DPPH free radical scavenging assay, suggested that squash peel extracts exhibited antioxidant activity of only 69%. On the other hand, Kulczyński et al. [17] reported that squash (Cucurbita pepo) seed extracts exhibited 20.5% and 18.9% inhibition when extracted with 70% ethanol and 70% methanol, respectively. Another report of Valenzuela et al. [43], who worked on seeds from various squash species, indicated that the highest total polyphenol content in C. mixta Pangalo species was limited to 275 µmol GAE/g E. Moreover, according to Kiat et al. [44], lower total polyphenol content levels were detected in the seeds of C. maxima Duchense (212.87 µmol GAE/g E) and C. moschata (Duchense ex Lam.) species (118.79 µmol GAE/g E). This variability in antioxidant activities and total phenolic compound content in the Cucurbita genus could be explained by various factors, such as the origin of plants and the growing conditions, the particular species, and the extraction conditions [6,45,46]. According to the literature, great variability in the recovery of polyphenols from bio-residues is expected, depending on the extraction protocol, while the ultrasound-assisted method was suggested as the most efficient protocol compared with conventional solid-to-liquid extraction and microwave-assisted extraction protocols [47]. To date, there have been limited studies on the antioxidant activity of squash by-products, including seeds, flowers, and leaves, but not the endocarp. To the best of our knowledge, the antioxidant activity of endocarp tissues has not been thoroughly investigated so far and our results could provide important information regarding this squash by-product.

3.2. RSM Extraction and Comparison to Conventional High-Energy Extraction

The selection of the most appropriate extraction technique is crucial and is based on the benefits and drawbacks of the various available methods. This selection should take into account many factors such as safety, complexity of the manufacturing process, effectiveness of the obtained extract, and environmental friendliness [23]. The total phenolic compound content and antiradical activity from squash by-products determined by RSM and one of the most frequently used extraction methods, e.g., maceration combined with ultrasonication (MUS), are shown in Table 5. These results show that TPC was clearly higher when ultrasounds were also used for the extraction. In fact, TPC ranged between 58 and 121 mg GAE/g E (for endocarp and seeds, respectively) for the ultrasound-assisted extraction, while it was limited to 17 mg GAE/g E when only maceration was applied. Intriguingly, the antiradical activity values showed exactly the opposite trends, as IP values were undoubtedly more efficient with the low-energy extraction than the high-energy extraction. IC50 values over 340 µg/mL in the case of MUS extraction were reduced to 17.5 µg/mL in the RSM extraction. This result should be highlighted as it underlines that the phenolic composition impacted the efficiency of the extracts to a greater extent than the phenolic quantity. In this context, it seems that RSM extraction was oriented to select the most active phenolic compounds in terms of antiradical activity, rather than randomly extracting all of the polyphenols. According to Dahmoune et al. [48], microwave-assisted extraction was more efficient than the ultrasound-assisted and conventional extraction protocols in Pistacia lentiscus leaves, while similar results were reported by Nayak et al. [49] in the case of Citrus sinensis peels. On the other hand, Da Porto and Natolino [47] indicated the prevalence of ultrasound-assisted methods over microwave-assisted and conventional methods. These differences highlight the importance of proper selection of the extraction method depending on the plant matrix in order to increase the extraction efficiency and improve the added value of crop residues. Moreover, the contribution of phenolic compounds to radical scavenging activity of natural matrices may also point out the necessity of high extraction yields of polyphenols from plant residues [50]. Another point that should be discussed is that, although the same solvent and liquid-to-solid ratio were used in all of the extraction processes, the energy consumed during the ultrasound-assisted process was dramatically reduced in the RSM optimization, thus increasing the extraction efficiency of total phenolic compound content and the antiradical activity of the extracts. Therefore, our findings confirmed that the extraction process seems to be one of the most important factors for the variation in bioactive compound content and antioxidant capacity obtained from the extracts of other plant matrices [51,52].

3.3. Phenolic Compounds’ Identification

Table 6 presents the phenolic compounds’ identification in each by-products’ ethanolic extract. According to this table, important qualitative and quantitative differences were observed between the three studied by-products. First, the three presumed squash wastes exhibited interesting phenolic contents that reached 38 mg/g of extract (E), with a particular fingerprint for each sample. Moreover, thirteen phenolic compounds were successfully identified in the different squash by-products, including five flavonoids (catechin gallate, epigallocatechin, epicatechin, rutin, and myrecitin) and four phenolic acids (vanillic, gallic, chlorogenic, and ferulic acids). The identification was based on the retention time of each compound, the spectral characteristics of their peaks compared with those of standards, as well as by spiking the sample with standards. The obtained data highlighted the particular richness of the endocarp in phenolic compounds (37.8 mg/g E), followed by peel extracts and seeds (13.1 mg/g E and 7.7 mg/g E, respectively). The total phenolic compound content mainly comprises the flavonoids family, in particular the flavan-3-ols group, while phenolic acids are less representative or were detected in low amounts. Likewise, phytochemical investigation allowed us to depict epigallocatechin and epicatechin as the major flavonoids in the endocarp extract, with amounts of 22.4 mg/g E and 9.8 mg/g E, respectively. For peel extracts, the main compound was epicatechin (4.2 mg/g E), while catechin gallate and epicatechin were distinguished as the major compounds in seeds (2.2 mg/g E and 2.3 mg/g E, respectively).
On the other hand, HPLC analysis showed that the detected phenolic acids and their concentrations changed depending on the by-product as well. Chlorogenic acid was the most abundant phenolic acid in seeds, with a concentration of 0.7 mg/g E, while vanillic acid was the only detected phenolic acid in peel extracts, accounting for 0.15 mg/g E. Vanillic and chlorogenic acids were the main phenolic acids in the endocarp (0.8 mg/g E and 0.6 mg/g E, respectively). Similar results on the phenolic compound content in squash by-products were recently reported. Leichtweis et al. [6] conducted a study of Portuguese and Algerian C. maxima by-products (seeds, peels, and fibrous strands). According to these authors, the peel of the Portuguese ‘Common Pumpkin’ had the most diversified phenolic profile as well as the highest concentration of total phenolic compounds (9.4 mg/g E), followed by the fiber of ‘kabocha squash’ (4.8 mg/g E), with considerable concentrations of (−)-epicatechin. Interestingly, these values were clearly different and lower than those recorded in the present work (13.1 mg/g E and 37.8 mg/g E for peels and endocarp, respectively), a finding that could be probably attributed to differences in the genotypes tested and the growing conditions or to the extraction protocols and the analytical equipment [16,17,19,53]. Moreover, the ripeness stage may also affect the chemical profile of phenolic compounds, with the flavonoid content being higher in young and mature fruit of C. moschata, whereas phenolic acids are the most abundant compounds at the ripening stage [54]. This abundance of flavonoids in squash by-products was previously cited in Australian C. moschata samples, when HPLC-PDA quantification revealed epicatechin (6.6 μg/g) and catechin (6.1 μg/g) as the major components in pumpkins’ seeds and skins, while other compounds such as protocatechuic, caffeic and cumaric acid, and quercetin-3-glucuronide and epicatechin gallate were also detected in significant amounts [55]. Similarly, and in accordance with our results, Busuioc et al. [46] reported that flavonoids were the most abundant phenolic category as compared with hydrocinnamic acids in a Cucurbitaceae variety ‘Momordica caranthia’, whereas gallic acid was the most abundant compound. Extracts from this variety displayed high levels of phenolic compounds, including catechin and (−)-epicatechin. Indeed, several works have mentioned the flavonoids family as the most abundant in terms of the number and quantity of compounds detected, suggesting O-glycosylated derivatives of flavonoids as the major compounds [56,57], while the polyphenol compound content is associated with the bioactive properties of natural matrices [50].

3.4. Antioxidant and Phenolic Composition Statistical Interactions

A correlation matrix is a table that displays the pairwise correlations between two or more variables. In this study context, a correlation matrix was used to evaluate the relationship between total (TPC) and individual phenolic compounds with the antioxidant properties, as measured by the DPPH test, of pumpkin by-products. Note that, as a lower IC50 corresponds to higher activity, some correlation signs are expected to be “negative” as IC50 and TPC were inversely proportional. According to the correlation matrix in Figure 3, the antioxidant activity was highly correlated with the total phenolic compound content (TPC), with a correlation coefficient of −0.996. Moreover, statistical correlation coefficients of individual phenolic compounds vary, with some showing positive correlations, such as chlorogenic acid (0.953) and rutin (0.999), while others exhibit negative correlations, such as resorcinol (−0.981), resveratrol (−0.907), and myrecitin (−0.981). These data were consistent with previous studies that had found a strong correlation between DPPH activity and TPC [58]. However, it is important to note that the determination of antioxidant activity using chromogen radicals, such as DPPH, had some methodological limitations that should be taken into account when interpreting the results [59]. These limitations included the fact that the chromogen radicals may not have been representative of the complex biological environment in which antioxidants acted. With this respect, de Camargo et al. [60] criticized the use of total phenolics and antioxidant screening methods, arguing that these tests may not reflect the true biological effects of phenolic compounds. In summary, while the correlation matrix provided valuable information about the relationship between phenolic compounds (total and individually) and their antioxidant properties, it is important to consider the limitations of the methods used to measure these properties.

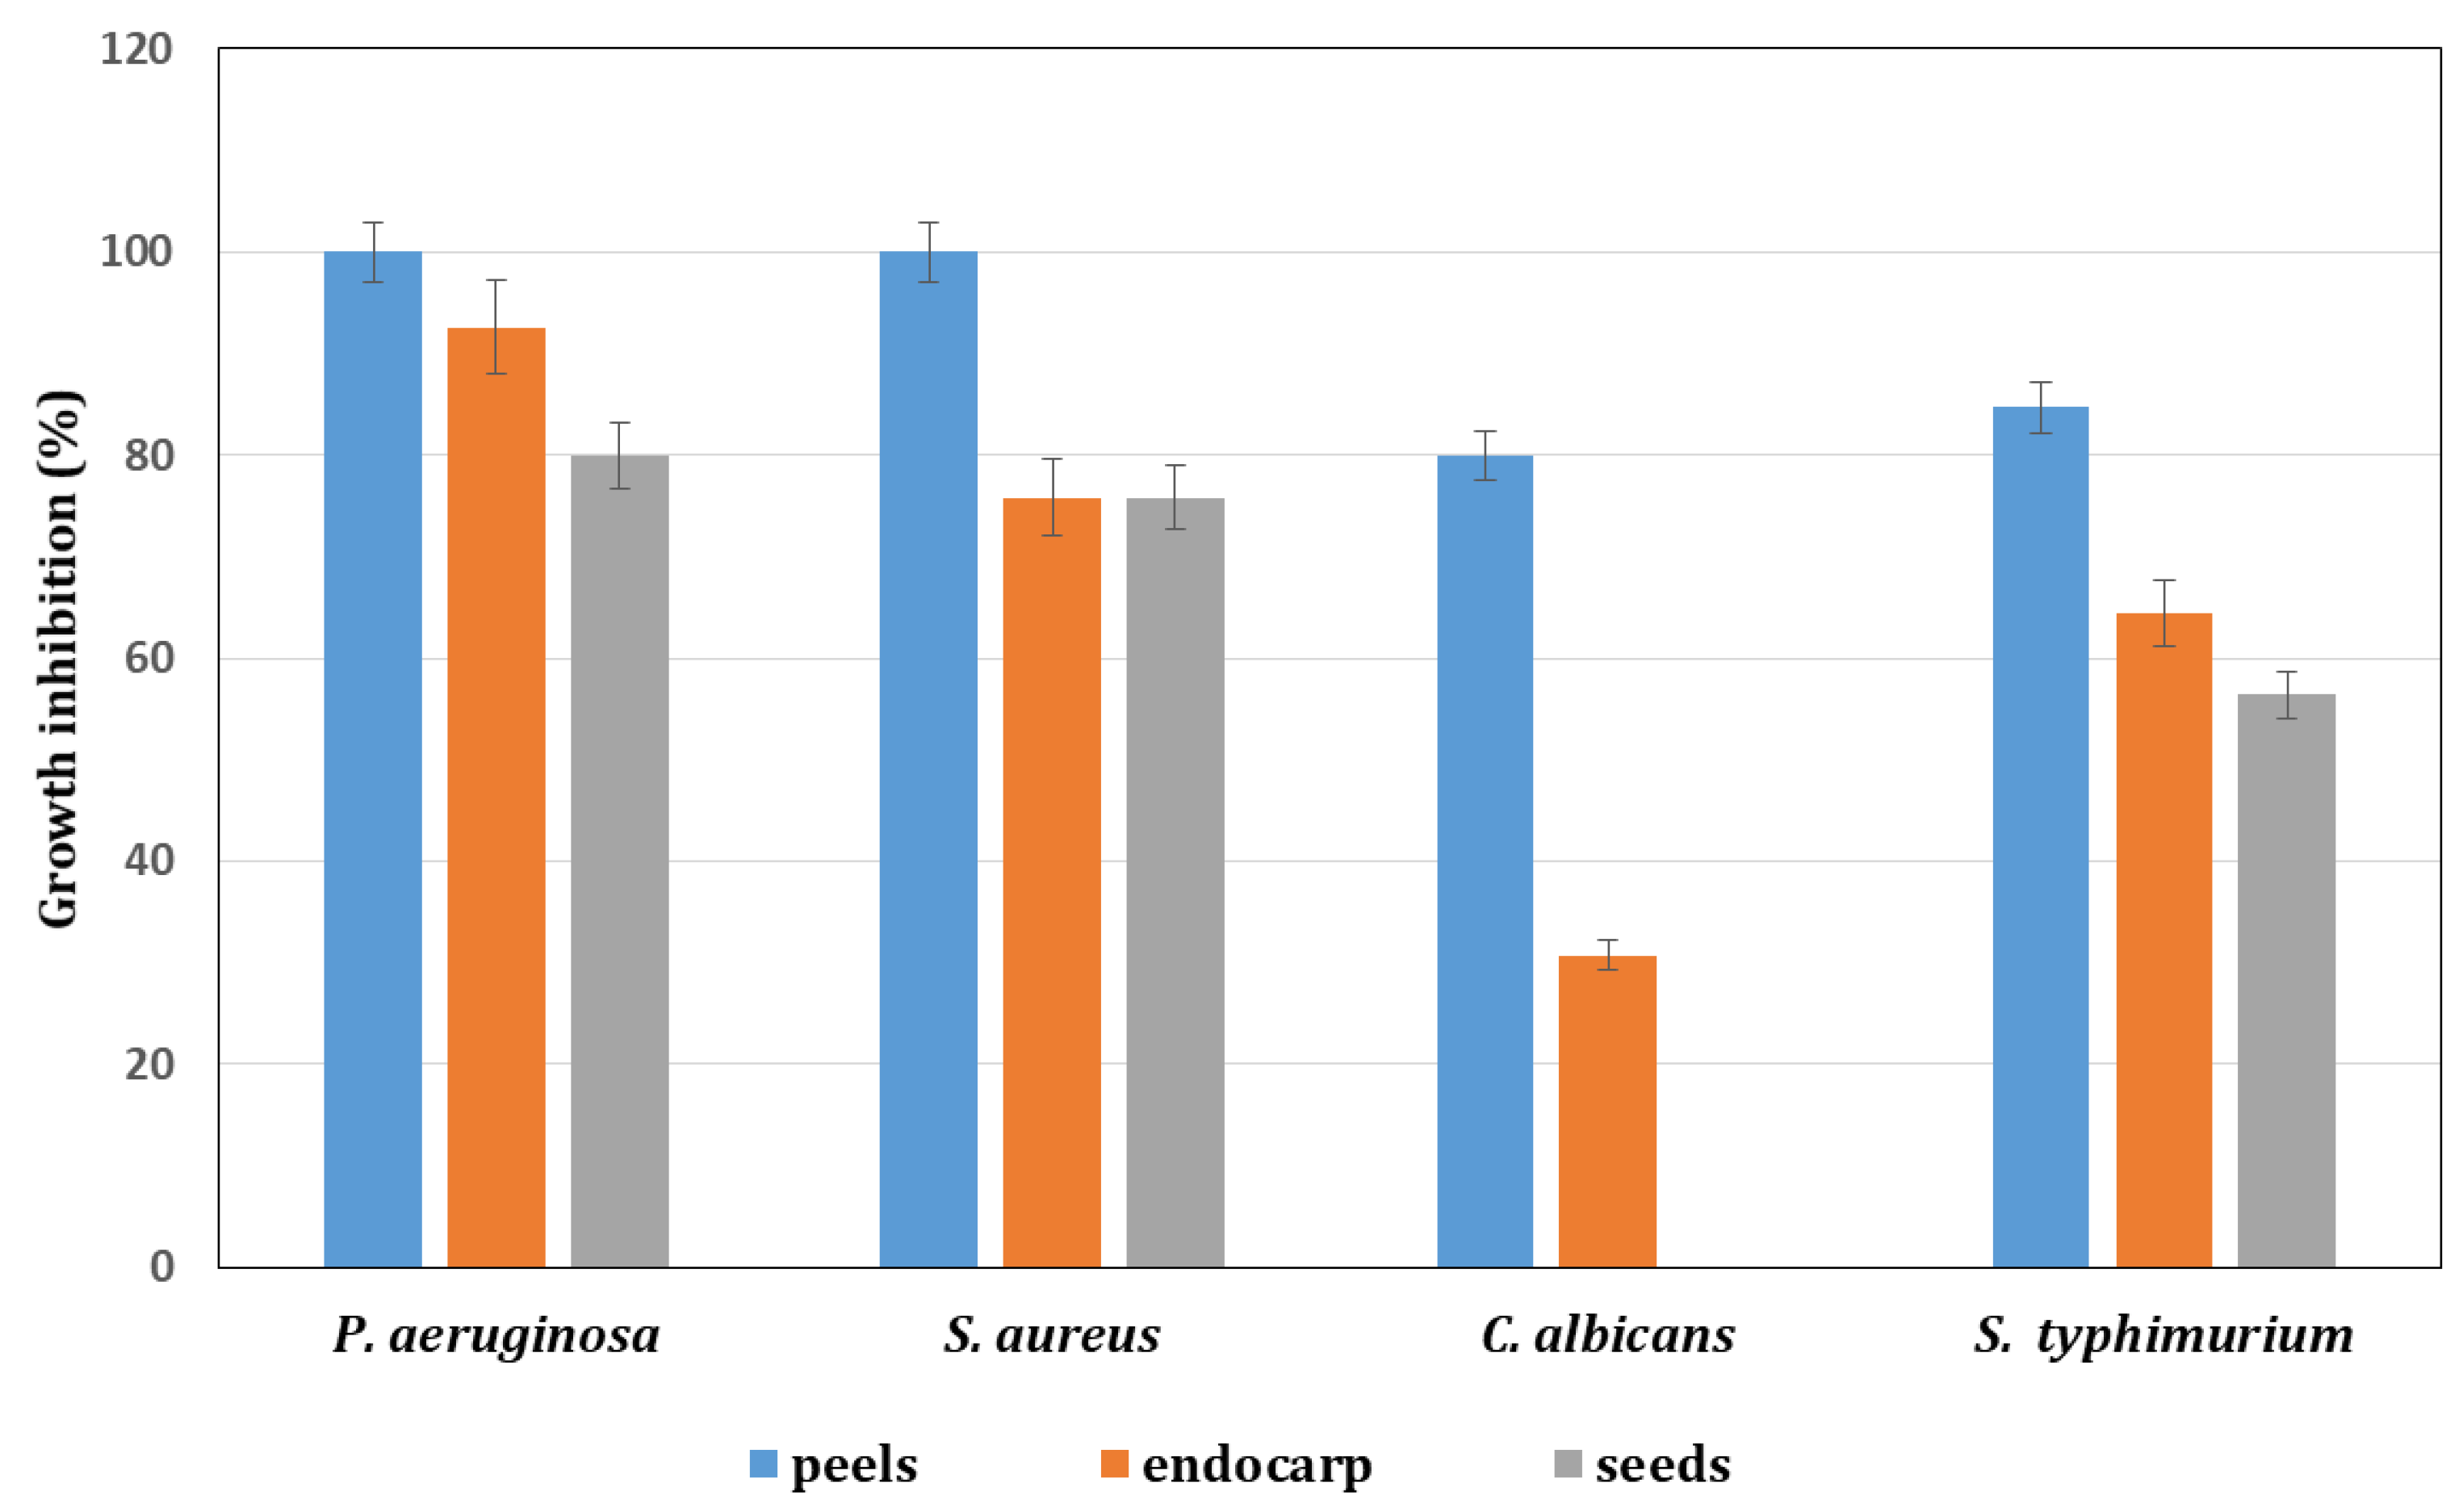
3.5. Antimicrobial and Antifungal Activities

Data concerning the antibacterial activities of squash by-products against different bacterial species (P. aeruginosa, S. typhimurium, and S. aureus) and one fungal strain (C. albicans) are presented in Figure 4. It is important to highlight that all of the studied samples exhibited interesting antimicrobial power, as the weakest recorded activity was estimated at 31% (seeds) growth inhibition, while peels and endocarp extracts succeeded in completely inhibiting pathogen growth, with 100% growth inhibition. Squash peel extract exhibited the best overall performance (growth inhibition of 100%, 100%, and 85% against P. aeruginosa, S. aureus, and S. typhimurium, respectively) as compared with seed and endocarp extracts. The same trend was recorded for the antifungal activity, with pumpkin peels being the most efficient in inhibiting C. albicans growth (80% growth inhibition), followed by endocarp extracts (31% growth inhibition), whereas seed extracts did not show any efficacy against this pathogen (0% growth inhibition).
In accordance with our results, Leichtweis et al. [6] reported that hydroethanolic extracts of squash by-products from Portuguese and Algerian fruit samples were able to inhibit eight bacterial strains (E. cloacae, S. enterica, Y. enterocolitica, B. cereus, L. monocytogenes P. aeruginosa, E. coli, and S. aureus) at a concentration ranging from 2.5 to 10 mg/mL. At this point, it is important to underline that flavonoids and phenolic acids, largely represented in squash by-products, have been reported as powerful antimicrobial agents [6,61]. Indeed, the antibacterial activities of phenolic compounds have been related to the reaction of these compounds with cellular compounds, resulting in the leakage of nucleotides and proteinaceous material into extracellular areas [59]. Considering this approach, the inhibitory effect of the extracts might be due to particular flavonoids and phenolic acids present in pumpkin by-products’ extracts. In fact, catechin and its derivatives, massively present in squash by-products, have been proven to exert antibacterial effects by reducing the antioxidant capacity of food-borne pathogens such as Escherichia coli and Salmonella. A study conducted by Ma et al. [61] showed that the minimum inhibitory concentration (MIC) of catechins against E. coli and Salmonella was between 6 and 50 mg/mL. The same authors confirmed that catechins can regulate the composition of intestinal microbes to improve intestinal immunity and promote intestinal health, thereby controlling foodborne pathogens [62]. In this context, Levy et al. [63] also reported that the MIC of catechin extracted from grape seed against S. Typhimurium was 46 ppm, while the MIC of catechin extract of peanut endothelial cells against the same strain was 61 ppm. Indeed, Xiong et al. [64] showed that catechins can increase the content of reactive oxygen species (ROS) in bacterial cells and cause endogenous oxidative stress in E. coli, applying antibacterial effects by reducing the antioxidant activity of the bacteria [64]. Yen et al. [65] also reported that the catechin content in the fiber of C. moschata was 0.39 mg/100 g DW. Consequently, this component is of high importance in human health care; it has been frequently used as a natural and nontoxic antioxidant agent in oils, as well as an antibacterial agent in food stuffs. Regarding antifungal activity, Hsu et al. [66] reported that the main components in 186 different plant extracts with proven antifungal activities were phenolic compounds such as flavonoids (especially catechin), gallic acid, and thymol. Kabbashi et al. [67] conducted an in vitro study to prove the antifungal effects of C. maxima seeds’ ethanolic extracts against two fungal strains. At a concentration of 12.5 mg/mL, pumpkin seeds’ ethanolic extracts exhibited a zone of inhibition of 15 mm against C. albicans.

4. Conclusions

In this present study, response surface methodology employing the Box–Behnken design was successfully applied to optimize the extraction process from by-products obtained from C. maxima seeds, peels, and endocarp. The total phenolic compound content and antiradical activity were significantly influenced by the various levels of the extraction conditions (e.g., solvent, time, and temperature of the extraction process) implemented as well as by their interaction. The experimental results adequately fitted with second-order polynomial models and showed significant linear, quadratic, and interaction effects of the independent variables. Moreover, the recorded values of regression coefficients (R2) revealed good correlations between responses and independent variables. The selected range of each independent variable and the obtained results of optimum extraction conditions depending on the plant by-product showed the adequacy of the model, while revealing that the experimental values are in agreement with the predicted values. The results also showed that C. maxima by-products contain valuable phenolic compounds (mostly epicatechin, epigallocatechin, hydroxytyrosol, and catechin gallate) with promising antioxidant activities, making them beneficial for human health. These by-products could also be used for the scaled-up recovery of bioactive compounds, with potential uses in the food processing industry for the production of high added value products, aiming to decrease the environmental footprint of crop production within the context of the circular economy.

Supplementary Materials

The following supporting information can be downloaded at https://www.mdpi.com/article/10.3390/pr11061726/s1. Table S1: Linear ranges and intra- and interday repeatability of spiked analytes (n = 3).

Author Contributions

Conceptualization, H.F., L.B. and R.K.; methodology, R.B.M., L.B., R.K. and S.A.P.; validation, L.B., H.F., N.T. and R.K.; formal analysis, M.H., L.B., H.F., N.T. and R.K.; software, L.B., H.F., N.T. and R.K.; resources, N.T.; writing—review and editing, N.T., L.B., R.K. and S.A.P.; supervision, R.K.; project administration, N.T., R.K. and L.B. All authors have read and agreed to the published version of the manuscript.

Funding

This study was supported by the Tunisian Ministry of Higher Education, Scientific Research, Information, and Communication Technologies and the Foundation for Science and Technology and was funded under the scope of the Project PulpIng (PRIMA/0007/2019)-H2020-PRIMA 2019—Section 2—Multi-topic 2019; the Foundation for Science and Technology (FCT, Portugal) for financial support by national funds FCT/MCTES (PIDDAC) to CIMO (UIDB/00690/2020 and UIDP/00690/2020) and SusTEC (LA/P/0007/2021); by FCT for the contract of L. Barros (CEEC Institutional); and by the General Secretariat for Research and Technology of the Ministry of Development and Investments under the PRIMA Program. PRIMA is an Art.185 initiative supported and co-funded under Horizon 2020, the European Union’s Program for Research and Plants 2022, 11, 800 16 of 18 Innovation (Prima2019-08).

Institutional Review Board Statement

Not applicable.

Informed Consent Statement

Not applicable.

Data Availability Statement

Data are available upon request.

Conflicts of Interest

The authors declare no conflict of interest.

Abbreviations

DPPH: 2,2-diphenyl-1-picrylhydrazyl; TPC: total phenolic compound content; RSM: response surface methodology; IC50: concentration of sample required to scavenge 50% of 2,2-diphenyl-1-picrylhydrazyl free radical; X1: extraction time (min); X2: solvent concentration (v/v, %); X3: extraction temperature (°C); YIP50: 2,2-diphenyl-1-picrylhydrazyl free radical scavenging activity response; YTPC: total phenolic compound content response; ANOVA: analysis of variance; Fregression: Fisher’s F-test value of regression; Ftabulated: tabulated value of Fisher’s F-test; mg GAE/g E: milligram of gallic acid equivalents per gram of extract.

References

  1. Bisht, B.; Gururani, P.; Aman, J.; Vlaskin, M.S.; Kurbatova, A.I.; Adarchenko, I.A.; Joshi, S.; Kumar, S.; Kumar, V. A review on holistic approaches for fruits and vegetables biowastes valorization. Mater. Today Proc. 2022, 73, 54–63. [Google Scholar] [CrossRef]
  2. Lemus-Mondaca, R.; Marin, J.; Rivas, J.; Sanhueza, L.; Soto, Y.; Vera, N.; Puente-Díaz, L. Pumpkin seeds (Cucurbita maxima). A review of functional attributes and by-products. Rev. Chil. Nutr. 2019, 46, 783–791. [Google Scholar] [CrossRef] [Green Version]
  3. Kaźmińska, K.; Sobieszek, K.; Targońska-Karasek, M.; Korzeniewska, A.; Niemirowicz-Szczytt, K.; Bartoszewski, G. Genetic diversity assessment of a winter squash and pumpkin (Cucurbita maxima Duchesne) germplasm collection based on genomic Cucurbita-conserved SSR markers. Sci. Hortic. 2017, 219, 37–44. [Google Scholar] [CrossRef]
  4. Durante, M.; Lenucci, M.S.; Mita, G. Supercritical carbon dioxide extraction of carotenoids from pumpkin (Cucurbita spp.): A review. Int. J. Mol. Sci. 2014, 15, 6725–6740. [Google Scholar] [CrossRef] [PubMed] [Green Version]
  5. Tzortzakis, N.; Chrysargyris, A.; Petropoulos, S.A. Phytochemicals content and health effects of cultivated and underutilized species of the cucurbitaceae Family. In Phytochemical in Vegetables: A Valuable Source of Bioactive Compounds; Petropoulos, S.A., Ferreira, I.C.F.R., Barros, L., Eds.; Bentham Science Publishers: Sharjah, United Arab Emirates, 2018; pp. 99–165. ISBN 9781681087399. [Google Scholar]
  6. Leichtweis, M.G.; Molina, A.K.; Pires, T.C.S.; Dias, M.I.; Calhelha, R.; Bachari, K.; Ziani, B.E.C.; Oliveira, M.B.P.P.; Pereira, C.; Barros, L. Biological activity of pumpkin byproducts: Antimicrobial and antioxidant properties. Molecules 2022, 27, 8366. [Google Scholar] [CrossRef] [PubMed]
  7. Petropoulos, S.A.; Fernandes, Â.; Calhelha, R.C.; Rouphael, Y.; Petrović, J.; Soković, M.; Ferreira, I.C.F.R.; Barros, L. Antimicrobial properties, cytotoxic effects, and fatty acids composition of vegetable oils from purslane, linseed, luffa, and pumpkin seeds. Appl. Sci. 2021, 11, 5738. [Google Scholar] [CrossRef]
  8. Chouaibi, M.; Daoued, K.B.; Riguane, K.; Rouissi, T.; Ferrari, G. Production of bioethanol from pumpkin peel wastes: Comparison between response surface methodology (RSM) and artificial neural networks (ANN). Ind. Crops Prod. 2020, 155, 112822. [Google Scholar] [CrossRef]
  9. de Escalada Pla, M.; Rojas, A.M.; Gerschenson, L.N. Effect of butternut (Cucurbita moschata Duchesne ex Poiret) fibres on bread making, quality and staling. Food Bioprocess Technol. 2013, 6, 828–838. [Google Scholar] [CrossRef]
  10. Genevois, C.; Flores, S.; de Escalada Pla, M. Byproduct from pumpkin (Cucurbita moschata Duchesne ex poiret) as a substrate and vegetable matrix to contain Lactobacillus casei. J. Funct. Foods 2016, 23, 210–219. [Google Scholar] [CrossRef]
  11. Pająk, P.; Przetaczek-Rożnowska, I.; Juszczak, L. Development and physicochemical, thermal and mechanical properties of edible films based on pumpkin, lentil and quinoa starches. Int. J. Biol. Macromol. 2019, 138, 441–449. [Google Scholar] [CrossRef]
  12. Stevenson, D.G.; Eller, F.J.; Wang, L.; Jane, J.L.; Wang, T.; Inglett, G.E. Oil and tocopherol content and composition of pumpkin seed oil in 12 cultivars. J. Agric. Food Chem. 2007, 55, 4005–4013. [Google Scholar] [CrossRef] [Green Version]
  13. Achu, M.B.; Fokou, E.; Tchiégang, C.; Fotso, M.; Tchouanguep, F.M. Nutritive value of some Cucurbitaceae oilseeds from different regions in Cameroon. Afr. J. Biotechnol. 2005, 4, 1329–1334. [Google Scholar]
  14. Díaz Obregón, D.; Lloja Lozano, L.; Carbajal Zúñiga, V. Preclinical studies of Cucurbita maxima (pumpkin seeds) a traditional intestinal antiparasitic in rural urban areas. Rev. Gastroenterol. Peru 2004, 24, 323–327. [Google Scholar]
  15. Daiuto, E.R.; Vieites, R.L.; Pigoli, D.R.; de Carvalho, L.D. Alterações nutricionais em casca e polpa de abóbora decorrentes de diferentes métodos de cozimento. Rev. Iberoam. Tecnol. Postcosecha 2012, 13, 196–203. [Google Scholar]
  16. Kim, M.Y.; Kim, E.J.; Kim, Y.N.; Choi, C.; Lee, B.H. Comparison of the chemical compositions and nutritive values of various pumpkin (Cucurbitaceae) species and parts. Nutr. Res. Pract. 2012, 6, 21–27. [Google Scholar] [CrossRef] [Green Version]
  17. Kulczyński, B.; Gramza-Michałowska, A.; Królczyk, J.B. Optimization of extraction conditions for the antioxidant potential of different pumpkin varieties (Cucurbita maxima). Sustainability 2020, 12, 1305. [Google Scholar] [CrossRef] [Green Version]
  18. Staichok, C.A.B.; Mendonça, K.B.R.; dos Santos, A.P.G.; Garcia, L.G.C.; Damiani, C. Pumpkin Peel Flour (Cucurbita máxima L.)-Characterization and Technological Applicability. J. Food Nutr. Res. 2016, 4, 327–333. [Google Scholar]
  19. Bochnak, J.; Świeca, M. Potentially bioaccessible phenolics, antioxidant capacities and the colour of carrot, pumpkin and apple powders—Effect of drying temperature and sample structure. Int. J. Food Sci. Technol. 2020, 55, 136–145. [Google Scholar] [CrossRef]
  20. Asif, M.; Naqvi, S.A.R.; Sherazi, T.A.; Ahmad, M.; Zahoor, A.F.; Shahzad, S.A.; Hussain, Z.; Mahmood, H.; Mahmood, N. Antioxidant, antibacterial and antiproliferative activities of pumpkin (cucurbit) peel and puree extracts—An in vitro study. Pak. J. Pharm. Sci. 2017, 30, 1327–1334. [Google Scholar]
  21. Que, F.; Mao, L.; Fang, X.; Wu, T. Comparison of hot air-drying and freeze-drying on the physicochemical properties and antioxidant activities of pumpkin (Cucurbita moschata Duch.) flours. Int. J. Food Sci. Technol. 2008, 43, 1195–1201. [Google Scholar] [CrossRef]
  22. Schiffrin, E.L. Antioxidants in hypertension and cardiovascular disease. Mol. Interv. 2010, 10, 354–362. [Google Scholar] [CrossRef] [PubMed]
  23. Sendi, N.; Mkadmini-Hammi, K.; Mansour, R.B.; Selmi, S.; Trabelsi, N.; Isoda, H.; Ksouri, R.; Megdiche-Ksouri, W. Simultaneous optimization of ultrasound-assisted extraction of flavonoid compounds and antiradical activity from Artemisia herba-Alba using response surface methodology. Prep. Biochem. Biotechnol. 2020, 50, 943–953. [Google Scholar] [CrossRef]
  24. Chemat, F.; Rombaut, N.; Meullemiestre, A.; Turk, M.; Perino, S.; Fabiano-Tixier, A.-S.; Abert-Vian, M. Review of Green Food Processing techniques. Preservation, transformation, and extraction. Innov. Food Sci. Emerg. Technol. 2017, 41, 357–377. [Google Scholar] [CrossRef]
  25. Bessa, L.C.B.A.; Ferreira, M.C.; Rodrigues, C.E.C.; Batista, E.A.C.; Meirelles, A.J.A. Simulation and process design of continuous countercurrent ethanolic extraction of rice bran oil. J. Food Eng. 2017, 202, 99–113. [Google Scholar] [CrossRef]
  26. Cacace, J.E.; Mazza, G. Mass transfer process during extraction of phenolic compounds from milled berries. J. Food Eng. 2003, 59, 379–389. [Google Scholar] [CrossRef]
  27. Hammi, K.M.; Jdey, A.; Abdelly, C.; Majdoub, H.; Ksouri, R. Optimization of ultrasound-assisted extraction of antioxidant compounds from Tunisian Zizyphus lotus fruits using response surface methodology. Food Chem. 2015, 184, 80–89. [Google Scholar] [CrossRef]
  28. BenJemaa, M.; Rahali, F.Z.; Falleh, H.; Beji-Serairi, R.; Megdiche-Ksouri, W.; Hamrouni, I.; Hammami, M.; Nehme, R.; Pereira, R.B.; Andrés, S.; et al. Essential oil stabilisation by response surface methodology (RSM): Nanoemulsion formulation, physicochemical, microbiological, and sensory investigations. Molecules 2022, 27, 7330. [Google Scholar] [CrossRef] [PubMed]
  29. Zhang, H.; Li, H.; Zhang, Z.; Hou, T. Optimization of ultrasound-assisted extraction of polysaccharides from perilla seed meal by response surface methodology: Characterization and in vitro antioxidant activities. J. Food Sci. 2021, 86, 306–318. [Google Scholar] [CrossRef]
  30. Belwal, T.; Dhyani, P.; Bhatt, I.D.; Rawal, R.S.; Pande, V. Optimization extraction conditions for improving phenolic content and antioxidant activity in Berberis asiatica fruits using response surface methodology (RSM). Food Chem. 2016, 207, 115–124. [Google Scholar] [CrossRef]
  31. Dahmoune, F.; Remini, H.; Dairi, S.; Aoun, O.; Moussi, K.; Bouaoudia-Madi, N.; Adjeroud, N.; Kadri, N.; Lefsih, K.; Boughani, L.; et al. Ultrasound assisted extraction of phenolic compounds from P. lentiscus L. leaves: Comparative study of artificial neural network (ANN) versus degree of experiment for prediction ability of phenolic compounds recovery. Ind. Crops Prod. 2015, 77, 251–261. [Google Scholar] [CrossRef]
  32. Espada-Bellido, E.; Ferreiro-González, M.; Carrera, C.; Palma, M.; Barroso, C.G.; Barbero, G.F. Optimization of the ultrasound-assisted extraction of anthocyanins and total phenolic compounds in mulberry (Morus nigra) pulp. Food Chem. 2017, 219, 23–32. [Google Scholar] [CrossRef] [PubMed]
  33. Ghitescu, R.E.; Volf, I.; Carausu, C.; Bühlmann, A.M.; Gilca, I.A.; Popa, V.I. Optimization of ultrasound-assisted extraction of polyphenols from spruce wood bark. Ultrason. Sonochem. 2015, 22, 535–541. [Google Scholar] [CrossRef] [PubMed]
  34. He, B.; Zhang, L.L.; Yue, X.Y.; Liang, J.; Jiang, J.; Gao, X.L.; Yue, P.X. Optimization of Ultrasound-Assisted Extraction of phenolic compounds and anthocyanins from blueberry (Vaccinium ashei) wine pomace. Food Chem. 2016, 204, 70–76. [Google Scholar] [CrossRef]
  35. Mansour, R.B.; Wided, M.K.; Cluzet, S.; Krisa, S.; Richard, T.; Ksouri, R. LC-MS identification and preparative HPLC isolation of Frankenia pulverulenta phenolics with antioxidant and neuroprotective capacities in PC12 cell line. Pharm. Biol. 2017, 55, 880–887. [Google Scholar] [CrossRef] [PubMed] [Green Version]
  36. Boulaaba, M.; Medini, F.; Hajlaoui, H.; Mkadmini, K.; Falleh, H.; Ksouri, R.; Isoda, H.; Smaoui, A.; Abdelly, C. Biological activities and phytochemical analysis of phenolic extracts from Salsola kali L. Role of endogenous factors in the selection of the best plant extracts. S. Afr. J. Bot. 2019, 123, 193–199. [Google Scholar] [CrossRef]
  37. Hatano, T.; Kagawa, H.; Yasuhara, T.; Okuda, T. Two new flavonoids and other constituents in licorice root: Their relative astringency and radical scavenging effects. Chem. Pharm. Bull. 1988, 36, 2090–2097. [Google Scholar] [CrossRef] [Green Version]
  38. Chen, S.; Zeng, Z.; Hu, N.; Bai, B.; Wang, H.; Suo, Y. Simultaneous optimization of the ultrasound-assisted extraction for phenolic compounds content and antioxidant activity of Lycium ruthenicum Murr. fruit using response surface methodology. Food Chem. 2018, 242, 1–8. [Google Scholar] [CrossRef]
  39. Morelli, L.L.L.; Prado, M.A. Extraction optimization for antioxidant phenolic compounds in red grape jam using ultrasound with a response surface methodology. Ultrason. Sonochem. 2012, 19, 1144–1149. [Google Scholar] [CrossRef]
  40. Wu, Y.; Wang, X.; Xue, J.; Fan, E. Plant phenolics extraction from flos chrysanthemi: Response surface methodology based optimization and the correlation between extracts and free radical scavenging activity. J. Food Sci. 2017, 82, 2726–2733. [Google Scholar] [CrossRef] [Green Version]
  41. Kuo, C.H.; Hsiao, F.W.; Chen, J.H.; Hsieh, C.W.; Liu, Y.C.; Shieh, C.J. Kinetic aspects of ultrasound-accelerated lipase catalyzed acetylation and optimal synthesis of 4′-acetoxyresveratrol. Ultrason. Sonochem. 2013, 20, 546–552. [Google Scholar] [CrossRef]
  42. Singh, J.; Singh, V.; Shukla, S.; Rai, A.K. Phenolic content and antioxidant capacity of selected cucurbit fruits extracted with different solvents. J. Nutr. Food Sci. 2016, 6, 6. [Google Scholar] [CrossRef]
  43. Valenzuela, G.M.; Soro, A.S.; Tauguinas, A.L.; Gruszycki, M.R.; Cravzov, A.L.; Giménez, M.C.; Wirth, A. Evaluation polyphenol content and antioxidant activity in extracts of Cucurbita spp. Open Access Libr. J. 2014, 1, 1–6. [Google Scholar] [CrossRef]
  44. Kiat, V.V.; Siang, W.K.; Madhavan, P.; Chin, J.H.; Ahmad, M.; Akowuah, G.A. FT-IR profile and antiradical activity of dehulled kernels of apricot, almond and pumpkin. Res. J. Pharm. Biol. Chem. Sci. 2014, 5, 112–120. [Google Scholar]
  45. Martínez, C.; Valenzuela, J.L.; Jamilena, M. Genetic and pre-and postharvest factors influencing the content of antioxidants in cucurbit crops. Antioxidants 2021, 10, 894. [Google Scholar] [CrossRef]
  46. Busuioc, A.C.; Botezatu, A.V.D.; Furdui, B.; Vinatoru, C.; Maggi, F.; Caprioli, G.; Dinica, R.M. Comparative study of the chemical compositions and antioxidant activities of fresh juices from romanian Cucurbitaceae varieties. Molecules 2020, 25, 5468. [Google Scholar] [CrossRef]
  47. Da Porto, C.; Natolino, A. Extraction kinetic modelling of total polyphenols and total anthocyanins from saffron floral bio-residues: Comparison of extraction methods. Food Chem. 2018, 258, 137–143. [Google Scholar] [CrossRef]
  48. Dahmoune, F.; Spigno, G.; Moussi, K.; Remini, H.; Cherbal, A.; Madani, K. Pistacia lentiscus leaves as a source of phenolic compounds: Microwave-assisted extraction optimized and compared with ultrasound-assisted and conventional solvent extraction. Ind. Crops Prod. 2014, 61, 31–40. [Google Scholar] [CrossRef]
  49. Nayak, B.; Dahmoune, F.; Moussi, K.; Remini, H.; Dairi, S.; Aoun, O.; Khodir, M. Comparison of microwave, ultrasound and accelerated-assisted solvent extraction for recovery of polyphenols from Citrus sinensis peels. Food Chem. 2015, 187, 507–516. [Google Scholar] [CrossRef] [PubMed]
  50. Rice-Evans, C.A.; Miller, N.J.; Paganga, G. Antioxidant properties of phenolic compounds. Trends Plant Sci. 1997, 2, 152–159. [Google Scholar] [CrossRef]
  51. Saeed, R.; Ahmed, D.; Mushtaq, M. Ultrasound-aided enzyme-assisted efficient extraction of bioactive compounds from Gymnema sylvestre and optimization as per response surface methodology. Sustain. Chem. Pharm. 2022, 29, 100818. [Google Scholar] [CrossRef]
  52. Bashi, D.S.; Dowom, S.A.; Bazzaz, B.S.F.; Khanzadeh, F.; Soheili, V.; Mohammadpour, A. Evaluation, prediction and optimization the ultrasoundassisted extraction method using response surface methodology: Antioxidant and biological properties of Stachys parviflora L. Iran. J. Basic Med. Sci. 2016, 19, 829–841. [Google Scholar]
  53. Oloyede, F.M.; Obisesan, I.O.; Agbaje, G.O.; Obuotor, E.M. Effect of NPK fertilizer on chemical composition of pumpkin (Cucurbita pepo Linn.) seeds. Sci. World J. 2012, 2012, 808196. [Google Scholar] [CrossRef] [Green Version]
  54. Mokhtar, M.; Bouamar, S.; Di Lorenzo, A.; Temporini, C.; Daglia, M.; Riazi, A. The influence of ripeness on the phenolic content, antioxidant and antimicrobial activities of pumpkins (Cucurbita moschata Duchesne). Molecules 2021, 26, 3623. [Google Scholar] [CrossRef]
  55. Yang, Z.; Shi, L.; Qi, Y.; Xie, C.; Zhao, W.; Barrow, C.J.; Dunshea, F.R.; Suleria, H.A.R. Effect of processing on polyphenols in butternut pumpkin (Cucurbita moschata). Food Biosci. 2022, 49, 101925. [Google Scholar] [CrossRef]
  56. Iswaldi, I.; Gómez-Caravaca, A.M.; Lozano-Sánchez, J.; Arráez-Román, D.; Segura-Carretero, A.; Fernández-Gutiérrez, A. Profiling of phenolic and other polar compounds in zucchini (Cucurbita pepo L.) by reverse-phase high-performance liquid chromatography coupled to quadrupole time-of-flight mass spectrometry. Food Res. Int. 2013, 50, 77–84. [Google Scholar] [CrossRef]
  57. Hussain, A.; Kausar, T.; Sehar, S.; Sarwar, A.; Ashraf, A.H.; Jamil, M.A.; Noreen, S.; Rafique, A.; Iftikhar, K.; Quddoos, M.Y.; et al. A Comprehensive review of functional ingredients, especially bioactive compounds present in pumpkin peel, flesh and seeds, and their health benefits. Food Chem. Adv. 2022, 1, 100067. [Google Scholar] [CrossRef]
  58. Granato, D.; Santos, J.S.; Maciel, L.; Nunes, D.S. Chemical perspective and criticism on selected analytical methods used to estimate the total content of phenolic compounds in food matrices. TrAC Trends Anal. Chem. 2016, 80, 266–279. [Google Scholar] [CrossRef]
  59. Arnao, M.B. Some methodological problems in the determination of antioxidant activity using chromogen radicals: A practical case. Trends Food Sci Technol. 2000, 11, 419–421. [Google Scholar] [CrossRef]
  60. de Camargo, A.C.; Biasoto, A.C.; Schwember, A.R.; Granato, D.; Rasera, G.B.; Franchin, M.; Rosalen, P.L.; Alencar, S.M.; Shahidi, F. Should we ban total phenolics and antioxidant screening methods? The link between antioxidant potential and activation of NF-κB using phenolic compounds from grape by-products. Food Chem. 2019, 290, 229–238. [Google Scholar] [CrossRef]
  61. Ma, Y.; Ding, S.; Fei, Y.; Liu, G.; Jang, H.; Fang, J. Antimicrobial activity of anthocyanins and catechins against foodborne pathogens Escherichia coli and Salmonella. Food Control 2019, 106, 106712. [Google Scholar] [CrossRef]
  62. Caili, F.; Huan, S.; Quanhong, L. A review on pharmacological activities and utilization technologies of pumpkin. Plant Foods Hum. Nutr. 2006, 61, 73–80. [Google Scholar] [CrossRef] [PubMed]
  63. Levy, J.; Boyer, R.R.; Neilson, A.P.; O’Keefe, S.F.; Chu, H.S.S.; Williams, R.C.; Dorenkott, M.R.; Goodrich, K.M. Evaluation of peanut skin and grape seed extracts to inhibit growth of foodborne pathogens. Food Sci. Nutr. 2017, 5, 1130–1138. [Google Scholar] [CrossRef] [PubMed]
  64. Xiong, L.G.; Chen, Y.J.; Tong, J.W.; Huang, J.A.; Li, J.; Gong, Y.S.; Liu, Z.H. Tea polyphenol epigallocatechin gallate inhibits Escherichia coli by increasing endogenous oxidative stress. Food Chem. 2017, 217, 196–204. [Google Scholar] [CrossRef]
  65. Yen, G.C.; Duh, P.D.; Tsai, H.L. Antioxidant and pro-oxidant properties of ascorbic acid and gallic acid. Food Chem. 2002, 79, 307–313. [Google Scholar] [CrossRef]
  66. Hsu, H.; Sheth, C.C.; Veses, V. Herbal extracts with antifungal activity against Candida albicans: A systematic review. Mini-Rev. Med. Chem. 2021, 21, 90–117. [Google Scholar] [CrossRef] [PubMed]
  67. Kabbashi, A.; Koko, W.; Mohammed, S.; Musa, N.; Osman, E.; Dahab, M.; Allah, E.; Mohammed, A. In vitro amoebicidal and antioxidant activities of the plants Adansonia digitata and Cucurbit maxima. Adv. Med. Plant Res. 2014, 2, 50–57. [Google Scholar]
Figure 1. Curcubita maxima: whole plants and fruit (A), seeds (B), peel (C), and endocarp (D).
Processes 11 01726 g001
Figure 2. Optimization of sustainable and industrially applicable extraction processes of natural preservatives. DPPH ((A): peels; (B): endocarp; (C): seeds); total phenolic compound content (TPC) ((D): peels; (E); endocarp; (F): seeds). GAE: Gallic acid equivalents. DW: dry weight.
Processes 11 01726 g002
Figure 3. Correlation matrix between DPPH IC50, total phenolic compounds, and detected phenolic compounds of pumpkin by-products.
Processes 11 01726 g003
Figure 4. Microbial growth inhibition (expressed in %) against four microbial strains of squash by-products’ extracts obtained with maceration combined with ultrasonication (MUS) and after mathematical optimization (RSM). Values followed by different letters mean statistically significant differences (p < 0.01), according to Duncan’s multiple range test (DMRT).
Processes 11 01726 g004
Table 1. Coded levels, condition runs, and measured responses used in the implemented experimental design for response surface methodology.
Experiments aSeedsPeelsEndocarp
Independent VariablesResponsesIndependent VariablesResponsesIndependent VariablesResponses
Time (min) X1% Alcohol
X2
Temp (°C)
X3
YIP50 b (%I)YTPC c (mg
GAE/g
E)
Time (min) X1% Alcohol
X2
Temp (°C)
X3
YIP50 (%I)YTPC (mg
GAE/g
E)
Time (min) X1% Alcohol
X2
Temp (°C)
X3
YIP50 (%I)YTPC
(mg
GAE/g
E)
122.5015.0055.0049.4810.525.0050.0010.0065.3914.2310.0025.0030.0054.2611.51
222.5025.0055.0044.8512.3515.0050.0010.0066.7315.2410.0035.0030.0045.2911.58
322.5015.0065.0031.7011.595.0060.0010.0065.6116.0310.0025.0040.0060.4514.97
422.5025.0065.0045.6712.4315.0060.0010.0064.6815.2310.0035.0040.0043.7111.63
515.0015.0060.0041.3611.705.0055.005.0065.0614.925.0025.0035.0049.8211.82
615.0025.0060.0038.8912.0215.0055.005.0066.8416.425.0035.0035.0045.4711.81
730.0015.0060.0027.5710.055.0055.0015.0066.1616.2515.0025.0035.0055.4914.08
830.0025.0060.0039.3813.6015.0055.0015.0068.0115.6315.0035.0035.0038.589.98
915.0020.0055.0054.0913.2110.0050.005.0066.6416.235.0030.0030.0052.1813.44
1015.0020.0065.0032.5611.9310.0060.005.0068.8315.825.0030.0040.0043.9812.28
1130.0020.0055.0037.3812.4510.0050.0015.0068.4315.8315.0030.0030.0043.5412.72
1230.0020.0065.0042.2912.9910.0060.0015.0069.7016.8215.0030.0040.0051.7611.92
1322.5020.0060.0053.6814.4610.0055.0010.0070.9417.7210.0030.0035.0066.1915.88
1422.5020.0060.0053.2314.4110.0055.0010.0072.8017.9210.0030.0035.0067.1115.86
1522.5020.0060.0055.9014.6710.0055.0010.0072.6917.8210.0030.0035.0066.9015.95
1622.5020.0060.0052.0214.9810.0055.0010.0073.7818.1010.0030.0035.0066.2915.00
1722.5020.0060.0054.6914.6910.0055.0010.0073.6617.8210.0030.0035.0067.4815.16
a: standard order. b: inhibition percentage (IP50%) of DPPH at a concentration of 10 mg MS/mL. c: total phenolic compound content.
Table 2. Regression coefficients of the predicted second-order polynomial models for the DPPH scavenging activity and the total phenolic content.
DPPH TPC
CoefficientSignificance %CoefficientSignificance %
Peels
b 075.374***17.876***
Linear effect
b 10.925*0.13611.3%
b 20.734*0.296**
b 30.41618.6%0.14210.0%
Quadratic effect
b 11−7.027***−1.532***
b 22−4.745***−1.162***
b 33−2.230***−0.539**
Interaction effect
b 12−1.067*−0.452**
b 13−0.58219.0%−0.530**
b 23−0.23059.1%0.350*
Endocarp
b 066.794***15.570***
Linear effect
b 1−5.871***−0.922*
b 20.57912.6%0.19454.0%
b 3−0.26046.9%−0.08178.7%
Quadratic effect
b 11−8.196***−1.907**
b 22−7.671***−1.240*
b 33−11.258***−1.740**
Interaction effect
b 12−1.943**−0.8538.0%
b 13−3.140***−1.022*
b 234.105***0.09083%
Seeds
b 053.9.03 *** 14.64***
Linear effect
b 12.333 ** 0.817***
b 2−4.199 *** 0.05069.9%
b 3−2.334 ** 0.03081.0%
Quadratic effect
b 11−7.879 *** −1.858***
b 22−3.099 ** −1.061***
b 33−9.223 *** −0.936**
Interaction effect
b 124.651 *** −0.24919.3%
b 133.570 ** 0.807**
b 236.611 *** 0.454*
* Weakly significant at 0.05 < p ≤ 0.10, ** significant at 0.01 < p ≤ 0.05, *** highly significant at p ≤ 0.01; TPC: total phenolic compound content.
Table 3. Analysis of variance (ANOVA) of the second-order polynomial models for the DPPH scavenging activity (% of inhibition (IP)) and the total phenolic compounds content (TPC).
Source of VariationSum of SquaresDegrees of FreedomMean SquareFOBSSignificance
Peels (response YIP)
Regression372.2282941.358763.6624***
Residuals4.547670.6497
Validity3.683331.22785.68206.5%
Pure error0.864340.2161
Total376.775816
FOBS (63.6624) ˃ Ftabulated (3.68)
Peels (response YTPC)
Regression21.851592.427952.7332***
Residuals0.322370.0460
Validity0.239630.07993.861611.3%
Pure error0.082740.0207
Total22.173816
FOBS (52.7332) ˃ Ftabulated (3.68)
Endocarp (response YIP)
Regression1.585091.7612194.8989***
Residuals6.325579.0364
Validity5.125031.70835.69206.5%
Pure error1.2005243.0013
Total1.5914116
FOBS (194.8989) ˃ Ftabulated (3.68)
Endocarp (response YTPC)
Regression52.718395.85768.3155**
Residuals4.930970.7044
Validity4.113331.37116.70805.0%
Pure error0.817640.2044
Total57.649216
FOBS (8.3155) ˃ Ftabulated (3.68)
Seeds (response YIP) a
Regression34.3791.41272.3968***
Residuals1.36571.951
Validity5.011731.6760.772956.8%
Pure error8.64542.161
Total1.28916
FOBS (72.39) ˃ Ftabulated (3.68)
Seeds (response YTPC) b
Regression34.3793.0131.5245***
Residuals0.84870.121
Validity0.64530.21524.25539.9%
Pure error0.20240.0506
Total35.2216
FOBS (31.52) ˃ Ftabulated (3.68)
a The coefficient of determination (R2) of the model was 0.989. b The coefficient of determination (R2) of the model was 0.976. YIP: yield of inhibition percentage; YTPC: yield of total phenolic compound content. ** significant at 0.01 < p ≤ 0.05, *** highly significant at p ≤ 0.01.
Table 4. Predicted and experimental values of the responses obtained under optimal conditions.
Process VariablesExperimental Value aPredicted Value
RunTime (min) X1% Alcohol
X2
Temp (°C)
X3
DPPH
Scavenging
TPC (mg/g)DPPH
Scavenging
TPC (mg/g)
Peels11.2312.1755.1575 ± 0.3117.5 ± 0.2775.3717.88
Seeds22.520.0060.0053.5 ± 0.2214.5 ± 0.3853.9014.64
Endocarp10.5428.4536.8865.9 ± 0.4416 ± 0.3266.7915.57
a Mean ± standard deviation (n = 3). TPC: total phenolic compound content.
Table 5. Total phenolic compound content (TPC, expressed as mg GAE/g E) and antiradical activity (DPPH test, expressed as inhibition concentration at 50% or IC50) of squash by-product extracts obtained with maceration combined with ultrasonication (MUS) and after mathematical optimization (response surface methodology, RSM).
By-ProductsPeelSeedsEndocarp
MUSRSMMUSRSMMUSRSM
TPC76 ± 1.5 a17.5 ± 0.3121.2 ± 3.514.5 ± 0.457.6 ± 0.216 ± 0.3
DPPH Test 650 ± 10.775 ± 2.3340 ± 7.253.5 ± 0.2730 ± 0.865.9 ± 0.4
a Mean ± standard deviation (n = 3). Ethanol 80%: 30 min.
Table 6. RP-HPLC/UV phenolic compounds from squash by-products’ extracts. Values are expressed as milligrams per gram of extract (mg/g E). Recovery is expressed in percentage. RT: retention time, LOD: limit of detection; LOQ: limit of quantification. Values with different superscripts within a line are significantly different at p < 0.05, according to Duncan’s multiple range test (DMRT).
CompoundsRT (min)Content (mg g−1)R2Standard Curve (Regression Equation)Recovery (%)LOD (µg/mL)LOQ (µg/mL)
SeedsPeelsEndocarp
1Vanillic acid5.12 ± 0.070.177 ± 0.02 b0.152 ± 0.09 b0.801 ± 0.01 a1y = 22.285x + 1.6898.7 ± 2.131.234.33
2Gallic acid6.1 ± 0.030.035 ± 0.01 a--1y = 22.28x + 1.68100.2 ± 3.131.505.1
3Catechin gallate7.3 ± 0.102.18 ± 0.14 a1.69 ± 0.03 b2.003 ± 0.03 a1y = 3.63x + 1.8100 ± 3.040.270.87
4Hydroxytyrosol9.15 ± 0.21-2.71 ± 0.22 a1.7 ± 0.31 b0.95y = 9.878x − 4.308100 ± 1.840.973.88
5Epigallocatechin10.6 ± 0.711.129 ± 0.12 c2.92 ± 0.11 b22.42 ± 1.12 a1y = 3.63x + 1.897.7 ± 1.200.211.13
6Resorcinol11.5 ± 0.1-0.198 ± 0.07 a-0.99y = 9.878x − 4.30899.6 ± 5.120.070.84
7Chlorogenic acid11.6 ± 0.090.657 ± 0.03 a-0.576 ± 0.02 a0.99y = 9.02x − 1.5597.2 ± 0.830.151.09
8Epicatechin13.8 ± 0.122.296 ± 0.15 c4.243 ± 0.51 b9.78 ± 0.05 a1y = 3.63x + 1.897.1 ± 1.511.084.67
9Rutin16.44 ± 0.50.480 ± 0.04 a0.240 ± 0.03 b0.511 ± 0.0 a1y = 9.58x − 7.4195.9 ± 2.741.494.51
10Ferulic acid18.87 ± 0.230.198 ± 0.03 a--1y = 20.50x − 8.72100.6 ± 4.080.421.26
12Myrecitin22.50 ± 0.07-0.050 ± 0.02 a-0.99y = 67.91x − 35.3599.8 ± 1.010.090.77
13Resveratrol24.5 ± 0.470.538 ± 0.03 b0.908 ± 0.05 a-0.99y = 9.87x − 4.30899.2 ± 0.990.41.30
Total 7.69 c13.10 b37.79 a
Disclaimer/Publisher’s Note: The statements, opinions and data contained in all publications are solely those of the individual author(s) and contributor(s) and not of MDPI and/or the editor(s). MDPI and/or the editor(s) disclaim responsibility for any injury to people or property resulting from any ideas, methods, instructions or products referred to in the content.

