Abstract
Capsicum chinense Jacq., from the Yucatan peninsula, is recognized worldwide for its pungency, flavor, and secondary metabolites content. This has resulted in an increase in its production, which has led to an increase in the number of byproducts considered waste, mainly its leaves. Capsicum chinense leaves have been demonstrated to contain polyphenols with bioactive properties (antioxidant, anti-inflammatory, antiobesogenic capacity, etc.); hence, the extraction of polyphenols through the use of natural deep eutectic solvents (NADES) with a green technology, such as an ultrasonic probe, could help to revalue these leaves by maximizing the extraction efficiency and preserving their bioactive properties. The objective of this study was to optimize the composition of a eutectic solvent for obtaining an extract rich in polyphenols from the Capsicum chinense leaf using a sonic probe. The optimum conditions of the composition of NADES for obtaining the highest Antioxidant capacity (Ax, 79.71% inhibition) were a 0.8 mol glucose to 1 mol of choline chloride ratio, and 12% water. In addition, with this composition, the Total Polyphenol Content (TPC) obtained was 165.39 mg GAE/100 g dry leaf, and the individual polyphenols, such as vanillin (19.15 mg/100 g dry leaf) and ferulic acid (1.35 mg/100 g dry leaf), were optimized. The habanero pepper leaf extract obtained using a eutectic solvent and a sonic probe demonstrated a high potential for use as an ingredient in the development of nutraceuticals (i.e., functional foods).
1. Introduction
The Habanero pepper (Capsicum chinense Jacq.) is globally recognized for its unique characteristics, including its organoleptic properties, shelf life, and a high levels of bioactive compounds. Capsaicin is the most recognized bioactive compound in the fruit, but the habanero pepper plant also contains polyphenols, vitamin C, and carotenoids. These compounds are present due to a long process of adaptation of the plant to both the soil and climatic conditions of the Yucatan peninsula (Yucatan, Quintana Roo, and Campeche). It has been recognized that both the region and anthropogenic conditions can have an effect on these unique characteristics. As a result, the Habanero pepper of both Mayapan and Jaguar varieties received an official Designation of origin in 2010 [1,2,3].
The habanero pepper has gained worldwide recognition and aroused the interest of various industries, such as the pharmaceutical and food industries [4], which has led to an increase in its production in the Yucatán peninsula. Consequently, the production of up to 9.7 million plants has resulted in agro-industrial waste (byproducts) at the end of their productive cycle, comprising stems, peduncles, and leaves [5,6].
Currently, the byproducts of Habanero pepper cultivation in Southeast Mexico represent 80% of the non-industrialized crop. Consequently, these byproducts are usually discarded or burned after the fruit is harvested [6]. However, an increased interest in the leaves of Capsicum has been reported due to their anti-inflammatory properties [7,8] and antioxidant activity [9], with the latter resulting from important biomolecules, such as proteins, fats [10], phenolic acids, flavonoids [11], coumarins, terpenoids, saponins, and polyphenols [10].
Among the secondary metabolites present in the leaves of the Habanero pepper, polyphenols are of great interest due to their diverse bioactive properties, such as their antioxidant, anti-inflammatory, anticancer, and hypoglycemic abilities [12], among others. However, to ensure consumer safety, the extraction of these metabolites must be performed using techniques and solvents that align with the aims of green technology, namely reducing the toxicity, costs, environmental pollution, and risks to those involved in the extraction [13,14]. As a result, the resulting extracts could then be deemed to be generally recognized as safe (GRAS), while also ensuring an extraction yield comparable to (or greater than) current technologies. Recently, it has been reported that the solvents that best align with the principles of green chemistry are natural deep eutectic solvents (NADES), as they have high biodegradability, are potentially recyclable, and are safe for human consumption, thereby achieving the GRAS status [15]. NADES are a mixture of two or more natural origin reagents (primary metabolites), where at least one is a hydrogen bond donor (HBD) while the others are hydrogen bond acceptors (HBA), and is made at constant temperature greater than 80 °C for an established period of time (>2 h). This high temperature increases the interaction of their molecules (hydrogen bonds), resulting in a liquid phase at room temperature. The molar ratio between HBD and HBA is also a relevant factor, since NADES have been implemented as solvents for the extraction of bioactive compounds [16,17]. Therefore, by varying this ratio, the extraction efficiency of the bioactive compounds of interest could be modified, depending on the amount of water added and the extraction technology implemented [18,19].
NADES have been used with other byproduct extraction techniques, such as liquid–liquid extraction, maceration (agitation and heating), high-voltage electrical discharge, microwave-assisted extraction, and ultrasound-assisted extraction, to obtain polyphenols from these agricultural byproducts [20]. Among such techniques, ultrasound-assisted extraction (UAE) using NADES has shown higher yield than organic solvents (e.g., ethanol, methanol, and water) in the extraction of phenolic compounds, in addition to having low costs and a low toxicity of resulting agricultural byproduct extract [16,21,22].
In a study conducted by Jeong et al. [23], phenolic compounds were extracted from mint leaves using various eutectic solvents; choline chloride and glucose in a 5:2 mol/mol ratio proved to be an effective eutectic solvent. The extract obtained had a high polyphenol concentration of over 75 mg GAE/g dry leaf, significantly higher than extracts obtained with water, methanol, or ethanol (sonic bath, <50 mg GAE/g dry leaf). In UAE, ultrasound probe (sonotrode) extraction has shown better performance than using sonication bath with organic solvents for extracting bioactive compounds [24,25,26,27]. Moreover, Aznar-Ramos et al. [28] evaluated phenolic compound extraction from mango byproducts using both methods. Sonic probe extracts had higher phenolic compound concentrations (3.9–9.4 mg/g dry weight) under optimal conditions, compared to sonic bath extracts (1.6–8.7 mg/g dry weight). Sonic probe extracts also had 33% more individual polyphenols, in addition to a shorter extraction time (18 min) than for sonic bath extracts (60 min). Higher concentrations in sonic probe extracts are due to the direct application of higher ultrasonic intensity, whereas water and container materials in the sonic bath attenuate the intensity, resulting in lower efficiency and reproducibility [26,28]. Sonic probes have been recently used with natural eutectic solvents for the extraction of phenolic compounds from agricultural byproducts. Duarte et al. [29] extracted polyphenols from Pinus pinaster spines using a eutectic solvent of choline chloride (HBA) and levulinic acid (HBD) in a 70:30 v/v ratio. The resulting extracts had a higher concentration (>20 mg GAE/g dry sample) compared to water and methanol organic solvents (<10 mg GAE/g dry sample). To the best of our knowledge, the use of a sonic probe in conjunction with the optimal NADES composition for extracting phenolic compounds and other secondary metabolites from habanero pepper byproducts, particularly leaves, has not been reported in the literature. Therefore, the use of response surface methodology (RSM) as a mathematical tool to determine the optimal NADES composition (as well as to predict the bioactive compounds in the extracts) could aid in the development of more efficient and sustainable extraction methodologies. Therefore, the objective of this study was to optimize the composition of a natural deep eutectic solvent for obtaining a habanero pepper leaf extract (Capsicum chinense Jacq.) rich in polyphenols, using an ultrasound probe.
2. Materials and Methods
2.1. Raw Material
Habanero pepper leaves (Capsicum chinense Jacq.) of the Jaguar variety were used. The habanero pepper plant was grown in black soil (Boox Lu’um, Mayan name) in the town of Chablekal, Yucatán (21°06′02.3″ N, 89°33′40.5″ W) under greenhouse conditions. The leaves used were collected from the first fruit that were harvested, which occurred 120 days after transplanting.
2.2. Habanero Pepper Drying Leaf Process
This process was carried out following the procedures reported by Chel-Guerrero et al. [6], with some modifications. The first step consisted of separating the leaves of the habanero pepper plants. Then, the leaves were placed in a stainless-steel tray dryer (HS60-AID model) at 44 °C for 48 h, until they reached a moisture content less than 5%.
Following the drying process, the habanero pepper leaves were ground using a Braun® coffee grinder (Treviso, Italy, model KSM-2). The resulting powder was then passed through a 500 µm (#35, Fisher Scientific, Boston, MA, USA) mesh sieve to obtain particles of uniform size. The powder was stored in airtight plastic bags that were lined with aluminum foil at room temperature, until further use.
2.3. Preparation of Natural Deep Eutectic Solvents
The natural deep eutectic solvent was obtained using the method described by Mansinhos et al. [16]. The components (choline chloride as the hydrogen acceptor (molecular weight 139.63 g/mol) and glucose as the hydrogen donor (molecular weight 180.16 g/mol)) were mixed in molar ratios of 1:1 (−1, low level), 1:1.5 (0, central point), and 1:2 (1, high level), in accordance with the experimental design (Table 1). To form the liquid phase of the eutectic solvent, it was heated to a constant temperature of 90 °C while being stirred in a water bath, until a pale yellowish liquid phase was reached (>2 h).

Table 1.
Central compound design 22 to optimize the composition of a natural deep eutectic solvent containing choline chloride and glucose.
2.4. Experimental Design for a Natural Deep Eutectic Solvent Composition Improvement
In order to enhance the extraction efficiency of phenolic compounds from habanero pepper leaves using a sonic probe, a central composite design (CCD) 22 was implemented to optimize the composition of a natural deep eutectic solvent (NADES) containing choline chloride and glucose.
Using the response surface methodology (RSM), the preliminary experimental design involved two factors, each with two levels, and 4 central points, yielding a total of 8 experiments (first design). Subsequently, an additional 4 experiments known as “star points” will be carried out only after confirming the lack of fit of the linear model from the first design, considering total polyphenol content (TPC) as the main variable response.
Table 1 exhibits the two levels of the molar ratio (MoR) factors of glucose to 1 mole of choline chloride, and the percentage of added water (%). The lowest level corresponds to a 1:1 molar ratio (Glucose: Choline chloride, mol/mol), while the highest level is a 2:1 ratio (Glucose: Choline chloride, mol/mol). Regarding the second factor, the percentage of added water varied from 20% as the lowest level to 60% as the highest level. The 4 central points were determined using a molar ratio of Glucose: Choline Chloride of 1.5:1 mol/mol and a water percentage of 40%. According to the experimental design, the first two “star points” were found to have a Glucose: Choline Chloride molar ratio of 0.8:1 mol/mol and 2.2:1 mol/mol, both in combination with the central value of the percentage of added water (40%). Meanwhile, the last two “star points” were determined with a percentage of added water of 12% and 68%, in combination with the central value of the MoR (1.5:1 mol/mol, Glucose: Choline chloride).
Sonic Probe and Bath-Assisted Extraction of Phenolic Compounds from Habanero Pepper Leaves
In order to extract polyphenols from habanero pepper leaves, a procedure described by Duarte et al. [29] was followed, with some modifications. A sample of leaf powder (1 g) was carefully placed into amber vials (20 mL), to which 10 mL of eutectic solvent was subsequently added (MoR and %water added in accordance with the experimental design). Samples were completely mixed by shaking them with a vortex mixer (Thermo scientific®, Mexico City, México, model vortex mixer Maxi Mix® II), and were then subjected to ultrasonic (sonic probe) treatment for 5 min (750 W, 20 kHz, 30% amplitude) using the Sonics Vibra cell® (Sonics®, New York, NY, USA, model CV 505) equipment. Then, the samples were centrifuged at 4700 rpm for 30 min at 4 °C to separate the extract from the solid residue. The supernatant was carefully collected and filtered (0.22 µm nylon filter), before being transferred to chromatographic vials. Finally, vials were refrigerated until subsequent analysis.
In order to compare the results obtained from the sonic probe with the sonic bath (after optimization), the NADES (natural deep eutectic solvent) was used to extract polyphenols from Habanero pepper leaves using the sonic bath ultrasound method. A sample of leaf powder (1 g) was placed into 20 mL amber vials, followed by the addition of 10 mL of the optimized eutectic solvent. The mixture was subjected to sonication for 30 min.
2.5. Total Polyphenol Content Evaluation in Habanero Pepper Leaf Extract
The polyphenolic content of the habanero pepper leaf extracts was determined using the Folin–Ciocalteu method (with some modifications), following the procedure described by Singleton et al. [30]. Firstly, 25 µL of the habanero pepper leaf extract was mixed with 25 µL of distilled water, followed by the addition of 3 mL of water and 250 µL of Folin reagent (Sigma-Aldrich®, St. Louis, MO, USA). After 5 min, 750 µL of 20% sodium carbonate (Na2CO3, Sigma Aldrich) and 950 µL of distilled water were added, and the mixture was left to stand for 30 min. The samples were then analyzed at 765 nm using a UV–Vis spectrophotometer (Thermo scientific®, Mexico City, México, model Genesys 140). Prior to sample analysis, a calibration curve was generated with gallic acid (0.005–0.1 mg/mL), obtaining an R2 = 0.9993 (Figure S1).
2.6. Determination and Identification of Phenolic Compounds in Habanero Pepper Leaf Extracts
The quantification and identification of polyphenols in habanero pepper (Capsicum chinense Jacq.) leaf extracts using eutectic solvents and a sonic probe was accomplished by utilizing an Acquity UPLC H-Class system (Waters, Milford, MA, USA) with a diode array detector (DAD) and an Acquity UPLC HSS C18 column (Waters, Milford, MA, USA), following the procedure reported by Oney-Montalvo et al. [31].
To quantify the polyphenols, a calibration curve was prepared using 17 polyphenol standards (Sigma-Aldrich®, St. Louis, MO, USA). The calibration curve was generated by creating a stock solution with a concentration of 1 mg/mL (prepared from 1 to 75 μg mL−1) that included gallic acid, protocatechuic acid, chlorogenic acid, coumaric acid, cinnamic acid, catechin, rutin, kaempferol, quercetin, luteolin, vanillin, ferulic acid, diosmin, hesperidin, neohesperidin, naringenin, apigenin, and diosmetin.
Both the calibration curve and the samples were subjected to analysis at a column temperature of 45 °C, with an injection volume of 2 µL. The detection wavelength was set at 280 nm, and the solvents used were: 0.2% acetic acid as solvent A, and acetonitrile with 0.1% acetic acid as solvent B. Each injection had a duration of 15 min, where the gradient for elution was as follows: from 99% A to 70% A from 0 to 10 min, followed by a steady 70% A from 10 to 12 min, and finally from 70% A back to 99% A for the final 3 min.
The polyphenols in the samples were determined and quantified by analyzing the area under the retention time curve obtained from the calibration curve. Quercetin and luteolin, as well as diosmin and hesperidin, were quantified collectively, due to their overlapping peaks during analysis.
2.7. Evaluation of the Antioxidant Capacity of Habanero Pepper Leaf Extract
The evaluation of the antioxidant capacity (Ax) of extracts obtained through sonication-assisted extraction with sonic probe using various eutectic solvents was conducted through the implementation of the DPPH methodology, following the protocol established by Chel-Guerrero et al. [6]. A quantity of 3.3 mg of DPPH was brought to a final volume of 100 mL by means of being gauged with methanol. The resulting solution was then standardized to an absorbance of 0.700 ± 0.002 at 515 nm, before being assessed with a Thermo scientific® UV–vis spectrophotometer (México city, México, Genesys 140).
Following the standardization of the DPPH absorbance, a 100 µL aliquot of the habanero pepper leaf extract was mixed with 3.9 mL of the adjusted DPPH-solution. The resulting solution was agitated and allowed to incubate for 30 min, and the absorbance (Abs) reading was taken at 515 nm. Ax was registered as the percentage of inhibition, calculated using Equation (1):
% DPPH Inhibition = 100 − [(leaf extract Abs ∗ 100)/(Adjusted DPPH-solution Abs)]
2.8. Vitamin C Identification and Quantification in Habanero Pepper Leaf Extracts
Vitamin C quantification was conducted by injecting a mobile phase of 0.1% formic acid in a volume of 2 µL with a flow rate of 0.25 mL/min in the equipment. The column was maintained at 27 °C, and a diode array detector (DAD) was used to measure samples at a wavelength of 244 nm, as stated in the study by Chel-Guerrero et al. [6]. Retention times were compared with a previously prepared calibration curve of ascorbic acid (0.5 to 5 µg/mL) prior to the injection of the samples.
2.9. Statistical Analysis
The experiments were conducted randomly. Triplicate measurements were taken for each extract obtained from the experimental design to determine total and individual polyphenols, as well as the Ax. The data are reported as means ± standard deviations. First and second order model fit analysis, canonical analysis, regression coefficients, principal component analysis (PCA) and data analysis were carried out using Statgraphics Centurion XVII.II-X64 software (Statgraphics Technologies Inc., Virgin, UT, USA) and R software version 4.3.0 (The R Foundation for Statistical Computing, Vienna, Austria).
3. Results
3.1. Total Polyphenol Content and Antioxidant Capacity of the Habanero Pepper Leaf Extract
The TPC values of the extracts were the highest (p < 0.05) in those samples with a molar ratio of 1:1 mol/mol (Glucose: Choline chloride) and both concentrations of added water (20% or 60%), with recorded values of 205.40 ± 10.00 mg GAE/100 g Dry Leaf (DL) and 206.75 ± 6.22 mg GAE/100 g DL, respectively. On the other hand, the extract with a molar ratio of 1.5:1 mol/mol (Glucose: Choline chloride) and 12% added water exhibited the lowest TPC concentration.
This study employed a 22 CCD to investigate the antioxidant capacity (Ax) of habanero pepper leaf extracts obtained through ultrasound using a sonic probe. Results (Table 2) indicated that the highest Ax values were achieved using a eutectic solvent with MoR of 1:1 mol/mol (Glucose: Choline chloride) with 20% added water (82.22 ± 1.81% inhibition). For MoR of 1.5:1 mol/mol (Glucose: Choline chloride) with 68% added water (77.57 ± 0.68% inhibition), no statistical difference was found (p > 0.05). On the other hand, the lowest Ax values were obtained within a range of 44% to 45.44% inhibition (p > 0.05), with MoR conditions ranging from 0.8:1 mol/mol to 2.2:1 mol/mol (Glucose: Choline chloride), of which all cases presented the percentage of 40% added water.
Table 2.
Values of total polyphenol content and antioxidant capacity from habanero pepper leaf extract obtained from central composite design (22) to optimize natural deep eutectic solvent composition.
3.1.1. Linear and Quadratic Model Analysis of Total Polyphenol Content and Antioxidant Capacity from Habanero Pepper Leaf Extract
The results obtained from the initial experimental design, comprising the first eigh experiments, were subjected to a multiple linear regression analysis. A lack of adjustment to a linear model for the TPC as the major response variable was found. This conclusion was based on the evidence, where the p-value was 0.7170 (R2 = 3.11). Table S1 shows the Ax multiple linear regression analysis results.
This lack of fit permitted us to implement a second experimental design, consisting of the star points (experiments 9 to 12) shown in Table 1, in accordance with the response surface methodology (RSM). Subsequently, a multiple regression analysis was performed. The analysis was carried out by incorporating the data obtained from both the first and the second experimental design, totaling twelve experiments in CCD 22 (Table 1). The analysis showed that the TPC of habanero pepper leaves fit at a second order model (R2 = 60.49), as evidenced by a p-value < 0.05.
The data analysis yielded regression coefficients (Table S2) that allowed to develop Equation (2) to predict the total polyphenol concentration in habanero pepper leaf extracts (mg GAE/100 g DL) obtained using a sonication method (probe) with a eutectic solvent consisting of glucose and choline chloride. The equation incorporated the factors MoR (X1) and percentage (%) of added water (X2):
TPC (mg GAE/100 g DL) = 641.499 − 664.651 X1 − 2.83571 X2 + 221.832 X12 − 0.645083 X1 X2 + 0.0535536 X22
X1 = Molar ratio of glucose to 1 mol choline chloride (MoR)
X2 = Added Water Percentage to NADES (%)
According to the mathematical model obtained for the TPC, the optimal conditions for obtaining the maximum concentration of phenolic compounds (271.46 mg/GAE/100 DL) in habanero pepper leaf extracts using a sonic probe and a eutectic solvent were the molar ratio of 0.8:1 mol/mol (Glucose: Choline chloride) with a 68% added water.
The characterization of the response surface for the TPC resulted in a plateau of minima. Figure 1a shows the minimum response in the blue area, while the maximum response area is represented in red. Figure 1b shows the contour plot where the maximum (red-orange) and minimum (blue) response of the dependent variable TPC was also observed. The symbol “+” identifies the optimal value predicted (0.8 mol Glucose and 68% added water) by the model, or the intersection between the best conditions of the MoR and percentage of added water.
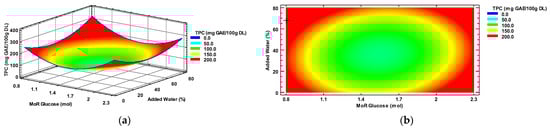
Figure 1.
(a) Total polyphenol content response surface, and (b) contour plots, by factors of input molar ratio of glucose/choline chloride and percentage of added water. TPC = Total polyphenol content; MoR = glucose ratio per mol of choline chloride; GAE = gallic acid equivalent; DL = Dry leaf.
The results of the analysis of variance of the complete experimental design (Table S3) also indicate that the quadratic terms of factors MoR (X12) and percentage of added water (X22) exert a significant influence on the concentration of extracted polyphenols from the habanero pepper leaves, with p-values of <0.0001 and 0.0208, respectively. In contrast, the nonquadratic terms and the interaction between the factors exhibited no statistically significant effect (p > 0.05).
Multiple linear regression analyses were also conducted on all Ax values from the data set of the first and second experimental designs (CCD 22), including the first eight experiments and four star points, respectively. Based on the results of the multiple regression analysis, the regression coefficients (Table S4) were fitted to the model with a R2 = 69.89, which were then used to develop the prediction Equation (3) for the Ax of a habanero pepper leaf extract obtained with a NADES.
The prediction equation for Ax is presented below:
Ax (% Inhibition) = 130.614 − 6.39756X1 − 3.15866X2 − 6.31696X12 + 0.0913333X1X2 + 0.0370936 X22
X1 = Molar ratio of glucose to 1 mol choline chloride (MoR)
X2 = Added Water Percentage to NADES (%)
The ideal conditions for achieving the highest Ax in extracts from Habanero pepper leaves can be determined based on the mathematical model for the percentage of inhibition.
Figure 2 displays the response surface (a) and the contour plot (b). It can be observed that the characterization displays a saddle-shaped plateau with both maximums and minimums. In both Figure 2a,b, the intersections of the conditions of MoR and water percentage at the blue zone represent the lowest attainable Ax (% inhibition) of a habanero pepper leaf extract, while the red area represents the highest attainable Ax. Optimal Ax, under the MoR and percentage of added water conditions, is identified with the symbol “+” in Figure 2b.
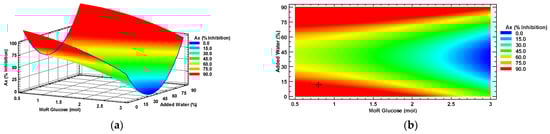
Figure 2.
Antioxidant capacity response surface (a) and contour (b) plots by factors of the input molar ratio of glucose and percentage of added water. MoR = glucose ratio per mol of choline chloride; Ax = Antioxidant capacity.
Optimal conditions were predicted to obtain an optimal Ax (89.76% inhibition) by using a molar ratio of 0.8:1 mol/mol of glucose to choline chloride and adding 12% water to the NADES.
The analysis of variance (ANOVA) conducted on the Ax values from de CCD 22 (Table S5) reveals that the MoR factor (X1) and the square term of the factor of added water (X22) have a significant effect (p < 0.05) on the Ax of habanero pepper leaf extracts obtained using a sonic probe. However, the term of added water (X2), the quadratic term of the factor MoR (X12), and the interaction between the main factors (X1X2) do not show a significant effect on the Ax of the extract (p > 0.05).
3.1.2. Model Validation for Total Polyphenol Content and Antioxidant Capacity
To validate the mathematical models generated using the response surface methodology for TPC and Ax, the conditions of MoR = 0.8:1 mol/mol (Glucose: Choline Chloride) and 12% added water were selected in order to reduce water consumption during extractions using a sonic probe.
The mathematical model predicted a concentration of 145.63 mg GAE/100 g DL and an Ax of 89.76% Inhibition, while the actual values obtained under the validation conditions were 165.39 mg GAE/100 g DL and 79.71% Inhibition, respectively. The percentage error for TPC was 13.56%, while for Ax it was 11.19%. Thus, the mathematical model is considered suitable for predicting both response variables in a Habanero pepper leaf extract obtained with the sonic probe using a eutectic solvent.
3.2. Individual Polyphenols of the Habanero Pepper Leaf Extract
It was observed (by following the identification and quantification of specific polyphenols in extracts of Habanero pepper leaves acquired under distinct conditions of MoR and water, via CCD 22 (Table 3 and Table 4) that the highest concentration (p < 0.05) of quercetin + luteolin (27.16 ± 0.61 mg/100 g DL) and naringenin (9.96 ± 0.10 mg/100 g DL) was achieved with 1:1 mol/mol (Glucose: Choline Chloride) and a 20% water content (Experiment #1). The highest concentrations of kaempferol (42.14 ± 0.95 mg/100 g DL) and apigenin (8.86 ± 0.10 mg/100 g DL) were obtain with 2:1 mol/mol, Glucose: Choline Chloride and 20% added water). The central point (1.5:1 mol/mol, Glucose: Choline Chloride and 40% added water, experiment #5) resulted in the highest concentration of catechin (37.08 ± 1.01 mg/100 g DL), diosmin + hesperidin (152.49 ± 4.90 mg/100 g/DL), neohesperidin (19.67 ± 2.35 mg/100 g DL), and ferulic Acid (8.21 ± 0.15 mg/100 g DL).
Table 3.
Individual polyphenols identified in habanero pepper leaf obtained from CCD 22 for the natural deep eutectic solvent optimization.
Table 4.
Individual polyphenols identified in habanero pepper leaf obtained from CCD 22 for the Natural Deep Eutectic Solvent composition optimization.
The highest concentration of rutin (22.57 ± 1.63 mg/100 g DL) obtained through CCD 22 was achieved with experiment #9 (Star point), where a molar ratio of 0.8:1 mol/mol (Glucose: Choline Chloride) and 40% added water were used. Similarly, the highest concentration of cinnamic acid (8.63 ± 0.23 mg/100 g DL) and vanillin (15.63 ± 0.36 mg/100 g DL) was obtained under star point conditions (Experiment #10).
Finally, the highest concentration of protocatechuic acid (26.46 ± 0.13 mg/100 g DL) and chlorogenic acid (14.29 ± 3.90) were obtained using a MoR of 1.5:1 mol/mol (Glucose: Choline Chloride) and 68% added water (Experiment #12, star point).
3.2.1. Modelling of Individual Polyphenols from Habanero Pepper Leaf Extract
Those individual polyphenol values obtained from CDD 22 which were not well fitted to a first-order model (Table S6) were subjected to multiple linear regression analysis to fit a second-order model. Table 5 presents the results obtained, wherein only protocatechuic acid, catechin, chlorogenic acid, quercetin + luteolin, kaempferol, vanillin, diosmin + hesperidin, neohesperidin, naringenin, apigenin, and ferulic Acid were fitted to a second-order fitting.
Table 5.
Multiple Regression Results and Prediction Equations for Second-Order Model Fit Analysis of Individual Polyphenols.
In the present study, the modeling was exclusively performed on those polyphenols that exhibited a suitable adjustment (R2 > 0.7) to a quadratic model.
Figure 3a shows the response surface graph for vanillin, where the red color indicates the areas of maximum possible response, obtained with the intersection of the optimal conditions (MoR, %water) of the NADES composition for maximum extraction of vanillin from the habanero pepper using a sonic probe. The contour plot (Figure 3b), showed with the symbol “+”, indicates the maximum response predicted using the mathematical model, predicting a concentration of 14.38 mg of vanillin in 100 g of habanero pepper dry leaf using a molar ratio of 2.2:1 mol/mol (Glucose: Choline Chloride) and 36% of added water.
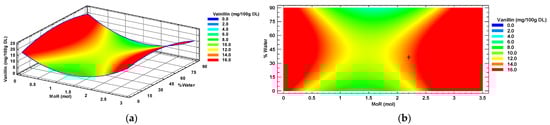
Figure 3.
Vanillin response surface (a) and contour (b) plots by factors of input molar ratio of glucose and percentage of added water. MoR = glucose ratio per mol of choline chloride; DL = Dry Leaf.
According to the ANOVA of the individual polyphenol data of vanillin, only the quadratic terms of the MoR (X12) and added water percentage (X22) factors had a significant effect (p < 0.0001, for both factors) on the concentration of this metabolite in the extract of Habanero pepper leaf obtained using the sonic probe.
Diosmin + hesperidin (D + H) also showed a suitable second-order model fit (R2 > 0.7). A response surface (Figure 4a) corresponding to a plateau of maxima was obtained. In Figure 4b, the zone of maximum response in the center is shown in red color, surrounded by a zone of minimum response (blue color). The optimal value (“+”) was identified at the center of the maximum response zone, which is the point where the optimal conditions of MoR (1.5:1 mol/mol, Glucose: Choline Chloride) and added water (27%) intersected to obtain the maximum concentration of diosmin + hesperidin (149 mg/100 g DL) in a habanero pepper leaf extract.
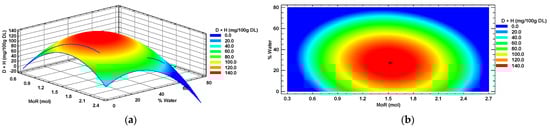
Figure 4.
Diosmin + hesperidin (D + H) response surface (a) and contour (b) plots by factors of input molar ratio of glucose and percentage of added water. MoR = glucose ratio per mol of choline chloride; DL = Dry Leaf.
The concentration of D + H in the habanero pepper leaf extract was significantly affected (p < 0.05) by additional water percentage and the quadratic terms of both main factors (X12 and X22). In contrast, the MoR factor and the interaction between both factors did not have a significant effect (p > 0.05) when extracted with the sonic probe using a eutectic solvent.
Ferulic acid (FaC) was another individual polyphenol that was successfully optimized. The characterization of the response surface, as presented in Figure 5a, revealed a plateau of maxima that was only partially present due to the restrictions on the operating conditions (Negative glucose ratio). The corresponding contour plot (Figure 5b) illustrates the region of maximum response (i.e., the highest concentration of FaC) and is represented in red color. The optimal predicted value (8.17 mg/100 g DL), obtained with the intersection of the optimal conditions of the eutectic solvent composition MoR = 0.8:1 mol/mol (Glucose: Choline chloride) and a 54% added water, is marked with a “+” symbol at the center of this maximum response region, as determined using the mathematical model. Additionally, the contour plot depicts the area (blue color) where the intersection of operating conditions (MoR and Added water percentage) would result in a minimal concentration of FaC in a leaf extract of Habanero pepper obtained through sonication (probe).
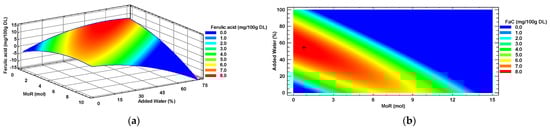
Figure 5.
Ferulic acid (FaC) response surface (a) and contour (b) plots, by factors of input molar ratio of glucose and percentage of added water. MoR = glucose ratio per mol of choline chloride; DL = Dry Leaf.
The analysis of variance of the ferulic acid data resulted in a significant effect (p < 0.05) of the nonquadratic term (X2) and quadratic term (X22) of the main factor (i.e., added water (%)) on the concentration of this metabolite in the extracts.
The optimal conditions and values of the Ax and the different bioactive compounds present in the Habanero pepper leaf extract are shown in Table 6. The values of MoR 0.8:1 (Glucose: Choline Chloride) and 12% of added water were affected the most among the optimized response variables.
Table 6.
Optimum values of the antioxidant capacity and bioactive compounds obtained from the habanero pepper leaf of CCD 22 for the composition optimization of a natural deep eutectic solvent.
Figures S2 and S3 displays the response surface and contour plots of the optimized individual polyphenols, with a R2 < 0.7.
3.2.2. Model Validation for Individual Polyphenols from Habanero Pepper Leaf Extract
The conditions used to validate the mathematical models for vanillin, diosmin + hesperidin, and ferulic acid were the same as those described in Section 3.1.2.
According to the mathematical models for each individual polyphenol, the predicted concentrations in the extracts of habanero pepper leaves ought to have been 11.07 mg/100 g DL for vanillin, 67.41 mg/100 g DL for diosmin + hesperidin, and 2.21 mg/100 g DL for ferulic acid. However, the actual values obtained from the validation experiment were 8.95 mg/100 g DL, 29.0 mg/100 g DL, and 2.24 mg/100 g DL, respectively.
Thus, the error rate for the concentration prediction of vanillin (19.15%) and ferulic acid (1.35%) was below 20%, while diosmin + hesperidin had an error rate of 56.97%. Hence, the model derived for vanillin and ferulic acid can be considered appropriate for predicting the concentrations of these metabolites in Habanero pepper leaf extracts obtained using a NADES (Choline chloride/Glucose). On the other hand, the model for predicting diosmin + hesperidin was inadequate.
3.3. Modelling of Vitamin C from Habanero Pepper Leaf Extract
The habanero pepper leaf extracts from CCD 22 had the highest concentration of vitamin C (8.51 ± 1.72 mg/100 g DL) when prepared using a MoR of 2.2:1 mol/mol (Glucose: Choline Chloride) and 40% added water. In contrast, the lowest concentration of vitamin C (3.22 ± 0.03 mg/100 g DL) was obtained with a MoR of 1.5:1 mol/mol (Glucose: Choline Chloride) and 12% added water (Table 7).
Table 7.
Values of Vitamin C from habanero pepper leaf extract obtained from CCD 22 for the natural deep eutectic solvent composition optimization.
The second order model analysis of vitamin C showed an adjustment (R2) of 67.94, it was observed that the principal factor of percentage of added water (X2), as well as its quadratic term (X22), presented a significant effect on the concentration of this metabolite in Habanero pepper leaf extract.
Using the regression coefficients obtained, the equation for predicting the concentration of vitamin C in the habanero pepper leaf extract was obtained with a sonic probe using a eutectic solvent composed of glucose and choline chloride. The equation is shown below:
Y = 1.4894 − 11.6069 X1 + 0.7347 X2 + 5.0232 X12 − 0.07025 X1X2 − 0.0056 X22
In accordance with the canonical analysis conducted using statistical software, the response surface for the concentration of vitamin C in the Habanero pepper leaf extracts was characterized. Figure 6 displays the response surface graph, which is identified as a plateau of maximums and minimums (saddle). Two areas of maximum response are observed in red color: the first area shows conditions of MoR below 0.8:1 mol/mol (Glucose: Choline Chloride) intersected with values of water percentage above 20%. The second area of maximum response in red color shows MoR values greater than 2.2:1 mol/mol (Glucose: Choline Chloride) and 10% to 80%, respectively, intersecting.
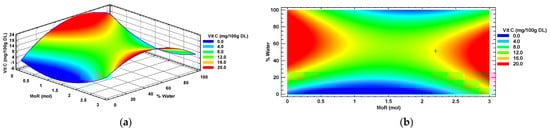
Figure 6.
Vitamin C (Vit C) response surface (a) and contour (b) plots by factors of input molar ratio of glucose and percentage of added water. MoR = glucose ratio per mol of choline chloride; DL = Dry Leaf.
The contour graph depicted in Figure 6b shows the optimal value (+) of vitamin C (15.15 mg/100 g DL) detected in a Habanero pepper leaf extract. This critical point resulted from the overlapping of the ideal settings obtained via canonical analysis. Specifically, the optimal conditions encompass a MoR of 2.2:1 mol/mol (Glucose: Choline chloride) and a percentage of added water equal to 51.32%.
Modelling of Vitamin C from Habanero Pepper Leaf Extract
To validate the mathematical model of vitamin C concentration in the habanero pepper leaf extract, the conditions described in Section 3.1.2 were employed.
The predicted concentration of vitamin C was 15.16 mg/100 g DL, while the actual concentration obtained from the validation experiment was 17.36 mg/100 g DL. This discrepancy resulted in an error rate of 14.51%. As a consequence, the mathematical model was determined as being appropriate for the prediction of vitamin C concentration in extracts derived from Habanero pepper leaves using a sonic probe with a eutectic solvent consisting of glucose and choline chloride.
3.4. Principal Component Analysis (PCA)
There is a positive correlation between some individual polyphenols (Figure 7a), such as kaempferol (9), neohesperidin (13), naringenin (14), and apigenin (15), and the TPC (1) in the extracts, identified in a cluster. This means that as the levels of these metabolites increased, the TPC value also increased. On the other hand, quercetin + luteolin (8), diosmin + hesperidin (12), and diosmetin (16) were associated (cluster) with the Ax of habanero pepper leaf extracts (Figure 7b). Therefore, these metabolites played a major role in the bioactive properties of the extracts, mainly when it came to Ax.
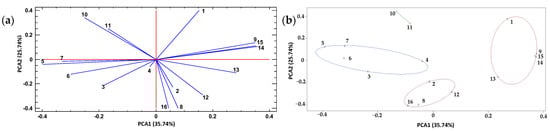
Figure 7.
Principal component analysis (PCA) of total polyphenol content, antioxidant capacity, and polyphenol profile of habanero pepper leaf extracts obtained from the experimental design for composition optimization of a natural deep eutectic solvent using a sonic probe; (a) PCA and (b) clusters depending on the mean values of ‘k’. Numeration: 1 = Total polyphenol content; 2 = Antioxidant capacity; 3 = protocatechuic acid; 4 = catechin; 5 = chlorogenic acid; 6 = cinnamic acid; 7 = rutin; 8 = quercetin + luteolin; 9 = kaempferol; 10 = ferulic acid; 11 = vanillin; 12 = diosmin + hesperidin; 13 = neohesperidin; 14 = naringenin; 15 = apigenin; 16 = diosmetin.
Another cluster (Figure 7b) was composed of the metabolites protocatechuic acid (3), catechin (4), chlorogenic acid (5), cinnamic acid (6), and rutin (7). This cluster exhibited an inverse association with the cluster where TPC was located. Finally, a fourth and last group consisting of only two metabolites (kaempferol and ferulic acid) was observed (Figure 7b). Both phenolic compounds exhibited an inverse association with the Ax of the habanero pepper (leaf) extracts obtained using the sonic probe.
According to the PCA (Figure 7a), TPC (1), chlorogenic acid (5), cinnamic acid (6) and rutin (7) showed no association with the Ax of the extracts. In turn, ferulic acid (10), vanillin (11) and diosmetin + hesperidin (12) exhibited no association with the TPC. Figure S4 shows a PCA with three axes PCA1, PCA2 and PCA3 that explain 75.53% of the variability of the data.
4. Discussion
The combination of NADES (natural deep eutectic solvents) and ultrasound-assisted extraction technology has been widely employed for the extraction of phenolic compounds from plants and to revalue agricultural waste byproducts, such as seeds (Phoenix dactylifera L.) [32], spines (Pinus pinaster) [29], mango peel [33], Beta vulgaris [34], and Curcuma longa [35]. However, no information was found regarding the utilization of both technologies for the extraction of phenolic compounds from habanero pepper leaves (Capsicum chinense Jacq.). Additionally, no investigation had been conducted on the optimization of NADES based on choline chloride and glucose, nor with any ultrasonic technology (bath or probe), for the extraction of phenolic compounds.
In this study, the concentration obtained of TPC from the mathematical model validation (Section 3.1.2) under the specified conditions of the NADES composition (MoR = 0.8:1 mol/mol, Glucose: Choline Chloride; 12% water) was 165.39 mg GAE/100 g DL, which was a higher than the concentration achieved under the same conditions but using the sonic bath (76.77 ± 9.92 mg/100 g DL) using same extraction times. This TPC value was higher than those reported with nonoptimized NADES (39.31 ± 0.09 mg/100 g DL) composed of a 1:1 mol/mol molar ratio of choline chloride and glucose, with 40% added water as solvent, using ultrasonic bath [36]. This behavior is consistent with that reported by Aznar-Ramos et al. [28], who compared the extraction efficiency of both ultrasonic methods (bath and probe) using organic solvents for phenolic compound extraction from a mango byproduct (peel), founding that extracts from the sonic probe method exhibited 10% higher concentrations of phenolic compounds within shorter time periods.
Maghsoudlou et al. [37] also reported a higher concentration of phenolic compounds in oregano (Origanum vulgare L.) leaves when comparing extracts obtained using the sonic probe (473.32 ± 25.90 μg GAE/mg dry extract) and sonic bath (353.53 ± 8.26 μg GAE/mg dry extract) using 50% ethanol. The high efficiency of extraction of phenolic compounds with the sonic probe was attributed to a direct application of higher power to the sample, enhancing the physical effects of ultrasonic technology (such as cavitation, shock waves, microjets and/or microturbulence) that have a significant effect on the plant matrix (disturbance), allowing the release (and better diffusion) of bioactive compounds [27]. However, when substituting organic solvents for eutectic solvents, it has been observed that the molar ratio and the percentage of water in the NADES also play an important role during the extraction process of phenolic compounds.
In this study, both the molar ratio and the percentage of added water were found to have an effect on the concentration of phenolic compounds. The highest concentration of phenolic compounds was obtained with a molar ratio of 1:1 mol/mol Glucose: Choline Chloride) and 60% added water. This could be attributed to the influence of the molar ratio on the solubility, polarity, and viscosity of the solvent. The formation of hydrogen bonds and their bonding energy between the components of the NADES during the extraction process contributed to an increased stability. This increased stability facilitated the formation of a greater number of hydrogen bonds between the solvent and the extracted phenolic compounds. Studies by Bajkacz et al. [38] and Sailau et al. [39] have highlighted the influence of the molar ratio on the properties of the eutectic solvent. The establishment of a higher number of hydrogen bonds enhances the extraction efficiency and promotes the extraction of phenolic compounds.
By controlling the percentage of added water, the viscosity of the solvent can be modulated. The addition of water decreases the viscosity of the solvent, which improves its diffusion in the plant matrix and facilitates the dissipation of ultrasonic energy. It has been reported that by increasing the percentage of added water, the polarity of the solvent can be modified. This modification in polarity promotes the extraction of phenolic compounds with similar characteristics. In previous studies, Patil et al. [35] and Maimulyanti et al. [18] have observed a desirable extraction stability in NADES based on choline chloride when the added water content exceeded 60%. Therefore, the results obtained in this study demonstrated that both the molar ratio and the percentage of added water play crucial roles in optimizing the extraction of phenolic compounds, where a molar ratio of 1:1 mol/mol (Glucose: Choline Chloride) and 68% added water were identified as the optimal conditions for achieving the highest concentration of phenolic compounds in the habanero pepper leaf extract.
With regard to the polyphenols vanillin, diosmin + hesperidin, and ferulic acid, it was observed that the percentage of water added to the NADES (natural deep eutectic solvents) was the factor with the main effect on the concentration of the three metabolites when extracted from the Habanero pepper leaf using a sonic probe.
Gharat et al. [40] observed that the addition of water to a NADES composed of choline chloride and water in a molar ratio of 1:1 mol/mol increased the concentration of ferulic acid extracted from a rice byproduct (bran) using ultrasound technology. As mentioned previously, water changes the polarity of the solvent and increases its solubility characteristics, thereby enhancing the extraction yield of this metabolite. According to the mathematical model, a percentage of 36% added water was established for extracting maximum concentration of vanillin. This value aligned with the findings of González et al. [41], who determined a necessary addition between 25% and 60% water to choline chloride-based NADES in order to obtain a high concentration of vanillin in extracts obtained from vanilla pods (Vanilla planifolia). NADES, as a general trend, extracted nonpolar compounds. However, the addition of water facilitated the extraction and retention of compounds with intermediate polarity. In this study, diosmin and hesperidin exhibited similar physicochemical characteristics, such as low polarity [42], and thus could be extracted with choline chloride-based NADES with low percentages of added water, as determined using the mathematical model. It was found that adding 27% water to the NADES developed the optimal conditions for achieving a high concentration of these metabolites in the Habanero pepper leaf extract. A similar percentage of added water (25%) was reported by Xu et al. [43] to prevent an increase in solvent polarity when extracting diosmetin from a Novis tangerine peel using different compositions of choline chloride-based NADES. The molar ratio of 1:1.2 mol/mol (Chcl:HBD) showed the highest response (>50 mg diosmetin/g Dry peel). Additionally, a similar trend was observed in the molar ratio between choline chloride (Chcl) and the hydrogen bond donor (HBD) in relation to the results of our study. Slight molar ratios (<1:0.8 mol/mol) or high molar ratios (>1:2.4 mol/mol) of Chcl predicted a decrease in diosmetin extraction yield from Habanero pepper leaf using a sonic probe. Thus, the mathematical model established a molar ratio of 1.5:1 mol/mol. The diosmetin + hesperidin were the metabolites with the highest concentration in each extract obtained from the complete experimental design (12 experiments). This highlights the potential use of the Habanero pepper leaf extracts obtained using sonic probe for the design of functional foods or supplements, thanks to their antioxidant, anti-inflammatory, anticancer, and antidiabetic properties. Moreover, their extensively studied phlebotonic capacity makes them particularly valuable in protecting blood vessels against disorders and maintaining vascular health [44,45,46].
The optimal conditions for obtaining the highest Ax, measured using the DPPH method (% inhibition), were found to be a molar ratio of 0.8:1 mol/mol (Glucose: Choline chloride) and an added water percentage of 12%. These findings were consistent with the results obtained by Osamede et al. [32], who observed that the Ax of extracts obtained with a sonic probe using different compositions of choline chloride-based NADES increased as the added water concentration decreased (<30% added water). Another study has reported that choline chloride-based extracts obtained using ultrasonic technology (such as probes) could achieve an inhibition of 77.05 ± 0.08% [34]. This finding was similar to the optimal Ax established using the mathematical model in our study. Finally, according to the principal component analysis, the antioxidant capacity was associated with the metabolites diosmin + hesperidin (the metabolite with the highest concentration in each extract obtained from the experimental design), quercetin + luteolin (the metabolite with the second highest presence in the extracts), and diosmetin. Therefore, it can be assumed that these metabolites play a significant role in the Ax of the extracts. Moreover, the TPC did not present an association with the Ax. Some metabolites did show an inverse association with the Ax (such as ferulic acid and vanillin); this could be due to the optimal molar ratio for the extraction, which resulted in values above 2.2:1 mol/mol (Glucose: Choline Chloride). According to the mathematical model, this results in low antioxidant capacities, attributed to the polarity change in NADES and/or solvent instability [35], which in turn leads to a decrease in the extraction of such compounds as vitamin C, polyphenols, carotenoids, among others that contribute significantly to the Ax.
5. Conclusions
The results obtained demonstrate the capability of a choline chloride and glucose-based NADES composition to extract phenolic compounds, both total (Total Polyphenol Content) and individual (Polyphenol Profile). Furthermore, NADES exhibited the ability to extract vitamin C from Habanero pepper leaves when combined with ultrasonic technology using a probe modality. The factors of molar ratio and percentage of added water showed a significant effect on the extraction of different metabolites, and even on the Ax of the extracts. The extracts obtained using the choline chloride and glucose-based NADES combined with ultrasonic technology exhibited a high Ax compared to extracts obtained using the sonic bath and different organic solvents. It was demonstrated that modifying the composition of NADES can be used for targeted extractions. According to the different mathematical models, especially for vanillin, ferulic acid, and diosmin + hesperidin, the extraction conditions varied in terms of molar ratio and percentage of added water. This highlights the potential for the modification of the NADES composition to achieve a selective extraction. The composition of NADES was successfully optimized to achieve a maximum concentration of total polyphenols, as well as maximize Ax. Additionally, all the extracts exhibited a high concentration of diosmin + hesperidin, making them potential candidates for the development of future functional foods or supplements for the treatment or prevention of cardiovascular diseases.
Supplementary Materials
The following supporting information can be downloaded at: https://www.mdpi.com/article/10.3390/pr11061729/s1. Table S1: ANOVA of the second order multiple linear regression for the antioxidant capacity; Table S2: Second-order model regression coefficients for total polyphenol content; Table S3: ANOVA of the complete experimental design for the total polyphenol content; Table S4: Second-order model regression coefficients for antioxidant capacity; Table S5: ANOVA of the complete experimental design for the antioxidant capacity; Table S6: First-order model ANOVA for individual polyphenols of the first experimental design for the optimization of the NADES conditions; Figure S1: Calibration curve for the evaluation of the total amount of polyphenols in habanero pepper leaf extracts; Figure S2: Response surface (Capital letter) and contour plot (Lowercase letter) of protocatechuic acid (A, a), catechin (B, b), chlorogenic acid (C, c), quercetin + Lutein (D, d), kaempferol (E, e), neohesperidin (F, f), naringenin (G, g), and apigenin (H, h). Abbreviations: PrAc = protocatechuic acid; Cn = catechin; ChAc = chlorogenic acid; Q + L = quercetin + luteolin; Figure S3: Response surface (Capital letter) and contour plot (Lowercase letter) of Kaempferol (E, e); Neohesperidin (F, f); Naringenin (G, g); Apigenin (H, h). Abbreviations: Kf = Kaempferol; NeHe = Neohesperidin; Ngn = Naringenin; Apn = Apigenin; Figure S4: Principal component analysis (PCA) with three components (PCA1, PCA2 and PCA3) for the total polyphenol content, antioxidant capacity, and polyphenol profile of habanero pepper leaf extracts obtained from the experimental design for composition optimization of a natural deep eutectic solvent using a sonic probe. Numeration: 1 = Total polyphenol content; 2 = Antioxidant capacity; 3 = protocatechuic acid; 4 = catechin; 5 = chlorogenic acid; 6 = cinnamic acid; 7 = rutin; 8 = quercetin + luteolin; 9 = kaempferol; 10 = ferulic acid; 11 = vanillin; 12 = diosmin + hesperidin; 13 = neohesperidin; 14 = naringenin; 15 = apigenin; 16 = diosmetin.
Author Contributions
Conceptualization, I.M.R.-B. and K.A.A.-B.; methodology, K.A.A.-B.; software, K.A.A.-B. and I.M.R.-B.; validation, I.M.R.-B., M.O.R.-S. and J.V.C.-R.; formal analysis, I.M.R.-B.; investigation, K.A.A.-B., I.M.R.-B., M.G.-Á., M.S. and K.M.; resources, I.M.R.-B.; data curation, I.M.R.-B.; writing—original draft preparation, K.A.A.-B.; writing—review and editing, I.M.R.-B., J.V.C.-R., M.O.R.-S., M.G.-Á., M.S. and K.M.; visualization, I.M.R.-B.; supervision, I.M.R.-B. and J.V.C.-R.; project administration, I.M.R.-B.; funding acquisition, I.M.R.-B. All authors have read and agreed to the published version of the manuscript.
Funding
This research was funded by the National Council of Science and Technology of Mexico (CONACYT), which financed the project No. 257588, and the scholarship 661099 for Kevin Alejandro Avilés-Betanzos.
Data Availability Statement
Not applicable.
Conflicts of Interest
The authors declare no conflict of interest.
References
- Oney-Montalo, J.; López-Domínguez, C.; Zamacona-Ruiz, M.; Gómez-Rincón, E.; Ramíre-Sucrez, M.; Rodríguez-Buenfil, I. Metabolitos presentes en Capsicum chinense en dos estados de maduración cultivados en diferentes tipos de suelos de Yucatán, México. Bionatura 2018, 1, 1–13. [Google Scholar] [CrossRef]
- Zamancona-Ruiz, M.; Ramírez-Sucre, M.; Rodríguez-Buenfil, I. Comparación de dos Métodos de Extracción y Secado para la Cuantificación de Carotenoides en Chile Habanero. Rev. Cent. Grad. Investig. 2018, 33, 74. [Google Scholar]
- Aviles-Baeza, W.I.; Lozano-Contreras, M.G.; Ramírez-Silva, J.H. Evaluation of Habanero Pepper (Capsicum chinense Jacq.) Varieties under Shade House Conditions in Yucatan, Mexico. Open Access Libr. J. 2018, 8, 1–10. [Google Scholar] [CrossRef]
- Ávila-Román, J.; Soliz-Rueda, J.R.; Bravo, F.I.; Aragonès, G.; Suárez, M.; Arola-Arnal, A.; Mulero, M.; Salvadó, M.J.; Arola, L.; Torres-Fuentes, C.; et al. Phenolic compounds and biological rhythms: Who takes the lead? Trends Food Sci. Technol. 2021, 113, 77–85. [Google Scholar] [CrossRef]
- Servicio de Información Agroalimentaria y Pesquera (SIAP). Available online: https://nube.siap.gob.mx/cierreagricola/ (accessed on 6 March 2023).
- Chel-Guerrero, L.D.; Oney-Montalvo, J.E.; Rodríguez-Buenfil, I.M. Phytochemical characterization of by-products of Habanero pepper grown in two different types of soils from Yucatán, Mexico. Plants 2021, 10, 779. [Google Scholar] [CrossRef]
- Ukwuani, A.N.; Hassan, I.B. In vitro anti-inflammatory activity of hydromethanolic seed, fruit and leave extracts of Capsicum chinense (red pepper). Eur. J. Biomed. Pharm. Sci. 2015, 2, 57–65. [Google Scholar]
- Hazekawa, M.; Hideshima, Y.; Ono, K.; Nishinakagawa, T.; Kawakubo-Yasukochi, T.; Takatani-Nakase, T.; Nakashima, M. Anti-inflammatory effects of water extract from bell pepper (Capsicum annuum L. var. grossum) leaves in vitro. Exp. Ther. Med. 2017, 14, 4349–4355. [Google Scholar] [CrossRef]
- Chel-Guerrero, L.D.; Castañeda-Corral, G.; López-Castillo, M.; Scampicchio, M.; Morozova, K.; Oney-Montalvo, J.E.; Ferrentino, G.; Acevedo-Fernández, J.J.; Rodríguez-Buenfil, I.M. In Vivo Anti-Inflammatory Effect, Antioxidant Activity, and Polyphenolic Content of Extracts from Capsicum chinense By-Products. Molecules 2022, 27, 1323. [Google Scholar] [CrossRef]
- Rodríguez-Buenfil, I.M.; Ramírez-Sucre, M.O.; Ramírez-Rivera, E. Metabolómica y Cultivo del Chile Habanero (Capsicum Chinense Jacq) de la Península de Yucatán, 1st ed.; CIATEJ: Jalisco, Mexico, 2020; Chapters 6–9, 11; pp. 95–169, 185–216. ISBN 978-607-8734-09-2. [Google Scholar]
- Herrera-Pool, E.; Patrón-Vázquez, J.; Ramos-Díaz, A.; Ayora-Talavera, T.; Pacheco, N. Extraction and identification of phenoliccompounds in roots and leaves of Capsicum chinense by UPLC–PDA/MS.J. Bioeng. Biomed. Res. 2019, 3, 17–27. [Google Scholar]
- Abbas, M.; Saeed, F.; Anjum, F.M.; Afzaal, M.; Tufail, T.; Bashir, M.S.; Ishtiaq, A.; Hussain, S.; Suleria, H.A.R. Natural polyphenols: An overview. Int. J. Food Prop. 2017, 20, 1689–1699. [Google Scholar] [CrossRef]
- Radošević, K.; Čanak, I.; Panić, M.; Markov, K.; Bubalo, M.C.; Frece, J.; Srček, V.G.; Redovniković, I.R. Antimicrobial, cytotoxic and antioxidative evaluation of natural deep eutectic solvents. Environ. Sci. Pollut. Res. 2018, 25, 14188–14196. [Google Scholar] [CrossRef] [PubMed]
- Roy, W.R. Environmental Impact of Solvents: The Environmental Chemistry of Organic Solvents. In Handbook of Solvents, 2nd ed.; Chem Tec Publishing: Scarborough, UK, 2014; Volume 2, pp. 361–385. [Google Scholar] [CrossRef]
- Putnik, P.; Lorenzo, J.M.; Barba, F.J.; Roohinejad, S.; Jambrak, A.R.; Granato, D.; Montesano, D.; Kovaćević, D.B. Novel food processing and extraction technologies of high-added value compounds from plant materials. Foods 2018, 7, 106. [Google Scholar] [CrossRef] [PubMed]
- Mansinhos, I.; Gonçalves, S.; Rodríguez-Solana, R.; Ordóñez-Díaz, J.L.; Moreno-Rojas, J.M.; Romano, A. Ultrasonic-assisted extraction and natural deep eutectic solvents combination: A green strategy to improve the recovery of phenolic compounds from Lavandula pedunculata subsp. lusitanica (chaytor) franco. Antioxidants 2021, 10, 582. [Google Scholar] [CrossRef] [PubMed]
- Hikmawanti NP, E.; Ramadon, D.; Jantan, I.; Mun’im, A. Natural deep eutectic solvents (NADES): Phytochemical extraction performance enhancer for pharmaceutical and nutraceutical product development. Plants 2012, 10, 2091. [Google Scholar] [CrossRef]
- Maimulyanti, A.; Nurhidayati, I.; Mellisani, B.; Amelia Rachmawati Putri, F.; Puspita, F.; Restu Prihadi, A. Development of natural deep eutectic solvent (NADES) based on choline chloride as a green solvent to extract phenolic compound from coffee husk waste. Arab. J. Chem. 2023, 16, 104634. [Google Scholar] [CrossRef]
- Dai, Y.; Witkamp, G.-J.; Verpoorte, R.; Choi, Y.H. Tailoring properties of natural deep eutectic solvents with water to facilitate their applications. Food Chem. 2015, 187, 14–19. [Google Scholar] [CrossRef]
- Socas-Rodríguez, B.; Torres-Cornejo, M.V.; Álvarez-Rivera, G.; Mendiola, J.A. Deep eutectic solvents for the extraction of bioactive compounds from natural sources and agricultural by-products. Appl. Sci. 2021, 11, 4897. [Google Scholar] [CrossRef]
- Martinović, M.; Krgović, N.; Nešić, I.; Žugić, A.; Tadić, V.M. Conventional vs. Green Extraction Using Natural Deep Eutectic Solvents—Differences in the Composition of Soluble Unbound Phenolic Compounds and Antioxidant Activity. Antioxidants 2022, 11, 2295. [Google Scholar] [CrossRef]
- Wu, L.; Li, L.; Chen, S.; Wang, L.; Lin, X. Deep eutectic solvent-based ultrasonic-assisted extraction of phenolic compounds from Moringa oleifera L. leaves: Optimization, comparison and antioxidant activity. Sep. Purif. Technol. 2020, 247, 117014. [Google Scholar] [CrossRef]
- Jeong, K.M.; Jin, Y.; Yoo, D.E.; Han, S.Y.; Kim, E.M.; Lee, J. One-step sample preparation for convenient examination of volatile monoterpenes and phenolic compounds in peppermint leaves using deep eutectic solvents. Food Chem. 2018, 251, 69–76. [Google Scholar] [CrossRef]
- Afroz, B.M.; Geesi, M.H.; Riadi, Y.; Imran, M.; Imtiyaz Ali, M.; Ahsan, M.J.; Ajmal, N. Ultrasound-assisted extraction of some branded tea: Optimization based on polyphenol content, antioxidant potential and thermodynamic study. Saudi J. Biol. Sci. 2019, 26, 1043–1052. [Google Scholar] [CrossRef] [PubMed]
- Kumar, K.; Srivastav, S.; Sharanagat, V.S. Ultrasound assisted extraction (UAE) of bioactive compounds from fruit and vegetable processing by-products: A review. Ultrason. Sonochem. 2021, 70, 105325. [Google Scholar] [CrossRef]
- Sukor, N.; Jusoh, R.; Rahim, S.A.; Kamarudin, N. Ultrasound assisted methods for enhanced extraction of phenolic acids from Quercus Infectoria galls. Mater. Today Proc. 2018, 5, 21990–21999. [Google Scholar] [CrossRef]
- Ranjha MM, A.N.; Irfan, S.; Lorenzo, J.M.; Shafique, B.; Kanwal, R.; Pateiro, M.; Arshad, R.N.; Wang, L.; Nayik, G.A.; Roobab, U.; et al. Sonication, a potential technique for extraction of phytoconstituents: A systematic review. Processes 2021, 9, 1406. [Google Scholar] [CrossRef]
- Aznar-Ramos, M.J.; Razola-Díaz M del, C.; Verardo, V.; Gómez-Caravaca, A.M. Comparison between Ultrasonic Bath and Sonotrode Extraction of Phenolic Compounds from Mango Peel By-Products. Horticulturae 2022, 8, 1014. [Google Scholar] [CrossRef]
- Duarte, H.; Gomes, V.; Aliaño-González, M.J.; Faleiro, L.; Romano, A.; Medronho, B. Ultrasound-Assisted Extraction of Polyphenols from Maritime Pine Residues with Deep Eutectic Solvents. Foods 2022, 11, 3754. [Google Scholar] [CrossRef]
- Singleton, V.L.; Orthofer, R.; Lamuela-Raventós, R.M. Analysis of total phenols and other oxidation substrates and antioxidants by means of folin-ciocalteu reagent. In Methods in Enzymology; Academic Press: Cambridge, MA, USA, 1999; pp. 152–178. [Google Scholar]
- Oney-Montalvo, J.E.; Avilés-Betanzos, K.A.; Jesús Ramírez-Rivera EDe Ramírez-Sucre, M.O.; Rodríguez-Buenl, I.M. Polyphenols content in Capsicum chinense fruits at different harvest times and their correlation with the antioxidant activity. Plants 2020, 9, 1394. [Google Scholar] [CrossRef]
- Osamede, A.J.; Mostafa, H.; Riaz, A.; Maqsood, S. Utilization of natural deep eutectic solvents and ultrasound-assisted extraction as green extraction technique for the recovery of bioactive compounds from date palm (Phoenix dactylifera L.) seeds: An investigation into optimization of process parameters. Ultrason. Sonochem. 2022, 91, 106233. [Google Scholar] [CrossRef]
- Lanjekar, K.J.; Gokhale, S.; Rathod, V.K. Utilization of waste mango peels for extraction of polyphenolic antioxidants by ultrasound-assisted natural deep eutectic solvent. Bioresour. Technol. Rep. 2022, 18, 101074. [Google Scholar] [CrossRef]
- Dias AC, S.; Demuner, A.J.; Santos, M.H. Ultrasound-assisted extraction of active compounds from Beta vulgaris using deep eutectic solvents. Res. Sq. 2022, 43, 1–15. [Google Scholar] [CrossRef]
- Patil, S.S.; Pathak, A.; Rathod, V.K. Optimization and kinetic study of ultrasound assisted deep eutectic solvent based extraction: A greener route for extraction of curcuminoids from Curcuma longa. Ultrason. Sonochem. 2021, 70, 105267. [Google Scholar] [CrossRef]
- Avilés-Betanzos, K.A.; Oney-Montalvo, J.E.; Cauich-Rodríguez, J.V.; González-Ávila, M.; Scampicchio, M.; Morozova, K.; Ramírez-Sucre, M.O.; Rodríguez-Buenfil, I.M. Antioxidant Capacity, Vitamin C and Polyphenol Profile Evaluation of a Capsicum chinense By-Product Extract Obtained by Ultrasound Using Eutectic Solvent. Plants 2022, 11, 2060. [Google Scholar] [CrossRef]
- Maghsoudlou, E.; Kenari, R.E. Effects of the bath and probe ultrasound treatment on the antioxidant activity of phenolic extract from oregano (Origanumvulgare L.) leaves. Iran. Food Sci. Technol. 2020, 15, 89–101. [Google Scholar] [CrossRef]
- Bajkacz, S.; Adamek, J. Development of a Method Based on Natural Deep Eutectic Solvents for Extraction of Flavonoids from Food Samples. Food Anal. Methods 2018, 11, 1330–1344. [Google Scholar] [CrossRef]
- Sailau, Z.; Almas, N.; Aldongarov, A.; Toshtay, K. Studying the Formation of Choline Chloride- and Glucose-Based Natural Deep Eutectic Solvent at the Molecular Level. J. Mol. Model. 2022, 28, 235. [Google Scholar] [CrossRef] [PubMed]
- Gharat, N.N.; Rathod, V.K. Extraction of ferulic acid from rice bran using NADES-ultrasound-assisted extraction: Kinetics and optimization. J. Food Process Eng. 2022, 2022, e14158. [Google Scholar] [CrossRef]
- González, C.G.; Mustafa, N.R.; Wilson, E.G.; Verpoorte, R.; Choi, Y.H. Application of natural deep eutectic solvents for the “green” extraction of vanillin from vanilla pods. Flavour Fragr. J. 2017, 33, 91–96. [Google Scholar] [CrossRef]
- Roy, J.; Azamthulla, M.; Mukkerjee, D. Hesperidin and diosmin a novel drugs. Int. J. Pharm. Res. Technol. 2019, 10, 25–33. [Google Scholar] [CrossRef]
- Xu, M.; Ran, L.; Chen, N.; Fan, X.; Ren, D.; Yi, L. Polarity-dependent extraction of flavonoids from citrus peel waste using a tailor-made deep eutectic solvent. Food Chem. 2019, 297, 124970. [Google Scholar] [CrossRef]
- Bhattacharyya, S.; Pal, S.; Mohamed, R.; Singh, P.; Chattopadhyay, S.; Pal China, S.; Porwal, K.; Sanyal, S.; Gayen, J.R.; Chattopadhyay, N. A nutraceutical composition containing diosmin and hesperidin has osteogenic and anti-resorptive effects and expands the anabolic window of teriparatide. Biomed. Pharmacother. 2019, 118, 109207. [Google Scholar] [CrossRef]
- Pyrzynska, K. Hesperidin: A Review on Extraction Methods, Stability and Biological Activities. Nutrients 2022, 14, 2387. [Google Scholar] [CrossRef] [PubMed]
- Huwait, E.; Mobashir, M. Potential and Therapeutic Roles of diosmin in Human Diseases. Biomedicines 2022, 10, 1076. [Google Scholar] [CrossRef] [PubMed]


Disclaimer/Publisher’s Note: The statements, opinions and data contained in all publications are solely those of the individual author(s) and contributor(s) and not of MDPI and/or the editor(s). MDPI and/or the editor(s) disclaim responsibility for any injury to people or property resulting from any ideas, methods, instructions or products referred to in the content. |
© 2023 by the authors. Licensee MDPI, Basel, Switzerland. This article is an open access article distributed under the terms and conditions of the Creative Commons Attribution (CC BY) license (https://creativecommons.org/licenses/by/4.0/).