Article

Evaluation of Reconstruction Potential for Low-Production Vertical Wells of CBM in the Southern Qinshui Basin

Department of Earth Science and Engineering, College of Mining Engineering, Taiyuan University of Technology, Taiyuan 030024, China
*
Author to whom correspondence should be addressed.
Processes 2023, 11(6), 1741; https://doi.org/10.3390/pr11061741
Submission received: 10 April 2023 / Revised: 30 May 2023 / Accepted: 2 June 2023 / Published: 7 June 2023
(This article belongs to the Special Issue Physical, Chemical and Biological Processes in Energy Geoscience)

Abstract

:
Production practice has shown that not all low-production coalbed methane (CBM) wells can be reconstructed into high-production wells through secondary stimulation, so it is necessary and timely to establish an evaluation index system, form an evaluation method, and evaluate the reconstruction potential of low-production wells. Based on the development practice of CBM in the southern Qinshui Basin, this paper analyzes the influencing factors of low production in vertical wells from the aspects of coal and rock reservoir conditions, drilling and completion engineering, and drainage engineering. It is proposed that the evaluation of the reconstruction potential of low-production wells should focus on the quality of CBM resources, the difficulty of CBM desorption and diffusion, and the degree of damage to coal reservoirs caused by the initial reservoir stimulation. Twelve parameters, including gas content, gas saturation, reservoir pressure gradient, critical desorption–reservoir pressure ratio, and permeability, were systematically selected as evaluation indicators, and the grading reference values for each evaluation indicator were comparatively given. Then, a multi-factor comprehensive evaluation method for the reconstruction potential of low-production wells based on gray correlation analysis method was established. The reconstruction potential of low-production wells was divided into three levels: high, medium, and low. When reconstructing low-production wells, it is recommended to prioritize the low-production wells with high reconstruction potential, followed by those with medium reconstruction potential, while low-production wells with low reconstruction potential are not recommended for reconstruction. Finally, the evaluation method was used to evaluate the reconstruction potential of five low-production wells in a CBM block, and suggestions for the reconstruction order and reconstruction potential levels for each well were given.

1. Introduction

The growing global demand for energy requires sustainable energy supplies. Coalbed methane (CBM) is a kind of energy which is efficient, clean, and pollution-free [1]. It can alleviate the energy crisis and the greenhouse effect [2,3,4,5]. Moreover, coalbed methane extraction can effectively reduce the occurrence of coal mine fire and explosion accidents [6]. Safe and efficient production of coalbed methane is of strategic significance to global sustainable development [4]. Coal and coalbed methane coupling coordinated exploitation is a key technology for the safe exploitation of both resources [7]. China has huge coalbed methane reserves, but the exploitation and utilization of coalbed methane resources fall behind the United States, Canada, Australia, and other countries [1,8]. The exploitation of coalbed methane in China is hampered by the “four lows”: low effective producing ratio, low remaining producible reserves, low single-well gas production rate, and low exploitation profit [9]. These factors are seriously restricting China’s sustainable CBM development. In the southern Qinshui Basin, there are many low-production wells that need to be reconstructed to increase individual well production. However, not every low-production well can achieve a significant increase in production through secondary stimulation. Therefore, it is very necessary and urgent to select the right wells for reconstruction.
Qinshui Basin, located in Shanxi province (Figure 1), exhibits desirable characteristics for a CBM field, including high permeability and gas content, making it especially suitable for exploration and commercial development, particularly in the southern basin where stable gas production has already been achieved via large-scale investment and development [10]. However, even areas that were properly developed, including the Fanzhuang block, present considerable proportions (32%) of low-production (<500 m3/d) vertical wells due, in part, to the geological complexity of the coal reservoirs and other factors, including the compatibility of reservoir fracturing and drainage processes with geological conditions [11]. Other blocks that present more complex geological conditions, including Zhengzhuang, Gujiao, and Shizhuang, exhibit even higher proportions of low-production wells, while the proportion is only 10% in the Black Warrior Basin in the United States [5,12,13,14,15] (Figure 2). Such high proportions of low-production wells significantly hinder the development and efficient production of CBM reservoirs and drive away potential investors. To remedy this situation, researchers have conducted in-depth research on the underlying causes of low production and the stimulation operations that can be utilized and technological reconstruction of low-production wells of late; and comprehensive conclusions on the general causes of low productivity have been drawn by researchers by analyzing the geological conditions, engineering, drainage of CBM reservoirs, and hydraulic fracturing characteristics [11,16,17]. Furthermore, the following suggestions for targeted improvements have been made, including nitrogen-foam unblocking, refracturing with active water, acidization, pulse fracturing, and intelligent drainage. Significantly enhanced productivity has been exhibited by some enhanced wells [18,19,20,21,22,23]; however, the lack of considerations for reconstruction potential leads to the blind utilization of stimulation which, in turn, induced a major waste of manpower and resources as stimulation was applied on many unsuitable wells. Thus, this study contends that a method of selecting low-production wells with the most stimulation potential for successful enhancement is direly needed, which can enhance the efficiency of reconstructing low-production CBM wells, reduce the waste of human and material resources, and promote sustainable social and economic development.
Therefore, the objective of this study is to find a method to select low-production wells with the highest enhancement potential in order to achieve successful production increase. This method aims to improve the efficiency of wellbore reconstruction for low- production coalbed methane wells in the study area, reduce resource waste, and promote sustainable socio-economic development. However, it should be noted that in practical operations, there are various limitations to the on-site verification of the reconstruction potential of low-production wells, such as limitations related to funding, company planning, and negotiation and cooperation. Therefore, currently, on-site verification of the research results is not feasible.
Additionally, due to significant variations in reservoir characteristics, geological conditions, drilling, and fracturing techniques among different basins and even different blocks within the same basin, the selected evaluation indicators and their criteria in this thesis have certain limitations and are applicable only to the study area. Nonetheless, considering the practical significance of the research and its potential for future development, we are considering integrating the research model with software development to facilitate the evaluation of reconstruction potential. By developing a computer software, we can utilize the evaluation indicators and methods derived from the research to provide a convenient and efficient tool for calculating and outputting the evaluation results of reconstruction potential.

2. Research Method

Reconstruction of low-production vertical CBM wells requires consideration of multiple factors, including reservoir characteristics, drilling and initial stimulation-induced damage, and drainage technology. The impact of these factors on the reconstruction process is complex. To establish an evaluation index system for the potential reconstruction of low-production CBM wells, statistical analysis was performed to identify the factors that affect CBM production. The classification standard of each evaluation index was then determined. Due to the varying degrees of impact on the potential for reconstruction, the weights of each evaluation index were determined through the application of the AHP model. Finally, the gray correlation analysis method is used for target evaluation, which completes the reconstruction potential evaluation through quantitative and qualitative analyses.

2.1. AHP Model for Determination of Weights of Each Evaluation Index

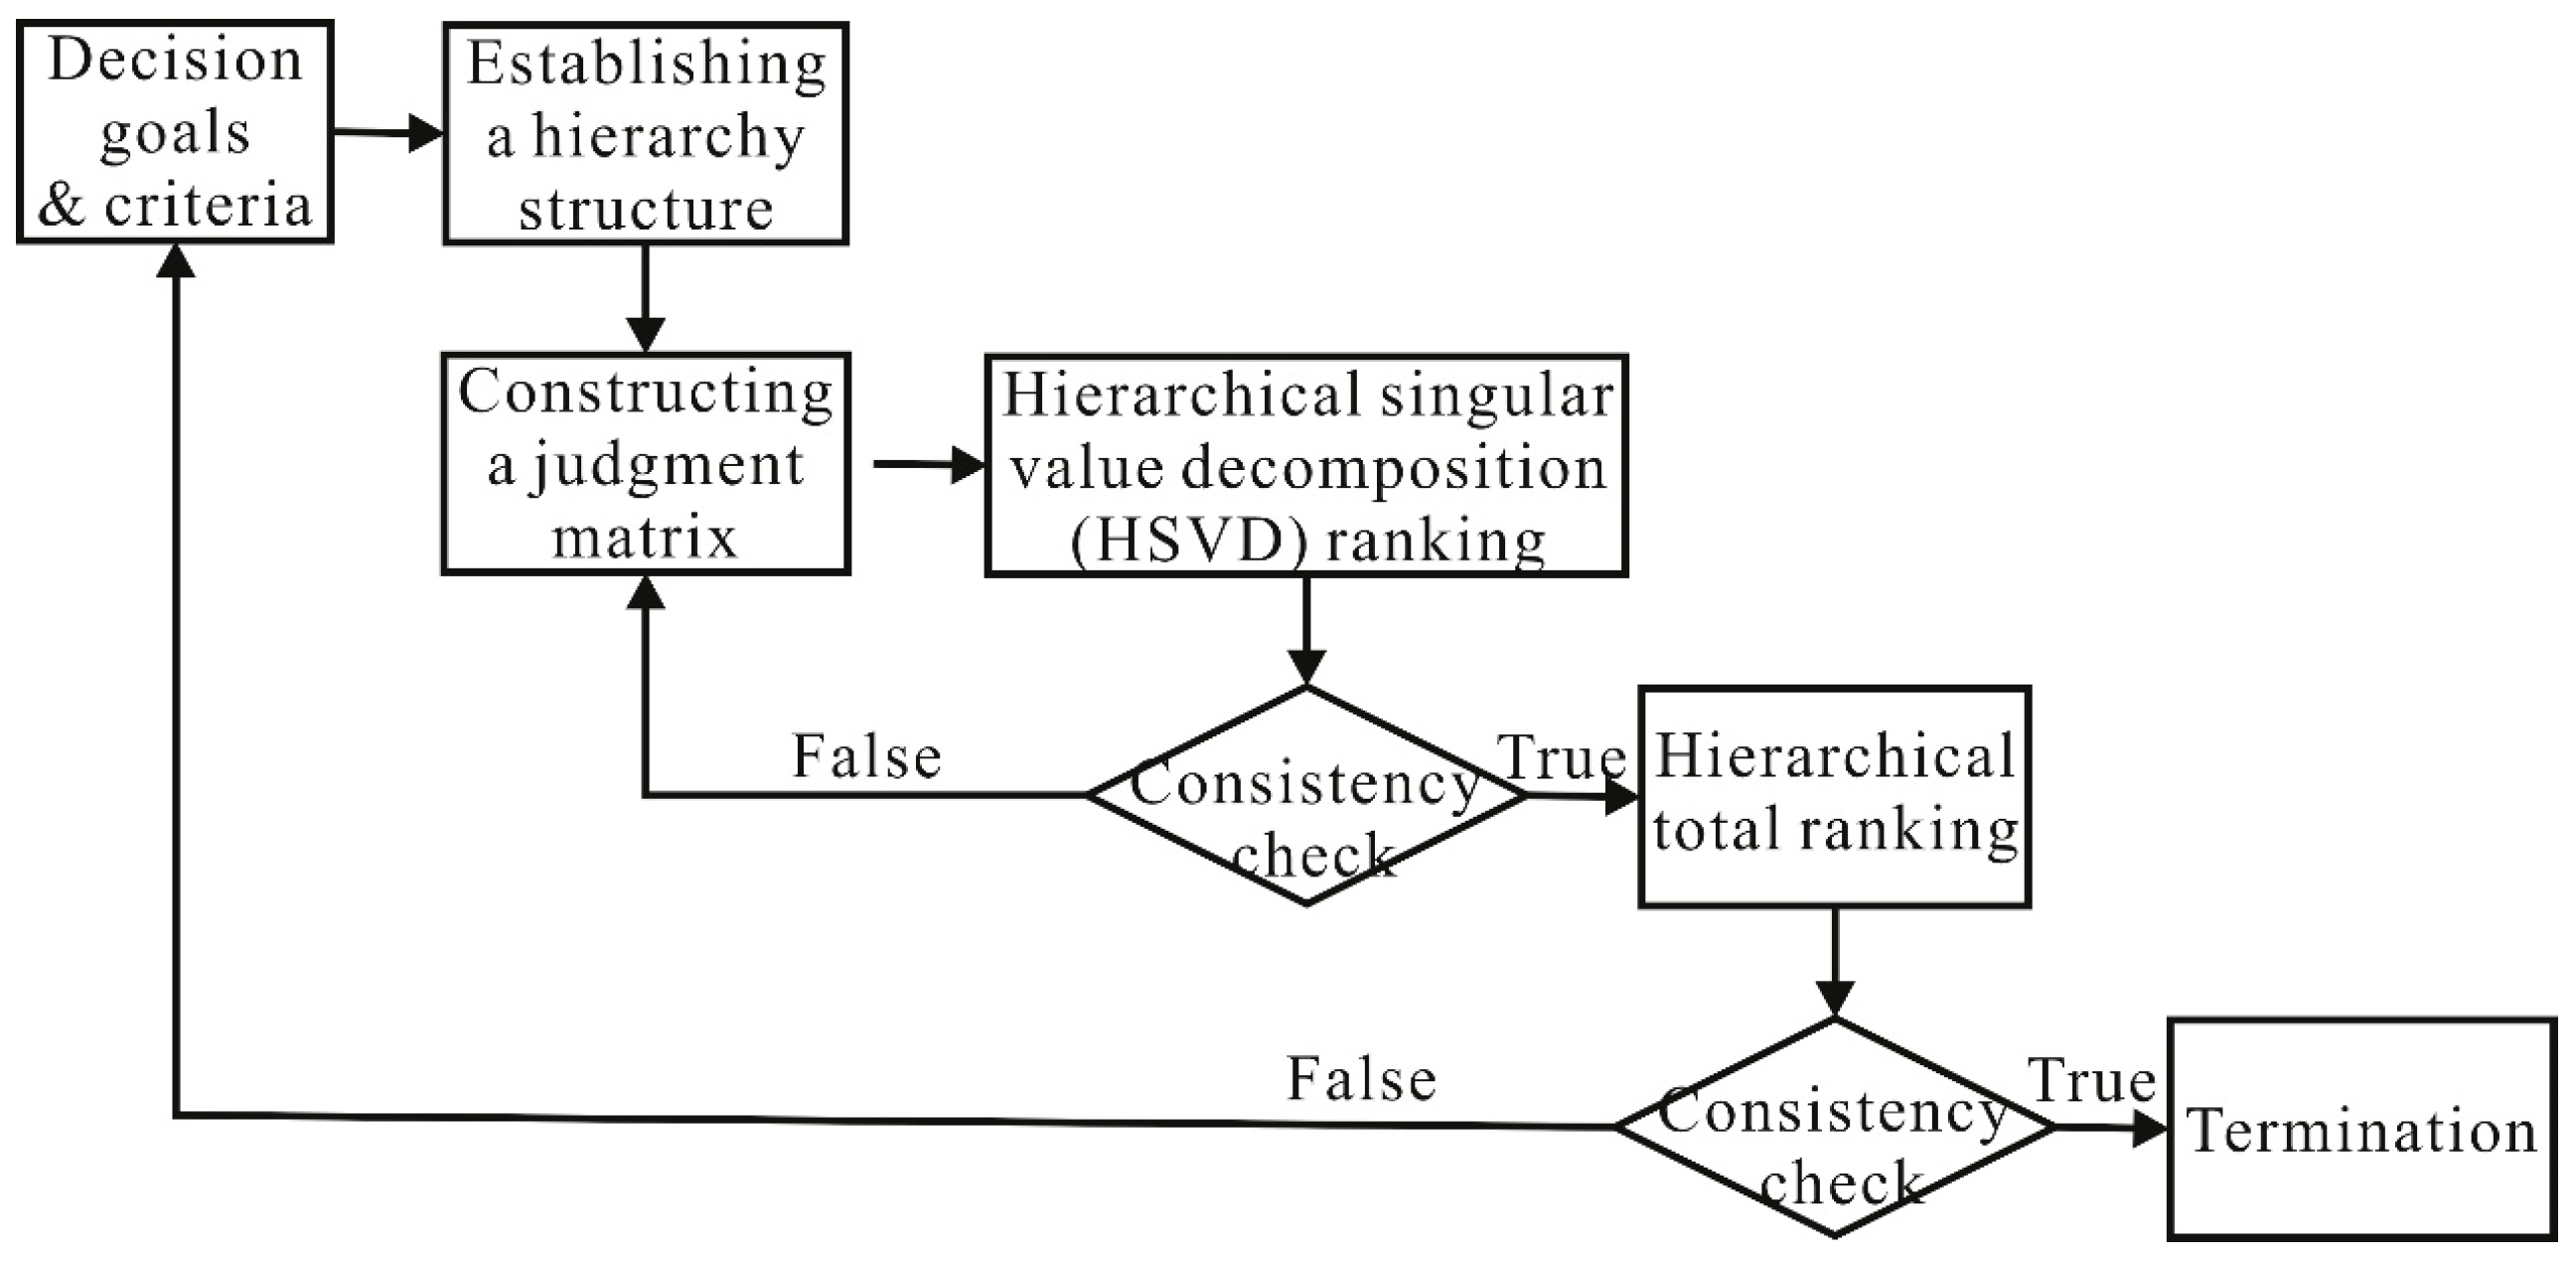
The Analytic Hierarchy Process (AHP) is a widely recognized multicriteria decision-making method commonly used to address complex decision problems [24]. Many scholars have applied AHP to evaluate oil and gas reservoirs and productivity [25,26,27,28,29]. The basic idea is to decompose the problem into multiple levels, which aids in the understanding of the essence of the problem more clearly and considers the influence of multiple factors, thus obtaining the relative weights of each influencing parameter. The hierarchical analysis method consists of several steps, as depicted in Figure 3, which are further detailed in Section 4.2.

2.2. The Gray Correlation Analysis Method

The gray correlation analysis (GRA) method, a quantitative analysis technique, is utilized to assess the interrelationships among different factors within a system. It has gained extensive application across various scientific domains due to its modeling, control, prediction, and decision-making capabilities [11,30,31,32]. In fact, the assessment of the reconstruction potential of low-production vertical CBM wells involves complex multi-objective and multi-factor approaches. Therefore, it is appropriate to view the evaluation system as a gray system and utilize the GRA methodology to evaluate the reconstruction potential of each individual well.
(1)
Determine the comparison sequence and reference sequence
The comparative sequence is composed of the values of the evaluation parameters for the reconstruction potential of the well to be evaluated, denoted as: X i k   ( k = 1 ,   2 ,   ,   n ;   i > 1 ) ; the reference sequence is composed of the standards of the evaluation parameters for the reconstruction potential, denoted as: Y j k   ( k = 1 ,   2 ,   ,   m ;   j > 1 ) .
(2)
Normalization of data
As the dimensions of each parameter vary and there are magnitudes of differences between each parameter value, the initialization method is used to normalize the data to the interval of [0, 1] to eliminate the influences of dimensionality when comparing the parameters.
When X i k and Y j k are negatively correlated, the reference sequence is normalized according to the following Equation:
Y j k = Y m k Y j k Y m k Y 1 k j = 1 , 2 , , m ; k = 1 , 2 , n
The comparison sequence is normalized according to the following Equation:
X i k =                   1 X i k Y 1 k Y m   k X i   k Y m   k Y 1   k Y m k > X i k > Y 1 k                   0 X i k Y m k
When X i k and Y j k are positively correlated, the reference sequence is normalized according to the following Equation:
Y j k = Y j k Y m k Y 1 k Y m k j = 1 , 2 , , m ; k = 1 , 2 , n
The comparison sequence is normalized according to the following Equation:
X i k =                   1 X i k Y 1 k X j   k Y m   k Y 1   k Y m   k Y m k < X i k < Y 1 k                   0 X i k Y m k
(3)
Calculation of correlation coefficient
A sequence matrix is formed by taking any sample vector from the comparison sequence X i k and comparing it with the reference sequence Y j k . The absolute difference of the corresponding index factor between each vector in the sample and the comparison sequence is calculated as follows:
Δ i j k = Y j k X i k
The matrix composed of absolute values Δ i j k is analyzed to determine the m a x i m a x j Y j k X i k and m i n i m i n j Y j k X i k | in the matrix, which are denoted as Δ 1 and Δ 2 , respectively. The calculation Equation for correlation coefficient ξ i j k is as follows:
ξ i j k = Δ 2 + ρ Δ 1 Δ i j k + ρ Δ 1
where ρ is the discrimination coefficient, which is generally taken as 0.5.
(4)
Calculation of correlation degree
Based on the obtained correlation coefficients and the weight of each parameter, the degree of correlation between each vector in the reference and comparison sequences can be calculated according to the following Equation:
r i j = 1 n k = 1 n ω i ξ i j k
where, ω i is the weight of i parameter; r i j is the correlation degree between i sequence in the comparison sequence and the j - level sequence in the reference sequence.
The maximum value of r i j indicates the best correlation between comparison sequence i and the j - level sequence in the reference sequence. Based on this, the evaluation results can be used to determine whether a candidate well has high, medium, or low potential for reconstruction. When carrying out reconstruction, priority should be given to the low-production wells with high reconstruction potential, followed by those with medium potential, while wells with low potential are not recommended for reconstruction.

3. The Factors Controlling the Production of CBM

CBM is originally in a state of adsorption in reservoirs, and the majority of CBM wells will produce gas after water drainage and pressure drops occur, which indicates that CBM wells mostly lack the ability to produce free gas [3,33,34]. As such, the alteration of CBM state from adsorption to free via pressure reduction desorption, which is a physical desorption process in which adsorbed CBM molecules become increasingly active with decreases in “external pressure,” and van der Waals forces are reduced enough for the change of state, is a major goal of enhancement operations [3]. The pressure at which the adsorbed gas on micropores begins to desorb is called the critical desorption pressure [33]. After CBM is desorbed, it flows from high- to low-pressure areas near the bottom of the well and into the wellbore [35]. When the bottom flow pressure drops to the minimum reservoir pressure (i.e., the abandonment pressure of the CBM well), the coalbed methane well stops producing gas. The factors that affect the development results of CBM wells mainly include coal reservoir characteristics, engineering, and drainage techniques [11,13,36,37,38,39,40,41].

3.1. Coal Reservoir Characteristics

(1)
Gas Content
High gas content is a prerequisite for high-production CBM wells [42]. The coalbed gas content is between 10 and 22 m3/t in the developed blocks in the south of Qinshui Basin. The coal seam in the Fanzhuang block has a gas content of less than 12 m3/t, and the average daily gas production of vertical wells in this seam is less than 500 m3/d. In contrast, the coal seams in Puchi and Guxian areas generally have a gas content of more than 20 m3/t, and the average daily gas production per well in these areas exceeds 1500 m3/d, with a maximum of 5000~6000 m3/d [11].
(2)
Gas Saturation
Coalbed gas saturation, which refers to the ratio of actual gas content to theoretical gas content, is related to pressure reduction and gas desorption [43]. The southern Qinshui Basin exhibits overall coalbed gas saturation in a wide range of 8.2–90% [36]. The Fanzhuang block has the lowest saturation, ranging from 8.2% to 43.8% and averaging only 24.8%, while that of the Guxian block is between 50% and 90%. There is a positive correlation between the gas production of CBM wells and CBM saturation. At higher gas saturations, free gas enters the wellbore earlier, which induces higher total gas production and productivity of CBM wells [44,45].
(3)
Critical desorption–reservoir pressure ratio and recoverable coefficient
Critical desorption–reservoir pressure ratio reflects the difficulty of reducing the reservoir pressure to the critical desorption pressure. The greater the ratio, the easier it is to desorb and extract CBM. There is a good positive correlation between critical desorption–reservoir ratio and the daily gas production of CBM wells. The higher the ratio, the higher the proportion of high-production wells. For the high-rank coals, the CBM wells in the southern Qinshui Basin generally exhibit low productivity when gas saturation is less than 60% and critical desorption–reservoir pressure ratio is less than 0.55 [36].
The recoverable coefficient represents the proportion of gas that can be extracted from the reservoir when pressure drops from the critical desorption pressure to the abandonment pressure [5]. When other parameters remain unchanged, a higher recoverable coefficient indicates a greater amount of CBM that can be extracted per unit volume of coal. CBM reservoirs with higher gas saturations also have higher critical desorption pressures, which results in an overall higher gas production. Conversely, when the coal reservoir is an undersaturated gas reservoir, its critical desorption pressure is relatively low, resulting in a relatively low gas well production. For CBM reservoir potential evaluation, both the reservoir pressure and the critical desorption pressure must be high to be considered as a high-quality reservoir [46].
(4)
Coal seam thickness
Coal seam thickness plays a significant role in CBM production, wherein with increased effective coal seam thickness, more CBM gathers at the wellbore, which consequently increases total CBM gas production. The above stated trend has been proven to hold true for the southern Qinshui Basin via statistical analyses of CBM wells of varying thicknesses. Additional numerical simulation calculations have also shown that, for a coal seam with a thickness of 10 m, peak daily and cumulative gas production over 10 years are 2.5 times those of a 4 m thick coal seam when other parameters remain unchanged [44].
(5)
Permeability
Permeability, the ability of fluids to spread and diffuse through pore spaces within the coal matrix [21], is typically expressed in millidarcies (mD). Permeability is a key factor that affects CBM gas production and is primarily controlled by the modern tectonic stress field. Xiao et al. [47] established a new apparent permeability model, revealing the evolution of permeability under the combined action of effective stress and slippage in the full pore pressure range. The permeability decreases as the water content increases in wet coal under non-equilibrium state (Xiao et al., 2023). Based on comparative statistical analyses of CBM wells in the Zhengzhuang, Fanzhuang, Chengzhuang, and Zhengcun blocks, there is a power index relationship between CBM permeability and daily gas production [41,48].
(6)
Geological Structure
Due to early inadequacies in the understanding of structural geology, some CBM wells were drilled near tensional normal faults or collapsed columns and presented with high water production and low gas production, which are due to inherently low gas content (less than 14 m3/t) and adsorption saturation (desorption pressure less than 1.5 MPa) [17]. CBM wells that are too close to faults generally produce significant amounts of water and little to no gas.
The Zhengzhuang M well started production in 2012 [39]. Due to the ineffective sealing of the coal reservoir caused by the nearby tensional normal fault (50 m away), the reservoir has only produced 726 m3 of gas, 3564 m3 of water, and has a casing pressure of 0.05 MPa after more than 4 years of production [49]. Similar to the previous case, the N well was drilled near a collapsed column, resulting in a discontinuous coal reservoir with low gas content, producing only 763.1 m3 of water after more than 4 years of production, with no gas being produced [49].
(7)
In situ Stress
In situ stress is closely related to CBM permeability as well as the efficacy of the enhancement of CBM wells. In areas with low in situ stress, permeability is higher and gas production is high; whereas, in areas with high in situ stress, permeability is low, which leads to difficulties in gas production [50]. In deep burial depth (>1000 m) of coal seams, such as those of the Zhengzhuang block, the gas production from vertical wells is between 500 and 1000 m3/d. In contrast, in low to medium burial depth (300–600 m) of coal seams, such as those in the Panzhuang block, gas production from vertical wells is comparatively high, with an average daily production of 2000 m3/d.
(8)
Reservoir Pressure
Reservoir pressure, also known as formation pressure or fluid pressure in reservoir fractures, can be determined via well testing that pushes the water and gas from coal fractures to the wellbore. In the Zhengzhuang block, under-pressured formations result in low-production wells, whereas over-pressured reservoirs result in high gas production [49].
(9)
Coal texture
In coal seams with original texture, hydraulic fracturing creates cracks that initiate and propagate along the direction of maximum principal stress, which avoids the problem of fracture turning and allows for the formation of a simple, long, and straight crack [51]. However, in areas with fragmented or granulated coal, hydraulic fracturing cracks extend along preexisting fractures within the coal matrix, which results in short fracture lengths due to the high fracturing resistance and difficulty in crack extension [51]. The fracturing construction curve in the fragmented coal zone shows an abnormal increase or significant fluctuation of construction pressure, and the characteristics of gas production are high desorption pressure, low gas production, and the inability to sustain gas production [19]. A comparison of original-textured and fractured coal shows that during the adsorption of methane in coal, the total change in surface free energy of mylonitized coal is the largest, and its system energy is the most stable. Methane molecules adsorbed on mylonitized coal surface require greater potential energy to desorb [52]; therefore, the larger the proportion of mylonitized coal in the coal seam, the more unfavorable it is for the stimulation of low-production gas wells in the coal seam. Studies involving animals or humans, and other studies that require ethical approval, must list the authority that provided approval and the corresponding ethical approval code.

3.2. Engineering and Drainage Techniques

(1)
Drilling engineering
In drilling operations, the improper usage of drilling fluid, poor cementing quality, and excessive wellbore enlargement rate can all limit the eventual productivity of vertical wells [39]. Adding a small amount of polymer to the drilling fluid can prevent wellbore collapse and improve carrying capacity; however, the adsorption and hydration effects of polymer can cause clay flocculation and swelling plugging, which can decrease coal reservoir permeability, making drainage and pressure reduction difficult and resulting in low gas production. Poor cementing quality can cause excessive or continuous water production, leading to long drainage times and difficulty in CBM production. Excessive wellbore enlargement rate can result in a thicker cement ring, affecting perforation quality, making fracturing construction difficult, and ultimately reducing CBM productivity.
(2)
Fracturing engineering
Both the selection of fracturing fluid and method of fracturing can affect the productivity of vertical wells. The differences between the properties of fracturing and formation fluid are the main causes of permeability damage to the fractured reservoir matrix, wherein the invasion of fracturing fluid and physical–chemical changes of fracturing fluid in formation pores and throats can cause permeability damage of the fractured reservoir matrix. Therefore, the improper selection of fracturing fluid can result in significant permeability damage to the reservoir matrix, which directly affects gas production [53].
(3)
Drainage technology
The reduction of pressure through drainage is a crucial step in the production of CBM wells, and, as such, the design of drainage systems has become an important factor affecting CBM production. The reasonable and effective control of casing pressure is a crucial aspect of the CBM drainage process. Both too rapid or too slow drainage modes will fail to establish an effective pressure relief range, thus preventing stable and high-yield production. Unreasonable casing pressure control and frequent system adjustments can cause liquid level oscillations, which can damage the reservoir, increase coal powder output, increase pump inspection frequency, and reduce drainage efficiency, resulting in low CBM production [16].
(4)
Water production
Reservoir pressure drops will result from the inflow of free water into the wellbore, and afterwards, once the CBM desorption pressure is reached, the CBM wells will begin to produce gas. According to the currently available production data of CBM wells, drainage volume is relatively low and gas production is high when the CBM reservoir is in an area without free water. When the CBM well is in an area with a source of free water, the depressurization cone in the reservoir near the wellbore expands slowly, and a desorption pressure zone cannot be formed in a relatively large range, resulting in low gas production of the coalbed methane well [54]. In the field, a considerable proportion of gas wells exhibit little to no gas production and significant water drainage, which is caused by an overabundant water recharge. Consequently, effective depressurization cone cannot be established close to the wellbore. The statistical results of the water production and gas production of 20 trial wells in the Fanzhuang block show that wells have low production efficiency and do not produce gas when water production exceeds 1 and 10 m3/d, respectively [11].

4. Results and Discussion

Experience obtained in the field indicates that only some low-production wells have the capacity to be reconstructed into high-production wells through secondary stimulation. Therefore, an evaluation index system and evaluation method must be established to evaluate the potential of low-production wells for further stimulation.

4.1. Evaluation Index

When selecting evaluation indexes, two primary aspects are taken into consideration: (1) The reservoir possesses high production potential. Considering that geological factors are crucial in determining the enrichment and production of coalbed methane and are intrinsic factors influencing well productivity, this study primarily focuses on evaluating geological factors near low-production wells in terms of their impact on reconstruction potential. The geological conditions of the reservoir are given significant consideration, particularly gas content, gas saturation, and recoverability; (2) Whether the primary stimulation has caused any damage to the reservoir and the extent of such damage.
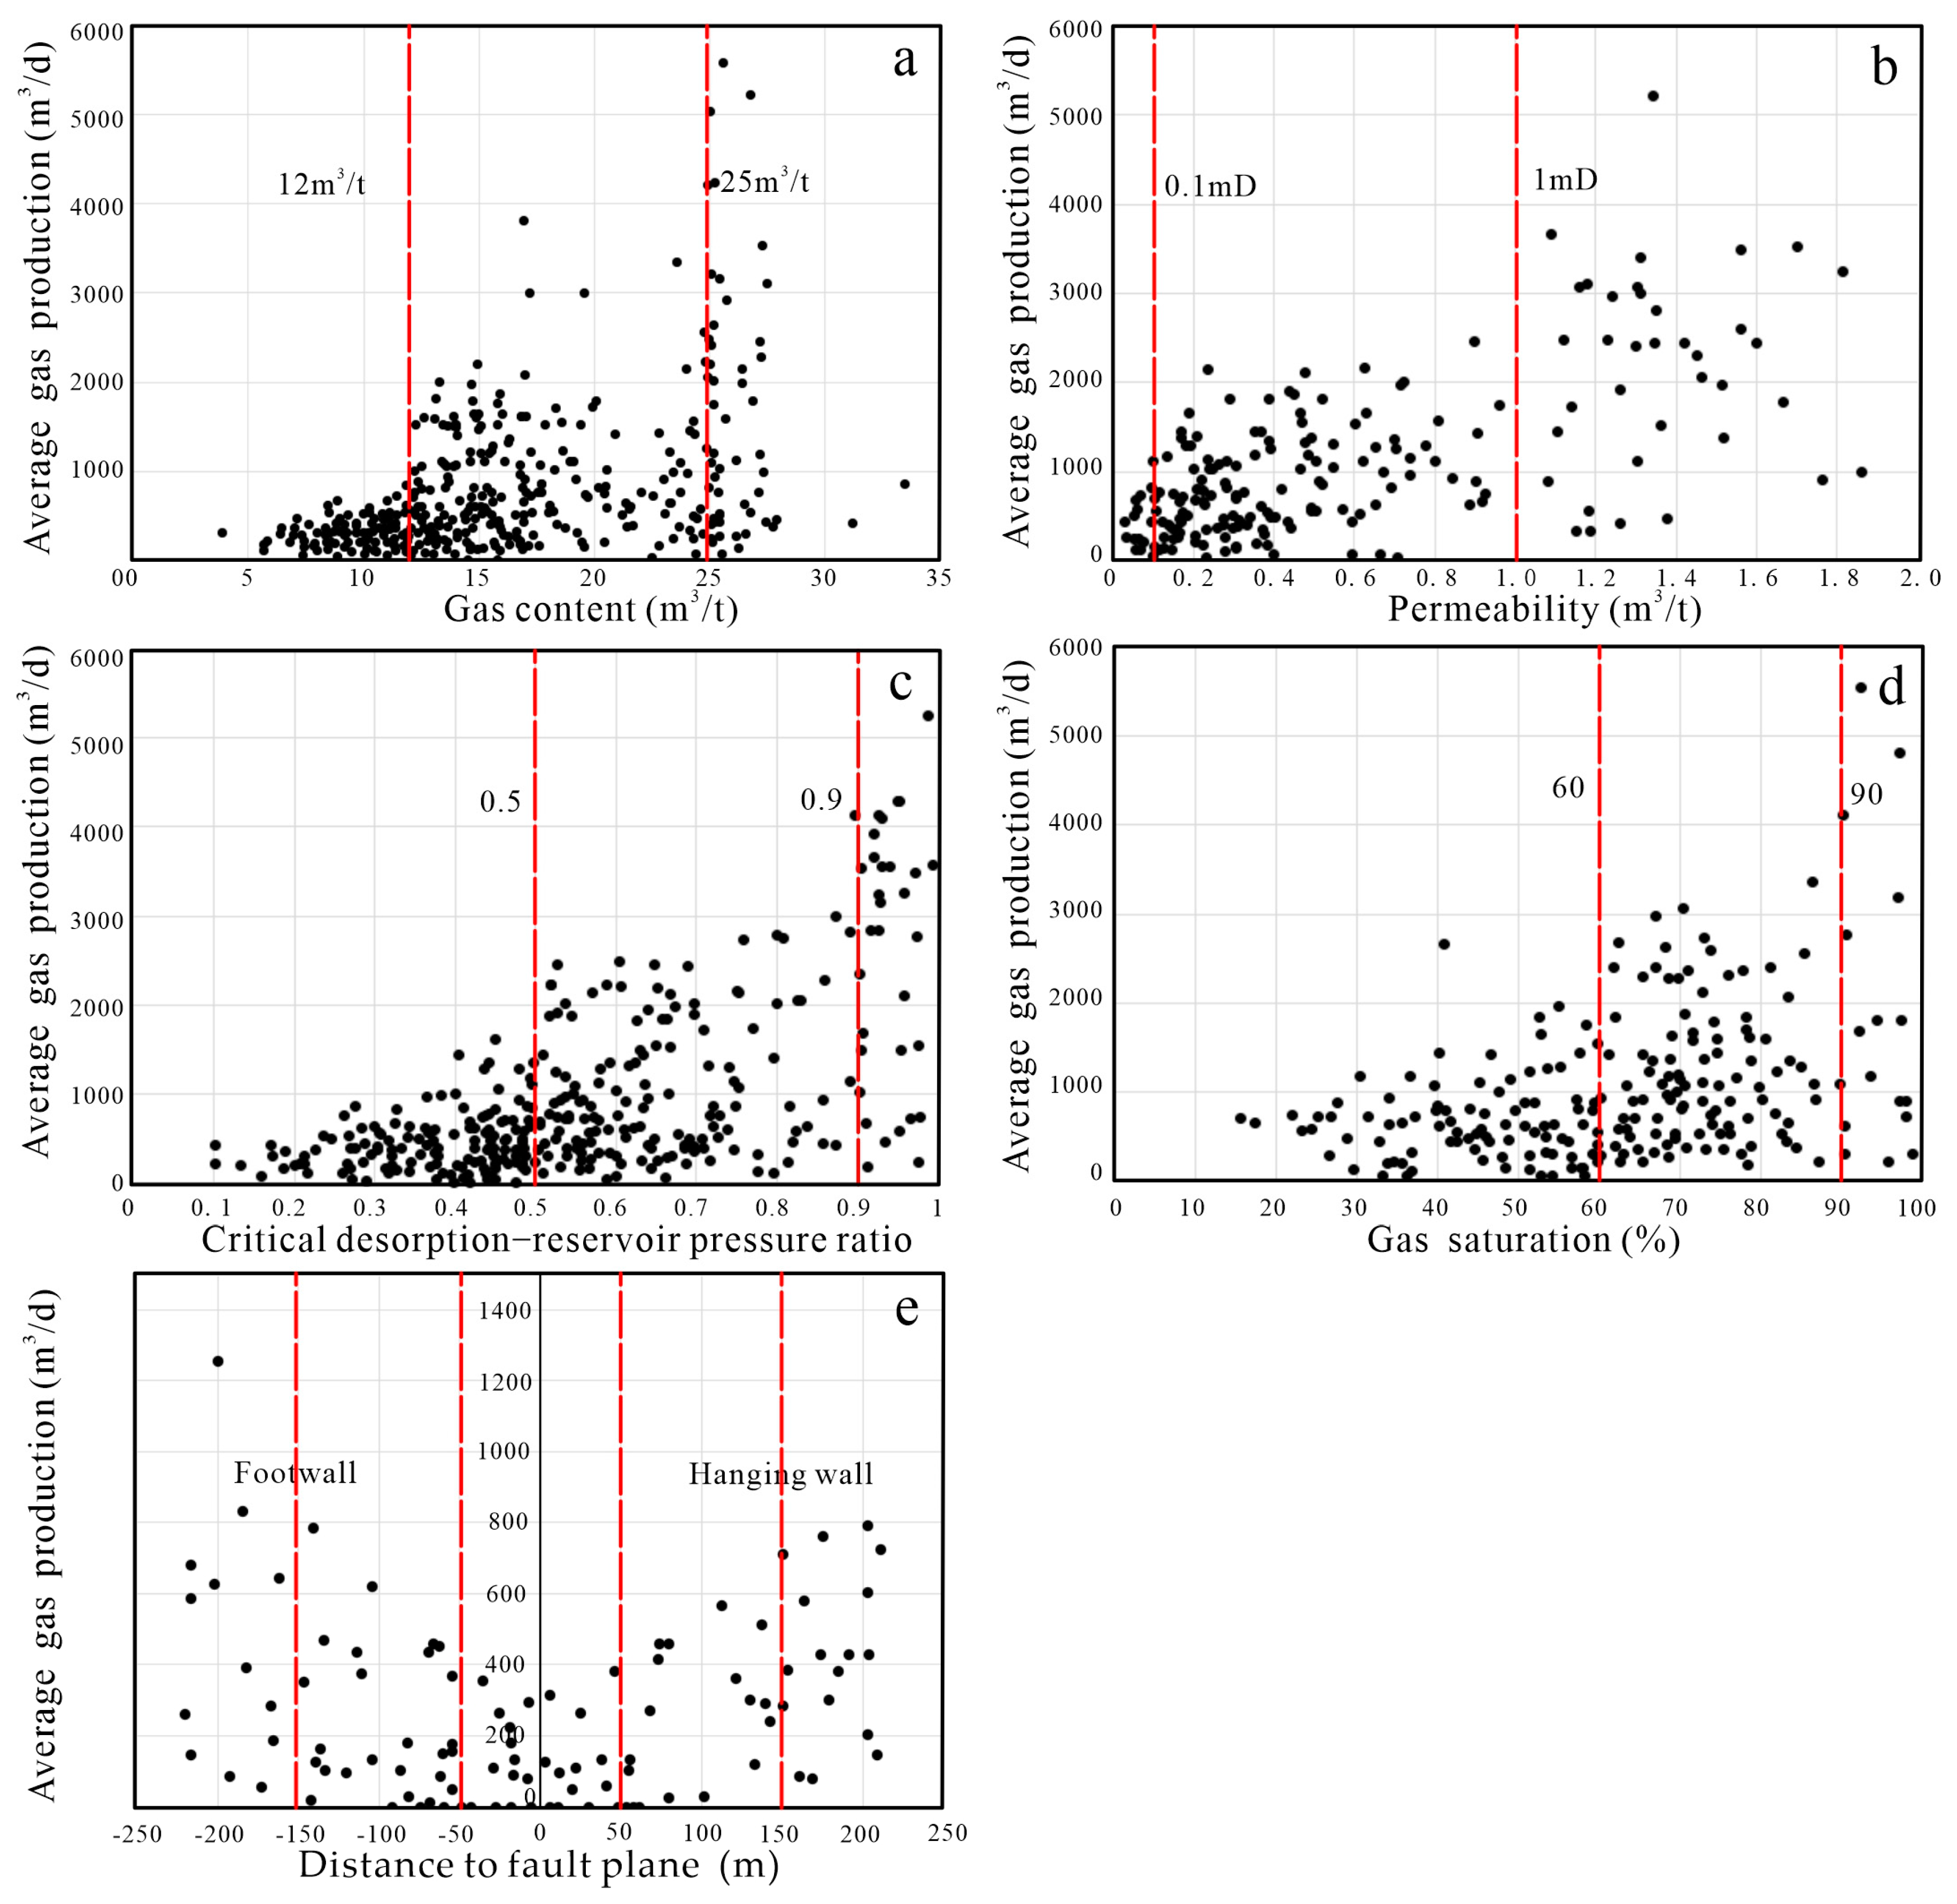
Therefore, resource and geological structure (U1), coal texture and gas saturation (U2), in situ stress and permeability (U3), and reservoir damage and water production (U4) are selected to be the primary indicators for the evaluation of reconstruction potential of low-production well in the southern Qinshui Basin. To establish the grading standard for each evaluation index, Figure 4 presents scatter plots of gas production and various factors in the southern Qinshui Basin to facilitate analysis. Figure 4 depicts the classification criteria of gas content, permeability, critical desorption–reservoir pressure ratio, gas saturation, and distance to fault (date source: [11,13,36,55]). The remaining parameters were derived from field experience. The evaluation parameters and their classification standards for the reconstruction potential of low-production wells are shown in Table 1.

4.2. Determination of Weights for Each Evaluation Index (AHP Model)

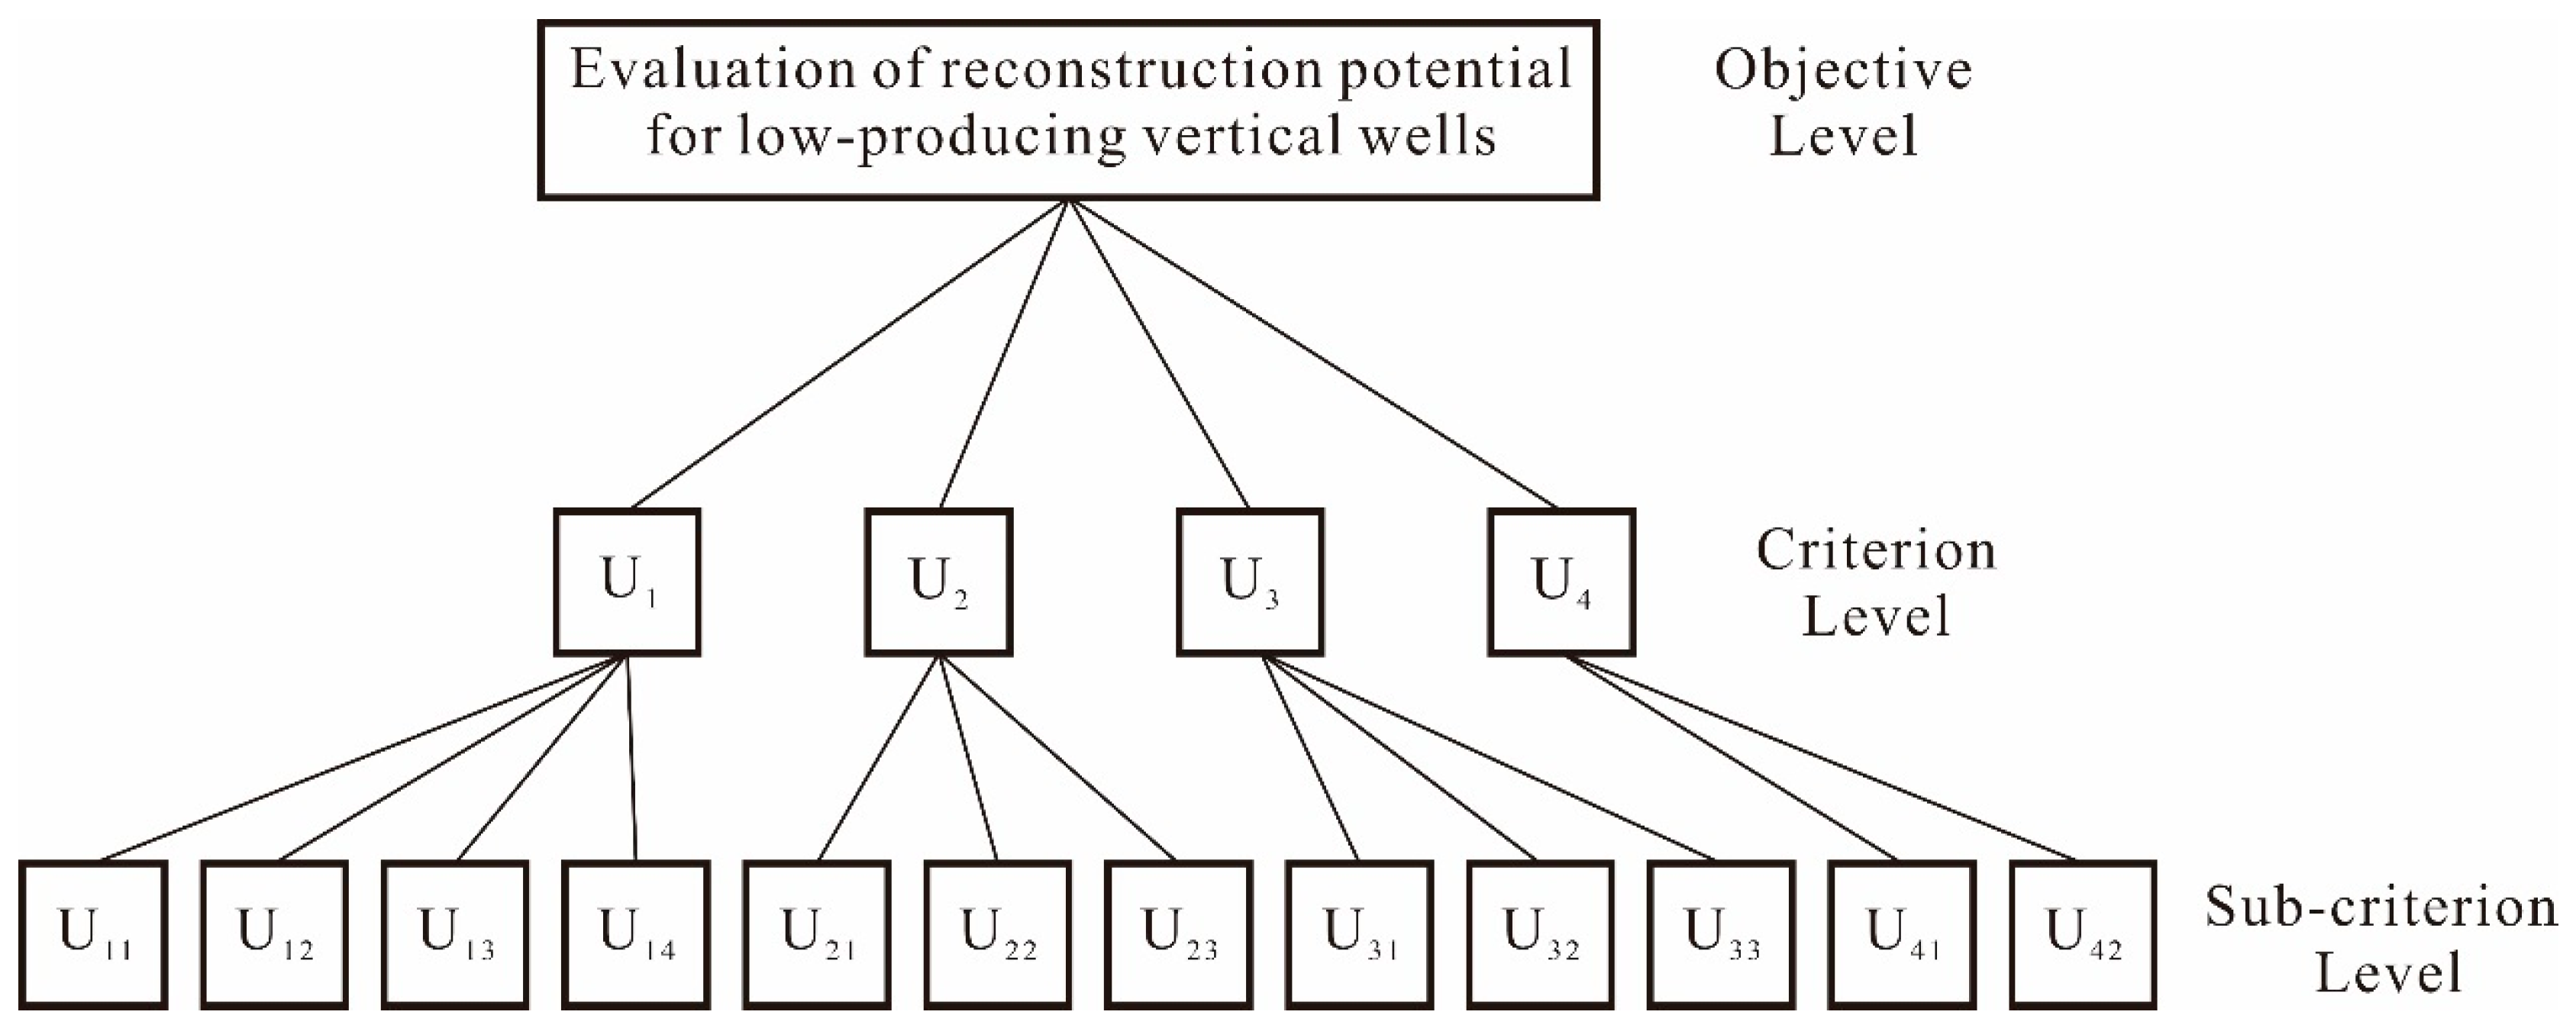
(1) Establishing a hierarchical structure via extensive analyses: it is believed that resource and geological structure (U1), coal texture and gas saturation (U2), in situ stress and permeability (U3), and reservoir damage and water production (U4) are the primary indicators for the evaluation of the potential of low-production well reconstruction in the southern Qinshui Basin. Each primary indicator is further categorized into multiple secondary parameters, and the hierarchical structure of the evaluation index system is illustrated in Figure 5.
(2) Constructing the judgment matrix: to quantify each evaluation parameter, it is necessary to construct judgment matrices for the relevant evaluation indicators. The judgment matrix represents the relative importance of all parameters in this layer compared to a certain parameter in the previous layer. The element of judgment matrix is defined as X i j , namely X i j = U i : U j . The judgment matrices are constructed based on 1–9 scale method (Table 2) to rank the importance of the evaluation indicators [24]. It should be noted that if the indexes are very close, the value of X i j can be 1.1 to 1.9 [24]. Firstly, a judgement matrix is constructed for the primary evaluation parameters, U1, U2, U3, and U4, under the overall goal (parameters affecting the reconstruction potential); subsequently, judgement matrices for the secondary evaluation parameters are constructed with respect to the primary evaluation parameters U1, U2, U3, and U4, as shown in Table 3.
(3) Calculation of single-layer weight: after constructing the judgment matrix, the maximum eigenvalue and eigenvector of the matrix are obtained to determine the relative importance weight of the parameters in this layer with respect to a certain index in the previous layer. The calculation results are shown in Table 4.
(4) Consistency check: the insurance of credibility and accuracy of calculation results necessitates the performance of a consistency check on the matrix, wherein, in this study, the random consistency ratio (CR) proposed by T.L. Saaty [24] is used to judge the consistency of the matrix. The Equation for calculating CR is:
C R = C I / R I
where CI is the consistency index and its value is ( λ m a x n ) / ( n 1 ) , λ m a x is the maximum eigenvalue of the matrix, and n is the order of the matrix. RI is the random consistency index of the same order, and its value can be obtained from Table 5 [24].
If CR < 10%, the judgment matrix has been deemed to have an acceptable consistency, whereas if CR > 10%, the values and calculations need to be adjusted and revised until consistency is achieved. The results of the consistency check are shown in Table 2.
(5) Calculation of overall weights: The analytic hierarchy process requires layer-by-layer calculation of weights. The weights of the first level parameters in the table are relative to the target layer, while the weights of the second level parameters are relative to the first level parameters. The product of the two yields the total ranking of the second level factors relative to the target layer. The results show that the weight of gas content is the largest, and recoverable coefficient is the lowest in the evaluation of the reconstruction potential of low-production wells (Table 4).

4.3. Gray Correlation Degree

Several vertical wells have been stimulated by fracturing in the early-stage development of a certain coalbed methane development block, but some low-production wells still require repeated productivity enhancement. To this end, a productivity improvement potential assessment and optimization were conducted on five vertical wells in the block. Relevant data for the candidate wells were collected, and the results are shown in Table 6. The reconstruction potential evaluation criteria used are shown in Table 1.
Among the selected 12 evaluation parameters, U23, U33, U41, and U42 are negatively correlated with the potential for low-production well improvement, and Equations (1) and (2) are used to normalize these evaluation parameters in Table 6 and Table 7. U11, U12, U13, U14, U21, U22, U31, and U32 are positively correlated with the potential for low-production well reconstruction, and Equations (3) and (4) are used to normalize the relevant evaluation parameters in Table 6 and Table 7, obtaining the following matrix sequences: X 5 × 12 , Y 3 × 12 .
X 5 × 12 = 0 0.1667 0.6667 0 0 0 0 0 0 0 0.3333 0 0 0 0.5 0 0.25 0.6667 0 0.5556 1 0.6 0.2 0 0.8462 0.1667 1 0.8 0.75 0.6667 0 0.5556 0 1 1 0 0 0.1667 0.1667 1 0 0.3333 0 0.5556 1 0.6 0 1 0 0.1667 0 0 0.25 0 0 0 0 0.2 0 0.25
Y 3 × 12 = 1 1 1 1 1 1 0 1 1 0 0 0 0.5 0.5 0.5 0.5 0.5 0.5 0.5 0.5 0.5 0.5 0.5 0.5 0 0 0 0 0 0 1 0 0 1 1 1
Calculation of correlation coefficient and degree of association for No.1 candidate well is presented as an example. Firstly, the following evaluation sequence is established:
Y 4 × 12 = 0 0.1667 0.1667 0 0 0 0 0 0 0 0.3333 0 1 1 1 1 1 1 0 1 1 0 0 0 0.5 0.5 0.5 0.5 0.5 0.5 0.5 0.5 0.5 0.5 0.5 0.5 0 0 0 0 0 0 1 0 0 1 1 1
Using Equation (5), the calculation was performed on the matrix (11), and the result is:
Δ i j = 1 0.8333 0.3333 1 1 1 0 1 1 0 0.3333 0 0.5 0.3333 0.1667 0.5 0.5 0.5 0.5 0.5 0.5 0.5 0.1667 0.5 0 0.1667 0.6667 0 0 0 1 0 0 1 0.6667 1
Using Equations (6) and (7), the correlation degrees between the evaluation factors of the first candidate well and the low-production well reconstruction potential evaluation criteria can be obtained as follows: r 1 = 0.5251 ,   0.5290 ,   0.7651 . Following the above principles and steps, the correlation degrees for the other four candidate wells can be obtained. The results are shown in Table 7.
According to the data in Table 7, candidate well 1 exhibits gray correlation coefficients of 0.5251, 0.5290, and 0.7651 with respect to low, medium, and high reconstruction potential, respectively. The evaluation of reconstruction potential for candidate well 1 shows the closest correlation with high reconstruction potential, indicating that candidate well 1 possesses a significant potential for reconstruction. Similarly, we can determine the reconstruction potential levels for candidate wells 4 and 5 are also high, while well 2 is medium and well 3 is low.

5. Conclusions

(1)
Through extensive data analysis and field practical experience, the evaluation of reconstruction potential for low-production wells in the southern Qinshui Basin focuses on geological conditions and the degree of damage caused by initial fracturing to the coal reservoir. For this purpose, a comprehensive set of 12 indicators and their corresponding grading standards have been established to evaluate the reconstruction potential. These indicators encompass crucial factors, such as gas content, coal seam thickness, recoverable coefficient, distance to structure, critical desorption–reservoir pressure ratio, gas saturation, coal texture, permeability, pressure gradient, burial depth, water production rate, and reservoir damage ratio.
(2)
The weights for each evaluation indicator were obtained using the Analytic Hierarchy Process (AHP). The results indicate that the gas content has the highest weight, with a value of 0.15. On the other hand, the recovery coefficient has the lowest weight, with a value of 0.03. The weights for the remaining indicators fall between these two values, reflecting their relative importance in the evaluation process.
(3)
The reconstruction potential of five wells was evaluated using the gray correlation analysis method. The results indicate that candidate wells 1, 4, and 5 have high reconstruction potential, candidate well 2 has a moderate reconstruction potential, and candidate well 3 has a low reconstruction potential.
(4)
The developed evaluation method for reconstruction potential is primarily applicable to the Qinshui Basin. Due to significant differences in geological characteristics and coal reservoir conditions in other regions, the applicability of this evaluation method in other areas requires further research and validation.

Author Contributions

Conceptualization, B.S. and C.L.; methodology, B.S.; validation, K.X., B.S. and C.L.; formal analysis, K.X.; investigation, C.L.; resources, B.S.; data curation, B.S.; writing—original draft preparation, K.X.; writing—review and editing, K.X.; supervision, C.L.; project administration, B.S.; funding acquisition, B.S. All authors have read and agreed to the published version of the manuscript.

Funding

This research was funded by Shanxi Province Science and Technology Major Project, grant number 20191102001.

Institutional Review Board Statement

Not applicable.

Informed Consent Statement

Not applicable.

Data Availability Statement

All relevant data are within the paper.

Conflicts of Interest

The authors declare no conflict of interest.

References

  1. Mastalerz, M.; Drobniak, A. 5–Coalbed Methane: Reserves, Production, and Future Outlook. In Future Energy, 3rd ed.; Elsevier: Amsterdam, The Netherlands, 2020; pp. 97–109. [Google Scholar] [CrossRef]
  2. Wen, S.; Zhou, K.; Lu, Q. A discussion on CBM development strategies in China: A case study of PetroChina Coalbed Methane Co., Ltd. Nat. Gas Ind. B 2019, 6, 610–618. [Google Scholar] [CrossRef]
  3. Gilman, A.; Beckie, R. Flow of Coal-Bed Methane to a Gallery. Transp. Porous Media 2000, 41, 1–16. [Google Scholar] [CrossRef]
  4. Altowilib, A.; AlSaihati, A.; Alhamood, H.; Alafnan, S.; Alarifi, S. Reserves Estimation for Coalbed Methane Reservoirs: A Review. Sustainability 2020, 12, 10621. [Google Scholar] [CrossRef]
  5. Mu, F.; Zhong, W.; Zhao, X.; Che, C.; Chen, Y.; Zhu, J.; Wang, B. Strategies for the development of CBM gas industry in China. Nat. Gas Ind. B 2015, 2, 383–389. [Google Scholar] [CrossRef] [Green Version]
  6. Bosikov, I.I.; Martyushev, N.V.; Klyuev, R.V.; Savchenko, I.A.; Kukartsev, V.V.; Kukartsev, V.A.; Tynchenko, Y.A. Modeling and Complex Analysis of the Topology Parameters of Ventilation Networks When Ensuring Fire Safety While Developing Coal and Gas Deposits. Fire 2023, 6, 95. [Google Scholar] [CrossRef]
  7. Zou, Q.; Chen, Z.; Cheng, Z.; Liang, Y.; Xu, W.; Wen, P.; Zhang, B.; Liu, H.; Kong, F. Evaluation and intelligent deployment of coal and coalbed methane coupling coordinated exploitation based on Bayesian network and cuckoo search. Int. J. Min. Sci. Technol. 2022, 32, 1315–1328. [Google Scholar] [CrossRef]
  8. Pashin, J.C. Variable gas saturation in coalbed methane reservoirs of the Black Warrior Basin: Implications for exploration and production. Int. J. Coal Geol. 2010, 82, 135–146. [Google Scholar] [CrossRef]
  9. Liang, W.; Yan, J.; Zhang, B.; Hou, D. Review on Coal Bed Methane Recovery Theory and Technology: Recent Progress and Perspectives. Energy Fuels 2021, 35, 4633–4643. [Google Scholar] [CrossRef]
  10. Zhu, Q.; Zuo, Y.; Yang, Y. How to solve the technical problems in CBM development: A case study of a CBM gas reservoir in the southern Qinshui Basin. Nat. Gas Ind. B 2015, 2, 277–281. [Google Scholar] [CrossRef] [Green Version]
  11. Tao, S.; Tang, D.; Xu, H.; Gao, L.; Fang, Y. Factors controlling high-yield coalbed methane vertical wells in the Fanzhuang Block, Southern Qinshui Basin. Int. J. Coal Geol. 2014, 134–135, 38–45. [Google Scholar] [CrossRef]
  12. Karacan, C.Ö. Production history matching to determine reservoir properties of important coal groups in the Upper Pottsville formation, Brookwood and Oak Grove fields, Black Warrior Basin, Alabama. J. Nat. Gas Sci. Eng. 2013, 10, 51–67. [Google Scholar] [CrossRef] [Green Version]
  13. Peng, C.; Zou, C.; Zhou, T.; Li, K.; Yang, Y.; Zhang, G.; Wang, W. Factors affecting coalbed methane (CBM) well productivity in the Shizhuangnan block of southern Qinshui basin, North China: Investigation by geophysical log, experiment and production data. Fuel 2017, 191, 427–441. [Google Scholar] [CrossRef]
  14. Li, Z.; Liu, D.; Wang, Y.; Si, G.; Cai, Y.; Wang, Y. Evaluation of multistage characteristics for coalbed methane desorption-diffusion and their geological controls: A case study of the northern Gujiao Block of Qinshui Basin, China. J. Pet. Sci. Eng. 2021, 204, 108704. [Google Scholar] [CrossRef]
  15. Zhang, P.; Meng, Z.; Jiang, S.; Chen, X. Characteristics of in-situ stress distribution in Zhengzhuang Region, Southern Qinshui Basin, China and its stress path during depletion. Eng. Geol. 2020, 264, 105413. [Google Scholar] [CrossRef]
  16. Yang, G.; Tang, S.; Hu, W.; Song, Z.; Zhang, S.; Xi, Z.; Wang, K.; Yan, X. Analysis of abnormally high water production in coalbed methane vertical wells: A case study of the Shizhuangnan block in the southern Qinshui Basin, China. J. Pet. Sci. Eng. 2020, 190, 107100. [Google Scholar] [CrossRef]
  17. Wang, Q.; Su, X.; Su, L.; Zhou, F. CBM geological characteristics and exploration potential in the Sunan Syncline block, southern north China basin. J. Pet. Sci. Eng. 2020, 186, 106713. [Google Scholar] [CrossRef]
  18. Zhao, L.; Chen, X.; Zou, H.; Liu, P.; Liang, C.; Zhang, N.; Li, N.; Luo, Z.; Du, J. A review of diverting agents for reservoir stimulation. J. Pet. Sci. Eng. 2020, 187, 106734. [Google Scholar] [CrossRef]
  19. Huang, Q.; Liu, S.; Wang, G.; Wu, B.; Zhang, Y. Coalbed methane reservoir stimulation using guar-based fracturing fluid: A review. J. Nat. Gas Sci. Eng. 2019, 66, 107–125. [Google Scholar] [CrossRef]
  20. Keshavarz, A.; Badalyan, A.; Johnson, R.; Bedrikovetski, P. Improving the efficiency of hydraulic fracturing treatment in CBM reservoirs by stimulating the surrounding natural fracture system. APPEA J. 2015, 55, 351–360. [Google Scholar] [CrossRef]
  21. Keshavarz, A.; Badalyan, A.; Carageorgos, T.; Bedrikovetsky, P.; Johnson, R., Jr. Stimulation of coal seam permeability by micro-sized graded proppant placement using selective fluid properties. Fuel 2015, 144, 228–236. [Google Scholar] [CrossRef]
  22. Sampath, K.H.S.M.; Perera, M.S.A.; Ranjith, P.G.; Matthai, S.K.; Rathnaweera, T.; Zhang, G.; Tao, X. CH4–CO2 gas exchange and supercritical CO2 based hydraulic fracturing as CBM production-accelerating techniques: A review. J. CO2 Util. 2017, 22, 212–230. [Google Scholar] [CrossRef]
  23. Danesh, N.N.; Zhao, Y.; Teng, T.; Masoudian, M.S. Prediction of interactive effects of CBM production, faulting stress regime, and fault in coal reservoir: Numerical simulation. J. Nat. Gas Sci. Eng. 2022, 99, 104419. [Google Scholar] [CrossRef]
  24. Basak, I.; Saaty, T. Group decision making using the analytic hierarchy process. Math. Comput. Model. 1993, 17, 101–109. [Google Scholar] [CrossRef]
  25. Ni, X.; Tan, X.; Wang, B.; Fu, X. An evaluation method for types of low-production coalbed methane reservoirs and its application. Energy Rep. 2021, 7, 5305–5315. [Google Scholar] [CrossRef]
  26. Yao, Y.; Liu, D.; Tang, D.; Huang, W.; Tang, S.; Chen, Y. A Comprehensive Model for Evaluating Coalbed Methane Reservoirs in China. Acta Geol. Sin. Engl. Ed. 2010, 82, 1253–1270. [Google Scholar] [CrossRef]
  27. Yao, Y.; Liu, D.; Tang, D.; Tang, S.; Che, Y.; Huang, W. Preliminary evaluation of the coalbed me-thane production potential and its geological controls in the Weibei Coalfield, southeastern Ordos Basin, China. Int. J. Coal Geol. 2009, 78, 1–15. [Google Scholar] [CrossRef]
  28. Cai, Y.; Liu, D.; Yao, Y.; Li, J.; Qiu, Y. Geological controls on prediction of coalbed methane of No. 3 coal seam in Southern Qinshui Basin, North China. Int. J. Coal Geol. 2011, 88, 101–112. [Google Scholar] [CrossRef]
  29. Tapia, J.F.D.; Promentilla, M.A.B.; Tseng, M.-L.; Tan, R.R. Screening of carbon dioxide utilization options using hybrid Analytic Hierarchy Process-Data Envelopment Analysis method. J. Clean. Prod. 2017, 165, 1361–1370. [Google Scholar] [CrossRef]
  30. Lin, S.J.; Lu, I.J.; Lewis, C. Grey relation performance correlations among economics, energy use and carbon dioxide emission in Taiwan. Energy Policy 2017, 35, 1948–1955. [Google Scholar] [CrossRef]
  31. Wang, J.J.; Jing, Y.Y.; Zhang, C.F.; Zhang, X.T.; Shi, G.-H. Integrated evaluation of distributed triple-generation systems using improved grey incidence approach. Energy 2008, 33, 1427–1437. [Google Scholar] [CrossRef]
  32. ASLAN, N. Use of the grey analysis to determine optimal oil agglomeration with multiple performance characteristics. Fuel 2013, 109, 109373–109378. [Google Scholar] [CrossRef]
  33. Kiani, A.; Sakurovs, R.; Grigore, M.; Sokolova, A. Gas sorption capacity, gas sorption rates and nanoporosity in coals. Int. J. Coal Geol. 2018, 200, 77–86. [Google Scholar] [CrossRef]
  34. Salmachi, A.; Yarmohammadtooski, Z. Production data analysis of coalbed methane wells to estimate the time required to reach to peak of gas production. Int. J. Coal Geol. 2015, 141–142, 33–41. [Google Scholar] [CrossRef]
  35. Pillalamarry, M.; Harpalani, S.; Liu, S. Gas diffusion behavior of coal and its impact on production from coalbed methane reservoirs. Int. J. Coal Geol. 2011, 86, 342–348. [Google Scholar] [CrossRef]
  36. Li, P.; Zhang, X.; Li, J.; Zhao, J.; Huang, J.; Zhang, S.; Zhou, S. Analysis of the Key Factors Affecting the Productivity of Coalbed Methane Wells: A Case Study of a High-Rank Coal Reservoir in the Central and Southern Qinshui Basin, China. ACS Omega 2020, 5, 28012–28026. [Google Scholar] [CrossRef]
  37. Chen, S.; Tao, S.; Tian, W.; Tang, D.; Zhang, B.; Liu, P. Hydrogeological control on the accumulation and production of coalbed methane in the Anze Block, southern Qinshui Basin, China. J. Pet. Sci. Eng. 2021, 198, 108138. [Google Scholar] [CrossRef]
  38. Sun, F.; Wang, B.; Li, M.; Liang, H. Major geological factors controlling the enrichment and high yield of coalbed methane in the southern Qinshui Basin. Acta Pet. Sin. 2014, 35, 1070–1079. [Google Scholar] [CrossRef]
  39. Tao, S.; Pan, Z.; Tang, S.; Chen, S. Current status and geological conditions for the applicability of CBM drilling technologies in China: A review. Int. J. Coal Geol. 2018, 202, 95–108. [Google Scholar] [CrossRef]
  40. Wang, H.; Yao, Y.; Liu, D.; Cai, Y.; Yang, Y.; Zhou, S. Determination of the degree of coal deformation and its effects on gas production in the southern Qinshui Basin, North China. J. Pet. Sci. Eng. 2022, 216, 110746. [Google Scholar] [CrossRef]
  41. Sang, S.; Liu, H.; Li, Y.; Li, M.; Li, L. Geological controls over coal-bed methane well production in southern Qinshui basin. Procedia Earth Planet. Sci. 2009, 1, 917–922. [Google Scholar] [CrossRef] [Green Version]
  42. Karthikeyan, G.; Chand, J.; Chatterjee, R. Impact of geomechanics in coal bed methane development and production, Barakar coals in central India. J. Pet. Sci. Eng. 2020, 194, 194107515. [Google Scholar] [CrossRef]
  43. Perera, M.S.A.; Ranjith, P.G.; Peter, M. Effects of saturation medium and pressure on strength parameters of Latrobe Valley brown coal: Carbon dioxide, water and nitrogen saturations. Energy 2011, 36, 6941–6947. [Google Scholar] [CrossRef]
  44. Zhou, R.; Zuo, Y.; Wang, Y.; Zhang, X.; Shuai, Z. Study on Optimization and evaluation indexes of coalbed methane development units in south of Qinshui Basin. In Proceedings of the 5th National Symposium on Efficient Development Technology of Natural Gas Reser, Nanchang, China, 1 March 2014. [Google Scholar]
  45. Zheng, A.; Wang, X.; Wang, X.; Wu, M.; Yuan, Y. The Effect of Coal Seam Gas saturation on CBM Well Productivity—A Case Study of Central Region of Hedong Area. Procedia Eng. 2011, 26, 1205–1213. [Google Scholar] [CrossRef] [Green Version]
  46. Han, S.-J.; Sang, S.-X.; Duan, P.-P.; Zhang, J.-C.; Xiang, W.-X.; Xu, A. The effect of the density difference between supercritical CO2 and supercritical CH4 on their adsorption capacities: An experimental study on anthracite in the Qinshui Basin. Pet. Sci. 2022, 19, 1516–1526. [Google Scholar] [CrossRef]
  47. Xiao, Z.; Wang, C.; Wang, G.; Jiang, Y.; Yu, J. An improved apparent permeability model considering full pore pressure range, variable intrinsic permeability and slippage coefficient. Int. J. Min. Sci. Technol. 2022, 32, 1233–1244. [Google Scholar] [CrossRef]
  48. Zhu, H.; Tang, X.; Liu, Q.; Liu, S.; Zhang, B.; Jiang, S.; McLennan, J.D. Permeability stress-sensitivity in 4D flow-geomechanical coupling of Shouyang CBM reservoir, Qinshui Basin, China. Fuel 2018, 232, 817–832. [Google Scholar] [CrossRef]
  49. Wupeng, Z.H.A.O.; Chunchun, L.I.U.; Xingwei, S.H.E.N.; He, P.E.N.G.; Hongtao, H.U.O. Study on the stimulation technologies for low-yield CBM wells in Zhengzhuang block. Oil Drill. Prod. Technol. 2017, 39, 491–494. [Google Scholar] [CrossRef]
  50. Meng, Z.; Zhang, J.; Wang, R. In-situ stress, pore pressure and stress-dependent permeability in the Southern Qinshui Basin. Int. J. Rock Mech. Min. Sci. 2011, 48, 122–131. [Google Scholar] [CrossRef]
  51. McMillan, D.W.; Palanyk, V.S. CBM: Fracture Stimulation—An Australian Experience. In Proceedings of the SPE Annual Technical Conference and Exhibition, Anaheim, CA, USA, 11–14 November 2007. [Google Scholar] [CrossRef]
  52. Jia, H.; Hu, Q.; Qi, K.; Liu, C.; Fan, B.; He, J. Reasons of low yield and stimulation measures for vertical CBM wells in high-rank coal. Coal Geology & Exploration. Coal Geol. Explor. 2019, 47, 104–110. [Google Scholar] [CrossRef]
  53. Zhang, L.; Shan, B.; Zhao, Y. Production performance laws of vertical wells by volume fracturing in CBM reservoirs. Nat. Gas Ind. B 2017, 4, 189–196. [Google Scholar] [CrossRef]
  54. Jamshidi, M.; Jessen, K. Water production in enhanced coalbed methane operations. J. Pet. Sci. Eng. 2012, 92–93, 56–64. [Google Scholar] [CrossRef]
  55. Ni, X.; Wang, Y.; Han, W.; Liu, D.; Li, Y.; Tao, C.; Gao, X.; Zhao, S. Division and application of development geological units for coalbed methane. J. China Coal Soc. 2020, 45, 2562–2574. [Google Scholar] [CrossRef]
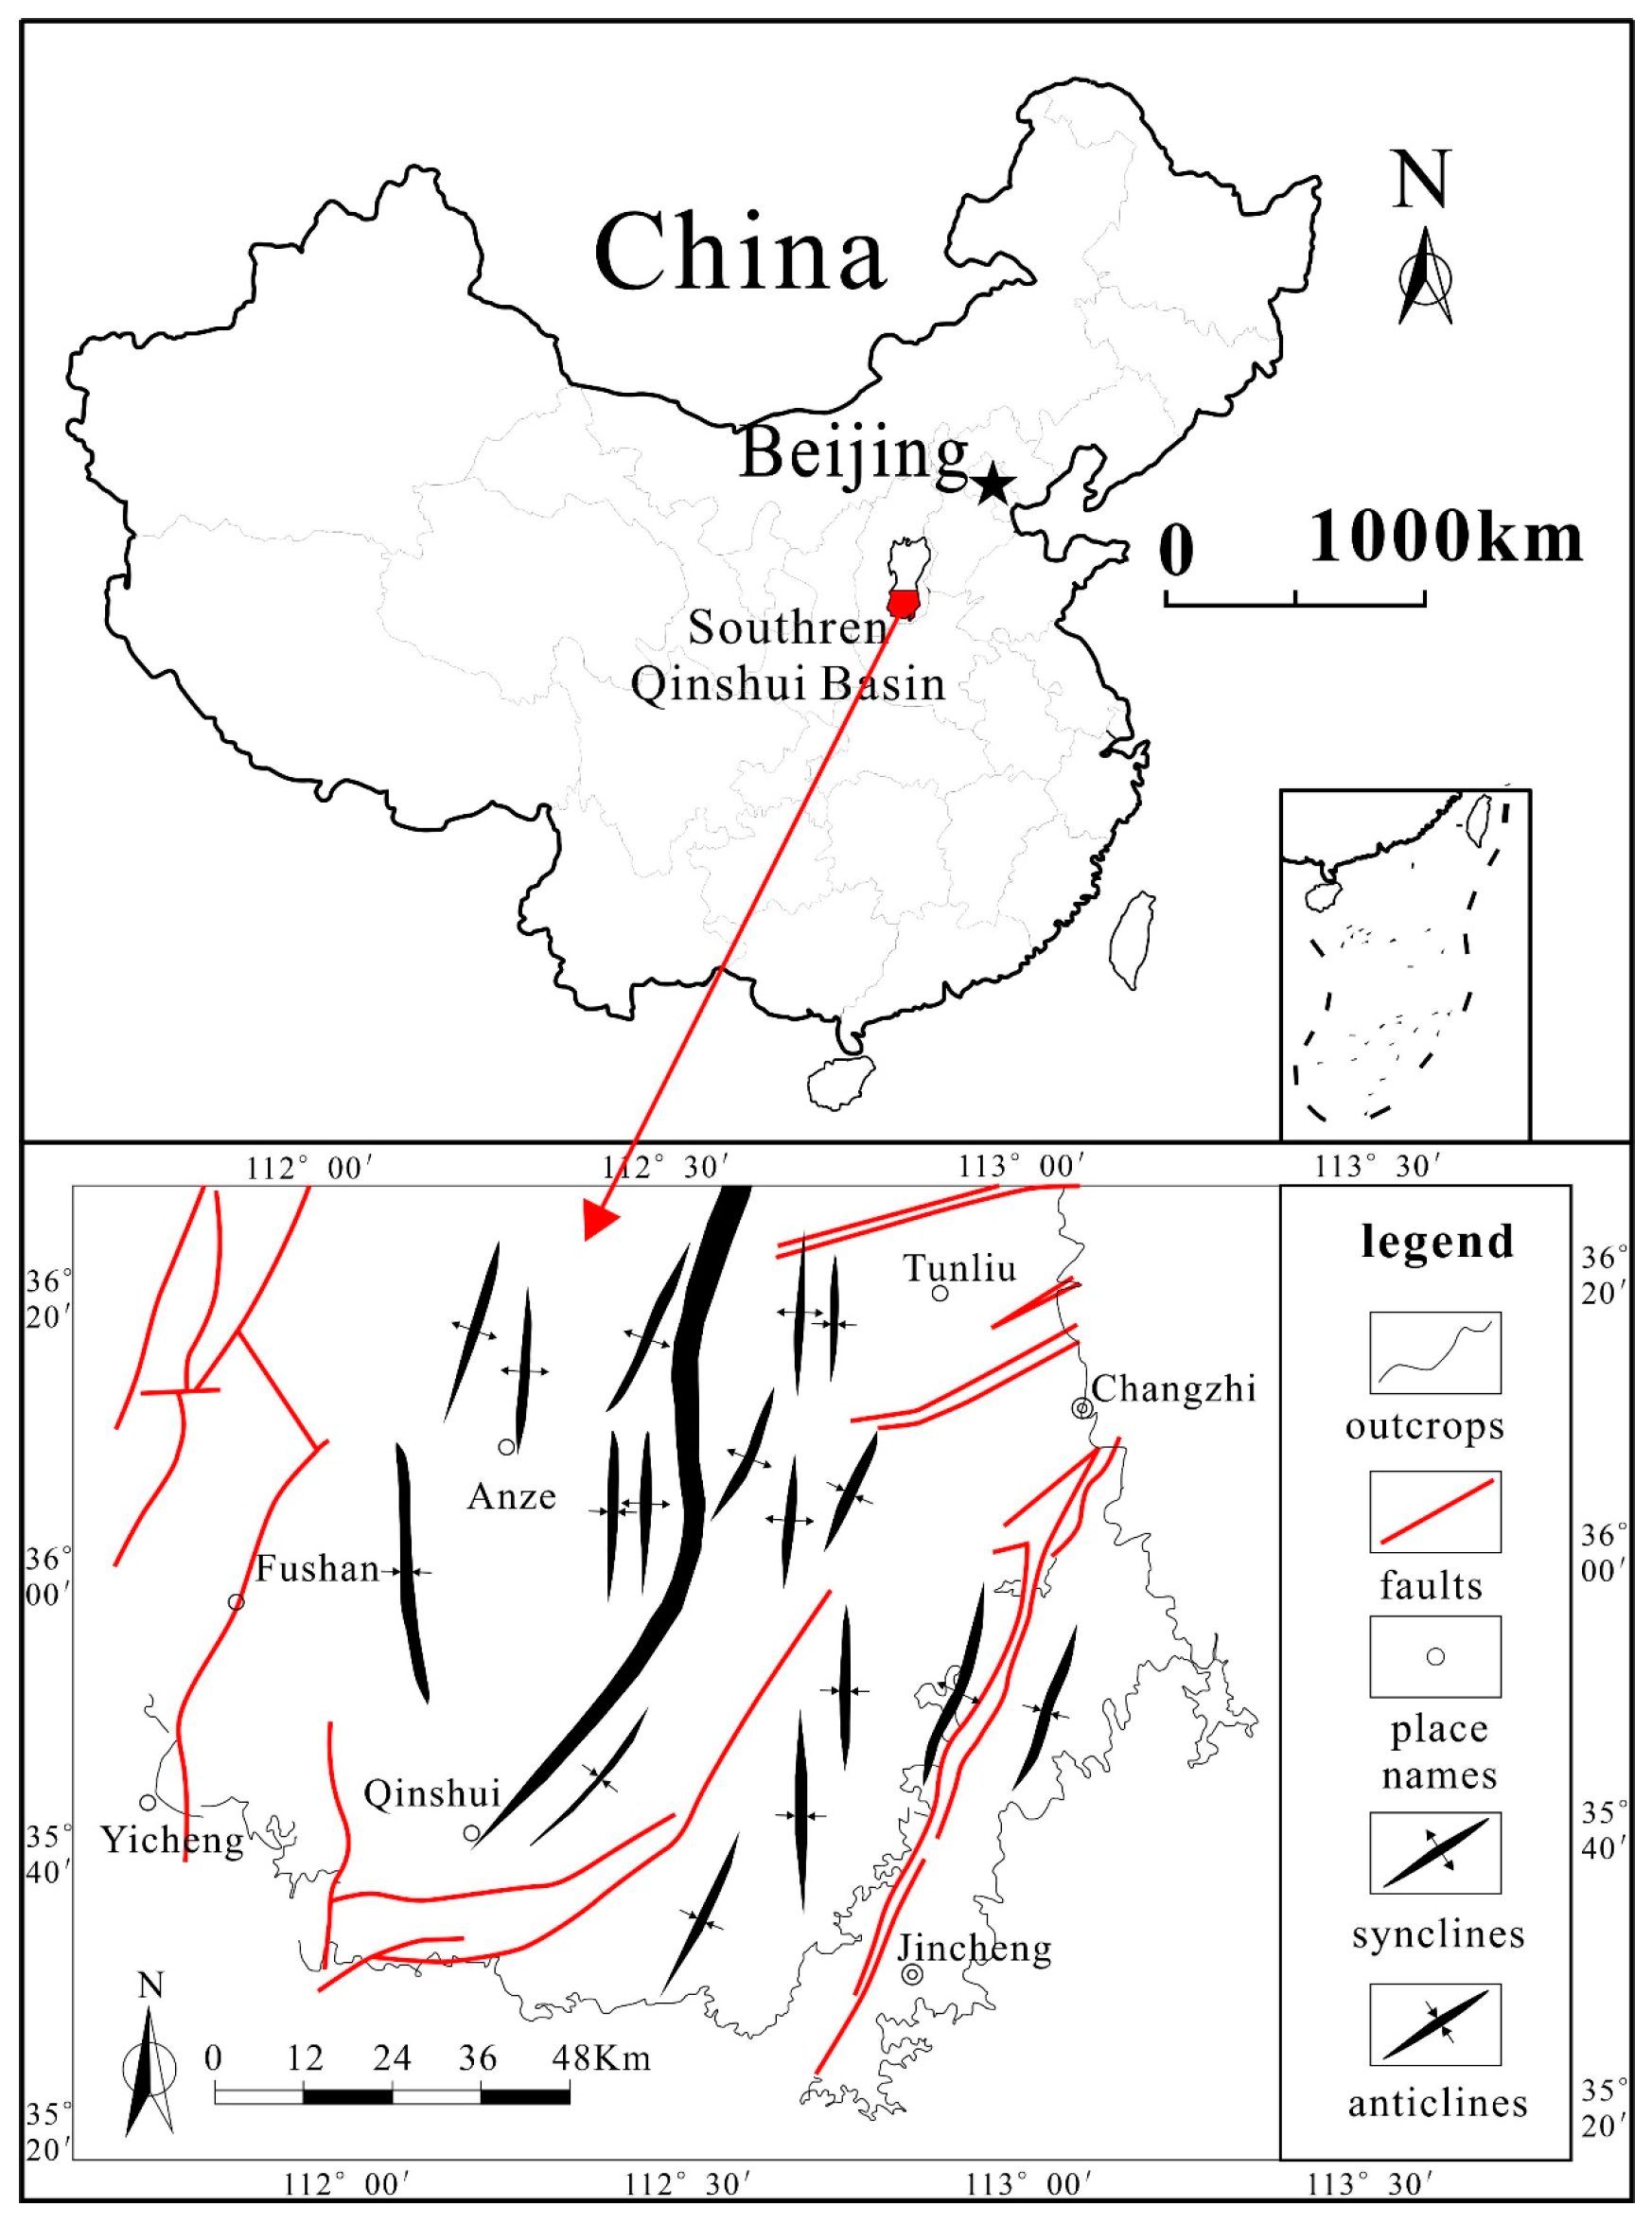
Figure 1. Location and structure outline of the southern Qinshui Basin.
Processes 11 01741 g001
Figure 2. The proportion of low-production CBM wells.
Processes 11 01741 g002
Figure 3. AHP flow chart.
Processes 11 01741 g003
Figure 4. Scatter plots of gas production and various factors for the southern Qinshui Basin (a, gas content; b, permeability; c, critical desorption−reservoir pressure; d, gas saturation; e, distance to fault plane).
Processes 11 01741 g004
Figure 5. Hierarchy for the evaluation of reconstruction potential of low-production wells.
Processes 11 01741 g005
Table 1. Evaluation indexes and classification of reconstruction potential of low-production wells.
Primary Evaluation FactorsSecondary Evaluation FactorsClassification Standards
LowMediumHigh
Resources and geological structure (U1) (U11) Gas content (m3/t) ≤1212–25≥25
(U12) Coal seam thickness (m) ≤33–6≥6
(U13) Recoverable coefficient (%) ≤5050–80≥80
(U14) Distance to structure (m) ≤5050–150≥150
Coal texture and gas saturation (U2) (U21) Critical desorption–reservoir pressure ratio (%) ≤0.50.5–0.9≥0.9
(U22) Gas saturation (%) ≤6060–90≥90
(U23) * Coal texture (%) ≥5020–50≤20
In situ stress and permeability (U3) (U31) Permeability (mD) ≤0.10.1–1≥1
(U32) Pressure Gradient (kPa/m) ≤9.509.5–10≥10
(U33) Burial depth (m) ≥1000500–1000≤500
Reservoir damage and water production (U4) (U41) Water production rate (m3/d) ≥50.5–5≤0.5
(U42) Reservoir damage ratio (%) ≥4020–40≤20
* Coal texture is described as the proportion of mylonitized coal to the total coal thickness.
Table 2. The fundamental scale of absolute numbers.
Intensity of ImportanceDefinitionExplanation
1Equal Importance Two indexes contribute equally to the objective
2Weak or slight
3Moderate importanceExperience and judgement slightly favor one index over another
4Moderate plus
5Strong importanceExperience and judgement strongly favor one index over another
6Strong plus
7Very strong An index is favored very strongly over another; its dominance demonstrated in practice
8Very, very strong
9Extreme importanceThe evidence favoring one index over another is of the highest possible order of affirmation
1.1–1.9If the indexes are very closeMay be difficult to assign the best value, but when compared with other contrasting indexes, the size of the small numbers would not be too noticeable, yet they can still indicate the relative importance of the indexes
Table 3. Each parameter weight coefficient and random consistency ratio.
Evaluation Indicators
and Matrices
Eigenvector
W
Maximum Eigenvalue
λMAX
Random
Consistency Ratio (CR)
U U1U2U3U4
U112 13 0.354.010.01
U20.5 1 2 2 0.28
U31 0.5 13 0.26
U40.330.5 0.33 1 0.11
U1 U11U12U13U14
U111252 0.444.240.09
U120.5132 0.28
U130.20.3310.330.08
U140.50.5310.20
U2 U21U22U23
U2110.91 0.32 3.000
U221.111.1 0.36
U2310.91 0.32
U3 U31U32U33
U3110.830.83 0.29 3.000
U321.211 0.36
U331.211 0.36
U4 U41U42
U4111 0.52.000
U4211 0.5
Table 4. Evaluation index weights results.
Objective LevelCriterion LevelWeightSub-Criterion LevelWeight
Evaluation of transformation potentialResources and
geological structure (U1)
0.35U110.15
U120.10
U130.03
U140.07
Coal texture and gas saturation (U2)0.28U210.09
U220.10
U230.09
In situ stress and
permeability (U3)
0.26U310.08
U320.09
U330.09
Reservoir damage and water production (U4)0.11U410.06
U420.06
Table 5. The look-up table of RI.
Matrix
Order
123456789
RI0.000.000.580.91.121.241.321.411.42
Table 6. Table of relevant evaluation parameters of candidate low-production wells.
WellU11
(m3/t)
U12
(m)
U13
(%)
U14
(m)
U21U22
(%)
U23
(%)
U31
(mD)
U32
(kPa/m)
U33
(m)
U41
(m3/d)
U42
(%)
1285.5602000.990101.510500120
2306.5651700.870100.598000.815
3145.550700.67050.5101000620
4285.575450.98050.558000.540
5275.5852100.89001.5186000.525
Table 7. Calculation value and evaluation results of gray correlation degree.
Candidate WellCorrelation CoefficientResults
LowMediumHigh
10.52480.53750.7735High
20.58370.63000.6117Medium
30.62450.60930.5743Low
40.58480.60500.6487High
50.50110.55120.7636High
Disclaimer/Publisher’s Note: The statements, opinions and data contained in all publications are solely those of the individual author(s) and contributor(s) and not of MDPI and/or the editor(s). MDPI and/or the editor(s) disclaim responsibility for any injury to people or property resulting from any ideas, methods, instructions or products referred to in the content.