Article

Coupled Thermal-Hydraulic-Mechanical Modeling of Near-Well Stress Evolution in Naturally Fractured Formations during Drilling

1
Exploration and Development Research Institute of CNPC Xinjiang Oilfield Company, Karamay 834000, China
2
College of Petroleum Engineering, China University of Petroleum (Beijing), Beijing 102249, China
3
Department of Petroleum Engineering, China University of Petroleum—Beijing at Karamay, Karamay 834000, China
*
Author to whom correspondence should be addressed.
Processes 2023, 11(6), 1744; https://doi.org/10.3390/pr11061744
Submission received: 14 April 2023 / Revised: 20 May 2023 / Accepted: 23 May 2023 / Published: 7 June 2023
(This article belongs to the Special Issue Oil and Gas Drilling Rock Mechanics and Engineering)

Abstract

:
Naturally fractured formations usually have strong heterogeneities. Drilling and production operations in such formations can involve unwanted formation failure risks such as wellbore collapse and wellbore fracturing. This study presents a coupled thermal-hydraulic-mechanical numerical model for near-well stress evolutions during drilling in naturally fractured formations. The evolution of pressure, temperature, and geo-mechanical responses on the wellbore wall and in the near-well region is simulated. The effects of wellbore pressure, internal friction angle, and natural fracture length on formation rock risks are discussed. A failure index is used to quantify the formation rock failure risks. The existence of natural fractures magnifies the heterogeneous system response induced by drilling. Increasing the wellbore pressure from a relatively low value can improve the support for the wellbore wall, which reduces the failure risks caused by shearing. In mechanically weak formations, the effect of natural fractures on formation rock failure becomes more significant. When the natural fracture length is large, the near-well region tends to have greater failure risks as the formations become more mechanically weak. This study provides a quantitative understanding of the effects of drilling and formation parameters on failure risks.

1. Introduction

Fractured formations bear a large amount of oil and gas resources and drilling operations are important during the exploitation process [1,2,3,4,5]. Drilling and production in naturally fractured formations can be disturbed by unwanted formation instability issues, since natural fractures are mechanically weaker than the rock matrix [6]. This can lead to significant increases in Non-Production Time and can lead to safety problems [7]. Wellbore stability is closely related to the stress fields on and near wellbores [8] The implementation of accurate and appropriate constitutive equations and failure criteria can help to quantify this problem [9]. To better address wellbore instability issues in naturally fractured formations, it is relevant to understand the distribution and evolution of stress near wellbores.
Compared to wellbore instability issues in formations without natural fractures, it is more difficult to understand wellbore instability problems in naturally fractured formations, as natural fractures have different rock mechanical, fluid flow, and thermal properties. This makes the problem more heterogeneous and anisotropic. In previous studies, experimental, analytical, and numerical methods have been proposed to analyze near-well stress fields and wellbore stability issues in naturally fractured formations. Wang et al. [10,11] indicated that establishing a fracture with pressure lower than the minimum horizontal stress can help to strengthen the wellbore and the mud window can be extended by using this technique. They then numerically analyzed the near-well stress and identified the role of hydraulically conductive fractures in wellbore instability. Helstrup et al. [12] proposed a poro-elastic model for the simulation of transient behaviors of wellbore instability and ballooning in naturally fractured formations. Two fractures are included in the model and they revealed that matrix permeability, mud cake build-up, stress contrast, elastic properties, and fracture dimensions are relevant parameters affecting wellbore instability. Wellbore interpretation techniques are important in the discrimination between drilling-induced fractures and naturally occurring fractures, and the in-situ stress states are key in this discrimination process [13]. Kidambi and Kumar [14] introduced a field study in the Persian Gulf where a mechanical earth model was constructed. In this high-pressure and high-temperature naturally fractured region, logs and core samples were used to establish the correlations between dynamic and static elastic mechanical properties. Breakouts and natural fractures were mainly located and analyzed based on image logs, stress concentrations near the vertical wellbore were quantified and a safe mud weight window was proposed. Fekete et al. [7] foregrounded the importance of proper geo-mechanical modeling in naturally fractured reservoirs in the process of determining minimum mud weight. They also indicated that the time effect is significant when analyzing wellbore instability in naturally fractured reservoirs: collapse failure areas decrease as excavation proceeds and wellbore spalling is only existent for short periods after the beginning of drilling. Near-well stress concentration was identified as a key factor affecting the efficacy of wellbore strengthening jobs [15]. Han et al. [16] presented a package for wellbore stability analyses in naturally fractured rocks. This can deal with elastic problems and time-dependent poro-elastic problems. It employs a dual-porosity and dual-permeability model to consider the effect of natural fractures. Critical mud weights were determined in field applications and the reliability of the method was discussed. In another attempt to calculate the mud weight in a vertical well in a naturally fractured reservoir in southwestern Iran, UBI logs helped to distinguish natural fractures from drilling-induced fractures. The calculation accurately predicted shear failures and breakouts [17]. Meng et al. [18] derived an analytical solution for wellbore instability in naturally fractured reservoirs based on dual-porosity, single-permeability, and finite radial fluid discharge. They stated that the model has advantages in ultralow permeability reservoirs and can provide safer mud weight calculations in dual-porosity and single-permeability scenarios.
Near-well stress states and their evolution patterns are key in predicting and quantifying damage and failure in the formation [19,20]. Since the stress evolution process in near-well regions is multi-physical, coupled modeling is often used in the literature, along with poromechanical theories [21,22,23,24]. Several strategies are commonly used to couple the fluid flow with geomechanics, and full coupling is the most stable method. Comparatively, sequential coupling has lower numerical stability and faster computation speed [25,26]. Cheng et al. [27] proposed a multi-physical model for wellbore stability problems. This model couples the hydraulic, chemical, thermal, and elastic problems on wellbore walls and in near-well formations. Shale hydration and weak planes are also considered. Based on the comprehensive analysis, they optimized mud weights in a shale reservoir for inclined wellbores with different deviation angles. Gao et al. [8] introduced a coupled thermo-hydro-mechanical-chemical wellbore stability model for inclined wellbores in chemically active formations. This semi-analytical model can calculate shear and tensile failures. A modified failure evaluation index was also proposed. Fan et al. [28] then derived a wellbore stability model considering the effects of weak bedding layers in the Ordos Basin. In their analysis, wellbore stability is sensitive to bedding strength, cohesion, and formation pressure.
The literature review indicates that, although there are many experimental and mathematical models describing the mechanical responses in the formation during drilling operations, a comprehensively transient model for the coupled thermal-hydraulic-mechanical problem in naturally fractured formations was not existent. This knowledge gap can be filled by carrying out a transient modeling study considering both the coupled multi-physical behaviors and the existence of natural fractures.
Based on the literature review, it is noted that a numerical analysis of near-well stress evolution in naturally fractured formations based on the multi-physical coupling of the thermal, hydraulic, and mechanical fields can provide a quantitative reference for the understanding of wellbore instability in naturally fractured formations. In this study, a coupled thermal-hydraulic-mechanical (THM) model considering natural fractures is introduced for the analysis of the system response on wellbore walls and in near-well regions during drilling. Effects of the existence and dimension of natural fractures on near-well system response are discussed. Near-well damage and failure risks are also quantified. This study provides a reference for wellbore stability analyses in naturally fractured reservoirs from the viewpoint of coupled THM modeling. The structure of the article is as follows: first, the transient model for the coupled THM behaviors during drilling in naturally fractured formations is introduced; second, a base-case simulation model is presented and the results are discussed; third, the effects of wellbore pressure, internal friction angle and natural fracture length are quantified; finally, conclusions are reached.

2. Methodology

2.1. Governing Equations

A coupled THM model is introduced for the numerical analysis in the study. Three physical fields of the porous media flow, the heat transport, and the rock deformation are considered. The governing equation for the porous media flow problems is seen in Equation (1):
( ϕ ρ f ) t + · ϕ ρ f u f s = ρ f q f
where ϕ is porosity; ρ f is the density of a phase; t is time; u f s is the velocity of a phase between the rock and the fluid flow; and q f is the inlet/outlet flow [29,30].
The velocity term is often expressed by Darcy’s law as:
u f s = k μ p
where k is permeability; μ is viscosity; and p is pressure. Since this study considers the near-well system response in a 2D domain for a vertical well, the effect of gravity is not considered.
For slightly compressible fluids in the porous media
c = 1 ρ f d ρ f d p
where c is compressibility.
In Equation (4), the governing equation of the heat transport problem in the solid rock is expressed as:
ρ r c r T t · λ T = q h
where T is temperature; ρ r is the density of rock; c r is the rock specific heat; λ is thermal conductivity; and q h is the heat inlet/outlet.
The governing equation of rock deformation is seen in Equation (5):
· σ = 0
where σ is the stress tensor.
Equations (1)–(5) describe the physical problem in each field under uncoupled conditions. Since the near-well system response is multi-physical, it is important to couple multiple fields. In this study, heat transport through the solid rock and by the porous media flow is considered. Therefore, the heat transport process can be expressed as:
ρ r c r T t · λ T + ρ f c f u f s T = q h
where c f is the specific heat of the fluid flow. Thus, conduction and convection can both be expressed.
In addition, the fluid flow is also coupled with rock deformation:
( ϕ ρ f ) t + · ϕ ρ f u s + u f s = ρ f q f
where u s is used to express the deformation of rock and is the solid phase velocity or solid strain rate related to fluid flow-induced deformation [23,31]. u s is much smaller than u f s as it denotes the contribution of rock deformation. It is not neglected, since the coupled flow and geo-mechanical mechanism is relevant to this study. The rock deformation field is also coupled with the temperature field by incorporating thermal expansion. The failure evaluation is based on the Mohr-Coulomb criterion, where cohesion c M C and internal frictional angle φ are used.
The equations above address the coupled THM behaviors on wellbore walls and near-well continuum. In naturally fractured formations, the existence of natural fractures should also be considered. In this study, local grid refinement techniques are used for the representation of natural fractures in the model. Hydraulic, thermal, and mechanical properties of natural fractures are assigned to the refined grids. Mixed finite element methods are used for the spatial discretization in the numerical solution. Validation between the coupled flow and mechanical fields has also been achieved [24,32]. The validation between the pressure field, the temperature field, and the deformation field has been achieved in [33].
In the numerical solution, mixed methods are used for the finite element, and spatial discretization is also based on these methods. The solid problem is discretized by quadratic serendipity element shape functions; the porous media flow problem is discretized by quadratic element shape functions; the heat transport problem is discretized by linear element shape functions. A backward Euler method is used in the time stepping. By using this method, good convergence rates can be achieved. A multifrontal massively parallel sparse direct solver is used to arrive at numerical solutions [34].

2.2. Limitations and Assumptions

Some assumptions are used in the methodology and certain limitations and uncertainties are introduced in the numerical study. The assumptions used in the governing equations are: natural fractures are represented by a continuum with different rock physical and mechanical properties, and local grid refinements are used to represent the natural fractures; linear elasticity is considered in the rock deformation problem.
The use of these assumptions introduces some limitations . Continuum modeling in formations with natural fractures does not directly solve for the discontinuity shearing and opening. Instead, a failure index is used. Linear elasticity is considered, which means that the model can provide relatively accurate results in elastic formations and is not suitable for formations with strong inelasticity or plasticity. These limitations should be noted when analyzing the results from this model.

3. Results and Discussion
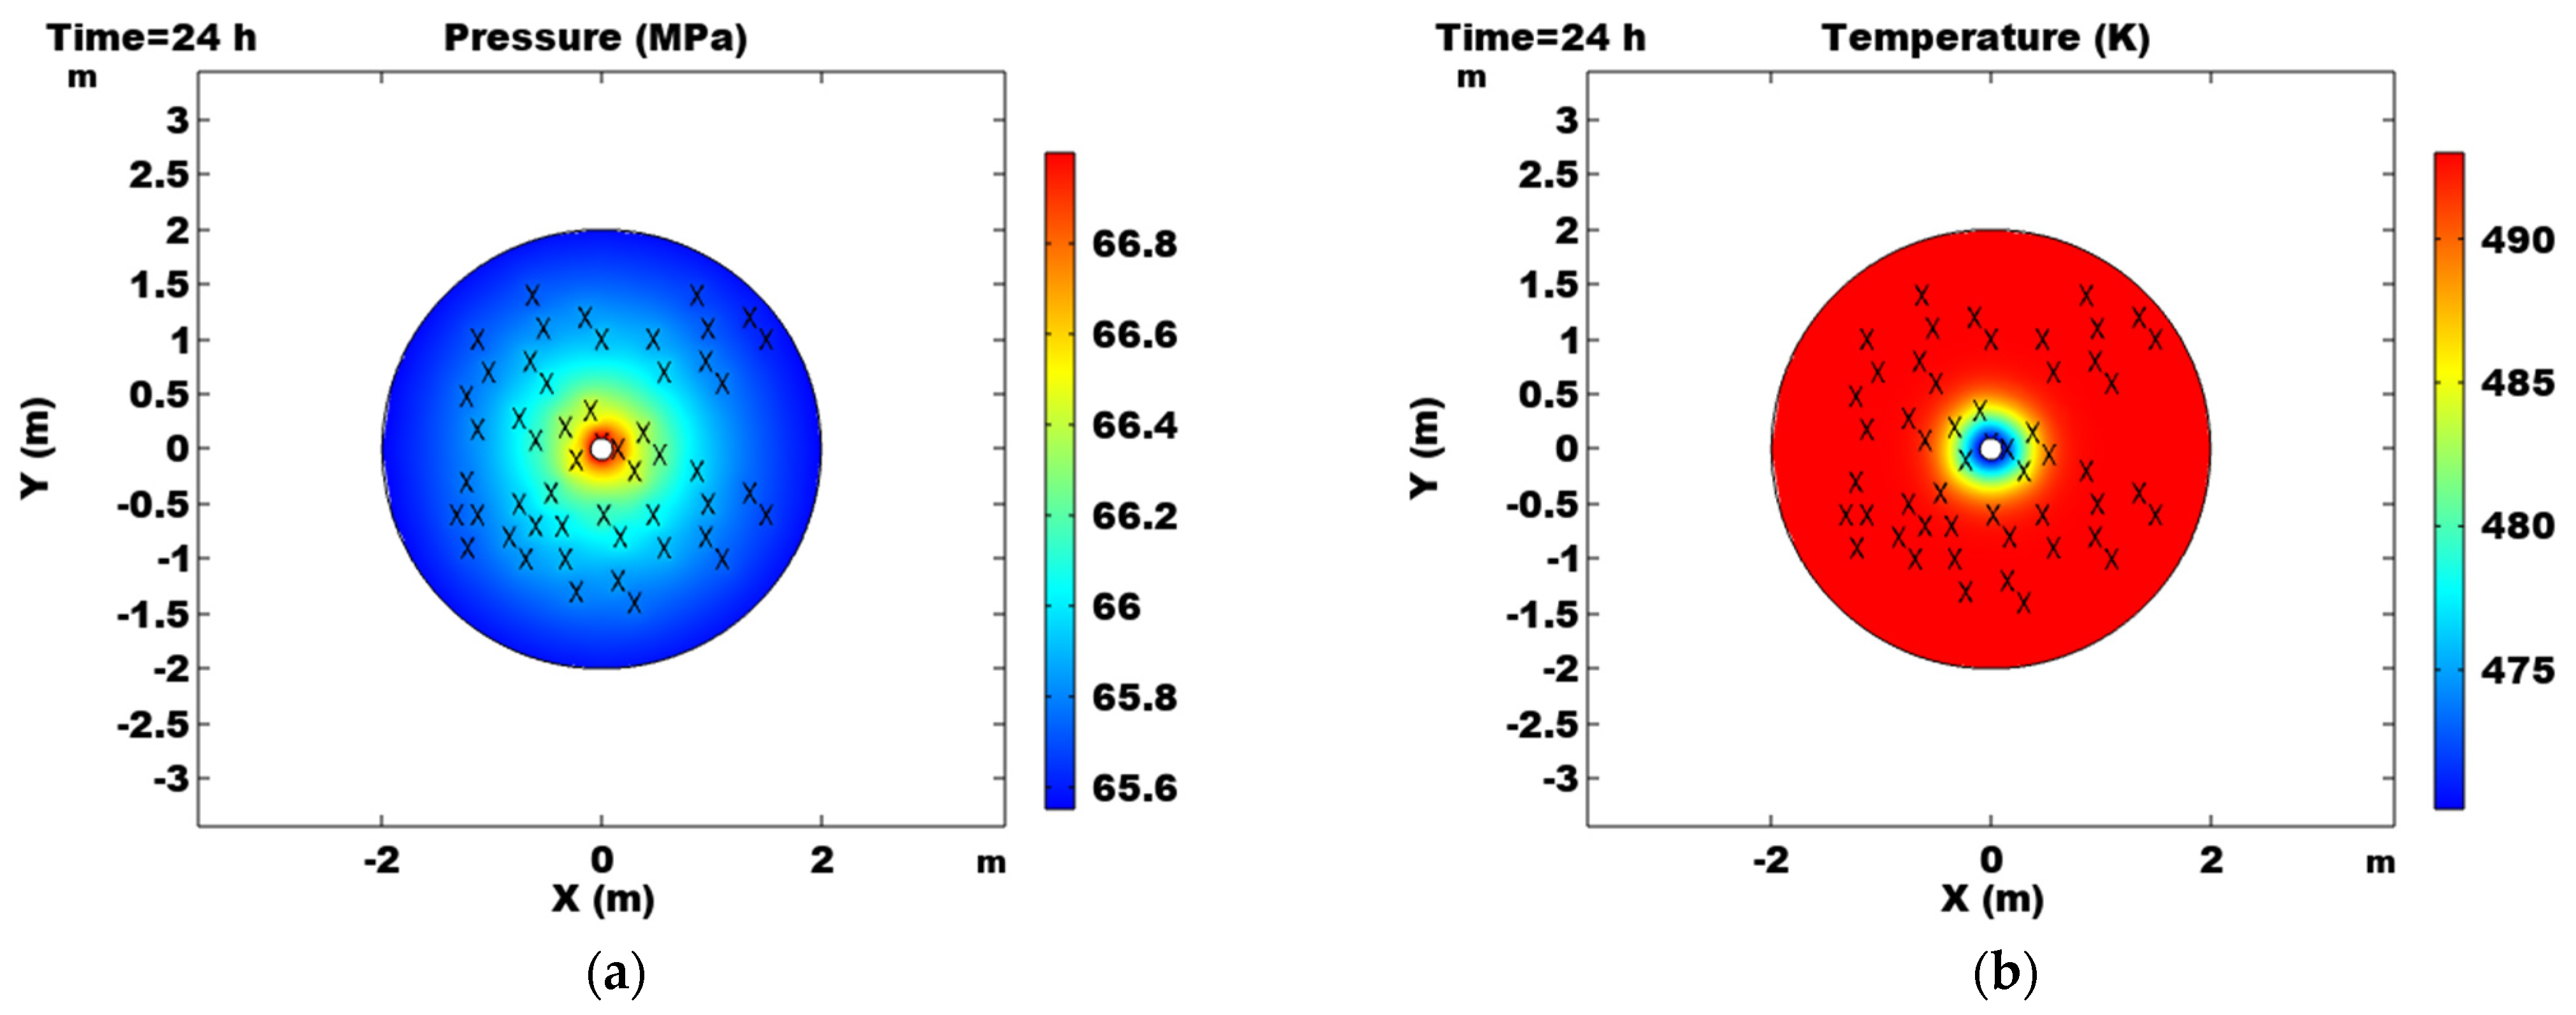
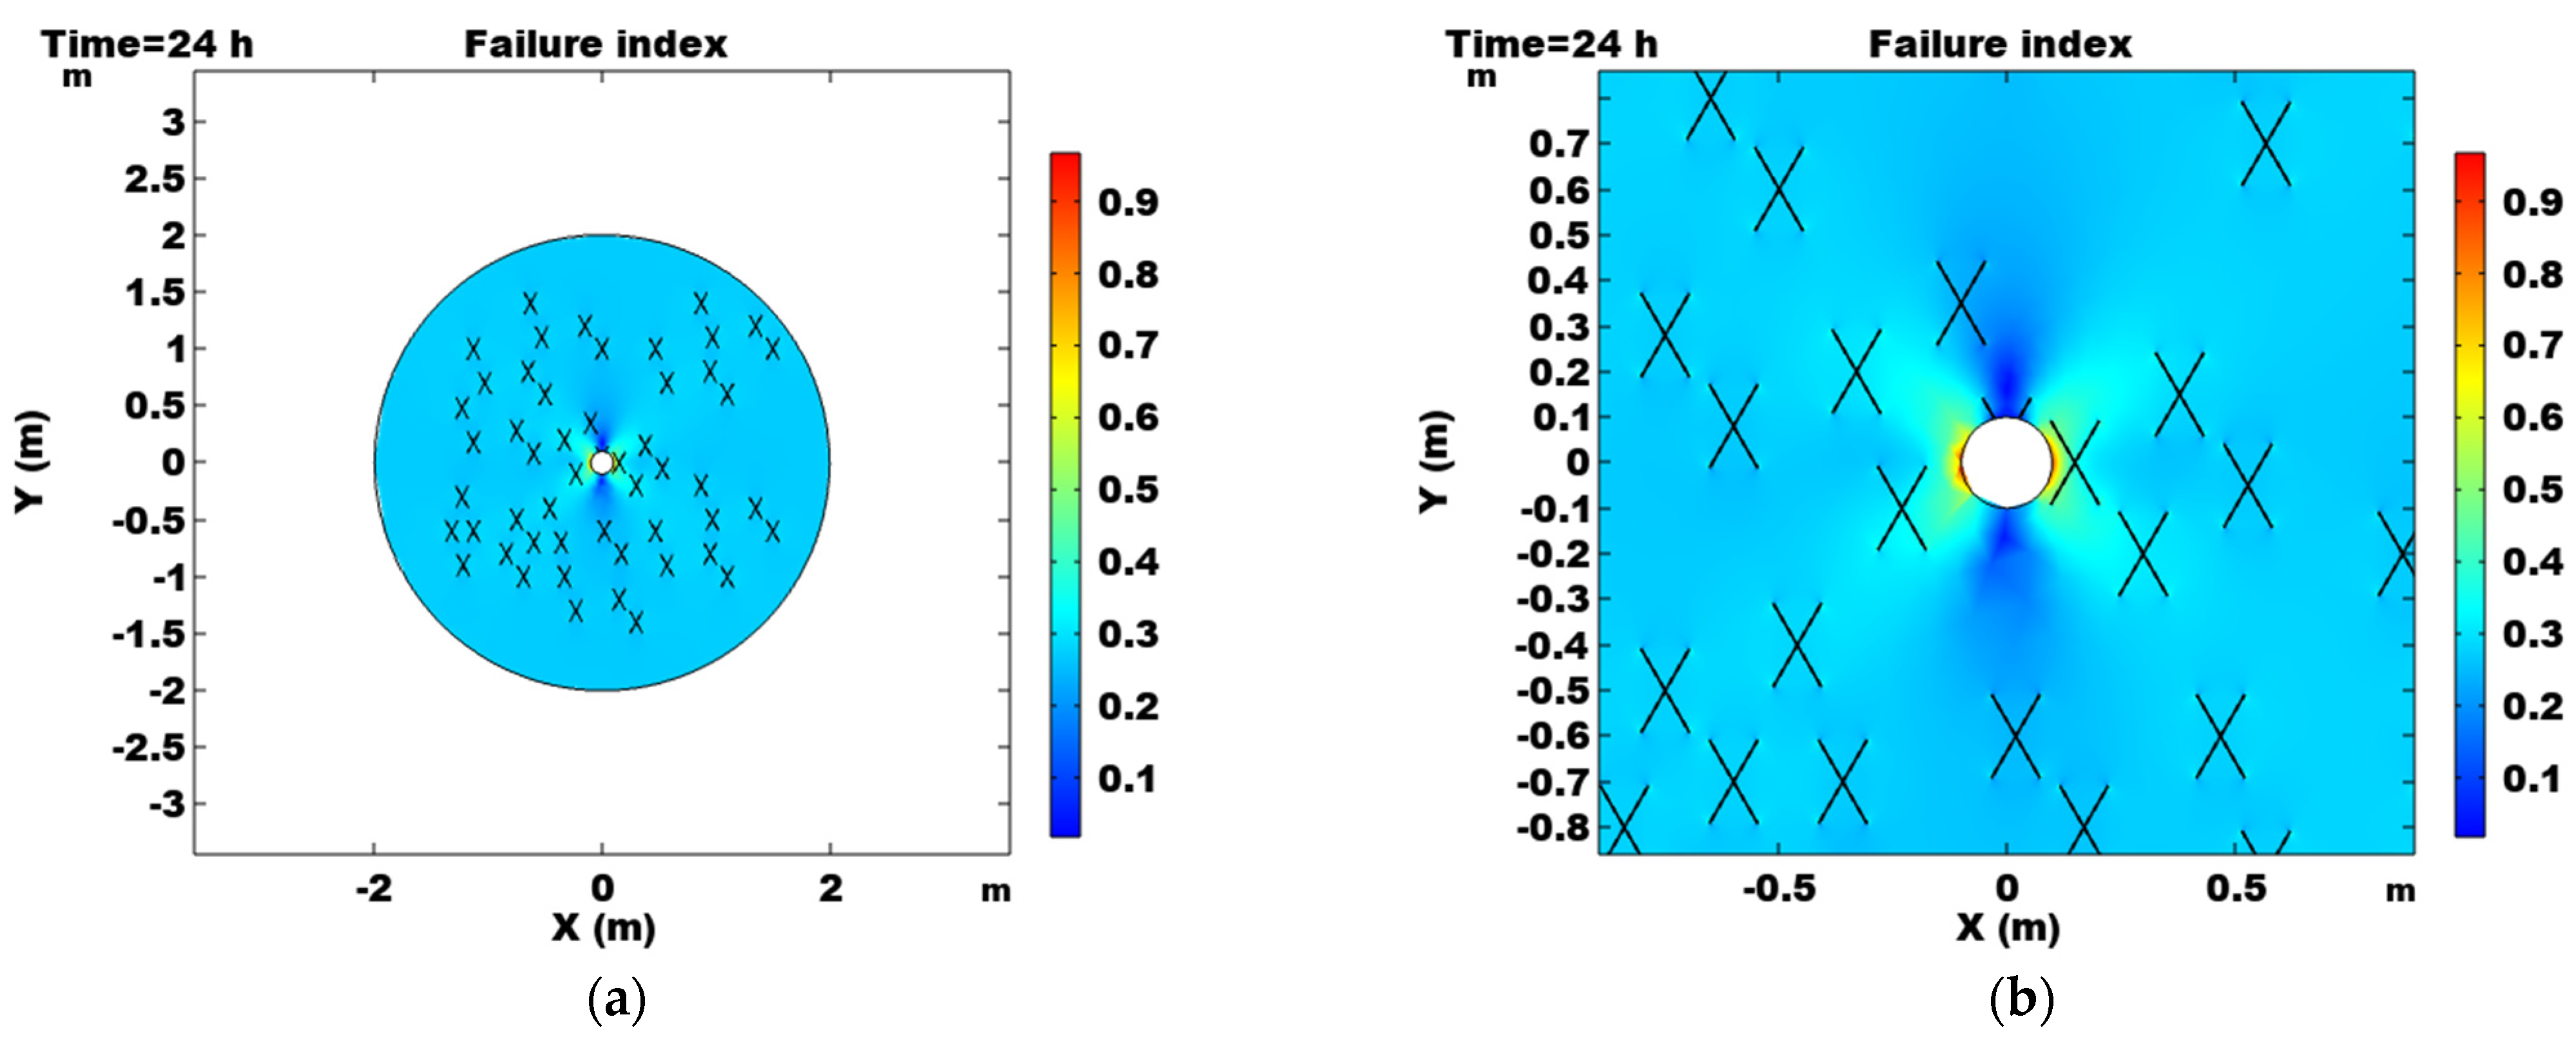
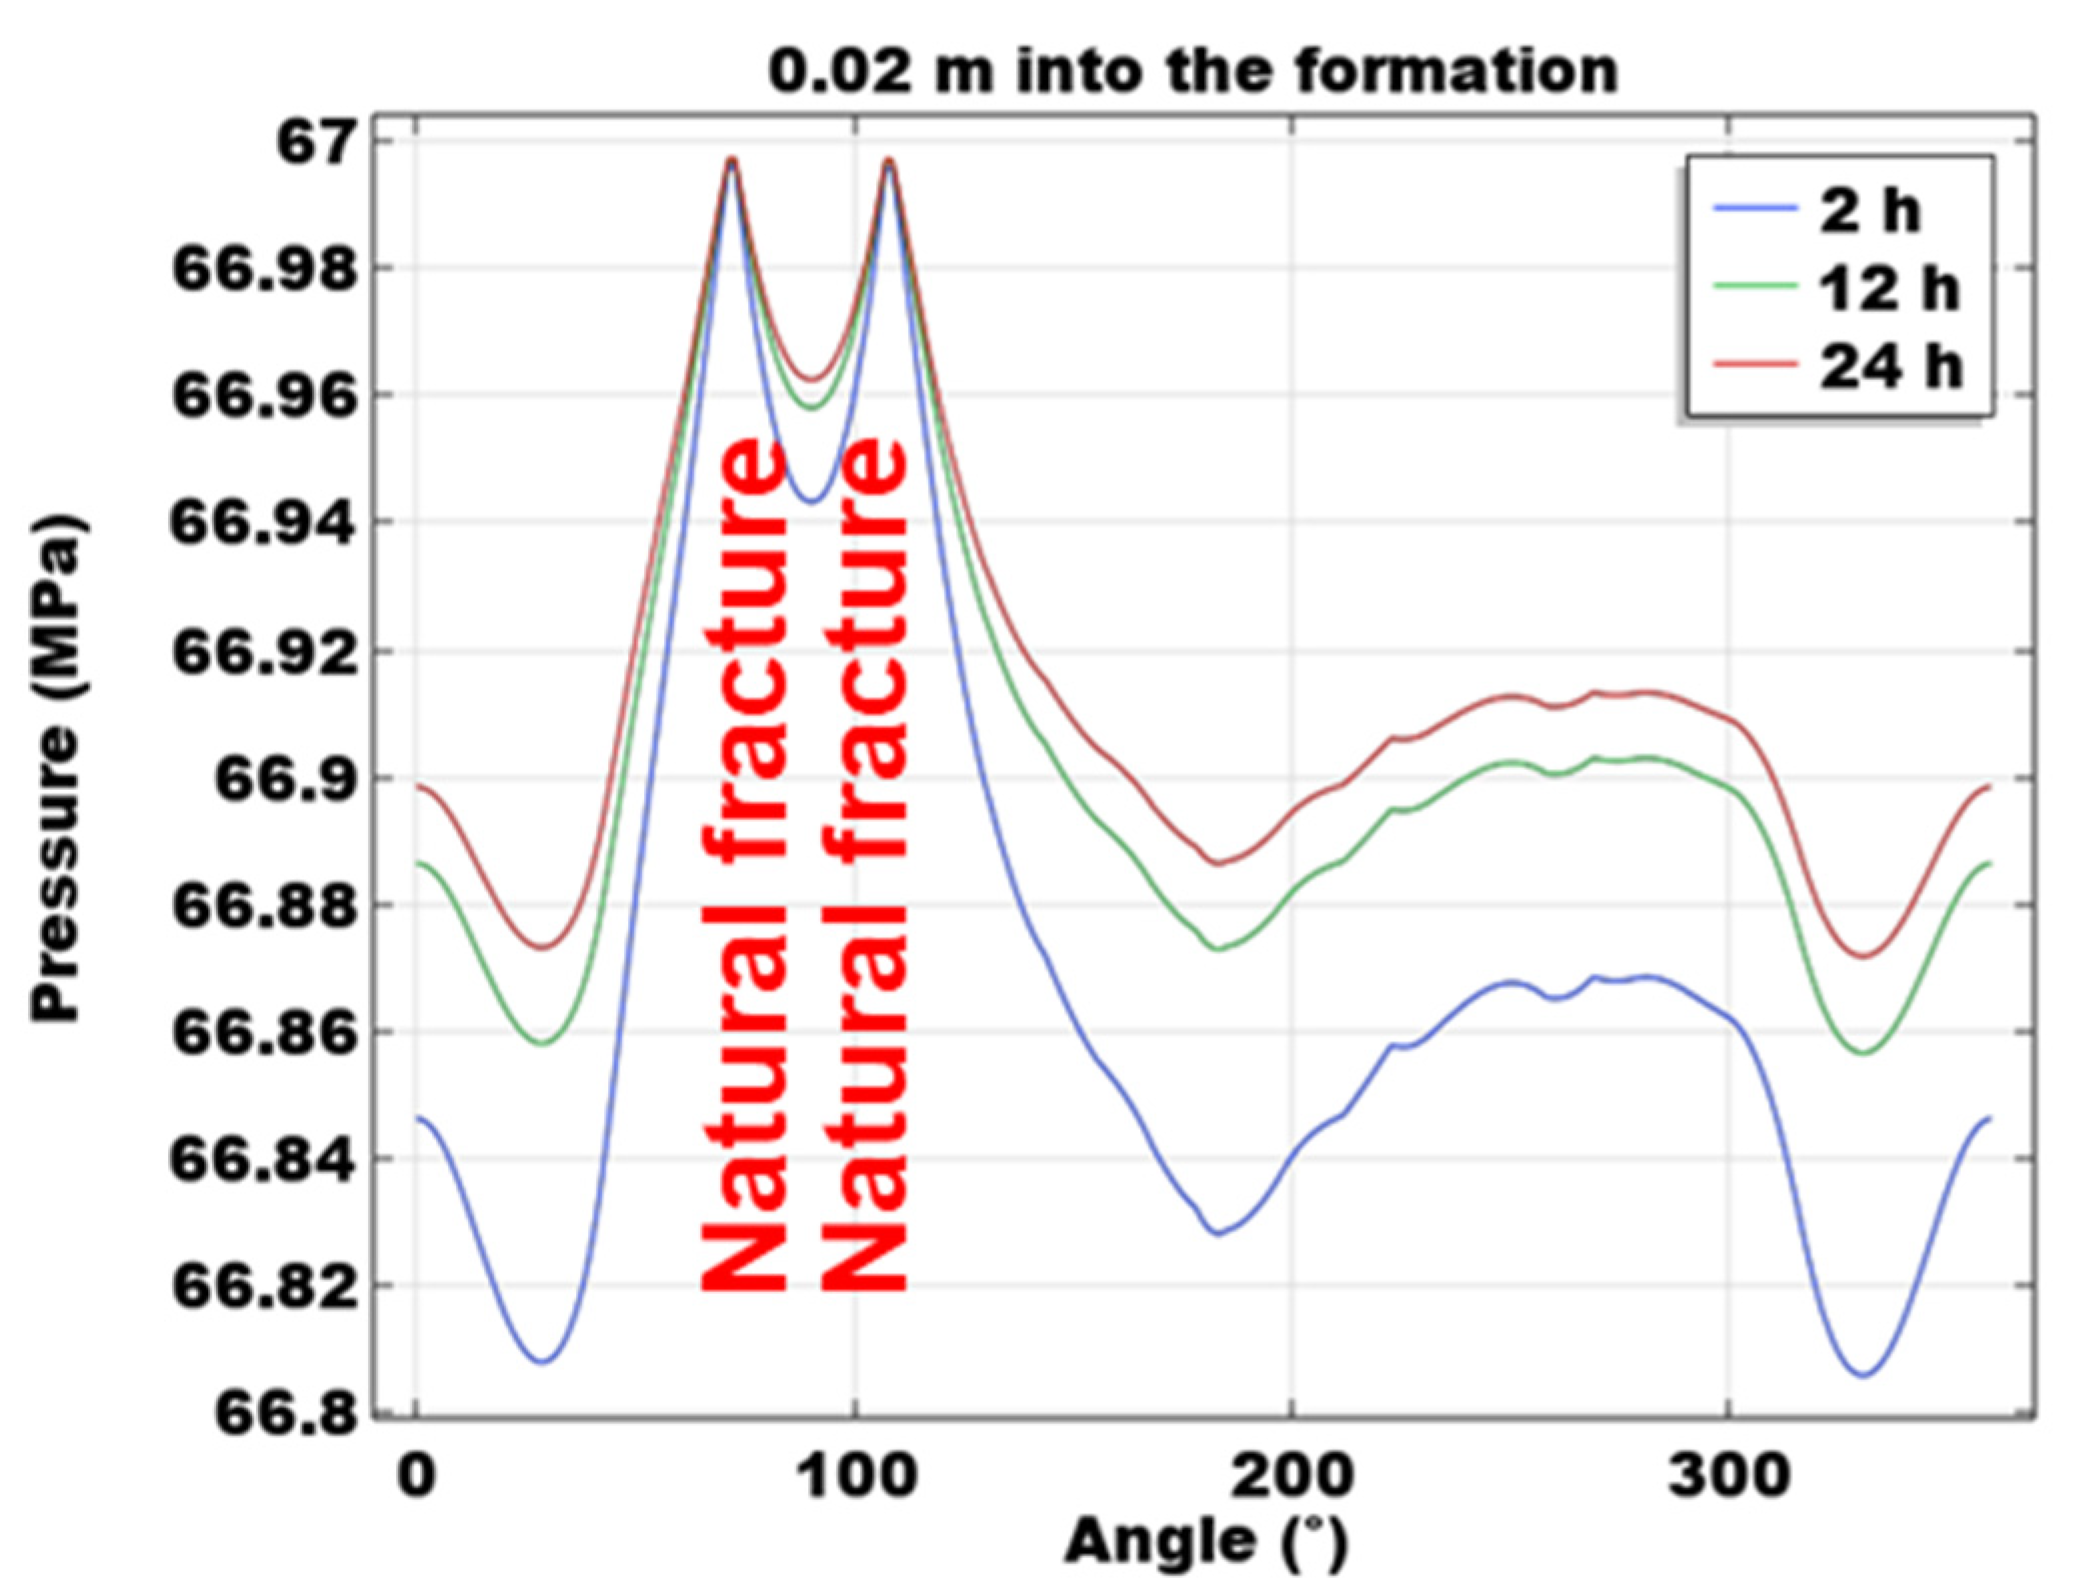
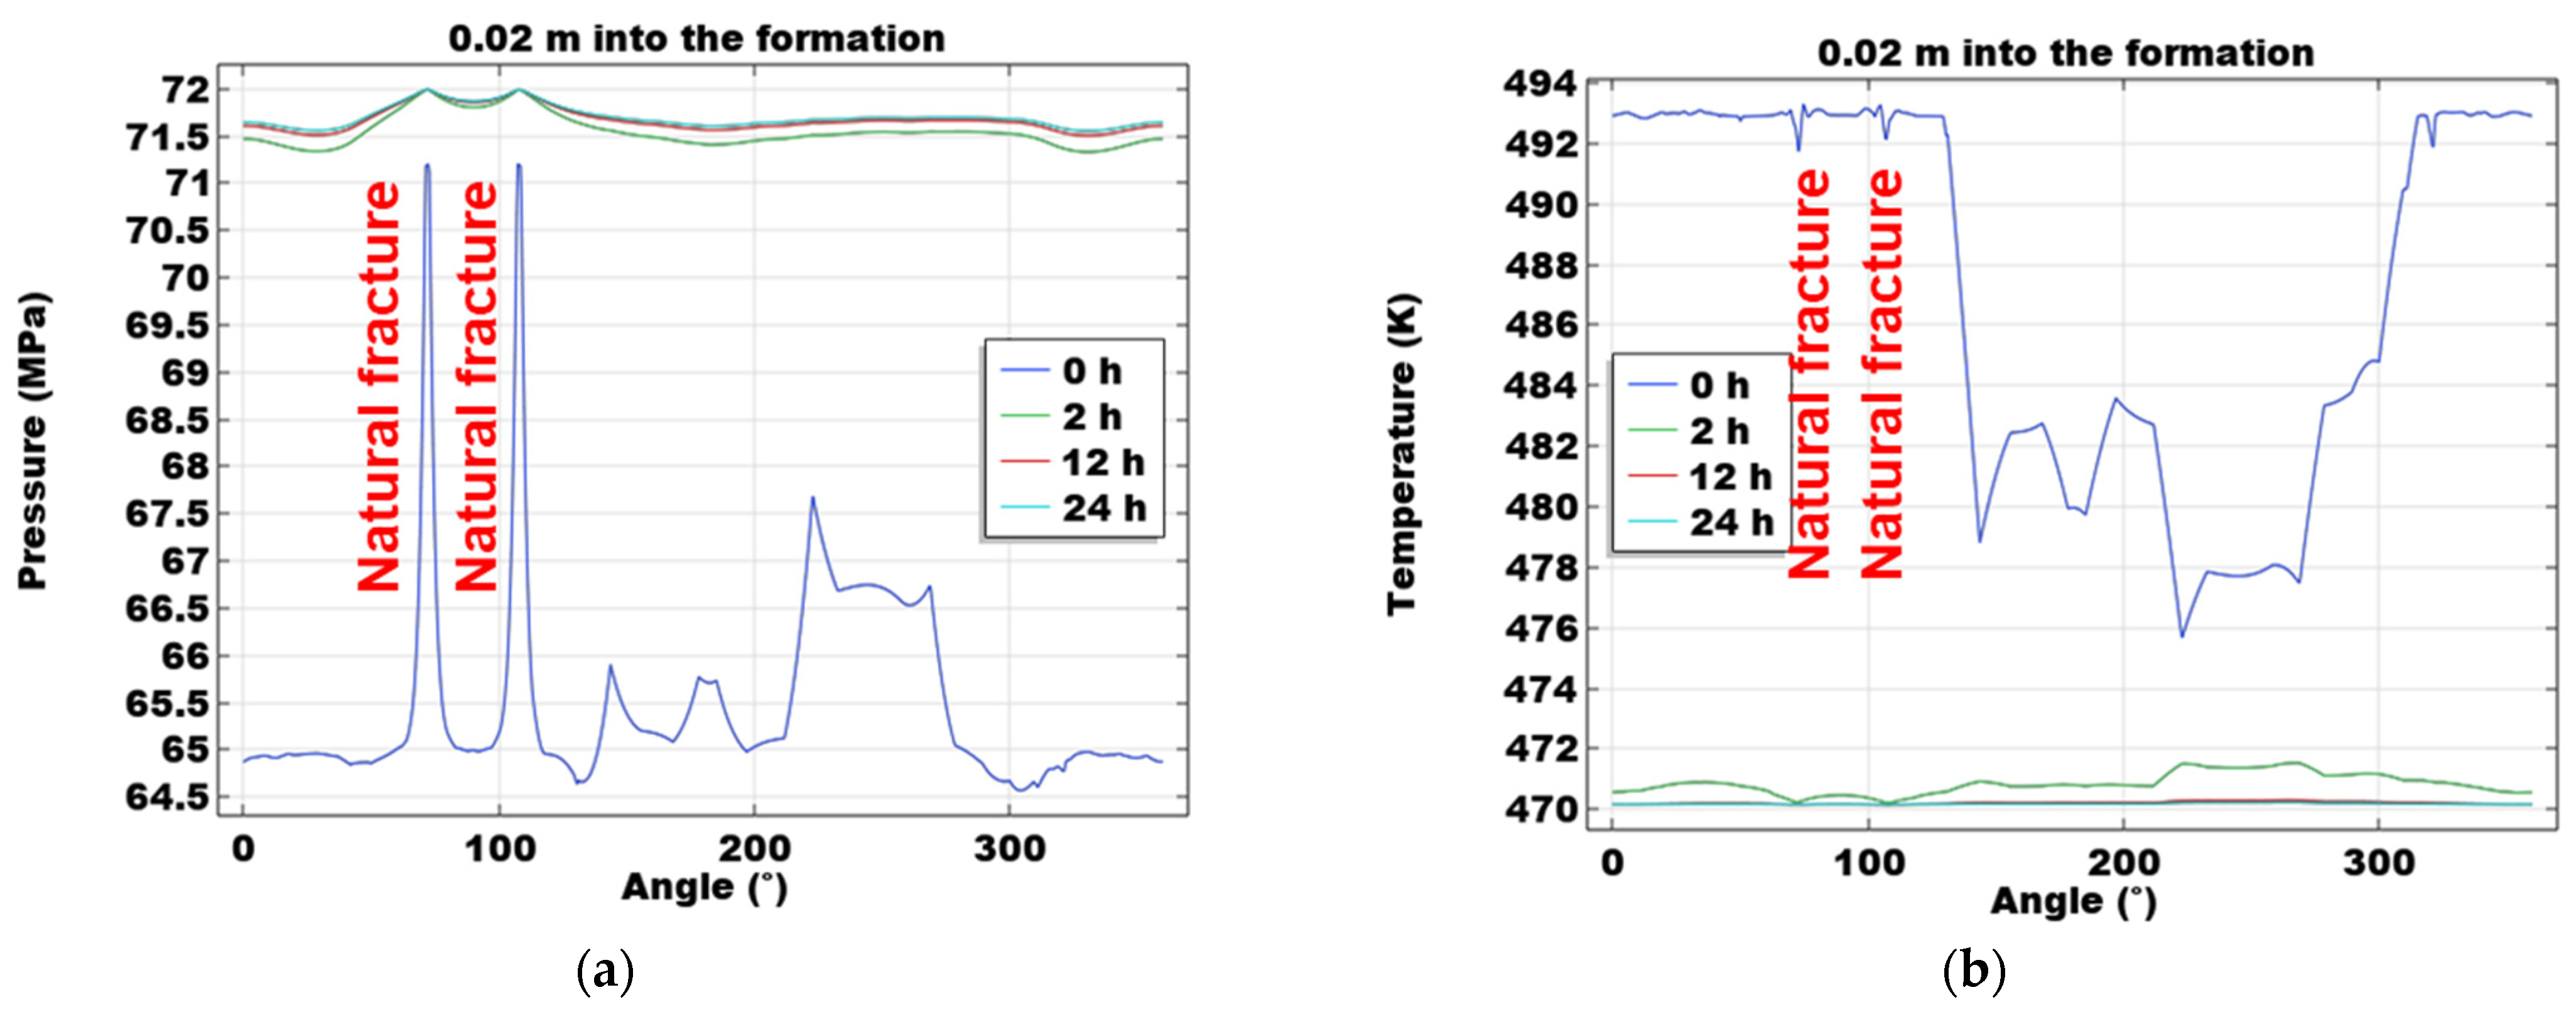
In the numerical analysis, several cases are investigated. First, the base case with a vertical wellbore drilled in a naturally fractured formation is discussed. The near-well evolution of pressure, stress, and failure or risk of failure is quantified. Then, several parametric studies are conducted to understand the effects of natural fracture properties on near-well evolution patterns. The natural fracture data are based on published datasets [35,36].

3.1. Base Case

In the base case, the formation is embedded with conjugate natural fractures. The fracture length is 0.21 m and the width is 0.003 m. Modeling parameters are shown in Table 1.
Figure 1 shows the setup of the simulation problem. A large square domain of 50 m by 50 m is considered. The boundary conditions of the THM problems are stress boundary, no-flow boundary, and thermal insulation boundary. The results and natural fractures in a near-well zone of R = 2 m are considered and the far-field is not considered in the discussion of results. This setup can minimize the boundary effect on the coupled THM behaviors in the near-well region.
In the base case, a pressure value of 67 MPa on the wellbore wall is first investigated. A strike slip stress regime is considered. Figure 2 shows the near-well distribution of pressure, temperature, and stress after 24 h of the exertion of the pressure load on the wellbore wall. The pressure increase on the wellbore is about 2 MPa due to the pressure difference between the pressure boundary and the initial pressure. The existence of natural fractures makes the pressure contour non-uniform. Natural fractures are more conductive and pressure drawdown is intensified in and near natural fractures. In the temperature results, the temperature difference between the wellbore and the formation leads to radial distributions of temperature contours. Compared to the pressure result, the effect of natural fractures is not as significant and the temperature field is more uniform. This is because the temperature field is affected by both conduction through the formation and convection through the fluid. Then, the distribution of S x and S y is plotted. Stress concentrations are observed on and near the wellbore, while stress away from the wellbore is relatively uniform. Note that the initial minimum horizontal principal stress is in the x direction and the initial maximum horizontal principal stress is in the y direction.
In order to understand the failure risk on and near the wellbore, the Mohr-Coulomb criterion is used and a failure index is used:
f i = ( σ 1 σ 2 ) / 2 c M C + t a n φ σ 1 + σ 2 2 / 1 + tan 2 φ
In this study, the failure risk is directly governed by the value of the failure index above. Specifically, when the failure index is below 1, the Mohr-Coulomb failure is not reached. Indices equal to or greater than 1 indicate that failure is reached. This signifies closeness to failure [37]. Therefore, a lower index value indicates a lower failure risk, while a higher index value means that the failure risk is higher. Figure 3 shows the distribution of the failure index in the near-well region. In general, there is no failure under the investigated condition. Based on the result, the most heterogeneous system response is on the wellbore wall and near the wellbore. The greatest failure index is in the x direction on the wellbore wall, which corresponds to the orientation of the initial minimum horizontal principal stress. In contrast, the failure index on the wall and near the wellbore in regions in the y direction is the lowest. This result is in accordance with the wellbore collapse patterns in the strike slip stress regime.
In Figure 4, curves are plotted to describe the circular distribution of the failure index on the wellbore wall and 0.02 m in the formation. They cover the circular distribution from 0° to 360° starting from the positive side in the x direction. On the wellbore wall, failure index values at orientations 0° and 180° are the highest, which corresponds to the wellbore collapse mechanism in the stress regime. Failure index values also increase locally at naturally fractured locations. This indicates that the existence of natural fractures can increase the failure risk on the wellbore wall. This effect is very localized and it does not affect locations without natural fractures. When it moves 0.02 m into the formation, the effect of natural fractures on the sudden increase in the failure index is still observed. In general, the failure index values are lower than those on the wellbore wall, indicating that the failure risk decreases as it moves into the formation.
Figure 5 shows the pressure distribution along the circle 0.02 m into the formation from the wellbore wall. It also presents the temporal change in pressure in the naturally fractured near-well region. Since the wellbore pressure is 2 MPa greater than the formation pressure, near-well pressure values are elevated by the pressure boundary condition. Naturally fractured regions are more conductive, and the pressure in these regions is distinguishably higher than in un-fractured formation regions. These results indicate that the existence of natural fractures near the wellbore leads to heterogeneous distribution patterns of pressure. Compared to the homogeneous near-well pressure distribution in uniform formations, naturally fractured near-well regions are characterized by heterogeneities in the pressure field.
In Figure 6, the distribution of temperature along the circle 0.02 m into the formation from the wellbore wall is presented. Since the wellbore temperature is lower than the formation pressure, drops in temperature are observed in the near-well region. Compared to the original temperature of 493 K, the near-well region is effectively cooled after 2 h, and the temperature keeps dropping in 12 and 24 h. After 2 h, it is noted that the naturally fractured locations experience the most significant temperature drop. It is because natural fractures have the most drastic fluid diffusivity and the convective heat transport in natural fractures is enhanced. This results in rapid and heterogeneous heat transport in these regions. As time increases, the oscillation in the temperature results is gradually reduced. After 12 h and 24 h, the amplitudes of the oscillatory temperature distribution curves decrease, indicating that the effect of natural fractures on temperature distribution becomes weaker as the drilling time increases.

3.2. Effect of Pressure on the Wellbore Wall

In the base case, a wellbore pressure value of 67 MPa is discussed. This is slightly greater than the formation pressure of 65 MPa. In this study, several different wellbore pressure values (72 MPa and 77 MPa) are also investigated. In these new cases, the wellbore fluid pressure values are increased.
Figure 7 shows the pressure and temperature distribution along the circle 0.02 m into the formation from the wellbore wall when the wellbore pressure is 72 MPa. Results at several time steps (0 h, 2 h, 12 h, and 24 h) are plotted. In the pressure results, the effect of the existence of natural fractures is significant at the time of 0 h. In the beginning, the exertion of the boundary pressure on the wellbore wall leads to an instantaneous pressure increase in the natural fractures. The pressure increase rapidly propagates into the formation through highly conductive fractures. Although the pressure in naturally fractured regions is largely increased at the beginning, it does not reach the wellbore boundary pressure of 72 MPa. After 2 h, the pressure in the near-well region is effectively increased, while the naturally fractured areas have the highest pressure, equal to the wellbore pressure. The most significant pressure increase is between 0 and 2 h. After 2 h, pressure values around the wellbore in the near-well region are generally elevated to nearly 72 MPa, which is the wellbore boundary pressure. After 12 h and 24 h, further change in pressure is not as significant as in the first 2 h. Pressure distribution curves at the beginning time steps are much more heterogeneous than those at later time steps. This means that the heterogeneous evolution of pressure in naturally fractured near-well regions becomes weaker as the drilling time increases. In the temperature results, a heterogeneous temperature drop is also observed. In the beginning, temperature distributions are not uniform, and naturally fractured locations are locally cooled. After 2 h, the effect of natural fractures on the drop in temperature becomes more significant, and naturally fractured locations have the lowest temperature. Compared to the base case, the pressure curves are largely affected. This is intuitive because of the elevated wellbore pressure boundary. The temperature curves at the same time step are also lower. This is because the porous media flow and the heat transport process are closely coupled in this model. When the boundary pressure on the wellbore wall becomes higher, the porous media flow becomes more rapid and the heat transport through the fluid flow becomes more drastic. Since the wellbore wall temperature is lower than the formation temperature, the cooling process becomes more significant in this case.
In Figure 8, the failure index distribution on the wellbore wall and in the naturally fractured near-well region is plotted. Similar to the observation in Figure 4, the existence of natural fractures leads to the heterogeneous distribution of the failure index. However, a difference is that, when the wellbore pressure is increased to 72 MPa, the maximum failure index drops, from greater than 1 to 0.85 on the wellbore wall and from 0.7 to 0.55 in the near-well region 0.02 m into the formation. This is because the increased wellbore pressure provides more support to the near-well formation and the wellbore collapse risk is alleviated in this case. This pattern is also observed in the naturally fractured locations, indicating that increasing the wellbore pressure to 72 MPa reduces the collapse risk on the wellbore and in the near-well region for both naturally fractured and un-fractured formations. This is attributed to the increased support from the wellbore pressure boundary.
Then, the case with a boundary pressure value of 77 MPa is investigated and the distribution curves are shown in Figure 9. The general spatial and temporal evolution trends are similar to those in Figure 7. The existence of natural fractures expedites the physical changes induced by the boundary pressure in the near-well region. After 2 h, natural fractures effectively increase the formation pressure and decrease the formation temperature at naturally fractured locations. Compared to the case with a 72 MPa wellbore pressure boundary, the near-well pressure values are higher and the near-well temperature drop becomes more significant. These can be explained by the change in the pressure boundary condition.
In the case with a wellbore pressure boundary of 77 MPa, the general failure index values become lower, especially at orientations of 0° and 180° (Figure 10). This is because the elevated wellbore pressure decreases the failure risk. However, it is noted that, at orientations of 90° and 270°, the failure risk values become greater than those in the case with a wellbore pressure value of 72 MPa. This phenomenon is related to possible wellbore collapse and wellbore fracture patterns in a vertical wellbore in a strike slip stress regime. As the wellbore pressure increases from a value slightly above the formation pressure to a value around the minimum principal stress, the shear failure risks at orientations of 0° and 180° (the orientation of the initial minimum horizontal principal stress) become lower and the tensile failure risks at orientations of 90° and 270° (the orientation of the initial maximum horizontal principal stress) increase. These phenomena indicate that, although the existence of natural fractures leads to heterogeneous evolution of failure risks around the wellbore, the general pattern follows that of classic analytical wellbore instability behavior.

3.3. Effect of Internal Friction Angle

In the previous section, the effect of wellbore pressure on the near-well system response is quantified. This is closely related to the drilling process. In this section, the effect of the rock mechanical parameter of internal friction angle is studied. In the base case, an internal friction angle of 20° is used. In this analysis, two internal friction angles of 10° and 30° are discussed.
Figure 11 compares the distribution of the failure index values on the wellbore wall for cases with internal friction angles of 10° and 30°. Results indicate that the failure index values are highly sensitive to internal friction angle. Decreasing the internal friction angle from 20° (the base case) to 10° significantly increases failure risks and the wellbore area experiencing failure is largely increased. This indicates that wellbore collapse magnitude and risk are both increased in a case with a relatively low internal friction angle. When the internal friction angle is increased to 30°, the failure risk is lowered. The result indicates that, in formations with relatively high internal friction angles, wellbore collapse risks are low and the potential wellbore collapse area is also limited.
In Figure 12, the distribution of the failure index values in the near-well region for cases with internal friction angles of 10° and 30° is plotted. It is noted that, in naturally fractured locations, the failure risk indices are elevated compared to the results on the wellbore wall. This is observed for both internal friction angle cases. This is related to the heterogeneous near-well rock mechanical property distributions and the different elastic properties in natural fractures and in the formation matrix. In un-fractured locations, the general failure indices are lower than those on the wellbore. This means that, as it moves into the formation, failure risks in the locations without natural fractures get lower. These results show that the relationship between internal friction angle and failure risk distribution is not homogeneous. Locations with and without natural fractures can exhibit different patterns.

3.4. Effect of Natural Fracture Length

In the previous studies, the natural fracture length of 0.21 m has been analyzed. In this section, the effect of this parameter is quantified. Two cases with natural fracture lengths of 0.11 m and 0.41 m are studied. In this analysis, the length of natural fractures is changed while the location and orientation are not changed during the simulation.
Figure 13 shows the near-well distribution of failure indices after 24 h of drilling for the cases with natural fracture lengths of 0.41 m and 0.11 m. This presents the failure risks around the wellbore. In the case with longer natural fractures, it can be observed that the maximum failure index is higher and the potential wellbore collapse near-well area becomes greater. In contrast, the case with shorter natural fractures has low wellbore collapse risks and the area with failure index values above 1 is very limited. Based on this comparison, it can be observed that the failure risks and wellbore collapse risks in heavily naturally fractured formations are greater than those in less naturally fractured formations. This is because the increase in natural fracture length can lead to a more drastic system response and the existence of longer natural fractures results in weaker rock mechanical properties in near-well formations.

3.5. Discussion

Based on the datasets involved in the study, the comparison between the field observations and the modeling results is made. The in-situ stress states, the wellbore fluid pressure, and the general geometries of natural fractures are based on the field data in Junggar Basin. Compared to the drilling and caliper logging data in the field, slight wellbore wall collapses were observed and the orientations are generally in accordance with the numerical modeling results. Temperature results are also validated with the temperature logging data. However, it is noted that the temperature results are only validated against the wellbore logging data, while the formation temperature cannot be directly compared or validated.
Based on the observations in this study, wellbore stability, and near-well formation stability are sensitive to the rock mechanical properties and natural fracture distributions. However, these parameters are usually directly measured when the wellbores are established. Thus, wellbore walls may already endure instability issues. Therefore, it is important to obtain the quantification of rock mechanical and natural fracture data before drilling. Coring from the same formation and seismic interpretation can be helpful in this process. In the optimization of drilling parameters, the modeling results can help to determine the wellbore pressure that provides sufficient support for the wellbore wall; they can also help to analyze situation in which the presence of natural fractures lowers the wellbore collapse pressure. The consideration of natural fractures in this study can help to determine the well design parameters, especially in the naturally fractured depth intervals. Note that the study is focused on strike slip stress regimes.

4. Conclusions

In this study, a coupled THM model is established considering the effect of natural fractures in near-well formations during the drilling in hydrocarbon-bearing formations. Natural fractures are prescribed in the mode using local grid refinement techniques. Some conclusions are drawn as follows:
(1)
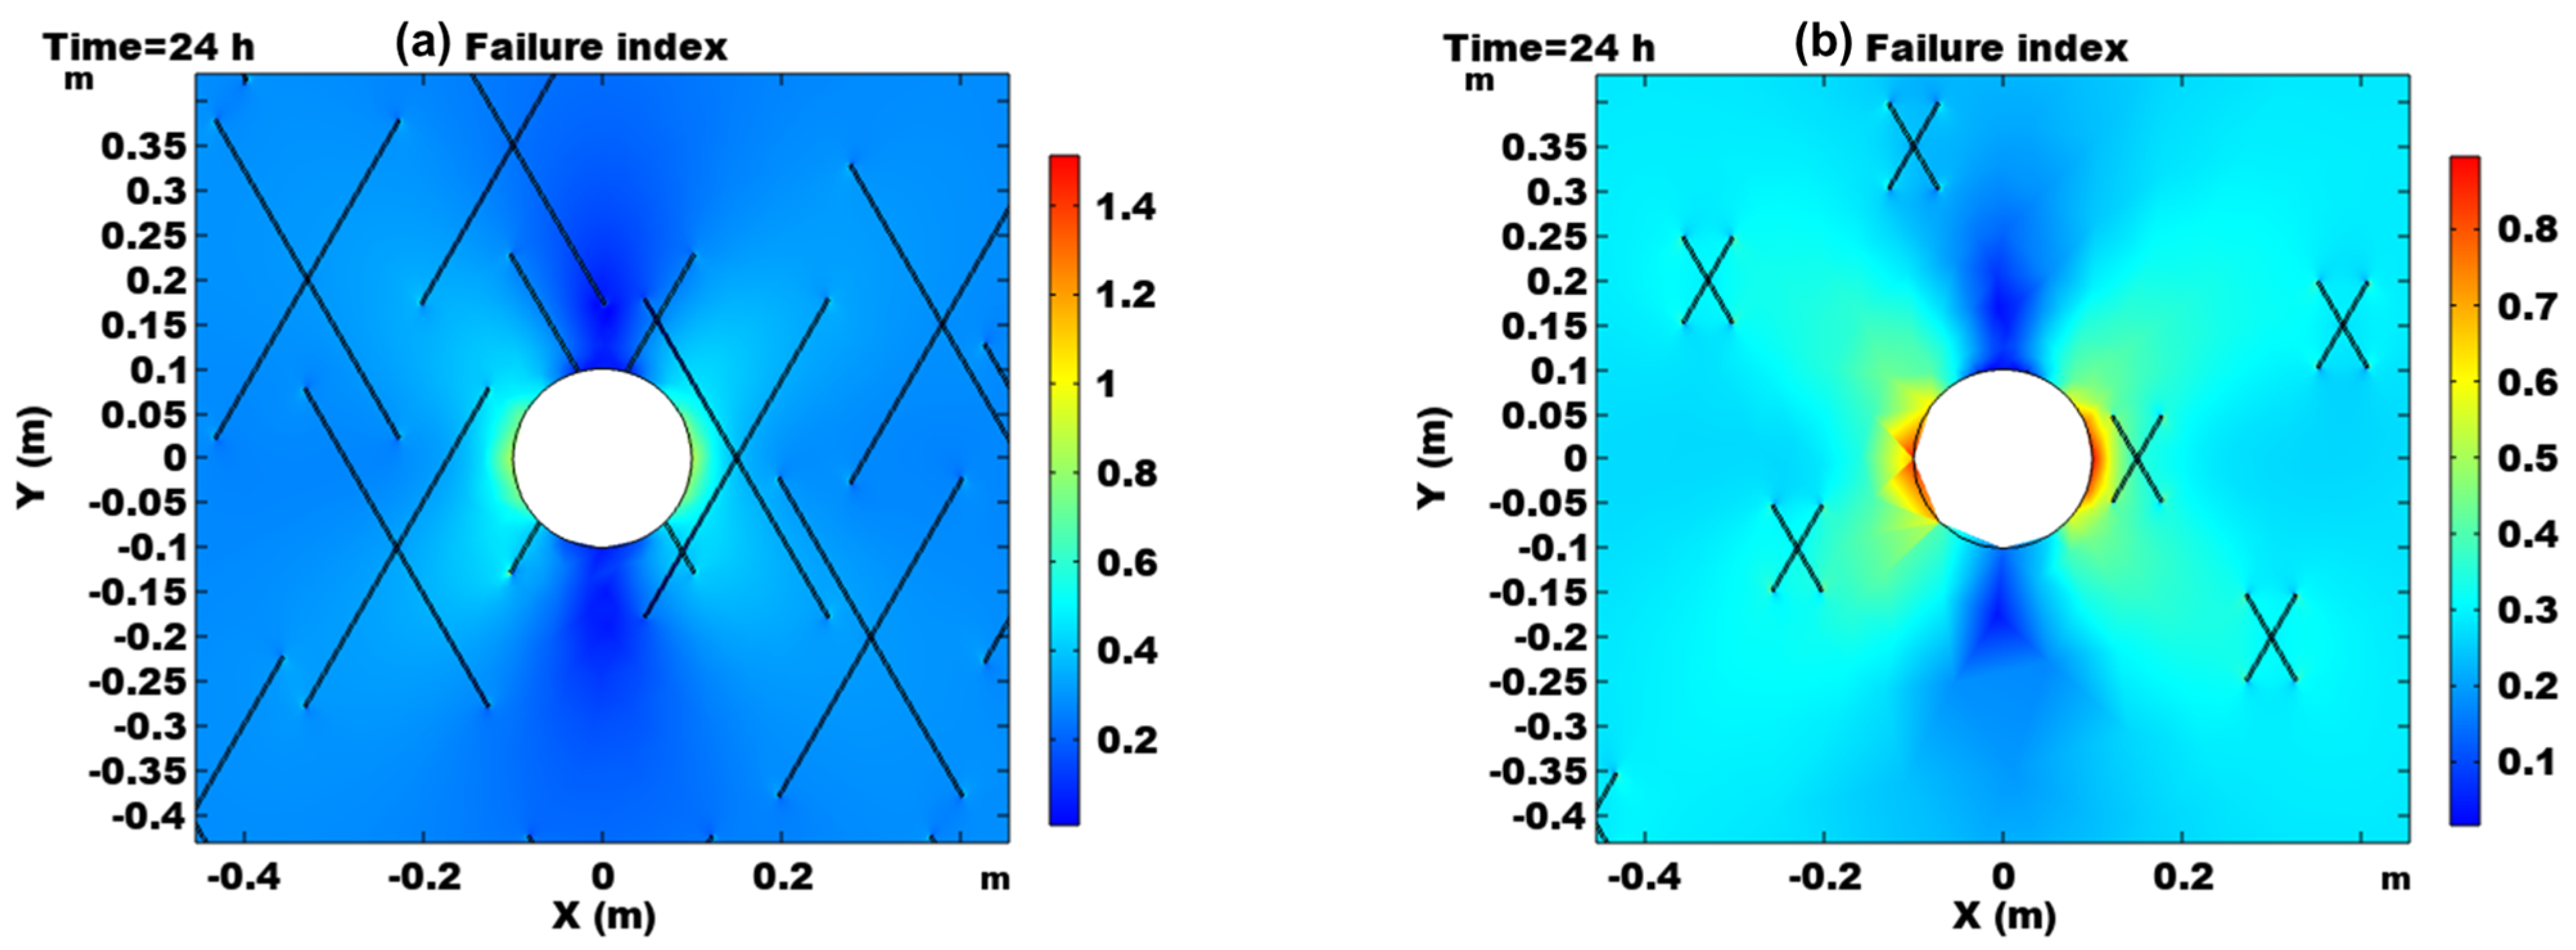
The temporal and spatial evolution patterns of pressure near the wellbore are more sensitive to the existence of natural fractures than those of temperature. Natural fractures only facilitate fluid flow.
(2)
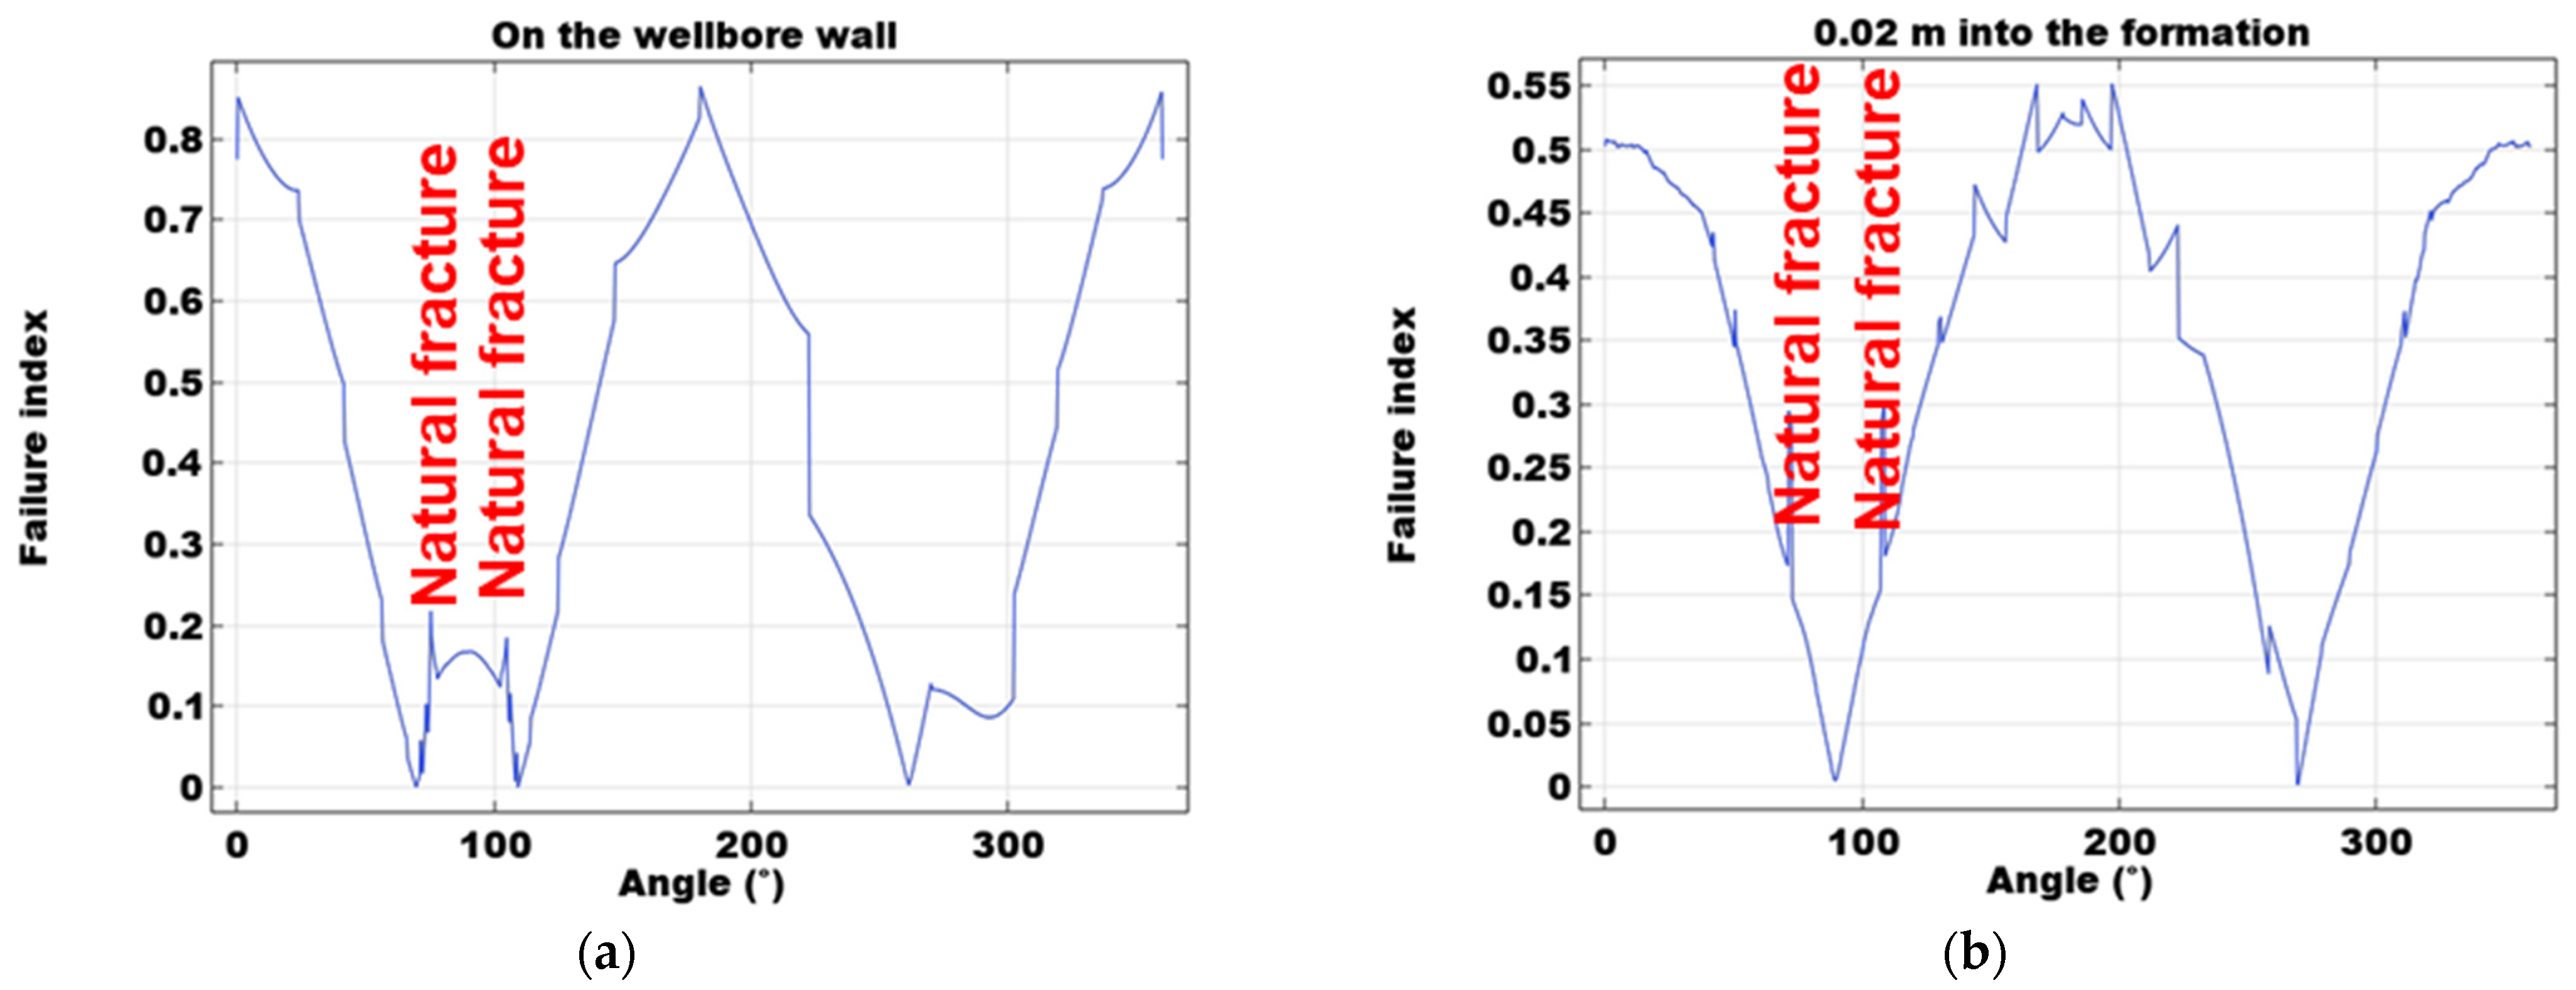
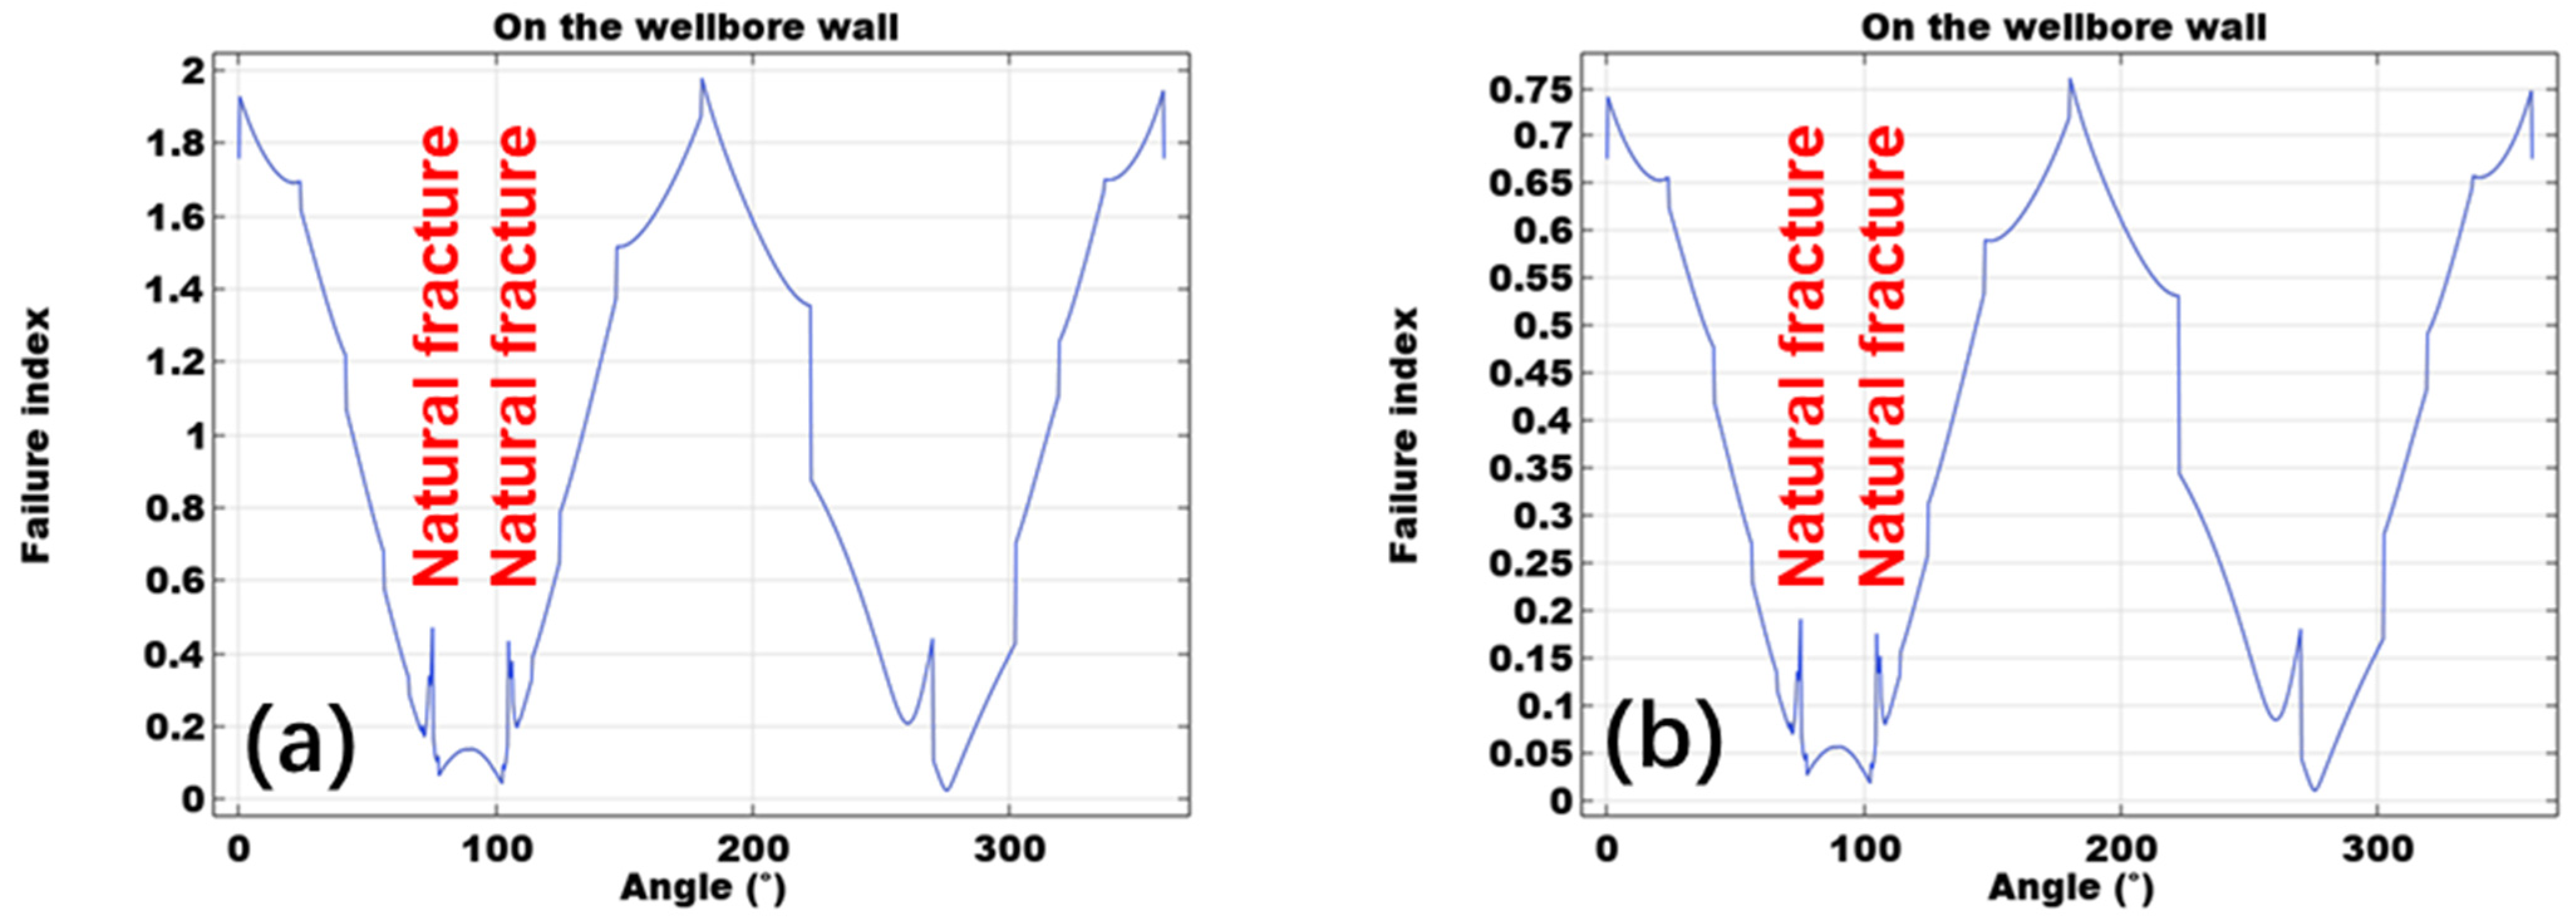
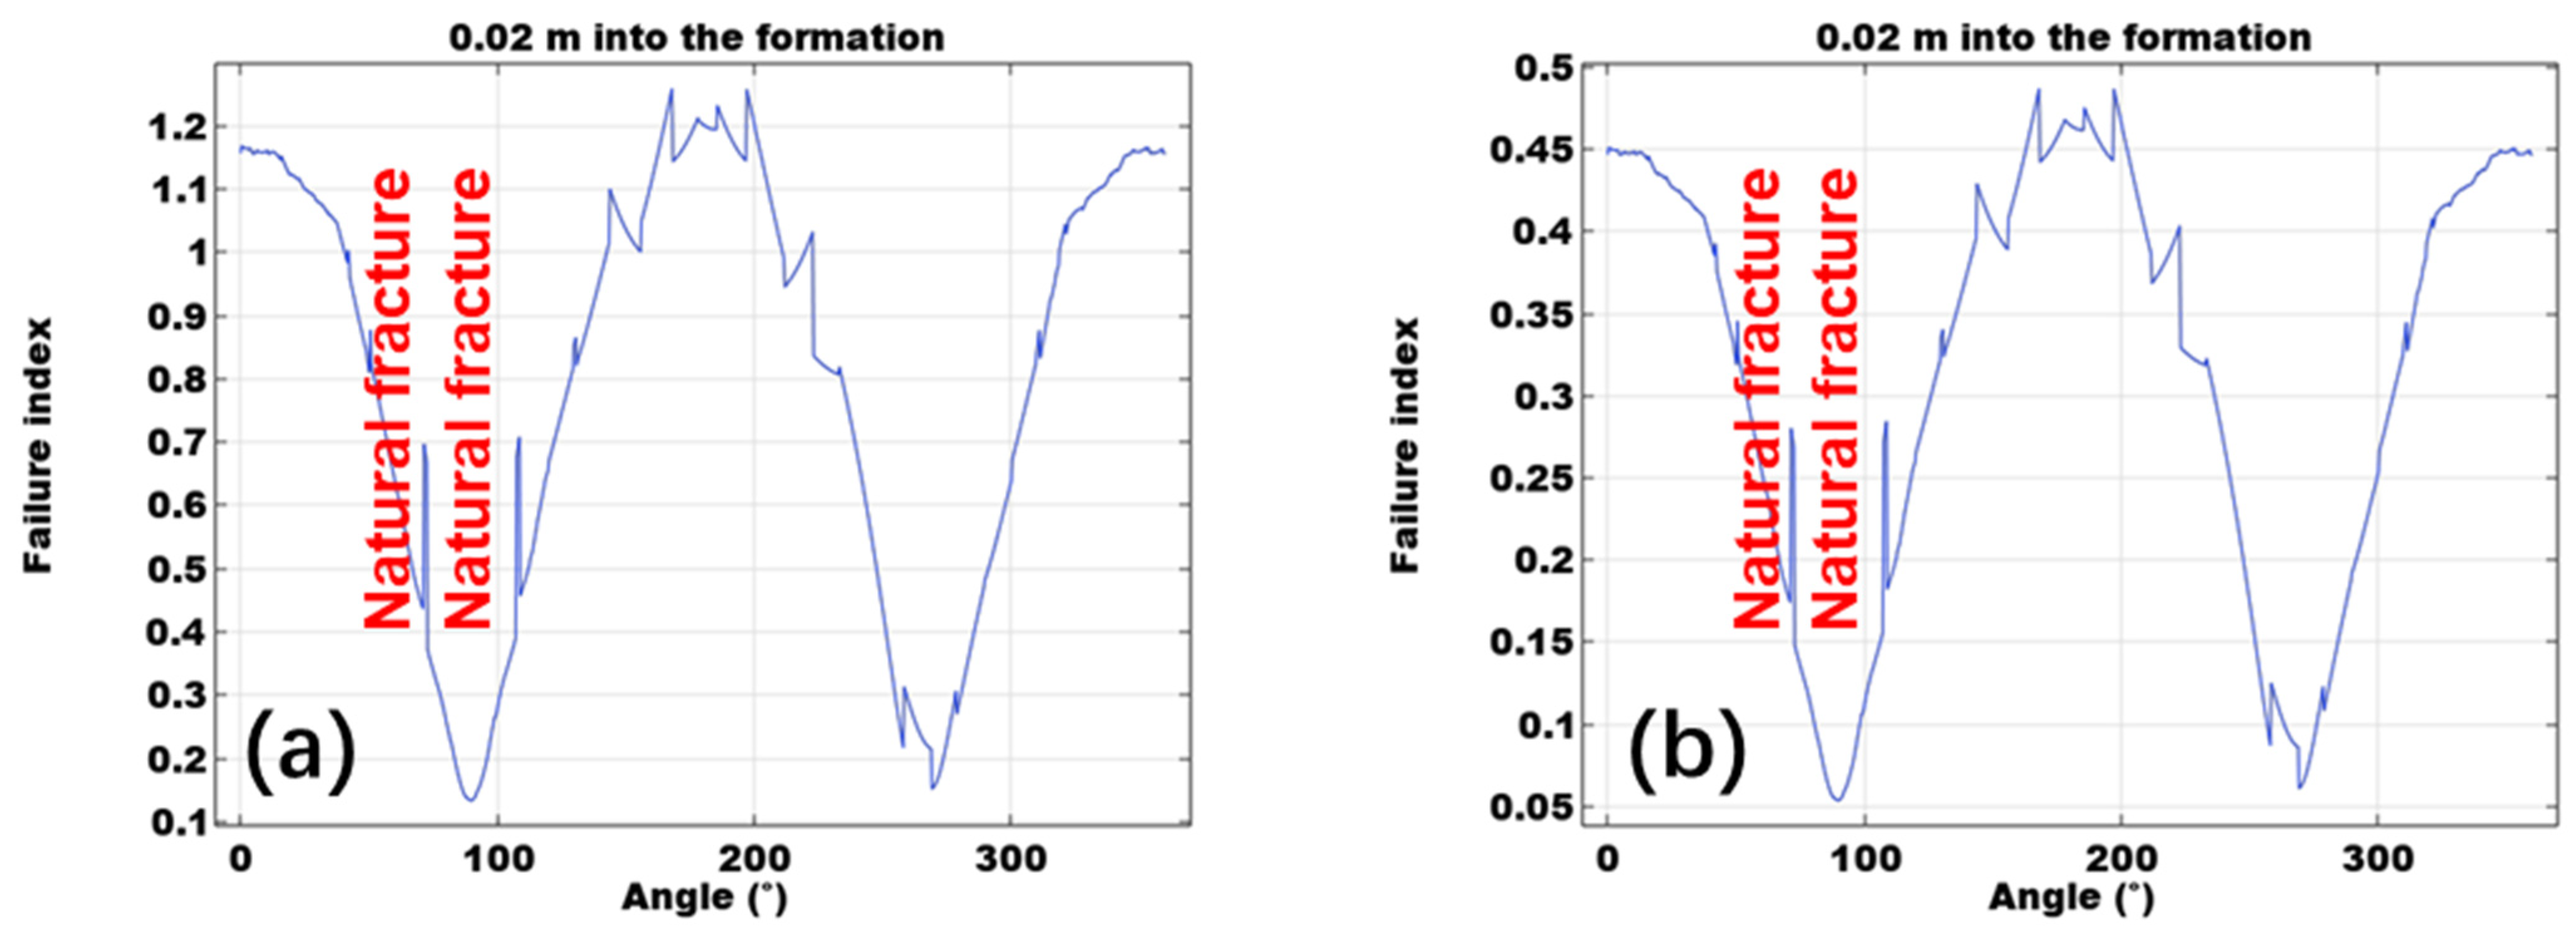
Natural fractures cause heterogeneous geo-mechanical responses. However, the general wellbore failure patterns still follow the analytical solutions.
(3)
Wellbore failure risks are highly sensitive to the internal friction angle of the formation. Natural fracture length also governs the near-well failure risks. Longer natural fractures increase the failure index values and the area with high failure risks.
(4)
It is important to characterize the internal friction angle and the geometry of natural fractures for the optimization of drilling parameters in naturally fractured formations. Improving the quantification quality of these parameters before drilling can effectively reduce formation failure risks.

Author Contributions

Conceptualization, X.G.; methodology, Z.W.; software, X.G. and B.Z.; validation, W.W. and P.Y.; writing—original draft preparation, Y.S.; writing—review and editing, X.G.; visualization, G.C. and J.L. All authors have read and agreed to the published version of the manuscript.

Funding

This research was funded by the National Natural Science Foundation of China (U19B6003-05) and the CNPC Innovation Fund (2021DQ02-0502) And The APC was funded by the CNPC Innovation Fund.

Data Availability Statement

The data presented in this study are available in the result sections in this article.

Acknowledgments

The authors acknowledge the financial support from the National Natural Science Foundation of China (No. U19B6003-05) and the CNPC Innovation Fund (No. 2021DQ02-0502).

Conflicts of Interest

The authors declare no conflict of interest.

References

  1. Weng, X. Modeling of complex hydraulic fractures in naturally fractured formation. J. Unconv. Oil Gas Resour. 2015, 9, 114–135. [Google Scholar] [CrossRef]
  2. He, Y.; Qiao, Y.; Qin, J.; Tang, Y.; Wang, Y.; Chai, Z. A novel method to enhance oil recovery by inter-fracture injection and production through the same multi-fractured horizontal well. J. Energy Resour. Technol. 2022, 144, 043005. [Google Scholar] [CrossRef]
  3. Zhao, X.; Jin, F.; Liu, X.; Zhang, Z.; Cong, Z.; Li, Z.; Tang, J. Numerical study of fracture dynamics in different shale fabric facies by integrating machine learning and 3-D lattice method: A case from Cangdong Sag, Bohai Bay basin, China. J. Pet. Sci. Eng. 2022, 218, 110861. [Google Scholar] [CrossRef]
  4. Li, Q.; Wu, J. Factors affecting the lower limit of the safe mud weight window for drilling operation in hydrate-bearing sediments in the Northern South China Sea. Geomech. Geophys. Geo-Energy Geo-Resour. 2022, 8, 82. [Google Scholar] [CrossRef]
  5. Li, Q.; Wang, F.; Wang, Y.; Zhou, C.; Chen, J.; Forson, K.; Miao, R.; Su, Y.; Zhang, J. Effect of reservoir characteristics and chemicals on filtration property of water-based drilling fluid in unconventional reservoir and mechanism disclosure. Environ. Sci. Pollut. Res. 2023, 30, 55034–55043. [Google Scholar] [CrossRef]
  6. Guo, X.; Jin, Y.; Zi, J.; Lin, J.; Zhu, B.; Wen, Q.; Jing, Q. Numerical Investigation of Depressurization through Horizontal Wells in Methane-Hydrate-Bearing Sediments Considering Sand Production. J. Mar. Sci. Eng. 2022, 10, 1777. [Google Scholar] [CrossRef]
  7. Fekete, P.; Bruno, L.A.; Dosunmu, A.; Odagme, S.; Sanusi, A.; Bowe, E. The effect of wellbore stability in naturally fractured reservoirs. In Proceedings of the SPE Nigeria Annual International Conference and Exhibition, Lagos, Nigeria, 4–6 August 2015; OnePetro: Richardson, TX, USA, 2015. [Google Scholar]
  8. Gao, J.; Lin, H.; Wu, B.; Deng, J.; Liu, H. Porochemothermoelastic solutions considering fully coupled thermo-hydro-mechanical-chemical processes to analyze the stability of inclined boreholes in chemically active porous media. Comput. Geotech. 2021, 134, 104019. [Google Scholar] [CrossRef]
  9. Zhi, D.; Guo, X.; Wang, W.; Jin, Y.; Liu, C.; Chen, G.; Wang, Z. Fracturing and production analysis of the efficacy of hydraulic fracture stage reduction in the improvement of cost-effectiveness in shale oil development: A case study of Jimsar shale oil, China. Energy Sci. Eng. 2021, 9, 1337–1348. [Google Scholar] [CrossRef]
  10. Wang, H.M.; Towler, B.F.; Soliman, M.Y. Near-wellbore stress analysis and wellbore strengthening for drilling depleted formations. In Proceedings of the Rocky Mountain Oil & Gas Technology Symposium, Denver, CO, USA, 16–18 April 2007; OnePetro: Richardson, TX, USA, 2007. [Google Scholar]
  11. Wang, H.M.; Towler, B.F.; Soliman, M. Fractured wellbore stress analysis: Sealing cracks to strengthen a wellbore. In Proceedings of the SPE/IADC Drilling Conference, Amsterdam, The Netherlands, 20–22 February 2007; OnePetro: Richardson, TX, USA, 2007. [Google Scholar]
  12. Helstrup, O.A.; Chen, Z.; Rahman, S.S. Time-dependent wellbore instability and ballooning in naturally fractured formations. J. Pet. Sci. Eng. 2004, 43, 113–128. [Google Scholar] [CrossRef]
  13. Barton, C.A.; Zoback, M.D. Discrimination of natural fractures from drilling-induced wellbore failures in wellbore image data—Implications for reservoir permeability. SPE Reserv. Eval. Eng. 2002, 5, 249–254. [Google Scholar] [CrossRef]
  14. Kidambi, T.; Kumar, G.S. Mechanical earth modeling for a vertical well drilled in a naturally fractured tight carbonate gas reservoir in the Persian Gulf. J. Pet. Sci. Eng. 2016, 141, 38–51. [Google Scholar] [CrossRef]
  15. Feng, Y.; Gray, K.E. A fracture-mechanics-based model for wellbore strengthening applications. J. Nat. Gas Sci. Eng. 2016, 29, 392–400. [Google Scholar] [CrossRef]
  16. Han, Y.; Liu, C.; Phan, D.; AlRuwaili, K.; Abousleiman, Y. Advanced wellbore stability analysis for drilling naturally fractured rocks. In Proceedings of the SPE Middle East Oil and Gas Show and Conference, Manama, Bahrain, 19–21 March 2019; OnePetro: Richardson, TX, USA, 2019. [Google Scholar]
  17. Bagdeli, M.; Manshad, A.K.; Shadizadeh, S.R.; Ali, J.A.; Gholami, R.; Keshavarz, A.; Iglauer, S. Natural fracture characterization and wellbore stability analysis of a highly fractured southwestern Iranian oilfield. Int. J. Rock Mech. Min. Sci. 2019, 123, 104101. [Google Scholar] [CrossRef]
  18. Meng, M.; Baldino, S.; Miska, S.Z.; Takach, N. Wellbore stability in naturally fractured formations featuring dual-porosity/single-permeability and finite radial fluid discharge. J. Pet. Sci. Eng. 2019, 174, 790–803. [Google Scholar] [CrossRef]
  19. Chen, B.; Ji, J.; Lin, J.; Chen, H.; Wang, X.; Guo, X.; Yang, W.; Lin, J. Experimental and numerical investigation of characteristics of highly heterogeneous rock mechanical responses in tight sandy conglomerate reservoir rock under tri-axial compression. Front. Earth Sci. 2021, 9, 735208. [Google Scholar] [CrossRef]
  20. Wang, L.; Li, Y.; Xu, D.; Gao, Y.; Zhang, J.; He, J.; Zhang, F.; Gao, S.; Guo, X. Evolution of Near-Well Damage Caused by Fluid Injection through Perforations in Wellbores in Low-Permeability Reservoirs: A Case Study in a Shale Oil Reservoir. Lithosphere 2022, 2022, 3824011. [Google Scholar] [CrossRef]
  21. Coussy, O. Poromechanics; John Wiley & Sons: Hoboken, NJ, USA, 2004. [Google Scholar]
  22. Roussel, N.P.; Florez, H.A.; Rodriguez, A.A. Hydraulic fracture propagation from infill horizontal wells. In Proceedings of the SPE Annual Technical Conference and Exhibition, New Orleans, LA, USA, 30 September–1 October 2013; OnePetro: Richardson, TX, USA, 2013. [Google Scholar]
  23. Guo, X.; Song, H.; Killough, J.; Du, L.; Sun, P. Numerical investigation of the efficiency of emission reduction and heat extraction in a sedimentary geothermal reservoir: A case study of the Daming geothermal field in China. Environ. Sci. Pollut. Res. 2018, 25, 4690–4706. [Google Scholar] [CrossRef]
  24. Guo, X.; Jin, Y.; Zi, J.; Lin, B. Numerical investigation of the gas production efficiency and induced geomechanical responses in marine methane hydrate-bearing sediments exploited by depressurization through hydraulic fractures. Energy Fuels 2021, 35, 18441–18458. [Google Scholar] [CrossRef]
  25. Dean, R.H.; Gai, X.; Stone, C.M.; Minkoff, S.E. A comparison of techniques for coupling porous flow and geomechanics. SPE J. 2006, 11, 132–140. [Google Scholar] [CrossRef]
  26. Kim, J.; Moridis, G.J.; Yang, D.; Rutqvist, J. Numerical studies on two-way coupled fluid flow and geomechanics in hydrate deposits. SPE J. 2012, 17, 485–501. [Google Scholar] [CrossRef] [Green Version]
  27. Cheng, W.; Jiang, G.; Li, X.; Zhou, Z.; Wei, Z. A porochemothermoelastic coupling model for continental shale wellbore stability and a case analysis. J. Pet. Sci. Eng. 2019, 182, 106265. [Google Scholar] [CrossRef]
  28. Fan, X.; Zhang, M.; Zhang, Q.; Zhao, P.; Yao, B.; Lv, D. Wellbore stability and failure regions analysis of shale formation accounting for weak bedding planes in ordos basin. J. Nat. Gas Sci. Eng. 2020, 77, 103258. [Google Scholar] [CrossRef]
  29. Yang, D. A Simulator with Numerical Upscaling for the Analysis of Coupled Multiphase Flow and Geomechanics in Heterogeneous and Deformable Porous and Fractured Media. Ph.D. Dissertation, Texas A&M University, College Station, TX, USA, 2013. [Google Scholar]
  30. Yang, D.; Moridis, G.J.; Blasingame, T.A. A fully coupled multiphase flow and geomechanics solver for highly heterogeneous porous media. J. Comput. Appl. Math. 2014, 270, 417–432. [Google Scholar] [CrossRef]
  31. Kolditz, O.; Shao, H.; Wang, W.; Bauer, S. Thermo-Hydro-Mechanical Chemical Processes in Fractured Porous Media: Modelling and Benchmarking; Springer: Berlin/Heidelberg, Germany, 2016; Volume 25. [Google Scholar]
  32. Guo, T.; Zhang, Y.; Zhang, W.; Niu, B.; He, J.; Chen, M.; Yu, Y.; Xiao, B.; Xu, R. Numerical simulation of geothermal energy productivity considering the evolution of permeability in various fractures. Appl. Therm. Eng. 2022, 201, 117756. [Google Scholar] [CrossRef]
  33. Guo, X.; Jin, Y.; Zi, J.; Lin, J.; Zhu, B. A 3D modeling study of effects of heterogeneity on system responses in methane hydrate reservoirs with horizontal well depressurization. Gas Sci. Eng. 2023, 115, 205001. [Google Scholar] [CrossRef]
  34. Amestoy, P.R.; Duff, I.S.; L’Excellent, J.Y.; Koster, J. A fully asynchronous multifrontal solver using distributed dynamic scheduling. SIAM J. Matrix Anal. Appl. 2001, 23, 15–41. [Google Scholar] [CrossRef] [Green Version]
  35. Liang, C.; Xie, J.; Chen, Y.; Liu, J.; He, Y.; Zhao, J.; Wang, W.; Wang, L. Genesis and Coupling Relationship of Fractures in Shale Reservoir of Lucaogou Formation in Jimsar Sag, Junggar Basin. Xinjiang Pet. Geol. 2021, 42, 521–528. [Google Scholar]
  36. Liu, X.; Wang, X.; Zhao, B.; Xiong, J.; Liang, L. Propagation of Hydraulic Fractures and Fracability Evaluation of Sandy Conglomerate Reservoirs. Xinjiang Pet. Geol. 2023, 44, 169–177. [Google Scholar]
  37. Okubo, K.; Rougier, E.; Lei, Z.; Bhat, H.S. Modeling earthquakes with off-fault damage using the combined finite-discrete element method. Comp. Part. Mech. 2020, 7, 1057–1072. [Google Scholar] [CrossRef]
Figure 1. Setup of the simulation problem.
Processes 11 01744 g001
Figure 2. Near−well distribution of pressure, temperature, and stress after 24 h. The results are after 24 h and they are pressure, temperature, Sx, and Sy (ad).
Processes 11 01744 g002aProcesses 11 01744 g002b
Figure 3. Failure index near the wellbore. Results are the failure index after 24 h (a,b).
Processes 11 01744 g003
Figure 4. Failure index distribution on the wellbore wall and along the circle 0.02 m into the formation from the wellbore wall. The results are for on the wellbore wall and the 0.02 m in the formation (a,b).
Processes 11 01744 g004
Figure 5. Pressure distribution along the circle 0.02 m into the formation from the wellbore wall.
Processes 11 01744 g005
Figure 6. Temperature distribution along the circle 0.02 m into the formation from the wellbore wall.
Processes 11 01744 g006
Figure 7. Pressure and temperature distribution along the circle 0.02 m into the formation from the wellbore wall with a boundary pressure of 72 MPa. Results are for pressure and temperature distributions 0.02 m in the formation (a,b).
Processes 11 01744 g007
Figure 8. Failure index distribution results on the wellbore wall and along the circle 0.02 m into the formation from the wellbore wall with a boundary pressure of 72 MPa (a,b).
Processes 11 01744 g008
Figure 9. Pressure and temperature distribution results along the circle 0.02 m into the formation from the wellbore wall with a boundary pressure of 77 MPa (a,b).
Processes 11 01744 g009
Figure 10. Pressure and temperature distribution results along the circle 0.02 m into the formation from the wellbore wall with a wellbore pressure of 77 MPa (a,b).
Processes 11 01744 g010
Figure 11. Failure index distribution results on the wellbore with friction angles of (a) 10° and (b) 30° with a wellbore pressure of 67 MPa.
Processes 11 01744 g011
Figure 12. Failure index distribution results along the circle 0.02 m into the formation from the wellbore wall with friction angles of (a) 10° and (b) 30° with a wellbore pressure of 67 MPa.
Processes 11 01744 g012
Figure 13. Failure index near the wellbore after 24 h for (a) natural fracture length of 0.41 m and (b) natural fracture length of 0.11 m.
Processes 11 01744 g013
Table 1. Modeling parameters of the base case.
ParameterValue
Natural fracture width0.003 m
Natural fracture length0.21 m
Conjugate angle of natural fractures60°
Wellbore radius0.1 m
Young’s modulus of the matrix40 GPa
Poisson’s ratio of the matrix0.2
Rock matrix density2600 kg/m3
Biot’s coefficient1.0
Maximum horizontal principal stress95 MPa
Minimum horizontal principal stress75 MPa
Overburden stress90 MPa
Reservoir fluid density1000 kg/m3
Viscosity1 mPa·s
Rock matrix permeability1 mD
Reservoir pressure65 MPa
Porosity0.1
Natural fracture permeability1000 mD
Reservoir temperature493 K
Reservoir fluid thermal conductivity0.598 W/(m·K)
Reservoir fluid heat capacity4184 J/(kg·K)
Rock thermal conductivity2 W/(m·K)
Rock heat capacity2000 J/(kg·K)
Temperature at the wellbore wall470.15 K
Disclaimer/Publisher’s Note: The statements, opinions and data contained in all publications are solely those of the individual author(s) and contributor(s) and not of MDPI and/or the editor(s). MDPI and/or the editor(s) disclaim responsibility for any injury to people or property resulting from any ideas, methods, instructions or products referred to in the content.

