
Effects of Superheated Surface on the Deposition Behavior of Na2SO4 in Supercritical Water


Abstract
:1. Introduction
2. Experiment
2.1. Chemicals
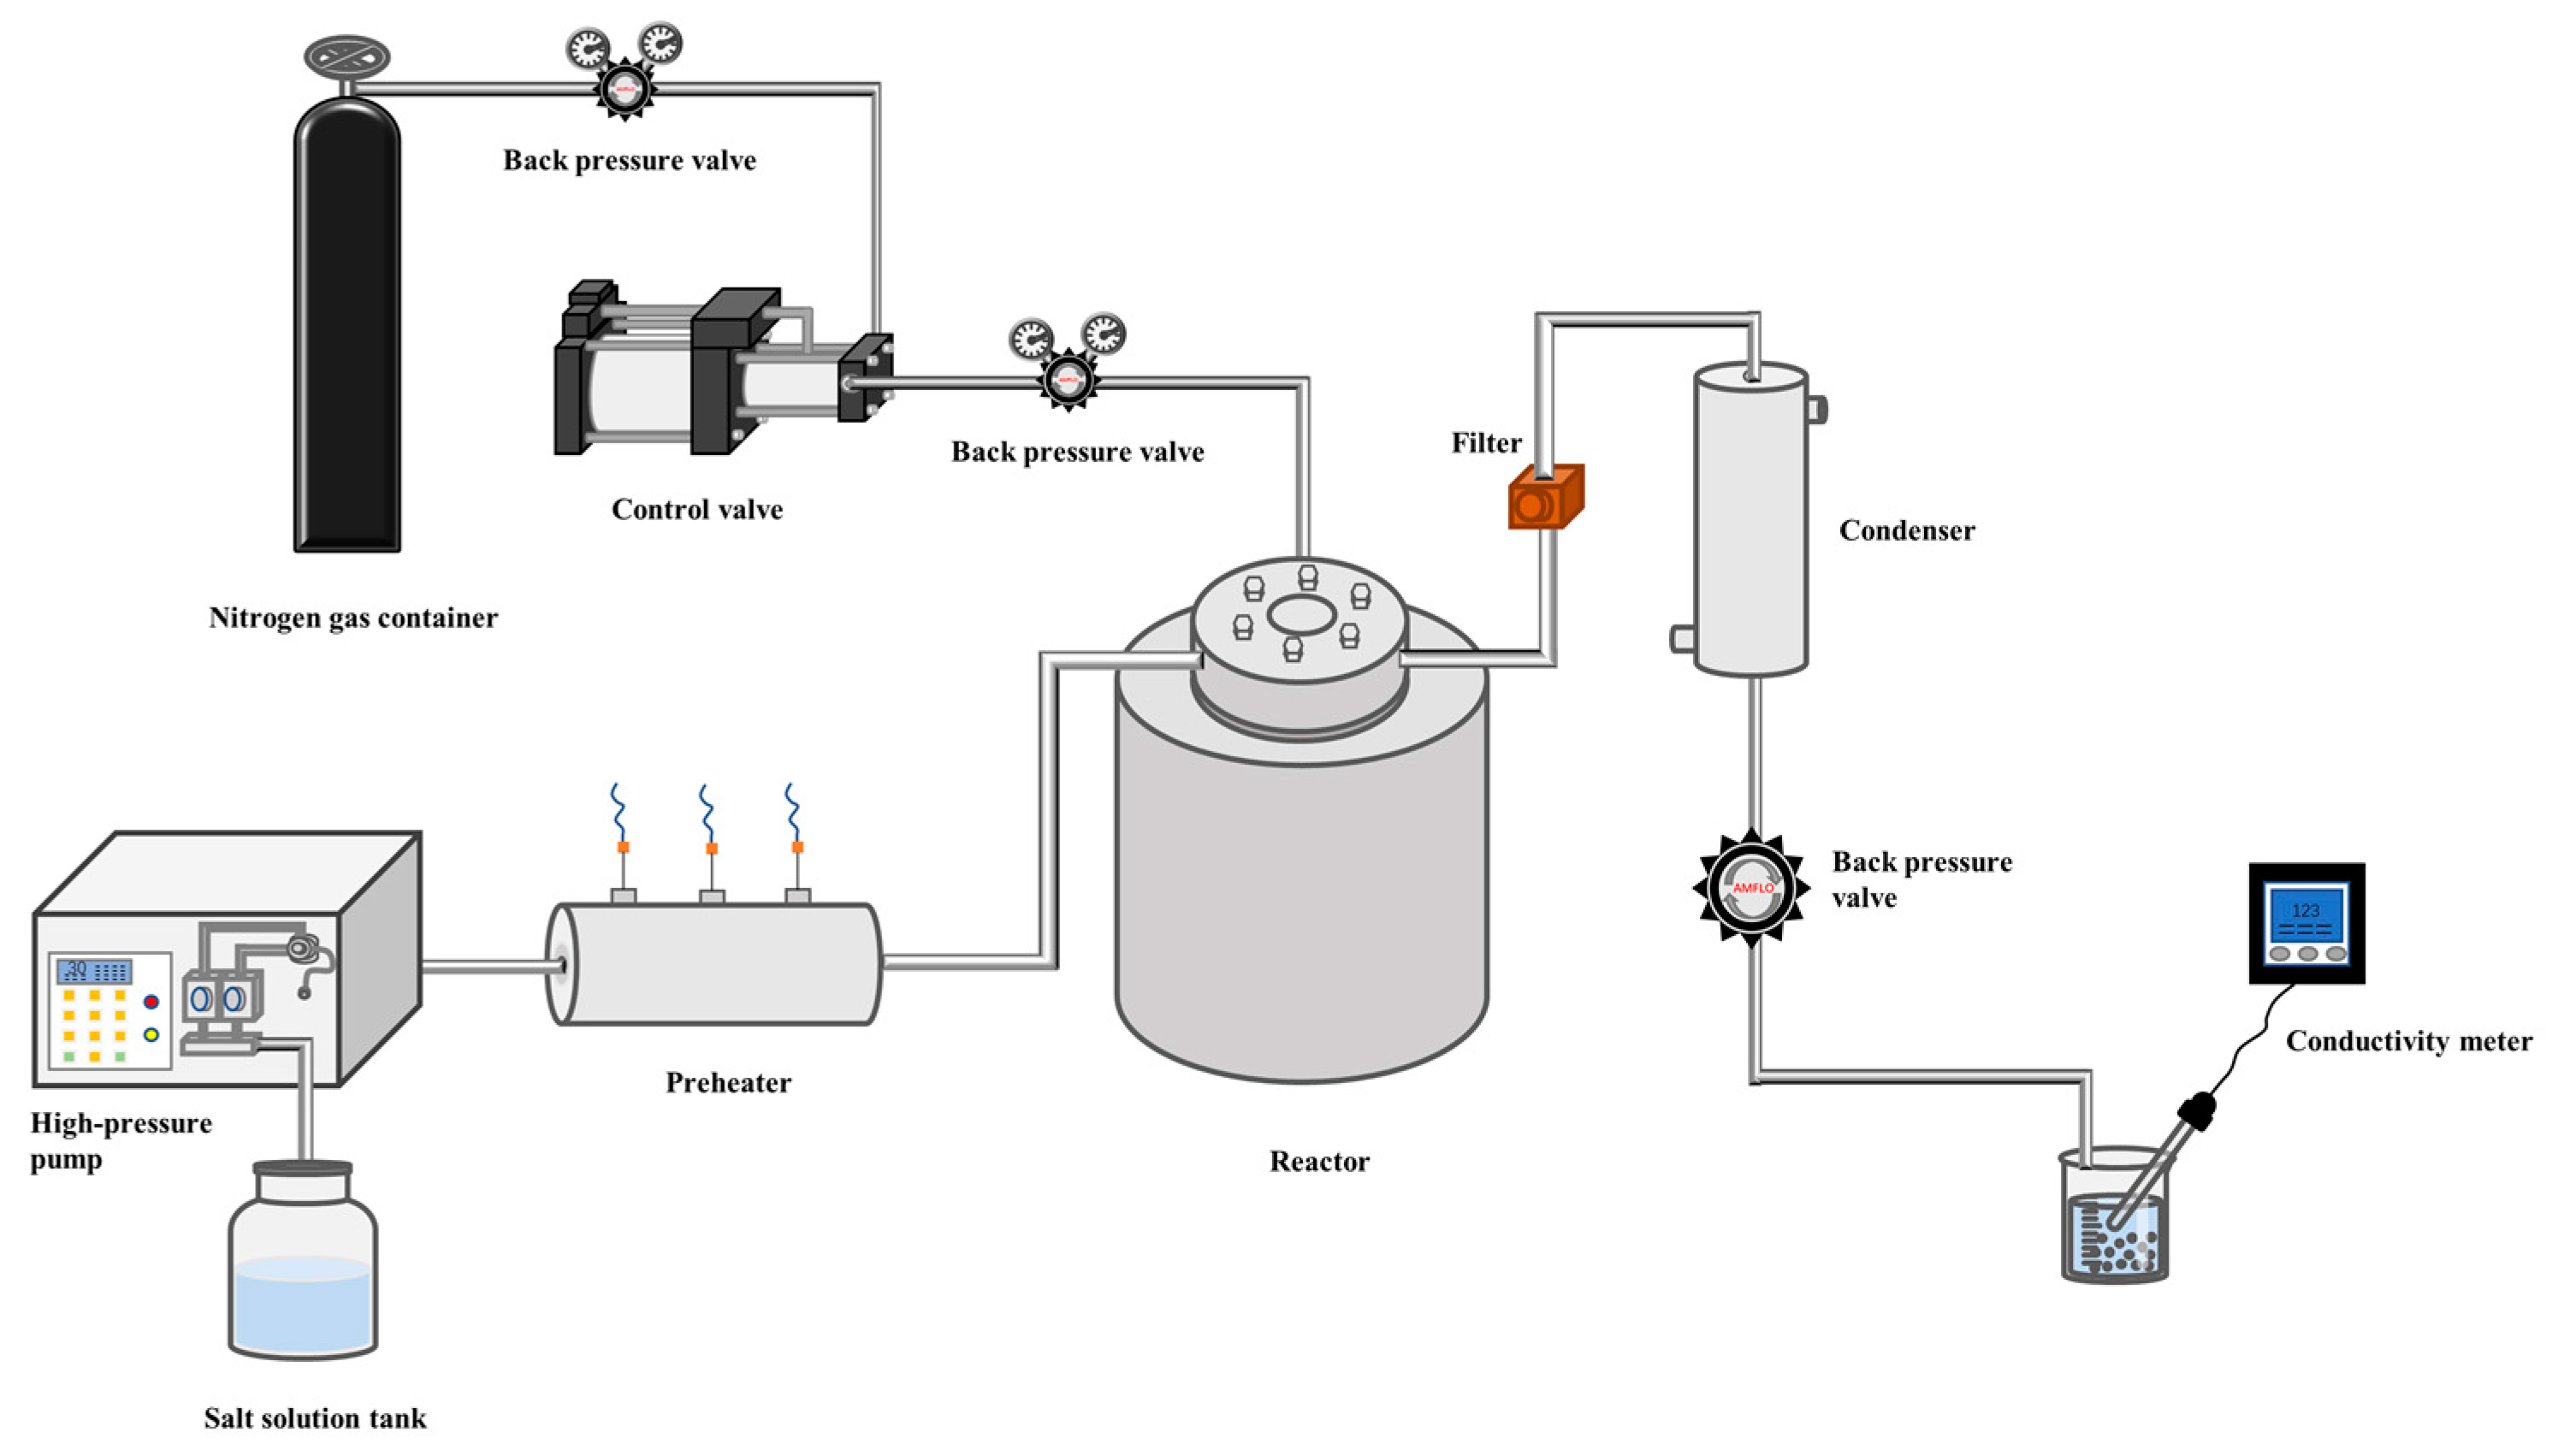
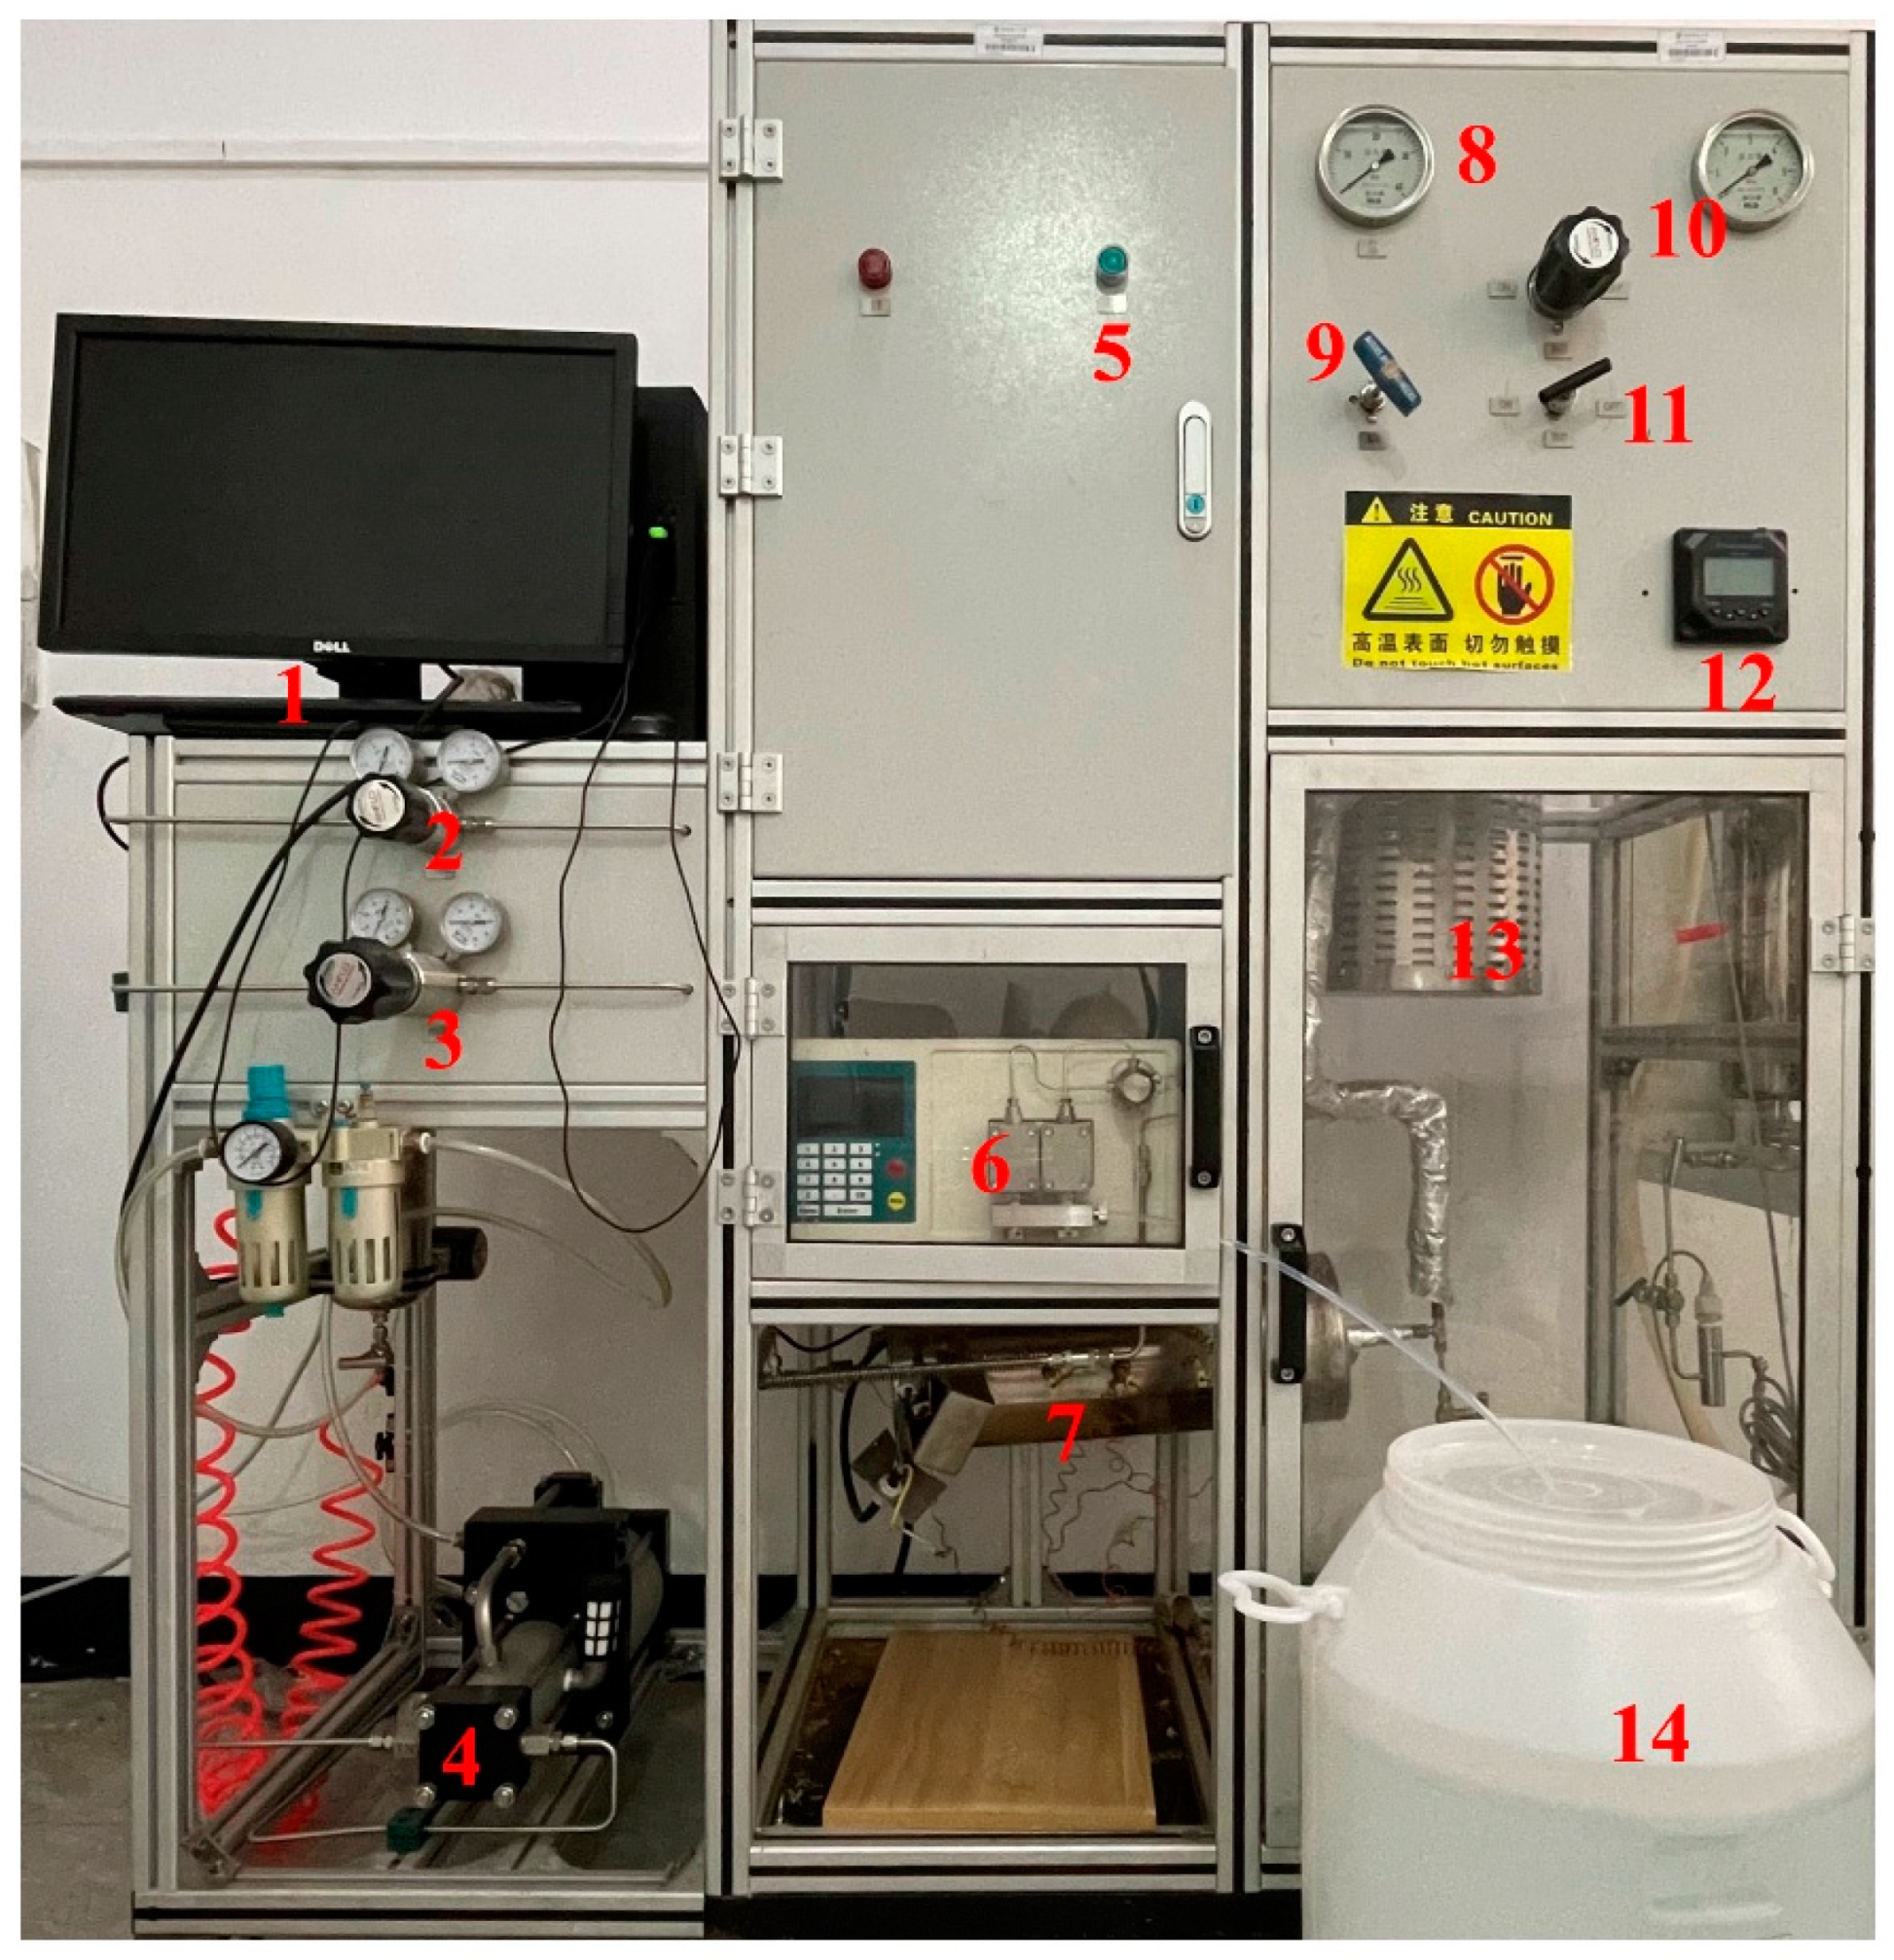
2.2. Device Process
3. Model and Theory
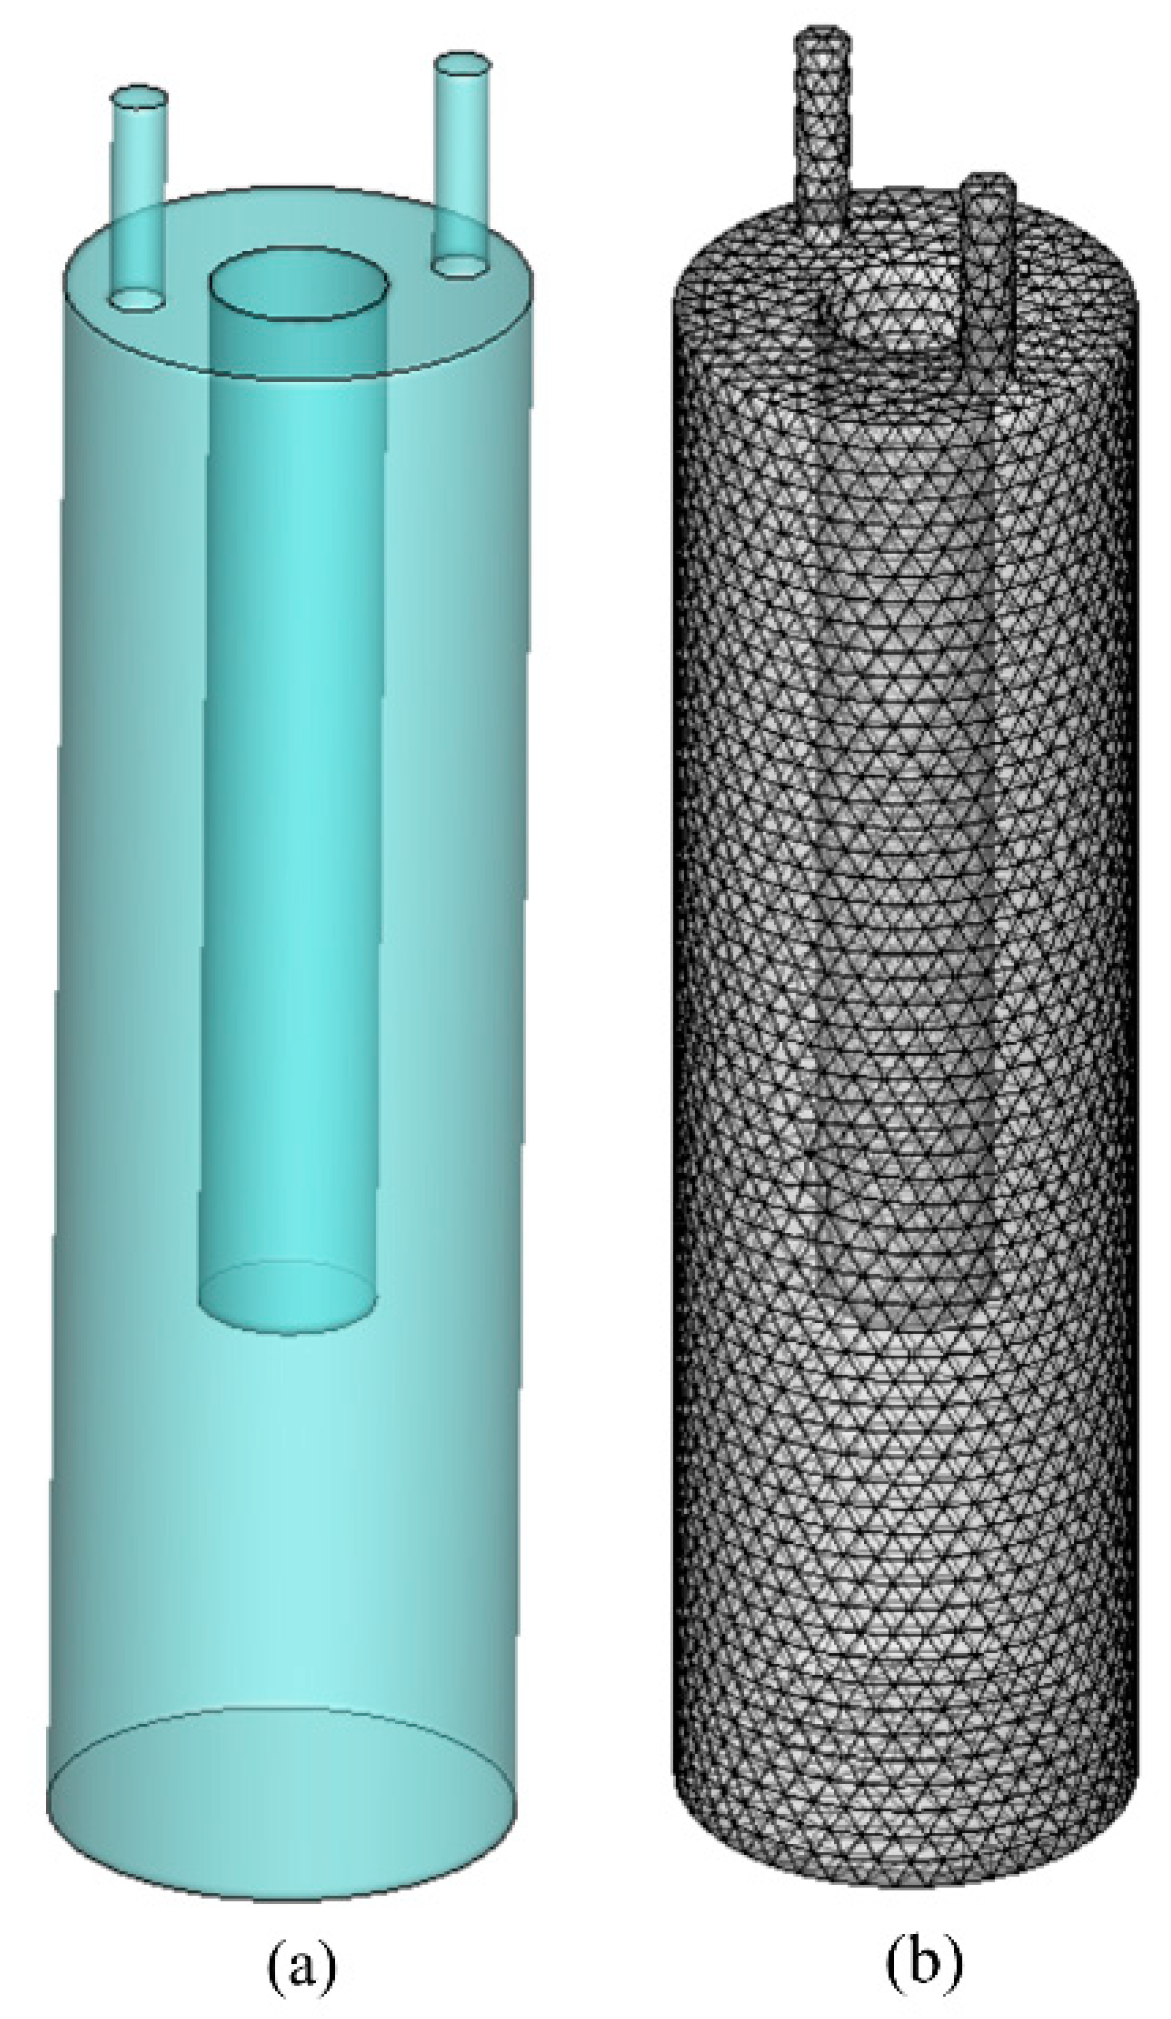
3.1. Physical Model
3.2. Grid Sensitivity Test
3.3. Fluid Dynamics
4. Results and Discussion
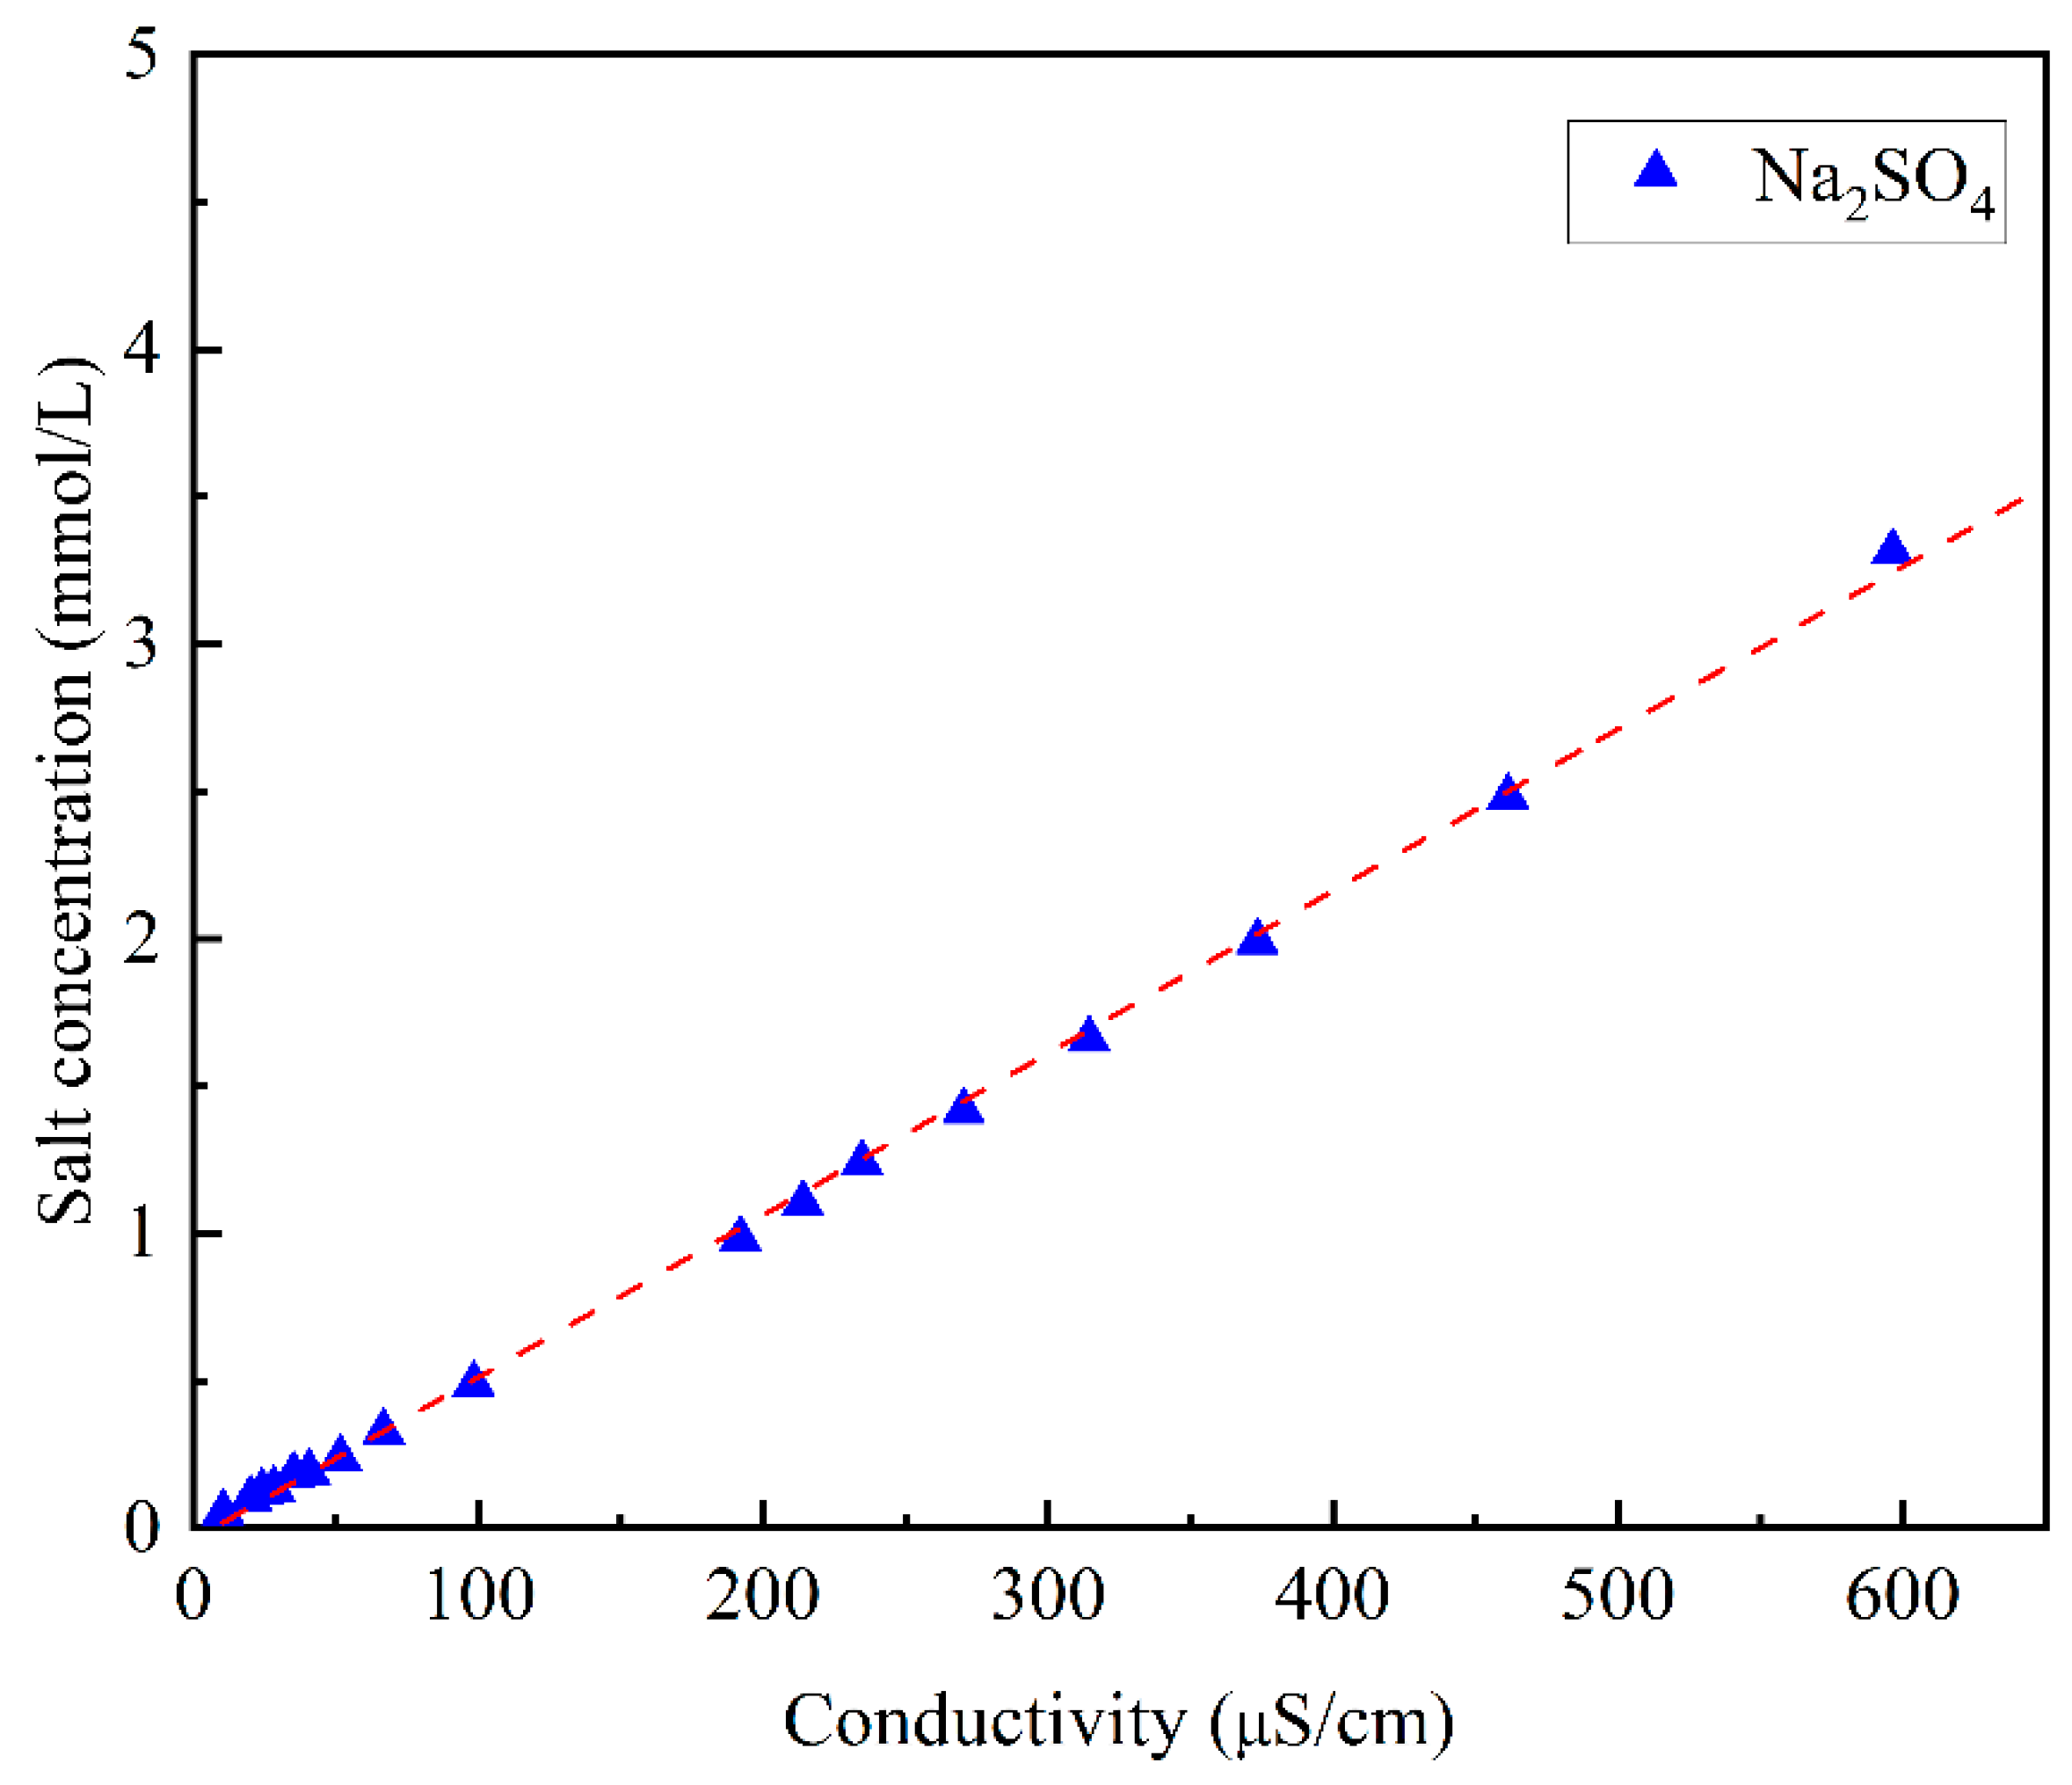
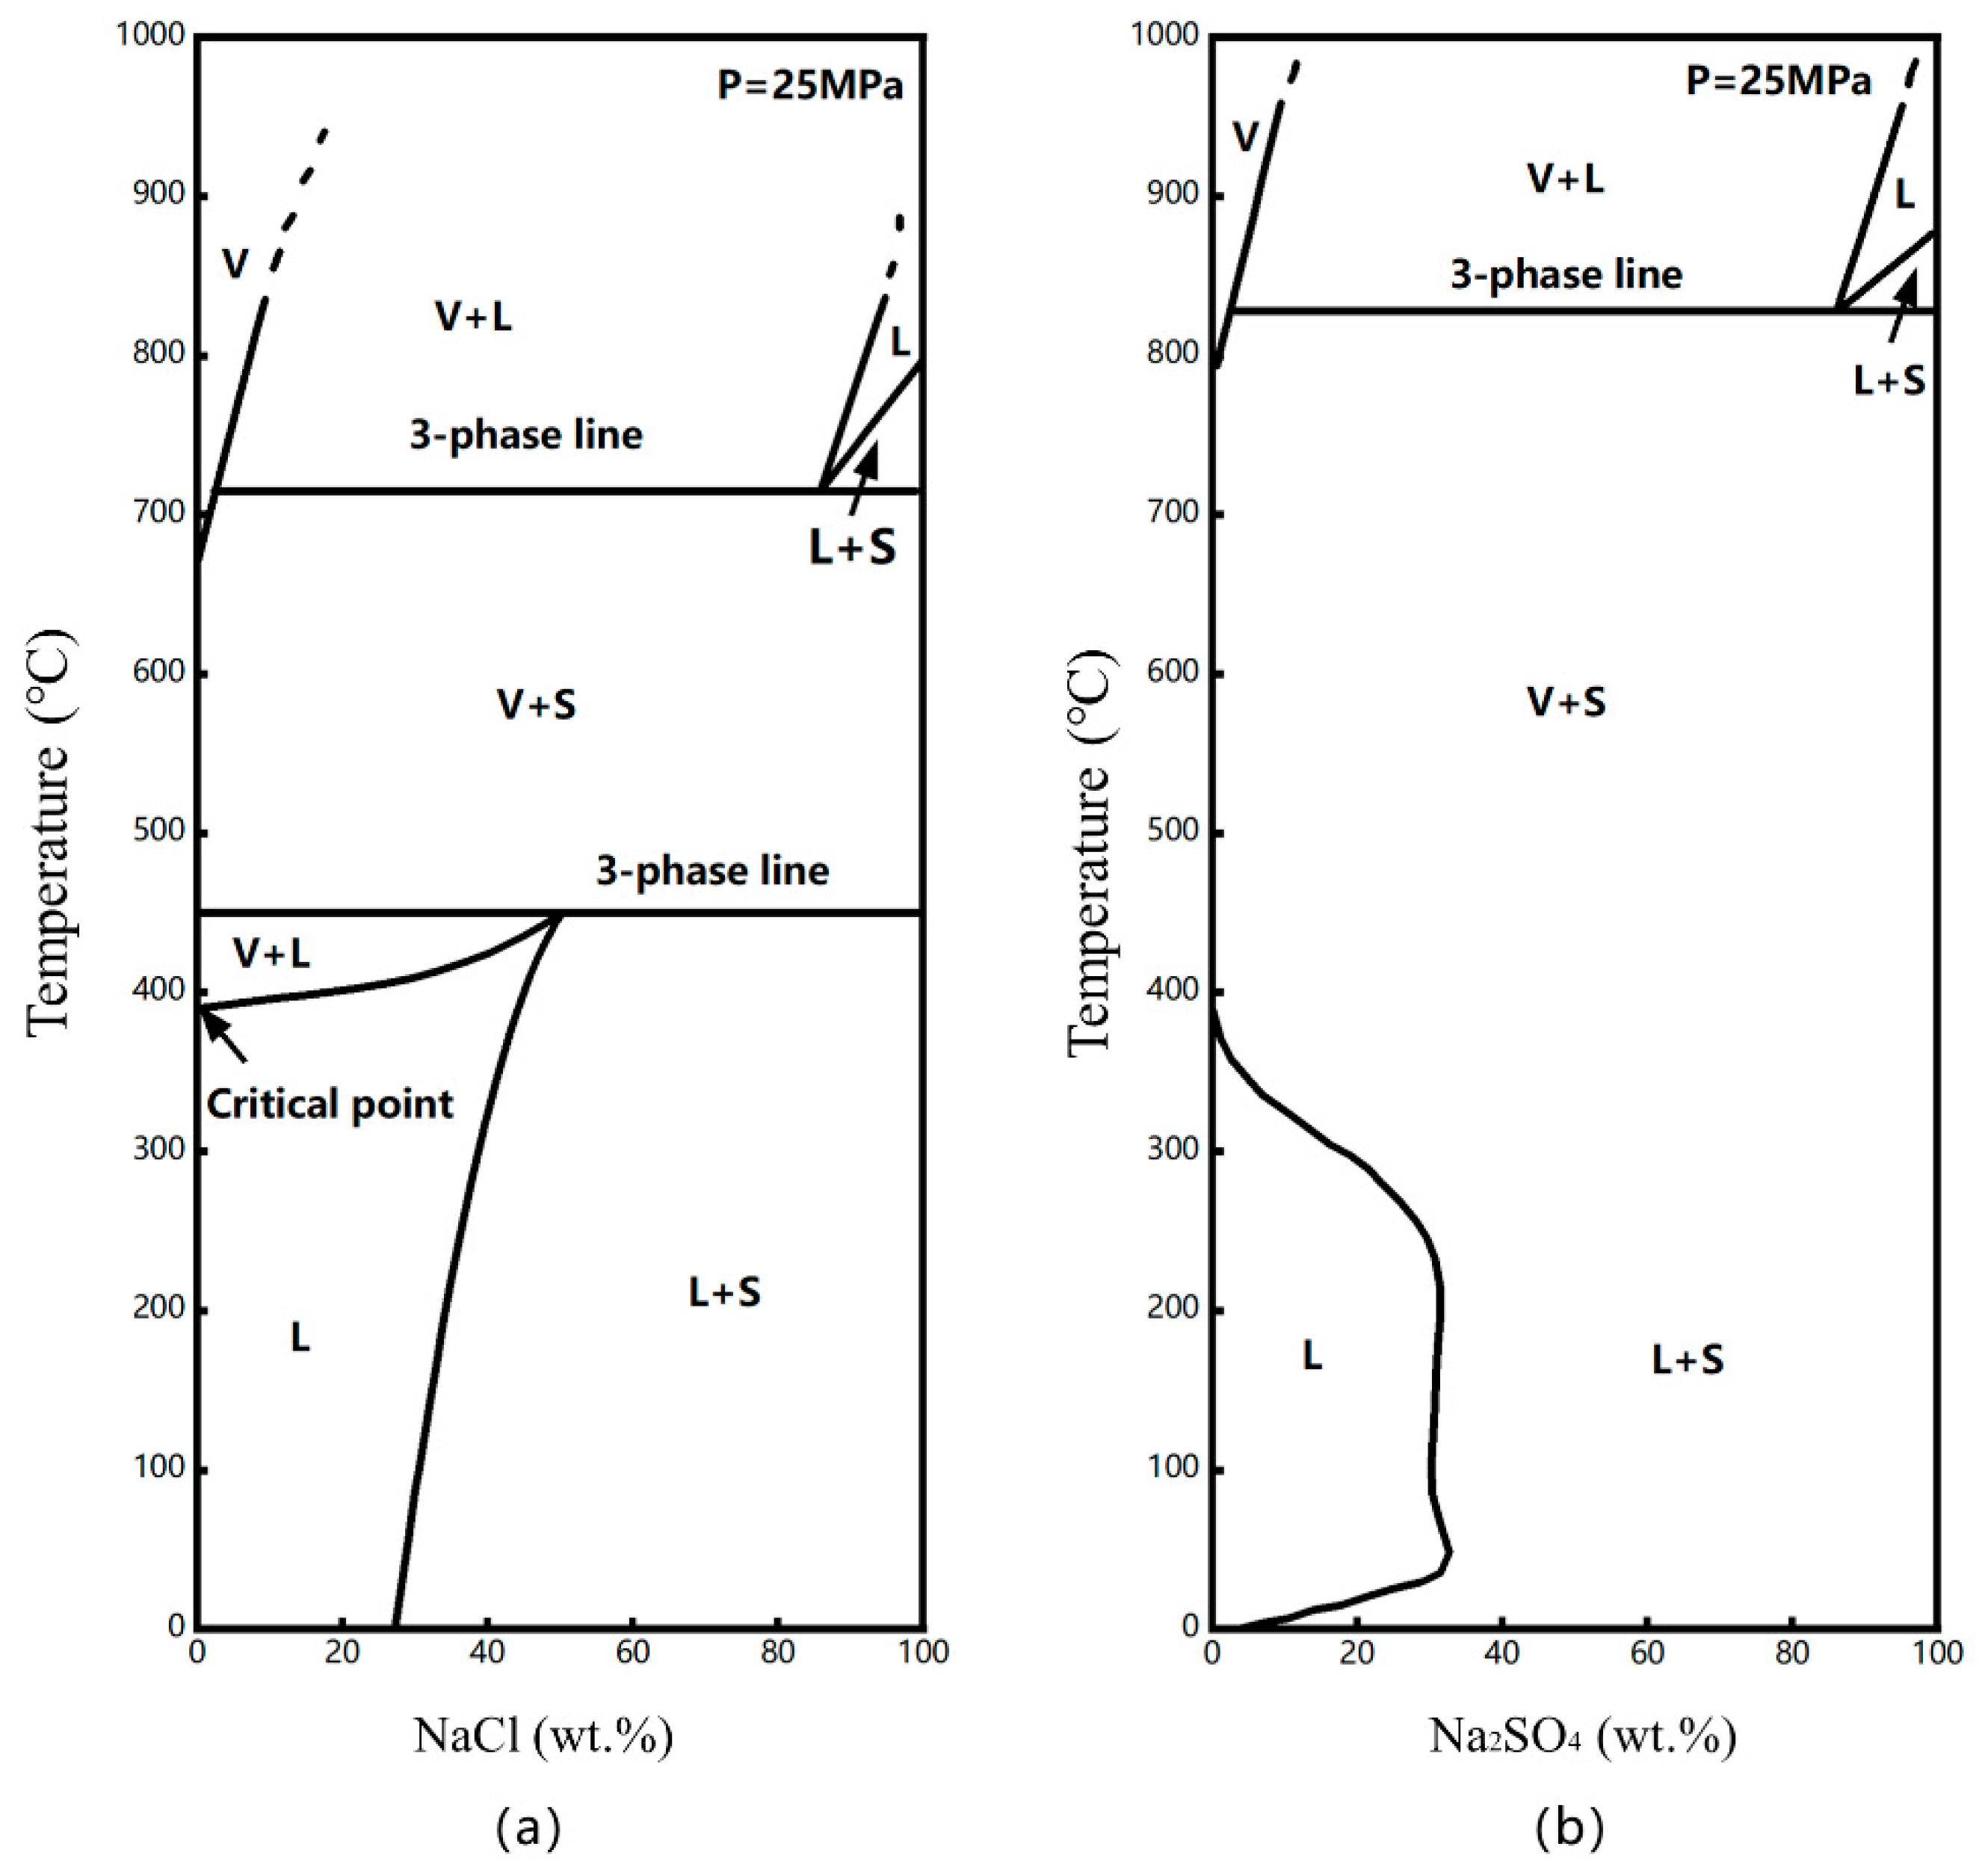
4.1. Solubility Data for Na2SO4
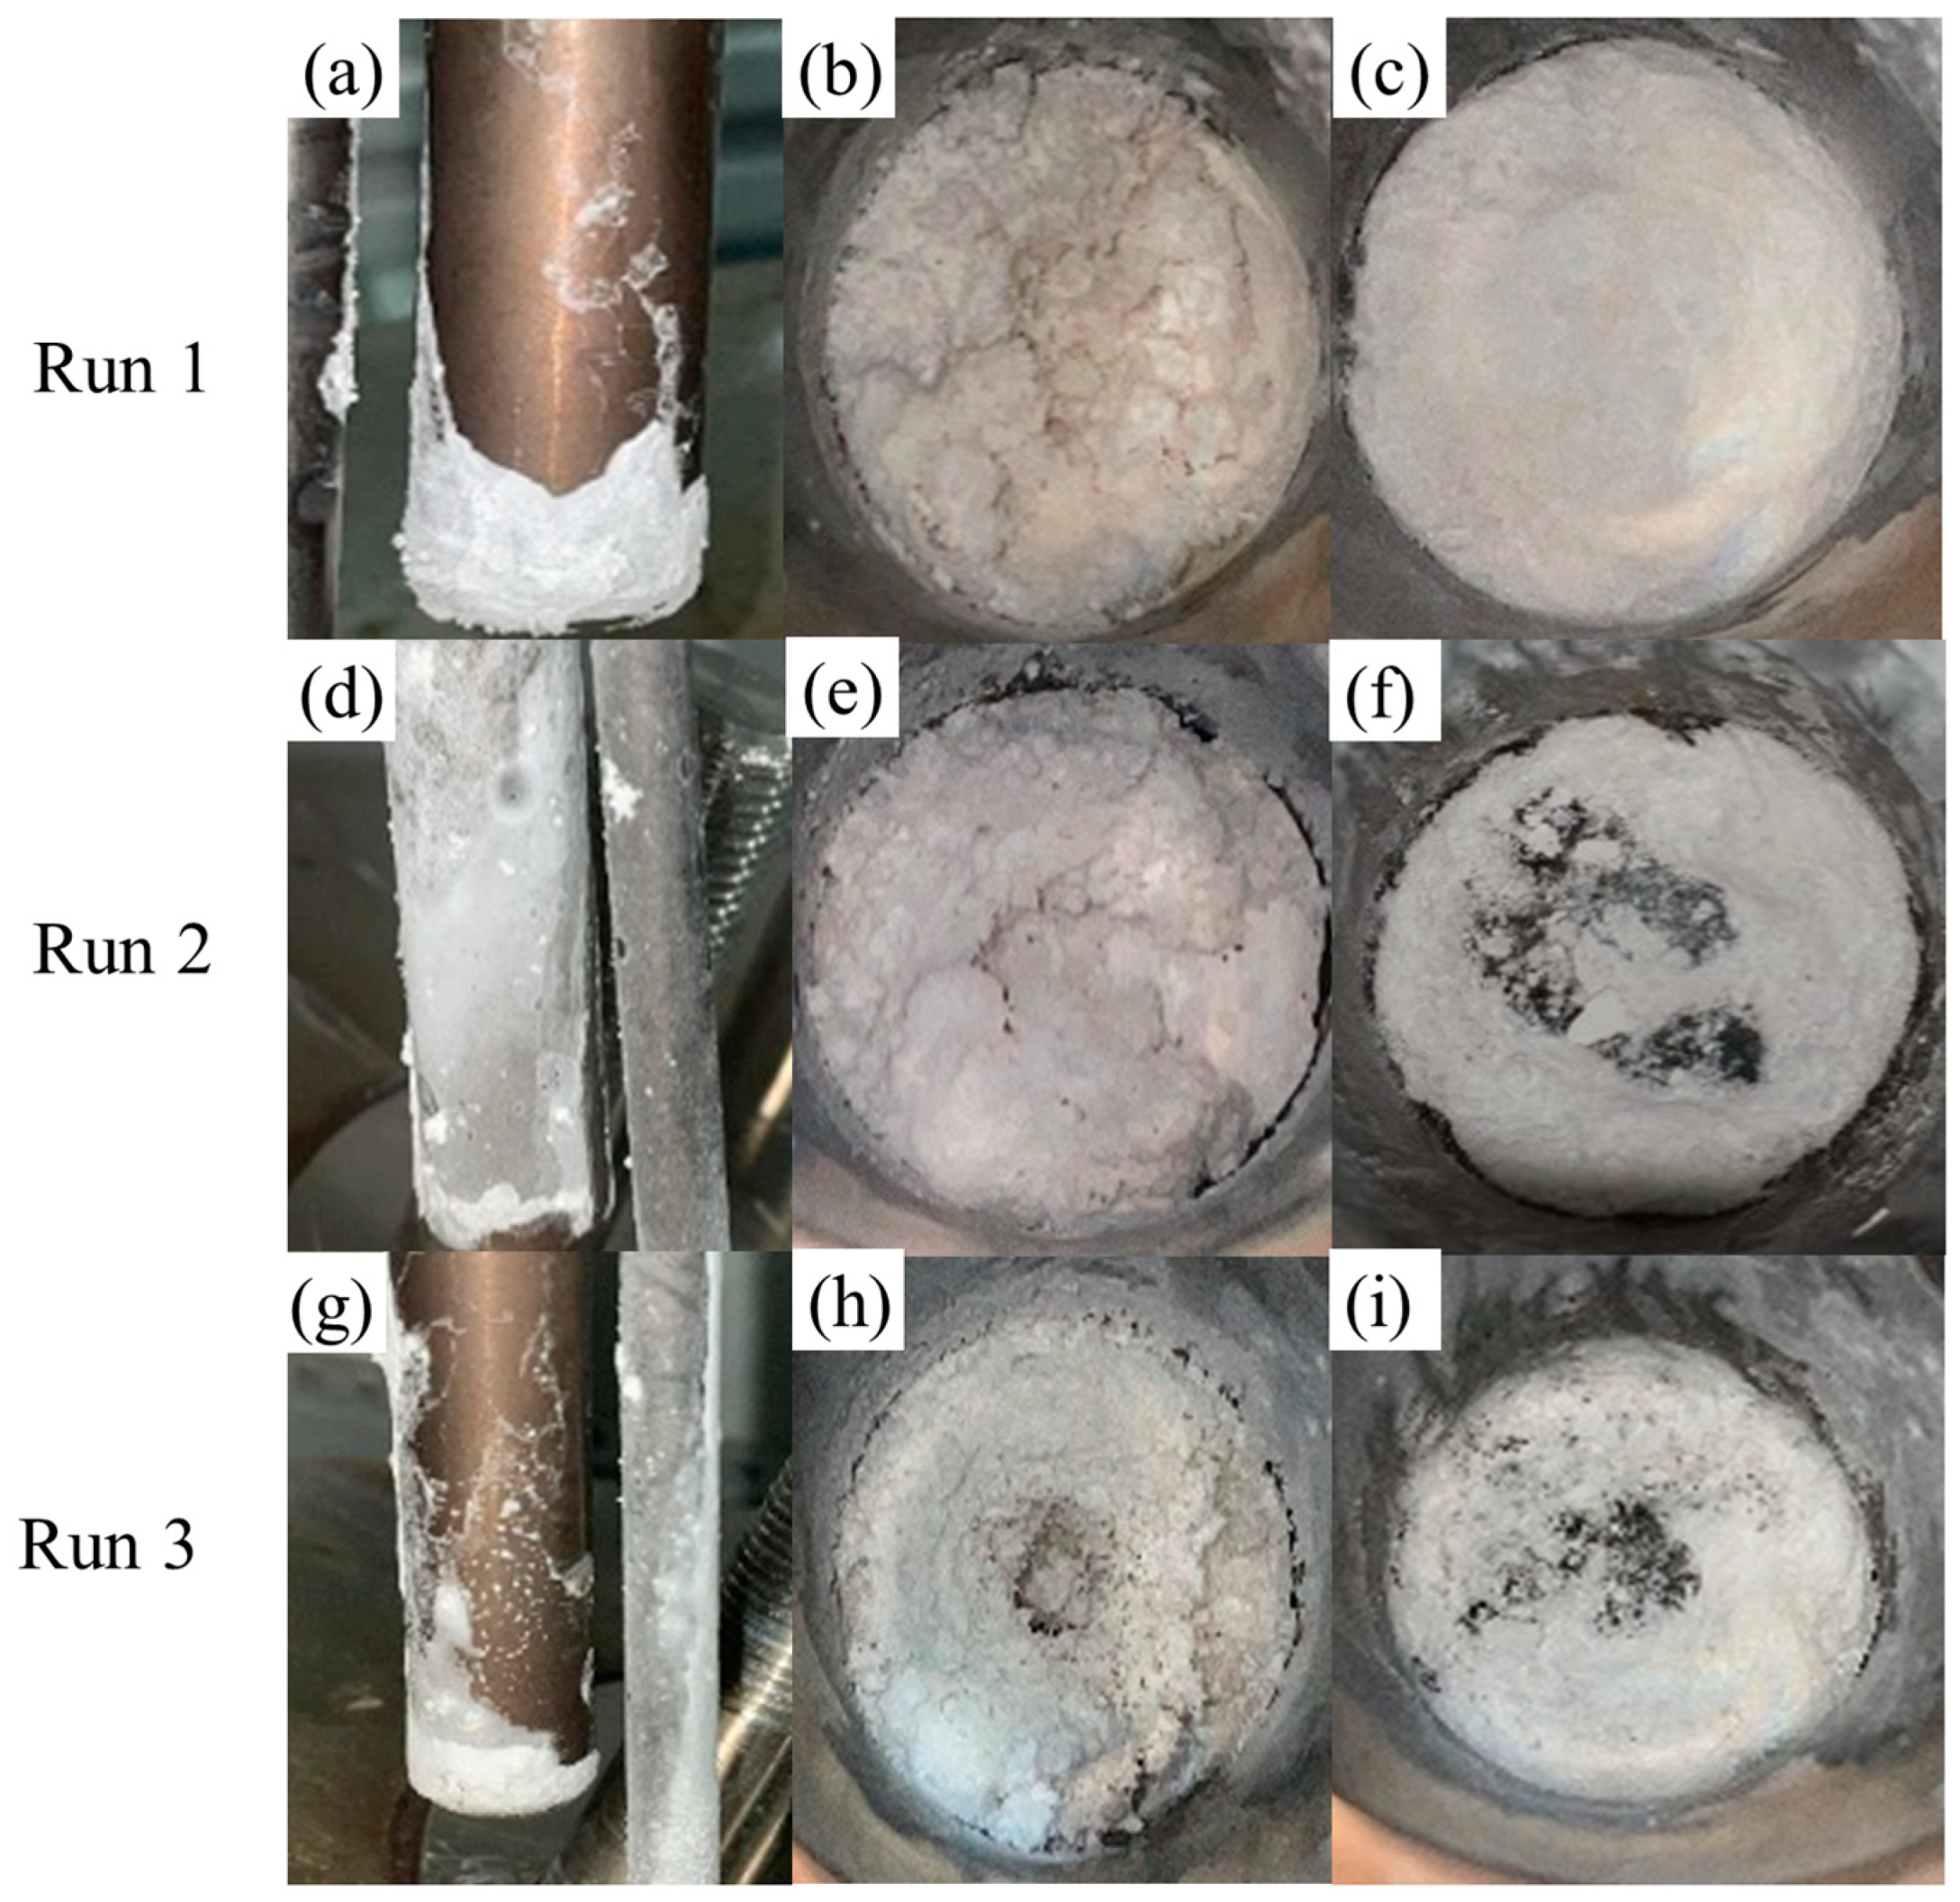
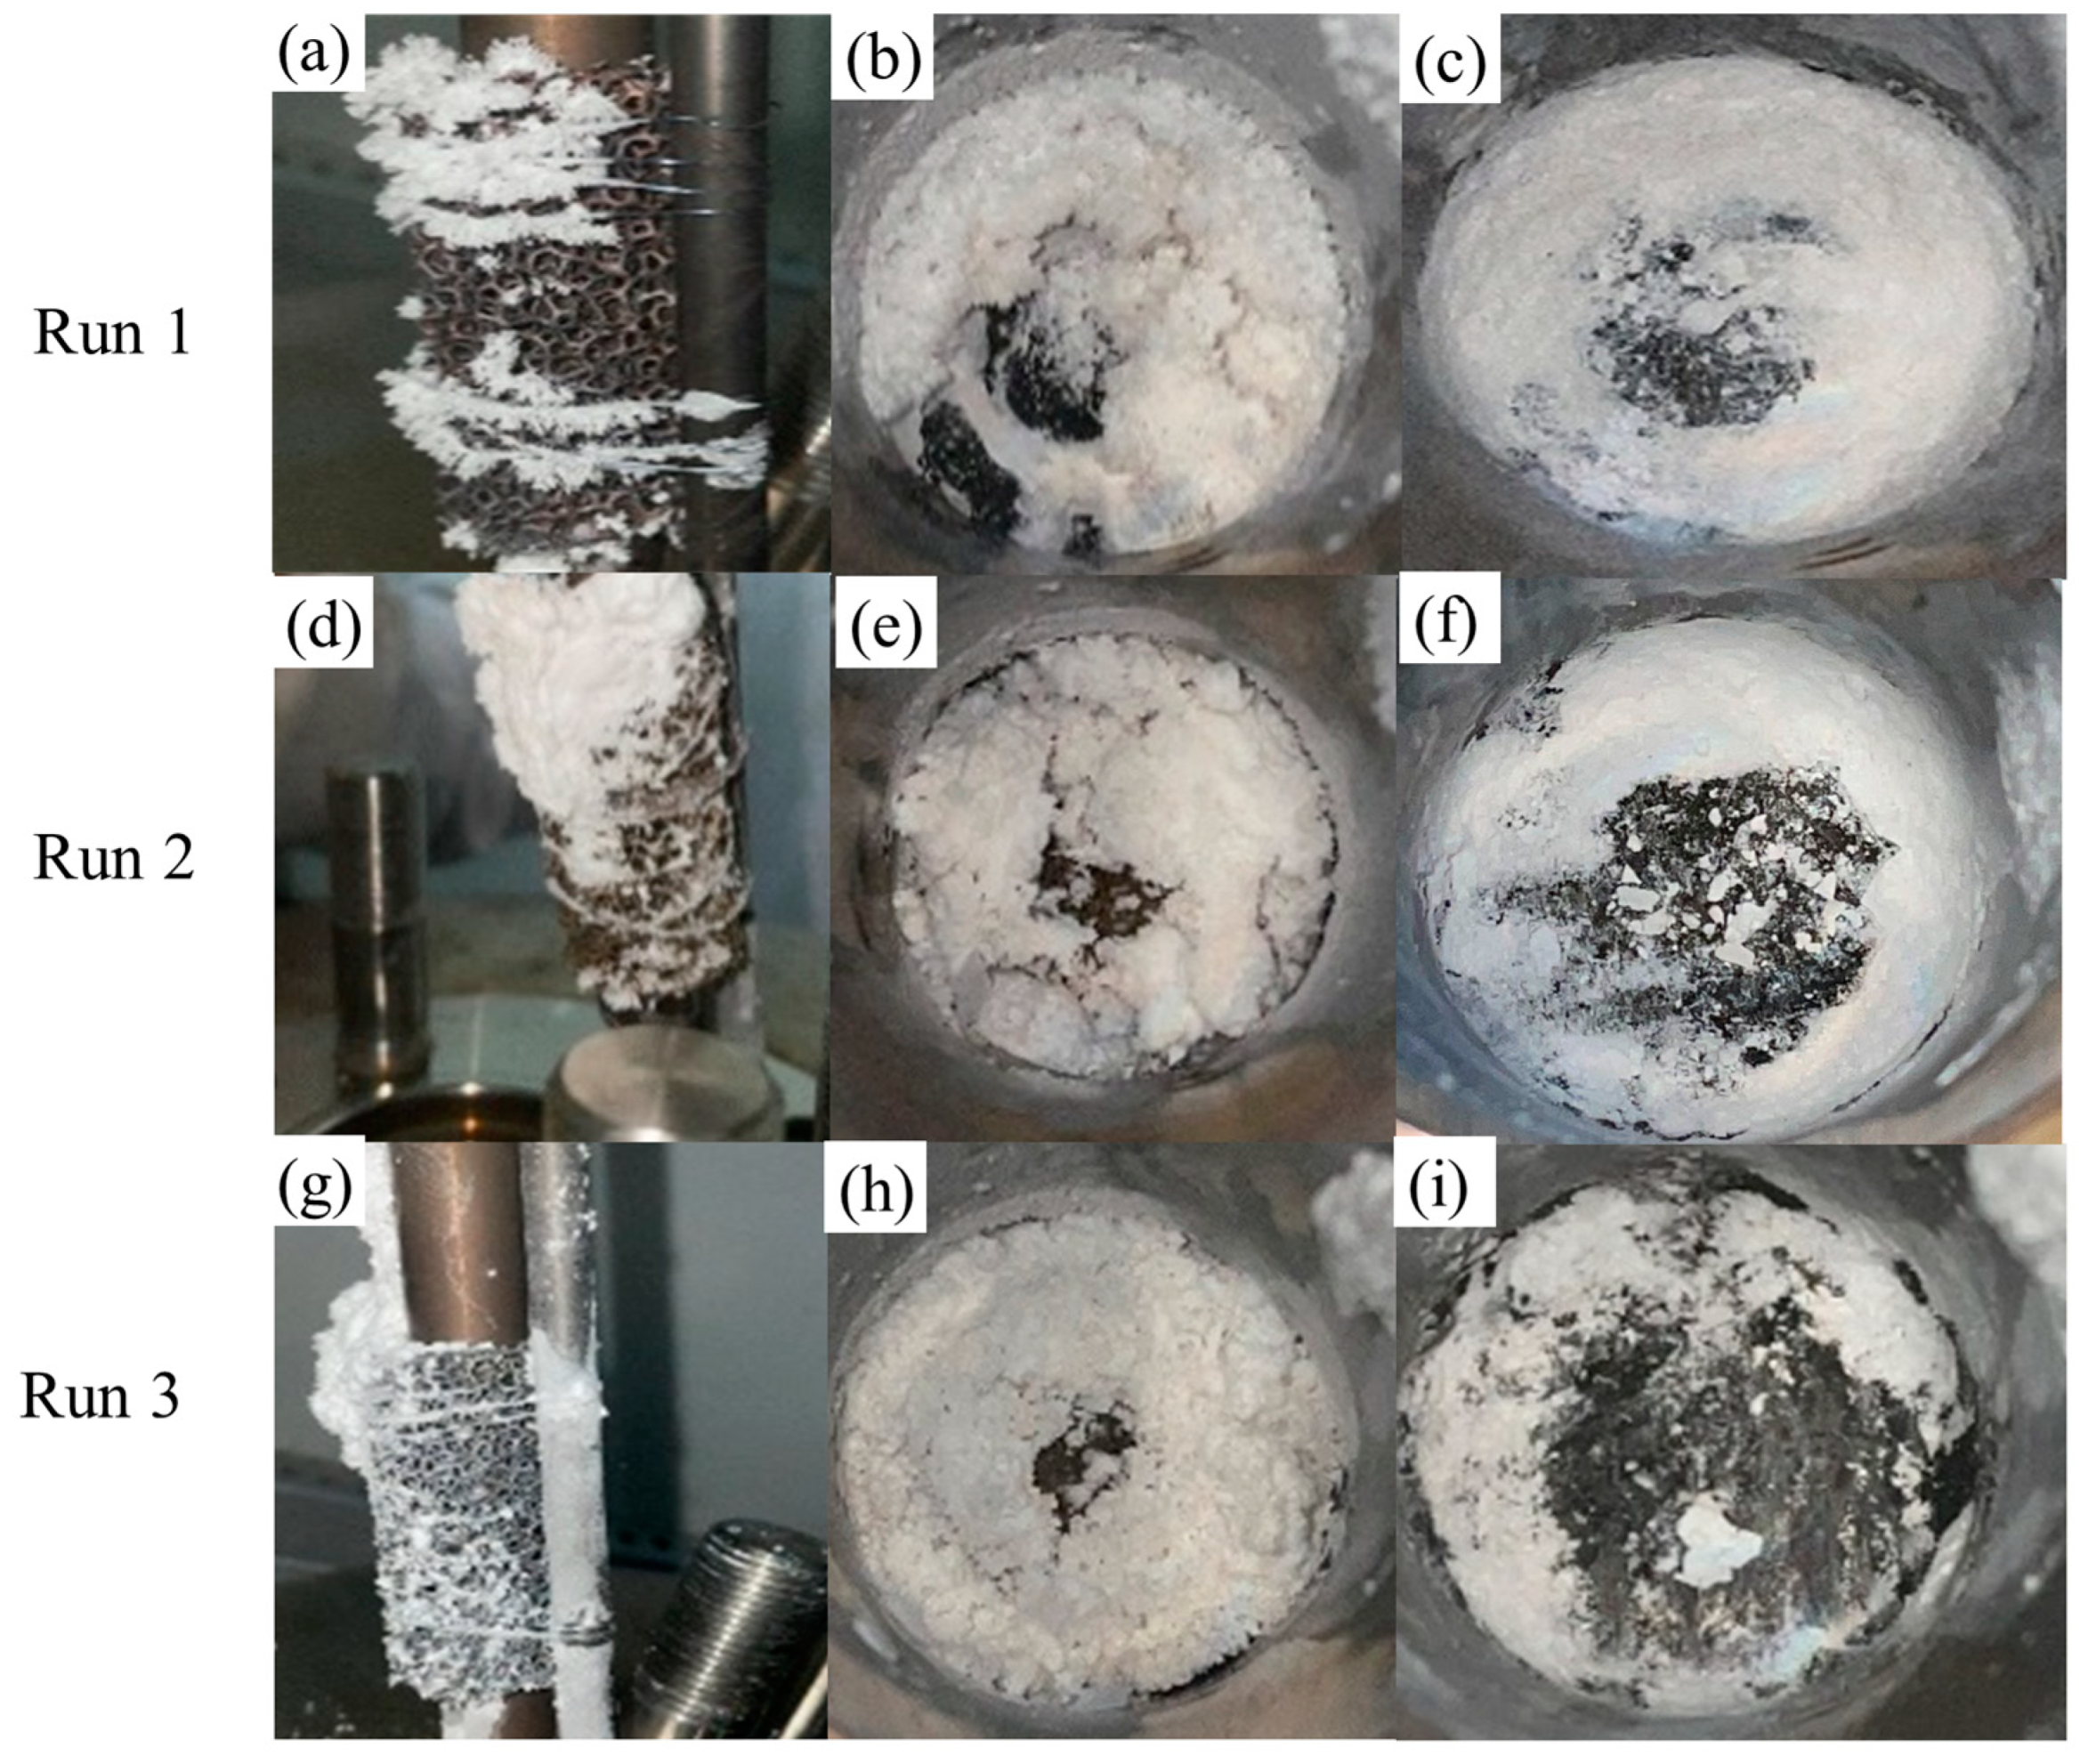
4.2. Results of Na2SO4 Salt Deposition Experiments
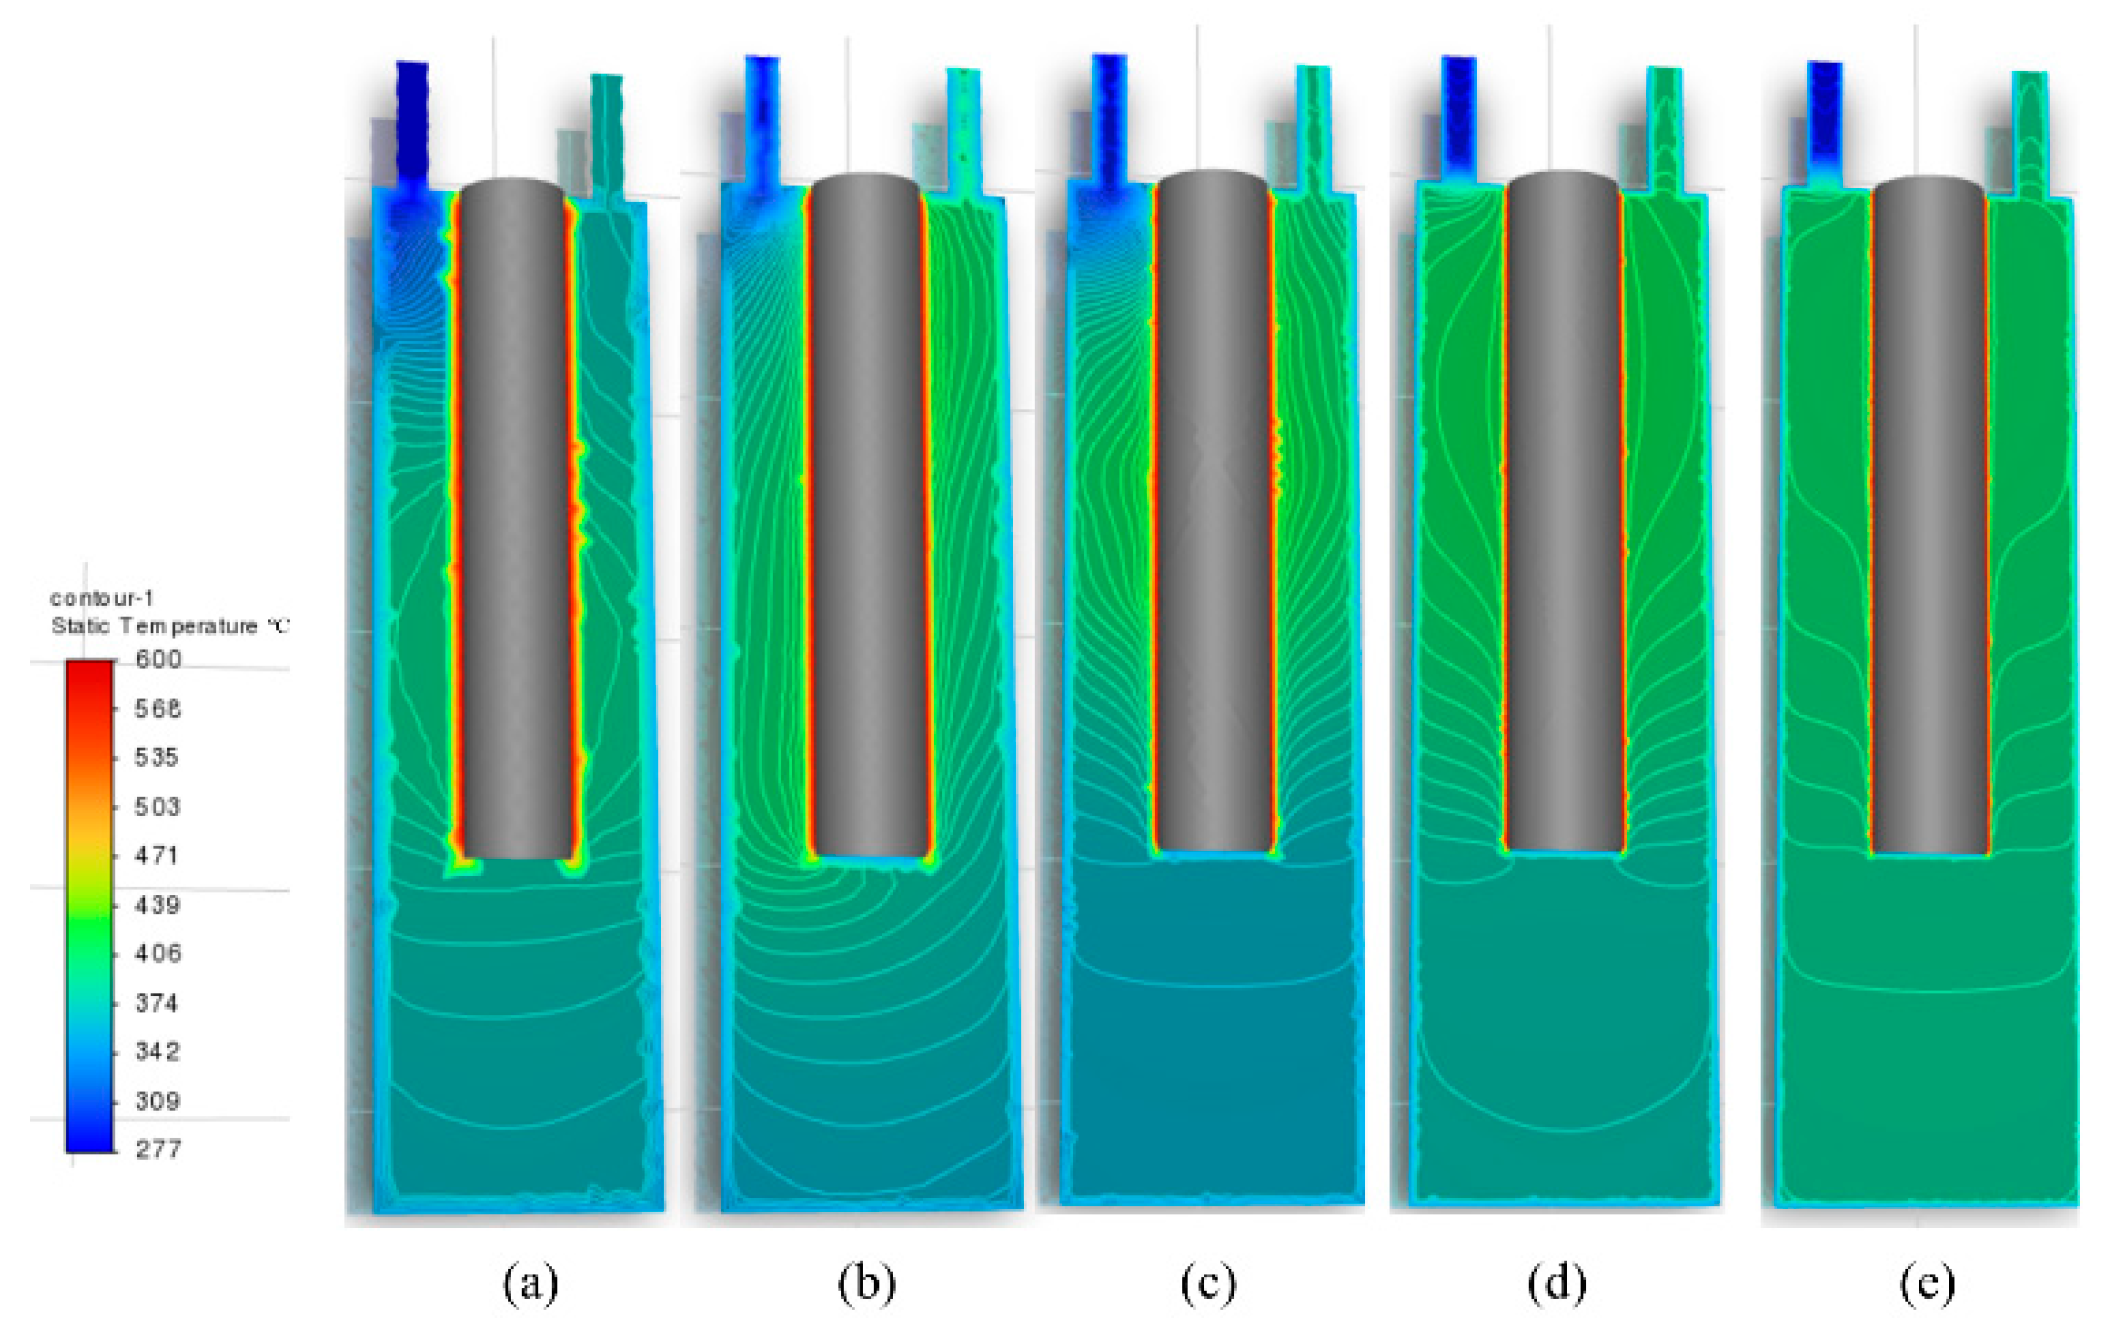
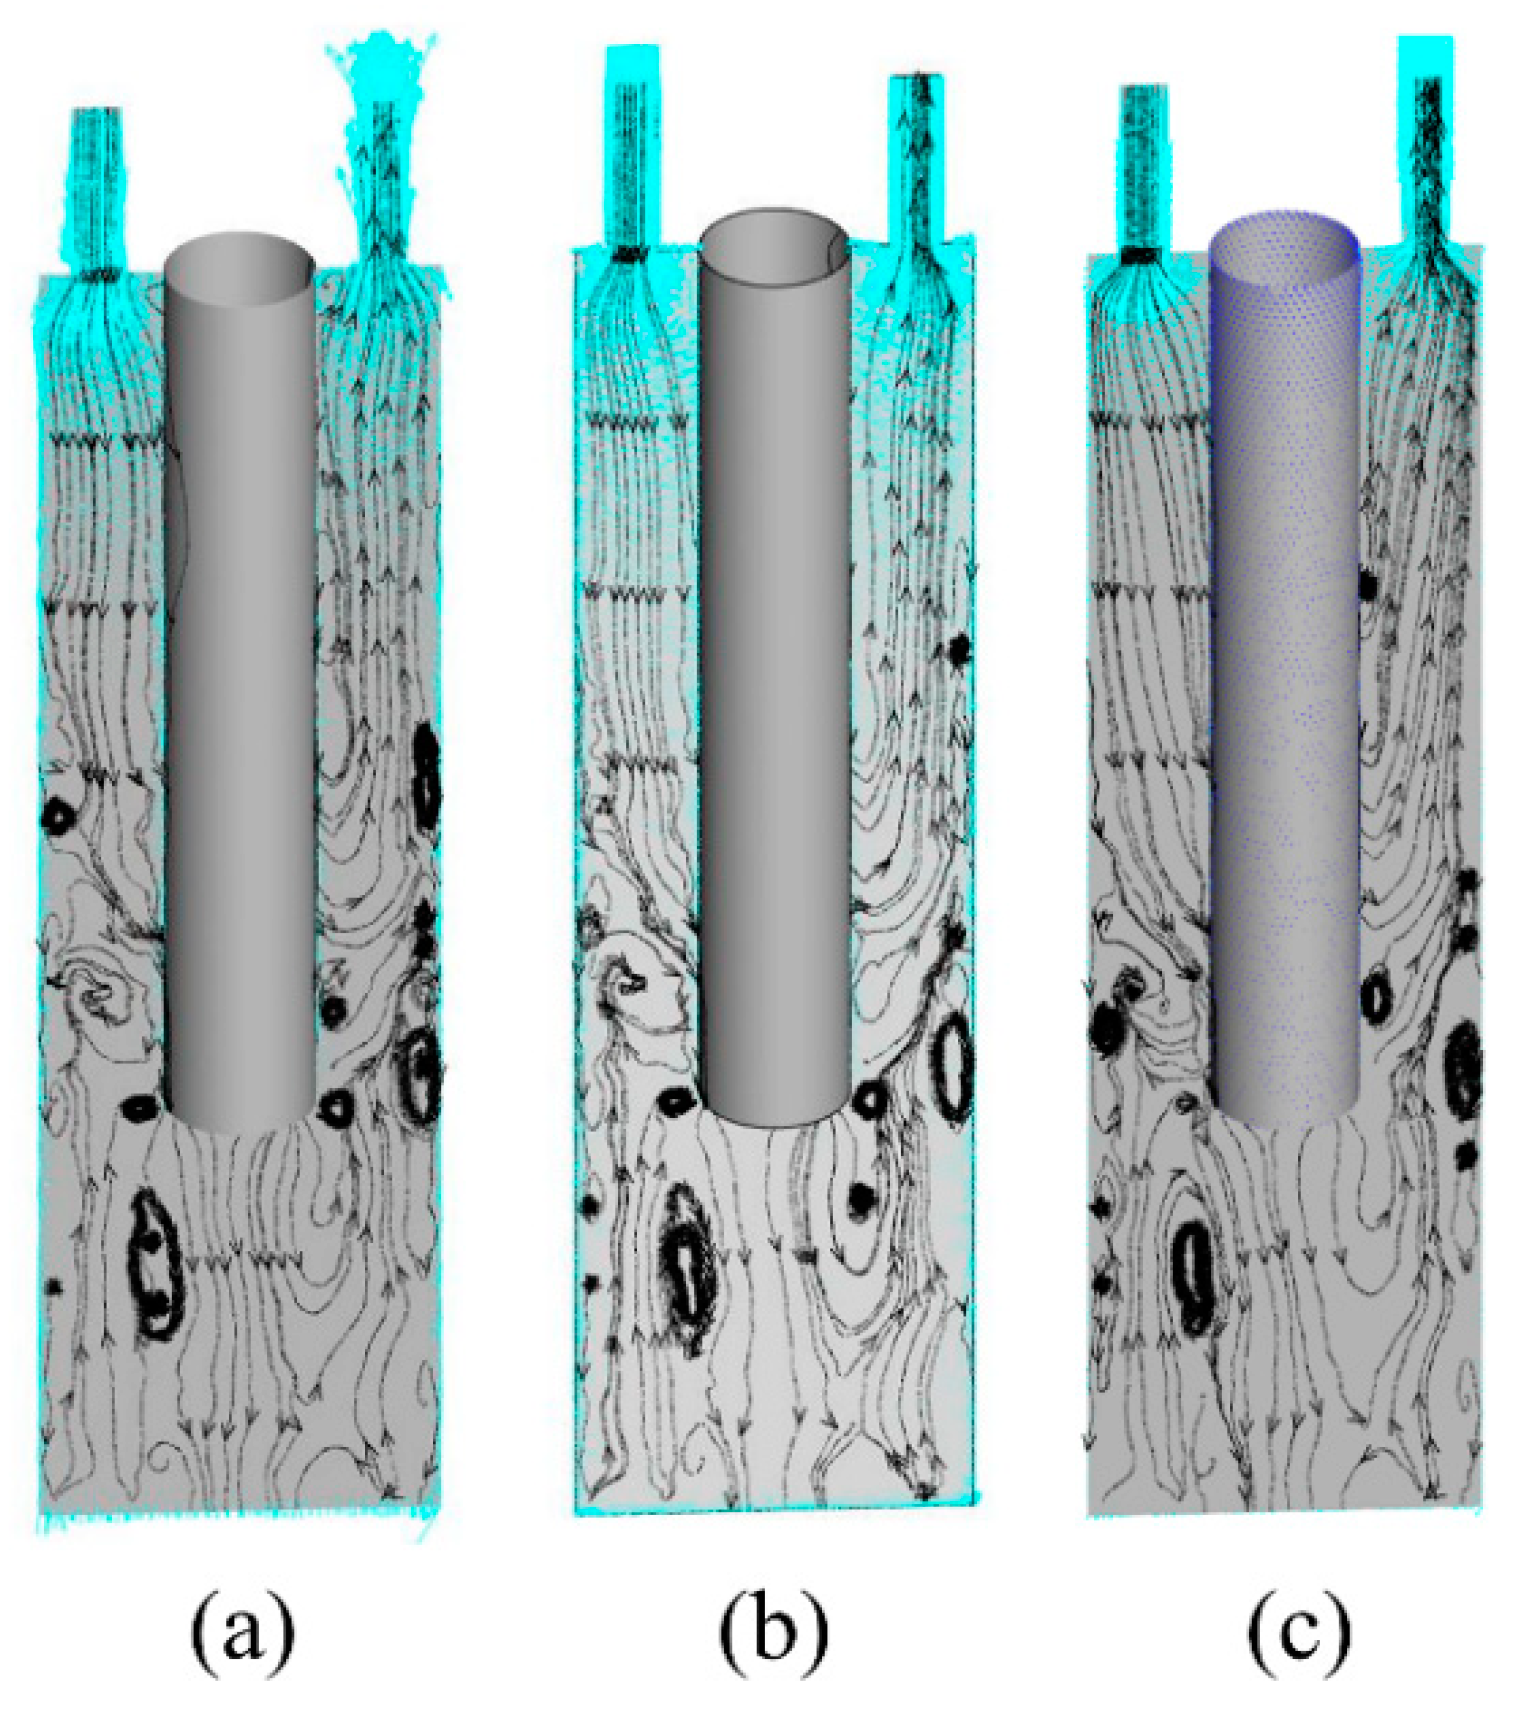
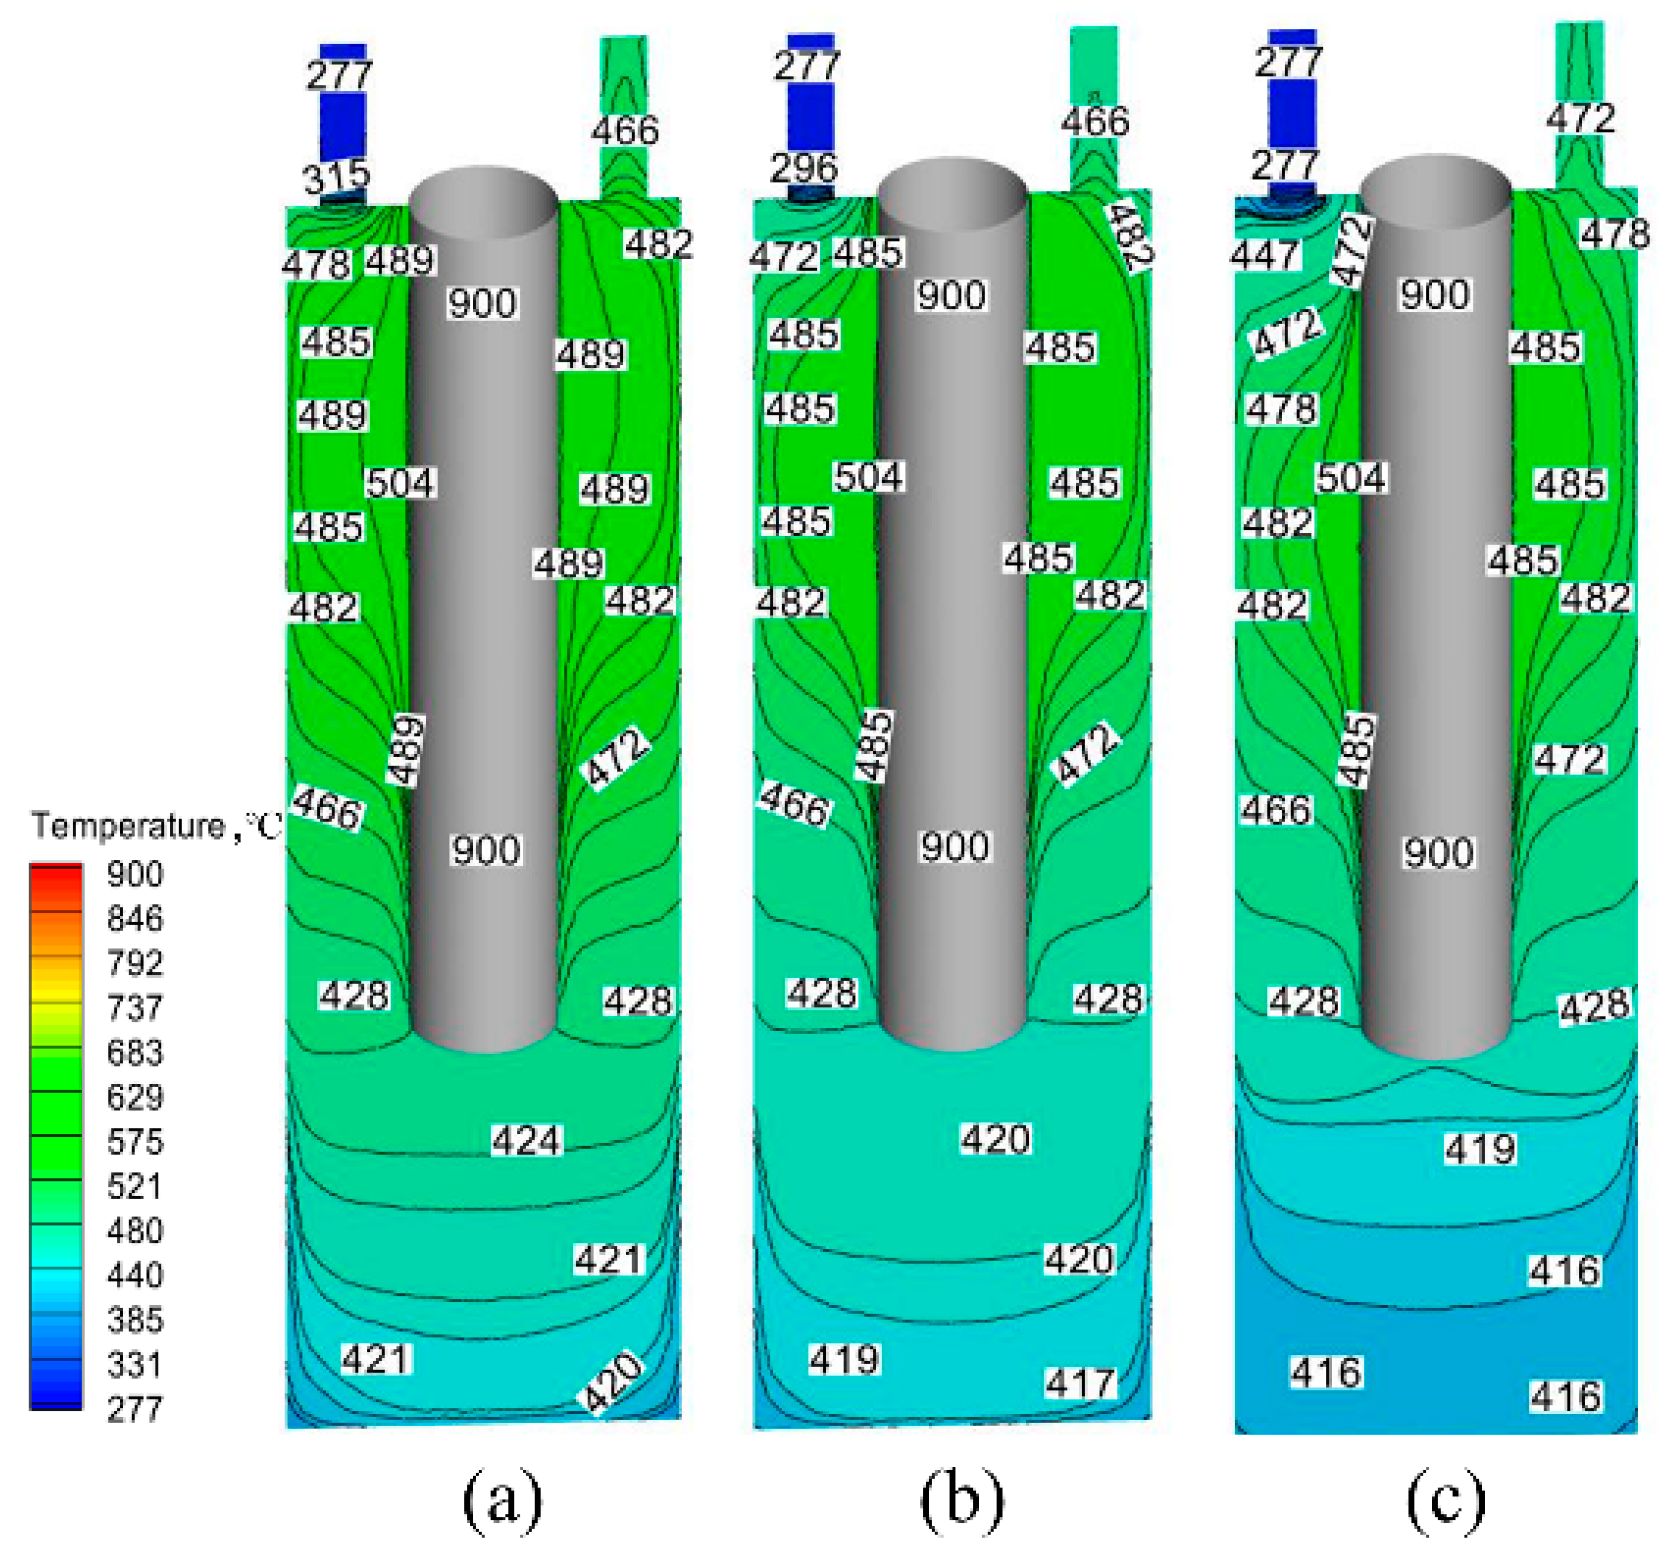
4.3. Numerical Simulation Results
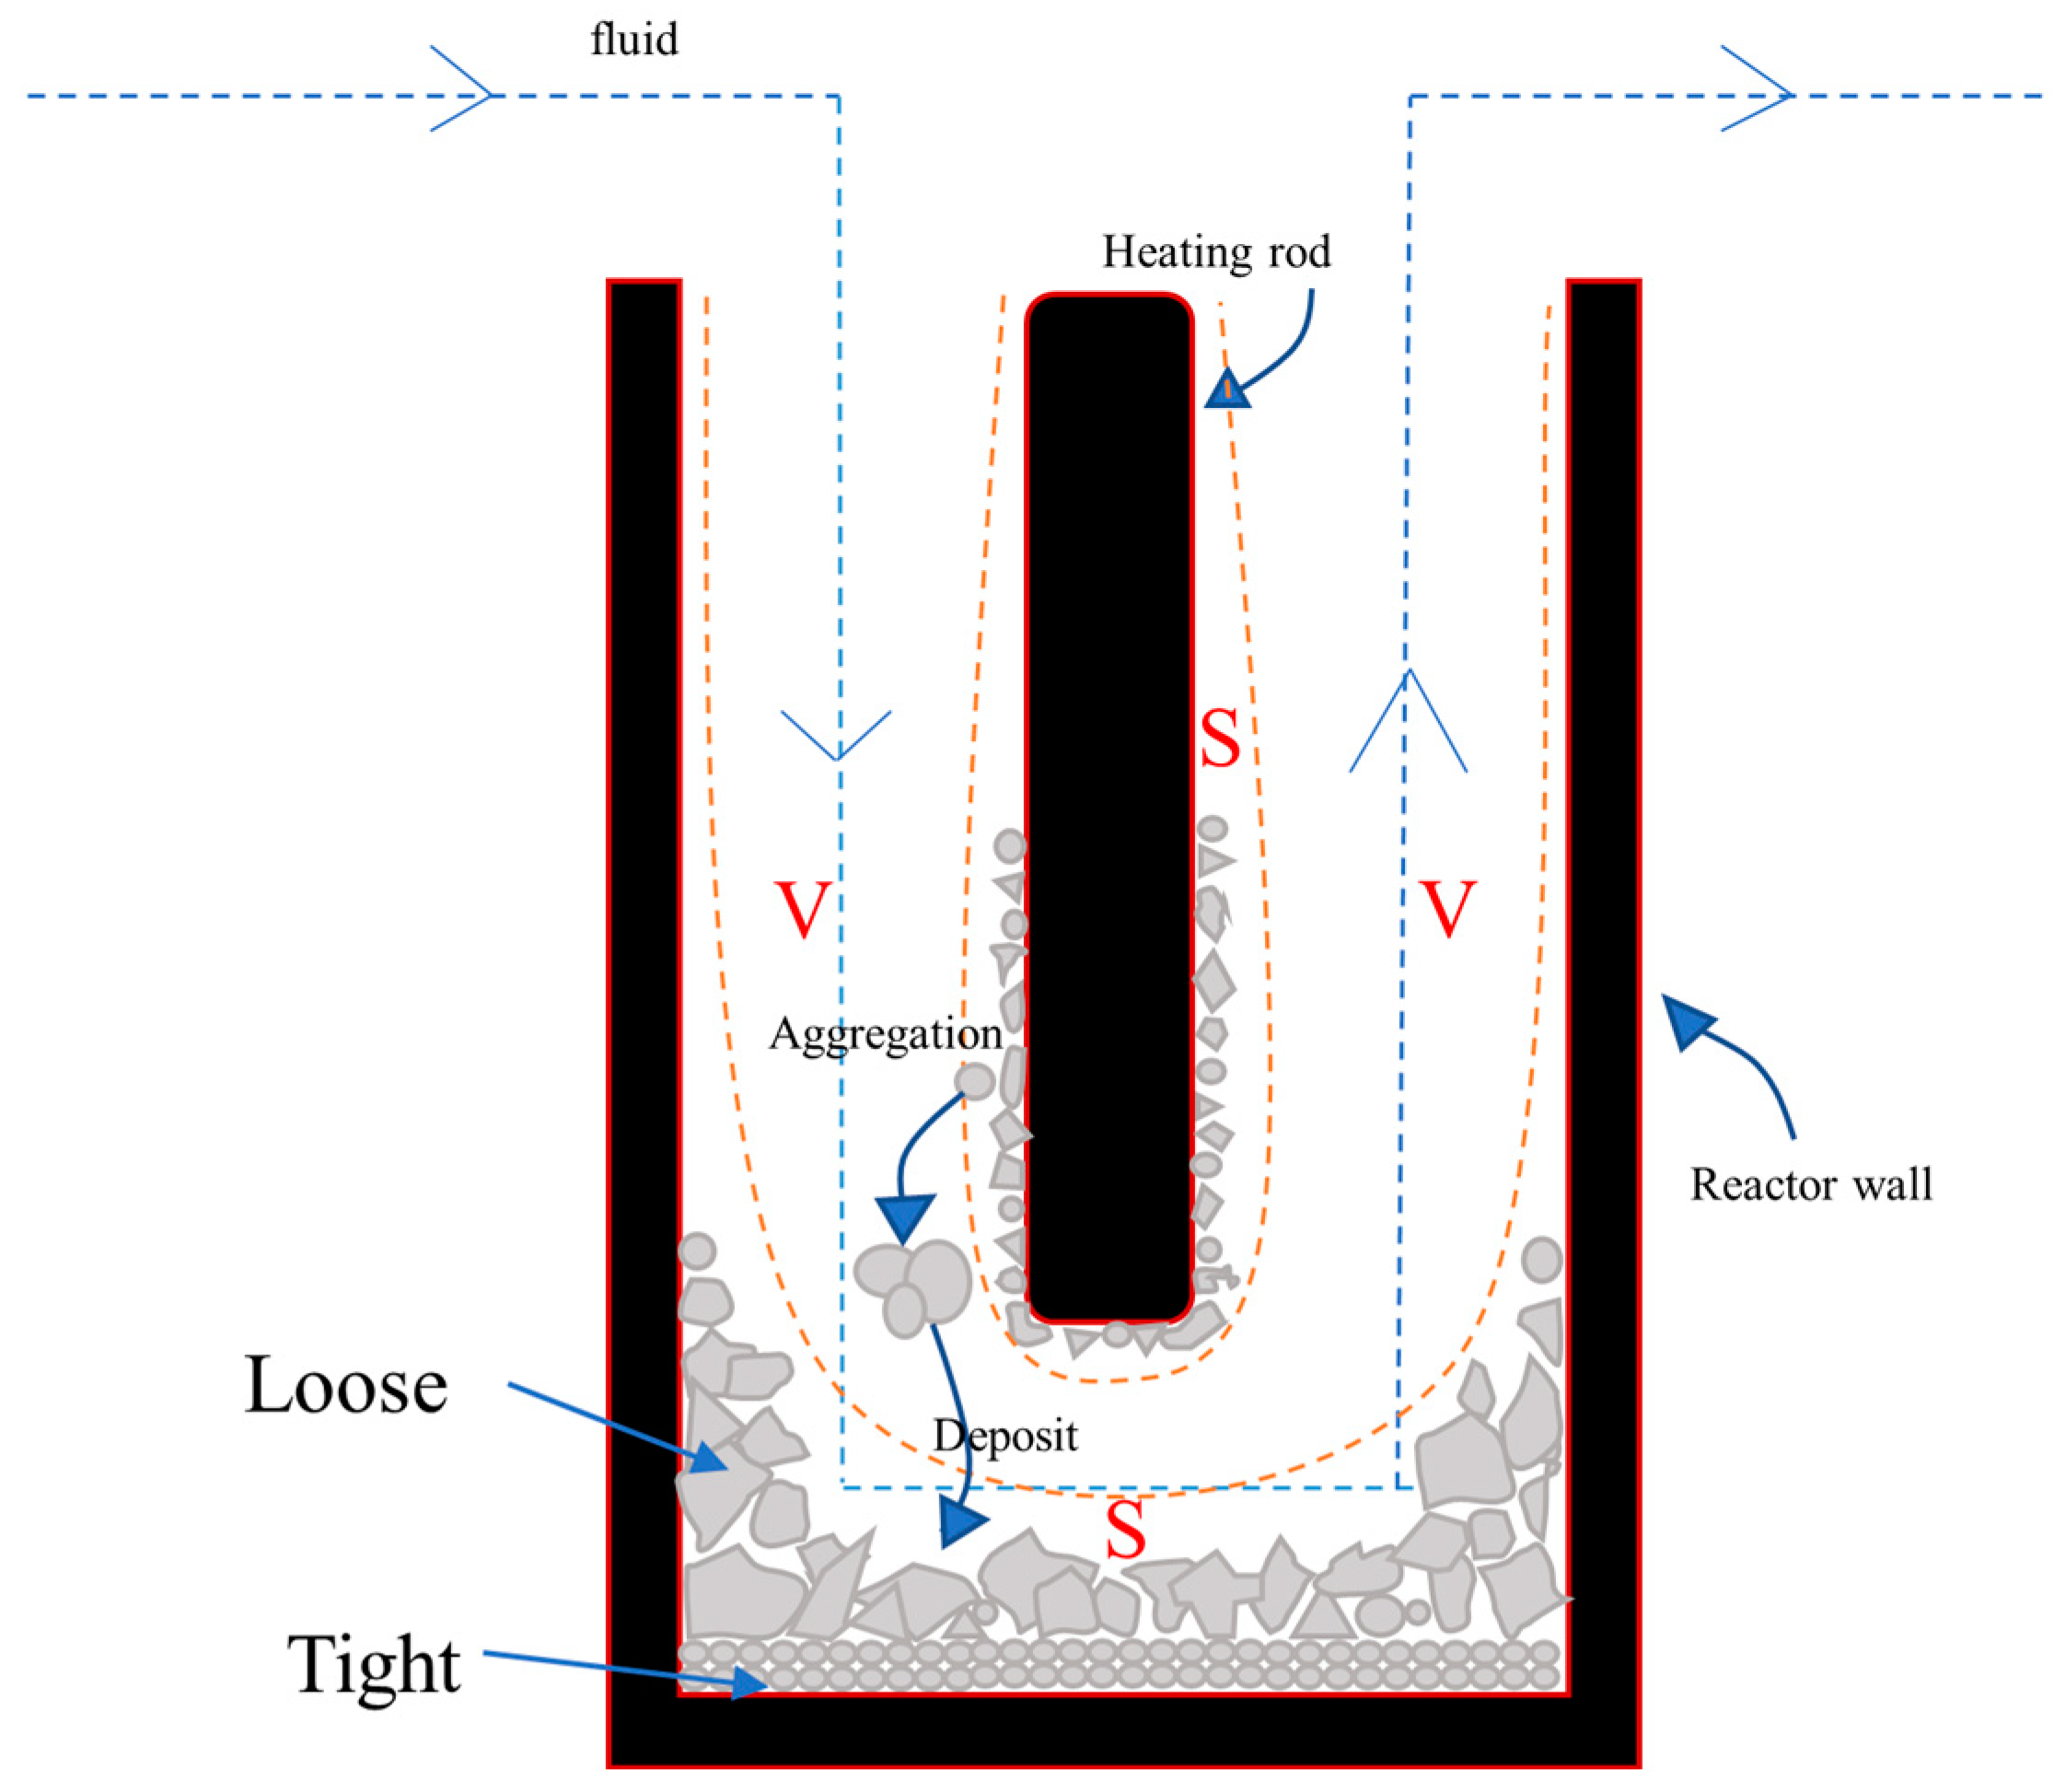
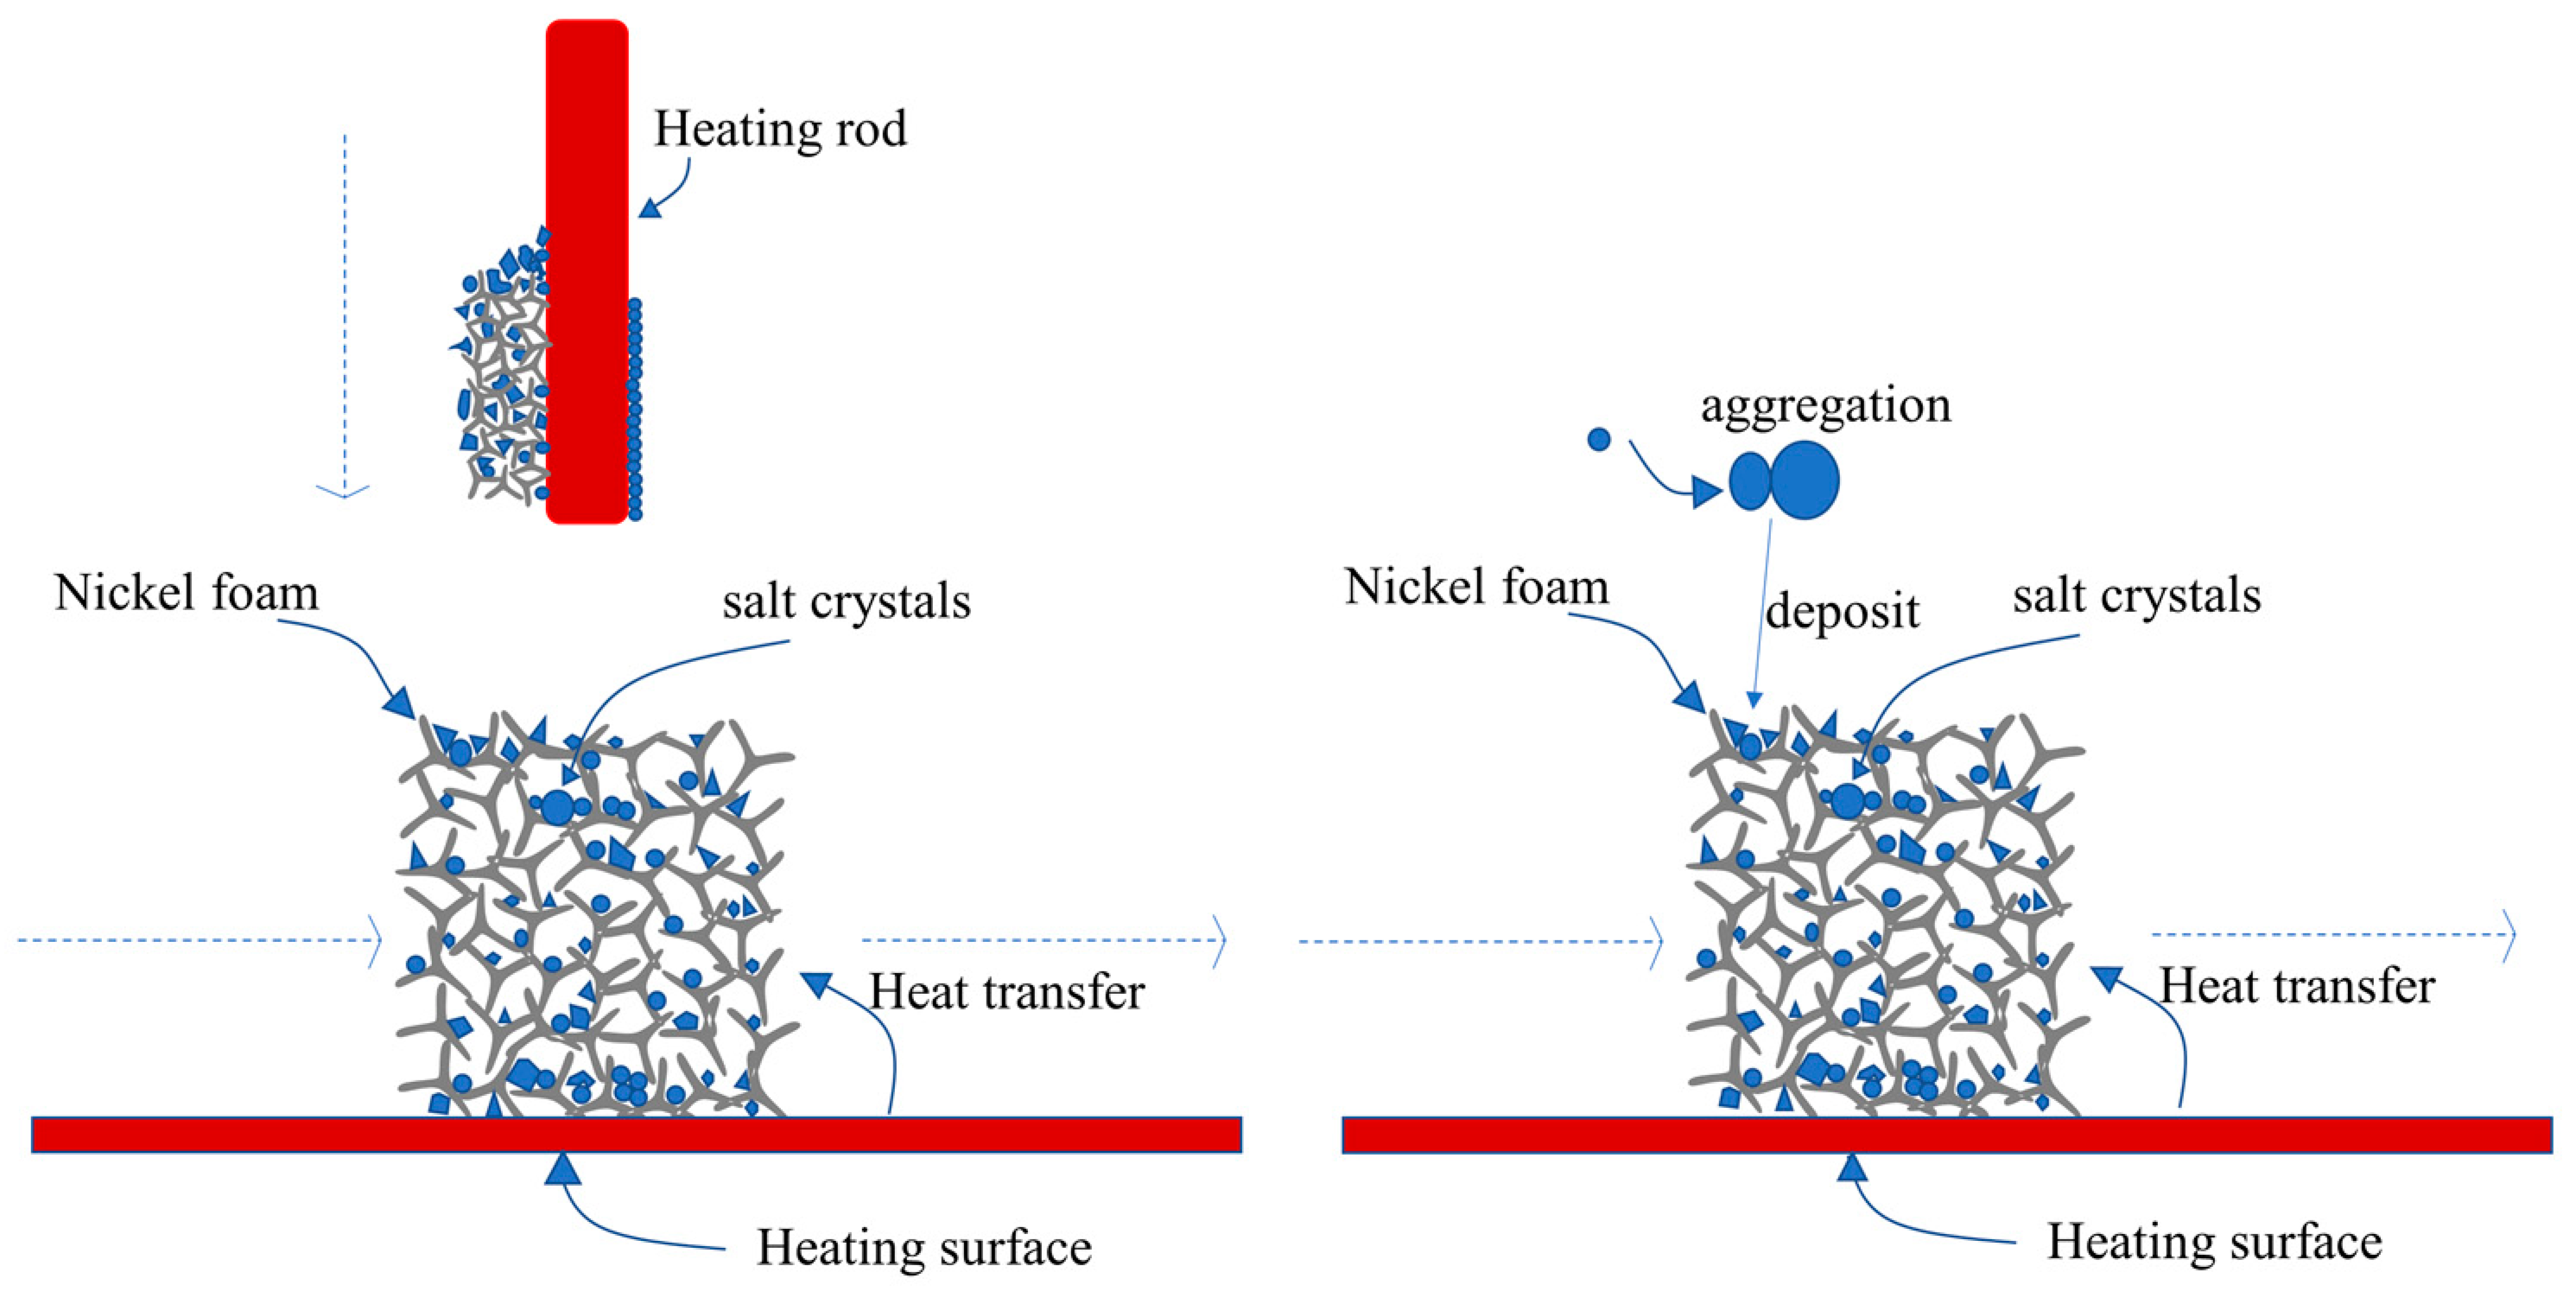
4.4. Analysis of the Mechanism of Salt Deposition
5. Conclusions
Author Contributions
Funding
Data Availability Statement
Conflicts of Interest
References
- Leusbrock, I.; Metz, S.J.; Rexwinkel, G.; Versteeg, G.F. Quantitative approaches for the description of solubilities of inorganic compounds in near-critical and supercritical water. J. Supercrit. Fluids 2008, 47, 117–127. [Google Scholar] [CrossRef] [Green Version]
- Deguchi, S.; Tsujii, K. Supercritical water: A fascinating medium for soft matter. Soft Matter 2007, 3, 797–803. [Google Scholar] [CrossRef] [PubMed]
- Marrone, P.A. Supercritical water oxidation—Current status of full-scale commercial activity for waste destruction. J. Supercrit. Fluids 2013, 79, 283–288. [Google Scholar] [CrossRef]
- Schmieder, H.; Abeln, J. Supercritical Water Oxidation: State of the Art. Chem. Eng. Technol. 1999, 22, 903–908. [Google Scholar] [CrossRef]
- Marrone, P.A.; Hodes, M.; Smith, K.A.; Tester, J.W. Salt precipitation and scale control in supercritical water oxidation—Part B: Commercial/full-scale applications. J. Supercrit. Fluids 2004, 29, 289–312. [Google Scholar] [CrossRef]
- Koda, S. Oxidation reactions of solid carbonaceous and resinous substances in supercritical water. J. Supercrit. Fluids 2009, 47, 400–406. [Google Scholar] [CrossRef]
- Loppinet-Serani, A.; Aymonier, C.; Cansell, F. Supercritical water for environmental technologies. J. Chem. Technol. Biotechnol. 2010, 85, 583–589. [Google Scholar] [CrossRef]
- Odu, S.O.; van der Ham, A.G.J.; Metz, S.; Kersten, S.R.A. Design of a Process for Supercritical Water Desalination with Zero Liquid Discharge. Ind. Eng. Chem. Res. 2015, 54, 5527–5535. [Google Scholar] [CrossRef]
- van Wyk, S.; van der Ham, A.G.J.; Kersten, S.R.A. Analysis of the energy consumption of supercritical water desalination (SCWD). Desalination 2020, 474, 114189. [Google Scholar] [CrossRef]
- van Wyk, S.; van der Ham, A.G.J.; Kersten, S.R.A. Potential of supercritical water desalination (SCWD) as zero liquid discharge (ZLD) technology. Desalination 2020, 495, 114593. [Google Scholar] [CrossRef]
- Feng, W.; van der Kooi, H.J.; de Swaan Arons, J. Biomass conversions in subcritical and supercritical water: Driving force, phase equilibria, and thermodynamic analysis. Chem. Eng. Process. Process Intensif. 2004, 43, 1459–1467. [Google Scholar] [CrossRef]
- Abdpour, S.; Santos, R.M. Recent advances in heterogeneous catalysis for supercritical water oxidation/gasification processes: Insight into catalyst development. Process Saf. Environ. Prot. 2021, 149, 169–184. [Google Scholar] [CrossRef]
- Matsumura, Y.; Minowa, T.; Potic, B.; Kersten, S.; Prins, W.; Vanswaaij, W.; Vandebeld, B.; Elliott, D.; Neuenschwander, G.; Kruse, A. Biomass gasification in near- and super-critical water: Status and prospects. Biomass Bioenergy 2005, 29, 269–292. [Google Scholar] [CrossRef]
- Hayashi, H.; Hakuta, Y. Hydrothermal Synthesis of Metal Oxide Nanoparticles in Supercritical Water. Materials 2010, 3, 3794–3817. [Google Scholar] [CrossRef] [Green Version]
- Ye, N.; Yan, T.; Jiang, Z.; Wu, W.; Fang, T. A review: Conventional and supercritical hydro/solvothermal synthesis of ultrafine particles as cathode in lithium battery. Ceram Int. 2018, 44, 4521–4537. [Google Scholar] [CrossRef]
- Yoko, A.; Seong, G.; Tomai, T.; Adschiri, T. Continuous Flow Synthesis of Nanoparticles Using Supercritical Water: Process Design, Surface Control, and Nanohybrid Materials. Kona Powder Part J. 2020, 37, 28–41. [Google Scholar] [CrossRef] [Green Version]
- Pietrzak, K.; Krstulovic, N.; Blazeka, D.; Car, J.; Malinowski, S.; Wardak, C. Metal oxide nanoparticles as solid contact in ion-selective electrodes sensitive to potassium ions. Talanta 2022, 243, 123335. [Google Scholar] [CrossRef]
- Amy, G.; Ghaffour, N.; Li, Z.Y.; Francis, L.; Linares, R.V.; Missimer, T.; Lattemann, S. Membrane-based seawater desalination: Present and future prospects. Desalination 2017, 401, 16–21. [Google Scholar] [CrossRef]
- Lefebvre, O.; Moletta, R. Treatment of organic pollution in industrial saline wastewater: A literature review. Water Res. 2006, 40, 3671–3682. [Google Scholar] [CrossRef]
- Goh, P.S.; Zulhairun, A.K.; Ismail, A.F.; Hilal, N. Contemporary antibiofouling modifications of reverse osmosis desalination membrane: A review. Desalination 2019, 468, 114072. [Google Scholar] [CrossRef]
- Zhang, Y.; Wang, S.; Li, Y.; Zhang, J.; Xu, D.; Yang, C.; Yang, J.; Li, J.; Xu, T. Inorganic salts in sub-/supercritical water—Part A: Behavior characteristics and mechanisms. Desalination 2020, 496, 114674. [Google Scholar] [CrossRef]
- Leusbrock, I.; Metz, S.; Rexwinkel, G.; Versteeg, G. Solubility of 1:1 Alkali Nitrates and Chlorides in Near-Critical and Supercritical Water. Chem. Eng. 2009, 54, 3215–3223. [Google Scholar] [CrossRef] [Green Version]
- Rogak, S.N.; Teshima, P. Deposition of sodium sulfate in a heated flow of supercritical water. AIChE J. 1999, 45, 240–247. [Google Scholar] [CrossRef]
- Yang, J.; Wang, S.; Li, Y.; Tang, X.; Wang, Y.; Xu, D.; Guo, Y. Effect of salt deposit on corrosion behavior of Ni-based alloys and stainless steels in supercritical water. J. Supercrit. Fluids 2019, 152, 104570. [Google Scholar] [CrossRef]
- Xu, D.; Huang, C.; Wang, S.; Lin, G.; Guo, Y. Salt deposition problems in supercritical water oxidation. Chem. Eng. J. 2015, 279, 1010–1022. [Google Scholar] [CrossRef]
- Dell’Orco, P.; Eaton, H.; Reynolds, T.; Buelow, S. The solubility of 1:1 nitrate electrolytes in supercritical water. J. Supercrit. Fluids 1995, 8, 217–227. [Google Scholar] [CrossRef]
- Yang, J.Q.; Wang, S.Z.; Li, Y.H.; Xu, D.H. Under-deposit corrosion of Ni-based alloy 825 and Fe-Ni based alloy 800 in supercritical water oxidation environment. Corros. Sci. 2020, 167, 108493. [Google Scholar] [CrossRef]
- Li, W.G.; Yu, Z.B.; Wang, Y.; Li, Y.L. Heat transfer of supercritical carbon dioxide in a tube-in-tube heat exchanger-a CFD study. J. Supercrit. Fluid. 2022, 181, 105493. [Google Scholar] [CrossRef]
- Demoisson, F.; Ariane, M.; Leybros, A.; Muhr, H.; Bernard, F. Design of a reactor operating in supercritical water conditions using CFD simulations. Examples of synthesized nanomaterials. J. Supercrit. Fluid. 2011, 58, 371–377. [Google Scholar] [CrossRef]
- Nadimpalli, N.K.V.; Bandyopadhyaya, R.; Runkana, V. A coupled CFD-PBM and thermodynamic analysis of continuous supercritical hydrothermal synthesis of nanoparticles. J. Supercrit. Fluid. 2018, 136, 164–179. [Google Scholar] [CrossRef]
- Leybros, A.; Piolet, R.; Ariane, M.; Muhr, H.; Bernard, F.; Demoisson, F. CFD simulation of ZnO nanoparticle precipitation in a supercritical water synthesis reactor. J. Supercrit. Fluid. 2012, 70, 17–26. [Google Scholar] [CrossRef]
- Voisin, T.; Erriguible, A.; Philippot, G.; Ballenghien, D.; Mateos, D.; Cansell, F.; Iversen, B.B.; Aymonier, C. Investigation of the precipitation of Na2SO4 in supercritical water. Chem. Eng. Sci. 2017, 174, 268–276. [Google Scholar] [CrossRef]
- Voisin, T.; Erriguible, A.; Aubert, G.; Aymonier, C. Aggregation of Na2SO4 Nanocrystals in Supercritical Water. Ind. Eng. Chem. Res. 2018, 57, 2376–2384. [Google Scholar] [CrossRef]
- Voisin, T.; Erriguible, A.; Aymonier, C. Influence of multiphasic systems on salt(s) solubility in supercritical water: The case of NaCl and NaCl-Na2SO4. J. Supercrit. Fluids 2019, 152, 104567. [Google Scholar] [CrossRef]
- Hodes, M.; Marrone, P.A.; Hong, G.T.; Smith, K.A.; Tester, J.W. Salt precipitation and scale control in supercritical water oxidation—Part A: Fundamentals and research. J. Supercrit. Fluids 2004, 29, 265–288. [Google Scholar] [CrossRef]


| Chemical Reagent | Source | Mass Fraction Purity | Purification Method | CAS No. |
|---|---|---|---|---|
| Sodium sulfate anhydrous | Aladdin (Shanghai Aladdin Biochemical Technology Co., Ltd., Shanghai, China) | AR, 99% | None | 7757-82-6 |
| deionized water | Shanghai Huazhen Technology Co., Ltd., Shanghai, China | Conductivity < 1.75 μS/cm | None | 7732-18-5 |
| Cells | Faces | Nodes | Partitions |
|---|---|---|---|
| 872,842 | 1,798,513 | 184,791 | 12 cell zones, 9 face zones |
| P/MPa | T/°C | Solubility of Na2SO4 (mmol/L) |
|---|---|---|
| 23 | 380 | 0.18 |
| 390 | 0.07 | |
| 400 | 0.06 | |
| 410 | 0.05 | |
| 420 | 0.04 | |
| 24 | 380 | 1.02 |
| 390 | 0.45 | |
| 400 | 0.35 | |
| 410 | 0.32 | |
| 420 | 0.26 | |
| 25 | 380 | 15.34 |
| 390 | 1.58 | |
| 400 | 1.00 | |
| 410 | 0.44 | |
| 420 | 0.33 |
| Run | P/MPa | T1 a/°C | T2 b/°C | T3 c/°C | Amount of Solution/L |
|---|---|---|---|---|---|
| 1 | 22.9 | 390 | 500 | 655–736 | 1.0 |
| 2 | 22.9 | 390 | 600 | 622.3–710.3 | 0.5 |
| 3 | 22.9 | 390 | 600 | 628.1–695.1 | 1.0 |
| Run | P/MPa | T1 a/°C | T2 b/°C | T3 c/°C | Amount of Solution/L |
|---|---|---|---|---|---|
| 1 | 22.9 | 390 | 600 | 608–690 | 0.5 |
| 2 | 22.9 | 390 | 600 | 637.8–673 | 0.75 |
| 3 | 22.9 | 390 | 600 | 627.7–706.8 | 1.0 |
Disclaimer/Publisher’s Note: The statements, opinions and data contained in all publications are solely those of the individual author(s) and contributor(s) and not of MDPI and/or the editor(s). MDPI and/or the editor(s) disclaim responsibility for any injury to people or property resulting from any ideas, methods, instructions or products referred to in the content. |
© 2023 by the authors. Licensee MDPI, Basel, Switzerland. This article is an open access article distributed under the terms and conditions of the Creative Commons Attribution (CC BY) license (https://creativecommons.org/licenses/by/4.0/).
Share and Cite
Zhu, Q.; Li, Z.; Song, Y.; Tong, Y.; Yang, T.; Cheng, Z. Effects of Superheated Surface on the Deposition Behavior of Na2SO4 in Supercritical Water. Processes 2023, 11, 1779. https://doi.org/10.3390/pr11061779
Zhu Q, Li Z, Song Y, Tong Y, Yang T, Cheng Z. Effects of Superheated Surface on the Deposition Behavior of Na2SO4 in Supercritical Water. Processes. 2023; 11(6):1779. https://doi.org/10.3390/pr11061779
Chicago/Turabian StyleZhu, Qiao, Zhe Li, Yafei Song, Yujun Tong, Tao Yang, and Zhenmin Cheng. 2023. "Effects of Superheated Surface on the Deposition Behavior of Na2SO4 in Supercritical Water" Processes 11, no. 6: 1779. https://doi.org/10.3390/pr11061779