Article

Experimental Investigation on Pressure-Control Characteristics of Liquid Hydrogen Tank Based on Active and Passive Thermodynamic Venting System Technology

China Academy of Launch Vehicle Technology, Beijing 100076, China
*
Author to whom correspondence should be addressed.
Processes 2023, 11(6), 1831; https://doi.org/10.3390/pr11061831
Submission received: 14 May 2023 / Revised: 11 June 2023 / Accepted: 14 June 2023 / Published: 16 June 2023
(This article belongs to the Special Issue Liquid Hydrogen Production and Application)

Abstract

:
Pressure control while minimizing the mass loss of liquid hydrogen is one of the key technologies required for the long-term storage of cryogenic propellants in microgravity in space, and the use of a thermodynamic venting system (TVS) has been considered as an effective means to solve this problem. In order to investigate the characteristics of pressure control by TVS technology, a cryogenic test platform for liquid hydrogen that integrated active and passive TVS was set up, a spray-bar exchanger and vapor-cooling screen were used to eliminate thermal stratification and realize the reuse of cold energy. Ten pressure-control tests using passive TVS (PTVS), mixing and active TVS (ATVS) strategies with heating powers of 0 W, 40 W and 80 W, were carried out. The single cycle time under different strategies, the effect of heating power on single cycle time, and the comparison of volume of the venting GH2 in different tests were analyzed in detail, the research showed that TVS technology could accurately control the pressure of cryogenic storage tanks within a predetermined range. An additional evaporation test was carried out using a direct venting method to compare with the above PTVS and ATVS tests, and the results showed that the venting volume of GH2 in unit time by the direct-venting method was close to that of the PTVS test with the heating power of 40 W, and the venting volume in unit time by the ATVS strategy was decreased by 87.3% compared to the direct-venting test.

1. Introduction

As the chemical propellant with the highest specific impulse at present, liquid hydrogen and oxygen will play a significant role in the future large-scale manned lunar landing, Mars exploration, and further deep space exploration [1]. The theoretical specific impulse of liquid hydrogen combined with liquid oxygen is up to 460 s, 35% higher than that of the normal-temperature propellant UDMH/NTO. Therefore, a propulsion system with liquid hydrogen and liquid oxygen can provide more flight power with less propellant [2]. In recent years, either in deep space exploration or earth–lunar transfers, higher requirements have been put forward for the application of cryogenic propellants. These space missions require the cryogenic propellant to not only meet the short-launch mission of a carrier rocket for several hours, but also meet the requirements of on-orbit missions of spacecraft lasting several months or even several years. In February 2022, the “List of Critical and Emerging Technologies” issued by the National Science and Technology Council of the United States included “cryogenic fluid management” into the field of space technology and systems for the first time [3]. The long term on-orbit storage and management technology for cryogenic propellants is one of the important and key technologies for future space development.
However, due to the physical characteristics of a low boiling point (20.18 K for liquid hydrogen, 90.19 K for liquid oxygen) and the ease with which it evaporates when heated, as well as the influence of space irradiation and heat transfer between the tank and solid components of the vehicle, the pressure of a cryogenic tank will gradually rise and exceed the upper limits of safe pressure if there are no other pressure-control measures, which indicates that the core problem of the long-term orbital storage of cryogenic propellants lies in the internal pressure control of the tank [4]. In the 1990s. NASA proposed the thermodynamics venting system (TVS), which consumed a small fraction of fluids to transfer the heat into the tank, eliminating the thermal stratification of cryogenic fluids through a spray bar to avoid entrainment of the liquid when exhausting, and ultimately achieving the purpose of controlling the tank pressure and propellant evaporation [5]. Many NASA technicians have carried out extensive theoretical and experimental research studies on ATVS.
Nguyen [6] developed a model using a lumped parameter method that could run a TVS workflow application. The simulation results showed that the calculated model was higher than the test results during the self-pressurization stage of the cryogenic tank. When the TVS system was used to control the tank pressure, the model prediction was in good agreement with the test results. After NASA built the Multipurpose Hydrogen Test Bed (MHTB) research platform, Candy [7] and Hastings [8] conducted a series of experiments using the platform, which included multiple tests under different conditions of heat leakage and filling rates. The results showed that the ullage pressure-fluctuation range of the liquid hydrogen tank can be effectively controlled by no more than 6.9 kPa. A TVS test bed was established at the French Centre national d’ etudes spatiales (CNRS), in which a spray head located in the upper gas phase zone replaced the traditional spray bar and was separated from the fluid heat-transfer structure [9,10]. In the experiment, NOVEC1230 (boiling point:322 K, freezing point:165 K) was used as the simulated working medium, and a power of 0~360 W was heated outside the tank. The experimental results showed the efficiency of the TVS system with the spray head in controlling the pressure of the tank, which transferred heat leakage from the external environmental into a liquid and controlled the pressure of the tank well. Passive TVS (PTVS) is another method to control the pressure of cryogenic tanks. Compared with ATVS, PTVS has a simpler structure and is mainly composed of a J-T valve and multiple heat-exchange tubes. In 2018, Bae, J. conducted the first PTVS test using liquid nitrogen as a simulated working fluid, with a coil heat exchanger placed into the ullage of a copper storage tank and a J-T orifice submerged in the liquid [11]. The results indicated that when the PTVS is turned on, the pressure and fluid temperature in the tank show a significant downward trend, which is because the two-phase flow generated after throttling cools the vapor in the ullage through the heat exchanger, reducing the tank pressure and causing a decrease in the fluid saturation temperature corresponding to the ullage pressure. This test proves the effectiveness of PTVS in controlling the tank pressure. In our earlier work, based on a previous theoretical analysis [12], we carried out tests for the evaporation control and pressure management of liquid nitrogen [13], conducted tests for multi-mode TVS operation, and verified the working principles of TVS [14]. The results showed the effectiveness of the spray and mixing bar in tank-pressure control under different pressure bands and heating quantities. Xi’an Jiaotong University once conducted ATVS experiments for principle verification using R123 [15] and carried out tests on fluid-cooling and depressurization processes at different throttle ratios [16]; In addition, an analysis was conducted on the principle of throttling refrigeration during the working process of TVS [17]. Shanghai Jiao Tong University conducted TVS tests on different working cases with liquid nitrogen based on a cryogenic propellant storage platform [18].
It can be seen from the previous research that for the control of cryogenic fluid, most researchers pay more attention to the macro level of evaporation and pressure management effect, and there is not much research on the details of the change characteristics in the pressure-cycle-control process, while these changes in the control process will reflect the differences and effects of control strategies. To further study the different strategies of TVS and heat load on the characteristics of pressure control in cryogenic tanks, a ground experimental apparatus integrating ATVS and PTVS was designed and built using liquid nitrogen as a working medium. The temperatures and ullage pressure change in the liquid hydrogen tank under different heat load and the above control strategies were compared and analyzed in detail.

2. Pressure-Control Strategy

The strategies for pressure control can be divided into PTVS mode, mixing mode, and ATVS mode, and the above three strategies are proposed as follows.
The PTVS mode (shown in Figure 1) activates the J-T valve once the pressure of the tank rises to the upper limit pmax, then the liquid flows through the J-T valve at dot 1, and exchanges heat with the tank along the outer wall to decrease the temperature and pressure of the internal fluid. The fluid is collected at dot 3 and vented out of the tank from dot 4. The J-T valve is turned off when the ullage pressure drops to the lower pressure limit pmin.
The mixing mode (shown in Figure 2) activates the cycle pump once the pressure of the tank rises to the upper limit pmax, when the circulating pump is activated. The liquid at the bottom of the tank flows through the pump, where it is driven into the spray bar, and then ejects into the gas and liquid area through small holes to decrease the ullage pressure. The circulating pump is turned off when the pressure drops to pmin.
The ATVS mode (shown in Figure 3) activates both the circulating pump and J-T valve once the pressure of the tank rises to the upper limit pmax, the liquid is divided into two streams after flowing through the pump, one of which accounting for a small proportion passes through J-T valve where it expands to a two-phase state with a lower pressure and temperature, then flows into the outer tube of the heat exchanger in the cryogenic tank, producing vapor with increased temperature and venting out of the tank at dot 4. The other stream flows directly into the inner tube of the heat exchanger and is driven into the spray bar. The circulating pump and J-T valve are turned off when the ullage pressure drops to the lower pressure limit pmin.

3. Mathematical Theoretical Model

3.1. Thermal Model Analysis of Storage Tanks

The heat leakage to the cryogenic tank will cause changes in temperature of the liquid and gas, as well as the ullage pressure. The heat leakage to the ullage is calculated as
q u = [ σ χ ( T e n v 4 T u 4 ) + q ] A u + q u c t + q u t u
where qu is the total heat leaks to the ullage, q is the uniform heat flux, quct is the heat leakage from support structure to the ullage, qutu is conduction heat from the connecting pipeline in the ullage area, χ is the view factor between radiation surfaces, Tenv is the ambient temperature, Tu is the ullage temperature, σ is the Stefan–Boltzman constant. The heat leakage to the liquid zone is calculated as
q l = [ σ χ ( T e n v 4 T l 4 ) + q u ] A l + q l c t + q l t u
where ql is the total heat leakage to the liquid, qlct is the heat leakage of the support structure to the liquid area, qltu is the thermal conduction of the connecting pipeline in the liquid area.
According to the energy jump boundary condition equation [19,20], the evaporation rate at the gas–liquid interface is
m ˙ e v a p = q u n i t q i n t l h g ( T i n t , P u ) h l ( T i n t , P u )
where m ˙ e v a p is the liquid evaporation rate, qunit is the heat transferred from vapor to the gas–liquid interface, qintl is the heat transferred from the gas–liquid area to liquid phase, hg(Tint,Pu) and hl(Tint,Pu) are gas enthalpy and liquid enthalpy corresponding to the gas–liquid interface temperature and ullage pressure, respectively. When considering the linear variation of the gas–liquid phase temperature with height, the heat transferred can be obtained from the heat conduction equation as follow.
q u i n t = A i n t k u ( T u T i n t ) L u q int l = A i n t k l ( T i n t T l ) L l
where Aint is the surface area of the gas–liquid interface heat transfer, Tint is the average temperature at the interface, Tu and Tl are the average temperatures of the gas and liquid phases, respectively, ku and kl are the thermal conductivity of the gas phase and the liquid phase, respectively, Lu and Ll are the heat-transfer distances from the gas and liquid phases to the interface, respectively.
The liquid phase temperature change is calculated as
d T l d t = Q l / M l c p l = ( q i n t l + m ˙ d c p l ( T d T l ) m ˙ e v a p h l g ) / M l c p l
where Tl is the liquid temperature, cpl is the specific heat of liquid, m ˙ d is the drop rate of the droplet ejected from the spray bar, hlg is the latent heat of liquid vaporization, Ml is the total mass of the liquid.

3.2. Throttling Refrigeration Analysis

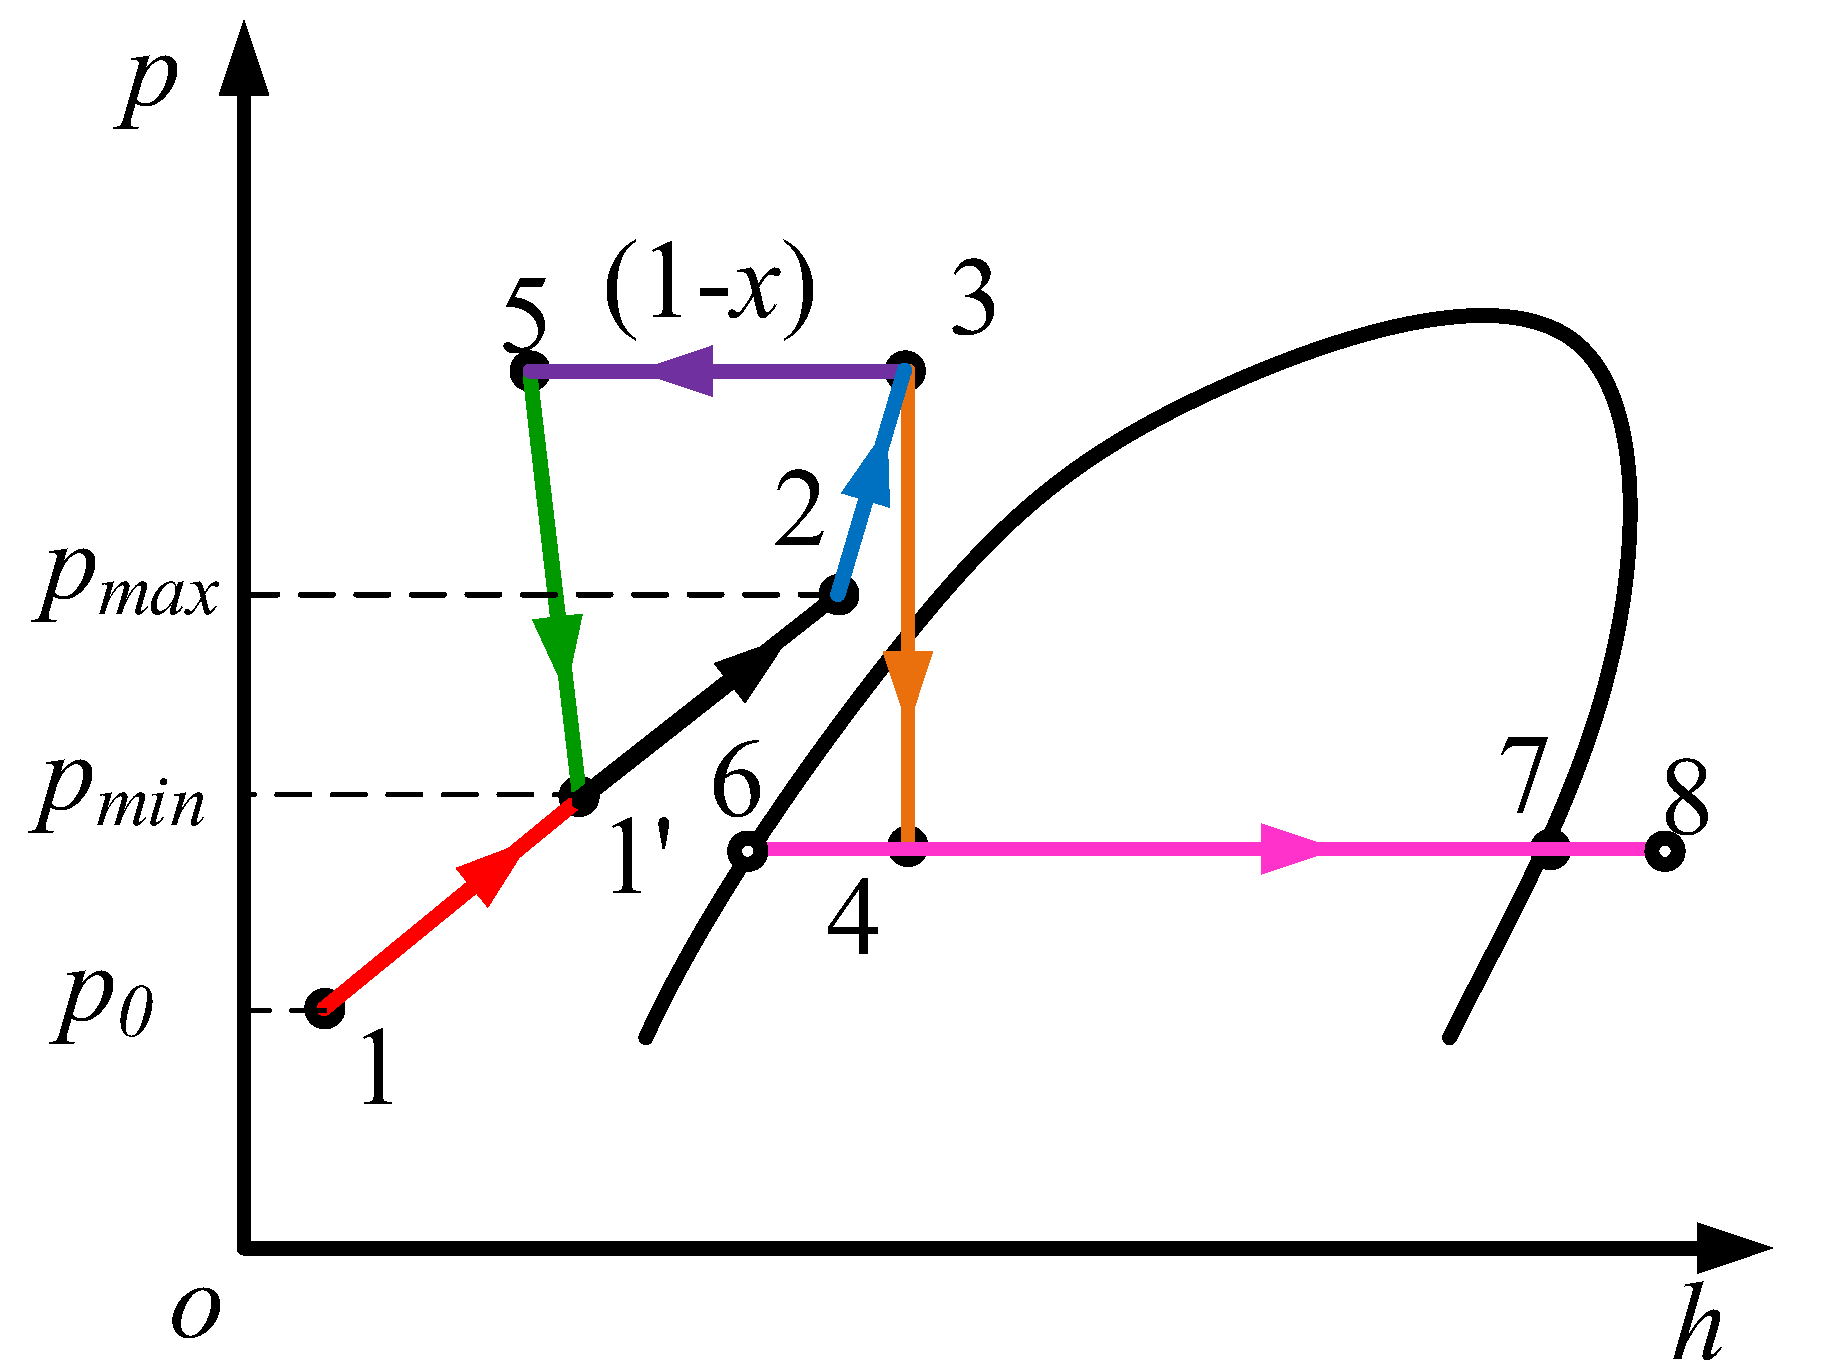
The theoretical diagram of pressure against the enthalpy of the cryogenic liquid is shown in Figure 4; the cooling capacity of unit mass is calculated as
q J T = h 7 h 4 ( h 3 )
In the above formula, h7 is the enthalpy of saturated vapor corresponding to the throttling back pressure, h3 is the enthalpy of LH2 at the inlet of J−T valve which is equal to h4. The dryness of the two−phase hydrogen formed after the J−T process is calculated as
x = m g m g + m l = h 4 h 6 h 7 h 6
where mg and ml are the mass of gas hydrogen (GH2) and liquid hydrogen (LH2), respectively, h6 is the enthalpy of the saturated liquid corresponding to the throttling back pressure. If the GH2 is heated to an overheating state in the coaxial exchanger, the total cooling capacity including the sensible heat of GH2 can be calculated as
q t o t = h 8 h 4 ( h 3 )
Therefore, the total cooling power, when the mass flow is considered, is calculated as
Q t o t = M H 2 × ( h 8 h 4 ( h 3 ) )
where h8 is the enthalpy of GH2 with an overheating state, and MH2 is the mass flow rate of GH2 measured by the flowmeter.

4. Experimental Apparatus and Measurement Uncertainties

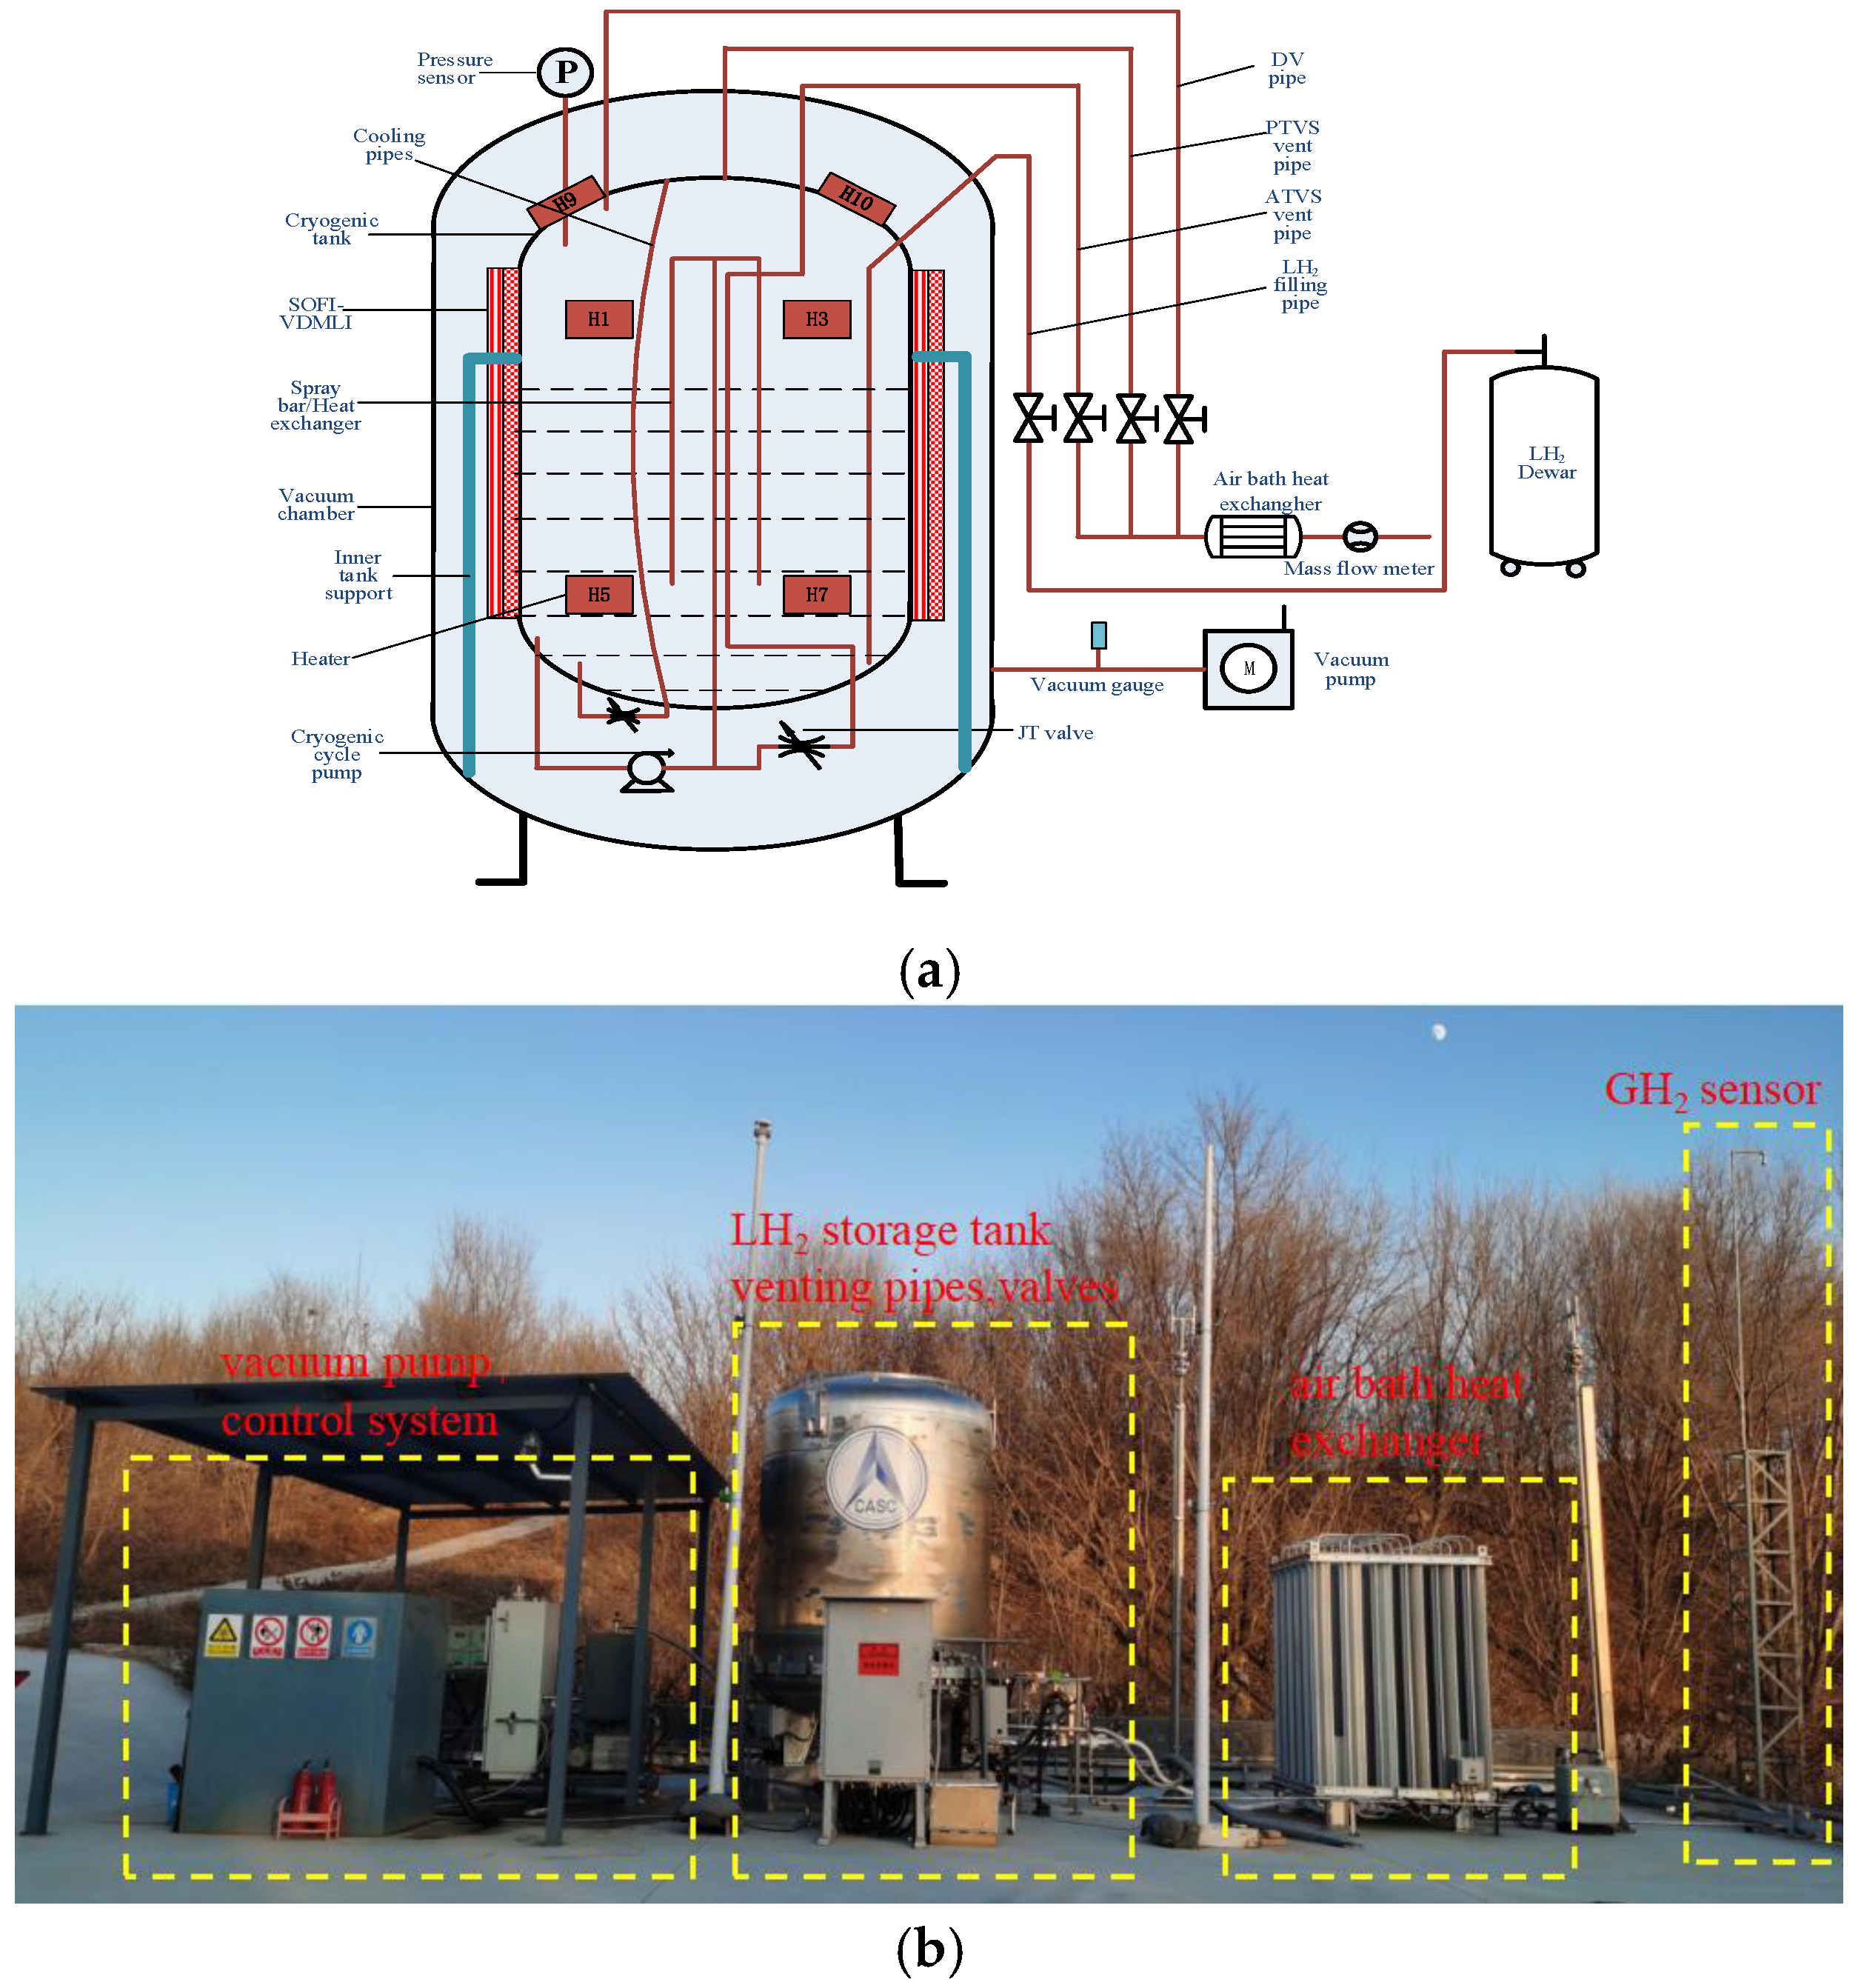
A cryogenic test platform was built, and LH2 was used as the working medium to carry out the pressure-control tests in the tank. Figure 5 shows the diagrams of the TVS experimental setup, the system comprises a vacuum storage tank, ATVS sub-system which includes a concentric tube spray-bar exchanger, a throttle valve and a circulating cryogenic pump, PTVS sub-system which includes a throttle valve and eight cooling pipelines uniformly distributed longitudinally on the outside surface of the inner tank, a liquid level meter, an air-bath heat exchanger, temperature sensors, pressure sensors, vacuum gauges, vacuum pump, a mass flow meter, heaters, and a data acquisition and automatic control system.
The vacuum is cylindrical with ellipse heads at the bottom and the top, the inner diameter and the height are 2310 mm and 3300 mm, respectively. The inner tank is also cylindrical with ellipse heads at the bottom and the top, of which the inner diameter and height are 1500 mm and 2558 mm, respectively. The inner tank has an internal volume of 4.06 m3 and an inner surface area of 13.6 m2. Ten electrical heaters are attached to the outside surface of the inner tank (as shown in Figure 6); the heating power of each heater is 10 W. The total input heating power can be controlled to heat the inner tank as required, at different positions, independently. To ensure that heat from the heaters enters the tank completely and to reduce the heat leaks from the outer vacuum chamber, the outside surface of the inner tank and cooling pipes were wrapped with multilayer thermal insulation. A small circulating pump specially developed for the hydrogen system was installed under the bottom of the inner tank, the pump was power by a 15 W electric motor that could drive the pump to provide a maximum flow of 40 L/min and a lift of 7.58 m. Thirty-two platinum-resistor PT-1000 temperature sensors were placed at different heights inside the inner tank (as shown in Figure 6), of which the measurement accuracy was calibrated within ±0.1 K. The interval distance between the T21–T31 thermometers at a 90% liquid level is 10 mm, which aims to accurately measure the thermal stratification at the vapor–liquid interface. The interval distance between other thermometers is 100 mm. All the temperature sensors were mounted on an internal rod to measure the temperature profiles of liquid and vapor hydrogen along the axis of the inner tank. An Endevco 8530B-500 piezoresistive pressure sensor with an accuracy of 0.2%FS and a full measuring range of 0.8 MPa was connected to the ullage to measure the pressure. In addition, a pressure sensor was installed before and after the circulating pump, respectively, to obtain the pressure profiles in the pipeline. A WG40 flowmeter with an accuracy of ±1% was installed on the vent pipe connected to the outlet of the air bath heat exchanger to measure the flow rates of the hydrogen gas discharged from the cryogenic tank during the boil-off process in the direct-venting and TVS tests. An HY1151/3351GP differential pressure gauge with an accuracy of 0.1% FS was employed to measure the liquid level of LH2.
Table 1 lists the sources of experimental uncertainty from the above sensors. All the measurements of temperature, pressure, flow rate and liquid level were recorded and displayed by the data acquisition and automatic control system.
As the upper limit of the safe pressure of the storage tank was designed to be 0.5 MPa, the upper limit of the pressure-control range for this cryogenic platform generally does not exceed 0.35 MPa. In addition, due to the fact that the heaters were pasted at certain positions on the surface of the tank, this experimental platform was also unable to simulate the continuous heat flow on the tank wall which occurs in real space.

5. Results and Discussion

To evaluate the characteristics of pressure control during the PTVS, mixing and ATVS tests in the LH2 storage tank, electrical heating power outputs of 0 W, 40 W and 80 W were input into the inner tank. The pressure of the inter-space between the outer and inner tank was maintained at 0.01 Pa–0.05 Pa by the vacuum pump in the tests. To ensure that the initial state in each test was consistent, it was necessary to maintain a liquid level of 90% by monitoring the temperatures of the LH2 and the level gauge. The pressure-control band in each test was limited to 230–240 kPa. In addition, an evaporation test with a direct-venting control strategy was carried out for comparison with the PTVS and ATVS tests. The tests mentioned above are listed in Table 2.
The characteristics of pressure control, the duty cycle in different control strategies, and the temperature changes in the fluids and flow rate of the vented GH2 are compared and analyzed in detail in the following section.

5.1. Effect of Different Pressure-Control Strategies on the Duty Cycle

The curves of ullage pressure by different control strategies in C1, C4 and C7 tests are shown in Figure 7. In the PTVS test, the thermal resistance was relatively high because of the heat exchange between the cooling pipes and mainstream hydrogen being through the metal wall, resulting in a lower efficiency in transferring the cooling energy. Figure 7a gives the stable stage of pressure control without the heating power input. It takes 11,057 s to run the 6.5 pressure-control cycle, and the average single cycle time (SCT) is about 1701 s. By comparing the pressurization and depressurization stages of each cycle, it can be concluded that the average duty cycle (DC) of the PTVS control cycle is 10.4%. Figure 7b,c shows the curves of pressure control in the mixing and ATVS tests, respectively. The average SCT is 433.7 s and 811.8 s, and the average DC is 25% and 6.4%, respectively.
Figure 8 shows the comparison of SCT and DC in the tests based on different control strategies. It can be seen that the SCT is the longest during PTVS strategy, while the DC is at a minimum in the ATVS strategy. This is because of the introduction of the throttling cooling power in the ATVS tests, which increases the temperature difference in the heat transfer and reduces the time of the heat transfer under the same thermal conditions.
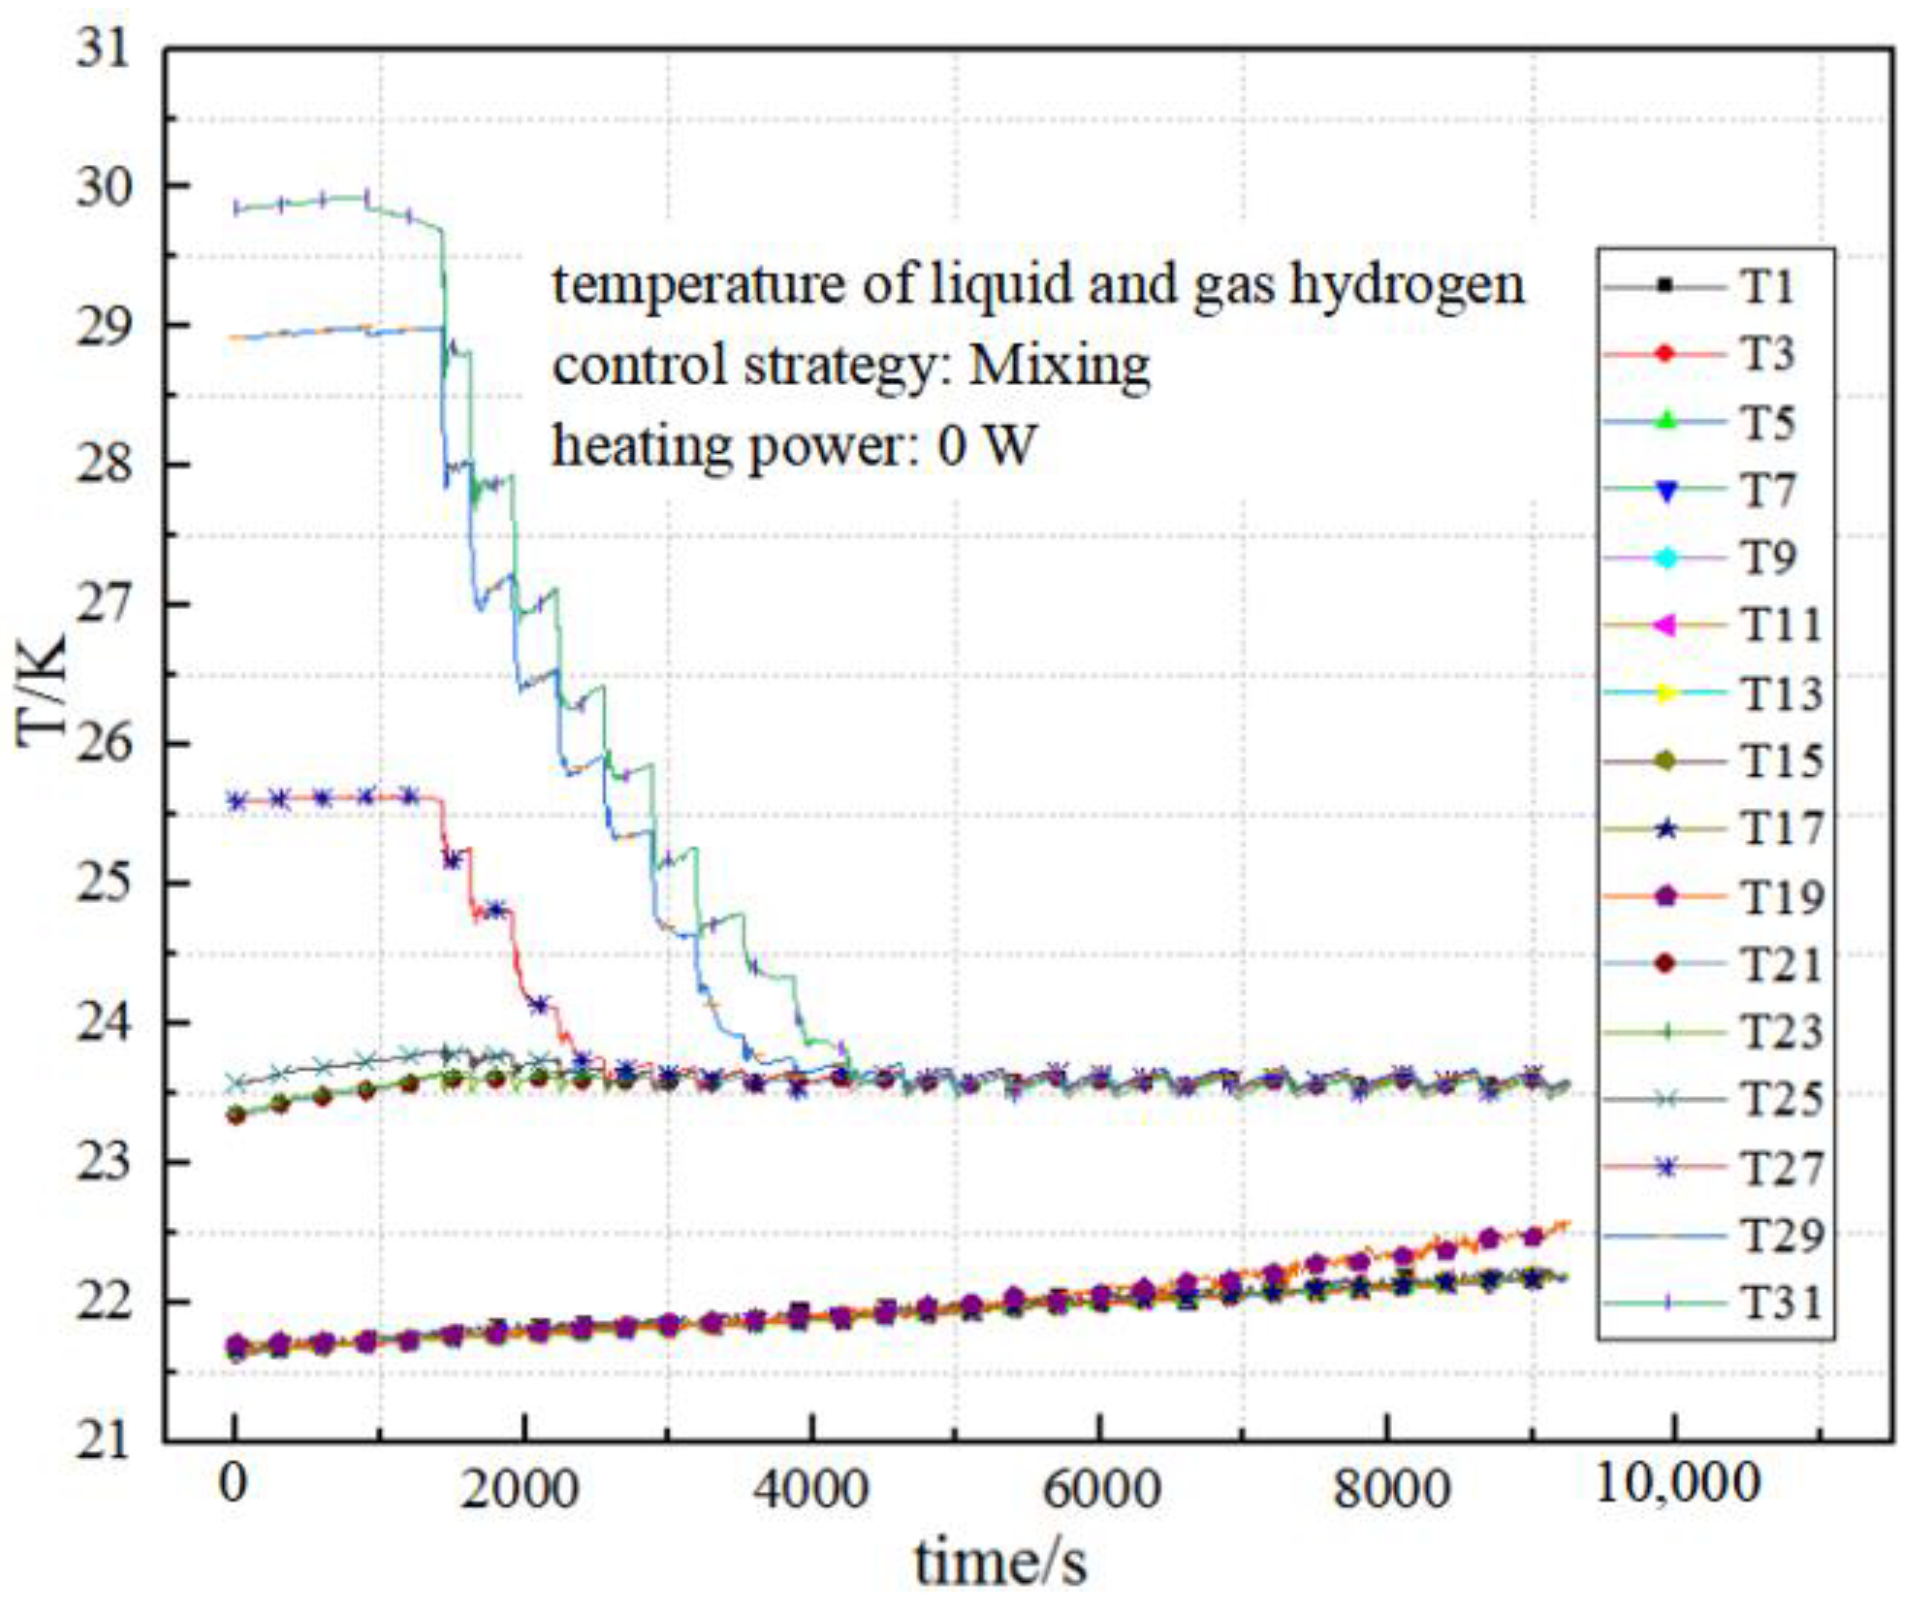
Specifically, there is no GH2 venting from the tank during the depressurization process in the mixing test. The injection of LH2 transfers the external heat from the vapor into LH2, ultimately resulting in the uniformity state of the temperature in the LH2 zone. This can be seen in Figure 9, where the initial temperature of the vapor in the ullage exhibits severe thermal stratification during the preliminary pressurization stage (0−1500 s), the temperature at the top of the upper elliptical head is 30 K which then decreases to 23.5 K because of the injection, raising the temperature to that of the upper surface of the LH2.
The SCT is the longest of the PTVS tests because the cooling pipelines are placed along the outer wall of the inner tank, the heat exchange of the two-phase hydrogen in the cooling pipes must pass through the inner tank wall with a relatively high thermal resistance, and the low heat-exchange efficiency means the sensitivity of the ullage pressure to heat exchange is reduced, which results in the longer duration of the pressurization and depressurization stages under the same heat input. The PTVS strategy is therefore not suitable for space tasks that require efficient and flexible control of the tank pressure. Subsequent improvements can be made by improving the heat-transfer efficiency, such as by arranging the cooling pipelines inside the tank.
The ATVS procedure includes not only the mixing process to make the temperature of the LH2 more uniform and the ullage pressure drop, but also the throttling process to provide the cooling capacity to the coaxial exchanger. The comprehensive effect occurs when the LH2 droplet with a lower temperature is injected and mixed with the mainstream LH2 and GH2 in the cryogenic tank, resulting in a shortened depressurization time and a minimum DC.
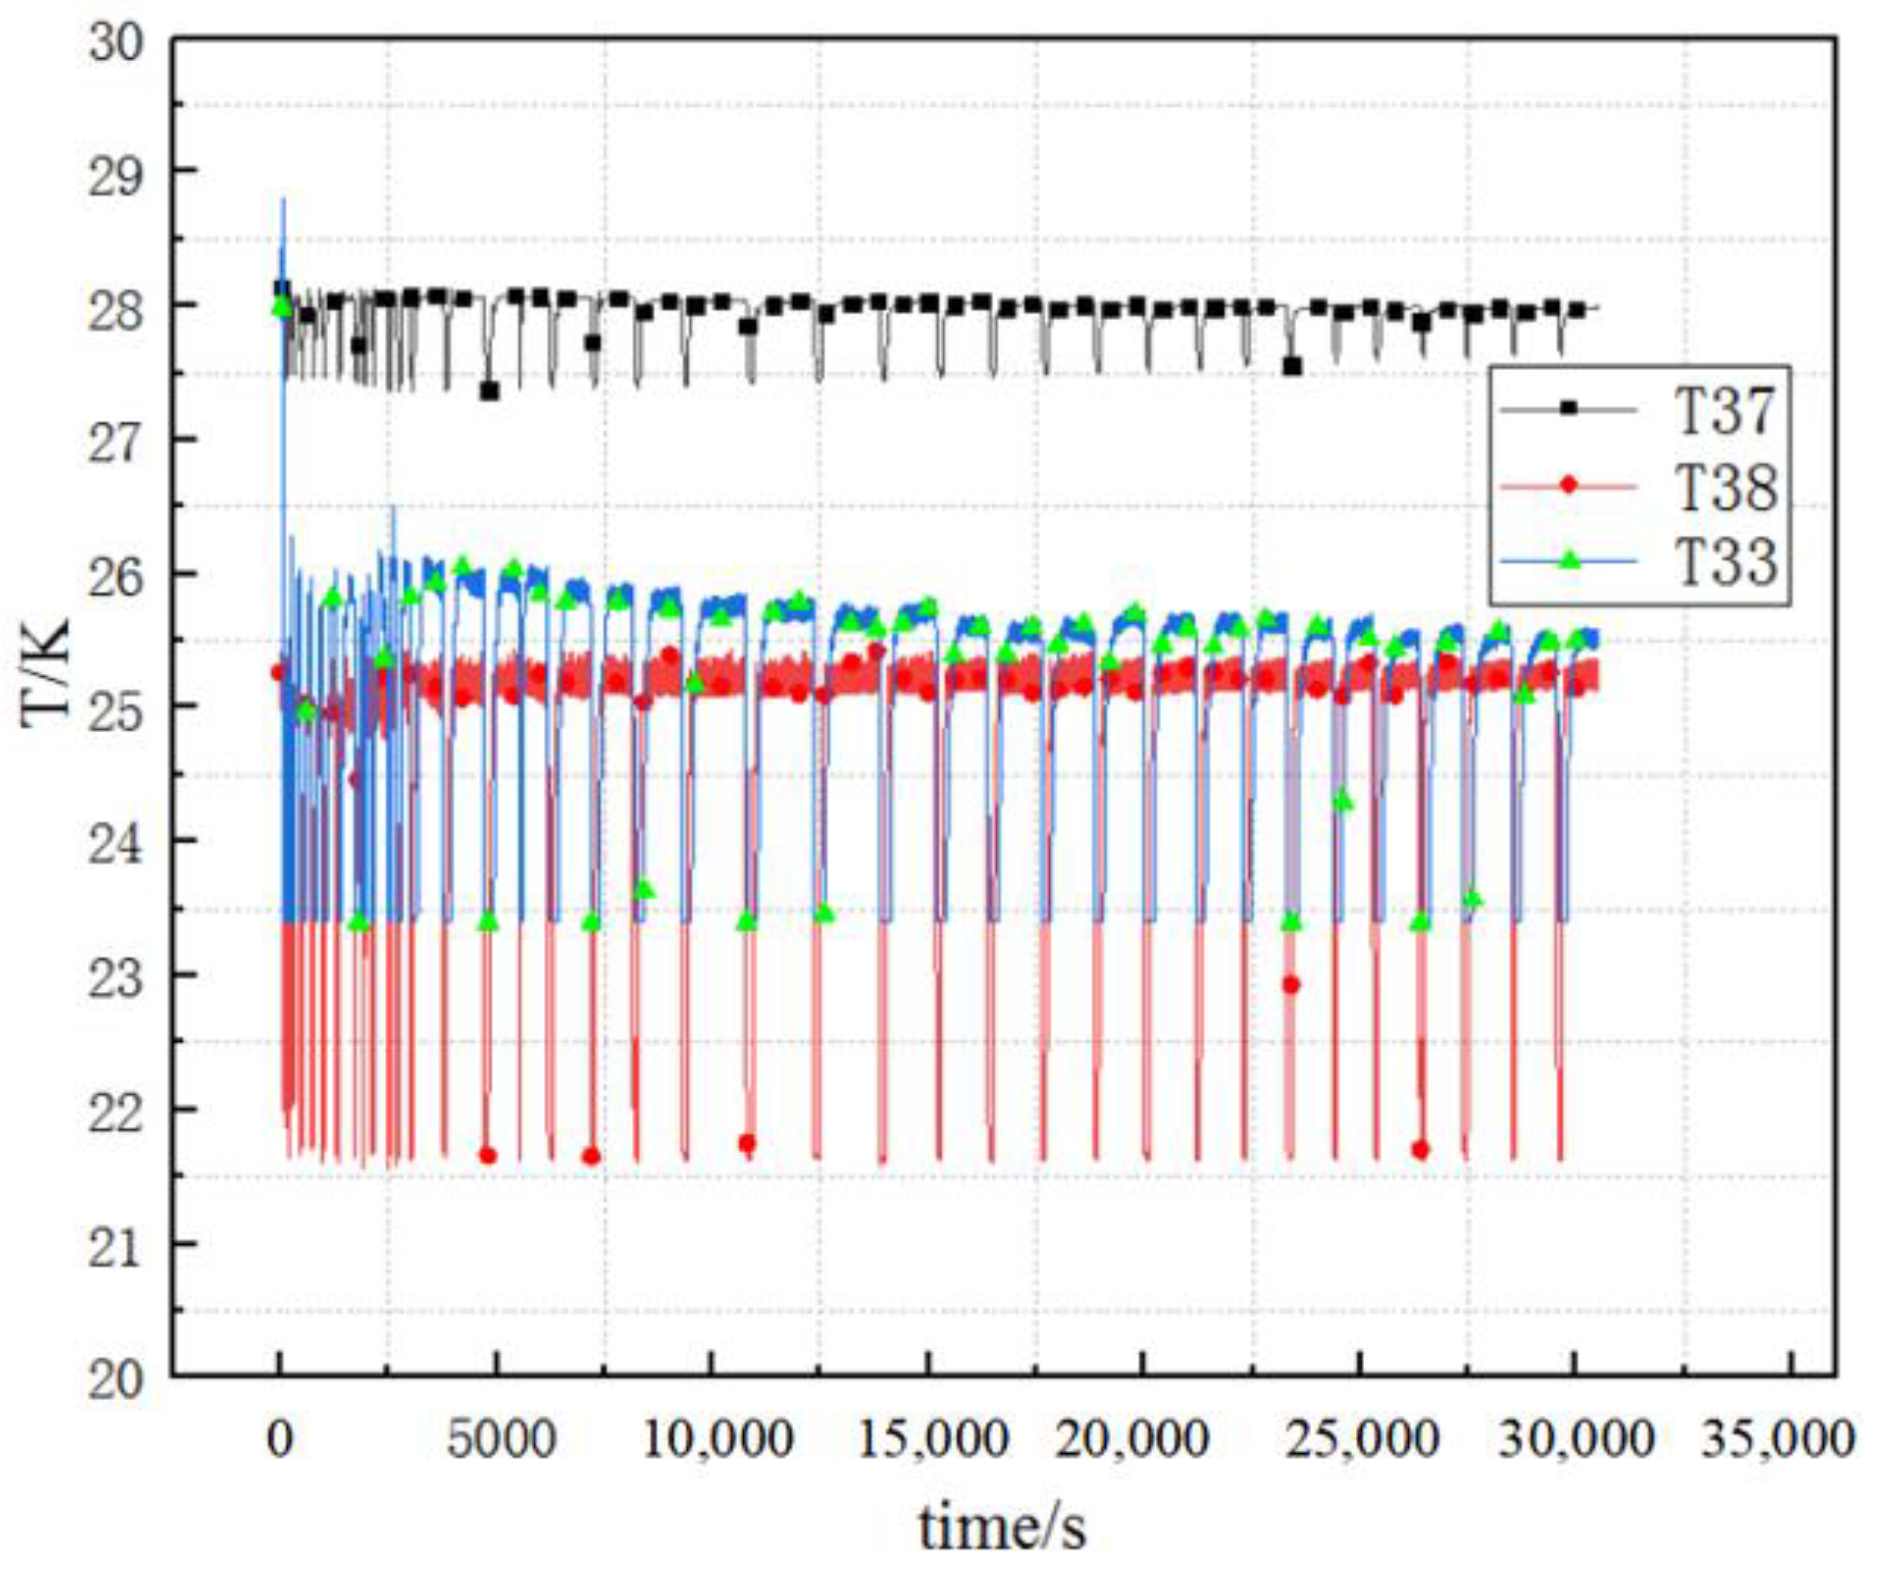
The refrigeration in the J-T valve and the thermodynamic process of LH2 in the heat exchanger were analyzed. T37 and T38 are the temperatures of hydrogen before and after the J-T valve, respectively, and T33 is the temperature of the hydrogen at the outlet of the heat exchanger. As shown in Figure 10, the average values of T37 and T38 are 28 K and 25.3 K when there is no gas vented from the tank. However, the average value of T38 decreases to 21.6 K when the J-T valve is open, and the temperature difference between T37 and T38 could reach 6.4 K. This difference remains stable in subsequent multiple cycles. The integral throttling coefficient μ ¯ H can be obtained from the following equation.
Δ T H = T 3 T 4 = p 4 p 3 μ H d p = μ ¯ H ( p 3 p 4 ) μ ¯ H = Δ T H / ( p 3 p 4 ) = 0.24 K / kPa
The average pressure in the depressurization stage is 235 kPa, which could be considered equal to the pressure at the pump inlet. The pressure difference provided by the cryogenic pump is 4 kPa, therefore the pressure at the inlet of the J−T valve is 239 kPa, the liquid content in the two-phase hydrogen after J-T process is 91.7% at that pressure, and the theoretical unit throttling cooling capacity is Q c J T = 411.7 kJ / kg . As shown in Figure 10, the temperature difference of the heat exchange in the outer tube is calculated as
Δ T J T = T h e x o u t T J T o u t = T 33 T 38 = 1.9 K
If the latent heat of the LH2 and the sensible heat of the GH2 in the two-phase hydrogen are included, the cooling capacity per unit mass is calculated as
Q c = Q c J T + c p Δ T J T = 430.2 kJ / kg
The average single-cycle venting volume and time during the test are 64.9 g and 52 s, respectively, so the calculated cooling power of the liquid hydrogen passing through the throttle valve is 537.5 W, which is 3.2 times the heat leakage of the system, proving that the system could provide the ability to eliminate external heat leakage.

5.2. Effect of Heating Power on Characteristics of Pressure Control

The effect of heating power on the characteristics of pressure control under different strategies was analyzed. Table 3 lists the average SCT for the first 10% and the last 10% of the total cycles in each pressure-control test. As can seen in the table, there is a gradual increase in the SCT when the heating power is constant for the tests using the mixing strategy. This is because the heat leaks into the tank continuously, causing an increase in the temperature of the LH2. The ability of the LH2 droplet to reduce the temperature and pressure of the ullage gradually weakens, and the depressurization time that occupies a higher duty cycle is extended. In addition, the increased amplitude of the single cycle time can be defined as
β = ( t 2 t 1 ) / t 1 × 100 %
in which, t1 is average SCT of the first 10% cycles, and t2 is average SCT of the last 10% cycles. It can be seen that as the heating power increases, it is obvious that the β valve raises significantly.
However, the SCT increases gradually only when the heating power is 0 W for the ATVS and PTVS tests, and it can be seen by the increasing trend in Table 3, that β is 54% and 96.3% in the PTVS test and ATVS test, respectively, when the heating power is 0W. This is because on the one hand, the increase in the volume in the ullage caused by evaporation leads to a longer pressurization time, and on the other hand, the cooling effect of the hydrogen to the wall of the inner tank (in PTVS tests) or the vent pipe (in ATVS tests) will cause a greater demand for heat to reach the upper pressure limit pmax in the next pressure-control cycle, which also results in a longer pressurization time.
However, when the heater is turned on to heat the tank, the pressurization time becomes shorter because the electric heat increases the amount of heat that drives the pressure increase. In addition, just as the comparison between the heating power of 40 W and 80 W in PTVS tests and ATVS tests shows in Table 3, the more electric heating power, the shorter the time required for pressurization, and the greater the proportion of the reduction in subsequent SCT compared to the initial pressure-control cycle. Therefore, it can be predicted that when the electric heating power reaches a certain value, the pressurization time determined by heating, and the depressurization time determined by refrigeration, will reach a dynamic balance, and the SCT will remain consistent in the pressure-control tests.

5.3. Effect of Pressure-Control Strategies on Volume of Vent GH2

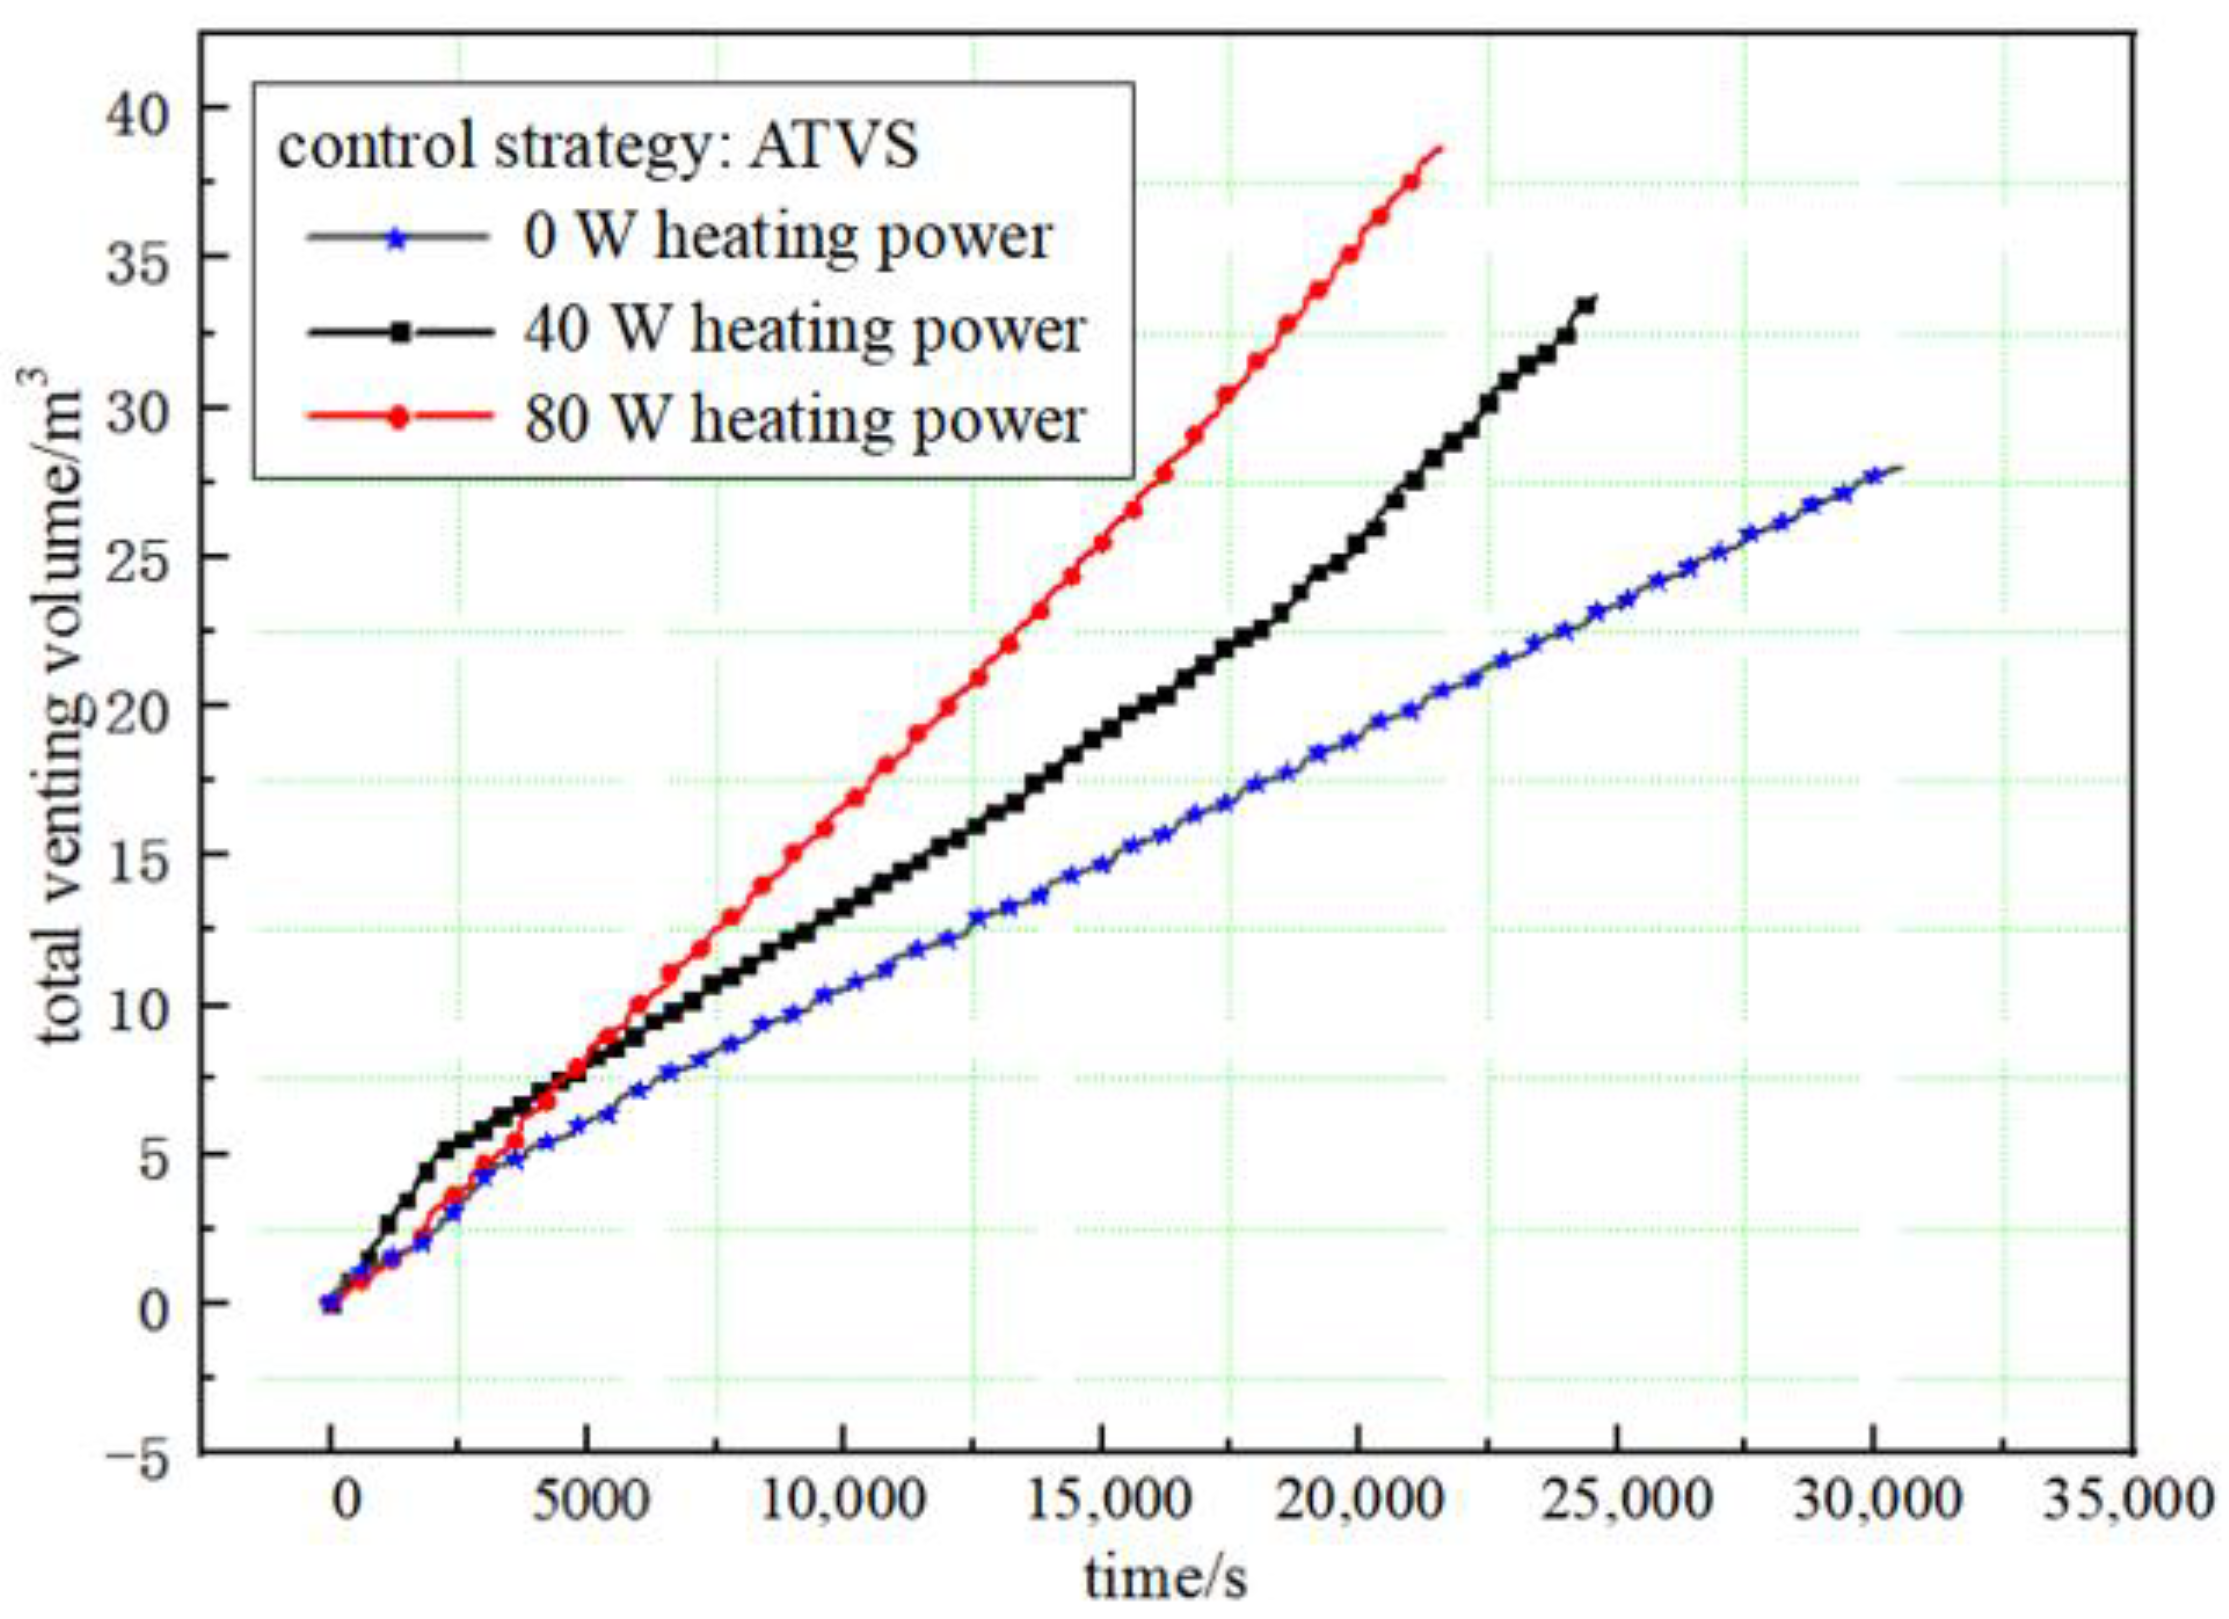
The vented GH2 from the cryogenic tank is measured by a flowmeter, the low-temperature GH2 is reheated in the air bath exchanger and recovers to room temperature and normal pressure to meet the requirements of the flowmeter for the measured gas. Figure 11 and Figure 12 show the total volumes of the venting GH2 in the PTVS and ATVS tests under different heating powers, and illustrate that in the same test times, the volumes of the venting gas increase with the increases in the heating power whether in the PTVS tests or the ATVS tests, which is mainly due to the increase in the evaporation of LH2 into the ullage caused by heat leaks from the tank wall.
Figure 13 compares the venting volume in unit times in the PTVS and ATVS tests under different heating powers, and shows that the venting volume in the unit time of the ATVS is much smaller than that of the PTVS, which is mainly due to the higher DC of the PTVS. The total venting volume of the GH2 in the depressurization stage of the PTVS test is much larger than that of the ATVS test when the test time is the same.
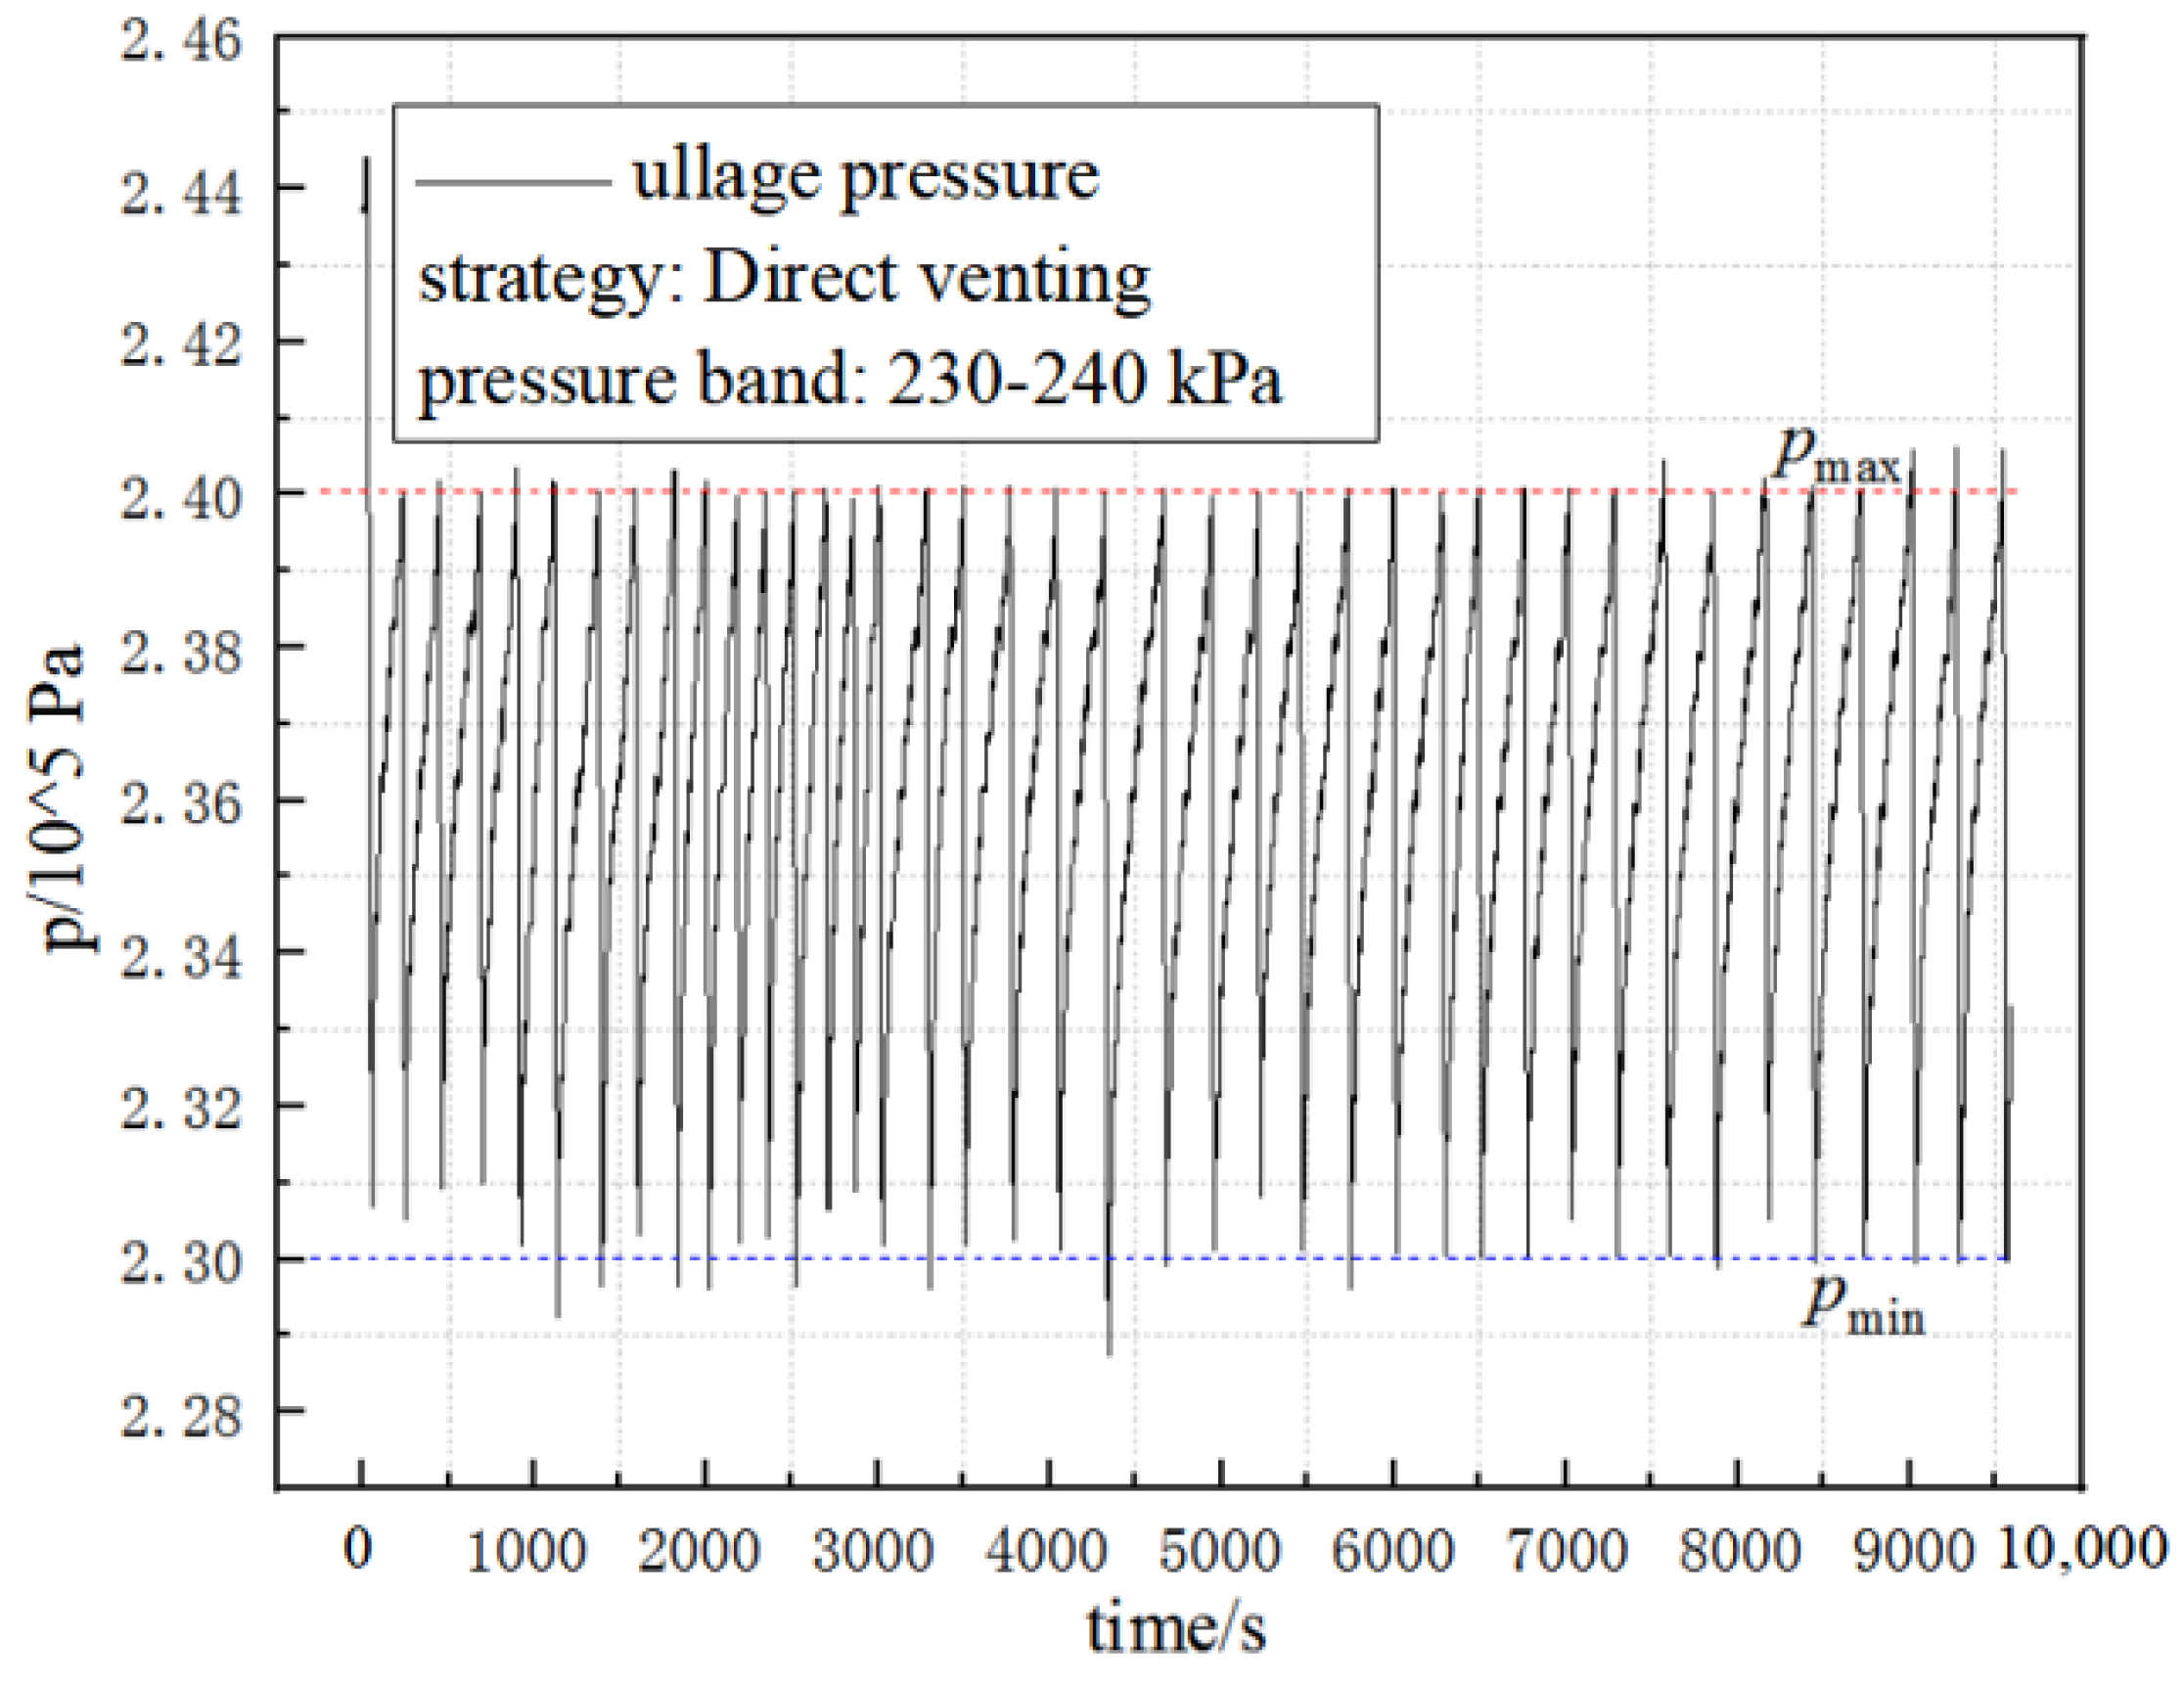
An evaporation test was carried out with the direct−venting method for comparison with the above PTVS and ATVS tests. The direct-venting control strategy is activated when the ullage pressure reaches the upper limit pmax, the venting valve connected to the ullage is turned open, the GH2 in the ullage vents from the cryogenic tank and flows through the reheating exchanger and flow meter successively, and the ullage pressure begins to drop. When the ullage pressure is reduced to the lower limit pmin, the venting valve is turned off. Figure 14 shows the ullage pressure curve using the direct-venting strategy and the pressure-control band is set at 230−240 kPa.
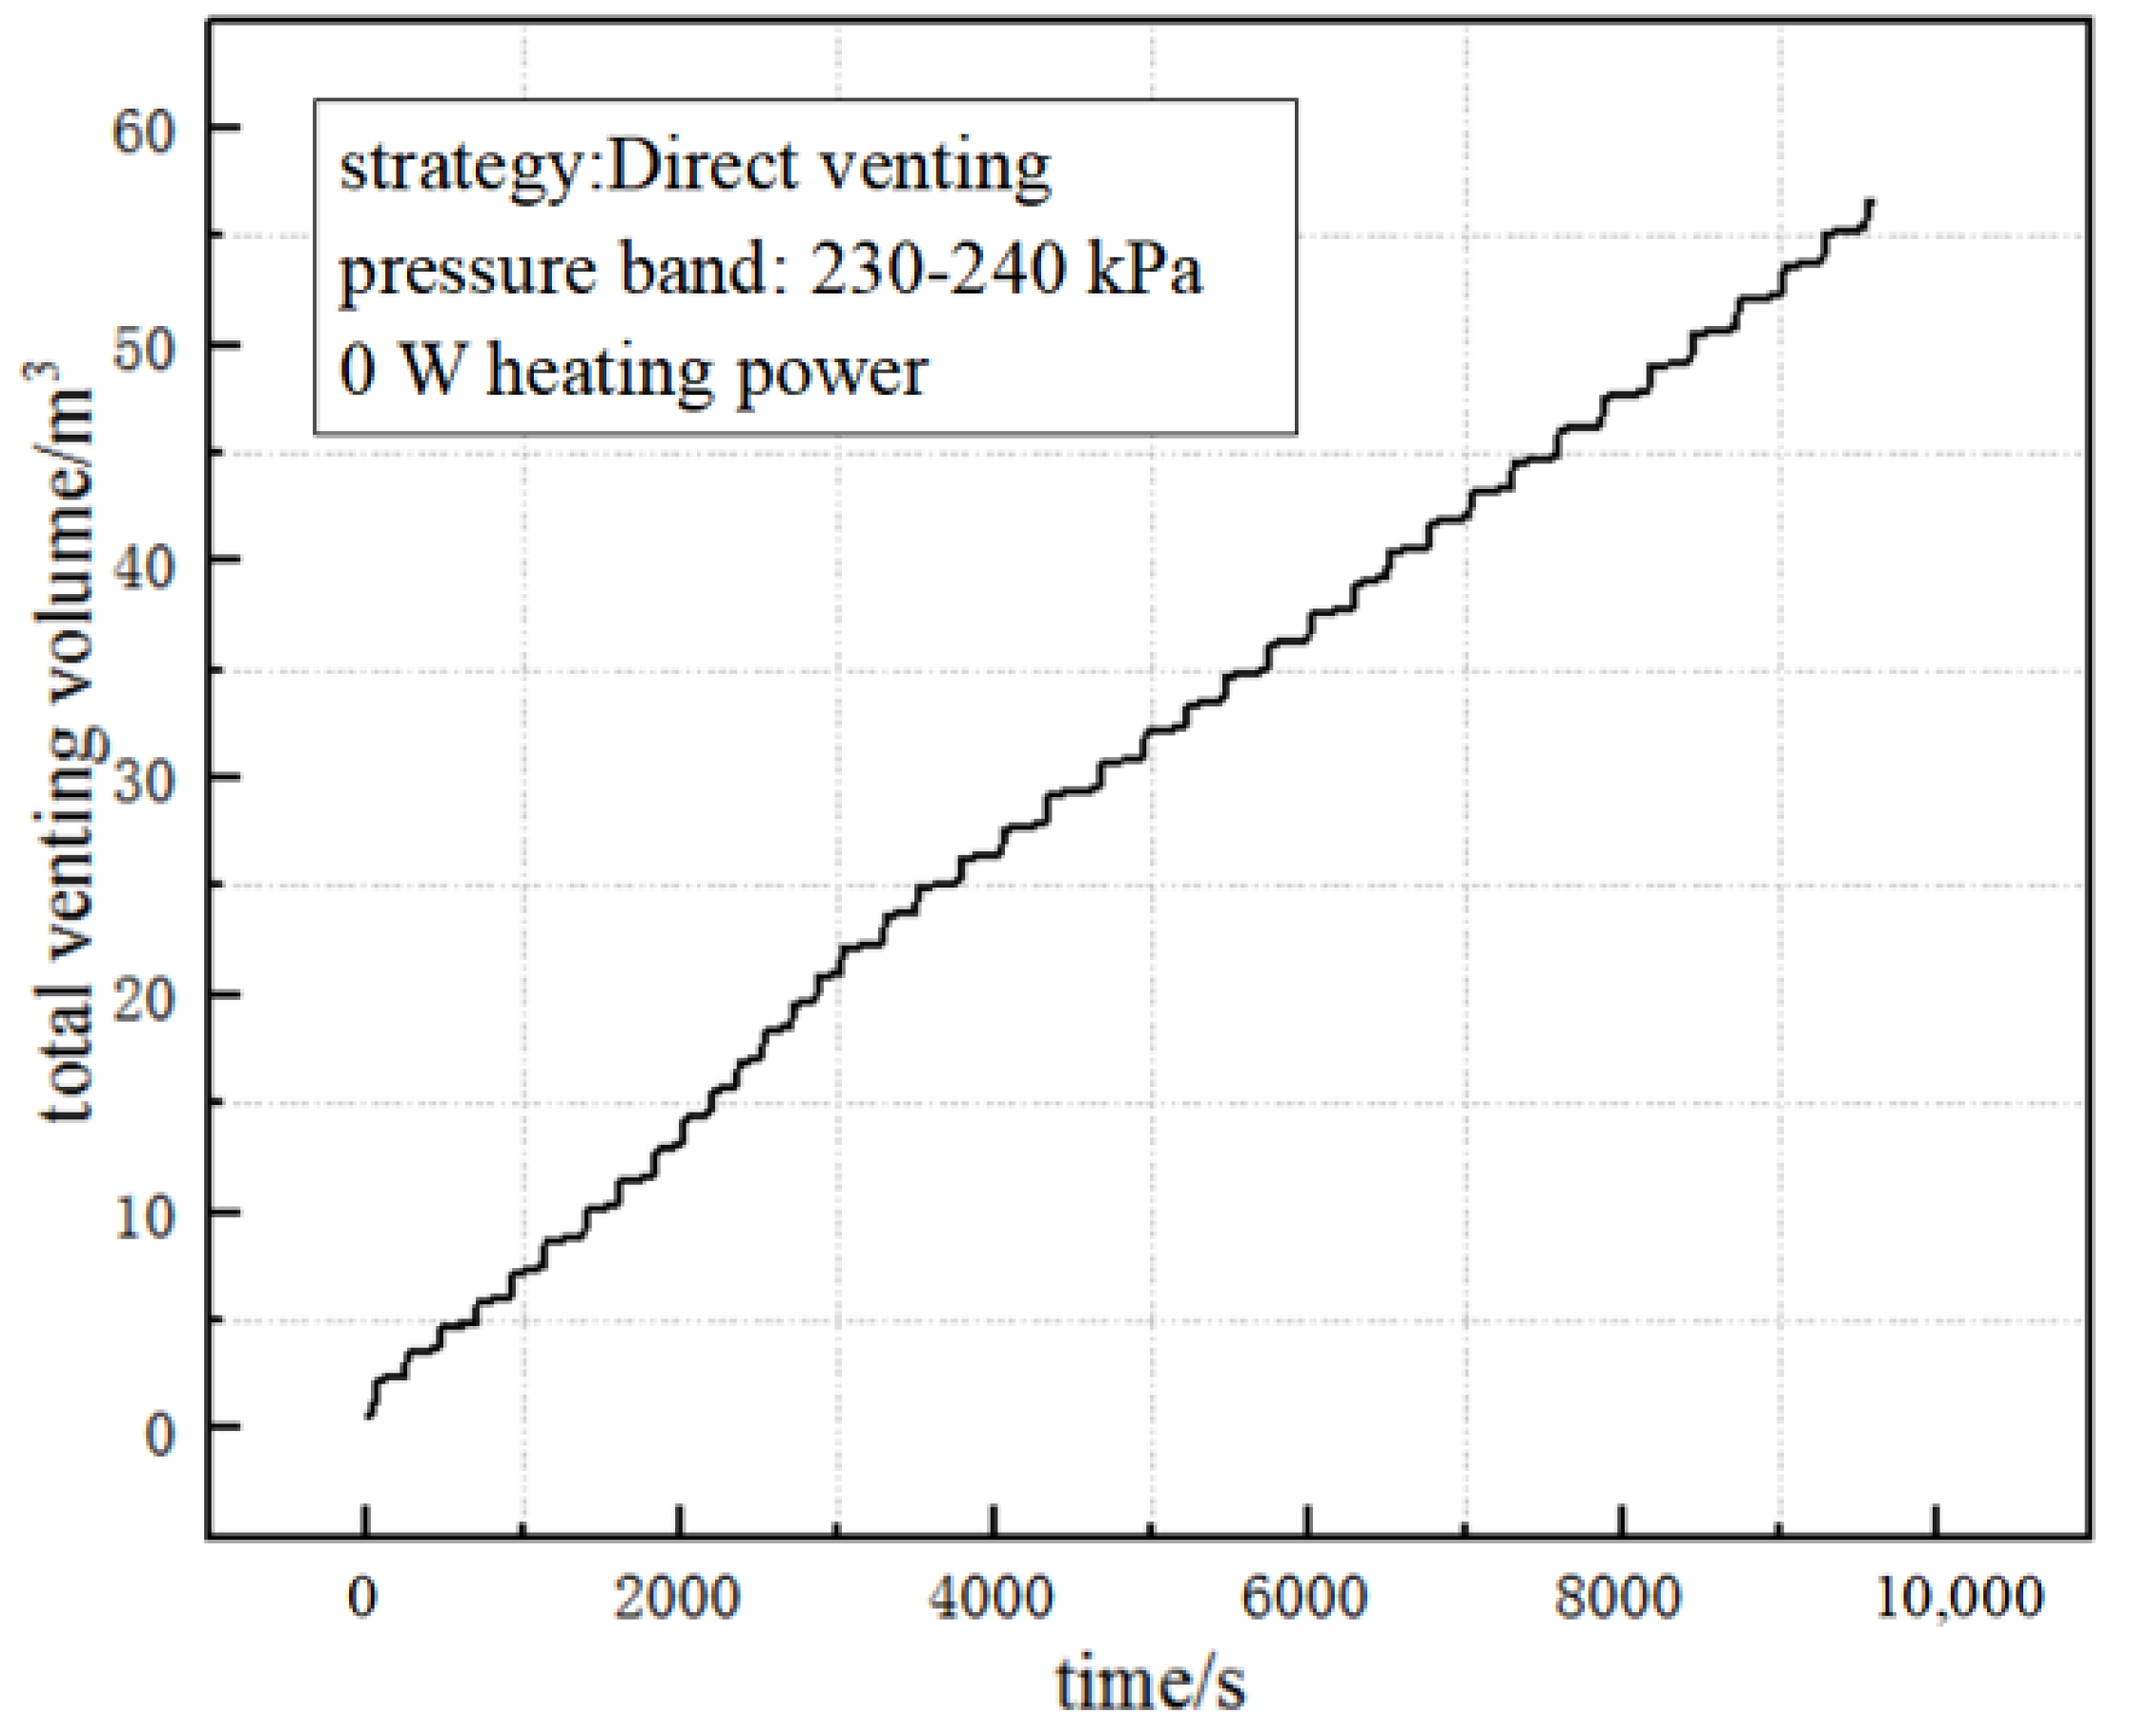
It can be seen from Figure 15 that in the test time of 9600 s, the total venting volume of the GH2 is 56.7 m3, and the venting volume in the unit time is 21.3 m3/h, which is close to the result of the PTVS test with the heating power of 40 W. Meanwhile, it also illustrates the advantage of the ATVS strategy in reducing the venting volume of the GH2. The venting volume in the unit time was under C7 test is 2.7 m3/h, which was decreased by 87.3% compared to the direct−venting test.

6. Conclusions

An experimental apparatus with an inner tank volume of 4.06 m3 was set up, integrating a PTVS and ATVS subsystem to investigate the characteristics of ullage pressure control and the effect of reducing the evaporation of LH2. The variations in temperature and pressure of both the ullage and liquid were studied. The three strategies of PTVS, mixing and ATVS were verified experimentally with different heating power inputs. The PTVS was activated by turning on J-T valve and vent valve to keep the ullage pressure maintained within a certain control band. The mixing strategy was only used to run the circulation pump to eliminate thermal stratification both in the liquid and ullage zones. ATVS strategy was activated by turning on the pump, J-T valve, and vent valve simultaneously during the depressurization stage. The difference was that, in the PTVS and ATVS tests, GH2 flowed through the J-T valve and vented from the tank, while no gas was vented in the mixing tests. The main conclusions obtained in the experiments on different pressure-control strategies are as follows:
(1)
The two-phase hydrogen with a lower temperature generated in the J-T throttle increases the temperature difference in the heat transfer and reduces the time of the heat transfer under the same thermal conditions, leading to the lowest single cycle time of the ATVS strategy in different tests;
(2)
There is a gradual increase in the single cycle time when the heating power is constant in the tests using the mixing strategy, while in the ATVS and PTVS tests, the single cycle time increases gradually only when there is no heating power input. The pressurization time becomes shorter when the heating power increases, β reflects the variation degree in the single cycle time, and β increases as the heating power increases;
(3)
The volume of the venting gas increases with the increases in the external heating power whether in the PTVS or ATVS tests. The venting volume in the unit time of ATVS is much smaller than that of the PTVS. The venting volume in unit time by direct venting is close to that of the PTVS test with a heating power of 40 W. In addition, the venting volume in the unit time with the ATVS strategy decreased by 87.3% compared to the direct-venting test.

Author Contributions

Conceptualization, Z.Z. and X.L.; methodology, Z.Z. and X.L.; software, J.W.; validation, Z.Z. and J.W.; formal analysis, Z.Z. and M.G.; investigation, S.Z.; resources, J.W.; data curation, Z.Z., S.Z. and J.W.; writing—original draft preparation, Z.Z. and M.G.; writing—review and editing, Z.Z., M.G. and X.L.; visualization, Z.Z. and J.W.; supervision, X.L.; project administration, X.L.; funding acquisition, X.L. All authors have read and agreed to the published version of the manuscript.

Funding

This research received no external funding.

Institutional Review Board Statement

Not applicable.

Informed Consent Statement

Not applicable.

Data Availability Statement

Not applicable.

Conflicts of Interest

The authors declare no conflict of interest.

Nomenclature

SOFIspray-on foam insulation
VDMLIvariable density multilayer insulation
TVSthermodynamic venting system
PTVSpassive thermodynamic venting system
ATVSactive thermodynamic venting system
LH2liquid hydrogen
GH2gas hydrogen
LO2liquid oxygen
MHTBMarshall Space Flight Center
J-TJoule-Thomson
SCTsingle cycle time
DCduty cycle
pmaxpressure upper limit (Pa)
pminpressure lower limit (Pa)
μ ¯ H integral throttling coefficient
Qc-JTunit throttling cooling capacity
cpspecific heat
βincrease amplitude of the single cycle time
χview factor
σStefan-Boltzman constant

References

  1. Kutter, B.; Zegler, F.; Lucas, S.; Hines, L.; Ragab, M.; Spradley, I.; Hopkins, J. Atlas Centaur Extensibility to Long-Duration In-Space Applications; Lockheed Martin Space Systems Company: Denver, CO, USA, 2005. [Google Scholar]
  2. Motil, S.M. Technology Demonstration Mission (TMD) Cryogenic Propellant Storage & Transfer (CPST). CPST Project Overview and Cryogenic Activities; NASA Glenn Research Center: Cleveland, OH, USA, 2013. [Google Scholar]
  3. The White House. National Strategy for Critical and Emerging Technology. Available online: https://new.qq.com/rain/a/20220210A041VW00.html (accessed on 8 February 2022).
  4. Johnson, W.L. Recent ground hold and rapid depressurization testing of multilayer system. In Proceedings of the 50th AIAA/ASME/SAE/ASEE Joint Propulsion Conference, Cleveland, OH, USA, 28–30 July 2014. [Google Scholar]
  5. Lin, C.S.; Van Dresar, N.T.; Hasan, M.M. Pressure control analysis of cryogenic storage system. J. Propuls. Power 2004, 20, 480–485. [Google Scholar] [CrossRef] [Green Version]
  6. Nguyen, H. Zero Thermodynamic Venting System (TVS) Performance Prediction Program; National Aeronautics and Space Administration: Washington, DC, USA, 1994; pp. 1–136. [Google Scholar]
  7. Candy, E.C. Design of thermodynamic vent/screen baffle cryogenic storage system. Eng. Notes 1975, 12, 501–502. [Google Scholar]
  8. Hastings, L.J.; Flachbart, R.H.; Lak, T.; Nguyen, H.; Bailey, J.W. Spray Bar Zero-Gravity Vent System for On-Orbit Liquid Hydrogen Storage; NASA/TM-2003-212926; NASA Center for AeroSpace Information: Hanover, MD, USA, 2023. [Google Scholar]
  9. Thibault, J.P.; Corre, C.; Demeure, L.; Mer, S. Thermodynamic control system for cryogenic propellant storage during long missions. In Proceeding of the ASME 2014 4th Joint US-European Fluids Engineering Division Meeting, Chicago, IL, USA, 12 August 2014. [Google Scholar]
  10. Mer, S.; Fernandez, D.; Thibault, J.-P.; Corre, C. Optimal design of a thermodynamic vent system for cryogenic propellant storage. Cryogenics 2016, 80, 127–137. [Google Scholar] [CrossRef]
  11. Bae, J.; Yoo, J.; Jin, L.; Jeong, S. Experimental investigation of passive thermodynamic vent system (TVS) with liquid nitrogen. Cryogenics 2018, 89, 147–156. [Google Scholar] [CrossRef]
  12. Zhou, Z.; Lei, G.; Wang, T.; Xuan, Z. Control method of pressurization and venting flow rate in cryogenic tank. J. Aerosp. Power 2018, 33, 1263–1269. [Google Scholar]
  13. Zhou, Z.; Liu, X. Analysis of on-orbit pressure control method and effectiveness comparison of cryogenic propellants. Cryogenics 2019, 2, 41–46. [Google Scholar]
  14. Zhou, Z.; Liu, X.; Zhang, S.; Wang, S. Analysis for the effects of TVS on the pressure control characteristics of the liquid nitrogen storage tank. J. Astronaut. 2020, 41, 599–607. [Google Scholar]
  15. Liu, Z.; Li, Y.; Xia, S.; Tan, H. Ground experimental investigation of thermodynamic vent system with HCFC123. Int. J. Therm. Sci. 2017, 122, 218–230. [Google Scholar] [CrossRef]
  16. Liu, Z.; Li, Y.; Zhang, S.; Zhang, X.; Liu, X. Experimental study on thermodynamic vent system with different influence factors. Int. J. Energy Res. 2018, 42, 1040–1055. [Google Scholar] [CrossRef]
  17. Ren, J.; Xie, F.; Wang, L.; Li, Y. Analysis on throttling effect and cooling capacity utilization in thermodynamic vent system. J. Astronaut. 2020, 41, 490–498. [Google Scholar]
  18. Wang, B.; Huang, Y.; Chen, Z.; Wu, J.; Wang, T.; Lei, G. Performance of thermodynamic vent system for cryogenic propellant storage using different control strategies. Appl. Therm. Eng. 2017, 126, 100–107. [Google Scholar] [CrossRef]
  19. Delhaye, J.M. Jump conditions and entropy sources in two-phase systems. Local instant formulation. Int. J. Multiph. Flow 1974, 1, 395–409. [Google Scholar] [CrossRef]
  20. Meserole, J.S.; Jones Brennan, S.M.; Fortini, A. Mixing-Induced Ullage Condensation and Fluid Destratifcation. In Proceedings of the AIAA-87-2018, 23rd Joint Propulsion Conference, San Diego, CA, USA, 29 June–2 July 1987. [Google Scholar] [CrossRef]
  21. Xin, L.; Xiaoyu, Z. Experimental Pressure Control Investigation of Thermodynamic Vent System. J. Deep. Space Explor. 2018, 5, 292–298. [Google Scholar]
Figure 1. PTVS schematic diagram and operation process.
Processes 11 01831 g001
Figure 2. Mixing schematic diagram and operation process.
Processes 11 01831 g002
Figure 3. ATVS schematic diagram and operation process.
Processes 11 01831 g003
Figure 4. The theoretical diagram of pressure against enthalpy [21].
Processes 11 01831 g004
Figure 5. Diagrams of TVS experimental setup. (a) schematic diagram of TVS experimental setup; and (b) image of TVS experimental setup and related facilities.
Processes 11 01831 g005
Figure 6. Layout of measurement sensors in the TVS experimental apparatus.
Processes 11 01831 g006
Figure 7. Curves of ullage pressure by different control strategies: (a) pressure−control strategy: PTVS (C1: 230−240 kPa, 0 W heating); (b) pressure-control strategy: Mixing (C4: 230−240 kPa, 0 W heating); and (c) pressure−control strategy: ATVS (C7: 230−240 kPa, 0 W heating).
Processes 11 01831 g007
Figure 8. Comparison of SCT and DC in tests based on PTVS, mixing, and ATVS control strategies.
Processes 11 01831 g008
Figure 9. Temperature-change curve of two-phase hydrogen in test using the mixing strategy.
Processes 11 01831 g009
Figure 10. Temperature curve of two-phase hydrogen before and after the J−T valve.
Processes 11 01831 g010
Figure 11. Volume of venting GH2 in PTVS tests (C1, C2, C3).
Processes 11 01831 g011
Figure 12. Volume of venting GH2 in ATVS tests (C7, C8, C9).
Processes 11 01831 g012
Figure 13. Comparison of volume of vent GH2 in PTVS and ATVS tests.
Processes 11 01831 g013
Figure 14. Ullage pressure curve using the strategy of direct venting.
Processes 11 01831 g014
Figure 15. Total venting volume using the direct-venting strategy.
Processes 11 01831 g015
Table 1. Measuring accuracy of the different sensors used for the measurements.
Measuring
Parameter
UnitsDescriptionSensorsUncertainty
TKTemperatureplatinum-resistor PT-1000±0.1 K
pPaPressureEndevco 8530B-500 piezoresistive 0.2%FS
q ˙ V m3/hFlow rateWG40 flowmeter±1%
LmLiquid levelHY1151/3351GP0.1%FS
Table 2. Operation parameters in different test cases.
CasesControl Bank (kPa)Pressure-Control StrategyHeating Power (W)
C1230–240PTVS0
C2230–240PTVS40
C3230–240PTVS80
C4230–240Mixing0
C5230–240Mixing40
C6230–240Mixing80
C7230–240ATVS0
C8230–240ATVS40
C9230–240ATVS80
C10230–240DV0
Table 3. Comparison of PTVS and ATVS strategies on the characteristics of pressure control.
Control StrategyHeating Power/WAverage Cycle Time in the First 10%
Cycles t1/s
Average Cycle Time in the Last 10%
Cycles t2/s
β
PTVS01316202654%
401069945−11.6%
80928442−52.4%
Mixing045056325.1%
4036252545.0%
8015325969.3%
ATVS048795696.3%
40576530−8.0%
80788550−30.2%
Disclaimer/Publisher’s Note: The statements, opinions and data contained in all publications are solely those of the individual author(s) and contributor(s) and not of MDPI and/or the editor(s). MDPI and/or the editor(s) disclaim responsibility for any injury to people or property resulting from any ideas, methods, instructions or products referred to in the content.